Embed Size (px)
Citation preview

FY 2017 RESULTSAnalyst Briefing
27 February 2018
2
This presentation is not and does not constitute an offer, invitation, solicitation or recommendation to subscribe for, or purchase, any securities and neither this presentation nor anything contained in it
shall form the basis of, or be relied on in connection with any contract or commitment or investment decision.
This presentation has been prepared solely for use at this presentation. By your continued attendance at this presentation, you are deemed to have agreed and confirmed to Telekom Malaysia Berhad
(the “Company”) that: (a) you agree not to trade in any securities of the Company or its respective affiliates until the public disclosure of the information contained herein; and (b) you agree to maintain
absolute confidentiality regarding the information disclosed in this presentation until the public disclosure of such information, or unless you have been otherwise notified by the Company.
Reliance should not be placed on the information or opinions contained in this presentation or on its completeness. This presentation does not take into consideration the investment objectives, financial
situation or particular needs of any particular investor.
No representation or warranty, express or implied, is made as to the fairness, accuracy, completeness or correctness of the information, opinions and conclusions contained in this presentation. None of
the Company and its affiliates and related bodies corporate, and their respective officers, directors, employees and agents disclaim any liability (including, without limitation, any liability arising from fault
or negligence) for any loss arising from any use of this presentation or its contents or otherwise arising in connection with it.
This presentation contains projections and “forward-looking statements” relating to the Company’s business and the sectors in which the Company operates. These forward-looking statements include
statements relating to the Company’s performance. These statements reflect the current views of the Company with respect to future events and are subject to certain risks, uncertainties and
assumptions. It is important to note that actual results could differ materially from those anticipated in these forward looking statements. The Company does not undertake to inform you of any matters or
information which may come to light or be brought to the Company’s attention after the date hereof.
The forecasts and other forward-looking statements set out in this presentation are based on a number of estimates and assumptions that are subject to business, economic and competitive
uncertainties and contingencies, with respect to future business decisions, which are subject to change and in many cases outside the control of the Company. The directors and officers of the Company
believe that they have prepared the forecasts with due care and attention and consider all best estimates and assumptions when taken as a whole to be reasonable at the time of preparing the
presentation. However, the Company’s forecasts presented in this presentation may vary from actual financial results, and these variations may be material and, accordingly, neither the Company nor its
directors or officers can give any assurance that the forecast performance in the forecasts or any forward-looking statement contained in this presentation will be achieved. Details of the forecasts and
the assumptions on which they are based are set out in the presentation.
This presentation may not be copied or otherwise reproduced without the written consent of TM.
Disclaimer

Performance Overview
Operating Highlights
Concluding Remarks
3
1
2
3

4
Resilience through Perfexe 10
FY 2017 revenue at RM12.09bn
Healthy Reported PATAMI growth of 19.8% at RM929.7mn; Normalised PATAMI growth of 1.8% at RM863.2mn
Reported EBIT was down 5.3% at RM1.1bn due to higher operating expenses and forex loss. Excluding forex loss, Normalised EBIT was at RM1.2bn
9.8% TM Household penetration of unifi mobile
Sustained Customer Satisfaction – surpassed our TRIM index target of 73
Second interim dividend of 12.1 sen per share; totaling 21.5 sen for FY2017 or RM808.0mn, in line with Dividend Commitment
FY 2017 Highlights
Brand consolidation at unifi, reorganization of TM ONE #BEBAS plan launched Digital empowerment

5
Group Results FY 2017
*Excludes FX Gain/(Loss)
RM mn
Reported
4Q17 3Q17% Change
QoQ4Q16
% Change YoY
FY17 FY16% Change
YTD
Revenue 3,199.9 2,940.4 +8.8% 3,237.0 -1.1% 12,085.1 12,060.9 +0.2%
Other Operating Income 25.6 42.0 -39.0% 29.3 -12.6% 164.0 130.4 +25.8%
EBITDA 893.5 878.7 +1.7% 970.9 -8.0% 3,576.4 3,788.6 -5.6%
Normalised EBITDA 922.3 889.1 +3.7% 985.3 -6.4% 3,671.1 3,820.0 -3.9%
Depn & Amort. 623.2 617.2 +1.0% 685.0 -9.0% 2,483.7 2,634.6 -5.7%
EBIT 270.3 261.5 +3.4% 285.9 -5.5% 1,092.7 1,154.0 -5.3%
Normalised EBIT 299.1 271.9 +10.0% 300.3 -0.4% 1,187.4 1,185.4 +0.2%
Other Gains / (Losses) 14.0 (1.9) +>100.0% 0.9 +>100.0% 8.5 47.2 -82.0%
Net Finance Cost* 56.8 58.9 -3.6% 62.7 -9.4% 255.3 225.4 +13.3%
FX Gain / (Loss) 74.8 27.0 +>100.0% (120.5) +>100.0% 174.5 (86.7) +>100.0%
Profit Before Tax (PBT) 307.6 235.5 +30.6% 110.6 +>100.0% 1,048.0 918.5 +14.1%
PATAMI 277.0 211.8 +30.8% 154.3 +79.5% 929.7 776.0 +19.8%
Normalised PATAMI 222.0 203.4 +9.1% 269.9 -17.7% 863.2 847.9 +1.8%
6
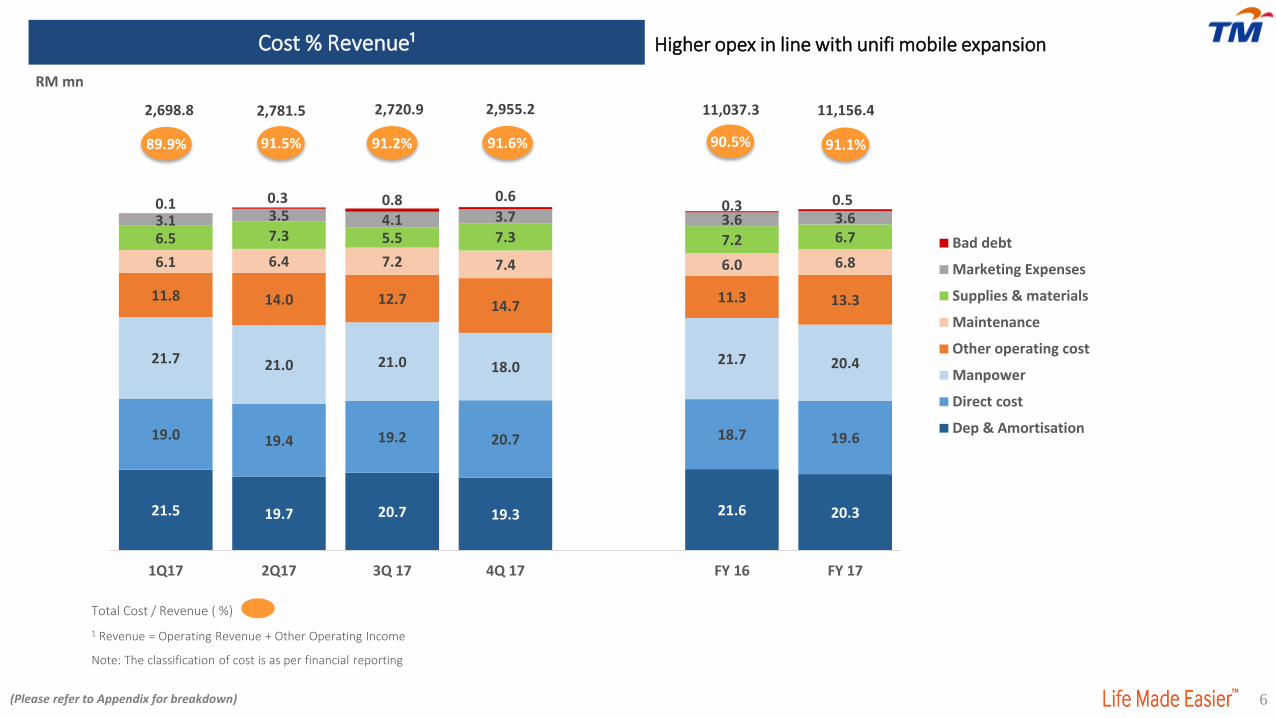
Total Cost / Revenue ( %)
1 Revenue = Operating Revenue + Other Operating Income
Note: The classification of cost is as per financial reporting
(Please refer to Appendix for breakdown)
RM mn
11,156.42,698.8
91.1%89.9%
2,781.5
91.5%
Cost % Revenue¹
11,037.3
90.5%
2,720.9
91.2%
2,955.2
91.6%
21.5 19.7 20.7 19.3 21.6 20.3
19.0 19.4 19.2 20.7 18.7 19.6
21.7 21.0 21.0 18.021.7 20.4
11.8 14.0 12.7 14.711.3 13.3
6.1 6.4 7.2 7.4 6.0 6.8
6.5 7.3 5.5 7.3 7.2 6.73.1 3.5 4.1 3.7 3.6 3.60.1 0.3 0.8 0.6
0.3 0.5
1Q17 2Q17 3Q 17 4Q 17 FY 16 FY 17
Bad debt
Marketing Expenses
Supplies & materials
Maintenance
Other operating cost
Manpower
Direct cost
Dep & Amortisation
Higher opex in line with unifi mobile expansion
81 172 334 340
1,196 927
188 248
275 440
1,449
1,151
83 127
126
342
670
678
1Q17 2Q17 3Q17 4Q17 FY16 FY17
Core Network Access Support System
7
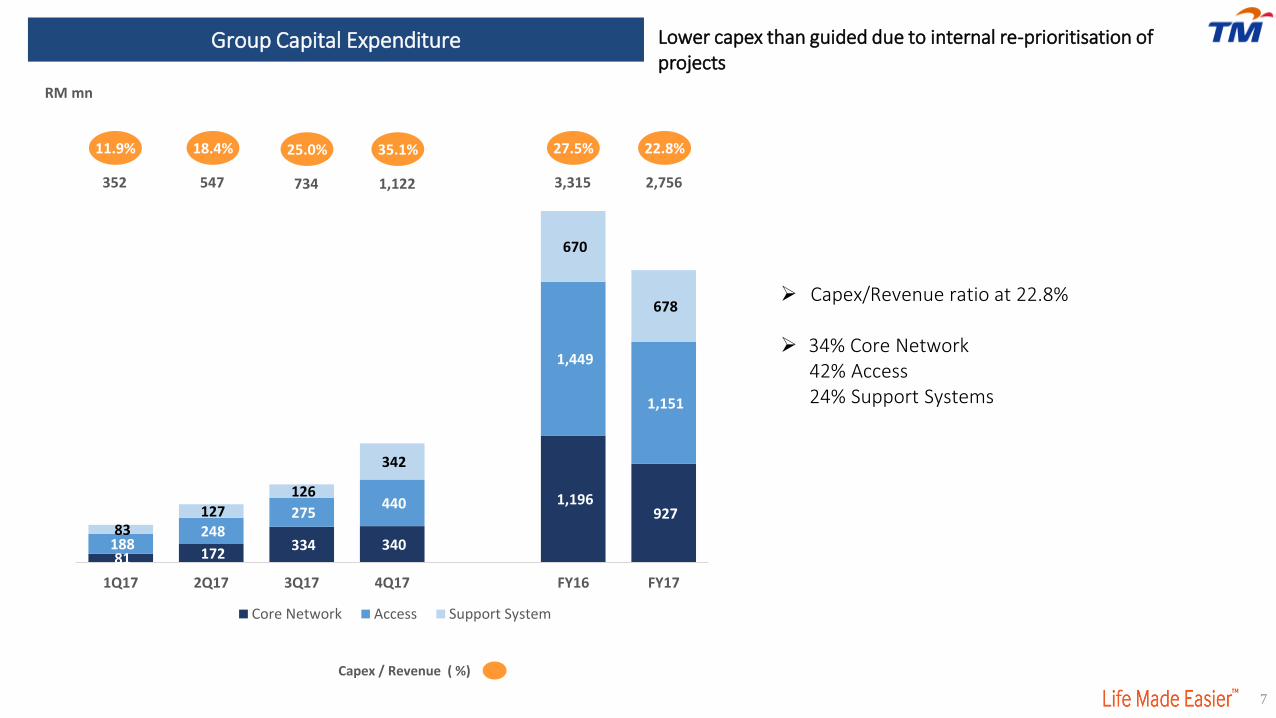
Capex / Revenue ( %)
RM mn
Capex/Revenue ratio at 22.8%
34% Core Network42% Access24% Support Systems
Group Capital Expenditure
352
11.9%
547
18.4%
3,315
27.5%
2,756
22.8%
734
25.0%
1,122
35.1%
Lower capex than guided due to internal re-prioritisation of projects

81 Based on Normalised EBIT2 Based on Normalised PATAMI
Group Cash Flow
Key Financial Ratios
RM mn FY17 FY16
Cash & cash equivalent at start 2,925.2 3,510.8
Cash flows from operating activities 2,417.6 2,848.6
Cash flows used in investing activities (2,783.2) (3,259.5)
Capex 2,755.8 3,314.5
Cash flows used in financing activities (802.8) (206.8)
Effect of exchange rate changes (37.8) 32.1
Cash & cash equivalent at end 1,719.0 2,925.2
Free cash-flow (EBITDA – Capex) 820.6 474.1
31 Dec 17 31 Dec 16
Return on Invested Capital1 5.80% 6.25%
Return on Equity2 11.11% 10.03%
Return on Assets1 4.77% 4.80%
Current Ratio³ 0.98 1.15
WACC 6.61% 7.17%
31 Dec 17 31 Dec 16
Gross Debt to EBITDA 2.31 2.10
Net Debt/EBITDA 1.66 1.25
Gross Debt/Equity 1.04 1.09
Net Debt/Equity 0.82 0.71
Net Assets/Share (sen) 208.7 204.7
3 Lower Current Ratio was mainly due to reclassification of Long Term Borrowing to Short Term Borrowing

9
Performance Overview
Operating Highlights
Concluding Remarks
1
2
3
697 508
667
2,317 2,256
4Q16 3Q17 4Q17 FY16 FY17
732 634 715
2,745 2,675
4Q16 3Q17 4Q17 FY16 FY17
951 1,005 1,018
3,668 3,974
4Q16 3Q17 4Q17 FY16 FY17
857 793 800
3,330 3,180
4Q16 3Q17 4Q17 FY16 FY17
10
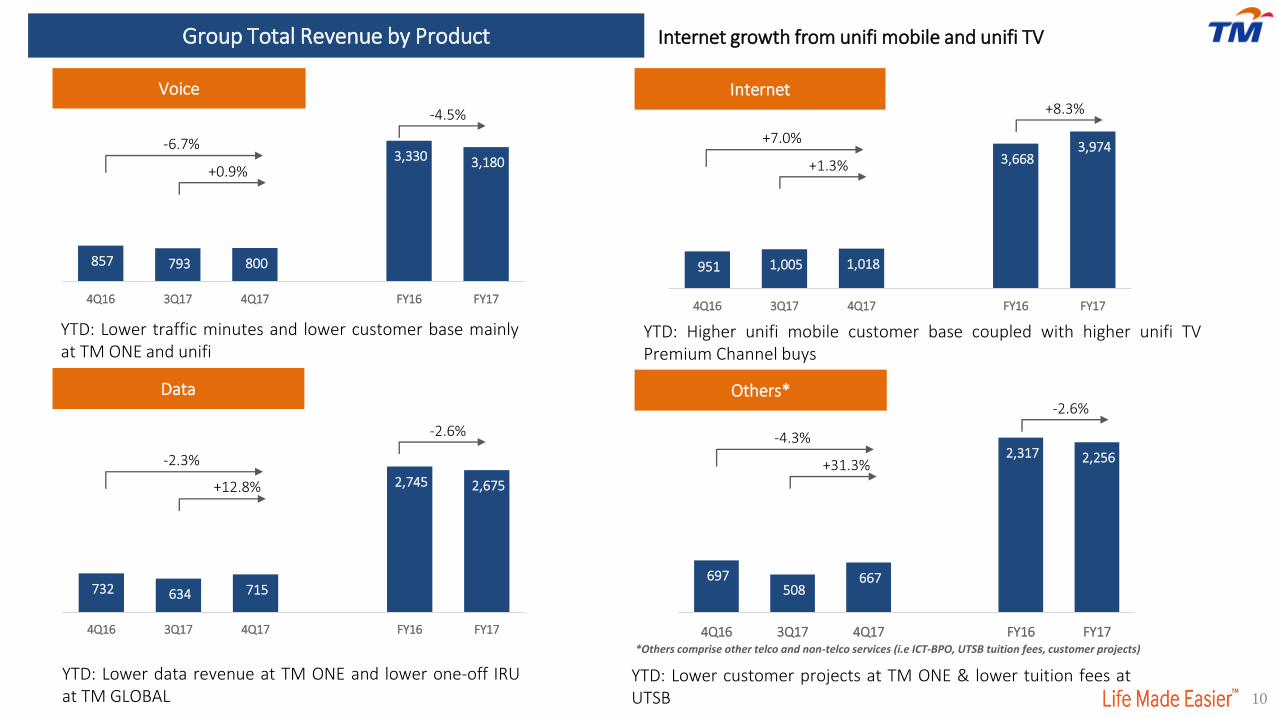
Group Total Revenue by Product
YTD: Lower data revenue at TM ONE and lower one-off IRUat TM GLOBAL
YTD: Lower customer projects at TM ONE & lower tuition fees atUTSB
YTD: Higher unifi mobile customer base coupled with higher unifi TVPremium Channel buys
YTD: Lower traffic minutes and lower customer base mainlyat TM ONE and unifi
Voice Internet
-6.7%
+0.9%
-4.5%
+7.0%
+1.3%
+8.3%
Data Others*
*Others comprise other telco and non-telco services (i.e ICT-BPO, UTSB tuition fees, customer projects)
-2.3%
+12.8%
-2.6% -4.3%
+31.3%
-2.6%
Internet growth from unifi mobile and unifi TV
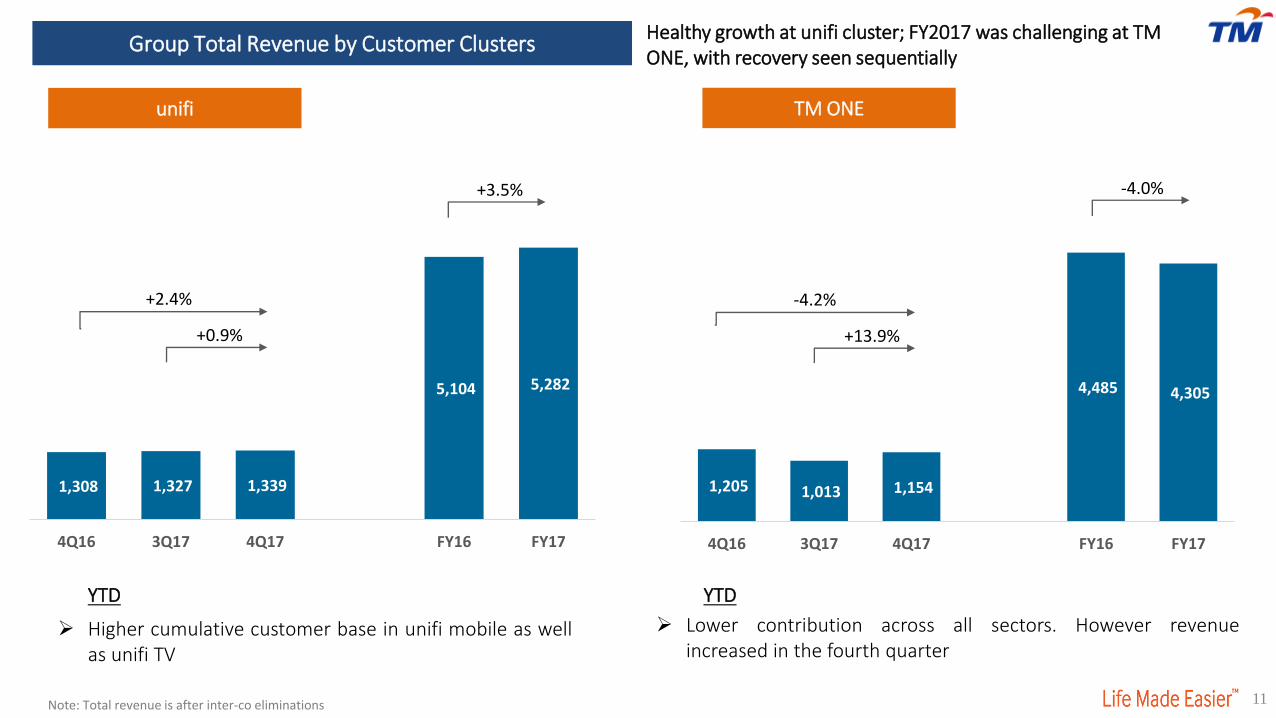
1,205 1,013 1,154
4,485 4,305
4Q16 3Q17 4Q17 FY16 FY17
1,308 1,327 1,339
5,104 5,282
4Q16 3Q17 4Q17 FY16 FY17
11
Higher cumulative customer base in unifi mobile as wellas unifi TV
Lower contribution across all sectors. However revenueincreased in the fourth quarter
YTD YTD
Note: Total revenue is after inter-co eliminations
+2.4%
+0.9%
+3.5%
-4.2%
+13.9%
-4.0%
Group Total Revenue by Customer Clusters
unifi TM ONE
Healthy growth at unifi cluster; FY2017 was challenging at TM ONE, with recovery seen sequentially

150 132 157
544 542
4Q16 3Q17 4Q17 FY16 FY17
573 468 550
1,928 1,956
4Q16 3Q17 4Q17 FY16 FY17
12
YTD YTD
Higher Domestic Ethernet Higher share of GDV on property which reduced theimpact of lower tuition fees at UTSB
-4.0%
+17.5%
+1.5%
+4.7%
+18.9%
-0.4%
Group Total Revenue by Customer Clusters
TM GLOBAL Others*
*Others include revenue from Property Development, TM R&D, UTSB & MKL
Note: Total revenue is after inter-co eliminations

3,364 3,319 3,280 3,233 3,184 3,132 3,045 2,960
877 900 921 949 979 1,007 1,062 1,126
1Q16 2Q16 3Q16 4Q16 1Q17 2Q17 3Q17 4Q17
Fixed Line unifi
1,487 1,465 1,448 1,421 1,391 1,352 1,288 1,207
877 900 921 949 979 1,007 1,062 1,126
1Q16 2Q16 3Q16 4Q16 1Q17 2Q17 3Q17 4Q17Broadband unifi
13
Physical Highlights
Total Broadband Performance
-0.7%
Cu
sto
mer
s (I
n t
ho
usa
nd
)A
RP
U (
RM
)
unifi ARPU (Blended) Broadband Net ARPU
Cu
sto
mer
s (I
n t
ho
usa
nd
)A
RP
U (
RM
)
ARPU at RM25
Fixed Line (DEL) ARPU
-1.6% 98% unifi customers on 10Mbps & above
unifi mobile penetration at 9.8%
Note: unifi previously known as “UniFi” , while Broadband previously known as “Streamyx”.
89 89 90 92 90 90 91 90
192 194 197 201 201 200 199 197
Fixed Line
-0.5%
-2.3%
29 29 27 28 26 25 25 25
2,364 2,365 2,369 2,370 2,370 2,359 2,350
4,241 4,219 4,201 4,182 4,163 4,139 4,107
2,333
4,086
Strong TM Household penetration of unifi mobile and unifihome net adds

14
Convergence Updates
unifi mobile
unifi edu pack
unifi ebiz pack
mobile apps

No 1 appin PlayStore & AppStore
Went viralin social media & market
- 350k installs in 2 weeks, trending
higher than world’s popular apps
- Queues at TMpoint
- Consistently high interest and
search trend during launch week
unifi mobile launch snippets

unifi mobile launch snippets

unifi mobile launch snippets

18
Performance Overview
Operating Highlights
Concluding Remarks
1
2
3

19
Key Takeaways
2018 and Mid-Term Headline KPI
2018 Mid Term
Revenue Growth
EBIT Growth
Customer Satisfaction Measure¹
1 Using TRiM index measuring end to endcustomer experience at all touch points. TRiM(Measuring, Managing and Monitoring) is astandardized indicator system. It analyzes,measures and portrays stakeholderrelationships on the basis of standardizedindicators. The TRI*M Index is an indicator ofthe status quo of a particular relationship. Theindex is made up of four points of view on thestakeholder relationship, e.g. for customerloyalty: overall rating, recommendation,repeat purchasing of product/services, and acompany's competitive advantage. Theinformation is based on surveys/interviews ona sample customer base.”
3.5-4% 3.5-4%
Maintain 2017 EBIT RM
3.5-4%
74 75
Resilience despite a challenging environment, with healthy revenue and profitability Strong customer traction in home and mobile space Sustained Customer Satisfaction – surpassed our TRIM index target Group achieved NPS Score of 9 Dividend Commitment met: 21.5 sen per share; RM808.0mn

20
Powered by Perfexe 10
ACCELERATE
CONVERGENCE
EMPOWER
DIGITISATION
ASPIRATIONFocus on targets, driven by
aspirations. KPI and KHI
ACCELERATIONSpeed of executing our
initiatives
EXECUTIONExecute in a differentiated
manner vs. BAU
Anchor principles:
Appendices
21

22
Normalised EBIT
RM mn 4Q17 3Q17 4Q16 FY17 FY16
Reported EBIT 270.3 261.5 285.9 1,092.7 1,154.0
Non Operational
Unrealised FX Loss/(Gain) on International Trade Settlement
28.3 10.4 (62.1) 93.8 (45.5)
Loss on Sale of Assets 0.5 - 0.2 0.9 0.6
MESRA Program - - 76.3 - 76.3
Normalised EBIT 299.1 271.9 300.3 1,187.4 1,185.4
Normalised EBIT Margin 9.3% 9.1% 9.2% 9.7% 9.7%
Reported EBIT Margin 8.4% 8.8% 8.8% 8.9% 9.5%
EBIT is calculated as Total Revenue (Operating Revenue + Oth. Operating Income) less Operating CostEBIT Margin is calculated as percentage of EBIT against Total RevenueNormalised EBIT Margin is calculated as percentage of Normalised EBIT against Normalised Total Revenue (Operating Revenue + Oth. Operating Income – Loss on Sale of Assets)
23
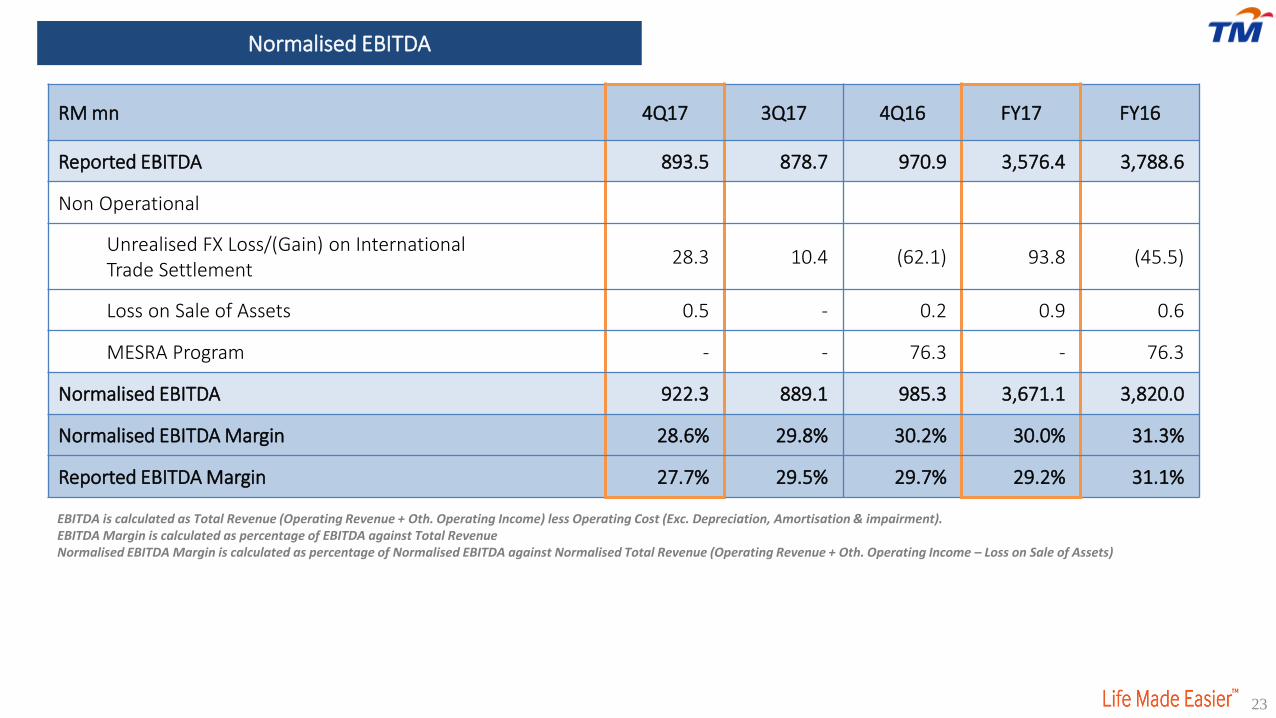
EBITDA is calculated as Total Revenue (Operating Revenue + Oth. Operating Income) less Operating Cost (Exc. Depreciation, Amortisation & impairment).EBITDA Margin is calculated as percentage of EBITDA against Total RevenueNormalised EBITDA Margin is calculated as percentage of Normalised EBITDA against Normalised Total Revenue (Operating Revenue + Oth. Operating Income – Loss on Sale of Assets)
RM mn 4Q17 3Q17 4Q16 FY17 FY16
Reported EBITDA 893.5 878.7 970.9 3,576.4 3,788.6
Non Operational
Unrealised FX Loss/(Gain) on International Trade Settlement
28.3 10.4 (62.1) 93.8 (45.5)
Loss on Sale of Assets 0.5 - 0.2 0.9 0.6
MESRA Program - - 76.3 - 76.3
Normalised EBITDA 922.3 889.1 985.3 3,671.1 3,820.0
Normalised EBITDA Margin 28.6% 29.8% 30.2% 30.0% 31.3%
Reported EBITDA Margin 27.7% 29.5% 29.7% 29.2% 31.1%
Normalised EBITDA
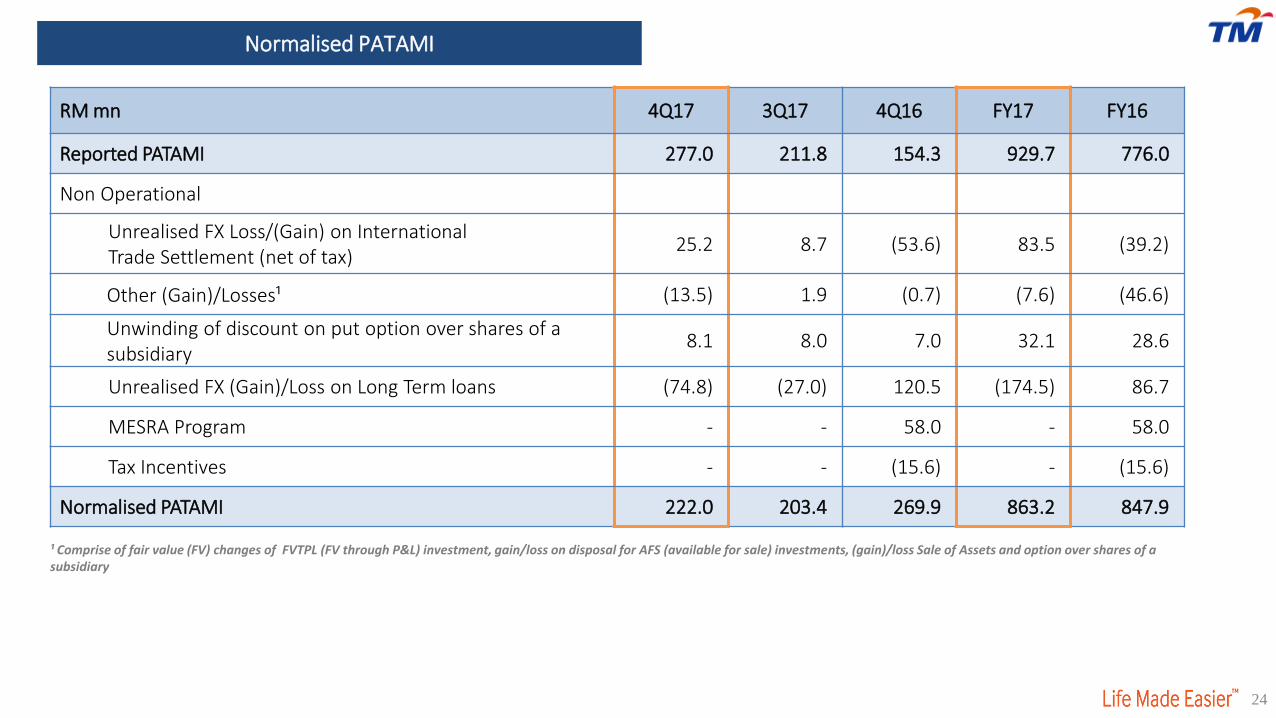
RM mn 4Q17 3Q17 4Q16 FY17 FY16
Reported PATAMI 277.0 211.8 154.3 929.7 776.0
Non Operational
Unrealised FX Loss/(Gain) on International Trade Settlement (net of tax)
25.2 8.7 (53.6) 83.5 (39.2)
Other (Gain)/Losses¹ (13.5) 1.9 (0.7) (7.6) (46.6)
Unwinding of discount on put option over shares of a subsidiary
8.1 8.0 7.0 32.1 28.6
Unrealised FX (Gain)/Loss on Long Term loans (74.8) (27.0) 120.5 (174.5) 86.7
MESRA Program - - 58.0 - 58.0
Tax Incentives - - (15.6) - (15.6)
Normalised PATAMI 222.0 203.4 269.9 863.2 847.9
24
¹ Comprise of fair value (FV) changes of FVTPL (FV through P&L) investment, gain/loss on disposal for AFS (available for sale) investments, (gain)/loss Sale of Assets and option over shares of a subsidiary
Normalised PATAMI

25
RM mn 4Q17 3Q17 4Q16 FY17 FY16
Reported PBT 307.6 235.5 110.6 1,048.0 918.5
Non Operational
Unrealised FX Loss/(Gain) on International Trade Settlement
28.3 10.4 (62.1) 93.8 (45.5)
Other (Gain)/Losses* (13.5) 1.9 (0.7) (7.6) (46.6)
Unwinding of discount on put option over shares of a subsidiary
8.1 8.0 7.0 32.1 28.6
Unrealised FX (Gain)/Loss on Long Term Loans
(74.8) (27.0) 120.5 (174.5) 86.7
MESRA Program - - 76.3 - 76.3
Normalised PBT 255.7 228.8 251.6 991.8 1,018.0
* Comprise fair value (FV) changes of FVTPL (FV through P&L) investment gain/loss on disposal for AFS (available for sale) investments, (gain)/loss on Sale of Assets and option over shares of a subsidiary
Normalised PBT

26
*Total Revenue = Operating Revenue + Other Operating Income
Cost % Revenue
4Q17 3Q17 4Q16 FY16 FY17 Comments (FY17 vs. FY16)
Total Revenue* (RM mn) 3,225.5 2,982.4 3,266.3 12,191.3 12,249.1
Direct Costs % 20.7 19.2 18.0 18.7 19.6 Higher network costs in line with higher cumulative customer base in unifi mobile RM mn 668.7 571.4 589.5 2,282.9 2,400.5
Manpower % 18.0 21.0 22.6 21.7 20.4Absence of Skim Mesra offered in 2017
RM mn 579.2 627.5 737.2 2,641.0 2,497.4
Supplies & Materials % 7.3 5.5 9.1 7.2 6.7 Reduction in customer equipment cost & lower cost ofmaterials for customer projects at TM ONERM mn 236.3 163.1 298.3 876.2 815.4
Bad & Doubtful Debts % 0.6 0.8 0.4 0.3 0.5Increase in impairment loss at TM ONE & TM GLOBAL
RM mn 18.1 24.9 11.9 40.7 57.6
Marketing Expenses % 3.7 4.1 3.5 3.6 3.6 Lower commission offset by higher A&P and customer loyalty chargesRM mn 119.0 123.0 115.6 444.4 440.4
Maintenance Cost % 7.4 7.2 6.2 6.0 6.8Higher maintenance cost mainly at TM ONE
RM mn 238.0 216.1 203.1 735.3 832.9
Other Operating Costs % 14.7 12.7 10.4 11.3 13.3 Higher FOREX losses on trade settlement, higher rental at unifi and higher international service chargeRM mn 472.7 377.8 339.8 1,382.2 1,628.5
Depreciation & Amortisation % 19.3 20.7 21.0 21.6 20.3 Lower depreciation mainly at unifi due to lower Wimaxsites’ write-off and depreciationRM mn 623.2 617.2 685.0 2,634.6 2,483.7
Total Cost (RM mn) 2,955.2 2,721.0 2,980.4 11,037.3 11,156.4
Total (%) 91.6 91.2 91.2 90.5 91.1

27
Group Balance Sheet
RM mnAs at As at
31 Dec 2017 31 Dec 2016
Shareholders’ Funds 7,843.5 7,692.3
Non-Controlling Interests (76.7) 140.2
Deferred & Long Term Liabilities 10,712.2 11,194.4
Long Term Borrowings 7,031.2 7,662.6
Derivative Financial Instruments 287.7 301.9
Deferred Tax 1,591.3 1,514.8
Deferred Income 1,796.5 1,711.4
Others 5.5 3.7
18,479.0 19,026.9
Current Assets 6,133.1 6,887.5
Trade Receivables 1,853.2 2,357.1
Other Receivables 1,857.0 801.1
Cash & Bank Balances 1,719.8 2,926.0
Inventories 258.5 207.1
Others 444.6 596.2
Current Liabilities 6,282.8 5,974.7
Trade and Other Payables 3,934.2 4,103.0
Short Term Borrowings 1,119.0 700.7
Others 1,229.6 1,171.0
Net Current Assets/(Liabilities) (149.7) 912.8
Property Plant & Equipment 16,540.7 16,010.6
Other Non-Current Assets 2,088.0 2,103.5
18,479.0 19,026.9

678 640 626 2,711 2,557 401 370 364
1,587 1,496
951 1,005 1,018
3,671 3,976
602 438 628
2,069 2,040
4Q16 3Q17 4Q17 FY16 FY17
Others
Internet
Data
Voice
28
Revenue by Product by Customer Clusters
Note: Total revenue is after inter-co elimination. Revenue by product is before inter-co elimination *Others comprise other telco and non-telco services (i.e: ICT-BPO, MMU tuition fees, customer projects)
2,513 2,340 2,493
9,589 9,587-0.8%
+6.5%
0.0%unifi and TM ONE
TM GLOBAL
178 157 180 639 640 412 326 436
1,416 1,447
80 61
35
206 201
4Q16 3Q17 4Q17 FY16 FY17
Others
Data
Voice
573 469 550
1,928 1,956-4.0%
+17.3%
+1.5%
Note: Total revenue is after inter-co elimination. Revenue by product is before inter-co elimination

Thank you!Corporate Finance & Investor RelationsLevel 11 (North Wing), Menara TMJalan Pantai Baharu50672 Kuala LumpurMalaysiaTel: (603) 2240 4848/ 7366 / 7388www.tm.com.my/[email protected]