Embed Size (px)
Citation preview
FY 2016 Year-end Summary
October 18, 2016

FY 2016 Year End Summary
• Year Ended With a Balanced Budget
• Fund Balance Continues to Decline from FY 2014
• Majority of funding is restricted (91% in FY 2016)
2
$155.0
$174.0
$203.3
$178.5 $173.4
$36.50
$25.60
$29.80
$21.80
$17.80
$100.0
$120.0
$140.0
$160.0
$180.0
$200.0
$220.0
$240.0
2012 2013 2014 2015 2016
Year-End Fund Balance
Restricted Funding Discretionary Funding
$191.5
$199.6
$233.1
$200.3
$191.2
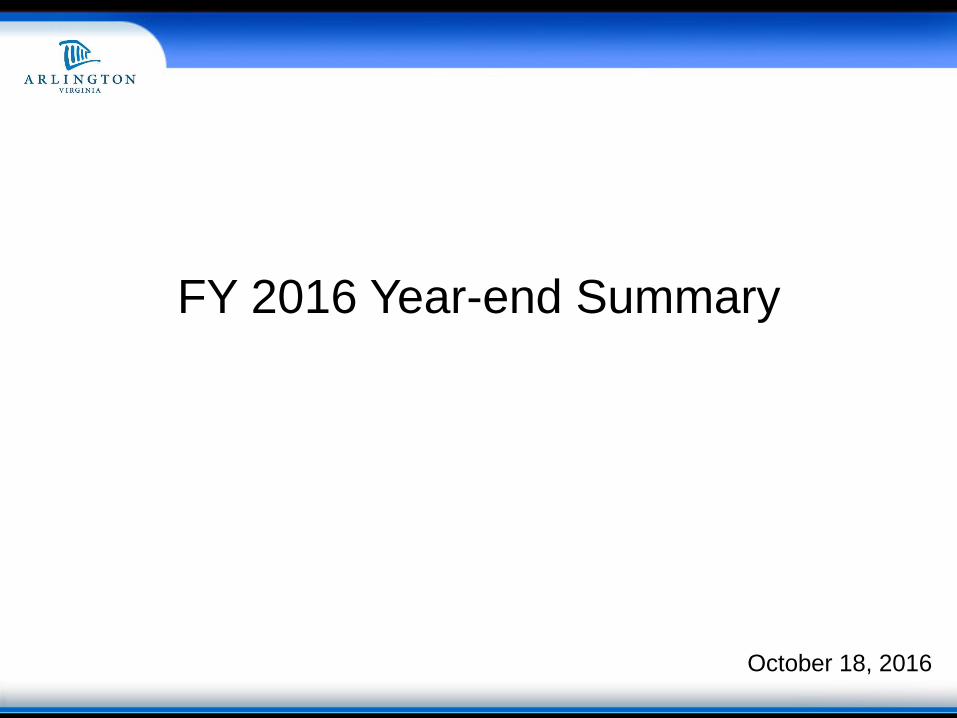
Historical Operating Savings
$18.8
$10.1
$6.4
$0.0
$2.0
$4.0
$6.0
$8.0
$10.0
$12.0
$14.0
$16.0
$18.0
$20.0
2014 2015 2016
$'s
mill
ion
s
Operating Department Savings ($ millions)• Amounts of
department and
program savings vary
from year to year
(1.0% - 3.5%)
• Examples of variable
factors
• Winter Weather
• Hiring Slowdowns
• Program Utilization
(e.g. DPR programs)
• Program Service
Demands
3

FY 2016 Year End Tax Revenue
4
1.6%
1.3%
1.1%1.0%
1.6%
0.0%
0.5%
1.0%
1.5%
2.0%
750
800
850
900
950
1,000
FY 2012 FY 2013 FY 2014 FY 2015 FY 2016
Mil
lio
ns
3rd Quarter Budget Estimate Actuals Actuals to 3rd Quarter
On average, actual tax revenue has been 1.3% higher than 3rd Quarter projections.

5
Allocations of Fund Balance
Allocations of Fund Balance ($191.2 million):
– Over 91% ($173.5 million) of fund balance restricted or already allocated per current Board policy or prior Board action
• Funding to reserves ($67.9 million)– Required to maintain the County’s triple AAA
• Continue commitment to Schools ($25.2 million)
• Affordable Housing Investment Fund ($53.5 million)– $27.5 million Allocated to projects
– $26.0 million Unallocated
• Legally restricted funds ($8.2 million)
• Projects the County Board has already taken action on ($18.7 million)

County Manager Recommendations
Affordable Housing (AHIF & Housing
Grants), $9.1
Operating Contingent, $1.0
Economic & revenue Stabilization , $1.0
Life / Safety, $1.0
Capital, $1.7
Land Acquisition / Temporary Facilities for
Fire Stations, $2.5
Unallocated, $1.6
6
Remaining Funding Recommendations: $17.8 million ($ millions)
7
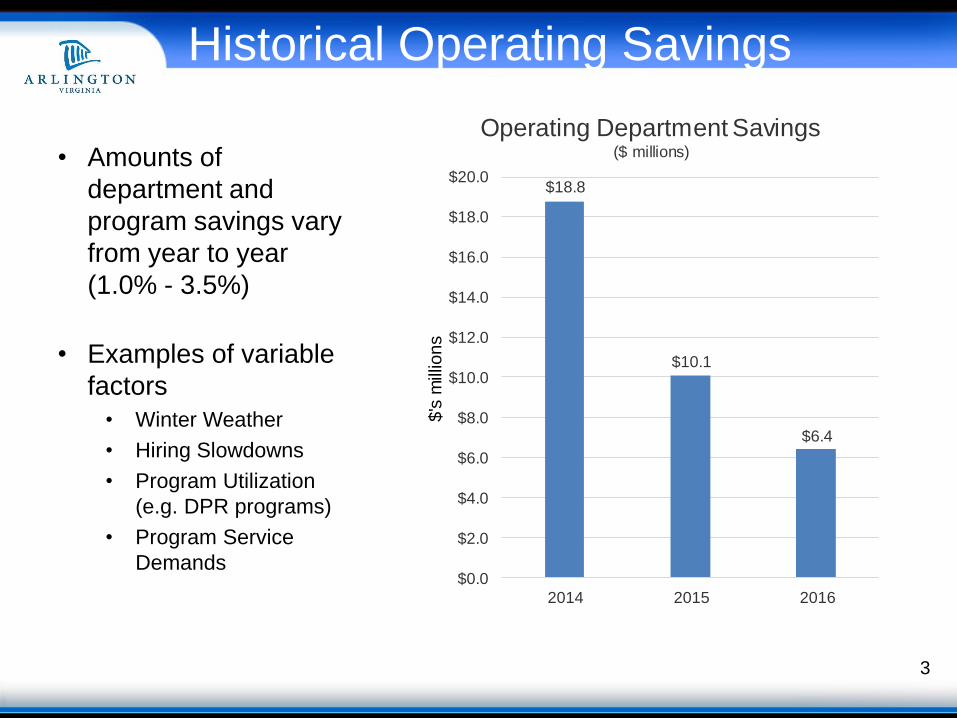
Allocating the Balance of Funding
County Manager’s Recommendations ($17.8 million)
– Affordable Housing• Housing Grants: $2.1 million
– Continue the multi-year effort to include additional ongoing funds for this program
• AHIF: $7.0 million
– Critical Life Safety Needs: $0.95 million• Police equipment for first responders, replacement of generators at key 24x7 facilities, and
one-time funding needed for the Northern Virginia Emergency Response System (NVERS)
– Land Acquisition & Possible Temporary Facility Costs: $2.5 million• Fire Stations 8 (Lee Highway) & 10 (Wilson School)
– Economic & Revenue Stabilization Contingent: $1.0 million
– Capital Projects: $1.7 million
– Operating Contingent: $1.0 million
– Unallocated for consideration in the FY 2018 budget: $1.6 million
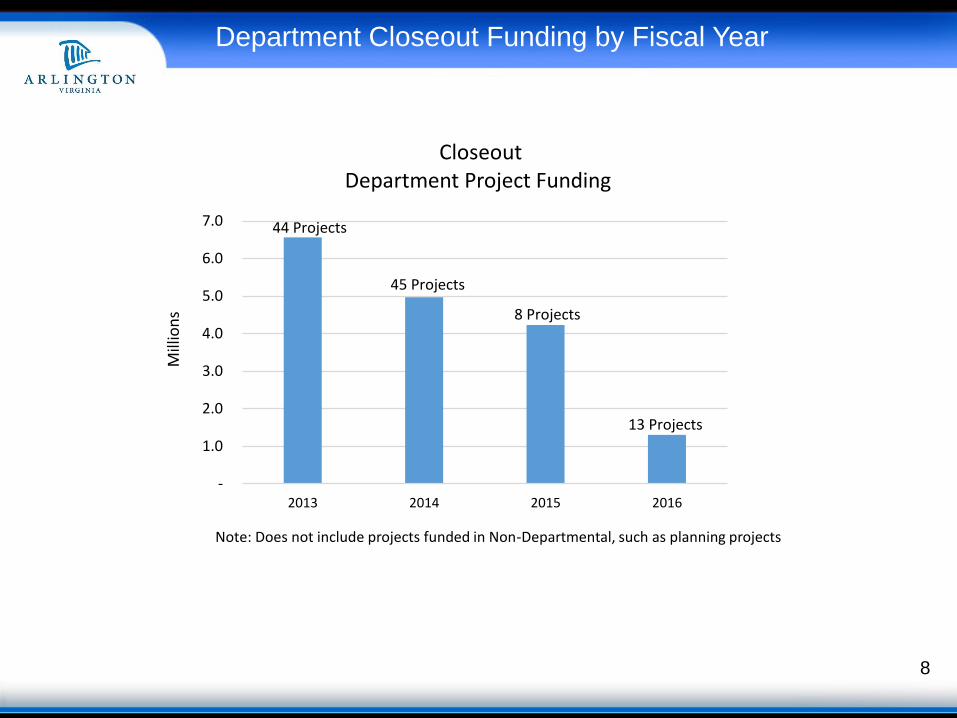
Department Closeout Funding by Fiscal Year
8
-
1.0
2.0
3.0
4.0
5.0
6.0
7.0
2013 2014 2015 2016
Mill
ion
sCloseout
Department Project Funding
44 Projects
45 Projects
8 Projects
13 Projects
Note: Does not include projects funded in Non-Departmental, such as planning projects
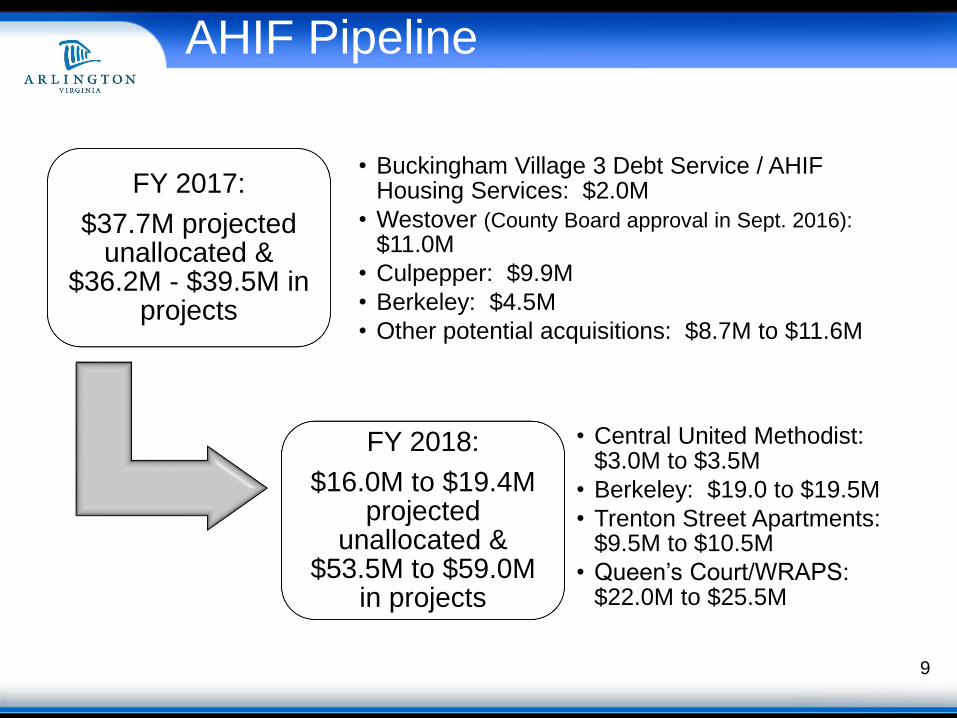
AHIF Pipeline
FY 2017:
$37.7M projected unallocated &
$36.2M - $39.5M in projects
• Buckingham Village 3 Debt Service / AHIF Housing Services: $2.0M
• Westover (County Board approval in Sept. 2016):$11.0M
• Culpepper: $9.9M
• Berkeley: $4.5M
• Other potential acquisitions: $8.7M to $11.6M
FY 2018:
$16.0M to $19.4M projected
unallocated & $53.5M to $59.0M
in projects
• Central United Methodist: $3.0M to $3.5M
• Berkeley: $19.0 to $19.5M
• Trenton Street Apartments: $9.5M to $10.5M
• Queen’s Court/WRAPS: $22.0M to $25.5M
9
FY 2016 Close-out
FY 2018 Budget Forecast Overview
October 18, 2016
12
Arlington Outlook
• Arlington Continues to Grow – Population
– Service Demands
– Real Estate Assessment Base / New Construction
– School Population
• Real Estate Trends– Residential – slightly positive – 2016 sales & prices
up
– Apartments – slower growth in rents, some
concessions
– Commercial Office – continues to be under pressure -
vacancy rate still key concern
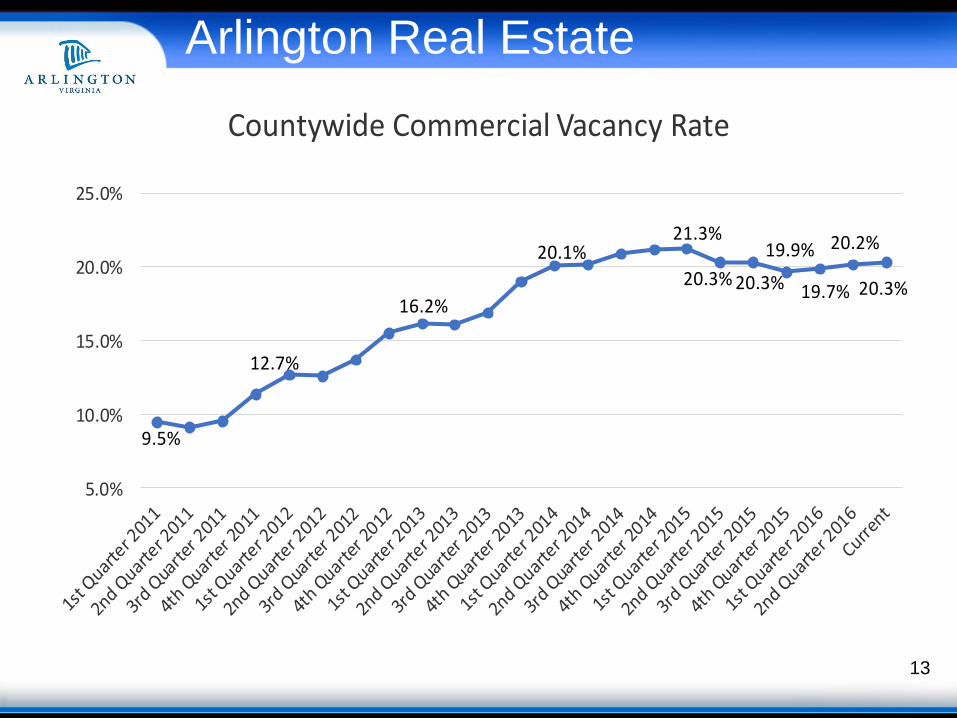
Arlington Real Estate
13
9.5%
12.7%
16.2%
20.1%21.3%
20.3% 20.3% 19.7%
19.9% 20.2%
20.3%
5.0%
10.0%
15.0%
20.0%
25.0%
Countywide Commercial Vacancy Rate
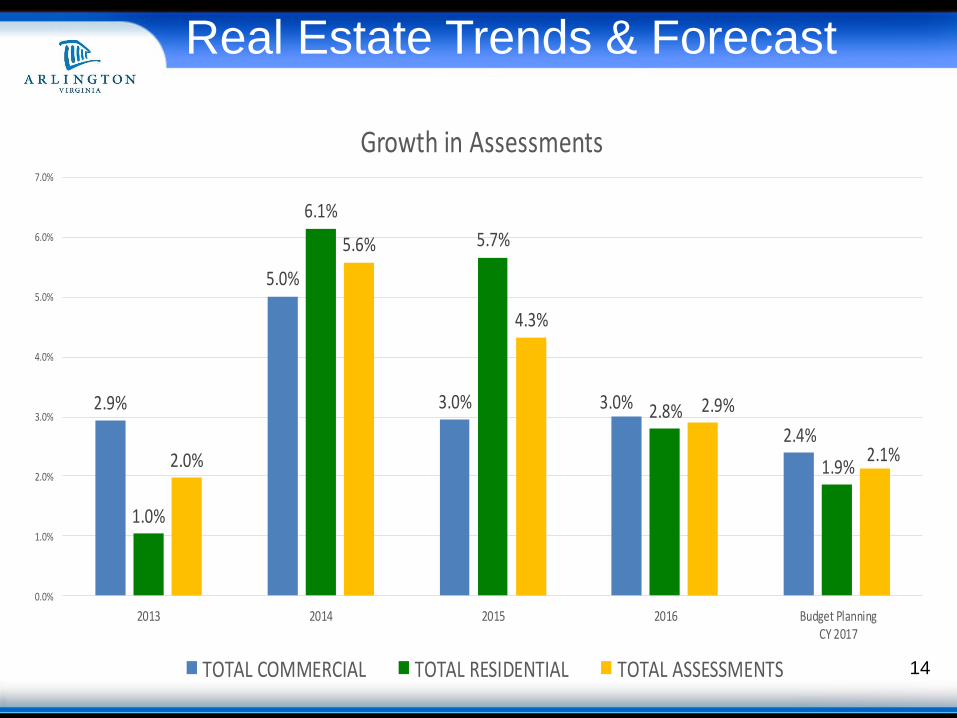
Real Estate Trends & Forecast
14
2.9%
5.0%
3.0% 3.0%
2.4%
1.0%
6.1%
5.7%
2.8%
1.9%2.0%
5.6%
4.3%
2.9%
2.1%
0.0%
1.0%
2.0%
3.0%
4.0%
5.0%
6.0%
7.0%
2013 2014 2015 2016 Budget PlanningCY 2017
Growth in Assessments
TOTAL COMMERCIAL TOTAL RESIDENTIAL TOTAL ASSESSMENTS
Preliminary FY 2018 Outlook
• Other taxes showing slow but positive growth– Personal Property & Business Tangibles: increasing
– Business, Profession & Occupational License (BPOL): increasing
– Sales, Meals, & Transient Occupancy Tax: flat to slow growth
– Other local taxes: up 1%
• Minimal growth in fee revenue
• State & Federal flat– Concerns about the impact of potential state cuts
15
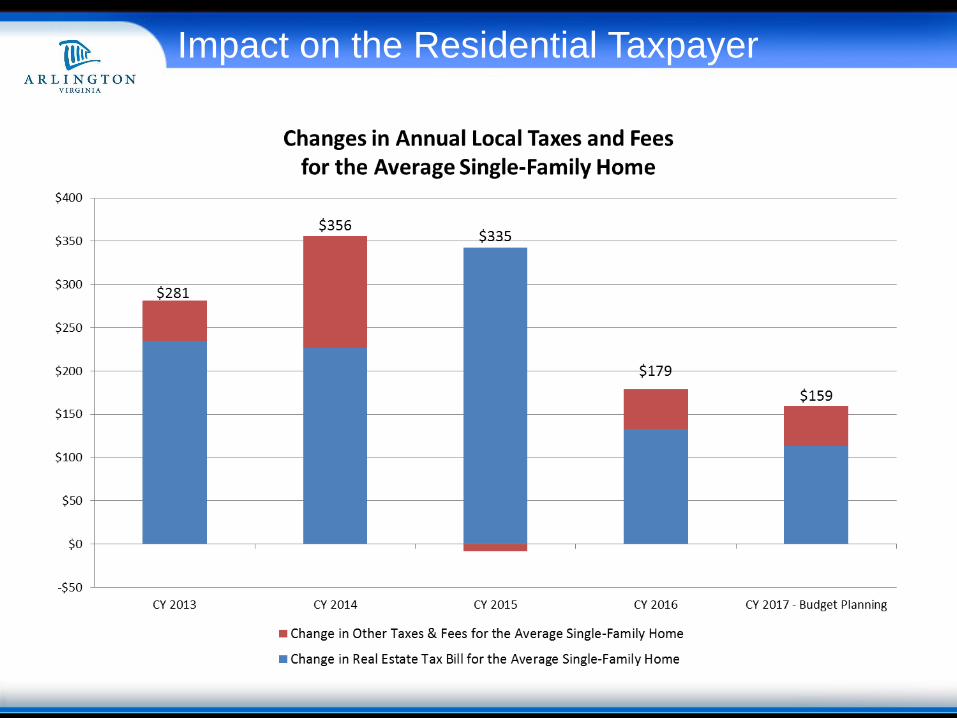
Impact on the Residential Taxpayer

County Expenditure Assumptions
Preliminary Continuing Services
Budget Development Assumptions
• Metro: 13.2% (+$4.0 million)
• Debt: 3% (+$2.1 million)
• Contractual Cost Increases (e.g. multi-year contract
agreements): 1.5% (+1.1 million)
• Healthcare (rates +7.5%): +$1.2 million
• Retirement: flat
• Other Post Employment Benefits (OPEB): flat
• Employee Compensation
– Pay Changes: $7.5 million
17

18
FY 2018 Funding Pressures
• Schools Budget Gap: Unknown at this time– Continuing enrollment increases
– Capacity needs
– Normal inflationary pressures of compensation, healthcare, retirement, OPEB, etc.
• County Budget Gap: $5.4 million– Retirement Costs & Retiree Healthcare (OPEB) could change
– Metro pressures – uncertainty until the WMATA budget is adopted in April 2017
– State budget uncertainty
• One-Time Funding for a Variety of Programs Included in the FY 2017 Budget
Metro Budget Pressures
• WMATA funding gap of $200 - $275 million - declining
ridership, lower fare revenues, and contractual increases in
wages and benefits.
• 2 Primary funding sources for WMATA’s operating budget:
fare revenues & jurisdictional subsidies
• Timing: General Manager proposes his budget in November
2016, with an expected budget adoption no earlier than April
2017.
• Impact to Arlington County:
– $4 - $6 million estimated increase
– Will be an estimate until the WMATA budget is adopted – unsure of
action that will be taken by WMATA Board and jurisdictional partners. 19

20
County Support of Schools
• Sharing Local Tax Revenue (46.6%)
• FY 2018 Ongoing Revenue Transfer:
$474.8 million (up from $464.5
million in FY 2017)
– Increase of $10.2 million over FY 2017
– Funding gap still remains (projected
based on Schools forecast)
• Additional Support (approx. $7-$8
million) Through:
– School Resource Officers
– School Health Nurses & Services
– Crossing Guards
– DHS Programs Helping Children &
Families
– Fields, & Maintaining Safe Routes to
Schools
County Board Guidance
County Manager to Receive
Board Guidance
21
![Six Ion Gun Fusion Experiment (SIGFE) Findings and Future Work€¦ · 0.2 0.4 0.6 0.8 1.0 1.2 1.4 1.6 0.0 0.5 1.0 1.5 2.0 2.5 3.0 3.5 4.0 4.5-2.0 -1.0 0.0 1.0 2.0 x ]-] Neutron data](https://img.pdfslide.us/doc/110x75/60a6f6bf243e2e03cc5a20da/six-ion-gun-fusion-experiment-sigfe-findings-and-future-work-02-04-06-08-10.jpg)