Embed Size (px)
Citation preview

April 2017
Highlights The global economy seems to have turned the corner based on recent consensus-topping economic data.
But optimism should not breed complacency considering significant risks which may cause a relapse or worse. Mounting trade protectionism, credit and geopolitical risks could indeed derail growth.
While many are suggesting that the failure of Republicans to reform Obamacare will stall U.S. tax reform, we
take the opposing view. Republicans are now under pressure to deliver something substantial before next year’s mid-term elections or risk the wrath of voters. But considering low fiscal multipliers associated with tax cuts for corporations and wealthy individuals, don’t hold your breath for the 4% GDP growth that was promised during the election campaign. A more realistic target for U.S. growth is arguably in the 2-3% range, but under such scenario inflation is unlikely to spin out of control.
In light of a stronger-than-expected handoff from last year and the good start to 2017, we have raised by
three ticks our Canadian GDP growth forecast for this year to 2.2%. Despite an elevated debt load, consumers are showing resilience thanks to a solid labour market, credit availability, and the housing wealth effect. Consumption growth should moderate later this year as employment creation ramps down to a more sustainable pace, but government spending is set to take up the baton as Ottawa increases outlays. Trade should also contribute to growth buoyed by the Comprehensive Economic and Trade Agreement with Europe and improving demand stateside. But the threat of protectionism should not be underestimated given its potential to derail exports and hence growth.
Krishen Rangasamy
514-879-3140
Change fromPrevious Forecast
2016 2017 2018 2017 2018
United States
GDP 1.6% 2.2% 2.4% unch unch
CPI inflation 1.3% 2.3% 2.2% +0.1 pp unch
Fed Fund Target Rate* 0.75% 1.50% 2.25% +25 bp +25 bp
Ten-year bond yield* 2.45% 2.95% 3.30% - 6 bp +1 bp
Canada
GDP 1.4% 2.2% 1.7% +0.3 pp unch
CPI inflation 1.4% 1.8% 2.0% unch unch
Overnight rate* 0.50% 0.50% 1.25% unch unch
Ten-year bond yield* 1.72% 2.22% 2.69% +4 bp +4 bp
* end of period

MONTHLY ECONOMIC MONITOR
2
World: Upside surprises The global economy seems to have turned the corner based on recent consensus-topping economic data. But optimism should not breed complacency considering significant risks which may cause a relapse or worse. Mounting trade protectionism, credit and geopolitical risks could indeed derail growth. After a disappointing 2016, the global economy seems to have turned the corner. We got some hints of improvement towards the end of last year and it now seems momentum extended to the first quarter of 2017 based on consensus-topping economic data in both the OECD and emerging markets. Lifting advanced economies in Q1 were the U.S. which seems to be on a roll with a booming labour market (see U.S. section), but also Japan and the Eurozone. All three major advanced economies had composite purchasing managers indices increasing in Q1 relative to the prior quarter. In Japan, rising exports are stimulating factory activity. Business investment has also ramped up in line with improving corporate profits, while consumption spending has shown resilience thanks to healthy income gains and strong employment. However, the annual inflation rate remains well below the Bank of Japan’s 2% target, meaning the central bank will maintain its loose stance on monetary policy for a while despite improving data elsewhere. In the Eurozone, the European Central Bank’s stimulus seems to be having the desired impacts of stimulating borrowing, with household credit and business loans on the rise. The credit channels seem to be functioning again and this is having a positive effect on the real economy. Production has risen above the pre-recession peak in the eurozone even excluding Germany, i.e. the zone is now in expansion mode. The labour market is improving as a result ─ employment grew more than 1% last year. That’s not to say all is rosy. Changing U.S. trade policy presents threats to the Eurozone, more so considering its growing trade surpluses may raise red flags in the new Washington. There are also major uncertainties on the old continent itself such as Brexit and its aftermath, as well as upcoming elections in France and Germany which could potentially lead to a further slide towards growth-busting protectionist policies. Also, despite improvements in credit growth, the banking sector is not yet out of the woods. The share of non-performing loans remain elevated in places such as Italy and Spain, delaying the timeline for repairing bank balance sheets. The Eurozone sovereign debt problem is also not resolved. Greece’s troubles shouldn’t be taken lightly. As we’ve seen in recent years, while it’s a relatively small economy (less than 2% of the eurozone’s GDP), Greece can punch above its weight when it comes to contributing to economic uncertainty.
-140
-120
-100
-80
-60
-40
-20
0
20
40
60
80
2007 2008 2009 2010 2011 2012 2013 2014 2015 2016 2017
World: Economic data surprising on the upsideEconomic surprise index
NBF Economics and Strategy (data via Datastream)
Emerging
OECD
40 42 44 46 48 50 52 54 56 58
Eurozone
U.S.
UK
GLOBAL
China
Japan
India
Brazil 2017Q12016Q4
World: Economic activity generally improved in Q1Composite purchasing managers index
NBF Economics and Strategy (data via Bloomberg)
Index
0
1
2
3
4
5
6
7
8
9
10
11
12
13
14
2007 2008 2009 2010 2011 2012 2013 2014 2015 2016 2017-4
-2
0
2
4
6
8
10
12
14
16
2007 2008 2009 2010 2011 2012 2013 2014 2015 2016 2017
Eurozone: Banking sector is improving
y/y % chg.
NBF Economics and Strategy (data via Datastream)
Loans to non-financial
corporations
Loans to households
MFI loans to households and non-financial corporations
Eurozone bank lending continues to improve …
… although problems persist with regards to bad
loans in some countries
%
Non-performing loans as a share of total loans
Spain
Italy

MONTHLY ECONOMIC MONITOR
3
That’s why ECB President Draghi, during his March press conference, maintained a cautious tone. While there was an acknowledgement that risks surrounding the euro area growth outlook have become less pronounced, the ECB made clear risks remain tilted to the downside. President Draghi downplayed the recent uptick in the annual inflation rate, attributing it to food and energy, while highlighting underlying measures of inflation which remain low. Indeed, the annual core inflation rate has been close to 1% for four years in a row. The ECB expects the latter to rise “only gradually over the medium term” hence warranting its decision to continue with quantitative easing for now. Also of concern to President Draghi is the slow pace of structural reforms. Last year, less than 3% of the recommendations put forward by the European Commission ─ such as reforms to tackle labour market rigidities and boost competitiveness ─ were implemented by targeted governments. The lack of reforms coupled with unfavourable demographics, means the Eurozone’s potential GDP growth will remain low. In other words, the zone seems destined to continue growing at a sub-2% annual pace despite extraordinary monetary policy stimulus from the ECB.
World Economic Outlook
Forecast
2016 2017 2018Advanced countries 1.7 1.9 1.9United States 1.6 2.2 2.4Euroland 1.7 1.6 1.5Japan 1.0 1.2 1.0UK 2.0 1.5 1.3Canada 1.4 2.2 1.7Australia 2.4 2.5 2.8New Zealand 2.7 3.2 2.9Hong Kong 1.5 1.6 1.9Korea 2.7 2.5 2.5Taiwan 1.4 1.7 1.9Singapore 1.8 1.6 2.0
Emerging Asia 6.4 6.0 5.9China 6.7 6.5 6.1India 7.1 6.8 7.4Indonesia 5.0 5.2 5.3Malaysia 4.2 4.2 4.4Philippines 6.8 6.4 6.3Thailand 3.2 3.2 3.2
Latin America -1.1 1.5 2.2Mexico 2.3 1.4 2.0Brazil -3.6 0.7 2.3Argentina -2.3 3.0 3.2Venezuela -18.6 -3.1 0.6Colombia 1.5 2.0 2.6
Eastern Europe and CIS 1.2 1.6 1.9Russia -0.5 1.3 1.6Czech Rep. 2.3 2.5 2.6Poland 2.8 3.1 3.1Turkey 2.1 2.2 3.1
Middle East and N. Africa 3.3 2.8 3.3
Sub-Saharan Africa 1.6 3.0 3.8
Advanced economies 1.7 1.9 1.9Emerging economies 4.0 4.3 4.5World 3.0 3.3 3.4
Source: NBF Economics and Strategy
1.54
1.56
1.58
1.60
1.62
1.64
1.66
1.68
1.70
1.72
1.74
1.76
1.78
1.80
1.82
43
44
45
46
47
48
49
50
51
52
53
54
55
56
57
Nov 16 Dec 16 Jan 17 Feb 17 Mar 17-0.8
-0.4
0.0
0.4
0.8
1.2
1.6
2.0
2.4
2.8
2012 2013 2014 2015 2016 2017
Eurozone: Core inflation remains mild
y/y % chg.
NBF Economics and Strategy (data via Datastream)
TOTAL
Core, i.e. excluding energy, foods, alcohol and tobacco
Feb.
Consumer price index Inflation expectations in 5 years for the next five years versus WTI oil price
WTI (R)
Inflation expectations (L)
% US$/barrel
ECB should focus on core inflation …
… and refrain from paying too much attention to measures of inflation
expectations which can be volatile
0
1
2
3
4
5
6
7
8
2014 2015 2016
European Union: Reform efforts have weakened Share of fully addressed country specific recommendations or those where substantial progress has been made
%
NBF Economics and Strategy (data via European Commission)

MONTHLY ECONOMIC MONITOR
4
Like the OECD, emerging markets started 2017 with consensus-topping economic data. India’s purchasing managers indices for the manufacturing and services sectors both returned to expansion mode in Q1 after briefly dipping below 50 the prior quarter when the cash ban was introduced. In China, the purchasing managers indices remained comfortably above 50 in the first quarter for both the manufacturing and services sectors. Exports, which fell in 2015 and 2016, now seem to be stabilizing, giving a boost to the manufacturing sector. Imports also seem to be slowly coming back after falling even faster than exports in the last two years. That said, China’s trade surplus, which fell to about half a trillion dollars last year, has room for further declines considering the still-elevated yuan in real effective terms. China’s domestic demand is finding support from consumers with nominal retail spending growing roughly 10% in Q1 on a year-on-year basis. The apparent recovery in the real estate market may be helping. The number of cities seeing monthly declines in home prices have dwindled in recent months. So much so that the real estate climate index, after treading water for so long, has soared to its highest level in over 5 years. The improvement in the real estate outlook is good news in that it lowers odds of default in a highly-levered economy. But China’s financial system is not out of the woods just yet. Corporations have borrowed heavily with their debt now accounting for a massive 145% of China’s GDP. The corporate debt to earnings ratio has accordingly soared. Credit risks have been enhanced further by the proliferation of shadow banking products. About half of the stock of shadow credit products is reportedly high yield and hence high risk. So, the question is not if but when defaults are going to hit China’s financial system. The threat of a financial crisis in the world’s second largest economy should not be underestimated. The debt problem isn’t isolated to China. According to the Bank of International Settlements’ latest Quarterly Review, US dollar-denominated debt outstanding outside of America at the end of 2016Q3 amounted to a record US$10.5 trillion, or almost 19% of world GDP excluding the U.S. While USD-denominated debt has increased in emerging markets to $3.6 trillion, that pales in comparison to advanced economies (ex-U.S.) where such debt jumped to US$6.9 trillion at the end of Q3 or 25% of GDP of advanced economies excluding the U.S. That’s more than three times the exposure of 20 years ago. The persistence of USD strength is bad news for those borrowers. All told, while the global economy seems to have turned the corner, credit risks have potential to cause a relapse or worse. The threat of increased trade protectionism and political instability in places such as Europe should not be underestimated either.
85
90
95
100
105
110
115
120
125
130
135
2007 2008 2009 2010 2011 2012 2013 2014 2015 2016
China: Declining trade surplus
NBF Economics and Strategy (data via Bank of International Settlements, Datastream)
Real effective yuan
Despite last year’s depreciation, real effective
yuan remains high …
100
150
200
250
300
350
400
450
500
550
600
650
600
800
1,000
1,200
1,400
1,600
1,800
2,000
2,200
2,400
2,600
2007 2008 2009 2010 2011 2012 2013 2014 2015 2016 2017
Exports, Imports and Trade balance, 12-month cumulative
… which explains declining trade
surplus
US$ bn US$ bn
Imports (R)
Exports (R)
Trade balance (L)
0
4
8
12
16
20
24
28
32
36
40
44
48
52
56
60
64
68
72
2011 2012 2013 2014 2015 2016 201792
93
94
95
96
97
98
99
100
101
102
103
104
2011 2012 2013 2014 2015 2016 2017
China: Sharp improvement in real estate outlook
Real estate climate index
NBF Economics and Strategy (data via Bloomberg)
Number of cities seeing monthly decrease in price
Existing residentialapartments
New residentialapartments
Sharp improvement in real estate outlook …
… as fewer cities see home price declines
2
3
4
5
6
7
8
9
10
11
10
11
12
13
14
15
16
17
18
19
2000 2002 2004 2006 2008 2010 2012 2014 2016
US$ trillion
NBF Economics and Strategy (data via Bank of International Settlements)
% of GDP (R)
TOTAL (L)
%
World: Record USD-denominated debt USD-denominated debt held outside of the U.S.

MONTHLY ECONOMIC MONITOR
5
U.S.: Fed tightens policy While many are suggesting that the failure of Republicans to reform Obamacare will stall U.S. tax reform, we take the opposing view. Republicans are now under pressure to deliver something substantial before next year’s mid-term elections or risk the wrath of voters. But considering low fiscal multipliers associated with tax cuts for corporations and wealthy individuals, don’t hold your breath for the 4% GDP growth that was promised during the election campaign. A more realistic target for U.S. growth is arguably in the 2-3% range, but under such scenario inflation is unlikely to spin out of control. The U.S. economy is on a roll according to latest data. Indices from the Institute for Supply Management for both the manufacturing and non-manufacturing sectors soared to multi-year highs in February. While the non-manufacturing index is the highest since October 2015, its business activity sub-component is the highest in six years, pointing to a strong services sector. In the manufacturing sector, output is reportedly growing at the fastest pace since 2011, buoyed by strong increases for new orders both at home and abroad. The uptick in factory orders reflects higher demand for capital goods, a sign that business investment, which was rather weak last year, is finally bouncing back. The labour market is also booming. While warmer-than-usual weather probably helped boost February’s employment numbers, underlying strength cannot be denied. Indeed, the establishment survey’s consensus-topping 235K increase for February non-farm payrolls included large gains in cyclical sectors such as manufacturing and construction, both of which suggest the U.S. economy is on solid footing. Construction employment even rose by the biggest amount in a decade. And it wasn’t just those sectors because job gains were broad-based as evidenced by the highest private sector diffusion index since 2015. Wages are also growing at a decent pace of 2.8% on a year-on-year basis. The household survey’s increases in employment ─ full-time jobs crossed 125 million for the first time ─ and the participation rate (63% is the highest in a year) were also encouraging. The improving data gave the Fed more confidence that the recent uptick in prices can be sustained, and it accordingly raised interest rates by 25 basis points to 1.00% in March. It’s unclear, however, if inflation pressures can be sustained ─ see our latest Special Report: “How concerned should the Fed be about U.S. inflation?”. For instance, wage growth is likely to remain under control if there is further progress on the participation rate, particularly for the age group 25-54, the most cyclical cohort of the labour market. The latter, which hit a six-year high of 81.7% in February, has plenty of room to increase further as prime-age workers enter the labour force.
47
48
49
50
51
52
53
54
55
56
57
58
59
60
2014 2015 2016 2017
Index
NBF Economics and Strategy (data via Federal Reserve)
Manufacturing
Non-manufacturing
U.S.: Momentum from last year extended to Q1 ISM manufacturing and non-manufacturing indices
Feb.
-12
-8
-4
0
4
8
12
16
20
2012 2013 2014 2015 2016 2017
q/q % chg. saar
*Assuming no change in March and no revisions to prior months NBF Economics and Strategy (data via Datastream)
Shipments of non-defense capital goods
excluding aircrafts
Real business investmentin equipment
U.S.: Business investment is bouncing back Real business investment in equipment versus Shipments of non-defense capital goods excluding aircrafts
Q1 est.*
110
111
112
113
114
115
116
117
118
119
120
121
122
123
124
125
126
2007 2008 2009 2010 2011 2012 2013 2014 2015 2016 201780.4
80.6
80.8
81.0
81.2
81.4
81.6
81.8
82.0
82.2
82.4
82.6
82.8
83.0
83.2
83.4
83.6
61.2
61.6
62.0
62.4
62.8
63.2
63.6
64.0
64.4
64.8
65.2
65.6
66.0
66.4
66.8
67.2
67.6
2007 2008 2009 2010 2011 2012 2013 2014 2015 2016 2017
U.S.: Labour market is booming
NBF Economics and Strategy (data via Datastream)
millions
Feb.
Full time employment Participation rate
%
Feb.
Total (R)
25-54 age group (L)
Highest since 2011
%

MONTHLY ECONOMIC MONITOR
6
The Fed’s optimism is also based on upcoming fiscal stimulus. While the latter should indeed lift U.S. growth, the extent of the boost may not be as good as advertised. The Trump administration reportedly aims to boost defense spending by US$54 billion this year, while seeking compensating cuts in non-defense spending. But fiscal multipliers for defense spending have typically been estimated at less than 1, meaning that such outlays are likely to crowd out private spending, restraining growth as a result. One can only hope compensating cuts to non-defense spending does not include infrastructure whose fiscal multiplier is well above 1 according to the Congressional Budget Office. While many are suggesting that the failure of Republicans to reform Obamacare will stall Tax reform, we take the opposing view. Tax cuts for corporations and the wealthy are much easier to do than health care reform and have broad support among Republicans. More importantly, after their failure on health reform, Republicans are now under pressure to deliver something substantial before next year’s mid-term elections or risk the wrath of voters. But the benefits of such tax policy are unclear ─ the CBO suggests fiscal multipliers are much lower than 1 when there are tax cuts for corporations and wealthy individuals. So, don’t hold your breath for the 4% U.S. GDP growth that was promised during the election campaign. A more realistic target for growth is arguably in the 2-3% range, but under such scenario inflation is unlikely to spin out of control. Could protectionism cause U.S. inflation to rise? A tariff or border adjustment tax on imports would indeed raise the price of imported goods for American consumers. But unless tariffs are raised every year, the impact on annual inflation would be temporary because the annual price increase due to the tariff would vanish after a year. Moreover, the inflation impact would also be restricted considering the share of imports in U.S. personal consumption expenditures is less than 15%. Moreover, a reversal in prices is likely over the longer-term as economic growth, employment and hence inflation is negatively affected. Note that more than 11 million U.S. workers depend directly on exports and hence would be vulnerable to retaliatory measures from trade partners. All told, we doubt the Fed can deliver more than three rate hikes this year (including March’s increase). While the economy seems strong now, that’s not to say it will remain so throughout the year. Note that credit growth is softening, coinciding with tighter monetary policy since last December. Loans and leases were about flat in the first quarter of 2017 as increases for consumer loans were offset by weak commercial and industrial loans, the latter even registering a quarterly drop for the first time since 2010. One can only hope this is just a temporary pullback because if it turns into a downtrend, the ongoing recovery in business investment spending could be derailed.
480
520
560
600
640
680
720
760
800
840
2000 2002 2004 2006 2008 2010 2012 2014 2016
U.S.: How effective is defense spending?
Defense spending by federal government
US$ bn
NBF Economics and Strategy (data via BEA)
Sequestrationstarts
+9%
0.0
0.2
0.4
0.6
0.8
1.0
1.2
Owyang, Ramey,Zubairy (2013)
Barro/Redlick (2011) Hall (2009)
Estimations of fiscal multiplier on defense spending
8.0
8.4
8.8
9.2
9.6
10.0
10.4
10.8
11.2
11.6
6.2
6.4
6.6
6.8
7.0
7.2
7.4
7.6
7.8
8.0
8.2
8.4
2000 2002 2004 2006 2008 2010 2012 2014
millions
NBF Economics and Strategy (data via International Trade Administration)
Share of non-farmpayrolls (R)
TOTAL (L)
%
U.S.: More than 11 million workers depend directly on exports Jobs supported by exports
-14
-12
-10
-8
-6
-4
-2
0
2
4
6
8
10
12
14
16
2011 2012 2013 2014 2015 2016 2017
q/q % chg. saar
NBF Economics and Strategy (data via Federal Reserve)
Commercial and industrial loans
Loans and leases
U.S.: Weakest credit growth in six years Loans and leases
Q1 est.
Consumer loans

MONTHLY ECONOMIC MONITOR
7
Canada: Good start to 2017 In light of a stronger-than-expected handoff from last year and the good start to 2017, we have raised by three ticks our Canadian GDP growth forecast for this year to 2.2%. Despite an elevated debt load, consumers are showing resilience thanks to a solid labour market, credit availability, and the housing wealth effect. Consumption growth should moderate later this year as employment creation ramps down to a more sustainable pace, but government spending is set to take up the baton as Ottawa increases outlays. Trade should also contribute to growth buoyed by the Comprehensive Economic and Trade Agreement with Europe and improving demand stateside. But the threat of protectionism should not be underestimated given its potential to derail exports and hence growth. Canada’s economy continues to surprise on the upside providing more evidence it has adjusted to the oil shock. While last year’s GDP growth ended up at a meagre 1.4%, the handoff to 2017 was very good. The fourth quarter’s growth print of 2.6% annualized was well above consensus-expectations as the economy found support from consumption and housing demand courtesy of solid job creation and rising incomes, but also credit availability. Indeed, both mortgage and consumer credit remained strong, the latter even growing in the second half last year at the fastest pace in 5 years. Strength in consumption and housing seems to have extended to early 2017. So much so, that we have raised by three ticks our Canadian GDP growth forecast for this year to 2.2%. Home sales remain robust while retail volumes are on track to grow at a healthy pace again in the first quarter. An elevated household savings rate, the housing wealth effect ─ the Teranet–National Bank Composite House Price Index shows a year-on-year increase of over 12% in Q1 ─, and solid job gains helped boost spending during the quarter. Recall that roughly 64,000 jobs were created in the first two months of 2017, the best start of the year since 2008. It’s also encouraging that fiscal stimulus is starting to flow as evidenced by healthy contributions of government to Q4 growth. Nominal GDP, which grew 2% last year, is expected by consensus to grow at roughly double that pace this year and next. That explains why the 2017 federal budget forecasted revenues will grow about 4% in the next two years. Program expenses are slated to increase about 5% in 2017-2018, resulting in a projected deficit of $28.5 billion for that fiscal year, or roughly 1.4% of GDP. That is expected to be followed by a $27.4 billion deficit in 2018-19 or 1.2% of GDP. The debt-to-GDP ratio is slated to increase slightly to 31.6% in each of the coming two years, ending up a bit below 31% by 2021-22. While that’s not the lowest ratio among AAA-rated sovereigns, it is nonetheless consistent with good long-term fiscal sustainability.
1.0
1.5
2.0
2.5
3.0
3.5
4.0
4.5
5.0
5.5
6.0
6.5
7.0
7.5
2011 2012 2013 2014 2015 20161.00
1.25
1.50
1.75
2.00
2.25
2.50
2.75
3.00
3.25
3.50
3.75
4.00
4.25
4.50
4.75
5.00
2011 2012 2013 2014 2015 2016
Canada: Consumer credit growth on the rise
s/s % chg. saar
NBF Economics and Strategy (data via Statistics Canada)
y/y % chg.
Household credit Consumer credit, by semester
Second half last year sawconsumer credit grow at the fastest pace in 5 years
Residentialmortgage credit
Consumer credit
TOTAL
-5
-4
-3
-2
-1
0
1
2
3
4
5
6
7
2015q1 2015q2 2015q3 2015q4 2016q1 2016q2 2016q3 2016q4 2017q1
Canada: Consumption spending remains strong Real consumption spending on goods versus Real retail sales
*Assuming no change in February and March and no revisions to prior months NBF Economics and Strategy (data via Statistics Canada)
q/q % chg. saar
est.*
Retail volumes
Real consumption spending on goods (from
national accounts)
-23
-28.5-27.4
-23.4
-21.7
-30
-25
-20
-15
-10
-5
02016-17 2017-18 2018-19 2019-20 2020-21
Budget 2016 Budget 2017
Canada: Budget deficits expected to remain below 1.5% of GDPProjections from Federal Budgets for Canadian budget balance (includes C$3 bn adjustment for risk)
C$ bn
NBF Economics and Strategy (data via Department of Finance)
MONTHLY ECONOMIC MONITOR
8
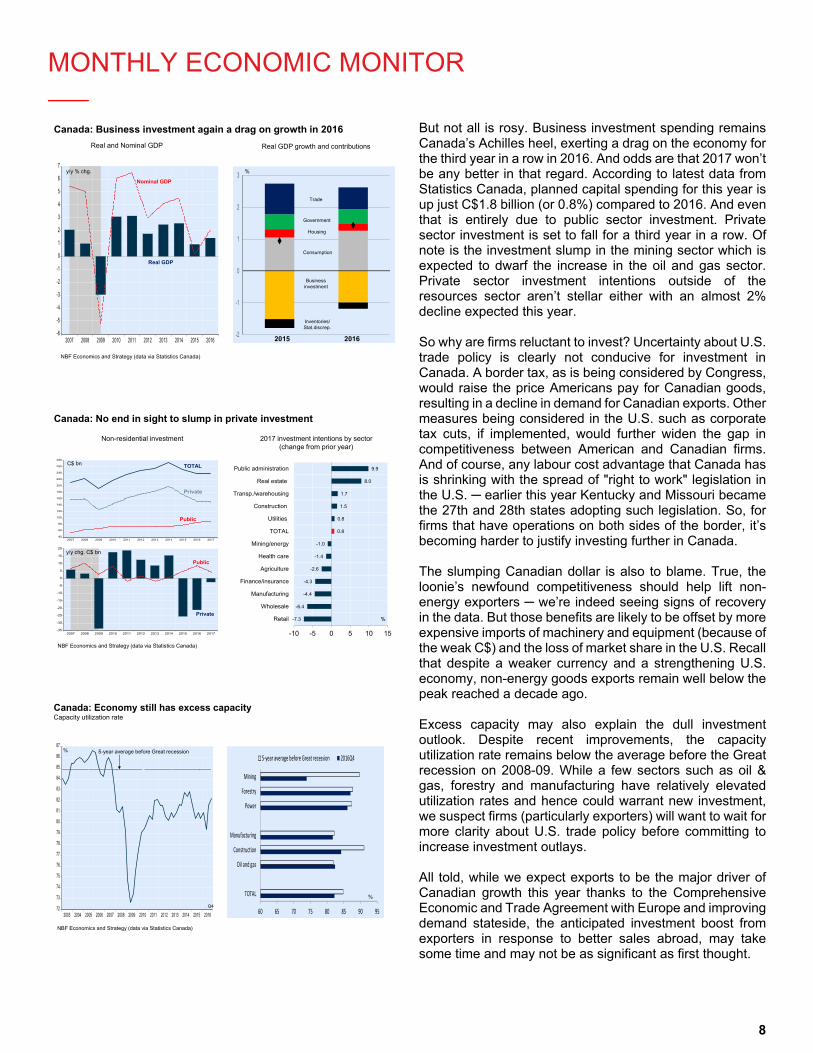
But not all is rosy. Business investment spending remains Canada’s Achilles heel, exerting a drag on the economy for the third year in a row in 2016. And odds are that 2017 won’t be any better in that regard. According to latest data from Statistics Canada, planned capital spending for this year is up just C$1.8 billion (or 0.8%) compared to 2016. And even that is entirely due to public sector investment. Private sector investment is set to fall for a third year in a row. Of note is the investment slump in the mining sector which is expected to dwarf the increase in the oil and gas sector. Private sector investment intentions outside of the resources sector aren’t stellar either with an almost 2% decline expected this year. So why are firms reluctant to invest? Uncertainty about U.S. trade policy is clearly not conducive for investment in Canada. A border tax, as is being considered by Congress, would raise the price Americans pay for Canadian goods, resulting in a decline in demand for Canadian exports. Other measures being considered in the U.S. such as corporate tax cuts, if implemented, would further widen the gap in competitiveness between American and Canadian firms. And of course, any labour cost advantage that Canada has is shrinking with the spread of "right to work" legislation in the U.S. ─ earlier this year Kentucky and Missouri became the 27th and 28th states adopting such legislation. So, for firms that have operations on both sides of the border, it’s becoming harder to justify investing further in Canada. The slumping Canadian dollar is also to blame. True, the loonie’s newfound competitiveness should help lift non-energy exporters ─ we’re indeed seeing signs of recovery in the data. But those benefits are likely to be offset by more expensive imports of machinery and equipment (because of the weak C$) and the loss of market share in the U.S. Recall that despite a weaker currency and a strengthening U.S. economy, non-energy goods exports remain well below the peak reached a decade ago. Excess capacity may also explain the dull investment outlook. Despite recent improvements, the capacity utilization rate remains below the average before the Great recession on 2008-09. While a few sectors such as oil & gas, forestry and manufacturing have relatively elevated utilization rates and hence could warrant new investment, we suspect firms (particularly exporters) will want to wait for more clarity about U.S. trade policy before committing to increase investment outlays. All told, while we expect exports to be the major driver of Canadian growth this year thanks to the Comprehensive Economic and Trade Agreement with Europe and improving demand stateside, the anticipated investment boost from exporters in response to better sales abroad, may take some time and may not be as significant as first thought.
-6
-5
-4
-3
-2
-1
0
1
2
3
4
5
6
7
2007 2008 2009 2010 2011 2012 2013 2014 2015 2016-2
-1
0
1
2
3
NBF Economics and Strategy (data via Statistics Canada)
2015 2016
Business investment
Trade
Housing
Consumption
Government
Inventories/Stat.discrep.
Real GDP growth and contributions
Canada: Business investment again a drag on growth in 2016
y/y % chg.
Nominal GDP
Real GDP
Real and Nominal GDP
%
-7.3
-6.4
-4.4
-4.3
-2.6
-1.4
-1.0
0.8
0.8
1.5
1.7
8.0
9.9
-10 -5 0 5 10 15
Retail
Wholesale
Manufacturing
Finance/insurance
Agriculture
Health care
Mining/energy
TOTAL
Utilities
Construction
Transp./warehousing
Real estate
Public administration
40
60
80
100
120
140
160
180
200
220
240
260
280
2007 2008 2009 2010 2011 2012 2013 2014 2015 2016 2017
-35
-30
-25
-20
-15
-10
-5
0
5
10
15
20
2007 2008 2009 2010 2011 2012 2013 2014 2015 2016 2017
Canada: No end in sight to slump in private investment
2017 investment intentions by sector (change from prior year)
Non-residential investment
y/y chg. C$ bn
%
NBF Economics and Strategy (data via Statistics Canada)
Public
Private
C$ bn
Public
Private
TOTAL
72
73
74
75
76
77
78
79
80
81
82
83
84
85
86
87
2003 2004 2005 2006 2007 2008 2009 2010 2011 2012 2013 2014 2015 2016 60 65 70 75 80 85 90 95
TOTAL
Oil and gas
Construction
Manufacturing
Power
Forestry
Mining
5‐year average before Great recession 2016Q4
Canada: Economy still has excess capacity Capacity utilization rate
%
NBF Economics and Strategy (data via Statistics Canada)
% 5-year average before Great recession
Q4

MONTHLY ECONOMIC MONITOR
9
Q4/Q4(Annual % change)* 2014 2015 2016 2017 2018 2006 2016 2017 2018
Gross domestic product (2009 $) 2.4 2.6 1.6 2.2 2.4 1.9 2.1 2.5Consumption 2.9 3.2 2.7 2.8 2.6 3.0 2.5 2.5Residential construction 3.5 11.7 4.9 3.7 1.8 1.1 4.0 1.5Business investment 6.0 2.1 (0.5) 1.4 1.8 0.0 1.5 2.1Government expenditures (0.9) 1.8 0.8 1.4 2.7 0.2 2.5 2.2Exports 4.3 0.1 0.4 (0.6) (0.3) 1.6 (1.5) 0.5Imports 4.4 4.6 1.1 3.3 1.6 2.5 2.5 1.0Change in inventories (bil. $) 57.7 84.0 21.1 45.0 43.0 46.2 44.2 42.2Domestic demand 2.6 3.1 2.1 2.4 2.5 2.1 2.5 2.4
Real disposable income 3.5 3.5 2.8 2.1 1.7 2.5 1.8 1.7Household employment 1.6 1.7 1.7 1.1 1.2 1.6 1.2 1.2Unemployment rate 6.2 5.3 4.9 4.8 4.6 4.7 4.7 4.5Inflation 1.6 0.1 1.3 2.3 2.2 1.8 2.0 2.5Before-tax profits 5.9 (3.0) 0.1 6.8 4.6 10.0 4.9 4.5Federal balance (unified budget, bil. $) (483.3) (439.0) (588.0) (594.0) (620.0) ... ... ...Current account (bil. $) (392.1) (463.0) (481.2) (474.5) (514.5) ... ... ...
-304
* or as noted
Current Q4 2016 Q4 2017 Q4 20183-24-17 Q2 2017 Q3 2017 Q4 2017 Q1 2018 2016 2017 2018
Fed Fund Target Rate 1.00 1.00 1.25 1.50 1.75 0.75 1.50 2.25 3 month Treasury bills 0.77 0.83 1.10 1.33 1.55 0.50 1.33 2.08 Treasury yield curve 2-Year 1.26 1.45 1.59 1.85 2.10 1.20 1.85 2.60 5-Year 1.93 2.10 2.20 2.43 2.65 1.93 2.43 2.96 10-Year 2.40 2.67 2.73 2.95 3.10 2.45 2.95 3.30 30-Year 3.00 3.26 3.29 3.47 3.58 3.06 3.47 3.69 Exchange rates U.S.$/Euro 1.08 1.07 1.05 1.03 1.04 1.05 1.03 1.07 YEN/U.S.$ 111 113 115 117 116 117 117 111
** end of period
Q1 2016 Q2 2016 Q3 2016 Q4 2016 Q1 2017 Q2 2017 Q3 2017 Q4 2017actual actual actual actual forecast forecast forecast forecast
Real GDP growth (q/q % chg. saar) 0.8 1.4 3.5 1.9 1.8 2.2 2.3 2.0CPI (y/y % chg.) 1.1 1.1 1.1 1.8 2.7 2.3 2.3 2.0Core CPI (y/y % chg.) 2.2 2.2 2.2 2.2 2.3 2.2 2.2 2.2Unemployment rate (%) 4.9 4.9 4.9 4.7 4.8 4.8 4.8 4.7
National Bank Financial
Quarterly pattern
United StatesEconomic Forecast
Financial Forecast**

MONTHLY ECONOMIC MONITOR
10
Q4/Q4(Annual % change)* 2014 2015 2016 2017 2018 2016 2017 2018
Gross domestic product (2007 $) 2.6 0.9 1.4 2.2 1.7 1.9 2.0 1.6Consumption 2.8 1.9 2.2 2.0 1.3 2.4 1.6 1.3Residential construction 2.7 3.8 2.9 0.6 (1.5) 2.4 (0.3) (1.5)Business investment 3.2 (11.5) (8.4) (1.6) 2.6 (7.0) 3.4 1.9Government expenditures 0.0 1.9 1.9 2.6 0.9 2.4 2.5 0.5Exports 5.8 3.4 1.1 3.0 4.0 0.8 4.2 3.6Imports 2.2 0.3 (1.0) 1.3 2.2 (1.3) 4.5 1.7Change in inventories (millions $) 9,392 3,861 -1,038 1,031 1,273 -4,365 1,298 1,539Domestic demand 1.9 0.3 0.9 1.6 1.2 1.2 1.8 1.0
Real disposable income 1.3 3.3 2.9 2.9 1.7 3.1 1.9 1.7Employment 0.6 0.9 0.7 1.3 0.7 1.1 1.0 0.7Unemployment rate 6.9 6.9 7.0 6.7 6.5 6.9 6.6 6.5Inflation 1.9 1.1 1.4 1.8 2.0 1.4 2.0 2.0Before-tax profits 8.2 (19.5) (4.5) 16.3 7.1 12.0 9.5 6.0Current account (bil. $) (48.2) (67.6) (67.7) (69.2) (58.0) .... .... ....
* or as noted
Current Q4 2016 Q4 2017 Q4 20183-24-17 Q2 2017 Q3 2017 Q4 2017 Q1 2018 2016 2017 2018
Overnight rate 0.50 0.50 0.50 0.50 0.75 0.50 0.50 1.25 3 month T-Bills 0.49 0.49 0.49 0.63 0.74 0.46 0.63 1.37 Treasury yield curve 2-Year 0.75 0.90 0.97 1.12 1.32 0.75 1.12 1.98 5-Year 1.13 1.35 1.47 1.62 1.77 1.12 1.62 2.32 10-Year 1.64 2.02 2.14 2.22 2.36 1.72 2.22 2.69 30-Year 2.31 2.63 2.69 2.74 2.83 2.31 2.74 3.07
CAD per USD 1.34 1.35 1.36 1.38 1.36 1.34 1.38 1.34 Oil price (WTI), U.S.$ 47 47 52 55 57 54 55 60
** end of period
Q1 2016 Q2 2016 Q3 2016 Q4 2016 Q1 2017 Q2 2017 Q3 2017 Q4 2017actual actual actual actual forecast forecast forecast forecast
Real GDP growth (q/q % chg. saar) 2.7 (1.2) 3.8 2.6 2.6 1.6 1.8 2.0CPI (y/y % chg.) 1.5 1.6 1.2 1.4 1.8 1.7 1.9 2.0Unemployment rate (%) 7.2 6.9 7.0 6.9 6.7 6.7 6.7 6.6
National Bank Financial
CanadaEconomic Forecast
Financial Forecast**
Quarterly pattern

MONTHLY ECONOMIC MONITOR
11
Provincial economic forecast
2014 2015 2016e 2017f 2018f 2014 2015 2016e 2017f 2018f
Real GDP (% growth) Nominal GDP (% growth)
Newfoundland & Labrador -1.0 -2.0 1.0 -2.7 2.9 -1.3 -11.5 2.3 3.0 2.9Prince Edward Island 1.5 1.3 1.3 1.2 1.4 3.5 3.9 3.4 3.3 3.9Nova Scotia 0.8 1.0 1.1 1.2 1.1 1.7 2.4 2.2 2.7 3.0New Brunswick -0.1 2.3 0.5 0.8 0.9 1.0 2.9 2.7 2.6 2.8Quebec 1.3 1.2 1.7 1.6 1.3 1.9 2.6 2.9 2.9 3.0Ontario 2.7 2.5 2.6 2.3 2.1 4.7 4.9 4.4 3.8 4.1Manitoba 1.5 2.2 1.5 2.0 1.5 2.5 3.1 1.5 2.7 3.6Saskatchewan 2.4 -1.3 -0.5 1.1 1.5 1.3 -5.7 -5.3 2.8 2.7Alberta 5.0 -3.6 -2.5 2.8 1.6 8.9 -12.5 -4.6 7.9 4.3British Columbia 3.3 3.3 3.1 2.7 2.1 5.2 3.8 4.8 5.2 4.1Canada 2.6 0.9 1.4 2.2 1.7 4.5 0.2 2.0 4.3 3.7
Employment (% growth) Unemployment rate (%)
Newfoundland & Labrador -1.9 -1.0 -1.4 -3.0 -3.9 12.0 12.8 13.5 14.3 16.0Prince Edward Island -0.4 -1.0 -2.3 2.1 0.3 10.5 10.4 10.8 9.8 9.2Nova Scotia -1.1 0.1 -0.4 0.8 0.0 8.9 8.6 8.3 7.8 7.6New Brunswick -0.2 -0.4 -0.1 0.4 0.4 9.9 9.8 9.6 8.8 9.4Quebec -0.1 1.0 0.9 1.4 0.4 7.8 7.6 7.0 6.7 6.4Ontario 0.8 0.7 1.1 1.5 1.0 7.3 6.7 6.6 6.2 6.1Manitoba 0.1 1.5 -0.5 0.7 0.8 5.4 5.6 6.1 6.0 5.9Saskatchewan 1.0 0.6 -0.9 0.7 0.8 3.8 5.0 6.4 6.3 6.1Alberta 2.2 1.2 -1.6 0.4 0.8 4.7 6.0 8.1 8.4 8.0British Columbia 0.6 1.3 3.1 2.4 1.0 6.1 6.2 6.0 5.4 5.6Canada 0.6 0.9 0.7 1.3 0.7 6.9 6.9 7.0 6.7 6.5
Housing starts (000) Consumer Price Index (% growth)Newfoundland & Labrador 2.1 1.7 1.4 1.4 1.3 1.9 0.4 2.7 2.5 2.0Prince Edward Island 0.5 0.6 0.6 0.5 0.4 1.6 -0.6 1.2 1.6 2.0Nova Scotia 3.1 3.8 3.8 3.3 3.1 1.7 0.4 1.2 1.3 1.9New Brunswick 2.3 2.0 1.8 1.7 1.6 1.5 0.5 2.2 2.3 2.0Quebec 38.8 37.9 38.9 35.0 35.0 1.4 1.1 0.7 1.4 1.9Ontario 59.1 70.2 75.0 74.0 60.0 2.2 1.1 1.8 1.8 1.9Manitoba 6.2 5.5 5.3 5.7 5.3 1.8 1.2 1.3 1.7 2.2Saskatchewan 8.3 5.1 4.8 4.7 4.6 2.4 1.6 1.1 1.6 2.1Alberta 40.6 37.3 24.5 24.3 23.7 2.6 1.2 1.1 1.9 2.2British Columbia 28.4 31.4 41.8 35.0 30.0 1.0 1.1 1.9 1.9 2.0Canada 189.3 195.5 197.9 185.6 165.0 1.9 1.1 1.4 1.8 2.0
e: estimate f: forecastHistorical data from Statistics Canada and CMHC, National Bank of Canada's forecast.

MONTHLY ECONOMIC MONITOR
Montreal Office
514-879-2529
Stéfane Marion Marc Pinsonneault Kyle Dahms Chief Economist and Strategist Senior Economist Economist [email protected] [email protected] [email protected]
Paul-André Pinsonnault Matthieu Arseneau Senior Fixed Income Economist Senior Economist [email protected] [email protected]
Krishen Rangasamy Angelo Katsoras Senior Economist Geopolitical Analyst [email protected] [email protected]
General – National Bank Financial (NBF) is an indirect wholly owned subsidiary of National Bank of Canada. National Bank of Canada is a public company listed on Canadian stock exchanges.
The particulars contained herein were obtained from sources which we believe to be reliable but are not guaranteed by us and may be incomplete. The opinions expressed are based upon our analysis and interpretation of these particulars and are not to be construed as a solicitation or offer to buy or sell the securities mentioned herein.
Research Analysts – The Research Analyst(s) who prepare these reports certify that their respective report accurately reflects his or her personal opinion and that no part of his/her compensation was, is, or will be directly or indirectly related to the specific recommendations or views as to the securities or companies.
NBF compensates its Research Analysts from a variety of sources. The Research Department is a cost centre and is funded by the business activities of NBF including, Institutional Equity Sales and Trading, Retail Sales, the correspondent clearing business, and Corporate and Investment Banking. Since the revenues from these businesses vary, the funds for research compensation vary. No one business line has a greater influence than any other for Research Analyst compensation.
Canadian Residents – In respect of the distribution of this report in Canada, NBF accepts responsibility for its contents. To make further inquiry related to this report, Canadian residents should contact their NBF professional representative. To effect any transaction, Canadian residents should contact their NBF Investment advisor.
U.S. Residents – With respect to the distribution of this report in the United States, National Bank of Canada Financial Inc. (NBCFI) is regulated by the Financial Industry Regulatory Authority (FINRA) and a member of the Securities Investor Protection Corporation (SIPC). This report has been prepared in whole or in part by, research analysts employed by non-US affiliates of NBCFI that are not registered as broker/dealers in the US. These non-US research analysts are not registered as associated persons of NBCFI and are not licensed or qualified as research analysts with FINRA or any other US regulatory authority and, accordingly, may not be subject (among other things) to FINRA restrictions regarding communications by a research analyst with the subject company, public appearances by research analysts and trading securities held a research analyst account.
All of the views expressed in this research report accurately reflect the research analysts’ personal views regarding any and all of the subject securities or issuers. No part of the analysts’ compensation was, is, or will be, directly or indirectly, related to the specific recommendations or views expressed in this research report. The analyst responsible for the production of this report certifies that the views expressed herein reflect his or her accurate personal and technical judgment at the moment of publication. Because the views of analysts may differ, members of the National Bank Financial Group may have or may in the future issue reports that are inconsistent with this report, or that reach conclusions different from those in this report. To make further inquiry related to this report, United States residents should contact their NBCFI registered representative.
UK Residents – In respect of the distribution of this report to UK residents, National Bank Financial Inc. has approved the contents (including, where necessary, for the purposes of Section 21(1) of the Financial Services and Markets Act 2000). National Bank Financial Inc. and/or its parent and/or any companies within or affiliates of the National Bank of Canada group and/or any of their directors, officers and employees may have or may have had interests or long or short positions in, and may at any time make purchases and/or sales as principal or agent, or may act or may have acted as market maker in the relevant investments or related investments discussed in this report, or may act or have acted as investment and/or commercial banker with respect thereto. The value of investments can go down as well as up. Past performance will not necessarily be repeated in the future. The investments contained in this report are not available to retail customers. This report does not constitute or form part of any offer for sale or subscription of or solicitation of any offer to buy or subscribe for the securities described herein nor shall it or any part of it form the basis of or be relied on in connection with any contract or commitment whatsoever.
This information is only for distribution to Eligible Counterparties and Professional Clients in the United Kingdom within the meaning of the rules of the Financial Conduct Authority. National Bank Financial Inc. is authorised and regulated by the Financial Conduct Authority and has its registered office at 71 Fenchurch Street, London, EC3M 4HD.
National Bank Financial Inc. is not authorised by the Prudential Regulation Authority and the Financial Conduct Authority to accept deposits in the United Kingdom.
HK Residents – With respect to the distribution of this report in Hong Kong by NBC Financial Markets Asia Limited (“NBCFMA”)which is licensed by the Securities and Futures Commission (“SFC”) to conduct Type 1 (dealing in securities) regulated activity, the contents of this report are solely for informational purposes. It has not been approved by, reviewed by, verified by or filed with any regulator in Hong Kong. Nothing herein is a recommendation, advice, offer or solicitation to buy or sell a product or service, nor an official confirmation of any transaction. None of the products issuers, NBCFMA or its affiliates or other persons or entities named herein are obliged to notify you of changes to any information and none of the foregoing assume any loss suffered by you in reliance of such information.
The content of this report may contain information about investment products which are not authorized by SFC for offering to the public in Hong Kong and such information will only be available to, those persons who are Professional Investors (as defined in the Securities and Futures Ordinance of Hong Kong (“SFO”)). If you are in any doubt as to your status you should consult a financial adviser or contact us. This material is not meant to be marketing materials and is not intended for public distribution. Please note that neither this material nor the product referred to is authorized for sale by SFC. Please refer to product prospectus for full details.
There may be conflicts of interest relating to NBCFMA or its affiliates’ businesses. These activities and interests include potential multiple advisory, transactional and financial and other interests in securities and instruments that may be purchased or sold by NBCFMA or its affiliates, or in other investment vehicles which are managed by NBCFMA or its affiliates that may purchase or sell such securities and instruments.
No other entity within the National Bank of Canada group, including NBF, is licensed or registered with the SFC. Accordingly, such entities and their employees are not permitted and do not intend to: (i) carry on a business in any regulated activity in Hong Kong; (ii) hold themselves out as carrying on a business in any regulated activity in Hong Kong; or (iii) actively market their services to the Hong Kong public.
Copyright – This report may not be reproduced in whole or in part, or further distributed or published or referred to in any manner whatsoever, nor may the information, opinions or conclusions contained in it be referred to without in each case the prior express written consent of National Bank Financial.
Toronto Office 416-869-8598 Warren Lovely MD, Public Sector Research and Strategy [email protected]