Embed Size (px)
Citation preview
UNITED STATES SENTENCING COMMISSION
Overview of Federal Criminal Cases Fiscal Year 2015
Patti B. SarisChair
Charles R. BreyerVice Chair
Dabney L. FriedrichCommissioner
Rachel E. BarkowCommissioner
William H. Pryor, Jr.Commissioner
Michelle Morales Ex Officio
J. Patricia Wilson Smoot Ex Officio
Kenneth P. CohenStaff Director
Glenn R. SchmittDirectorOffice of Research and Data
June 2016
United States Sentencing CommissionOne Columbus Circle, N.E.
Washington, DC 20002www.ussc.gov
Overview of Federal Criminal Cases – Fiscal Year 2015
1
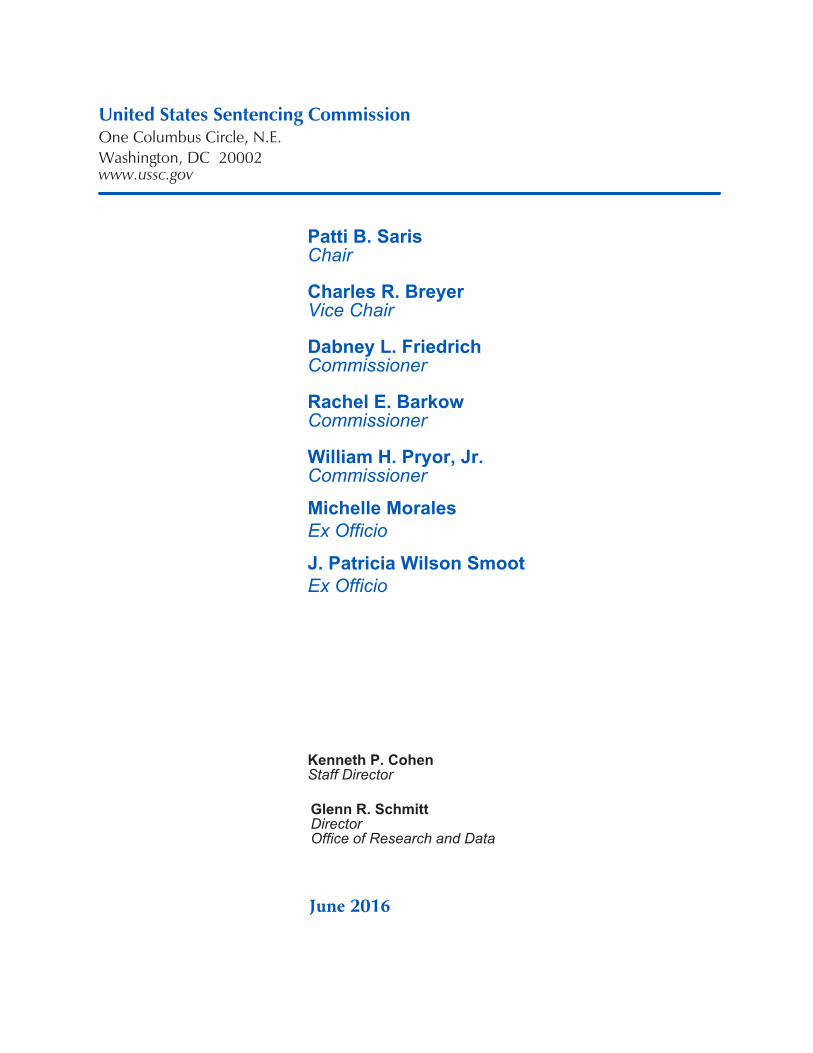
The United States Sentencing Commission1 received information on 71,184 federal criminal cases in which the offender was sentenced in fiscal year 2015.2 Among these cases, 71,003 involved an individual offender and 181 involved a corporation or other “organizational” offender. The Commission also received information on 24,743 cases in which the court resentenced the offender
or modified the sentence that had been previously imposed. This publication provides an overview of those cases.
The Case Load at a Glance The 71,003 individual original cases reported to the Commission in fiscal year 2015 represent a decrease of 4,833 (6.4%) cases from fiscal year 2014. Since fiscal year 2011, the year in which the largest number of offenders were sentenced,3 the number of offenders sentenced in the federal courts has fallen steadily, for a total decrease of 17.6 percent. In fiscal year 2015, fewer cases were reported for virtually every type of offense than in the prior fiscal year.
For more than a decade, cases involving drugs, immigration, fraud, or firearms constituted the vast majority of federal felonies and Class A misdemeanors. This trend continued in fiscal year 2015, as these crimes accounted for 81.6 percent of all cases reported to the Commission.
Overview of Federal Criminal Cases Fiscal Year 2015
Glenn R. Schmitt, J.D., M.P.P. Director Office of Research and Data
Elizabeth Jones, M.A. Research Associate Office of Research and Data
Figure 1. Number of Offenders Over Time Fiscal Years 2006 - 2015
United States Sentencing Commission
2
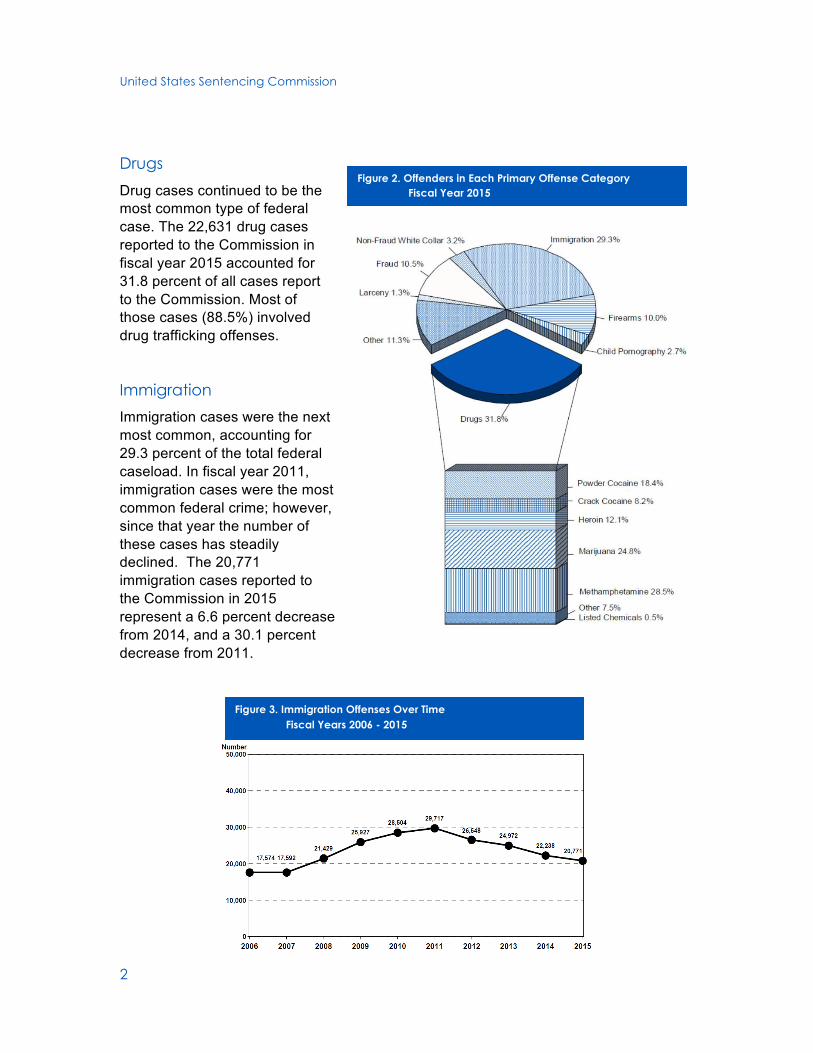
Drugs Drug cases continued to be the most common type of federal case. The 22,631 drug cases reported to the Commission in fiscal year 2015 accounted for 31.8 percent of all cases report to the Commission. Most of those cases (88.5%) involved drug trafficking offenses.
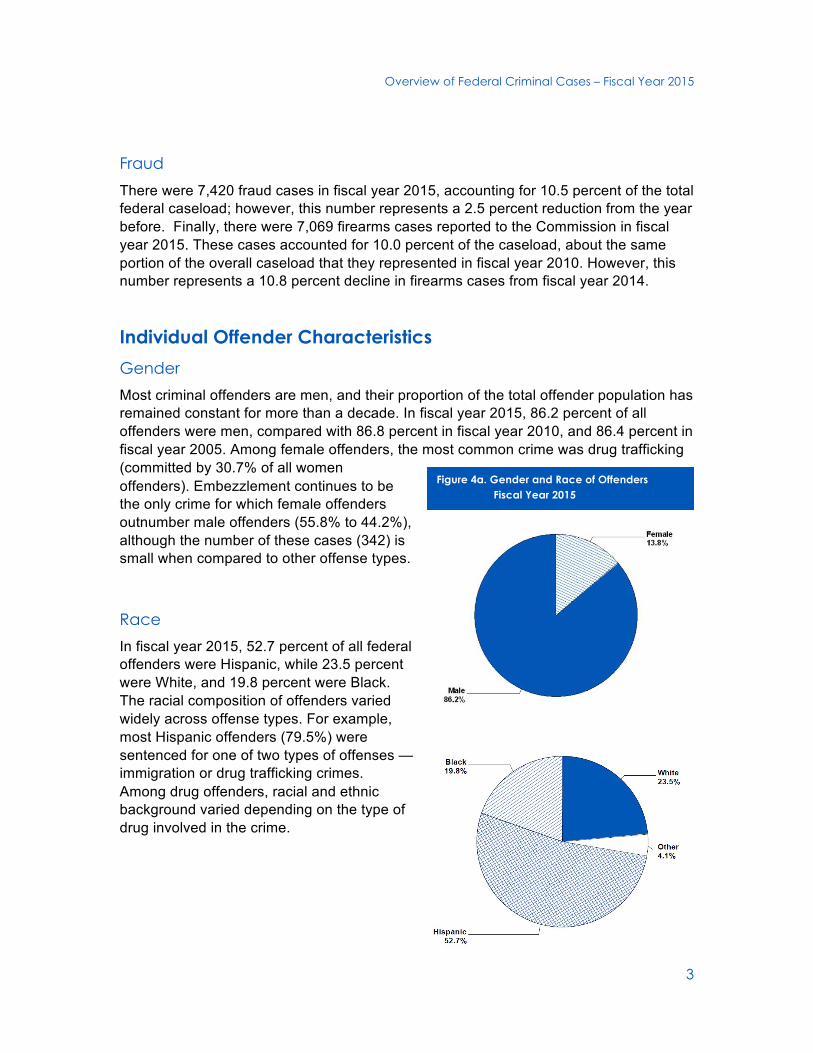
Immigration Immigration cases were the next most common, accounting for 29.3 percent of the total federal caseload. In fiscal year 2011, immigration cases were the most common federal crime;; however, since that year the number of these cases has steadily declined. The 20,771 immigration cases reported to the Commission in 2015 represent a 6.6 percent decrease from 2014, and a 30.1 percent decrease from 2011.
Figure 3. Immigration Offenses Over Time Fiscal Years 2006 - 2015
Figure 2. Offenders in Each Primary Offense Category Fiscal Year 2015
Overview of Federal Criminal Cases – Fiscal Year 2015
3
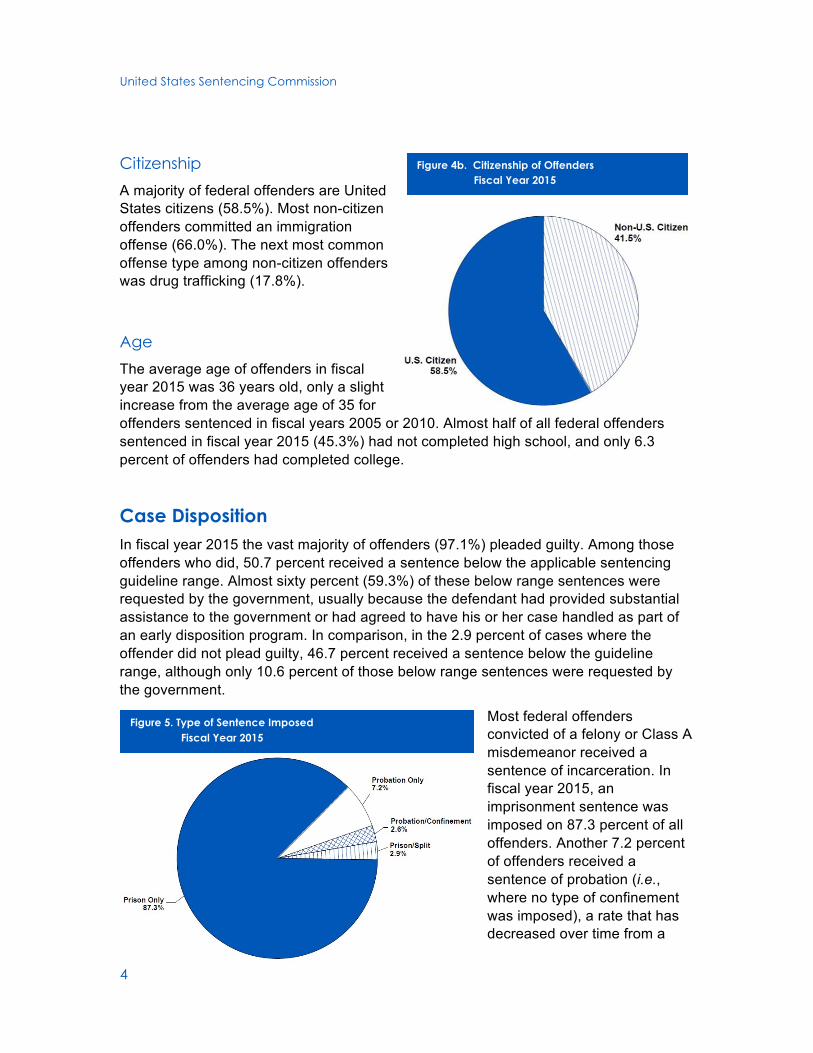
Figure 4a. Gender and Race of OffendersFiscal Year 2015
Fraud There were 7,420 fraud cases in fiscal year 2015, accounting for 10.5 percent of the total federal caseload;; however, this number represents a 2.5 percent reduction from the year before. Finally, there were 7,069 firearms cases reported to the Commission in fiscal year 2015. These cases accounted for 10.0 percent of the caseload, about the same portion of the overall caseload that they represented in fiscal year 2010. However, this number represents a 10.8 percent decline in firearms cases from fiscal year 2014.
Individual Offender Characteristics Gender Most criminal offenders are men, and their proportion of the total offender population has remained constant for more than a decade. In fiscal year 2015, 86.2 percent of all offenders were men, compared with 86.8 percent in fiscal year 2010, and 86.4 percent in fiscal year 2005. Among female offenders, the most common crime was drug trafficking (committed by 30.7% of all women offenders). Embezzlement continues to be the only crime for which female offenders outnumber male offenders (55.8% to 44.2%), although the number of these cases (342) is small when compared to other offense types.
Race In fiscal year 2015, 52.7 percent of all federal offenders were Hispanic, while 23.5 percent were White, and 19.8 percent were Black. The racial composition of offenders varied widely across offense types. For example, most Hispanic offenders (79.5%) were sentenced for one of two types of offenses — immigration or drug trafficking crimes. Among drug offenders, racial and ethnic background varied depending on the type of drug involved in the crime.
United States Sentencing Commission
4
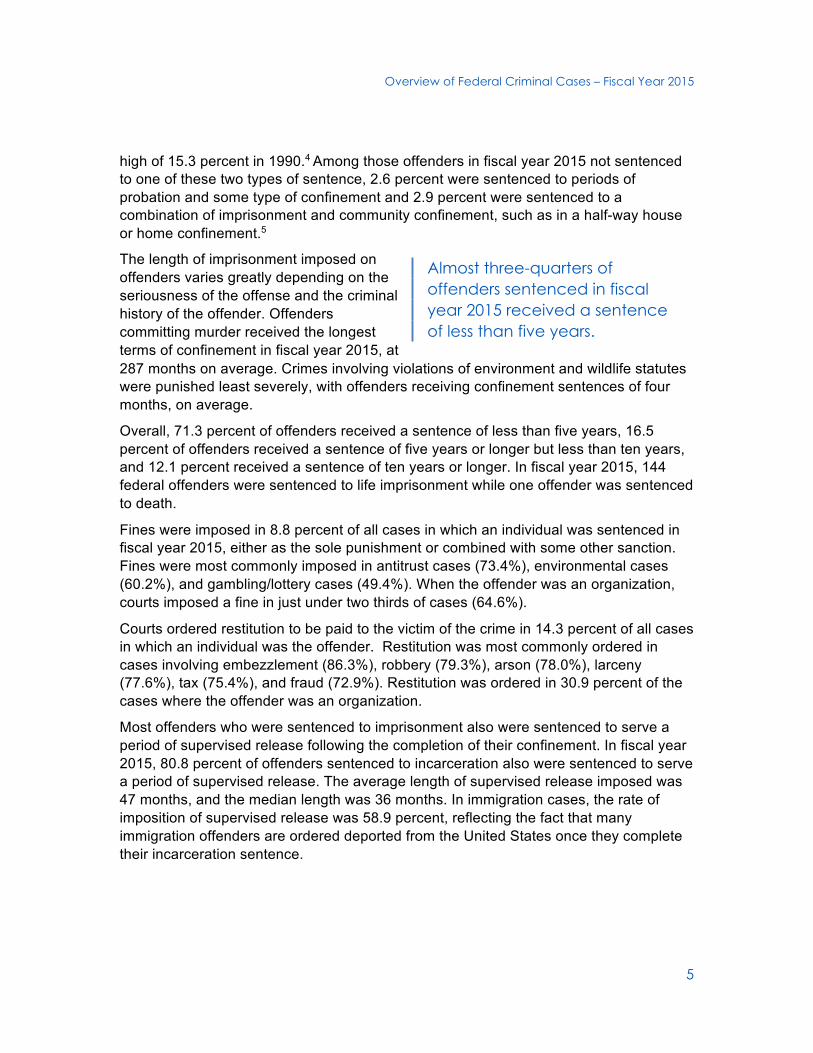
Citizenship A majority of federal offenders are United States citizens (58.5%). Most non-citizen offenders committed an immigration offense (66.0%). The next most common offense type among non-citizen offenders was drug trafficking (17.8%).
Age The average age of offenders in fiscal year 2015 was 36 years old, only a slight increase from the average age of 35 for offenders sentenced in fiscal years 2005 or 2010. Almost half of all federal offenders sentenced in fiscal year 2015 (45.3%) had not completed high school, and only 6.3 percent of offenders had completed college.
Case Disposition In fiscal year 2015 the vast majority of offenders (97.1%) pleaded guilty. Among those offenders who did, 50.7 percent received a sentence below the applicable sentencing guideline range. Almost sixty percent (59.3%) of these below range sentences were requested by the government, usually because the defendant had provided substantial assistance to the government or had agreed to have his or her case handled as part of an early disposition program. In comparison, in the 2.9 percent of cases where the offender did not plead guilty, 46.7 percent received a sentence below the guideline range, although only 10.6 percent of those below range sentences were requested by the government.
Most federal offenders convicted of a felony or Class A misdemeanor received a sentence of incarceration. In fiscal year 2015, an imprisonment sentence was imposed on 87.3 percent of all offenders. Another 7.2 percent of offenders received a sentence of probation (i.e., where no type of confinement was imposed), a rate that has decreased over time from a
Figure 4b. Citizenship of Offenders Fiscal Year 2015
Figure 5. Type of Sentence Imposed Fiscal Year 2015
Overview of Federal Criminal Cases – Fiscal Year 2015
5
high of 15.3 percent in 1990.4 Among those offenders in fiscal year 2015 not sentenced to one of these two types of sentence, 2.6 percent were sentenced to periods of probation and some type of confinement and 2.9 percent were sentenced to a combination of imprisonment and community confinement, such as in a half-way house or home confinement.5
The length of imprisonment imposed on offenders varies greatly depending on the seriousness of the offense and the criminal history of the offender. Offenders committing murder received the longest terms of confinement in fiscal year 2015, at
Almost three-quarters of offenders sentenced in fiscal year 2015 received a sentence of less than five years.
287 months on average. Crimes involving violations of environment and wildlife statutes were punished least severely, with offenders receiving confinement sentences of four months, on average.
Overall, 71.3 percent of offenders received a sentence of less than five years, 16.5 percent of offenders received a sentence of five years or longer but less than ten years, and 12.1 percent received a sentence of ten years or longer. In fiscal year 2015, 144 federal offenders were sentenced to life imprisonment while one offender was sentenced to death.
Fines were imposed in 8.8 percent of all cases in which an individual was sentenced in fiscal year 2015, either as the sole punishment or combined with some other sanction. Fines were most commonly imposed in antitrust cases (73.4%), environmental cases (60.2%), and gambling/lottery cases (49.4%). When the offender was an organization, courts imposed a fine in just under two thirds of cases (64.6%).
Courts ordered restitution to be paid to the victim of the crime in 14.3 percent of all cases in which an individual was the offender. Restitution was most commonly ordered in cases involving embezzlement (86.3%), robbery (79.3%), arson (78.0%), larceny (77.6%), tax (75.4%), and fraud (72.9%). Restitution was ordered in 30.9 percent of the cases where the offender was an organization.
Most offenders who were sentenced to imprisonment also were sentenced to serve a period of supervised release following the completion of their confinement. In fiscal year 2015, 80.8 percent of offenders sentenced to incarceration also were sentenced to serve a period of supervised release. The average length of supervised release imposed was 47 months, and the median length was 36 months. In immigration cases, the rate of imposition of supervised release was 58.9 percent, reflecting the fact that many immigration offenders are ordered deported from the United States once they complete their incarceration sentence.
United States Sentencing Commission
6
The Most Common Crimes Drugs Drug offenses were the most common federal crimes in fiscal year 2015. Most of the 22,631 drug cases involved the manufacture, sale, or transportation of a drug,6 while 2,277 of those cases involved the simple possession of a drug.
The total number of drug cases reported to the Commission fell for the third consecutive year. However, cases involving methamphetamine (6,468 cases) and heroin (2,744 cases) both increased over the number of such cases reported in fiscal year 2014.
Methamphetamine offenses were the most common drug trafficking offenses in fiscal year 2015.
For the first time since the Commission began reporting sentencing data, methamphetamine offenses were the most common drug cases, representing 28.5 percent of all drug crimes. The number of methamphetamine cases has increased substantially since 1994, when those cases accounted for only 6.4 percent of all drug cases.
Offenses involving cocaine, in either powder form or base (crack) form, were the second most common drug crimes, accounting for 26.6 percent of all drug offenders sentenced. Powder cocaine cases accounted for 18.4 percent of all drug cases while crack cocaine cases accounted for 8.2 percent. The number of crack cocaine cases has fallen substantially since fiscal year 2008, the year in which the largest number of those cases were reported to the Commission. That year, the 6,168 crack cocaine cases represented 24.3 percent of all drug cases.
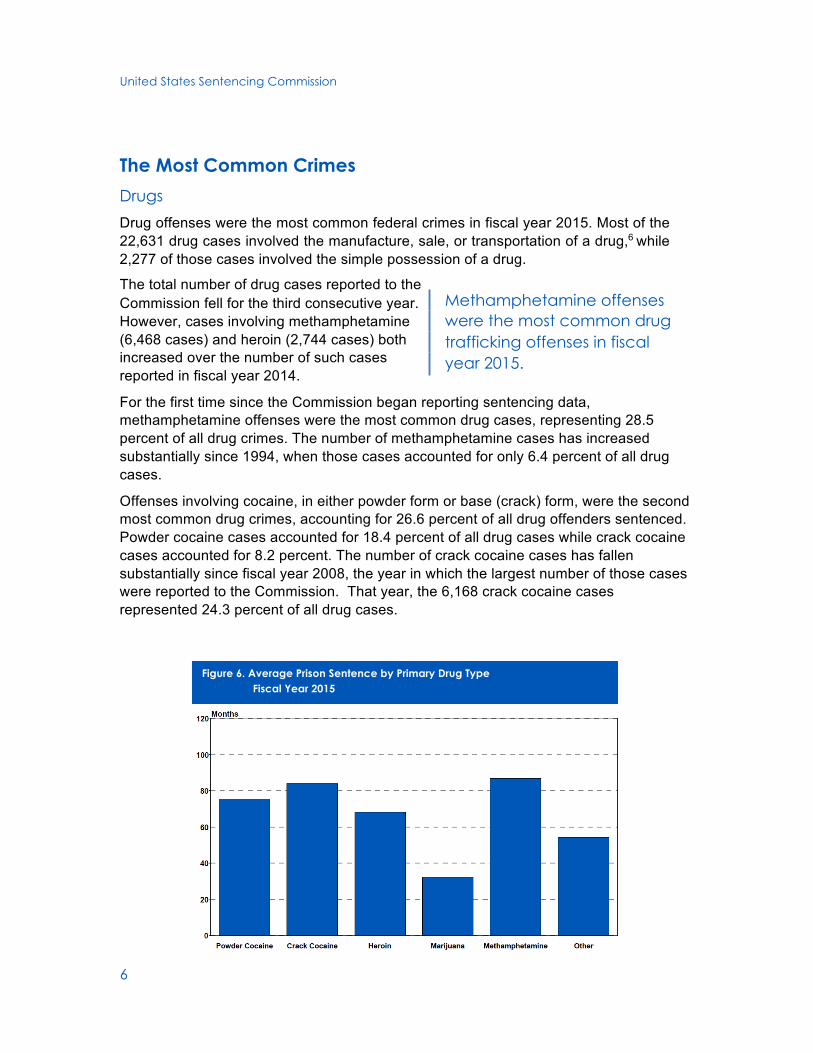
Figure 6. Average Prison Sentence by Primary Drug Type Fiscal Year 2015
Overview of Federal Criminal Cases – Fiscal Year 2015
7
Of the remaining drug cases, marijuana cases accounted for 24.8 percent of the cases, heroin for 12.1 percent, and cases involving other drugs, mostly prescription drugs such as oxycodone, accounted for 8.0 percent of all drug offenses.
Most drug offenders were United States citizens, although the citizenship of drug offenders varied widely depending on the type of drug involved in the offense. For example, 98.0 percent of crack cocaine offenders were United States citizens, while only 53.4 percent of marijuana offenders were citizens.
The race of drug offenders varied even more widely by the type of drug involved in the offense. Almost half (48.4%) of all drug offenders convicted in federal court were Hispanic, while Black offenders constituted 24.2 percent of all drug offenders, and White offenders were 24.3 percent of all drug offenders. Yet, in crack cocaine cases, 79.9 percent of those convicted were Black, and in “other” drug cases 56.5 percent of the offenders were White. In marijuana cases, 68.6 percent off those convicted were Hispanic.
Weapons were involved in 17.2 percent of all drug offenses. As with the other aspects of these cases, the rate of weapon involvement varied depending on the type of drug involved, ranging from 30.2 percent in crack cocaine cases to 9.4 percent in marijuana cases.
Methamphetamine offenses were the most severely punished drug crime in fiscal year 2015.
The length of sentences imposed in drug cases decreased for all drug types in fiscal year 2015. The largest reduction in average sentence occurred in cases involving crack cocaine, where the average length of imprisonment decreased to 84 months (with a median sentence of 65 months), which was a 9.7 percent from fiscal year 2014. The average sentence in crack cocaine cases has decreased steadily each year, from a high of 129 months in fiscal year 2007.
For more than 20 years, crack cocaine offenses were the most severely punished among all drug offenses. However, in fiscal year 2015, methamphetamine offenses became the most severely punished drug crime, with an average length of imprisonment of 87 months (and a median sentence of 70 months). Marijuana offenders had the lowest average imprisonment in fiscal year 2015 at 32 months (with a median sentence of 20 months).
Several factors can affect the average prison sentence imposed in drug offenses, including statutory mandatory minimum punishments, the quantity of the drugs involved in the case, the prior criminal history of the offender, and whether the offender assisted the government in the investigation of his or her crime and other crimes. Mandatory minimum sentences enacted by Congress play a large part in determining the sentence for drug offenders, either outright or through the impact of these statutes on the structure of the guidelines.7 In fiscal year 2015, just under half (45.8%) of all drug offenders were convicted of an offense carrying a mandatory minimum penalty;; however, this proportion was the lowest it has been since 1993, the year in which the Commission began
United States Sentencing Commission
8
reporting data on the rate at which mandatory minimum penalties were applied in federal cases. This significant reduction was due, in large part, to a change in the policy of the Department of Justice in 2013 as to how to charge drug cases.8
In fiscal year 2015, powder cocaine offenders and methamphetamine offenders were convicted of an offense that provided for the imposition of a mandatory minimum sentence at the highest rates – 61.9 percent in powder cocaine cases and 54.5 percent in methamphetamine cases.9 Mandatory minimum penalties were least common in drug cases involving “other” drugs (which are mostly prescription drugs) and marijuana, accounting for 4.1 percent and 28.9 percent, respectively, of those cases.
Many offenders convicted of an offense carrying a mandatory minimum penalty are able to obtain relief from that penalty through the “safety valve” exception to such sentences, which requires courts to sentence the offender without regard to any otherwise applicable mandatory minimum punishment when certain conditions are met.10 Powder
The proportion of drug offenders convicted of an offense carrying a mandatory minimum penalty was the lowest it has been since 1993.
cocaine offenders obtained relief from a mandatory minimum sentence through the use of the safety valve most often, in 22.7 percent of all powder cocaine cases in which a mandatory minimum penalty applied. In contrast, only 3.6 percent of crack cocaine offenders obtained this relief.
This difference is due largely to the differing criminal histories of powder cocaine and crack cocaine offenders. In fiscal year 2015, 58.3 percent of powder cocaine offenders were assigned to Criminal History Category I (offenders with a criminal history score under the sentencing guidelines of zero or one) while just 18.6 percent of crack cocaine offenders were assigned to that category. Only offenders assigned to Criminal History Category I are eligible to receive the benefit of the safety valve.
Overall, crack cocaine offenders continue to have, on average, a more serious criminal history than any other category of drug offender.11 Crack cocaine offenders were assigned to the most serious criminal history category (CHC VI) in 28.8 percent of all crack cocaine cases. In contrast, powder cocaine offenders were assigned to CHC VI in only 8.9 percent of cases. By comparison, 17.1 percent of heroin offenders were assigned to CHC VI and 14.2 percent of methamphetamine offenders were assigned to CHC VI. Offenders convicted of marijuana offenses generally had the least serious criminal histories, with 59.5 percent assigned to CHC I and only 3.8 percent to CHC VI.
An offender’s role in the offense also can affect the guideline range that judges consider when imposing punishment. In fiscal year 2015, judges in 16.7 percent of all drug cases determined that the applicable guideline range should be lowered because of the offender’s minor or minimal role in the offense. In marijuana cases, this adjustment to the guideline range occurred 27.2 percent of the time. In contrast, courts found such an adjustment warranted in only 4.3 percent of crack cocaine cases. In 7.7 percent of all drug cases, the court determined that the applicable guideline range should be
Overview of Federal Criminal Cases – Fiscal Year 2015
9
increased because of the offender’s role as an organizer, leader, manager, or supervisor. Immigration Immigration offenses12 were the second most common federal crime in fiscal year 2015, representing 29.3 percent of the cases reported to the Commission. This number represents a 6.6 percent decrease from fiscal year 2014. The majority of these offenses involved either the unlawful reentry into the United States or unlawfully remaining in the United States without authority (81.9%). Another 11.9 percent were alien smuggling offenses. The average sentence in immigration cases in fiscal year 2015 was 15 months.
Offenders sentenced under the immigration guidelines differ from other federal offenders in several ways. For example, although United States citizens committed the majority of all federal crimes (58.5%) in fiscal year 2015, the overwhelming majority (92.1%) of immigration offenses were committed by non-citizens.13 Similarly, while Hispanics accounted for only 32.2 percent of non-immigration offenders, they account for 95.4 percent of immigration offenders. Also, immigration offenders had significantly less education than other offenders. Over 80 percent (80.7%) of immigration offenders had less than a high school education, compared with less than 31.4 percent of offenders convicted of other crimes. While men committed most federal crimes not involving an immigration offense (83.6%), men committed an even higher proportion of immigration crimes (93.1%). Fraud Fraud crimes accounted for the third largest portion (10.5%) of the total federal criminal convictions for fiscal year 2015. The 7,420 fraud cases reported to the Commission were a decrease of 2.5 percent from the number of fraud cases reported the prior year. The losses in these cases ranged from no loss (134 cases) to more than $7 billion, with an average loss amount of $2,909,541 and a median loss amount of $213,831. Identity theft crimes14 accounted for a relatively small number (886) of these cases in fiscal year 2015. The average sentence imposed in fraud cases in fiscal year 2015 was 27 months. Firearms and other weapons Crimes involving firearms or other dangerous weapons15 accounted for 10.0 percent of the total number of federal criminal convictions in fiscal year 2015. The 7,069 firearms cases reported to the Commission represent a decrease of 10.8 percent from the prior year. Of all firearms cases, 25.7 percent involved the possession or use of a firearm in connection with a crime of violence or drug trafficking crime.16 More than half of firearms
United States Sentencing Commission
10
cases (53.2%) involved the illegal possessed a firearm, usually by a convicted felon.17 The average sentence imposed in firearms cases was 79 months. Cases other than firearms prosecutions also may involve the possession or use of a dangerous weapon. In the cases with complete guideline application information reported to the Commission in fiscal year 2015, the sentences imposed in 8.8 percent of the cases were enhanced (either through
Ten percent of all federal criminal convictions involved a firearm or other dangerous weapon.
application of specific offense characteristics under the guidelines when available or by statute) because a firearm or other dangerous weapon (e.g., knife) was involved in the offense. In drug cases, a weapon was involved at a rate (17.2%) more than twice that of all cases generally. Among drug cases, weapons were present most often in crack cocaine cases (30.2%) and least often in marijuana cases (9.4%). Organizational Cases Organizations such as corporations and partnerships can be prosecuted for violating federal criminal law, and 181 organizations were sentenced for at least one federal criminal offense in fiscal year 2015. This number is a 10.5 percent increase from the 161 cases reported in fiscal year 2014, although the number of organizational defendants continues to be lower than in earlier years. For example, 200 organizational defendants were sentenced in fiscal year 2003, and 255 organizational defendants were sentenced in fiscal year 1999.
Of the 181 organizational offenders, 97.8 percent pled guilty to one or more charges in fiscal year 2015. The most common crimes for which organizational defendants were convicted were environmental and fraud crimes. Organizational offenders were sentenced to pay only a fine in 87 cases. In an additional 30 cases the offender was sentenced to pay restitution to the victim of the crime as well as to pay a fine. In 26 cases, the organization was sentenced to pay restitution only. No fine or restitution was imposed in 38 cases, although other sanctions were imposed in some of these cases. Additionally, of the 181 organizational offenders, 139 received some term of probation, and 51 were ordered to make improvements in compliance or ethics procedures.
Overview of Federal Criminal Cases – Fiscal Year 2015
11
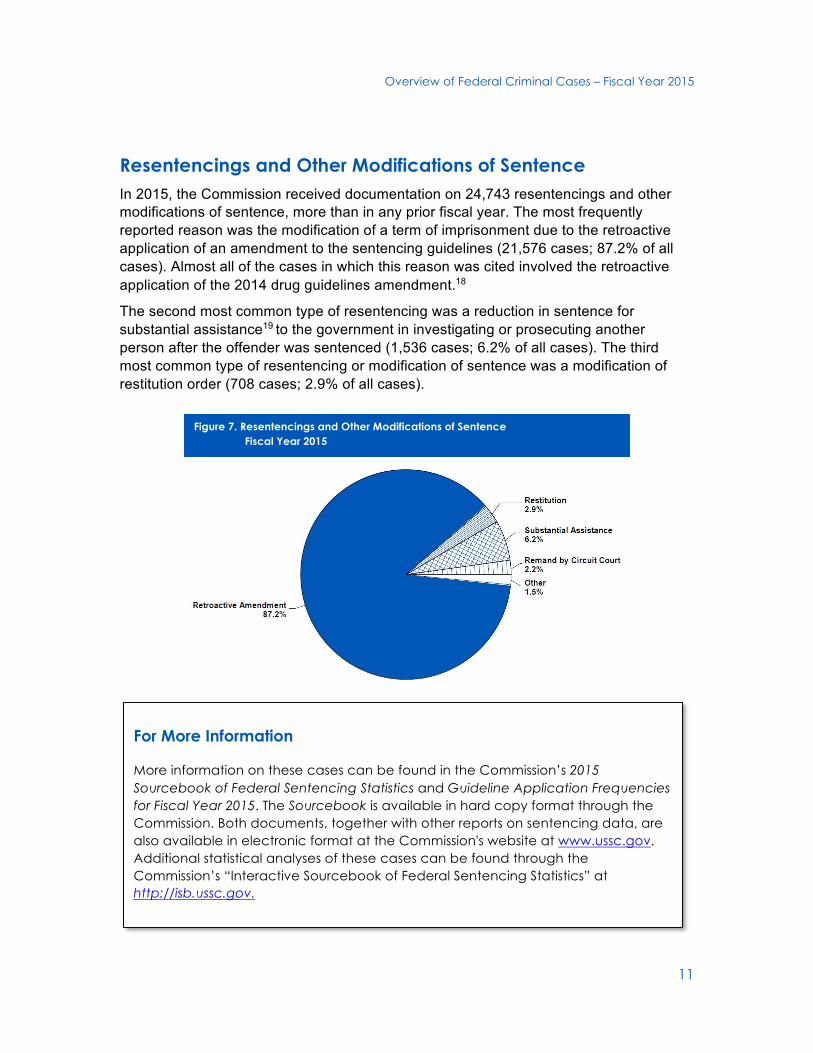
Resentencings and Other Modifications of Sentence In 2015, the Commission received documentation on 24,743 resentencings and other modifications of sentence, more than in any prior fiscal year. The most frequently reported reason was the modification of a term of imprisonment due to the retroactive application of an amendment to the sentencing guidelines (21,576 cases;; 87.2% of all cases). Almost all of the cases in which this reason was cited involved the retroactive application of the 2014 drug guidelines amendment.18
The second most common type of resentencing was a reduction in sentence for substantial assistance19 to the government in investigating or prosecuting another person after the offender was sentenced (1,536 cases;; 6.2% of all cases). The third most common type of resentencing or modification of sentence was a modification of restitution order (708 cases;; 2.9% of all cases).
Figure 7. Resentencings and Other Modifications of Sentence Fiscal Year 2015
For More Information
More information on these cases can be found in the Commission’s 2015 Sourcebook of Federal Sentencing Statistics and Guideline Application Frequencies for Fiscal Year 2015. The Sourcebook is available in hard copy format through the Commission. Both documents, together with other reports on sentencing data, are also available in electronic format at the Commission's website at www.ussc.gov. Additional statistical analyses of these cases can be found through the Commission’s “Interactive Sourcebook of Federal Sentencing Statistics” at http://isb.ussc.gov.
United States Sentencing Commission
12
1 The United States Sentencing Commission is an independent agency in the judicial branch of government. Its principal purposes are (1) to establish sentencing policies and practices for the federal courts, including guidelines to be consulted regarding the appropriate form and severity of punishment for offenders convicted of federal crimes;; (2) to advise and assist Congress and the executive branch in the development of effective and efficient crime policy;; and (3) to collect, analyze, research, and distribute a broad array of information on federal crime and sentencing issues.
2 The Commission receives information from the courts on cases in which the defendant has been convicted of a felony or a Class A misdemeanor.
3 In fiscal year 2011, 86,201 individual offenders were sentenced. U.S. SENT’G COMM’N, 2011 SOURCEBOOKOF FEDERAL SENTENCING STATISTICS iv (2012).
4 See U.S. SENT’G COMM’N, 1990 ANNUAL REPORT 53 (1991).
5 For more information concerning the use of alternative sentences in the federal system, see COURTNEYSEMISCH, U.S. SENT’G. COMM’N, ALTERNATIVE SENTENCES IN THE FEDERAL SYSTEM (2015).
6 This number also includes persons convicted of one or more crimes in addition to a drug offense.
7 The Commission’s general practice has been to incorporate statutory minimum penalties into the structure of the guidelines. For example, in drug trafficking cases, the offense levels that correspond to the drug quantities that trigger the statutory mandatory minimum penalties provide for a sentencing range for an offender with no prior criminal history that includes the statutory penalty. The remaining sentencing ranges are extrapolated upward and downward from the guideline ranges that include the mandatory minimum penalties. See generally U.S. SENT’G COMM’N, GUIDELINES MANUAL, APPENDIX C, AMENDMENT 782 (effective November 1, 2014).
8 See Memorandum to United States Attorneys and Assistant Attorney General for the Criminal Division from Attorney General Eric Holder, Department Policy on Charging Mandatory Minimum Sentences and Recidivist Enhancements in Certain Drug Cases, August 12, 2013. In fiscal year 2013, the fiscal year that concluded just after the Attorney General’s memorandum was issued, 62.2 percent of drug offenders were convicted of an offense carrying a mandatory minimum penalty. The portion of drug cases carrying a mandatory minimum penalty in fiscal year 2014 was 50.1 percent.
9 Some of these offenders received a sentence that was lower than the applicable statutory mandatory minimum punishment due to the operation of 18 U.S.C. §§ 3553(e) or (f). Subsection (e) authorizes courts to impose a sentence that is below a statutory mandatory minimum when the offender has provided substantial assistance to the government in investigating or prosecuting another offender. Subsection (f) requires courts to impose a sentence on a non-violent offender with no or limited criminal background without regard to a statutory mandatory minimum punishment when certain other conditions are met.
10 See 18 U.S.C. § 3553(f).
11 Under the guidelines, offenders are assigned to one of six criminal history categories (CHCs) based on their prior criminal history. The criminal history score establishes the CHC for an offender. See U.S. SENT’G COMM’N, GUIDELINES MANUAL, Ch.4 (2015). The CHC, along with the final offense level, determines the sentencing range under the guidelines.
Overview of Federal Criminal Cases – Fiscal Year 2015
13
12 Immigration offense means, in general, a case in which at least one of the statutes of conviction involved trafficking in passports or entry documents;; failure to surrender naturalization certificates;; fraudulently acquiring passports;; alien smuggling;; unlawful presence in the United States;; or fraudulently acquiring entry documents.
13 Non-citizens primarily are convicted of immigration crimes. Non-citizens were the offenders in only 14.1 percent of all other federal crimes in fiscal year 2015.
14 Identity theft crimes are those fraud cases in which one or more of the offenses of conviction was 18 U.S.C. § 1028(a)(7) or 18 U.S.C. § 1028A. The Commission includes these cases with other fraud cases when it reports sentencing statistics.
15 Firearms crime includes unlawful possession or transportation of firearms or ammunition;; unlawful trafficking in explosives;; possession of guns or explosives in a federal facility, a school, or on an aircraft;; the use of fire or explosives to commit a felony;; and the use of firearms or ammunition during a crime.
16 I.e., a case in which 18 U.S.C. § 924(c) was the statute of conviction.
17 I.e., a case in which 18 U.S.C. § 922(g)(1) was the statute of conviction.
18 See U.S. SENT’G COMM’N, GUIDELINES MANUAL, APPENDIX C, AMENDMENT 782 (effective November 1, 2014).
19 See Fed R. Crim. P. 35(b). For more information about cases involving a resentencing for substantial assistance to the government after sentencing, see KEVIN BLACKWELL & JILL BAISINGER, U.S. SENT’G COMM’N, THE USE OF FEDERAL RULE OF CRIMINAL PROCEDURE 35(B) (2016).