Embed Size (px)
Citation preview
FUTUREFUEL CORP.
FORM 10-Q(Quarterly Report)
Filed 08/07/14 for the Period Ending 06/30/14
Address 8235 FORSYTH BOULEVARD SUITE 400
CLAYTON, MO 63105Telephone 805-565-9800
CIK 0001337298Symbol FF
SIC Code 2860 - Industrial Organic ChemicalsIndustry Chemical Manufacturing
Sector Basic MaterialsFiscal Year 12/31
http://www.edgar-online.com© Copyright 2014, EDGAR Online, Inc. All Rights Reserved.
Distribution and use of this document restricted under EDGAR Online, Inc. Terms of Use.

UNITED STATES
SECURITIES AND EXCHANGE COMMISSION Washington, D.C. 20549
FORM 10-Q
(Mark One)
Commission file number: 0-52577
FUTUREFUEL CORP. (Exact Name of Registrant as Specified in Its Charter)
8235 Forsyth Blvd., Suite 400 St. Louis, Missouri 63105
(Address of Principal Executive Offices)
(805) 565-9800 (Registrant’s Telephone Number, Including Area Code)
Indicate by check mark whether the registrant (1) has filed all reports required to be filed by Section 13 or 15(d) of the Securities Exchange Act of 1934 during the preceding 12 months (or for such shorter period that the registrant was required to file such reports), and (2) has been subject to such filing requirements for the past 90 days. Yes √ No ☐ Indicate by check mark whether the registrant has submitted electronically and posted on its corporate Web site, if any, every Interactive Data File required to be submitted and posted pursuant to Rule 405 of Regulation S-T (§232.405 of this chapter) during the preceding 12 months (or for such shorter period that the registrant was required to submit and post such files). Yes √ No ☐ Indicate by check mark whether the registrant is a large accelerated filer, an accelerated filer, a non-accelerated filer, or a smaller reporting company. See the definitions of “large accelerated filer,” “accelerated filer” and “smaller reporting company” in Rule 12b-2 of the Exchange Act. (Check one):
Indicate by check mark whether the registrant is a shell company (as defined in Rule 12b-2 of the Exchange Act). Yes ☐ No √ Indicate the number of shares outstanding of each of the issuer’s classes of common stock, as of August 7, 2014: 43,606,118
√ QUARTERLY REPORT PURSUANT TO SECTION 13 OR 15(d) OF THE SECURITIES EXCHANGE ACT OF 1934 For the quarterly period ended June 30, 2014
OR ☐ TRANSITION REPORT PURSUANT TO SECTION 13 OR 15(d) OF THE SECURITIES EXCHANGE ACT OF 1934
For the transition period from _____________
Delaware 20-3340900 (State or Other Jurisdiction of Incorporation or Organization)
(IRS Employer Identification No.)
Large accelerated filer ☐ Accelerated filer √ Non-accelerated filer ☐ (do not check if a smaller reporting company)
Smaller reporting company ☐
PART I
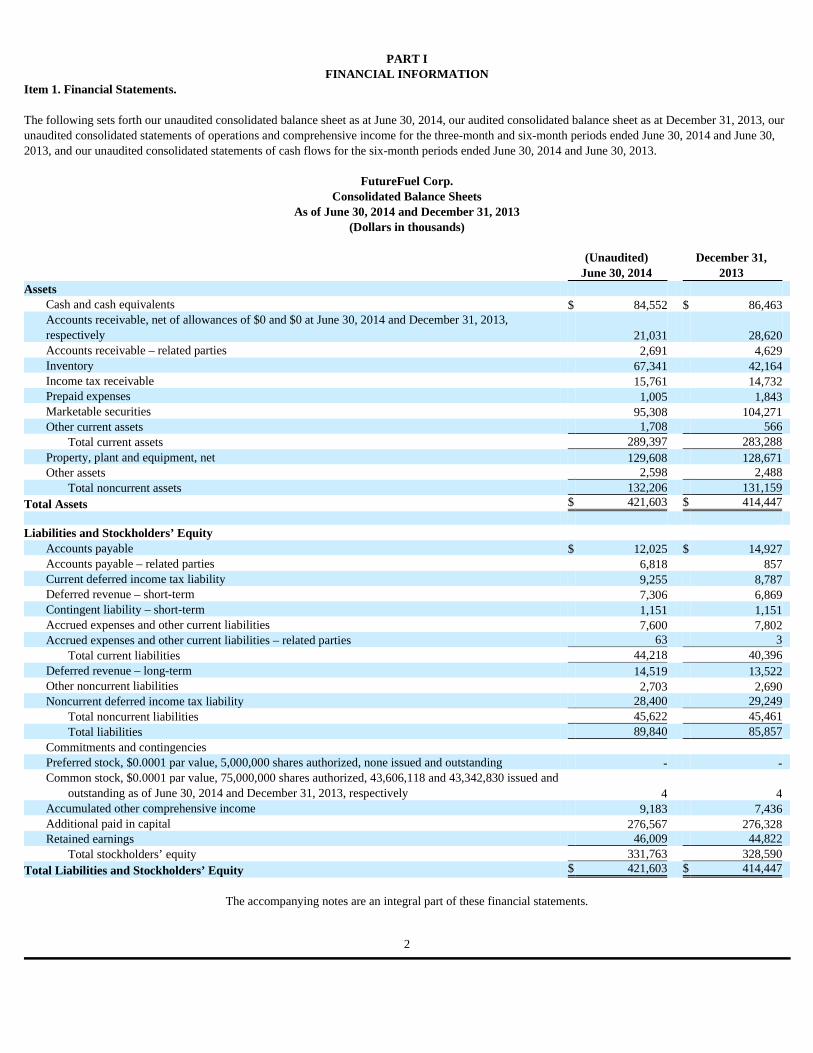
FINANCIAL INFORMATION Item 1. Financial Statements. The following sets forth our unaudited consolidated balance sheet as at June 30, 2014, our audited consolidated balance sheet as at December 31, 2013, our unaudited consolidated statements of operations and comprehensive income for the three-month and six-month periods ended June 30, 2014 and June 30, 2013, and our unaudited consolidated statements of cash flows for the six-month periods ended June 30, 2014 and June 30, 2013.
FutureFuel Corp. Consolidated Balance Sheets
As of June 30, 2014 and December 31, 2013 (Dollars in thousands)
The accompanying notes are an integral part of these financial statements.
(Unaudited)
June 30, 2014 December 31,
2013 Assets
Cash and cash equivalents $ 84,552 $ 86,463 Accounts receivable, net of allowances of $0 and $0 at June 30, 2014 and December 31, 2013, respectively 21,031 28,620 Accounts receivable – related parties 2,691 4,629 Inventory 67,341 42,164 Income tax receivable 15,761 14,732 Prepaid expenses 1,005 1,843 Marketable securities 95,308 104,271 Other current assets 1,708 566
Total current assets 289,397 283,288 Property, plant and equipment, net 129,608 128,671 Other assets 2,598 2,488
Total noncurrent assets 132,206 131,159 Total Assets $ 421,603 $ 414,447 Liabilities and Stockholders’ Equity
Accounts payable $ 12,025 $ 14,927 Accounts payable – related parties 6,818 857 Current deferred income tax liability 9,255 8,787 Deferred revenue – short-term 7,306 6,869 Contingent liability – short-term 1,151 1,151 Accrued expenses and other current liabilities 7,600 7,802 Accrued expenses and other current liabilities – related parties 63 3
Total current liabilities 44,218 40,396 Deferred revenue – long-term 14,519 13,522 Other noncurrent liabilities 2,703 2,690 Noncurrent deferred income tax liability 28,400 29,249
Total noncurrent liabilities 45,622 45,461 Total liabilities 89,840 85,857
Commitments and contingencies Preferred stock, $0.0001 par value, 5,000,000 shares authorized, none issued and outstanding - - Common stock, $0.0001 par value, 75,000,000 shares authorized, 43,606,118 and 43,342,830 issued and
outstanding as of June 30, 2014 and December 31, 2013, respectively 4 4 Accumulated other comprehensive income 9,183 7,436 Additional paid in capital 276,567 276,328 Retained earnings 46,009 44,822
Total stockholders’ equity 331,763 328,590 Total Liabilities and Stockholders’ Equity $ 421,603 $ 414,447
2
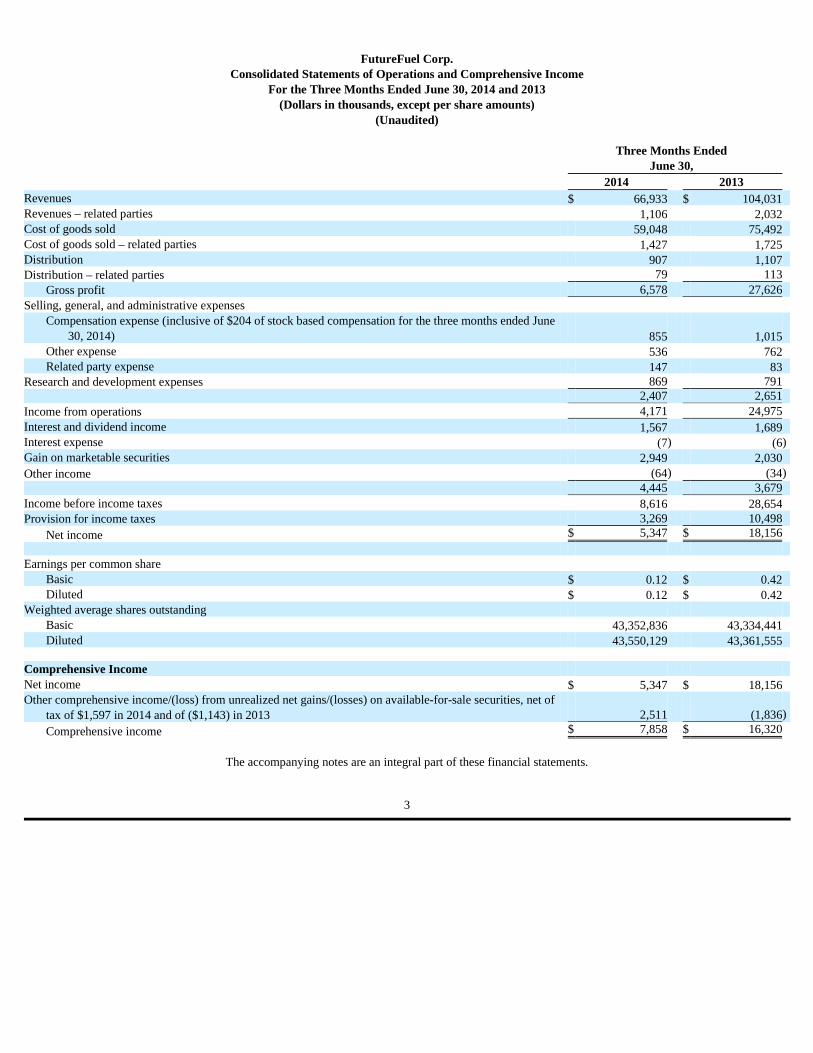
FutureFuel Corp.
Consolidated Statements of Operations and Comprehensive Income For the Three Months Ended June 30, 2014 and 2013
(Dollars in thousands, except per share amounts) (Unaudited)
The accompanying notes are an integral part of these financial statements.
Three Months Ended
June 30, 2014 2013 Revenues $ 66,933 $ 104,031 Revenues – related parties 1,106 2,032 Cost of goods sold 59,048 75,492 Cost of goods sold – related parties 1,427 1,725 Distribution 907 1,107 Distribution – related parties 79 113
Gross profit 6,578 27,626 Selling, general, and administrative expenses
Compensation expense (inclusive of $204 of stock based compensation for the three months ended June 30, 2014) 855 1,015
Other expense 536 762 Related party expense 147 83
Research and development expenses 869 791 2,407 2,651 Income from operations 4,171 24,975 Interest and dividend income 1,567 1,689 Interest expense (7 ) (6 ) Gain on marketable securities 2,949 2,030 Other income (64 ) (34 ) 4,445 3,679 Income before income taxes 8,616 28,654 Provision for income taxes 3,269 10,498
Net income $ 5,347 $ 18,156 Earnings per common share
Basic $ 0.12 $ 0.42 Diluted $ 0.12 $ 0.42
Weighted average shares outstanding Basic 43,352,836 43,334,441 Diluted 43,550,129 43,361,555
Comprehensive Income Net income $ 5,347 $ 18,156 Other comprehensive income/(loss) from unrealized net gains/(losses) on available-for-sale securities, net of
tax of $1,597 in 2014 and of ($1,143) in 2013 2,511 (1,836 )
Comprehensive income $ 7,858 $ 16,320
3
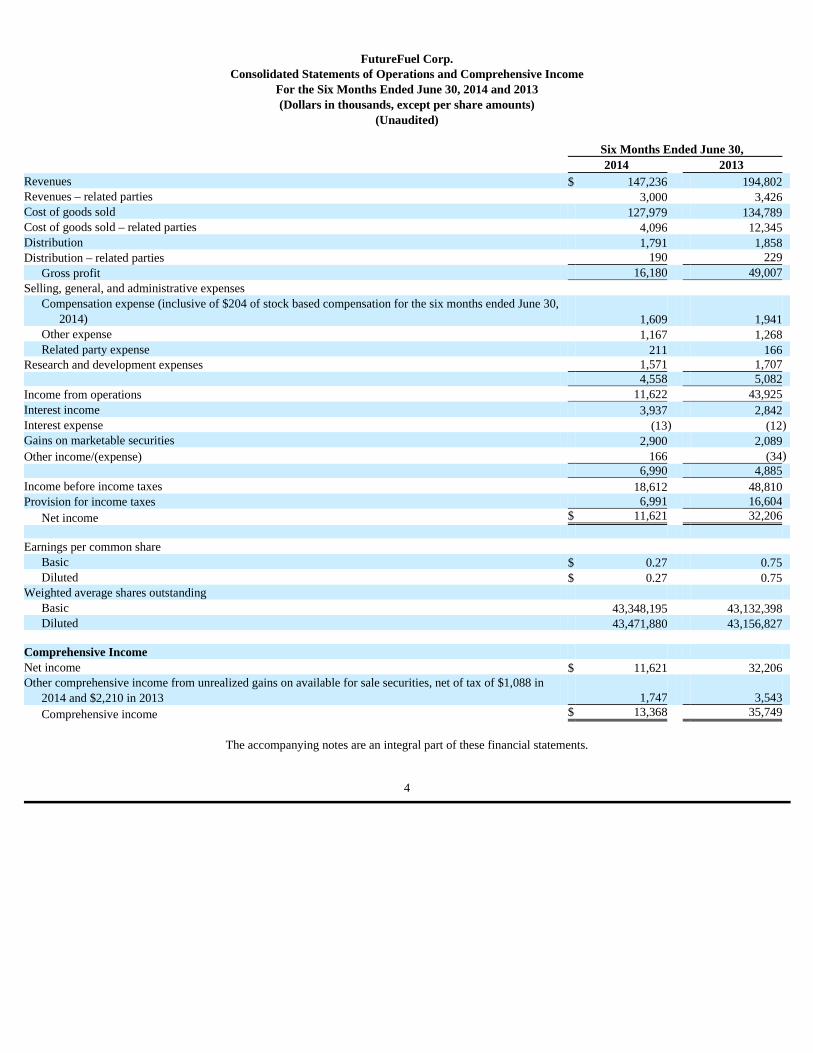
FutureFuel Corp.
Consolidated Statements of Operations and Comprehensive Income For the Six Months Ended June 30, 2014 and 2013 (Dollars in thousands, except per share amounts)
(Unaudited)
The accompanying notes are an integral part of these financial statements.
Six Months Ended June 30, 2014 2013 Revenues $ 147,236 194,802 Revenues – related parties 3,000 3,426 Cost of goods sold 127,979 134,789 Cost of goods sold – related parties 4,096 12,345 Distribution 1,791 1,858 Distribution – related parties 190 229
Gross profit 16,180 49,007 Selling, general, and administrative expenses
Compensation expense (inclusive of $204 of stock based compensation for the six months ended June 30, 2014) 1,609 1,941
Other expense 1,167 1,268 Related party expense 211 166
Research and development expenses 1,571 1,707 4,558 5,082 Income from operations 11,622 43,925 Interest income 3,937 2,842 Interest expense (13 ) (12 ) Gains on marketable securities 2,900 2,089 Other income/(expense) 166 (34 ) 6,990 4,885 Income before income taxes 18,612 48,810 Provision for income taxes 6,991 16,604
Net income $ 11,621 32,206 Earnings per common share
Basic $ 0.27 0.75 Diluted $ 0.27 0.75
Weighted average shares outstanding Basic 43,348,195 43,132,398 Diluted 43,471,880 43,156,827
Comprehensive Income Net income $ 11,621 32,206 Other comprehensive income from unrealized gains on available for sale securities, net of tax of $1,088 in
2014 and $2,210 in 2013 1,747 3,543 Comprehensive income $ 13,368 35,749
4
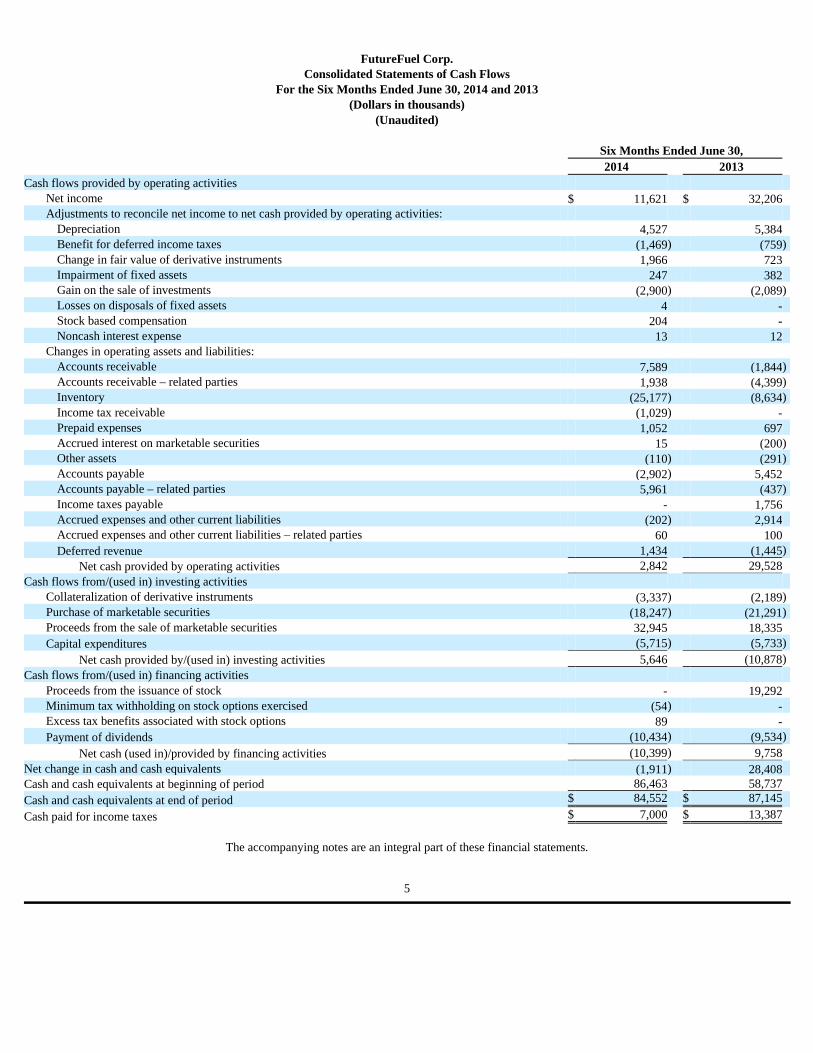
FutureFuel Corp.
Consolidated Statements of Cash Flows For the Six Months Ended June 30, 2014 and 2013
(Dollars in thousands) (Unaudited)
The accompanying notes are an integral part of these financial statements.
Six Months Ended June 30, 2014 2013 Cash flows provided by operating activities
Net income $ 11,621 $ 32,206 Adjustments to reconcile net income to net cash provided by operating activities:
Depreciation 4,527 5,384 Benefit for deferred income taxes (1,469 ) (759 ) Change in fair value of derivative instruments 1,966 723 Impairment of fixed assets 247 382 Gain on the sale of investments (2,900 ) (2,089 ) Losses on disposals of fixed assets 4 - Stock based compensation 204 - Noncash interest expense 13 12
Changes in operating assets and liabilities: Accounts receivable 7,589 (1,844 ) Accounts receivable – related parties 1,938 (4,399 ) Inventory (25,177 ) (8,634 ) Income tax receivable (1,029 ) - Prepaid expenses 1,052 697 Accrued interest on marketable securities 15 (200 ) Other assets (110 ) (291 ) Accounts payable (2,902 ) 5,452 Accounts payable – related parties 5,961 (437 ) Income taxes payable - 1,756 Accrued expenses and other current liabilities (202 ) 2,914 Accrued expenses and other current liabilities – related parties 60 100 Deferred revenue 1,434 (1,445 )
Net cash provided by operating activities 2,842 29,528 Cash flows from/(used in) investing activities
Collateralization of derivative instruments (3,337 ) (2,189 ) Purchase of marketable securities (18,247 ) (21,291 ) Proceeds from the sale of marketable securities 32,945 18,335 Capital expenditures (5,715 ) (5,733 )
Net cash provided by/(used in) investing activities 5,646 (10,878 ) Cash flows from/(used in) financing activities
Proceeds from the issuance of stock - 19,292 Minimum tax withholding on stock options exercised (54 ) - Excess tax benefits associated with stock options 89 - Payment of dividends (10,434 ) (9,534 )
Net cash (used in)/provided by financing activities (10,399 ) 9,758 Net change in cash and cash equivalents (1,911 ) 28,408 Cash and cash equivalents at beginning of period 86,463 58,737 Cash and cash equivalents at end of period $ 84,552 $ 87,145
Cash paid for income taxes $ 7,000 $ 13,387
5
Notes to Consolidated Financial Statements of FutureFuel Corp.
(Dollars in thousands, except per share amounts) (Unaudited)
1) Nature of operations and basis of presentation
Organization
FutureFuel Corp. (“FutureFuel ”), through its wholly-owned subsidiary, FutureFuel Chemical Company (“FutureFuel Chemical”), owns and operates a chemical production facility located on approximately 2,200 acres of land six miles southeast of Batesville in north central Arkansas fronting the White River (the “Batesville Plant”). FutureFuel Chemical manufactures diversified chemical products, biobased products comprised of biofuels, and biobased specialty chemical products. FutureFuel Chemical’s operations are reported in two segments: chemicals and biofuels.
The chemicals segment manufactures a diversified listing of chemical products that are sold to third party customers. The majority of the revenues from the chemical segment are derived from the custom manufacturing of specialty chemicals for specific customers. Historically, the chemicals segment has relied upon two customers for a substantial amount of its revenues.
The biofuels segment leverages the Batesville Plant’s technical and operational expertise as well as available manufacturing capacity to compete in the emerging biofuels industry.
Basis of Presentation
The accompanying consolidated financial statements have been prepared by FutureFuel in accordance and consistent with the accounting policies stated in FutureFuel’s 2013 audited consolidated financial statements and should be read in conjunction with the 2013 audited consolidated financial statements of FutureFuel.
In the opinion of FutureFuel, all normal recurring adjustments necessary for a fair presentation have been included in the unaudited consolidated financial statements. The unaudited consolidated financial statements have been prepared in compliance with the Financial Accounting Standards Board (“FASB”) Accounting Standards Codification (“ASC”) accounting principles generally accepted in the United States for interim financial information and with instructions to Form 10-Q adopted by the Securities and Exchange Commission (“SEC”). Accordingly, the financial statements do not include all the information and footnotes required by accounting principles generally accepted in the United States for complete financial statements, and do include amounts that are based upon management estimates and judgments. Future actual results could differ from such current estimates. The unaudited consolidated financial statements include assets, liabilities, revenues, and expenses of FutureFuel and its wholly owned subsidiaries, FutureFuel Chemical Company, FFC Grain, L.L.C., FutureFuel Warehouse Company, LLC, and Legacy Regional Transport, L.L.C. Intercompany transactions and balances have been eliminated in consolidation.
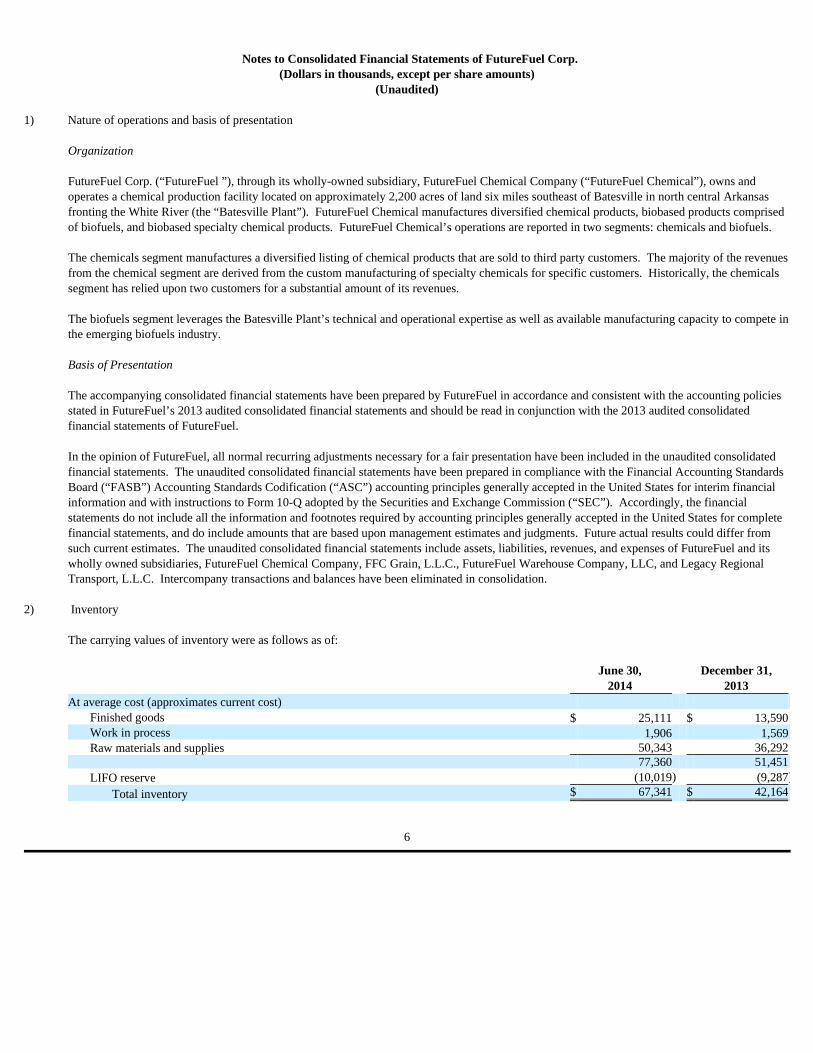
2) Inventory
The carrying values of inventory were as follows as of:
June 30,
2014 December 31,
2013 At average cost (approximates current cost)
Finished goods $ 25,111 $ 13,590 Work in process 1,906 1,569 Raw materials and supplies 50,343 36,292
77,360 51,451 LIFO reserve (10,019 ) (9,287 )
Total inventory $ 67,341 $ 42,164
6
Notes to Consolidated Financial Statements of FutureFuel Corp.
(Dollars in thousands, except per share amounts) (Unaudited)
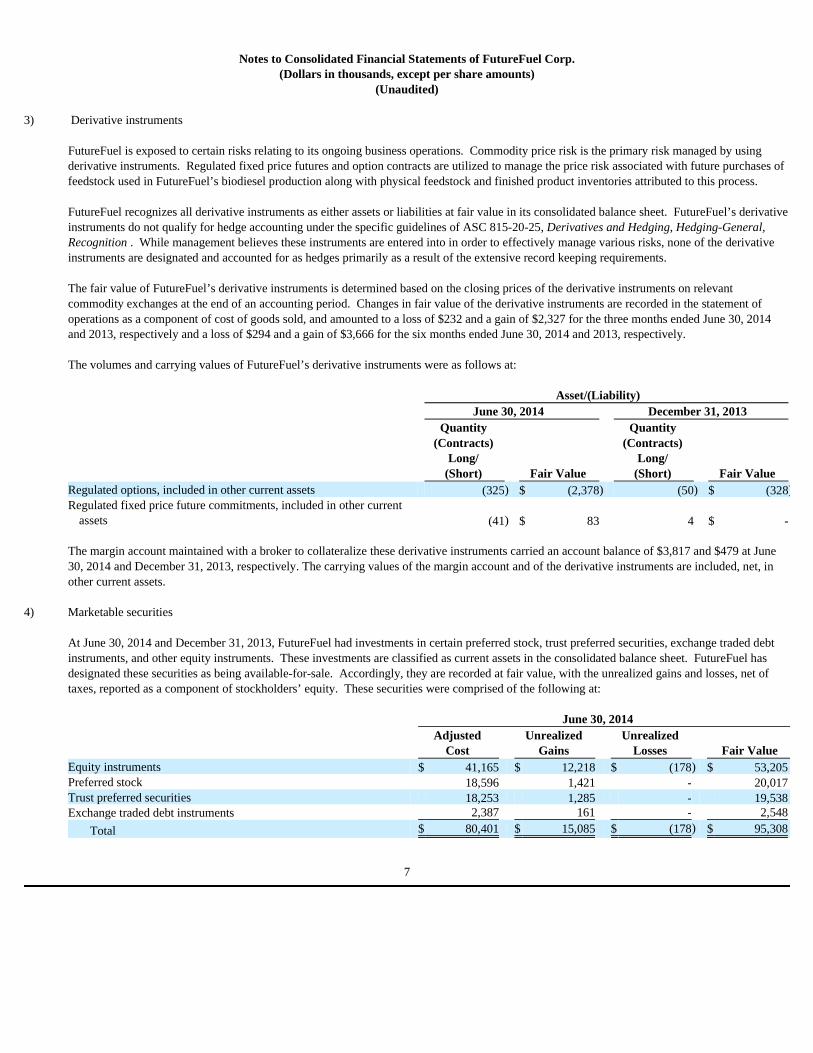
3) Derivative instruments
FutureFuel is exposed to certain risks relating to its ongoing business operations. Commodity price risk is the primary risk managed by using derivative instruments. Regulated fixed price futures and option contracts are utilized to manage the price risk associated with future purchases of feedstock used in FutureFuel’s biodiesel production along with physical feedstock and finished product inventories attributed to this process.
FutureFuel recognizes all derivative instruments as either assets or liabilities at fair value in its consolidated balance sheet. FutureFuel’s derivative instruments do not qualify for hedge accounting under the specific guidelines of ASC 815-20-25, Derivatives and Hedging, Hedging-General, Recognition . While management believes these instruments are entered into in order to effectively manage various risks, none of the derivative instruments are designated and accounted for as hedges primarily as a result of the extensive record keeping requirements.
The fair value of FutureFuel’s derivative instruments is determined based on the closing prices of the derivative instruments on relevant commodity exchanges at the end of an accounting period. Changes in fair value of the derivative instruments are recorded in the statement of operations as a component of cost of goods sold, and amounted to a loss of $232 and a gain of $2,327 for the three months ended June 30, 2014 and 2013, respectively and a loss of $294 and a gain of $3,666 for the six months ended June 30, 2014 and 2013, respectively. The volumes and carrying values of FutureFuel’s derivative instruments were as follows at:
The margin account maintained with a broker to collateralize these derivative instruments carried an account balance of $3,817 and $479 at June 30, 2014 and December 31, 2013, respectively. The carrying values of the margin account and of the derivative instruments are included, net, in other current assets.
4) Marketable securities
At June 30, 2014 and December 31, 2013, FutureFuel had investments in certain preferred stock, trust preferred securities, exchange traded debt instruments, and other equity instruments. These investments are classified as current assets in the consolidated balance sheet. FutureFuel has designated these securities as being available-for-sale. Accordingly, they are recorded at fair value, with the unrealized gains and losses, net of taxes, reported as a component of stockholders’ equity. These securities were comprised of the following at:
Asset/(Liability) June 30, 2014 December 31, 2013
Quantity (Contracts)
Long/ (Short) Fair Value
Quantity (Contracts)
Long/ (Short) Fair Value
Regulated options, included in other current assets (325 ) $ (2,378 ) (50 ) $ (328 ) Regulated fixed price future commitments, included in other current
assets (41 ) $ 83 4 $ -
June 30, 2014
Adjusted
Cost Unrealized
Gains Unrealized
Losses Fair Value Equity instruments $ 41,165 $ 12,218 $ (178 ) $ 53,205 Preferred stock 18,596 1,421 - 20,017 Trust preferred securities 18,253 1,285 - 19,538 Exchange traded debt instruments 2,387 161 - 2,548
Total $ 80,401 $ 15,085 $ (178 ) $ 95,308
7

Notes to Consolidated Financial Statements of FutureFuel Corp.
(Dollars in thousands, except per share amounts) (Unaudited)
The aggregate fair value of instruments with unrealized losses totaled $2,678 and $26,321 at June 30, 2014 and December 31, 2013, respectively. As of June 30, 2014 and December 31, 2013, FutureFuel had a total of $0 and $0 invested in marketable securities that were in an unrealized loss position for a greater than 12-month period, respectively.
5) Accrued expenses and other current liabilities
Accrued expenses and other current liabilities, including those associated with related parties, consisted of the following at:
6) Borrowings
Effective June 30, 2013, FutureFuel Chemical extended the term of its $50 million credit agreement with a commercial bank. The loan is a revolving facility the proceeds of which may be used for working capital, capital expenditures, and the general corporate purposes of FutureFuel Chemical. The facility terminates on June 30, 2018. Advances are made pursuant to a borrowing base comprised of 85% of eligible accounts receivable plus 60% of eligible direct inventory plus 50% of eligible indirect inventory. Advances are secured by a perfected first priority security interest in accounts receivable and inventory. The interest rate floats at certain margins over the London Interbank Offered Rate (“LIBOR”) or base rate based upon the leverage ratio from time to time as set forth in the following table.
There is an unused commitment fee of 0.25% per annum. On the last day of each fiscal quarter, the ratio of EBITDA to fixed charges may not be less than 3:1. FutureFuel has guaranteed FutureFuel Chemical’s obligations under this credit agreement.
There were no borrowings under this credit agreement at June 30, 2014 or December 31, 2013.
7) Provision for income taxes
The following table summarizes the provision for income taxes.
December 31, 2013
Adjusted
Cost Unrealized
Gains Unrealized
Losses Fair Value Equity instruments $ 51,711 $ 11,597 $ (278 ) $ 63,030 Preferred stock 18,519 893 (299 ) 19,113 Trust preferred securities 19,726 386 (235 ) 19,877 Exchange traded debt instruments 2,243 34 (26 ) 2,251
Total $ 92,199 $ 12,910 $ (838 ) $ 104,271
June 30,
2014 December 31,
2013 Accrued employee liabilities $ 5,478 $ 5,010 Accrued property, use, and franchise taxes 1,824 2,558 Other 361 237
Total $ 7,663 $ 7,805
Leverage Ratio
Base Rate Margin
LIBOR Margin
> 3 -0.55% 1.70% > 2 < 3 -0.70% 1.50% > 1 < 2 -1.00% 1.25%
< 1 -1.00% 1.00%
8
Notes to Consolidated Financial Statements of FutureFuel Corp.
(Dollars in thousands, except per share amounts) (Unaudited)
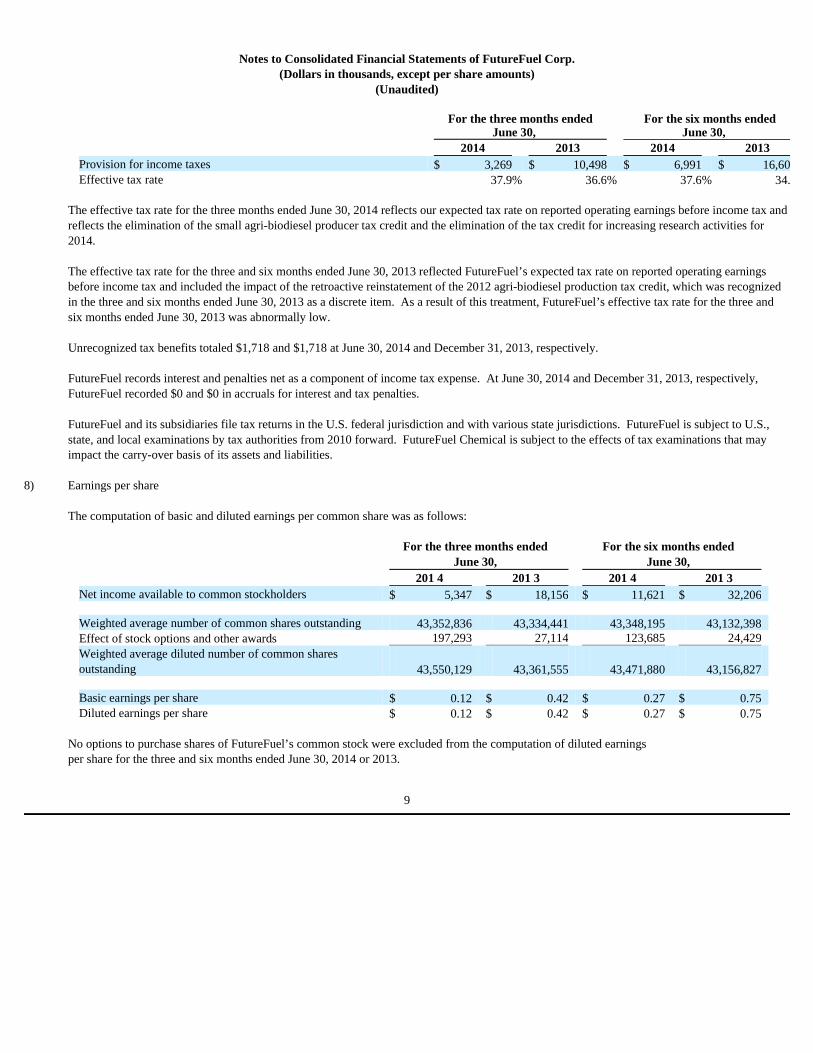
The effective tax rate for the three months ended June 30, 2014 reflects our expected tax rate on reported operating earnings before income tax and reflects the elimination of the small agri-biodiesel producer tax credit and the elimination of the tax credit for increasing research activities for 2014. The effective tax rate for the three and six months ended June 30, 2013 reflected FutureFuel’s expected tax rate on reported operating earnings before income tax and included the impact of the retroactive reinstatement of the 2012 agri-biodiesel production tax credit, which was recognized in the three and six months ended June 30, 2013 as a discrete item. As a result of this treatment, FutureFuel’s effective tax rate for the three and six months ended June 30, 2013 was abnormally low.
Unrecognized tax benefits totaled $1,718 and $1,718 at June 30, 2014 and December 31, 2013, respectively.
FutureFuel records interest and penalties net as a component of income tax expense. At June 30, 2014 and December 31, 2013, respectively, FutureFuel recorded $0 and $0 in accruals for interest and tax penalties.
FutureFuel and its subsidiaries file tax returns in the U.S. federal jurisdiction and with various state jurisdictions. FutureFuel is subject to U.S., state, and local examinations by tax authorities from 2010 forward. FutureFuel Chemical is subject to the effects of tax examinations that may impact the carry-over basis of its assets and liabilities.
8) Earnings per share
The computation of basic and diluted earnings per common share was as follows:
No options to purchase shares of FutureFuel’s common stock were excluded from the computation of diluted earnings per share for the three and six months ended June 30, 2014 or 2013.
For the three months ended
June 30, For the six months ended
June 30, 2014 2013 2014 2013 Provision for income taxes $ 3,269 $ 10,498 $ 6,991 $ 16,604 Effective tax rate 37.9 % 36.6 % 37.6 % 34.0
For the three months ended
June 30, For the six months ended
June 30, 201 4 201 3 201 4 201 3 Net income available to common stockholders $ 5,347 $ 18,156 $ 11,621 $ 32,206 Weighted average number of common shares outstanding 43,352,836 43,334,441 43,348,195 43,132,398 Effect of stock options and other awards 197,293 27,114 123,685 24,429 Weighted average diluted number of common shares outstanding 43,550,129 43,361,555 43,471,880 43,156,827 Basic earnings per share $ 0.12 $ 0.42 $ 0.27 $ 0.75 Diluted earnings per share $ 0.12 $ 0.42 $ 0.27 $ 0.75
9
Notes to Consolidated Financial Statements of FutureFuel Corp.
(Dollars in thousands, except per share amounts) (Unaudited)
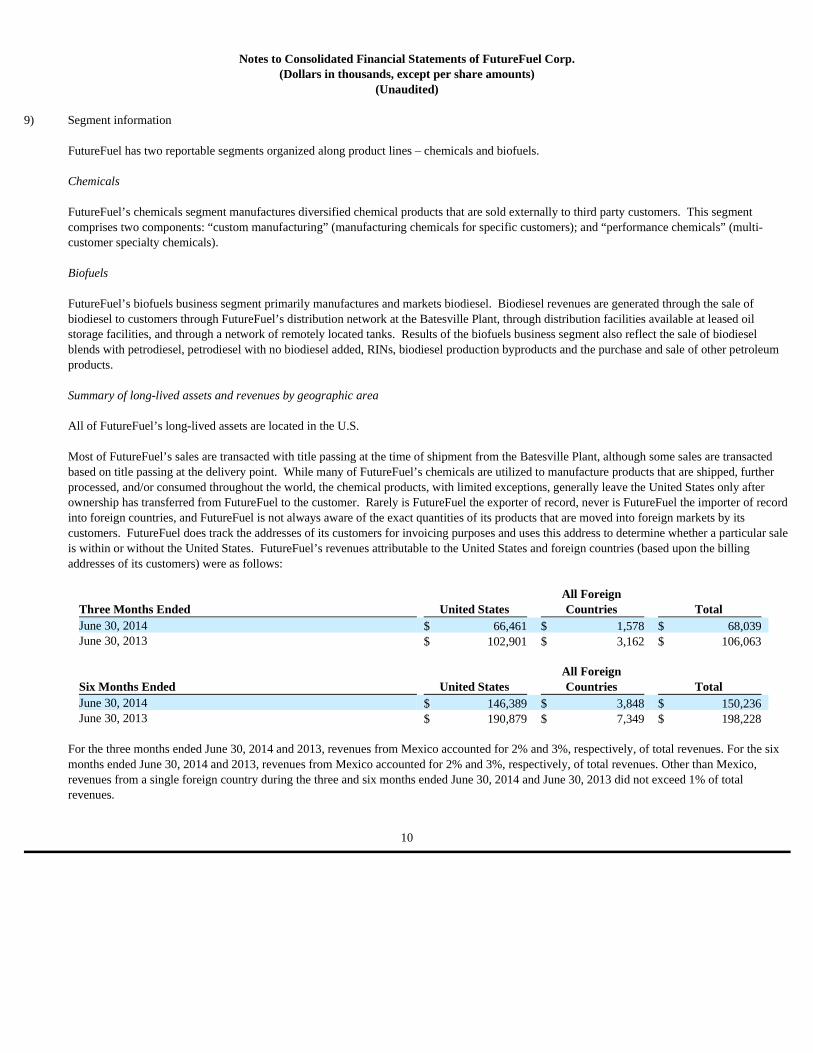
9) Segment information
FutureFuel has two reportable segments organized along product lines – chemicals and biofuels.
Chemicals
FutureFuel’s chemicals segment manufactures diversified chemical products that are sold externally to third party customers. This segment comprises two components: “custom manufacturing” (manufacturing chemicals for specific customers); and “performance chemicals” (multi-customer specialty chemicals).
Biofuels
FutureFuel’s biofuels business segment primarily manufactures and markets biodiesel. Biodiesel revenues are generated through the sale of biodiesel to customers through FutureFuel’s distribution network at the Batesville Plant, through distribution facilities available at leased oil storage facilities, and through a network of remotely located tanks. Results of the biofuels business segment also reflect the sale of biodiesel blends with petrodiesel, petrodiesel with no biodiesel added, RINs, biodiesel production byproducts and the purchase and sale of other petroleum products.
Summary of long-lived assets and revenues by geographic area
All of FutureFuel’s long-lived assets are located in the U.S.
Most of FutureFuel’s sales are transacted with title passing at the time of shipment from the Batesville Plant, although some sales are transacted based on title passing at the delivery point. While many of FutureFuel’s chemicals are utilized to manufacture products that are shipped, further processed, and/or consumed throughout the world, the chemical products, with limited exceptions, generally leave the United States only after ownership has transferred from FutureFuel to the customer. Rarely is FutureFuel the exporter of record, never is FutureFuel the importer of record into foreign countries, and FutureFuel is not always aware of the exact quantities of its products that are moved into foreign markets by its customers. FutureFuel does track the addresses of its customers for invoicing purposes and uses this address to determine whether a particular sale is within or without the United States. FutureFuel’s revenues attributable to the United States and foreign countries (based upon the billing addresses of its customers) were as follows:
For the three months ended June 30, 2014 and 2013, revenues from Mexico accounted for 2% and 3%, respectively, of total revenues. For the six months ended June 30, 2014 and 2013, revenues from Mexico accounted for 2% and 3%, respectively, of total revenues. Other than Mexico, revenues from a single foreign country during the three and six months ended June 30, 2014 and June 30, 2013 did not exceed 1% of total revenues.
Three Months Ended United States All Foreign Countries Total
June 30, 2014 $ 66,461 $ 1,578 $ 68,039 June 30, 2013 $ 102,901 $ 3,162 $ 106,063
Six Months Ended United States All Foreign Countries Total
June 30, 2014 $ 146,389 $ 3,848 $ 150,236 June 30, 2013 $ 190,879 $ 7,349 $ 198,228
10
Notes to Consolidated Financial Statements of FutureFuel Corp.
(Dollars in thousands, except per share amounts) (Unaudited)
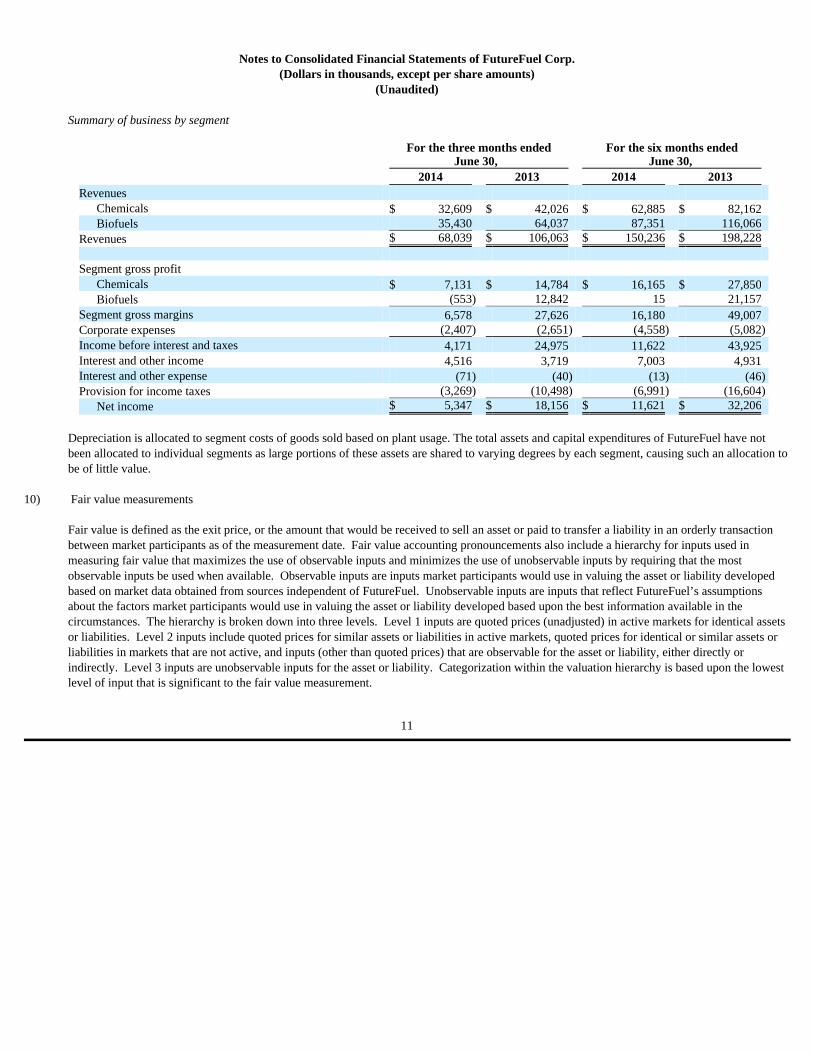
Summary of business by segment
Depreciation is allocated to segment costs of goods sold based on plant usage. The total assets and capital expenditures of FutureFuel have not been allocated to individual segments as large portions of these assets are shared to varying degrees by each segment, causing such an allocation to be of little value.
10) Fair value measurements
Fair value is defined as the exit price, or the amount that would be received to sell an asset or paid to transfer a liability in an orderly transaction between market participants as of the measurement date. Fair value accounting pronouncements also include a hierarchy for inputs used in measuring fair value that maximizes the use of observable inputs and minimizes the use of unobservable inputs by requiring that the most observable inputs be used when available. Observable inputs are inputs market participants would use in valuing the asset or liability developed based on market data obtained from sources independent of FutureFuel. Unobservable inputs are inputs that reflect FutureFuel’s assumptions about the factors market participants would use in valuing the asset or liability developed based upon the best information available in the circumstances. The hierarchy is broken down into three levels. Level 1 inputs are quoted prices (unadjusted) in active markets for identical assets or liabilities. Level 2 inputs include quoted prices for similar assets or liabilities in active markets, quoted prices for identical or similar assets or liabilities in markets that are not active, and inputs (other than quoted prices) that are observable for the asset or liability, either directly or indirectly. Level 3 inputs are unobservable inputs for the asset or liability. Categorization within the valuation hierarchy is based upon the lowest level of input that is significant to the fair value measurement.
For the three months ended
June 30, For the six months ended
June 30, 2014 2013 2014 2013 Revenues
Chemicals $ 32,609 $ 42,026 $ 62,885 $ 82,162 Biofuels 35,430 64,037 87,351 116,066
Revenues $ 68,039 $ 106,063 $ 150,236 $ 198,228 Segment gross profit
Chemicals $ 7,131 $ 14,784 $ 16,165 $ 27,850 Biofuels (553 ) 12,842 15 21,157
Segment gross margins 6,578 27,626 16,180 49,007 Corporate expenses (2,407 ) (2,651 ) (4,558 ) (5,082 ) Income before interest and taxes 4,171 24,975 11,622 43,925 Interest and other income 4,516 3,719 7,003 4,931 Interest and other expense (71 ) (40 ) (13 ) (46 ) Provision for income taxes (3,269 ) (10,498 ) (6,991 ) (16,604 )
Net income $ 5,347 $ 18,156 $ 11,621 $ 32,206
11

Notes to Consolidated Financial Statements of FutureFuel Corp.
(Dollars in thousands, except per share amounts) (Unaudited)
The following tables provide information by level for assets and liabilities that are measured at fair value, on a recurring basis, at June 30, 2014 and December 31, 2013.
11) Reclassifications from accumulated other comprehensive income:
The following tables summarizes changes in accumulated other comprehensive income from unrealized gains and losses on available-for-sale securities.
Asset/(Liability)
Fair Value at
June 30, Fair Value Measurements Using
Inputs Considered as Description 2014 Level 1 Level 2 Level 3 Derivative instruments $ 2,295 $ 2,295 $ - $ Preferred stock, trust preferred securities, exchange traded debt instruments, and other equity instruments $ 95,308 $ 95,308 $ - $
Asset/(Liability)
Fair Value at December 31,
Fair Value Measurements Using Inputs Considered as
Description 2013 Level 1 Level 2 Level 3 Derivative instruments $ (328 ) $ (328 ) $ - $ Preferred stock, trust preferred securities, exchange traded debt instruments, and other equity instruments $ 104,271 $ 104,271 $ - $
Changes in Accumulated Other Comprehensive Income Unrealized Gains and Losses on Available-for-Sale Securities
For T he Three M onths E nded June 3 0 , 2014 (net of tax)
Balance at March 31, 2014 $ 6,672 Other comprehensive income before reclassifications 6,042 Amounts reclassified from accumulated other comprehensive income (3,531 Net current-period other comprehensive income 2,511
Balance at June 30, 2014 $ 9,183
Changes in Accumulated Other Comprehensive Income Unrealized Gains and Losses on Available-for-Sale Securities
For T he S ix M onths E nded June 30, 2014 (net of tax)
Balance at December 31, 2013 $ 7,436 Other comprehensive income before reclassifications 5,266 Amounts reclassified from accumulated other comprehensive income (3,519 Net current-period other comprehensive income 1,747
Balance at June 30, 2014 $ 9,183
12
Notes to Consolidated Financial Statements of FutureFuel Corp.
(Dollars in thousands, except per share amounts) (Unaudited)
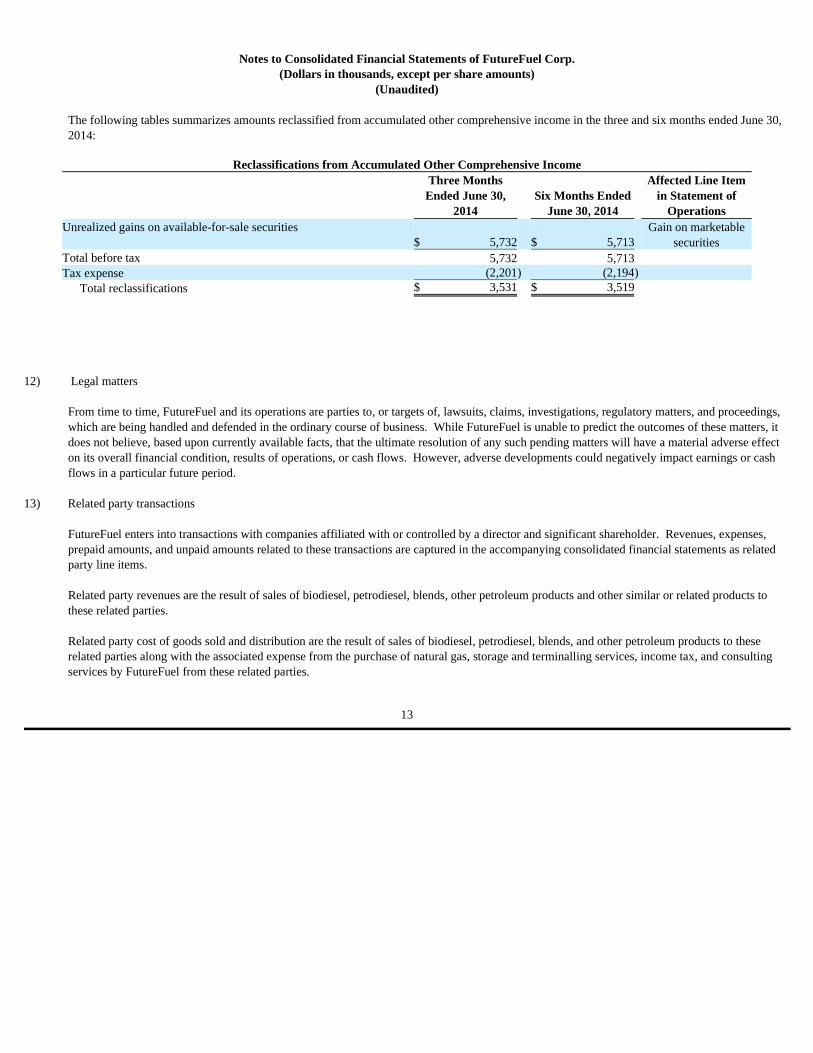
The following tables summarizes amounts reclassified from accumulated other comprehensive income in the three and six months ended June 30, 2014:
12) Legal matters
From time to time, FutureFuel and its operations are parties to, or targets of, lawsuits, claims, investigations, regulatory matters, and proceedings, which are being handled and defended in the ordinary course of business. While FutureFuel is unable to predict the outcomes of these matters, it does not believe, based upon currently available facts, that the ultimate resolution of any such pending matters will have a material adverse effect on its overall financial condition, results of operations, or cash flows. However, adverse developments could negatively impact earnings or cash flows in a particular future period.
13) Related party transactions
FutureFuel enters into transactions with companies affiliated with or controlled by a director and significant shareholder. Revenues, expenses, prepaid amounts, and unpaid amounts related to these transactions are captured in the accompanying consolidated financial statements as related party line items.
Related party revenues are the result of sales of biodiesel, petrodiesel, blends, other petroleum products and other similar or related products to these related parties.
Related party cost of goods sold and distribution are the result of sales of biodiesel, petrodiesel, blends, and other petroleum products to these related parties along with the associated expense from the purchase of natural gas, storage and terminalling services, income tax, and consulting services by FutureFuel from these related parties.
Reclassifications from Accumulated Other Comprehensive Income
Three Months Ended June 30,
2014 Six Months Ended
June 30, 2014
Affected Line Item in Statement of
Operations Unrealized gains on available-for-sale securities
$ 5,732 $ 5,713 Gain on marketable
securities Total before tax 5,732 5,713 Tax expense (2,201 ) (2,194 )
Total reclassifications $ 3,531 $ 3,519
13
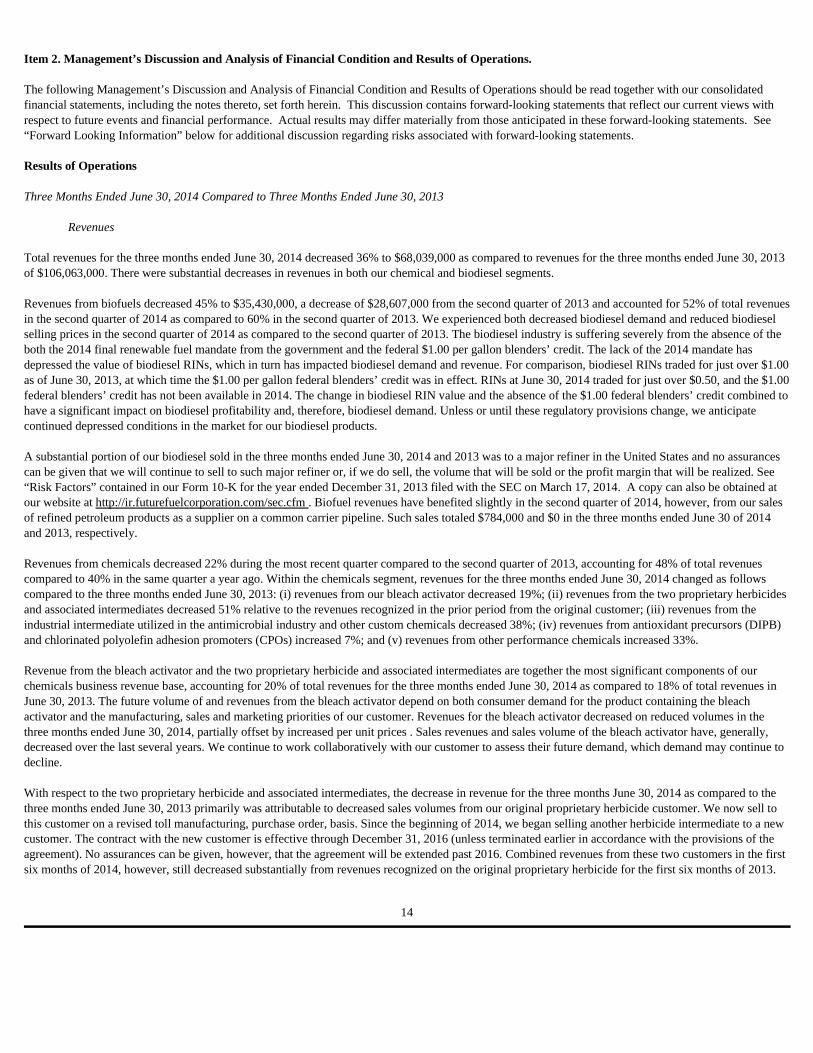
Item 2. Management’s Discussion and Analysis of Financial Condition and Results of Operations. The following Management’s Discussion and Analysis of Financial Condition and Results of Operations should be read together with our consolidated financial statements, including the notes thereto, set forth herein. This discussion contains forward-looking statements that reflect our current views with respect to future events and financial performance. Actual results may differ materially from those anticipated in these forward-looking statements. See “Forward Looking Information” below for additional discussion regarding risks associated with forward-looking statements. Results of Operations Three Months Ended June 30, 2014 Compared to Three Months Ended June 30, 2013
Revenues Total revenues for the three months ended June 30, 2014 decreased 36% to $68,039,000 as compared to revenues for the three months ended June 30, 2013 of $106,063,000. There were substantial decreases in revenues in both our chemical and biodiesel segments. Revenues from biofuels decreased 45% to $35,430,000, a decrease of $28,607,000 from the second quarter of 2013 and accounted for 52% of total revenues in the second quarter of 2014 as compared to 60% in the second quarter of 2013. We experienced both decreased biodiesel demand and reduced biodiesel selling prices in the second quarter of 2014 as compared to the second quarter of 2013. The biodiesel industry is suffering severely from the absence of the both the 2014 final renewable fuel mandate from the government and the federal $1.00 per gallon blenders’ credit. The lack of the 2014 mandate has depressed the value of biodiesel RINs, which in turn has impacted biodiesel demand and revenue. For comparison, biodiesel RINs traded for just over $1.00 as of June 30, 2013, at which time the $1.00 per gallon federal blenders’ credit was in effect. RINs at June 30, 2014 traded for just over $0.50, and the $1.00 federal blenders’ credit has not been available in 2014. The change in biodiesel RIN value and the absence of the $1.00 federal blenders’ credit combined to have a significant impact on biodiesel profitability and, therefore, biodiesel demand. Unless or until these regulatory provisions change, we anticipate continued depressed conditions in the market for our biodiesel products. A substantial portion of our biodiesel sold in the three months ended June 30, 2014 and 2013 was to a major refiner in the United States and no assurances can be given that we will continue to sell to such major refiner or, if we do sell, the volume that will be sold or the profit margin that will be realized. See “Risk Factors” contained in our Form 10-K for the year ended December 31, 2013 filed with the SEC on March 17, 2014. A copy can also be obtained at our website at http://ir.futurefuelcorporation.com/sec.cfm . Biofuel revenues have benefited slightly in the second quarter of 2014, however, from our sales of refined petroleum products as a supplier on a common carrier pipeline. Such sales totaled $784,000 and $0 in the three months ended June 30 of 2014 and 2013, respectively. Revenues from chemicals decreased 22% during the most recent quarter compared to the second quarter of 2013, accounting for 48% of total revenues compared to 40% in the same quarter a year ago. Within the chemicals segment, revenues for the three months ended June 30, 2014 changed as follows compared to the three months ended June 30, 2013: (i) revenues from our bleach activator decreased 19%; (ii) revenues from the two proprietary herbicides and associated intermediates decreased 51% relative to the revenues recognized in the prior period from the original customer; (iii) revenues from the industrial intermediate utilized in the antimicrobial industry and other custom chemicals decreased 38%; (iv) revenues from antioxidant precursors (DIPB) and chlorinated polyolefin adhesion promoters (CPOs) increased 7%; and (v) revenues from other performance chemicals increased 33%. Revenue from the bleach activator and the two proprietary herbicide and associated intermediates are together the most significant components of our chemicals business revenue base, accounting for 20% of total revenues for the three months ended June 30, 2014 as compared to 18% of total revenues in June 30, 2013. The future volume of and revenues from the bleach activator depend on both consumer demand for the product containing the bleach activator and the manufacturing, sales and marketing priorities of our customer. Revenues for the bleach activator decreased on reduced volumes in the three months ended June 30, 2014, partially offset by increased per unit prices . Sales revenues and sales volume of the bleach activator have, generally, decreased over the last several years. We continue to work collaboratively with our customer to assess their future demand, which demand may continue to decline. With respect to the two proprietary herbicide and associated intermediates, the decrease in revenue for the three months June 30, 2014 as compared to the three months ended June 30, 2013 primarily was attributable to decreased sales volumes from our original proprietary herbicide customer. We now sell to this customer on a revised toll manufacturing, purchase order, basis. Since the beginning of 2014, we began selling another herbicide intermediate to a new customer. The contract with the new customer is effective through December 31, 2016 (unless terminated earlier in accordance with the provisions of the agreement). No assurances can be given, however, that the agreement will be extended past 2016. Combined revenues from these two customers in the first six months of 2014, however, still decreased substantially from revenues recognized on the original proprietary herbicide for the first six months of 2013.
14

For CPOs and DIPB, the combined 7% increase in revenues this quarter was attributable to increased sales volumes to our primary customer. Revenues from other custom chemical products decreased 45% in the second quarter of 2014 as compared to the second quarter of 2013. The decrease was primarily related to loss of sales of a product to a substantial customer and discontinued production of another custom chemical product for lack of demand. A bright spot was a 33% increase in revenues from performance chemicals for the second quarter of 2014 as compared to the same quarter last year, accounting for approximately 8% of total revenues for the three months ended June 30, 2014. Sales of a new product and increased demand for another existing product accounted for most of this increase.
Cost of Goods Sold, Distribution, and Segment Gross Profit Total cost of goods sold and distribution for the second quarter of 2014 were $61,461,000 as compared to $78,437,000 for the second quarter of 2013, a decrease of 22%. By comparison, our revenues decreased 36% for the period. Due to the significant fixed cost component of our operating structure, decreases in revenues have a disproportionate impact on profitability. A build-up of finished goods inventory (primarily biodiesel) and increased fixed costs during the quarter also contributed to this disparity. Cost of goods sold and distribution for the second quarter of 2014 in our biofuels segment were $35,983,000 as compared to $51,195,000 for the second quarter of 2013. On a percentage basis, cost of goods sold and distribution decreased 30% from the three months ended June 30, 2013 as compared to a 45% reduction in revenues for the same period. The reduction in biofuel segment gross profit was primarily the result of a combination of the following: (i) hedging losses were $232,000 in the second quarter of 2014 as compared to hedging gains in the second quarter of 2013 of $2,327,000; (ii) the impact of not having the benefit of the $1.00 per gallon blenders’ credit on quantities of biodiesel sold in the second quarter of 2014; (iii) reduced biodiesel RIN values; and (iv) reduced production yields from the mix of feedstock purchased. Additionally, at June 30, 2014 we held in inventory certain quantities of biodiesel RINs. We do not allocate production cost to internally generated RINs. The benefit of the sale of our RINs is recognized in the period the sale is completed. Minimal RINs were held in inventory at June 30, 2013. Partially offsetting the reduced gross profit was the benefit of a larger fixed cost allocation to the chemical segment, which included a reduction in the change in LIFO reserve for the three months ended June 30, 2014 as compared to the three months ended June 30, 2013. Cost of goods sold and distribution for the three months ended June 30, 2014 for our chemicals segment totaled $25,478,000 as compared to $27,242,000 for the three months ended June 30, 2013. On a percentage basis, total cost of goods sold and distribution decreased approximately 6% for the three months ended June 30, 2014 as compared to the three months ended June 30, 2013. This compares against a 22% decrease in chemical segment revenue for the same comparison periods. The reduction in chemical segment gross profit was primarily the result of reduced sales volumes, particularly volumes of: (i) the original proprietary herbicide intermediate; (ii) two other custom chemicals we no longer sell; (iii) the bleach activator; and (iv) timing of shipment of particular products when compared quarter to quarter. Chemical segment gross profit was also negatively impacted by reduced production yields for certain products. These reduced production yields are not expected to continue. Additionally, higher maintenance and repairs costs were incurred for waste treatment activities during the second quarter of 2014, which should be non-recurring. These reductions in gross profit were partially offset by a reduction in the LIFO reserve for the three months ended June 30, 2014 as compared to the three months ended June 30, 2013.
Operating Expenses Operating expenses decreased 9% from $2,651,000 in the second quarter of 2013 to $2,408,000 in the second quarter of 2014. This decrease was primarily attributable to reduced compensation expense. Partially offsetting this reduction was a restricted stock award for 250,000 shares granted on May 9, 2014 to Paul A. Novelly, our Chief Executive Officer pursuant and subject to the terms and conditions of the Company’s 2007 Omnibus Incentive Plan. The restricted shares vest in three annual installments on the first, second, and third anniversaries of the grant date as service to the company is fulfilled. The total expense for the award is $4,195,000 and will be recognized into expense equally over the three year service period.
Provision for Income Taxes and Net Income The effective tax rate for the three months ended June 30, 2014 reflects our expected tax rate on reported operating earnings before income tax and reflects the elimination of the small agri-biodiesel producer tax credit and the elimination of the tax credit for increasing research activities for 2014. The effective tax rate for the three months ended June 30, 2013 reflected our expected tax rate on reported operating earnings before tax. Net income for the quarter ended June 30, 2014 decreased 71% to $5,347,000 from $18,156,000 during the same quarter a year ago.
15
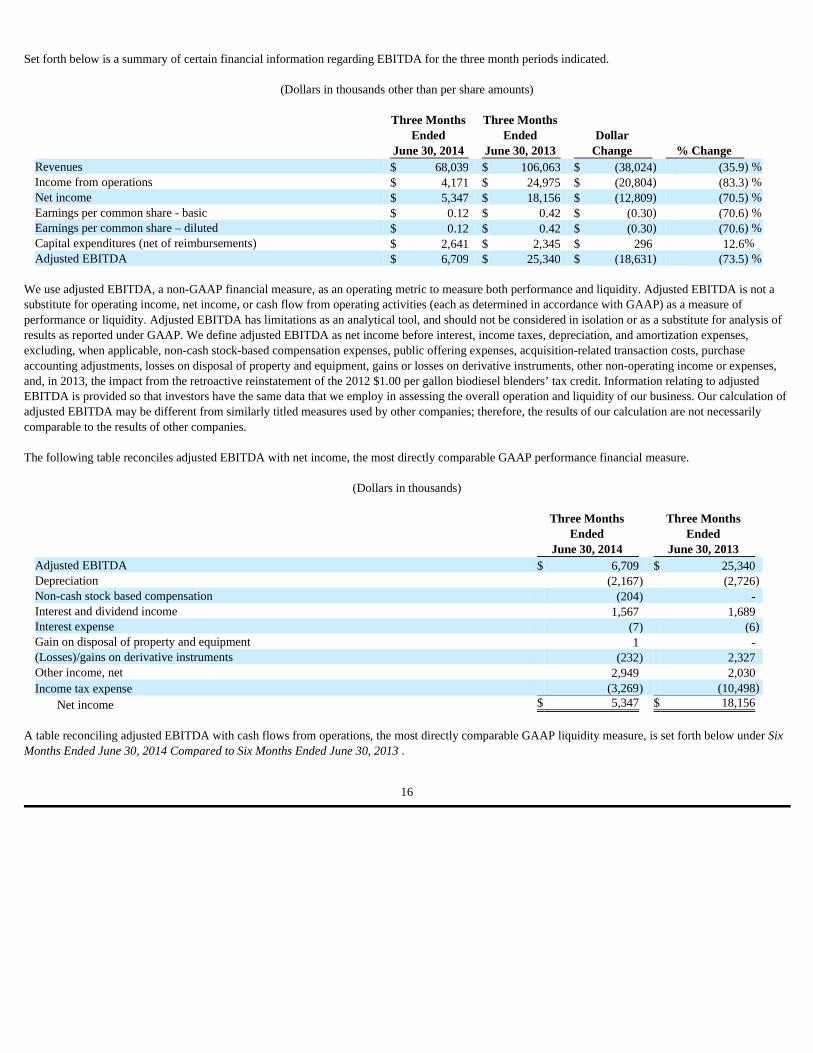
Set forth below is a summary of certain financial information regarding EBITDA for the three month periods indicated.
(Dollars in thousands other than per share amounts)
We use adjusted EBITDA, a non-GAAP financial measure, as an operating metric to measure both performance and liquidity. Adjusted EBITDA is not a substitute for operating income, net income, or cash flow from operating activities (each as determined in accordance with GAAP) as a measure of performance or liquidity. Adjusted EBITDA has limitations as an analytical tool, and should not be considered in isolation or as a substitute for analysis of results as reported under GAAP. We define adjusted EBITDA as net income before interest, income taxes, depreciation, and amortization expenses, excluding, when applicable, non-cash stock-based compensation expenses, public offering expenses, acquisition-related transaction costs, purchase accounting adjustments, losses on disposal of property and equipment, gains or losses on derivative instruments, other non-operating income or expenses, and, in 2013, the impact from the retroactive reinstatement of the 2012 $1.00 per gallon biodiesel blenders’ tax credit. Information relating to adjusted EBITDA is provided so that investors have the same data that we employ in assessing the overall operation and liquidity of our business. Our calculation of adjusted EBITDA may be different from similarly titled measures used by other companies; therefore, the results of our calculation are not necessarily comparable to the results of other companies. The following table reconciles adjusted EBITDA with net income, the most directly comparable GAAP performance financial measure.
(Dollars in thousands)
A table reconciling adjusted EBITDA with cash flows from operations, the most directly comparable GAAP liquidity measure, is set forth below under Six Months Ended June 30, 2014 Compared to Six Months Ended June 30, 2013 .
Three Months Ended
June 30, 2014
Three Months Ended
June 30, 2013 Dollar
Change % Change Revenues $ 68,039 $ 106,063 $ (38,024 ) (35.9 ) % Income from operations $ 4,171 $ 24,975 $ (20,804 ) (83.3 ) % Net income $ 5,347 $ 18,156 $ (12,809 ) (70.5 ) % Earnings per common share - basic $ 0.12 $ 0.42 $ (0.30 ) (70.6 ) % Earnings per common share – diluted $ 0.12 $ 0.42 $ (0.30 ) (70.6 ) % Capital expenditures (net of reimbursements) $ 2,641 $ 2,345 $ 296 12.6 % Adjusted EBITDA $ 6,709 $ 25,340 $ (18,631 ) (73.5 ) %
Three Months Ended
June 30, 2014
Three Months Ended
June 30, 2013 Adjusted EBITDA $ 6,709 $ 25,340 Depreciation (2,167 ) (2,726 ) Non-cash stock based compensation (204 ) - Interest and dividend income 1,567 1,689 Interest expense (7 ) (6 ) Gain on disposal of property and equipment 1 - (Losses)/gains on derivative instruments (232 ) 2,327 Other income, net 2,949 2,030 Income tax expense (3,269 ) (10,498 )
Net income $ 5,347 $ 18,156
16
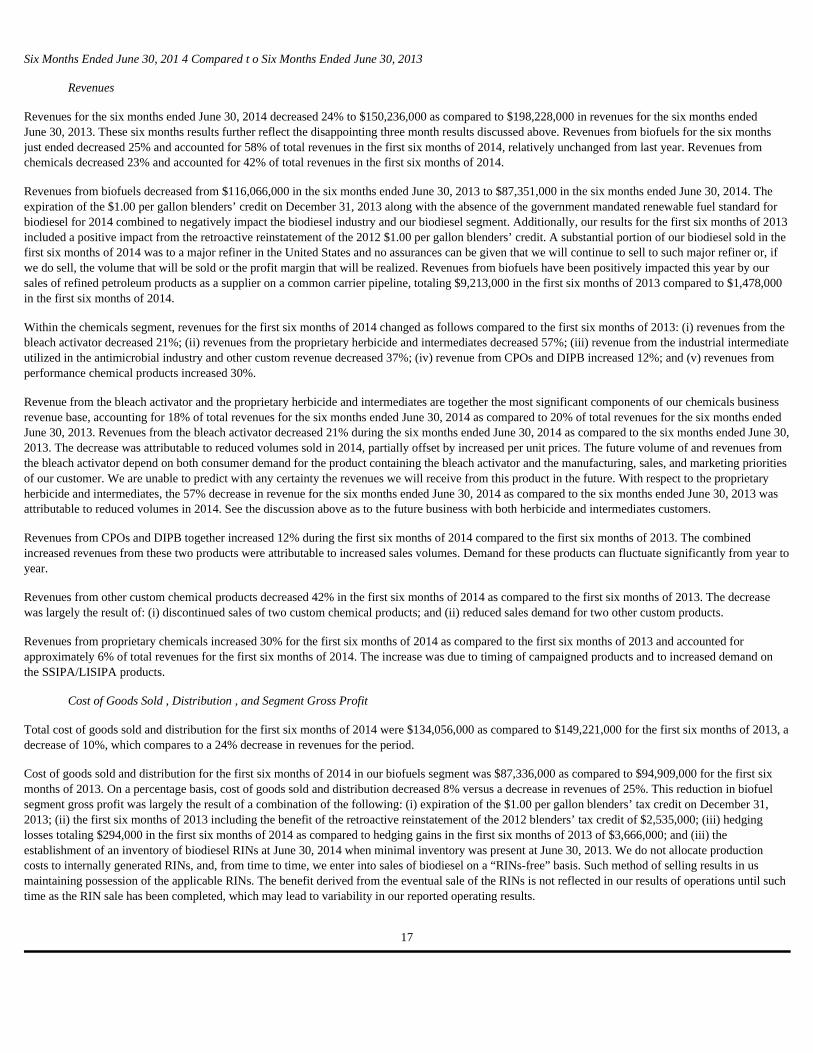
Six Months Ended June 30, 201 4 Compared t o Six Months Ended June 30, 2013
Revenues Revenues for the six months ended June 30, 2014 decreased 24% to $150,236,000 as compared to $198,228,000 in revenues for the six months ended June 30, 2013. These six months results further reflect the disappointing three month results discussed above. Revenues from biofuels for the six months just ended decreased 25% and accounted for 58% of total revenues in the first six months of 2014, relatively unchanged from last year. Revenues from chemicals decreased 23% and accounted for 42% of total revenues in the first six months of 2014. Revenues from biofuels decreased from $116,066,000 in the six months ended June 30, 2013 to $87,351,000 in the six months ended June 30, 2014. The expiration of the $1.00 per gallon blenders’ credit on December 31, 2013 along with the absence of the government mandated renewable fuel standard for biodiesel for 2014 combined to negatively impact the biodiesel industry and our biodiesel segment. Additionally, our results for the first six months of 2013 included a positive impact from the retroactive reinstatement of the 2012 $1.00 per gallon blenders’ credit. A substantial portion of our biodiesel sold in the first six months of 2014 was to a major refiner in the United States and no assurances can be given that we will continue to sell to such major refiner or, if we do sell, the volume that will be sold or the profit margin that will be realized. Revenues from biofuels have been positively impacted this year by our sales of refined petroleum products as a supplier on a common carrier pipeline, totaling $9,213,000 in the first six months of 2013 compared to $1,478,000 in the first six months of 2014. Within the chemicals segment, revenues for the first six months of 2014 changed as follows compared to the first six months of 2013: (i) revenues from the bleach activator decreased 21%; (ii) revenues from the proprietary herbicide and intermediates decreased 57%; (iii) revenue from the industrial intermediate utilized in the antimicrobial industry and other custom revenue decreased 37%; (iv) revenue from CPOs and DIPB increased 12%; and (v) revenues from performance chemical products increased 30%. Revenue from the bleach activator and the proprietary herbicide and intermediates are together the most significant components of our chemicals business revenue base, accounting for 18% of total revenues for the six months ended June 30, 2014 as compared to 20% of total revenues for the six months ended June 30, 2013. Revenues from the bleach activator decreased 21% during the six months ended June 30, 2014 as compared to the six months ended June 30, 2013. The decrease was attributable to reduced volumes sold in 2014, partially offset by increased per unit prices. The future volume of and revenues from the bleach activator depend on both consumer demand for the product containing the bleach activator and the manufacturing, sales, and marketing priorities of our customer. We are unable to predict with any certainty the revenues we will receive from this product in the future. With respect to the proprietary herbicide and intermediates, the 57% decrease in revenue for the six months ended June 30, 2014 as compared to the six months ended June 30, 2013 was attributable to reduced volumes in 2014. See the discussion above as to the future business with both herbicide and intermediates customers. Revenues from CPOs and DIPB together increased 12% during the first six months of 2014 compared to the first six months of 2013. The combined increased revenues from these two products were attributable to increased sales volumes. Demand for these products can fluctuate significantly from year to year. Revenues from other custom chemical products decreased 42% in the first six months of 2014 as compared to the first six months of 2013. The decrease was largely the result of: (i) discontinued sales of two custom chemical products; and (ii) reduced sales demand for two other custom products. Revenues from proprietary chemicals increased 30% for the first six months of 2014 as compared to the first six months of 2013 and accounted for approximately 6% of total revenues for the first six months of 2014. The increase was due to timing of campaigned products and to increased demand on the SSIPA/LISIPA products.
Cost of Goods Sold , Distribution , and Segment Gross Profit Total cost of goods sold and distribution for the first six months of 2014 were $134,056,000 as compared to $149,221,000 for the first six months of 2013, a decrease of 10%, which compares to a 24% decrease in revenues for the period. Cost of goods sold and distribution for the first six months of 2014 in our biofuels segment was $87,336,000 as compared to $94,909,000 for the first six months of 2013. On a percentage basis, cost of goods sold and distribution decreased 8% versus a decrease in revenues of 25%. This reduction in biofuel segment gross profit was largely the result of a combination of the following: (i) expiration of the $1.00 per gallon blenders’ tax credit on December 31, 2013; (ii) the first six months of 2013 including the benefit of the retroactive reinstatement of the 2012 blenders’ tax credit of $2,535,000; (iii) hedging losses totaling $294,000 in the first six months of 2014 as compared to hedging gains in the first six months of 2013 of $3,666,000; and (iii) the establishment of an inventory of biodiesel RINs at June 30, 2014 when minimal inventory was present at June 30, 2013. We do not allocate production costs to internally generated RINs, and, from time to time, we enter into sales of biodiesel on a “RINs-free” basis. Such method of selling results in us maintaining possession of the applicable RINs. The benefit derived from the eventual sale of the RINs is not reflected in our results of operations until such time as the RIN sale has been completed, which may lead to variability in our reported operating results.
17
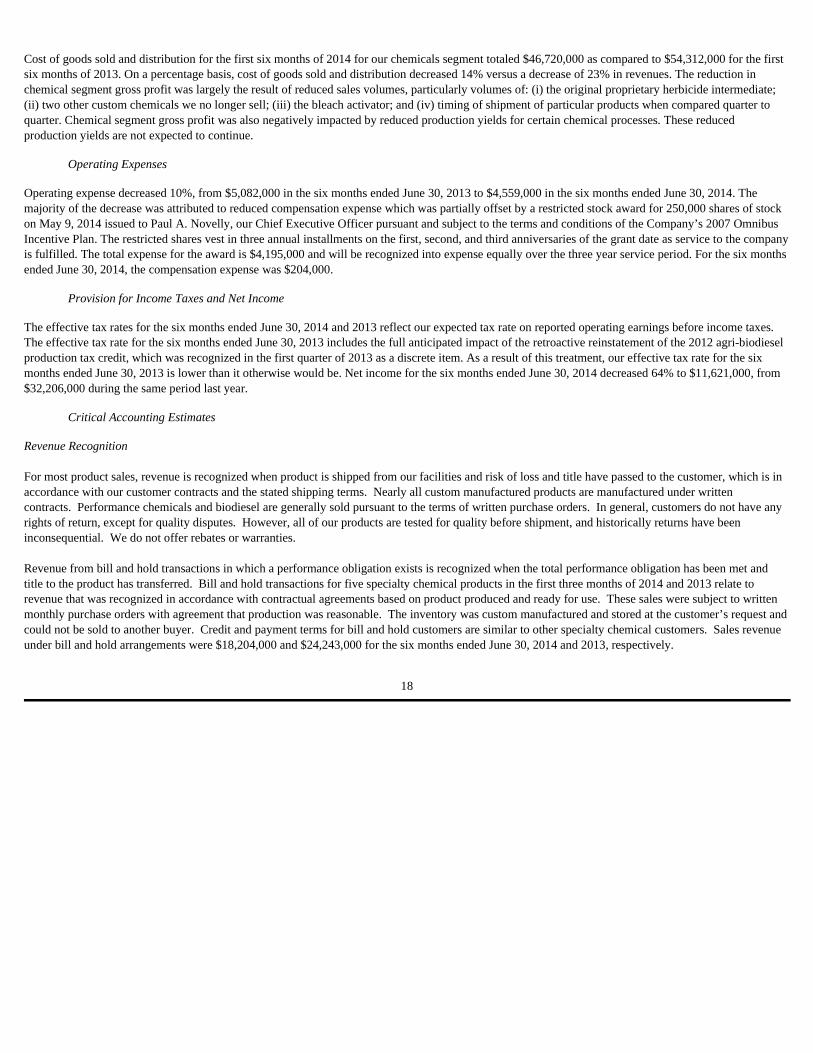
Cost of goods sold and distribution for the first six months of 2014 for our chemicals segment totaled $46,720,000 as compared to $54,312,000 for the first six months of 2013. On a percentage basis, cost of goods sold and distribution decreased 14% versus a decrease of 23% in revenues. The reduction in chemical segment gross profit was largely the result of reduced sales volumes, particularly volumes of: (i) the original proprietary herbicide intermediate; (ii) two other custom chemicals we no longer sell; (iii) the bleach activator; and (iv) timing of shipment of particular products when compared quarter to quarter. Chemical segment gross profit was also negatively impacted by reduced production yields for certain chemical processes. These reduced production yields are not expected to continue.
Operating Expenses Operating expense decreased 10%, from $5,082,000 in the six months ended June 30, 2013 to $4,559,000 in the six months ended June 30, 2014. The majority of the decrease was attributed to reduced compensation expense which was partially offset by a restricted stock award for 250,000 shares of stock on May 9, 2014 issued to Paul A. Novelly, our Chief Executive Officer pursuant and subject to the terms and conditions of the Company’s 2007 Omnibus Incentive Plan. The restricted shares vest in three annual installments on the first, second, and third anniversaries of the grant date as service to the company is fulfilled. The total expense for the award is $4,195,000 and will be recognized into expense equally over the three year service period. For the six months ended June 30, 2014, the compensation expense was $204,000.
Provision for Income Taxes and Net Income The effective tax rates for the six months ended June 30, 2014 and 2013 reflect our expected tax rate on reported operating earnings before income taxes. The effective tax rate for the six months ended June 30, 2013 includes the full anticipated impact of the retroactive reinstatement of the 2012 agri-biodiesel production tax credit, which was recognized in the first quarter of 2013 as a discrete item. As a result of this treatment, our effective tax rate for the six months ended June 30, 2013 is lower than it otherwise would be. Net income for the six months ended June 30, 2014 decreased 64% to $11,621,000, from $32,206,000 during the same period last year.
Critical Accounting Estimates Revenue Recognition For most product sales, revenue is recognized when product is shipped from our facilities and risk of loss and title have passed to the customer, which is in accordance with our customer contracts and the stated shipping terms. Nearly all custom manufactured products are manufactured under written contracts. Performance chemicals and biodiesel are generally sold pursuant to the terms of written purchase orders. In general, customers do not have any rights of return, except for quality disputes. However, all of our products are tested for quality before shipment, and historically returns have been inconsequential. We do not offer rebates or warranties. Revenue from bill and hold transactions in which a performance obligation exists is recognized when the total performance obligation has been met and title to the product has transferred. Bill and hold transactions for five specialty chemical products in the first three months of 2014 and 2013 relate to revenue that was recognized in accordance with contractual agreements based on product produced and ready for use. These sales were subject to written monthly purchase orders with agreement that production was reasonable. The inventory was custom manufactured and stored at the customer’s request and could not be sold to another buyer. Credit and payment terms for bill and hold customers are similar to other specialty chemical customers. Sales revenue under bill and hold arrangements were $18,204,000 and $24,243,000 for the six months ended June 30, 2014 and 2013, respectively.
18

Set forth below is a summary of certain financial information regarding EBITDA for the six month periods indicated.
(Dollars in thousands other than per share amounts)
See the discussion above regarding our use of adjusted EBITDA. The following table reconciles adjusted EBITDA with net income, the most directly comparable GAAP financial measure.
The following table reconciles adjusted EBITDA with cash flows from operations, the most directly comparable GAAP liquidity measure.
Reconciliation of Adjusted EBITDA to Net Cash Provided by Operating Activities
Six Months Ended
June 30, 2014
Six Months Ended June 30,
2013 Dollar Change % Change
Revenues $ 150,236 $ 198,228 $ (47,992 ) (24.2 %) Income from operations $ 11,622 $ 43,925 $ (32,303 ) (73.5 %) Net income $ 11,621 $ 32,206 $ (20,585 ) (63.9 %) Earnings per common share - basic $ 0.27 $ 0.75 $ (0.48 ) (64.0 %) Earnings per common share – diluted $ 0.27 $ 0.75 $ (0.48 ) (64.0 %) Capital expenditures (net of customer reimbursements and grants) $ 5,119 $ 3,606 $ 1,513 42.0 % Adjusted EBITDA $ 16,817 $ 43,074 $ (26,257 ) (61.0 %)
Six Months Ended
June 30, 2014
Six Months Ended
June 30, 2013 Adjusted EBITDA $ 16,817 $ 43,074 Depreciation and amortization (4,527 ) (5,384 ) Non-cash stock-based compensation (204 ) - Retroactive reinstatement of 2012 $1 blender credit - 2,535 Interest and dividend income 3,937 2,842 Interest expense (13 ) (12 ) Loss on disposal of property and equipment (4 ) - (Losses)/gains on derivative instruments (294 ) 3,666 Other income, net 2,900 2,089 Income tax expense (6,991 ) (16,604 )
Net income $ 11,621 $ 32,206
Six Months Ended
June 30, 2014
Six Months Ended
June 30, 2013 Adjusted EBITDA $ 16,817 $ 43,074 Benefit from deferred income taxes (1,469 ) (759 ) Impairment of fixed assets 247 382 Retroactive reinstatement of 2012 $1.00 blenders credit - 2,535 Interest and dividend income 3,937 2,842 Income tax expense (6,991 ) (16,604 ) (Losses)/gains on derivative instruments (294 ) 3,666 Change in fair value of derivative instruments and marketable securities 1,966 723 Changes in operating assets and liabilities, net (11,371 ) (6,331 ) Other - -
Net cash provided by operating activities $ 2,842 $ 29,528
19
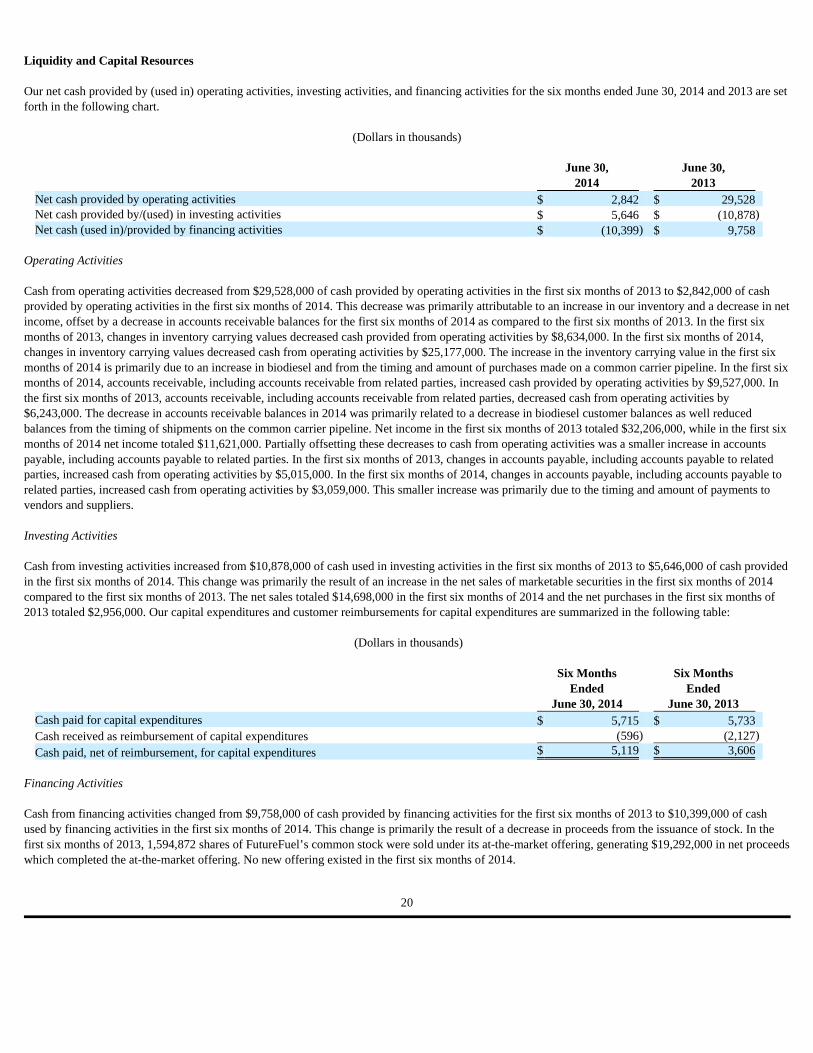
Liquidity and Capital Resources Our net cash provided by (used in) operating activities, investing activities, and financing activities for the six months ended June 30, 2014 and 2013 are set forth in the following chart.
(Dollars in thousands)
Operating Activities Cash from operating activities decreased from $29,528,000 of cash provided by operating activities in the first six months of 2013 to $2,842,000 of cash provided by operating activities in the first six months of 2014. This decrease was primarily attributable to an increase in our inventory and a decrease in net income, offset by a decrease in accounts receivable balances for the first six months of 2014 as compared to the first six months of 2013. In the first six months of 2013, changes in inventory carrying values decreased cash provided from operating activities by $8,634,000. In the first six months of 2014, changes in inventory carrying values decreased cash from operating activities by $25,177,000. The increase in the inventory carrying value in the first six months of 2014 is primarily due to an increase in biodiesel and from the timing and amount of purchases made on a common carrier pipeline. In the first six months of 2014, accounts receivable, including accounts receivable from related parties, increased cash provided by operating activities by $9,527,000. In the first six months of 2013, accounts receivable, including accounts receivable from related parties, decreased cash from operating activities by $6,243,000. The decrease in accounts receivable balances in 2014 was primarily related to a decrease in biodiesel customer balances as well reduced balances from the timing of shipments on the common carrier pipeline. Net income in the first six months of 2013 totaled $32,206,000, while in the first six months of 2014 net income totaled $11,621,000. Partially offsetting these decreases to cash from operating activities was a smaller increase in accounts payable, including accounts payable to related parties. In the first six months of 2013, changes in accounts payable, including accounts payable to related parties, increased cash from operating activities by $5,015,000. In the first six months of 2014, changes in accounts payable, including accounts payable to related parties, increased cash from operating activities by $3,059,000. This smaller increase was primarily due to the timing and amount of payments to vendors and suppliers. Investing Activities Cash from investing activities increased from $10,878,000 of cash used in investing activities in the first six months of 2013 to $5,646,000 of cash provided in the first six months of 2014. This change was primarily the result of an increase in the net sales of marketable securities in the first six months of 2014 compared to the first six months of 2013. The net sales totaled $14,698,000 in the first six months of 2014 and the net purchases in the first six months of 2013 totaled $2,956,000. Our capital expenditures and customer reimbursements for capital expenditures are summarized in the following table:
(Dollars in thousands)
Financing Activities Cash from financing activities changed from $9,758,000 of cash provided by financing activities for the first six months of 2013 to $10,399,000 of cash used by financing activities in the first six months of 2014. This change is primarily the result of a decrease in proceeds from the issuance of stock. In the first six months of 2013, 1,594,872 shares of FutureFuel’s common stock were sold under its at-the-market offering, generating $19,292,000 in net proceeds which completed the at-the-market offering. No new offering existed in the first six months of 2014.
June 30,
2014 June 30,
2013 Net cash provided by operating activities $ 2,842 $ 29,528 Net cash provided by/(used) in investing activities $ 5,646 $ (10,878 ) Net cash (used in)/provided by financing activities $ (10,399 ) $ 9,758
Six Months Ended
June 30, 2014
Six Months Ended
June 30, 2013 Cash paid for capital expenditures $ 5,715 $ 5,733 Cash received as reimbursement of capital expenditures (596 ) (2,127 )
Cash paid, net of reimbursement, for capital expenditures $ 5,119 $ 3,606
20
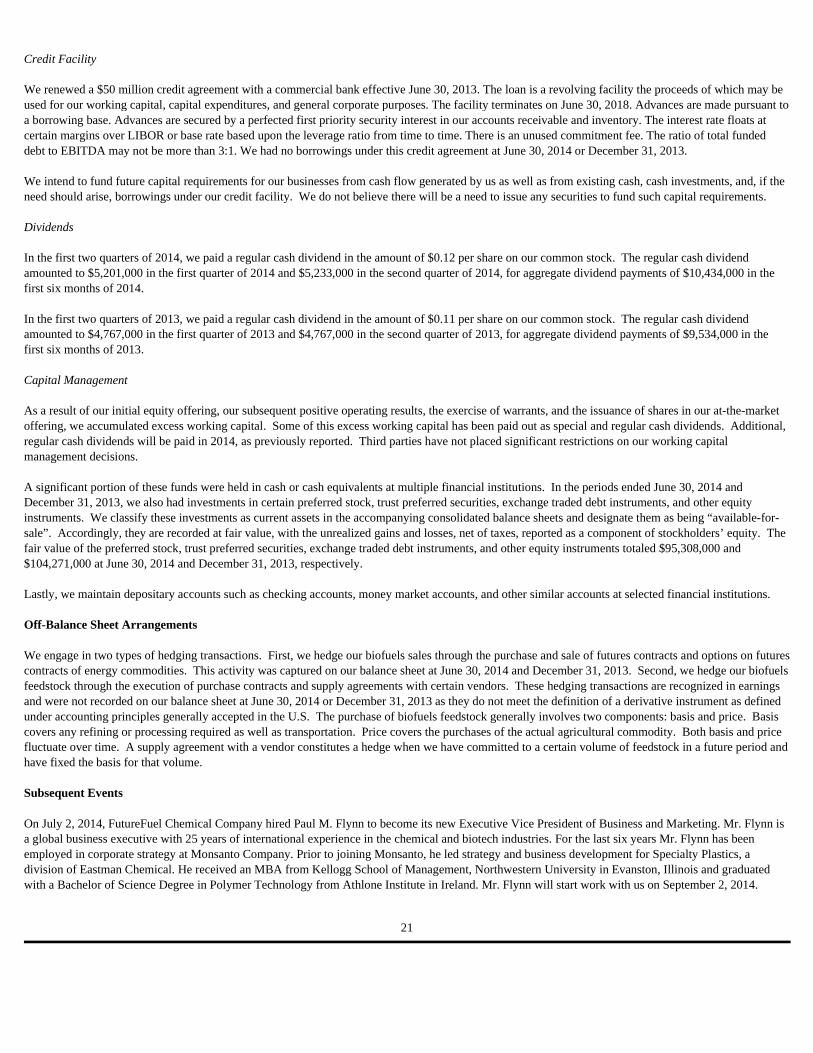
Credit Facility We renewed a $50 million credit agreement with a commercial bank effective June 30, 2013. The loan is a revolving facility the proceeds of which may be used for our working capital, capital expenditures, and general corporate purposes. The facility terminates on June 30, 2018. Advances are made pursuant to a borrowing base. Advances are secured by a perfected first priority security interest in our accounts receivable and inventory. The interest rate floats at certain margins over LIBOR or base rate based upon the leverage ratio from time to time. There is an unused commitment fee. The ratio of total funded debt to EBITDA may not be more than 3:1. We had no borrowings under this credit agreement at June 30, 2014 or December 31, 2013. We intend to fund future capital requirements for our businesses from cash flow generated by us as well as from existing cash, cash investments, and, if the need should arise, borrowings under our credit facility. We do not believe there will be a need to issue any securities to fund such capital requirements. Dividends In the first two quarters of 2014, we paid a regular cash dividend in the amount of $0.12 per share on our common stock. The regular cash dividend amounted to $5,201,000 in the first quarter of 2014 and $5,233,000 in the second quarter of 2014, for aggregate dividend payments of $10,434,000 in the first six months of 2014. In the first two quarters of 2013, we paid a regular cash dividend in the amount of $0.11 per share on our common stock. The regular cash dividend amounted to $4,767,000 in the first quarter of 2013 and $4,767,000 in the second quarter of 2013, for aggregate dividend payments of $9,534,000 in the first six months of 2013. Capital Management As a result of our initial equity offering, our subsequent positive operating results, the exercise of warrants, and the issuance of shares in our at-the-market offering, we accumulated excess working capital. Some of this excess working capital has been paid out as special and regular cash dividends. Additional, regular cash dividends will be paid in 2014, as previously reported. Third parties have not placed significant restrictions on our working capital management decisions. A significant portion of these funds were held in cash or cash equivalents at multiple financial institutions. In the periods ended June 30, 2014 and December 31, 2013, we also had investments in certain preferred stock, trust preferred securities, exchange traded debt instruments, and other equity instruments. We classify these investments as current assets in the accompanying consolidated balance sheets and designate them as being “available-for-sale”. Accordingly, they are recorded at fair value, with the unrealized gains and losses, net of taxes, reported as a component of stockholders’ equity. The fair value of the preferred stock, trust preferred securities, exchange traded debt instruments, and other equity instruments totaled $95,308,000 and $104,271,000 at June 30, 2014 and December 31, 2013, respectively. Lastly, we maintain depositary accounts such as checking accounts, money market accounts, and other similar accounts at selected financial institutions. Off-Balance Sheet Arrangements We engage in two types of hedging transactions. First, we hedge our biofuels sales through the purchase and sale of futures contracts and options on futures contracts of energy commodities. This activity was captured on our balance sheet at June 30, 2014 and December 31, 2013. Second, we hedge our biofuels feedstock through the execution of purchase contracts and supply agreements with certain vendors. These hedging transactions are recognized in earnings and were not recorded on our balance sheet at June 30, 2014 or December 31, 2013 as they do not meet the definition of a derivative instrument as defined under accounting principles generally accepted in the U.S. The purchase of biofuels feedstock generally involves two components: basis and price. Basis covers any refining or processing required as well as transportation. Price covers the purchases of the actual agricultural commodity. Both basis and price fluctuate over time. A supply agreement with a vendor constitutes a hedge when we have committed to a certain volume of feedstock in a future period and have fixed the basis for that volume. Subsequent Events On July 2, 2014, FutureFuel Chemical Company hired Paul M. Flynn to become its new Executive Vice President of Business and Marketing. Mr. Flynn is a global business executive with 25 years of international experience in the chemical and biotech industries. For the last six years Mr. Flynn has been employed in corporate strategy at Monsanto Company. Prior to joining Monsanto, he led strategy and business development for Specialty Plastics, a division of Eastman Chemical. He received an MBA from Kellogg School of Management, Northwestern University in Evanston, Illinois and graduated with a Bachelor of Science Degree in Polymer Technology from Athlone Institute in Ireland. Mr. Flynn will start work with us on September 2, 2014.
21
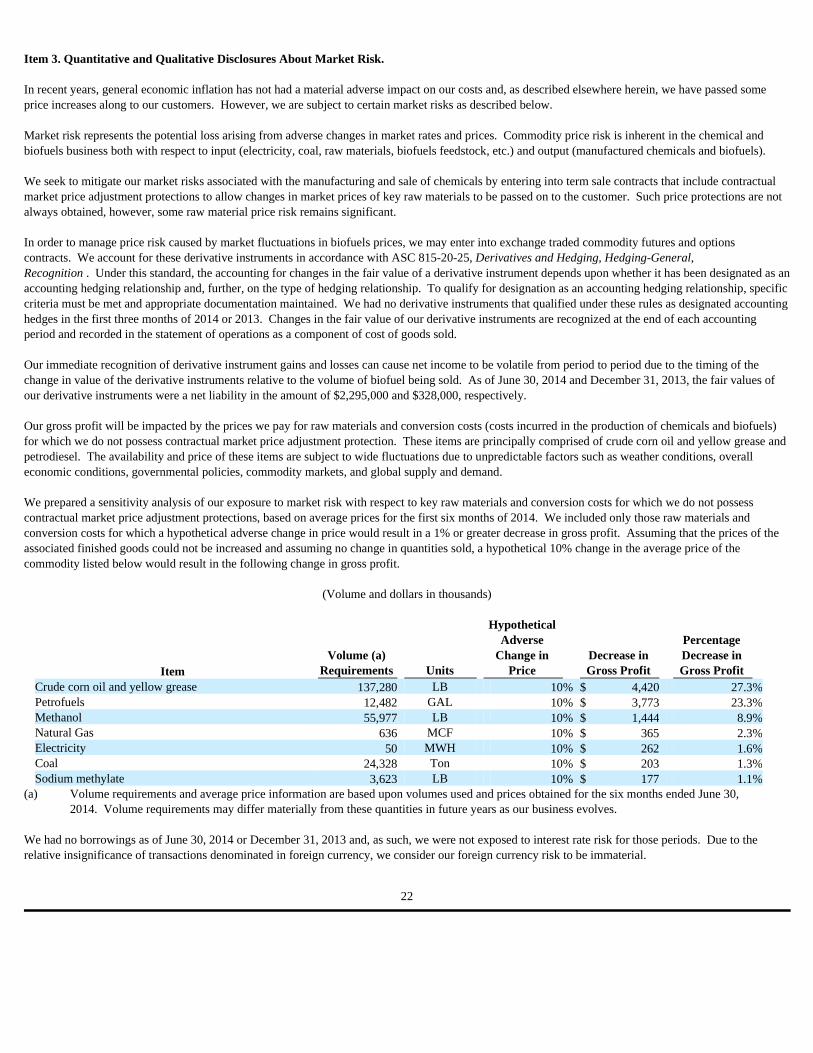
Item 3. Quantitative and Qualitative Disclosures About Market Risk. In recent years, general economic inflation has not had a material adverse impact on our costs and, as described elsewhere herein, we have passed some price increases along to our customers. However, we are subject to certain market risks as described below. Market risk represents the potential loss arising from adverse changes in market rates and prices. Commodity price risk is inherent in the chemical and biofuels business both with respect to input (electricity, coal, raw materials, biofuels feedstock, etc.) and output (manufactured chemicals and biofuels). We seek to mitigate our market risks associated with the manufacturing and sale of chemicals by entering into term sale contracts that include contractual market price adjustment protections to allow changes in market prices of key raw materials to be passed on to the customer. Such price protections are not always obtained, however, some raw material price risk remains significant. In order to manage price risk caused by market fluctuations in biofuels prices, we may enter into exchange traded commodity futures and options contracts. We account for these derivative instruments in accordance with ASC 815-20-25, Derivatives and Hedging, Hedging-General, Recognition . Under this standard, the accounting for changes in the fair value of a derivative instrument depends upon whether it has been designated as an accounting hedging relationship and, further, on the type of hedging relationship. To qualify for designation as an accounting hedging relationship, specific criteria must be met and appropriate documentation maintained. We had no derivative instruments that qualified under these rules as designated accounting hedges in the first three months of 2014 or 2013. Changes in the fair value of our derivative instruments are recognized at the end of each accounting period and recorded in the statement of operations as a component of cost of goods sold. Our immediate recognition of derivative instrument gains and losses can cause net income to be volatile from period to period due to the timing of the change in value of the derivative instruments relative to the volume of biofuel being sold. As of June 30, 2014 and December 31, 2013, the fair values of our derivative instruments were a net liability in the amount of $2,295,000 and $328,000, respectively. Our gross profit will be impacted by the prices we pay for raw materials and conversion costs (costs incurred in the production of chemicals and biofuels) for which we do not possess contractual market price adjustment protection. These items are principally comprised of crude corn oil and yellow grease and petrodiesel. The availability and price of these items are subject to wide fluctuations due to unpredictable factors such as weather conditions, overall economic conditions, governmental policies, commodity markets, and global supply and demand. We prepared a sensitivity analysis of our exposure to market risk with respect to key raw materials and conversion costs for which we do not possess contractual market price adjustment protections, based on average prices for the first six months of 2014. We included only those raw materials and conversion costs for which a hypothetical adverse change in price would result in a 1% or greater decrease in gross profit. Assuming that the prices of the associated finished goods could not be increased and assuming no change in quantities sold, a hypothetical 10% change in the average price of the commodity listed below would result in the following change in gross profit.
(Volume and dollars in thousands)
We had no borrowings as of June 30, 2014 or December 31, 2013 and, as such, we were not exposed to interest rate risk for those periods. Due to the relative insignificance of transactions denominated in foreign currency, we consider our foreign currency risk to be immaterial.
Item Volume (a)
Requirements Units
Hypothetical Adverse
Change in Price
Decrease in Gross Profit
Percentage Decrease in Gross Profit
Crude corn oil and yellow grease 137,280 LB 10 % $ 4,420 27.3 % Petrofuels 12,482 GAL 10 % $ 3,773 23.3 % Methanol 55,977 LB 10 % $ 1,444 8.9 % Natural Gas 636 MCF 10 % $ 365 2.3 % Electricity 50 MWH 10 % $ 262 1.6 % Coal 24,328 Ton 10 % $ 203 1.3 % Sodium methylate 3,623 LB 10 % $ 177 1.1 %
(a) Volume requirements and average price information are based upon volumes used and prices obtained for the six months ended June 30, 2014. Volume requirements may differ materially from these quantities in future years as our business evolves.
22

Item 4. Controls and Procedures. Under the supervision and with the participation of our chief executive officer and our principal financial officer and other senior management personnel, we evaluated the effectiveness of the design and operation of our disclosure controls and procedures (as defined in Rules 13a-15(e) and 15(d)-15(e)) under the Securities Exchange Act of 1934, as amended (or the Exchange Act), as of the end of the period covered by this report. Based on that evaluation, our chief executive officer and our principal financial officer have concluded that these disclosure controls and procedures as of June 30, 2014 were effective to ensure that information required to be disclosed in the reports that we file or submit under the Exchange Act is recorded, processed, summarized, and reported within the time periods specified in the SEC’s rules and forms. There were no changes in our internal control over financial reporting during our last fiscal quarter that materially affected, or were reasonably likely to materially affect, our internal control over financial reporting.
PART II OTHER INFORMATION
Item 1. Legal Proceedings. We are not a party to, nor is any of our property subject to, any material pending legal proceedings, other than ordinary routine litigation incidental to our business. However, from time to time, we may be a party to, or a target of, lawsuits, claims, investigations, and proceedings, including product liability, personal injury, asbestos, patent and intellectual property, commercial, contract, environmental, antitrust, health and safety, and employment matters, which we expect to be handled and defended in the ordinary course of business. While we are unable to predict the outcome of any matters currently pending, we do not believe that the ultimate resolution of any such pending matters will have a material adverse effect on our overall financial condition, results of operations, or cash flows. However, adverse developments could negatively impact earnings or cash flows in future periods. Please see the discussion above under Item 2. Management’s Discussion and Analysis of Financial Condition and Results of Operations – Other Matters for additional discussion on our legal matters. Item 1A. Risk Factors. There have been no material changes to the risk factors we previously disclosed in Item 1A of our Form 10-K, Annual Report for the year ended December 31, 2013 filed with the SEC on March 17, 2014. Item 6. Exhibits.
Special Note Regarding Forward Looking Information This report, and the documents incorporated by reference into this report, contain forward-looking statements. Forward-looking statements deal with our current plans, intentions, beliefs, and expectations, and statements of future economic performance. Statements containing such terms as “believe,” “do not believe,” “plan,” “expect,” “intend,” “estimate,” “anticipate,” and other phrases of similar meaning are considered to contain uncertainty and are forward-looking statements. In addition, from time to time we or our representatives have made or will make forward-looking statements orally or in writing. Furthermore, such forward-looking statements may be included in various filings that we make with the SEC, or in press releases, or in oral statements made by or with the approval of one of our authorized executive officers. These forward-looking statements are subject to certain known and unknown risks and uncertainties, as well as assumptions that could cause actual results to differ materially from those reflected in these forward-looking statements. Factors that might cause actual results to differ include, but are not limited to, those set forth under the headings “Risk Factors” and “Management’s Discussion and Analysis of Financial Condition and Results of Operations” and in our future filings made with the SEC. You should not place undue reliance on any forward-looking statements contained in this report which reflect our
Exhibit Description 11. Statement re Computation of per Share Earnings
31(a). Rule 13a-15(e)/15d-15(e) Certification of chief executive officer 31(b). Rule 13a-15(e)/15d-15(e) Certification of chief principal officer
32. Section 1350 Certification of chief executive officer and principal financial officer 101 Interactive Data Files**
101.INS XBRL Instance 101.SCH XBRL Taxonomy Extension Schema 101.CAL XBRL Taxonomy Extension Calculation 101.DEF XBRL Taxonomy Extension Definition 101.LAB XBRL Taxonomy Extension Labels 101.PRE XBRL Taxonomy Extension Presentation
** Pursuant to Rule 406T of Regulation S-T, the Interactive Data Files in Exhibit 101 hereto are deemed not filed or part of a registration statement or prospectus for purposes of Section 11 or 12 of the Securities Act of 1933, a amended, are deemed not filed for purposes of Section 18 of the Securities Exchange Act of 1934, as amended, and otherwise are not subject to liability under those sections.

management’s opinions only as of their respective dates. Except as required by law, we undertake no obligation to revise or publicly release the results of any revisions to forward-looking statements. The risks and uncertainties described in this report and in subsequent filings with the SEC are not the only ones we face. New factors emerge from time to time, and it is not possible for us to predict which will arise. There may be additional risks not presently known to us or that we currently believe are immaterial to our business. In addition, we cannot assess the impact of each factor on our business or the extent to which any factor, or combination of factors, may cause actual results to differ materially from those contained in any forward-looking statements . If any such risks occur, our business, operating results, liquidity, and financial condition could be materially affected in an adverse manner. You should consult any additional disclosures we have made or will make in our reports to the SEC on Forms 10-K, 10-Q, and 8-K, and any amendments thereto. All subsequent written and oral forward-looking statements attributable to us or persons acting on our behalf are expressly qualified in their entirety by the cautionary statements contained in this report.
23
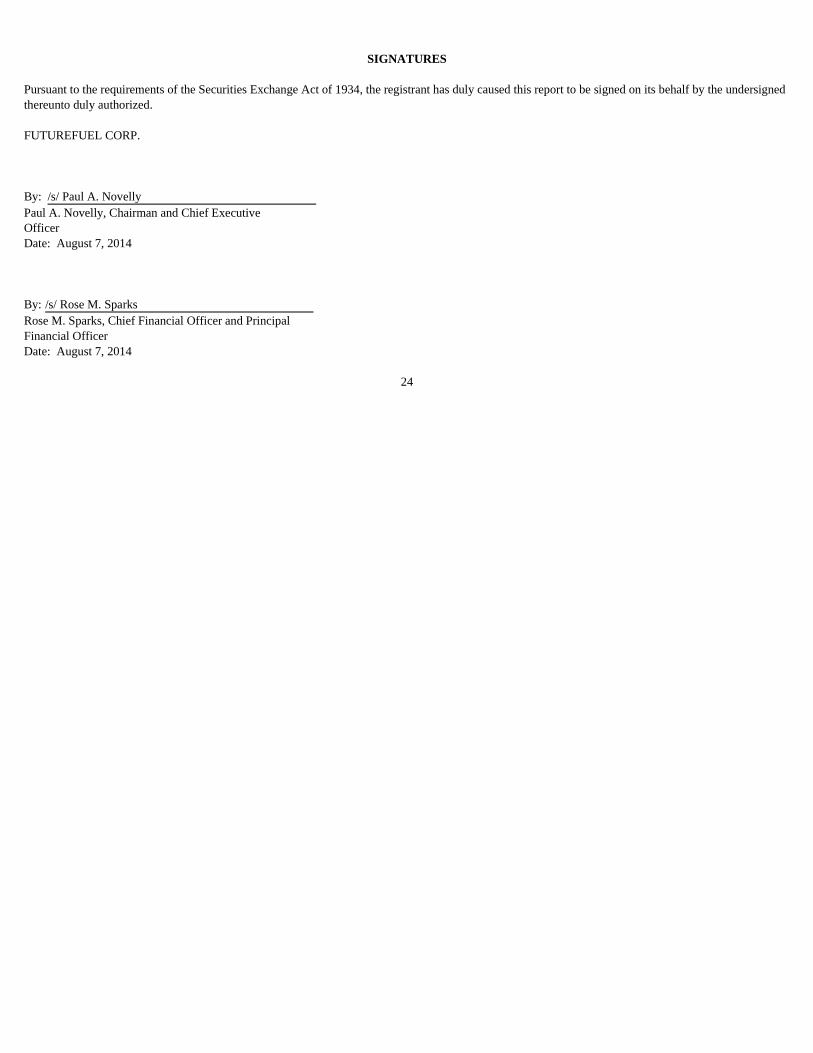
SIGNATURES
Pursuant to the requirements of the Securities Exchange Act of 1934, the registrant has duly caused this report to be signed on its behalf by the undersigned thereunto duly authorized. FUTUREFUEL CORP.
24
By: /s/ Paul A. Novelly Paul A. Novelly, Chairman and Chief Executive Officer
Date: August 7, 2014
By: /s/ Rose M. Sparks Rose M. Sparks, Chief Financial Officer and Principal Financial Officer
Date: August 7, 2014
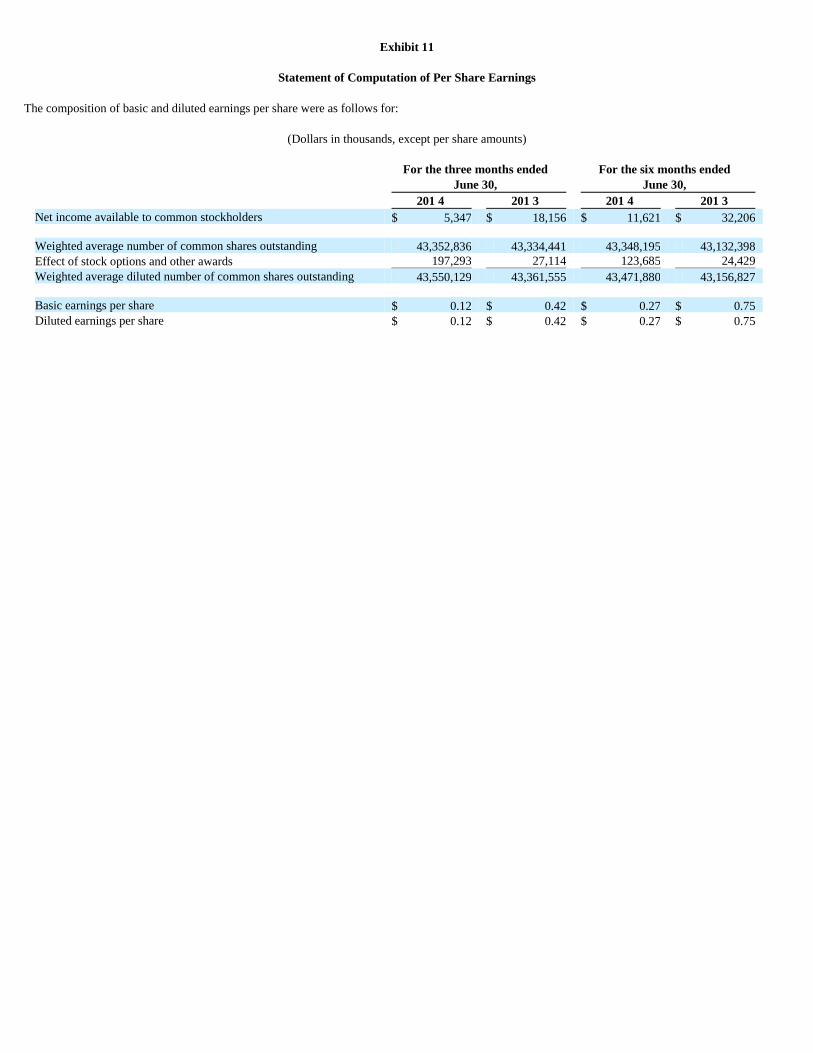
Exhibit 11
Statement of Computation of Per Share Earnings
The composition of basic and diluted earnings per share were as follows for:
(Dollars in thousands, except per share amounts)
For the three months ended
June 30, For the six months ended
June 30, 201 4 201 3 201 4 201 3 Net income available to common stockholders $ 5,347 $ 18,156 $ 11,621 $ 32,206 Weighted average number of common shares outstanding 43,352,836 43,334,441 43,348,195 43,132,398 Effect of stock options and other awards 197,293 27,114 123,685 24,429 Weighted average diluted number of common shares outstanding 43,550,129 43,361,555 43,471,880 43,156,827 Basic earnings per share $ 0.12 $ 0.42 $ 0.27 $ 0.75 Diluted earnings per share $ 0.12 $ 0.42 $ 0.27 $ 0.75

Exhibit 31(a) Certification
I, Paul A. Novelly, certify that:
Date: August 7, 2014
1. I have reviewed this report on Form 10-Q of FutureFuel Corp. (the “registrant”).
2. Based on my knowledge, this report does not contain any untrue statement of a material fact or omit to state a material fact necessary to make the statements made, in light of the circumstances under which such statements were made, not misleading with respect to the period covered by this report.
3. Based on my knowledge, the financial statements, and the other financial information included in this report, fairly present in all material respects the financial condition, results of operations and cash flows of the registrant as of, and for, the periods presented in this report.
4. The registrant’s other certifying officers and I are responsible for establishing and maintaining disclosure controls and procedures (as defined in Exchange Act Rules 13a-15(e) and 15d-15(e)) and internal control over financial reporting (as defined in Exchange Act Rules 13a-15(f) and 15d-15(f)) for the registrant and have:
(a) Designed such disclosure controls and procedures, or caused such disclosure controls and procedures to be designed under our supervision, to ensure that material information relating to the registrant, including its consolidated subsidiaries, is made known to us by others within those entities, particularly during the period in which this report is being prepared;
(b) Designed such internal control over financial reporting, or caused such internal control over financial reporting to be designed under my supervision, to provide reasonable assurance regarding the reliability of financial reporting and the preparation of financial statements for external purposes in accordance with generally accepted accounting principles;
(c) Evaluated the effectiveness of the registrant’s disclosure controls and procedures and presented in this report our conclusions about the effectiveness of the disclosure controls and procedures, as of the end of the period covered by this report based on such evaluation; and
(d) Disclosed in this report any change in the registrant’s internal control over financial reporting that occurred during the registrant’s most recent fiscal quarter that has materially affected, or is reasonably likely to materially effect, the registrant’s internal control over financial reporting.
5. The registrant’s other certifying officers and I have disclosed, based on our most recent evaluation of internal control over financial reporting, to the registrant’s auditors and the audit committee of the registrant’s board of directors:
(a) All significant deficiencies and material weaknesses in the design or operation of internal control over financial reporting which are reasonably likely to adversely affect the registrant’s ability to record, process, summarize and report financial information; and
(b) Any fraud, whether or not material, that involves management or other employees who have a significant role in the registrant’s internal control over financial reporting.
/s/ Paul A. Novelly Paul A. Novelly, Chairman and Chief Executive Officer
Exhibit 31(b) Certification
I, Rose M. Sparks, certify that:
Date: August 7, 2014
1. I have reviewed this report on Form 10-Q of FutureFuel Corp. (the “registrant”).
2. Based on my knowledge, this report does not contain any untrue statement of a material fact or omit to state a material fact necessary to make the statements made, in light of the circumstances under which such statements were made, not misleading with respect to the period covered by this report.
3. Based on my knowledge, the financial statements, and the other financial information included in this report, fairly present in all material respects the financial condition, results of operations and cash flows of the registrant as of, and for, the periods presented in this report.
4. The registrant’s other certifying officers and I are responsible for establishing and maintaining disclosure controls and procedures (as defined in Exchange Act Rules 13a-15(e) and 15d-15(e)) and internal control over financial reporting (as defined in Exchange Act Rules 13a-15(f) and 15d-15(f)) for the registrant and have:
(a) Designed such disclosure controls and procedures, or caused such disclosure controls and procedures to be designed under our supervision, to ensure that material information relating to the registrant, including its consolidated subsidiaries, is made known to us by others within those entities, particularly during the period in which this report is being prepared;
(b) Designed such internal control over financial reporting, or caused such internal control over financial reporting to be designed under my supervision, to provide reasonable assurance regarding the reliability of financial reporting and the preparation of financial statements for external purposes in accordance with generally accepted accounting principles;
(c) Evaluated the effectiveness of the registrant’s disclosure controls and procedures and presented in this report our conclusions about the effectiveness of the disclosure controls and procedures, as of the end of the period covered by this report based on such evaluation; and
(d) Disclosed in this report any change in the registrant’s internal control over financial reporting that occurred during the registrant’s most recent fiscal quarter that has materially affected, or is reasonably likely to materially effect, the registrant’s internal control over financial reporting.
5. The registrant’s other certifying officers and I have disclosed, based on our most recent evaluation of internal control over financial reporting, to the registrant’s auditors and the audit committee of the registrant’s board of directors:
(a) All significant deficiencies and material weaknesses in the design or operation of internal control over financial reporting which are reasonably likely to adversely affect the registrant’s ability to record, process, summarize and report financial information; and
(b) Any fraud, whether or not material, that involves management or other employees who have a significant role in the registrant’s internal control over financial reporting.
/s/ Rose M. Sparks Rose M. Sparks, Chief Financial Officer and Principal Financial Officer
Exhibit 32
Certification Pursuant to 18 U.S.C. §1350,
As Adopted Pursuant to §906 of the Sarbanes-Oxley Act of 2002
In connection with the Quarterly Report of Future Fuel Corp. (the “ Company ”) on Form 10-Q for the period ending June 30, 2014 as filed with the Securities and Exchange Commission on the date hereof (the “ Report ”), the undersigned hereby certify pursuant to 18 U.S.C. §1350, as adopted pursuant to §906 of the Sarbanes-Oxley Act of 2002, that:
1. The Report fully complies with the requirements of §13(a) of the Securities Exchange Act of 1934, as amended.
2. The information contained in the Report fairly presents, in all material respects, the financial condition and results of operations of the Company.
/s/ Paul A. Novelly Paul A. Novelly, Chairman and Chief Executive Officer
/s/ Rose M. Sparks Rose M. Sparks, Chief Financial Officer and Principal
Financial Officer
August 7, 2014