Embed Size (px)
Citation preview

Semi-Annual Shareholder Report
May 31, 2017
Share Class TickerA ISCAX
B ISCBX
C ISCCX
Institutional ISCIX
Federated InternationalSmall-Mid Company FundFund Established 1996
A Portfolio of Federated World Investment Series, Inc.
Dear Valued Shareholder,
I am pleased to present the Semi-Annual ShareholderReport for your fund covering the period fromDecember 1, 2016 through May 31, 2017. This reportincludes a complete listing of your fund’s holdings,performance information and financial statementsalong with other important fund information.
In addition, our website, FederatedInvestors.com,offers easy access to Federated resources that includetimely fund updates, economic and market insightsfrom our investment strategists, and financial planningtools. We invite you to register to take full advantageof its capabilities.
Thank you for investing with Federated. I hope youfind this information useful and look forward tokeeping you informed.
Sincerely,
J. Christopher Donahue, President
Not FDIC Insured • May Lose Value • No Bank Guarantee

CONTENTS
Portfolio of Investments Summary Tables . . . . . . . . . . . . . . . . . . . . . . . . . . . . . . . . . . . . . . . . . . . . . . . . . . . . . 1
Portfolio of Investments. . . . . . . . . . . . . . . . . . . . . . . . . . . . . . . . . . . . . . . . . . . . . . . . . . . . . . . . . . . . . . . . . . . . . . . . . . 3
Financial Highlights . . . . . . . . . . . . . . . . . . . . . . . . . . . . . . . . . . . . . . . . . . . . . . . . . . . . . . . . . . . . . . . . . . . . . . . . . . . . . . 10
Statement of Assets and Liabilities. . . . . . . . . . . . . . . . . . . . . . . . . . . . . . . . . . . . . . . . . . . . . . . . . . . . . . . . . . . . . 14
Statement of Operations. . . . . . . . . . . . . . . . . . . . . . . . . . . . . . . . . . . . . . . . . . . . . . . . . . . . . . . . . . . . . . . . . . . . . . . . . 16
Statement of Changes in Net Assets. . . . . . . . . . . . . . . . . . . . . . . . . . . . . . . . . . . . . . . . . . . . . . . . . . . . . . . . . . . 17
Notes to Financial Statements . . . . . . . . . . . . . . . . . . . . . . . . . . . . . . . . . . . . . . . . . . . . . . . . . . . . . . . . . . . . . . . . . . 18
Shareholder Expense Example . . . . . . . . . . . . . . . . . . . . . . . . . . . . . . . . . . . . . . . . . . . . . . . . . . . . . . . . . . . . . . . . . 30
Evaluation and Approval of Advisory Contract . . . . . . . . . . . . . . . . . . . . . . . . . . . . . . . . . . . . . . . . . . . . . . . . 32
Voting Proxies on Fund Portfolio Securities . . . . . . . . . . . . . . . . . . . . . . . . . . . . . . . . . . . . . . . . . . . . . . . . . . . 38
Quarterly Portfolio Schedule . . . . . . . . . . . . . . . . . . . . . . . . . . . . . . . . . . . . . . . . . . . . . . . . . . . . . . . . . . . . . . . . . . . . 38

Portfolio of Investments Summary Tables (unaudited)At May 31, 2017, the Fund’s portfolio composition1 was as follows:
CountryPercentage of
Total Net Assets
Japan 20.8%
United Kingdom 12.0%
France 9.2%
Germany 8.5%
Canada 5.1%
Italy 3.8%
Switzerland 3.8%
Spain 3.3%
Mexico 3.1%
Ireland 2.5%
Netherlands 2.5%
Sweden 2.2%
Thailand 2.1%
Brazil 1.9%
United States 1.9%
Hong Kong 1.9%
Australia 1.7%
Denmark 1.7%
South Korea 1.7%
Russia 1.0%
Austria 1.0%
Luxembourg 1.0%
Belgium 0.9%
Israel 0.7%
Cayman Islands 0.7%
India 0.5%
Cash Equivalents2 5.3%
Derivative Contracts3 (0.1)%
Other Assets and Liabilities—Net4 (0.7)%
TOTAL 100.0%
Semi-Annual Shareholder Report1

At May 31, 2017, the Fund’s sector classification composition5 was as follows:
Sector ClassificationPercentage of
Total Net Assets
Industrials 20.0%
Financials 13.1%
Consumer Discretionary 17.0%
Information Technology 11.4%
Health Care 9.4%
Consumer Staples 6.7%
Materials 6.6%
Real Estate 4.1%
Telecommunication Services 3.1%
Energy 2.8%
Utilities 0.9%
Commodity 0.4%
Cash Equivalents2 5.3%
Derivative Contracts3 (0.1)%
Other Assets and Liabilities—Net4 (0.7)%
TOTAL 100.0%
1 Country allocations are based primarily on the country in which a company is incorporated. However, theFund’s Adviser may allocate a company to a country based on other factors such as location of thecompany’s principal office, the location of the principal trading market for the company’s securities orthe country where a majority of the company’s revenues are derived.
2 Cash Equivalents include any investments in money market mutual funds and/or overnightrepurchase agreements.
3 Based upon net unrealized appreciation (depreciation) or value of the derivative contracts as applicable.Derivative Contracts may consist of futures, forwards, options and swaps. The impact of a derivativecontract on the Fund’s performance may be larger than its unrealized appreciation (depreciation) orvalue may indicate. In many cases, the notional value or amount of a derivative contract may provide abetter indication of the contract’s significance to the portfolio. More complete information regardingthe Fund’s direct investments in derivative contracts, including unrealized appreciation (depreciation),value, and notional values or amounts of such contracts, can be found in the table at the end of thePortfolio of Investments included in this Report.
4 Assets, other than investments in securities and derivative contracts, less liabilities. See Statement ofAssets and Liabilities.
5 Except for Cash Equivalents and Other Assets and Liabilities, sector classifications are based upon, andindividual securities assigned to, the classifications of the Global Industry Classification Standard (GICS)except that the Adviser assigns a classification to securities not classified by the GICS and to securitiesfor which the Adviser does not have access to the classification made by the GICS.
Semi-Annual Shareholder Report2

Portfolio of InvestmentsMay 31, 2017 (unaudited)
SharesValue in
U.S. Dollars
COMMON STOCKS—95.1%
Australia—1.7%
129,151 Link Administration Holdings Ltd. $ 743,030
57,000 Orica Ltd. 832,010
564,184 Viva Energy REIT Ltd. 1,010,296
TOTAL 2,585,336
Austria—1.0%
42,573 Erste Group Bank AG 1,545,401
Belgium—0.9%
129,081 1X-Fab Silicon Foundries SE 1,319,535
Brazil—1.9%
140,261 1Centro de Imagem Diagnosticos SA (Alliar) 768,500
105,000 Localiza Rent A Car SA 1,410,838
34,000 Raia Drogasil SA 756,501
TOTAL 2,935,839
Canada—4.7%
34,400 Canadian Western Bank 618,046
310,689 Eldorado Gold Corp. 940,680
201,183 1Mitel Networks Corp. 1,425,267
53,700 North West Co., Inc./The 1,283,219
91,000 Pason Systems, Inc. 1,313,617
200,000 1Precision Drilling Corp. 725,469
126,000 Whitecap Resources, Inc. 854,395
TOTAL 7,160,693
Cayman Islands—0.7%
714,000 Nexteer Automotive Group Ltd. 1,091,112
Denmark—1.7%
24,000 Chr.Hansen Holding 1,681,244
44,085 1,2,3NETS A/S 883,717
TOTAL 2,564,961
France—9.2%
48,552 Accor SA 2,307,086
22,274 1Advanced Accelerator Applications SA, ADR 841,512
17,871 1Criteo SA, ADR 936,977
63,000 Edenred 1,662,630
5,400 Iliad SA 1,401,707
Semi-Annual Shareholder Report3

SharesValue in
U.S. Dollars
COMMON STOCKS—continued
France—continued
16,700 Ipsen SA $ 2,106,145
18,647 Publicis Groupe 1,428,587
45,000 STMicroelectronics NV 743,066
13,680 Teleperformance 1,790,663
69,500 Television Francaise 1 SA TF1 893,150
TOTAL 14,111,523
Germany—8.5%
14,500 Deutsche Boerse AG 1,506,928
80,898 2,3Deutsche Pfandbriefbank AG 1,031,630
32,500 Deutsche Wohnen AG 1,274,742
192,899 Deutz AG 1,562,747
13,963 GEA Group AG 574,263
15,464 HeidelbergerCement AG 1,440,656
108,837 Kloeckner & Co. AG 1,152,048
15,745 Osram Licht AG 1,206,909
24,233 Rheinmetall AG 2,325,057
9,000 1Siltronic AG 807,315
TOTAL 12,882,295
Hong Kong—1.9%
42,000 Melco Resorts & Entertainment, ADR 948,360
407,500 Techtronic Industries Co. 1,928,366
TOTAL 2,876,726
India—0.5%
130,000 Jyothy Laboratories Ltd. 737,591
Ireland—2.5%
76,247 1Grafton Group PLC 764,607
17,200 Kerry Group PLC, Class A 1,507,568
56,965 Smurfit Kappa Group PLC 1,606,745
TOTAL 3,878,920
Israel—0.7%
14,454 NICE Ltd., ADR 1,126,111
Italy—3.8%
157,429 2,3Anima Holding SPA 1,002,413
7,000 DiaSorin SPA 542,331
267,029 2,3Enav SPA 1,125,681
151,881 2,3Infrastrutture Wireless Italiane SPA 900,810
Semi-Annual Shareholder Report4

SharesValue in
U.S. Dollars
COMMON STOCKS—continued
Italy—continued
81,015 1Yoox Net-A-Porter Group $ 2,265,224
TOTAL 5,836,459
Japan—20.8%
35,600 Aisin Seiki Co. 1,756,510
25,500 Alps Electric Co. 717,646
70,600 Chugai Pharmaceutical Co. Ltd. 2,696,464
68,900 Daifuku Co. 2,101,725
9,300 Disco Corp. 1,605,705
46,000 Don Quijote Holdings Co. Ltd. 1,800,168
61,000 Doutor Nichires Holdings Co. Ltd. 1,307,533
30,100 Horiba Ltd. 1,845,077
1,620 Japan Hotel REIT Investment Corp. 1,174,734
63,400 JSR Corp. 1,064,830
41,300 Kakaku.com, Inc. 588,454
42,200 Kanamoto Co. Ltd. 1,159,601
19,600 Kusuri No Aoki Holdings Co. Ltd. 952,444
57,300 Kyowa Hakko Kirin Co., Ltd. 980,909
18,600 Matsumotokiyoshi Holdings Co. Ltd. 1,088,873
11,300 Nidec Corp. 1,120,841
12,000 Nitori Holdings Co., Ltd. 1,754,712
38,500 Sompo Japan Nipponkoa Holdings, Inc. 1,488,701
55,600 Square Enix Holdings Co. Ltd. 1,763,366
62,000 Taiyo Nippon Sanso Corp. 630,004
54,800 Temp Holdings Co., Ltd. 1,082,795
50,800 THK Co. Ltd. 1,421,092
7,400 Tsuruha Holdings, Inc. 821,042
30,000 United Arrows Ltd. 906,411
TOTAL 31,829,637
Luxembourg—1.0%
86,199 SAF-Holland SA 1,504,555
Mexico—3.1%
105,000 Gruma SA, Class B 1,366,250
9,800 Grupo Aeroportuario del Sureste SAB de CV, Class B, ADR 1,934,324
291,316 Infraestructura Energetica Nova, SAB de C.V 1,357,996
TOTAL 4,658,570
Netherlands—2.5%
55,534 2,3ABN AMRO Group NV, GDR 1,430,560
Semi-Annual Shareholder Report5

SharesValue in
U.S. Dollars
COMMON STOCKS—continued
Netherlands—continued
50,869 2,3Intertrust NV $ 1,057,037
36,238 NN Group NV 1,303,306
TOTAL 3,790,903
Russia—1.0%
360,000 Moscow Exchange MICEX-RTS PJSC 642,318
26,000 1,2,3X5 Retail Group NV, GDR 941,883
TOTAL 1,584,201
South Korea—1.7%
18,300 Korea Aerospace Industry 1,039,471
6,400 Mando Corp. 1,474,774
TOTAL 2,514,245
Spain—3.3%
114,234 2,3Cellnex Telecom SAU 2,393,635
44,000 Cia de Distribucion Integral Logista Holdings 1,188,027
119,000 Merlin Properties SOCIMI SA 1,509,464
TOTAL 5,091,126
Sweden—2.2%
90,000 1Boozt AB 802,518
156,861 2,3Hoist Finance AB 1,594,055
125,000 Net Entertainment NE AB 1,021,960
TOTAL 3,418,533
Switzerland—3.8%
8,300 1Dufry AG 1,367,393
16,607 1,2,3Galenica Sante Ltd. 777,582
25,882 Julius Baer Group Ltd. 1,340,734
4,600 Lonza Group AG 953,091
6,900 Tecan AG 1,304,306
TOTAL 5,743,106
Thailand—2.1%
650,000 Central Pattana PCL, GDR 1,259,516
1,500,000 CH. Karnchang Public Co. Ltd., GDR 1,200,025
735,000 Minor International PCL, GDR 809,693
TOTAL 3,269,234
United Kingdom—12.0%
63,500 1Anglo American PLC 862,561
97,997 Ashtead Group PLC 1,980,480
19,600 1ASOS PLC 1,626,362
Semi-Annual Shareholder Report6

SharesValue in
U.S. Dollars
COMMON STOCKS—continued
United Kingdom—continued
58,059 Babcock International Group PLC $ 698,431
280,000 Booker Group PLC 719,852
21,082 Croda International PLC 1,077,794
20,205 1Dialog Semiconductor PLC 965,567
57,745 London Stock Exchange Group PLC 2,550,247
161,450 PageGroup PLC 979,664
15,010 Rightmove PLC 838,817
29,900 Shire PLC 1,722,334
140,763 St. James’s Place Capital PLC 2,129,691
532,567 1Vectura Group PLC 807,815
148,282 Wood Group (John) PLC 1,371,267
TOTAL 18,330,882
United States—1.9%
19,000 1Arch Capital Group Ltd. 1,847,750
18,355 1Livanova PLC 1,043,298
TOTAL 2,891,048
TOTAL COMMON STOCKS(IDENTIFIED COST $112,088,592) 145,278,542
EXCHANGE-TRADED FUND—0.4%
Canada—0.4%
58,054 1Sprott Physical Gold Trust(IDENTIFIED COST $641,787) 600,278
INVESTMENT COMPANY—5.3%
8,031,740 4Federated Institutional Prime Value Obligations Fund,Institutional Shares, 1.00%5
(IDENTIFIED COST $8,033,516) 8,034,150
TOTAL INVESTMENTS—100.8%(IDENTIFIED COST $120,763,895)6 153,912,970
OTHER ASSETS AND LIABILITIES - NET—(0.8)%7 (1,225,012)
TOTAL NET ASSETS—100% $152,687,958
Semi-Annual Shareholder Report7

At May 31, 2017, the Fund had the following outstanding foreign exchange contracts:
Settlement Date Counterparty
Foreign CurrencyUnits to
Receive/Deliver
InExchange
For
UnrealizedAppreciation
(Depreciation)
Contracts Purchased:
6/1/2017 BNY Mellon 1,345,231 CHF $1,384,090 $ 4,822
Contracts Sold:
6/1/2017 BNY Mellon 676,083 EUR $ 758,443 $ (1,039)
6/2/2017 BNY Mellon 18,016 GBP $ 23,139 $ (74)
6/2/2017 BNY Mellon 2,350,080 RUB $ 41,269 $ (164)
6/2/2017 BNY Mellon 239,063 SEK $ 27,419 $ (87)
6/5/2017 BNY Mellon 8,696 GBP $ 11,167 $ (40)
6/5/2017 BNY Mellon 430,623 JPY $ 3,884 $ (5)
8/15/2017 Credit Agricole 5,465,000 EUR $5,998,247 $(166,357)
NET UNREALIZED DEPRECIATION ON FOREIGN EXCHANGE CONTRACTS $(162,944)
Net Unrealized Depreciation on Foreign Exchange Contracts is included in “Other Assets andLiabilities—Net.”1 Non-income-producing security.2 Denotes a restricted security that either: (a) cannot be offered for public sale without first being
registered, or being able to take advantage of an exemption from registration, under the Securities Actof 1933; or (b) is subject to a contractual restriction on public sales. At May 31, 2017, these restrictedsecurities amounted to $13,139,003, which represented 8.6% of total net assets.
3 Denotes a restricted security that may be resold without restriction to “qualified institutional buyers” asdefined in Rule 144A under the Securities Act of 1933 and that the Fund has determined to be liquidunder criteria established by the Fund’s Board of Directors (the “Directors”). At May 31, 2017, theseliquid restricted securities amounted to $13,139,003, which represented 8.6% of total net assets.
4 Affiliated holding.5 7-day net yield.6 Also represents cost for federal tax purposes.7 Assets, other than investments in securities, less liabilities. See Statement of Assets and Liabilities.
Note: The categories of investments are shown as a percentage of total net assets atMay 31, 2017.
Various inputs are used in determining the value of the Fund’s investments. These inputs aresummarized in the three broad levels listed below:
Level 1—quoted prices in active markets for identical securities.Level 2—other significant observable inputs (including quoted prices for similar securities,interest rates, prepayment speeds, credit risk, etc.). Also includes securities valued atamortized cost.Level 3—significant unobservable inputs (including the Fund’s own assumptions indetermining the fair value of investments).
Semi-Annual Shareholder Report8

The inputs or methodology used for valuing securities are not an indication of the riskassociated with investing in those securities.
The following is a summary of the inputs used, as of May 31, 2017, in valuing the Fund’s assetscarried at fair value:
Valuation Inputs
Level 1—QuotedPrices
Level 2—Other
SignificantObservable
Inputs
Level 3—Significant
UnobservableInputs Total
Equity Securities:
Common Stocks
International $21,499,110 $123,779,432 $— $145,278,542
Exchange-Traded Fund 600,278 — — 600,278
Investment Company 8,034,150 — — 8,034,150
TOTAL SECURITIES $30,133,538 $123,779,432 $— $153,912,970
Other Financial Instruments:1
Assets $ 4,822 $ — $— $ 4,822
Liabilities (1,290) (166,476) — (167,766)
TOTAL OTHERFINANCIAL INSTRUMENTS $ 3,532 $ (166,476) $— $ (162,944)
1 Other financial instruments include foreign exchange contracts.
The following acronyms are used throughout this portfolio:
ADR —American Depositary ReceiptCHF —Swiss FrancEUR —EuroGBP —British PoundGDR —Global Depositary ReceiptJPY —Japanese YenPJSC—Public Joint Stock CompanyREIT —Real Estate Investment TrustRUB —Russian RubleSEK —Swedish Krona
See Notes which are an integral part of the Financial Statements
Semi-Annual Shareholder Report9
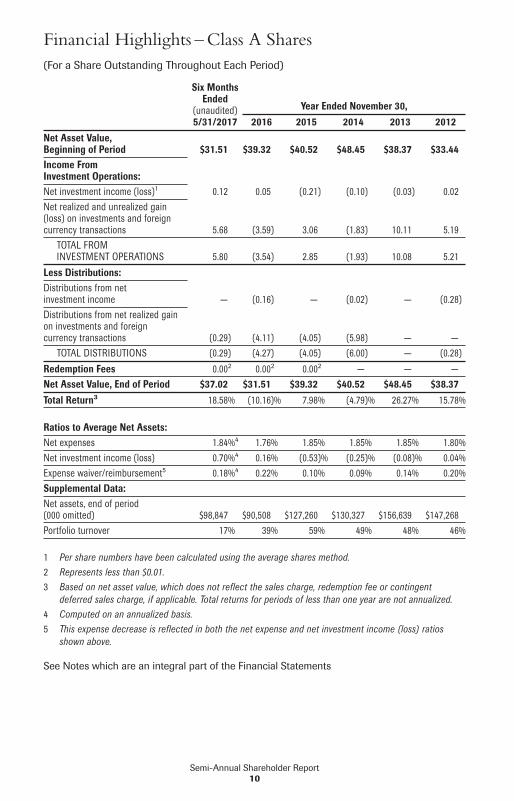
Financial Highlights – Class A Shares(For a Share Outstanding Throughout Each Period)
Six MonthsEnded
(unaudited)5/31/2017
Year Ended November 30,2016 2015 2014 2013 2012
Net Asset Value,Beginning of Period $31.51 $39.32 $40.52 $48.45 $38.37 $33.44Income FromInvestment Operations:Net investment income (loss)1 0.12 0.05 (0.21) (0.10) (0.03) 0.02Net realized and unrealized gain(loss) on investments and foreigncurrency transactions 5.68 (3.59) 3.06 (1.83) 10.11 5.19
TOTAL FROMINVESTMENT OPERATIONS 5.80 (3.54) 2.85 (1.93) 10.08 5.21
Less Distributions:Distributions from netinvestment income — (0.16) — (0.02) — (0.28)Distributions from net realized gainon investments and foreigncurrency transactions (0.29) (4.11) (4.05) (5.98) — —
TOTAL DISTRIBUTIONS (0.29) (4.27) (4.05) (6.00) — (0.28)
Redemption Fees 0.002 0.002 0.002 — — —Net Asset Value, End of Period $37.02 $31.51 $39.32 $40.52 $48.45 $38.37Total Return3 18.58% (10.16)% 7.98% (4.79)% 26.27% 15.78%
Ratios to Average Net Assets:Net expenses 1.84%4 1.76% 1.85% 1.85% 1.85% 1.80%Net investment income (loss) 0.70%4 0.16% (0.53)% (0.25)% (0.08)% 0.04%Expense waiver/reimbursement5 0.18%4 0.22% 0.10% 0.09% 0.14% 0.20%Supplemental Data:Net assets, end of period(000 omitted) $98,847 $90,508 $127,260 $130,327 $156,639 $147,268Portfolio turnover 17% 39% 59% 49% 48% 46%
1 Per share numbers have been calculated using the average shares method.2 Represents less than $0.01.3 Based on net asset value, which does not reflect the sales charge, redemption fee or contingent
deferred sales charge, if applicable. Total returns for periods of less than one year are not annualized.4 Computed on an annualized basis.5 This expense decrease is reflected in both the net expense and net investment income (loss) ratios
shown above.
See Notes which are an integral part of the Financial Statements
Semi-Annual Shareholder Report10

Financial Highlights – Class B Shares(For a Share Outstanding Throughout Each Period)
Six MonthsEnded
(unaudited)5/31/2017
Year Ended November 30,2016 2015 2014 2013 2012
Net Asset Value,Beginning of Period $25.22 $32.39 $34.34 $42.26 $33.73 $29.37Income FromInvestment Operations:Net investment income (loss)1 (0.02) (0.18) (0.42) (0.39) (0.33) (0.24)Net realized and unrealized gain (loss) oninvestments and foreigncurrency transactions 4.53 (2.88) 2.52 (1.53) 8.86 4.60
TOTAL FROMINVESTMENT OPERATIONS 4.51 (3.06) 2.10 (1.92) 8.53 4.36
Less Distributions:Distributions from net investment income — — — (0.02) — —Distributions from net realized gain oninvestments and foreigncurrency transactions (0.29) (4.11) (4.05) (5.98) — —
TOTAL DISTRIBUTIONS (0.29) (4.11) (4.05) (6.00) — —
Redemption Fees 0.002 0.002 0.002 — — —Net Asset Value, End of Period $29.44 $25.22 $32.39 $34.34 $42.26 $33.73Total Return3 18.09% (10.88)% 7.14% (5.57)% 25.29% 14.85%
Ratios to Average Net Assets:Net expenses 2.64%4 2.57% 2.65% 2.65% 2.65% 2.60%Net investment income (loss) (0.17)%4 (0.67)% (1.30)% (1.04)% (0.89)% (0.76)%Expense waiver/reimbursement5 0.13%4 0.17% 0.05% 0.04% 0.09% 0.16%Supplemental Data:Net assets, end of period (000 omitted) $1,585 $1,955 $3,413 $4,363 $7,398 $7,725Portfolio turnover 17% 39% 59% 49% 48% 46%
1 Per share numbers have been calculated using the average shares method.2 Represents less than $0.01.3 Based on net asset value, which does not reflect the sales charge, redemption fee or contingent
deferred sales charge, if applicable. Total returns for the periods of less than one year arenot annualized.
4 Computed on an annualized basis.5 This expense decrease is reflected in both the net expense and net investment income (loss) ratios
shown above.
See Notes which are an integral part of the Financial Statements
Semi-Annual Shareholder Report11

Financial Highlights – Class C Shares(For a Share Outstanding Throughout Each Period)
Six MonthsEnded
(unaudited)5/31/2017
Year Ended November 30,2016 2015 2014 2013 2012
Net Asset Value, Beginning of Period $25.19 $32.36 $34.31 $42.22 $33.70 $29.35Income From Investment Operations:Net investment income (loss)1 (0.02) (0.17) (0.43) (0.38) (0.33) (0.24)Net realized and unrealized gain (loss) oninvestments and foreigncurrency transactions 4.53 (2.89) 2.53 (1.53) 8.85 4.59
TOTAL FROMINVESTMENT OPERATIONS 4.51 (3.06) 2.10 (1.91) 8.52 4.35
Less Distributions:Distributions from net investment income — — — (0.02) — —Distributions from net realized gain oninvestments and foreigncurrency transactions (0.29) (4.11) (4.05) (5.98) — —
TOTAL DISTRIBUTIONS (0.29) (4.11) (4.05) (6.00) — —
Redemption Fees 0.002 0.002 0.002 — — —Net Asset Value, End of Period $29.41 $25.19 $32.36 $34.31 $42.22 $33.70Total Return3 18.11% (10.89)% 7.15% (5.55)% 25.28% 14.82%
Ratios to Average Net Assets:Net expenses 2.64%4 2.56% 2.65% 2.65% 2.65% 2.60%Net investment income (loss) (0.13)%4 (0.64)% (1.33)% (1.05)% (0.88)% (0.74)%Expense waiver/reimbursement5 0.13%4 0.17% 0.05% 0.04% 0.09% 0.16%Supplemental Data:Net assets, end of period (000 omitted) $15,497 $17,028 $22,681 $23,453 $27,858 $25,100Portfolio turnover 17% 39% 59% 49% 48% 46%
1 Per share numbers have been calculated using the average shares method.2 Represents less than $0.01.3 Based on net asset value, which does not reflect the sales charge, redemption fee or contingent
deferred sales charge, if applicable. Total returns for the periods of less than one year arenot annualized.
4 Computed on an annualized basis.5 This expense decrease is reflected in both the net expense and net investment income (loss) ratios
shown above.
See Notes which are an integral part of the Financial Statements
Semi-Annual Shareholder Report12

Financial Highlights – Institutional Shares(For a Share Outstanding Throughout Each Period)
Six MonthsEnded
(unaudited)5/31/2017
Year Ended November 30,2016 2015 2014 2013 2012
Net Asset Value, Beginning of Period $32.06 $39.95 $41.01 $48.88 $38.63 $33.70Income From Investment Operations:Net investment income (loss)1 0.16 0.12 (0.13) (0.02) 0.05 0.10Net realized and unrealized gain (loss) oninvestments and foreigncurrency transactions 5.78 (3.66) 3.12 (1.85) 10.20 5.20
TOTAL FROMINVESTMENT OPERATIONS 5.94 (3.34) 2.99 (1.87) 10.25 5.30
Less Distributions:Distributions from net investment income — (0.24) — (0.02) — (0.37)Distributions from net realized gain oninvestments and foreigncurrency transactions (0.29) (4.11) (4.05) (5.98) — —
TOTAL DISTRIBUTIONS (0.29) (4.35) (4.05) (6.00) — (0.37)
Redemption Fees 0.002 0.002 0.002 — — —Net Asset Value, End of Period $37.71 $32.06 $39.95 $41.01 $48.88 $38.63Total Return3 18.69% (10.00)% 8.25% (4.61)% 26.53% 15.97%
Ratios to Average Net Assets:Net expenses 1.64%4 1.56% 1.65% 1.66% 1.65% 1.60%Net investment income (loss) 0.92%4 0.34% (0.33)% (0.04)% 0.13% 0.25%Expense waiver/reimbursement5 0.13%4 0.17% 0.05% 0.04% 0.09% 0.15%Supplemental Data:Net assets, end of period (000 omitted) $36,759 $31,981 $38,830 $32,174 $28,847 $21,175Portfolio turnover 17% 39% 59% 49% 48% 46%
1 Per share numbers have been calculated using the average shares method.2 Represents less than $0.01.3 Based on the net asset value, which does not reflect the sales charge, redemption fee or contingent
deferred sales charge, if applicable. Total returns for the periods of less than one year arenot annualized.
4 Computed on an annualized basis.5 This expense decrease is reflected in both the net expense and net investment income (loss) ratios
shown above.
See Notes which are an integral part of the Financial Statements
Semi-Annual Shareholder Report13

Assets:
Total investment in securities, at value including $8,034,150 of investment in anaffiliated holding (Note 5) (identified cost $120,763,895) $153,912,970
Cash denominated in foreign currencies (identified cost $145,899) 146,167
Receivable for investments sold 2,970,702
Income receivable 571,002
Receivable for shares sold 61,293
Unrealized appreciation on foreign exchange contracts 4,822
TOTAL ASSETS 157,666,956
Liabilities:
Payable for investments purchased $4,242,147
Payable for shares redeemed 350,647
Unrealized depreciation on foreign exchange contracts 167,766
Payable for capital gains taxes withheld 51,665
Payable for distribution services fee (Note 5) 28,156
Payable for investment adviser fee (Note 5) 4,837
Payable for other service fees (Notes 2 and 5) 2,637
Payable for administrative fee (Note 5) 327
Payable for Directors’/Trustees’ fees (Note 5) 275
Accrued expenses (Note 5) 130,541
TOTAL LIABILITIES 4,978,998
Net assets for 4,225,318 shares outstanding $152,687,958
Net Assets Consists of:
Paid-in capital $116,475,650
Net unrealized appreciation of investments and translation of assets andliabilities in foreign currency 32,980,760
Accumulated net realized gain on investments and foreigncurrency transactions 3,391,283
Distributions in excess of net investment income (159,735)
TOTAL NET ASSETS $152,687,958
Statement of Assets and LiabilitiesMay 31, 2017 (unaudited)
Semi-Annual Shareholder Report14

Net Asset Value, Offering Price and Redemption Proceeds Per Share:
Class A Shares:
Net asset value per share ($98,847,405 ÷ 2,669,896 shares outstanding)$0.001 par value, 500,000,000 shares authorized $37.02
Offering price per share (100/94.50 of $37.02) $39.17
Redemption proceeds per share (98.00/100 of $37.02) $36.28
Class B Shares:
Net asset value per share ($1,585,405 ÷ 53,845 shares outstanding)$0.001 par value, 100,000,000 shares authorized $29.44
Offering price per share $29.44
Redemption proceeds per share (92.50/100 of $29.44) $27.23
Class C Shares:
Net asset value per share ($15,496,509 ÷ 526,906 shares outstanding)$0.001 par value, 100,000,000 shares authorized $29.41
Offering price per share $29.41
Redemption proceeds per share (97.00/100 of $29.41) $28.53
Institutional Shares:
Net asset value per share ($36,758,639 ÷ 974,671 shares outstanding)$0.001 par value, 200,000,000 shares authorized $37.71
Offering price per share $37.71
Redemption proceeds per share (98.00/100 of $37.71) $36.96
See Notes which are an integral part of the Financial Statements
Statement of Assets and Liabilities – continued
Semi-Annual Shareholder Report15

Investment Income:
Dividends (including $20,689 received from an affiliated holding(Note 5) and net of foreign taxes withheld of $166,932) $ 1,830,740
Expenses:
Investment adviser fee (Note 5) $ 899,569
Administrative fee (Note 5) 56,497
Custodian fees 35,036
Transfer agent fees 130,105
Directors’/Trustees’ fees (Note 5) 1,798
Auditing fees 16,604
Legal fees 5,889
Distribution services fee (Note 5) 184,111
Other service fees (Notes 2 and 5) 23,088
Portfolio accounting fees 68,128
Share registration costs 30,529
Printing and postage 18,083
Miscellaneous (Note 5) 14,365
TOTAL EXPENSES 1,483,802
Waivers and Reimbursements:
Waiver/reimbursement of investment adviser fee (Note 5) $(87,796)
Waiver/reimbursement of other operating expenses (Notes 2 and 5) (28,618)
TOTAL WAIVERS AND REIMBURSEMENT (116,414)
Net expenses 1,367,388
Net investment income 463,352
Realized and Unrealized Gain on Investments and ForeignCurrency Transactions:
Net realized gain on investments and foreign currency transactions 3,391,283
Net change in unrealized appreciation of investments andtranslation of assets and liabilities in foreign currency transactions 20,864,544
Net realized and unrealized gain on investments and foreigncurrency transactions 24,255,827
Change in net assets resulting from operations $24,719,179
See Notes which are an integral part of the Financial Statements
Statement of OperationsSix Months Ended May 31, 2017 (unaudited)
Semi-Annual Shareholder Report16

Six MonthsEnded
(unaudited)5/31/2017
Year Ended11/30/2016
Increase (Decrease) in Net Assets
Operations:
Net investment income $ 463,352 $ 146,815
Net realized gain on investments, futures contracts and foreigncurrency transactions 3,391,283 2,216,550
Net change in unrealized appreciation/depreciation of investments, futurescontracts and translation of assets and liabilities in foreign currency 20,864,544 (20,660,358)
CHANGE IN NET ASSETS RESULTING FROM OPERATIONS 24,719,179 (18,296,993)
Distributions to Shareholders:
Distributions from net investment income
Class A Shares — (500,206)
Class B Shares — —
Class C Shares — —
Institutional Shares — (237,208)
Distributions from net realized gain on investments
Class A Shares (820,119) (13,155,301)
Class B Shares (21,707) (399,375)
Class C Shares (190,987) (2,844,113)
Institutional Shares (287,702) (4,102,385)
CHANGE IN NET ASSETS RESULTING FROM DISTRIBUTIONSTO SHAREHOLDERS (1,320,515) (21,238,588)
Share Transactions:
Proceeds from sale of shares 7,560,767 19,790,000
Net asset value of shares issued to shareholders in payment ofdistributions declared 1,187,953 19,216,463
Cost of shares redeemed (20,932,455) (50,183,847)
CHANGE IN NET ASSETS RESULTING FROM SHARE TRANSACTIONS (12,183,735) (11,177,384)
Redemption fees 1,599 742
Change in net assets 11,216,528 (50,712,223)
Net Assets:
Beginning of period 141,471,430 192,183,653
End of period (including distributions in excess of net investment income of$(159,735) and $(623,087), respectively) $152,687,958 $141,471,430
See Notes which are an integral part of the Financial Statements
Statement of Changes in Net Assets
Semi-Annual Shareholder Report17

Notes to Financial StatementsMay 31, 2017 (unaudited)
1. ORGANIZATIONFederated World Investment Series, Inc. (the “Corporation”) is registered under the InvestmentCompany Act of 1940, as amended (the “Act”), as an open-end management investmentcompany. The Corporation consists of three portfolios. The financial statements includedherein are only those of Federated International Small-Mid Company Fund (the “Fund”), adiversified portfolio. The financial statements of the other portfolios are presented separately.The assets of each portfolio are segregated and a shareholder’s interest is limited to theportfolio in which shares are held. Each portfolio pays its own expenses. The Fund offers fourclasses of shares: Class A Shares, Class B Shares, Class C Shares and Institutional Shares. Allshares of the Fund have equal rights with respect to voting, except on class-specific matters.Class B Shares were closed to new accounts/investors on June 1, 2015, and to newpurchases/exchanges by existing shareholders on August 1, 2015. The investment objective ofthe Fund is to provide long-term growth of capital.
On March 30, 2017, the Fund’s T Shares class became effective with the Securities andExchange Commission (SEC) but is not offered for sale.
2. SIGNIFICANT ACCOUNTING POLICIESThe following is a summary of significant accounting policies consistently followed by theFund in the preparation of its financial statements. These policies are in conformity withU.S. generally accepted accounting principles (GAAP).
Investment ValuationIn calculating its net asset value (NAV), the Fund generally values investments as follows:� Equity securities listed on an exchange or traded through a regulated market system are
valued at their last reported sale price or official closing price in their principal exchangeor market.
� Shares of other mutual funds or non-exchange-traded investment companies are valuedbased upon their reported NAVs.
� Fixed-income securities are fair valued using price evaluations provided by a pricing serviceapproved by the Directors.
� Derivative contracts listed on exchanges are valued at their reported settlement or closingprice, except that options are valued at the mean of closing bid and asked quotations.
� Over-the-counter (OTC) derivative contracts are fair valued using price evaluations providedby a pricing service approved by the Directors.
� For securities that are fair valued in accordance with procedures established by and underthe general supervision of the Directors, certain factors may be considered such as: the lasttraded or purchase price of the security, information obtained by contacting the issuer ordealers, analysis of the issuer’s financial statements or other available documents,fundamental analytical data, the nature and duration of restrictions on disposition, themovement of the market in which the security is normally traded, public trading in similarsecurities or derivative contracts of the issuer or comparable issuers, movement of arelevant index, or other factors including but not limited to industry changes and relevantgovernment actions.
Semi-Annual Shareholder Report18

If any price, quotation, price evaluation or other pricing source is not readily available whenthe NAV is calculated, if the Fund cannot obtain price evaluations from a pricing service orfrom more than one dealer for an investment within a reasonable period of time as set forth inthe Fund’s valuation policies and procedures, or if information furnished by a pricing service,in the opinion of the valuation committee (“Valuation Committee”), is deemed notrepresentative of the fair value of such security, the Fund uses the fair value of the investmentdetermined in accordance with the procedures described below. There can be no assurancethat the Fund could obtain the fair value assigned to an investment if it sold the investment atapproximately the time at which the Fund determines its NAV per share.
Fair Valuation and Significant Events ProceduresThe Directors have ultimate responsibility for determining the fair value of investments forwhich market quotations are not readily available. The Directors have appointed a ValuationCommittee comprised of officers of the Fund, Federated Global Investment Management Corp.(“Adviser”) and certain of the Adviser’s affiliated companies to assist in determining fair valueand in overseeing the calculation of the NAV. The Directors have also authorized the use ofpricing services recommended by the Valuation Committee to provide fair value evaluations ofthe current value of certain investments for purposes of calculating the NAV. The ValuationCommittee employs various methods for reviewing third-party pricing-service evaluationsincluding periodic reviews of third-party pricing services’ policies, procedures and valuationmethods (including key inputs, methods, models and assumptions), transactional back-testing,comparisons of evaluations of different pricing services and review of price challenges by theAdviser based on recent market activity. In the event that market quotations and priceevaluations are not available for an investment, the Valuation Committee determines the fairvalue of the investment in accordance with procedures adopted by the Directors. TheDirectors periodically review and approve the fair valuations made by the Valuation Committeeand any changes made to the procedures.
Factors considered by pricing services in evaluating an investment include the yields orprices of investments of comparable quality, coupon, maturity, call rights and other potentialprepayments, terms and type, reported transactions, indications as to values from dealers andgeneral market conditions. Some pricing services provide a single price evaluation reflectingthe bid-side of the market for an investment (a “bid” evaluation). Other pricing services offerboth bid evaluations and price evaluations indicative of a price between the prices bid andasked for the investment (a “mid” evaluation). The Fund normally uses bid evaluations for anyU.S. Treasury and Agency securities, mortgage-backed securities and municipal securities. TheFund normally uses mid evaluations for any other types of fixed-income securities and anyOTC derivative contracts. In the event that market quotations and price evaluations are notavailable for an investment, the fair value of the investment is determined in accordance withprocedures adopted by the Directors.
Semi-Annual Shareholder Report19

The Directors also have adopted procedures requiring an investment to be priced at its fairvalue whenever the Adviser determines that a significant event affecting the value of theinvestment has occurred between the time as of which the price of the investment wouldotherwise be determined and the time as of which the NAV is computed. An event isconsidered significant if there is both an affirmative expectation that the investment’s valuewill change in response to the event and a reasonable basis for quantifying the resultingchange in value. Examples of significant events that may occur after the close of the principalmarket on which a security is traded, or after the time of a price evaluation provided by apricing service or a dealer, include:� With respect to securities principally traded in foreign markets, significant trends in
U.S. equity markets or in the trading of foreign securities index futures contracts;� Political or other developments affecting the economy or markets in which an issuer
conducts its operations or its securities are traded;� Announcements concerning matters such as acquisitions, recapitalizations, litigation
developments, or a natural disaster affecting the issuer’s operations or regulatory changesor market developments affecting the issuer’s industry.
The Directors have adopted procedures whereby the Valuation Committee uses a pricingservice to determine the fair value of equity securities traded principally in foreign marketswhen the Adviser determines that there has been a significant trend in the U.S. equity marketsor in index futures trading. For other significant events, the Fund may seek to obtain morecurrent quotations or price evaluations from alternative pricing sources. If a reliable alternativepricing source is not available, the Fund will determine the fair value of the investment inaccordance with the fair valuation procedures approved by the Directors. The Directors haveultimate responsibility for any fair valuations made in response to a significant event.
Repurchase AgreementsThe Fund may invest in repurchase agreements for short-term liquidity purposes. It is thepolicy of the Fund to require the other party to a repurchase agreement to transfer to theFund’s custodian or sub-custodian eligible securities or cash with a market value (aftertransaction costs) at least equal to the repurchase price to be paid under the repurchaseagreement. The eligible securities are transferred to accounts with the custodian or sub-custodian in which the Fund holds a “securities entitlement” and exercises “control” as thoseterms are defined in the Uniform Commercial Code. The Fund has established procedures formonitoring the market value of the transferred securities and requiring the transfer ofadditional eligible securities if necessary to equal at least the repurchase price. Theseprocedures also allow the other party to require securities to be transferred from the accountto the extent that their market value exceeds the repurchase price or in exchange for othereligible securities of equivalent market value.
The insolvency of the other party or other failure to repurchase the securities may delay thedisposition of the underlying securities or cause the Fund to receive less than the fullrepurchase price. Under the terms of the repurchase agreement, any amounts received by theFund in excess of the repurchase price and related transaction costs must be remitted to theother party.
Semi-Annual Shareholder Report20

The Fund may enter into repurchase agreements in which eligible securities are transferredinto joint trading accounts maintained by the custodian or sub-custodian for investmentcompanies and other clients advised by the Adviser and its affiliates. The Fund will participateon a pro rata basis with the other investment companies and clients in its share of thesecurities transferred under such repurchase agreements and in its share of proceeds fromany repurchase or other disposition of such securities.
Investment Income, Gains and Losses, Expenses and DistributionsInvestment transactions are accounted for on a trade-date basis. Realized gains and lossesfrom investment transactions are recorded on an identified-cost basis. Interest income andexpenses are accrued daily. Dividend income and distributions to shareholders are recordedon the ex-dividend date. Foreign dividends are recorded on the ex-dividend date or when theFund is informed of the ex-dividend date. Distributions of net investment income, if any, aredeclared and paid annually. Non-cash dividends included in dividend income, if any, arerecorded at fair value. Amortization/accretion of premium and discount is included ininvestment income. Investment income, realized and unrealized gains and losses, and certainfund-level expenses are allocated to each class based on relative average daily net assets,except that Class A Shares, Class B Shares and Class C Shares may bear distribution servicesfees and other service fees unique to those classes. The detail of the total fund expensewaivers and reimbursements of $116,414 is disclosed in various locations in this Note 2 andNote 5.
For the six months ended May 31, 2017, the Fund’s former custodian reimbursed $5,650 ofcustody fees.
Dividends are declared separately for each class. No class has preferential dividend rights;differences in per share dividend rates are generally due to differences in separateclass expenses.
Other Service FeesThe Fund may pay other service fees up to 0.25% of the average daily net assets of the Fund’sClass A Shares, Class B Shares and Class C Shares to unaffiliated financial intermediaries or toFederated Shareholder Services Company (FSSC) for providing services to shareholders andmaintaining shareholder accounts. Subject to the terms described in the Expense Limitationnote, FSSC may voluntarily reimburse the Fund for other service fees. For the six monthsended May 31, 2017, other service fees for the Fund were as follows:
OtherService Fees
Incurred
Class B Shares $ 2,193
Class C Shares 20,895
TOTAL $23,088
For the six months ended May 31, 2017, the Fund’s Class A Shares did not incur otherservice fees.
Semi-Annual Shareholder Report21

Federal TaxesIt is the Fund’s policy to comply with the Subchapter M provision of the Internal Revenue Code(the “Code”) and to distribute to shareholders each year substantially all of its income.Accordingly, no provision for federal income tax is necessary. As of and during the six monthsended May 31, 2017, the Fund did not have a liability for any uncertain tax positions. The Fundrecognizes interest and penalties, if any, related to tax liabilities as income tax expense in theStatement of Operations. As of May 31, 2017, tax years 2013 through 2016 remain subject toexamination by the Fund’s major tax jurisdictions, which include the United States of America,the State of Maryland and the Commonwealth of Pennsylvania.
The Fund may be subject to taxes imposed by governments of countries in which it invests.Such taxes are generally based on either income or gains earned or repatriated. The Fundaccrues and applies such taxes to net investment income, net realized gains and netunrealized gains as income and/or gains are earned.
When-Issued and Delayed-Delivery TransactionsThe Fund may engage in when-issued or delayed-delivery transactions. The Fund recordswhen-issued securities on the trade date and maintains security positions such that sufficientliquid assets will be available to make payment for the securities purchased. Securitiespurchased on a when-issued or delayed-delivery basis are marked to market daily and beginearning interest on the settlement date. Losses may occur on these transactions due tochanges in market conditions or the failure of counterparties to perform under the contract.
Restricted SecuritiesThe Fund may purchase securities which are considered restricted. Restricted securities aresecurities that either: (a) cannot be offered for public sale without first being registered, orbeing able to take advantage of an exemption from registration, under the Securities Act of1933; or (b) are subject to contractual restrictions on public sales. In some cases, when asecurity cannot be offered for public sale without first being registered, the issuer of therestricted security has agreed to register such securities for resale, at the issuer’s expense,either upon demand by the Fund or in connection with another registered offering of thesecurities. Many such restricted securities may be resold in the secondary market intransactions exempt from registration. Restricted securities may be determined to be liquidunder criteria established by the Directors. The Funds will not incur any registration costsupon such resales. The Fund’s restricted securities, like other securities, are priced inaccordance with procedures established by and under the general supervision ofthe Directors.
Futures ContractsThe Fund purchases and sells financial futures contracts to manage country risk. Uponentering into a financial futures contract with a broker, the Fund is required to deposit in asegregated account, either U.S. government securities or a specified amount of cash which isshown as Restricted cash in the Statement of Assets and Liabilities. Futures contracts arevalued daily and unrealized gains or losses are recorded in a “variation margin” account. Daily,the Fund receives from or pays to the broker a specified amount of cash based upon changesin the variation margin account. When a contract is closed, the Fund recognizes a realized gainor loss. Futures contracts have market risks, including the risk that the change in the value of
Semi-Annual Shareholder Report22

the contract may not correlate with the changes in the value of the underlying securities.There is minimal counterparty risk to the Fund since futures contracts are exchange tradedand the exchange’s clearing house, as counterparty to all exchange-traded futures contracts,guarantees the futures contracts against default.
At May 31, 2017, the Fund had no outstanding futures contracts.
Foreign Exchange ContractsThe Fund may enter into foreign exchange contracts to manage currency risk. Purchasedcontracts are used to acquire exposure to foreign currencies, whereas, contracts to sell areused to hedge the Fund’s securities against currency fluctuations. Risks may arise uponentering into these transactions from the potential inability of counterparties to meet the termsof their commitments and from unanticipated movements in security prices or foreignexchange rates. The foreign exchange contracts are adjusted by the daily exchange rate of theunderlying currency and any gains or losses are recorded for financial statement purposes asunrealized until the settlement date.
Foreign exchange contracts are subject to Master Netting Agreements which areagreements between the Fund and its counterparties that provides for the net settlement of alltransactions and collateral with the Fund, through a single payment, in the event of default ortermination. Amounts presented on the Portfolio of Investments and Statement of Assets andLiabilities are not net settlement amounts but gross.
Foreign exchange contracts outstanding at period end, including net unrealizedappreciation/depreciation or net settlement amounts, are listed after the Fund’s Portfolioof Investments.
The average value at settlement date payable and receivable of foreign exchange contractspurchased and sold by the Fund throughout the period was $151,877 and $149,206,respectively. This is based on the contracts held as of each month-end throughout the sixmonth fiscal period year.
Foreign Currency TranslationThe accounting records of the Fund are maintained in U.S. dollars. All assets and liabilitiesdenominated in foreign currencies are translated into U.S. dollars based on the rates ofexchange of such currencies against U.S. dollars on the date of valuation. Purchases and salesof securities, income and expenses are translated at the rate of exchange quoted on therespective date that such transactions are recorded. The Fund does not isolate that portion ofthe results of operations resulting from changes in foreign exchange rates on investmentsfrom the fluctuations arising from changes in market prices of securities held. Suchfluctuations are included with the net realized and unrealized gain or loss from investments.
Reported net realized foreign exchange gains or losses arise from sales of foreigncurrencies, currency gains or losses realized between the trade and settlement dates onsecurities transactions, the difference between the amounts of dividends, interest and foreignwithholding taxes recorded on the Fund’s books and the U.S. dollar equivalent of the amountsactually received or paid. Net unrealized foreign exchange gains and losses arise fromchanges in the value of assets and liabilities other than investments in securities at periodend, resulting from changes in the exchange rate.
Semi-Annual Shareholder Report23

Additional Disclosure Related to Derivative Instruments
Fair Value of Derivative Instruments
Asset Liability
Foreign exchange contracts
Unrealizedappreciation onforeign exchangecontracts $4,822
Unrealizeddepreciation onforeign exchangecontracts $167,766
The Effect of Derivative Instruments on the Statement of Operations forthe Six Months Ended May 31, 2017
Amount of Realized Gain or (Loss) on Derivatives Recognized in Income
ForeignExchangeContracts1
Foreign exchange contracts $72,160
Change in Unrealized Appreciation or (Depreciation) on Derivatives Recognized in Income
ForeignExchangeContracts2
Foreign exchange contracts $(494,349)
1 The net realized gain (loss) on Foreign Exchange Contracts is found within the net realized gain oninvestments and foreign currency transactions on the Statement of Operations.
2 The net change in unrealized appreciation/depreciation of Foreign Exchange Contracts is found withinthe Net change in unrealized appreciation of investments and translation of assets and liabilities inforeign currency on the Statement of Operations.
OtherThe preparation of financial statements in conformity with GAAP requires management tomake estimates and assumptions that affect the amounts of assets, liabilities, expenses andrevenues reported in the financial statements. Actual results could differ from those estimated.The Fund applies investment company accounting and reporting guidance.
Semi-Annual Shareholder Report24

3. CAPITAL STOCKThe following tables summarize capital stock activity:
Six Months Ended5/31/2017
Year Ended11/30/2016
Class A Shares: Shares Amount Shares Amount
Shares sold 123,328 $ 4,332,766 188,620 $ 6,305,394
Shares issued to shareholders in payment ofdistributions declared 22,936 719,960 344,309 12,126,559
Shares redeemed (348,996) (11,697,551) (896,452) (29,718,270)
NET CHANGE RESULTING FROMCLASS A SHARE TRANSACTIONS (202,732) $ (6,644,825) (363,523) $(11,286,317)
Six Months Ended5/31/2017
Year Ended11/30/2016
Class B Shares: Shares Amount Shares Amount
Shares issued to shareholders in payment ofdistributions declared 860 $ 21,547 14,005 397,749
Shares redeemed (24,565) (662,742) (41,818) (1,141,179)
NET CHANGE RESULTING FROMCLASS B SHARE TRANSACTIONS (23,705) $(641,195) (27,813) $ (743,430)
Six Months Ended5/31/2017
Year Ended11/30/2016
Class C Shares: Shares Amount Shares Amount
Shares sold 39,967 $ 1,068,632 102,898 $ 2,757,538
Shares issued to shareholders in payment ofdistributions declared 6,848 171,337 89,776 2,546,048
Shares redeemed (195,961) (5,372,932) (217,499) (5,765,792)
NET CHANGE RESULTING FROMCLASS C SHARE TRANSACTIONS (149,146) $(4,132,963) (24,825) $ (462,206)
Six Months Ended5/31/2017
Year Ended11/30/2016
Institutional Shares: Shares Amount Shares Amount
Shares sold 62,227 $ 2,159,369 317,620 $ 10,727,068
Shares issued to shareholders in payment ofdistributions declared 8,613 275,109 115,910 4,146,107
Shares redeemed (93,755) (3,199,230) (408,015) (13,558,606)
NET CHANGE RESULTING FROMINSTITUTIONAL SHARE TRANSACTIONS (22,915) $ (764,752) 25,515 $ 1,314,569
NET CHANGE RESULTING FROMTOTAL FUND SHARE TRANSACTIONS (398,498) $(12,183,735) (390,646) $(11,177,384)
Semi-Annual Shareholder Report25

Redemption FeesThe Fund imposes a 2.00% redemption fee to shareholders of the Fund’s Class A Shares,Class B Shares, Class C Shares and Institutional Shares who redeem shares held for 30 daysor less. Shares acquired by reinvestment of dividends or distributions of the Fund, orpurchased pursuant to the Systematic Investment Program or withdrawn pursuant to theSystematic Withdrawal Program, will not be subject to the redemption fee. All redemption feesare recorded by the Fund as additions to paid-in capital. For the six months endedMay 31, 2017, the redemption fees for Class A Shares, Class B Shares, Class C Shares andInstitutional Shares amounted to $1,003, $26, $229 and $341, respectively. For the year endedNovember 30, 2016, redemption fees for Class A Shares, Class B Shares, Class C Shares andInstitutional Shares amounted to $472, $13, $107 and $150, respectively.
4. FEDERAL TAX INFORMATIONAt May 31, 2017, the cost of investments for federal tax purposes was $120,763,895. The netunrealized appreciation of investments for federal tax purposes, excluding any unrealizedappreciation/depreciation resulting from: (a) the translation of foreign currencies toU.S. dollars of assets and liabilities other than investments in securities; and (b) outstandingforeign currency commitments was $33,149,075. This consists of net unrealized appreciationfrom investments for those securities having an excess of value over cost of $36,265,814 andnet unrealized depreciation from investments for those securities having an excess of costover value of $3,116,739.
5. INVESTMENT ADVISER FEE AND OTHER TRANSACTIONSWITH AFFILIATES
Investment Adviser FeeThe advisory agreement between the Fund and the Adviser provides for an annual fee equal to1.25% of the Fund’s average daily net assets. Subject to the terms described in the ExpenseLimitation note, the Adviser may voluntarily choose to waive any portion of its fee. For the sixmonths ended May 31, 2017, the Adviser voluntarily waived $85,271 of its fee.
Administrative FeeFederated Administrative Services (FAS), under the Administrative Services Agreement,provides the Fund with administrative personnel and services. For purposes of determining theappropriate rate breakpoint, “Investment Complex” is defined as all of the Federated Fundssubject to a fee under the Administrative Services Agreement. The fee paid to FAS is based onthe average daily net assets of the Investment Complex as specified below, plus certainout-of-pocket expenses:
Administrative FeeAverage Daily Net Assetsof the Investment Complex
0.150% on the first $5 billion
0.125% on the next $5 billion
0.100% on the next $10 billion
0.075% on assets in excess of $20 billion
Subject to the terms described in the Expense Limitation note, FAS may voluntarily choose towaive any portion of its fee. For the six months ended May 31, 2017, the annualized fee paid toFAS was 0.079% of average daily net assets of the Fund.
Semi-Annual Shareholder Report26

Distribution Services FeeThe Fund has adopted a Distribution Plan (the “Plan”) pursuant to Rule 12b-1 under the Act.Under the terms of the Plan, the Fund will compensate Federated Securities Corp. (FSC), theprincipal distributor, from the daily net assets of the Fund’s Class A Shares, Class B Shares andClass C Shares to finance activities intended to result in the sale of these shares. The Planprovides that the Fund may incur distribution expenses at the following percentages ofaverage daily net assets annually, to compensate FSC:
Share Class NamePercentage of Average DailyNet Assets of Class
Class A Shares 0.25%
Class B Shares 0.75%
Class C Shares 0.75%
Subject to the terms described in the Expense Limitation note, FSC may voluntarily choose towaive any portion of its fee. For the six months ended May 31, 2017, distribution services feesfor the Fund were as follows:
DistributionService Fees
Incurred
DistributionService Fees
Waived
Class A Shares $114,844 $(22,968)
Class B Shares 6,581 —
Class C Shares 62,686 —
TOTAL $184,111 $(22,968)
When FSC receives fees, it may pay some or all of them to financial intermediaries whosecustomers purchase shares. For the six months ended May 31, 2017, FSC did not retain anyfees paid by the Fund.
Sales ChargesFront-end sales charges and contingent deferred sales charges (CDSC) do not representexpenses of the Fund. They are deducted from the proceeds of sales of Fund shares prior toinvestment or from redemption proceeds prior to remittance, as applicable. For the six monthsended May 31, 2017, FSC retained $1,317 in sales charges from the sale of Class A Shares.FSC also retained $1,686 and $157 of CDSC relating to redemptions of Class B Shares andClass C Shares, respectively.
Other Service FeesFor the six months ended May 31, 2017, FSSC received $2,438 of the other service feesdisclosed in Note 2.
Semi-Annual Shareholder Report27

Expense LimitationThe Adviser and certain of its affiliates (which may include FSC, FAS and FSSC) on their owninitiative have agreed to waive certain amounts of their respective fees and/or reimburseexpenses. Total annual fund operating expenses (as shown in the financial highlights,excluding interest expense, tax reclaim recovery expenses, extraordinary expenses, line ofcredit expenses and proxy-related expenses paid by the Fund, if any) paid by the Fund’sClass A Shares, Class B Shares, Class C Shares and Institutional Shares (after the voluntarywaivers and reimbursements) will not exceed 1.84%, 2.64%, 2.64% and 1.64% (the “Fee Limit”),respectively, up to but not including the later of (the “Termination Date”): (a) February 1, 2018;or (b) the date of the Fund’s next effective Prospectus. While the Adviser and its applicableaffiliates currently do not anticipate terminating or increasing these arrangements prior to theTermination Date, these arrangements may only be terminated or the Fee Limit increased priorto the Termination Date with the agreement of the Directors.
GeneralCertain Officers and Directors of the Fund are Officers and Directors or Trustees of certain ofthe above companies. To efficiently facilitate payment, Directors’/Trustees’ fees and certainexpenses related to conducting meetings of the Directors/Trustees and other miscellaneousexpenses are paid by an affiliate of the Adviser which in due course are reimbursed by theFund. These expenses related to conducting meetings of the Directors/Trustees and othermiscellaneous expenses may be included in Accrued and Miscellaneous Expenses on theStatement of Assets and Liabilities and Statement of Operations, respectively.
Transactions Involving Affiliated HoldingsAffiliated holdings are investment companies which are managed by the Adviser or an affiliateof the Adviser. The Adviser has agreed to reimburse the Fund for certain investment adviserfees as a result of transactions in other affiliated investment companies. For the six monthsended May 31, 2017, the Adviser reimbursed $2,525. Transactions with the affiliated holdingduring the six months ended May 31, 2017, were as follows:
FederatedInstitutionalPrime Value
Obligations Fund,Institutional Shares
Balance of Shares Held 11/30/2016 7,573,944
Purchases/Additions 21,878,659
Sales/Reductions (21,420,863)
Balance of Shares Held 5/31/2017 $ 8,031,740
Value $ 8,034,150
Dividend Income $ 20,689
Semi-Annual Shareholder Report28

6. INVESTMENT TRANSACTIONSPurchases and sales of investments, excluding long-term U.S. government securities andshort-term obligations, for the six months ended May 31, 2017, were as follows:
Purchases $23,521,008
Sales $35,946,366
7. CONCENTRATION OF RISKThe Fund invests in securities of non-U.S. issuers. Foreign political or economic developmentsmay have an effect on the liquidity and volatility of portfolio securities and currency holdings.
The Fund may invest a portion of its assets in securities of companies that are deemed bythe Fund’s management to be classified in similar business sectors. Economic developmentsmay have an effect on the liquidity and volatility of the portfolio securities.
8. LINE OF CREDITThe Fund participates with certain other Federated Funds, on a several basis, in an up to$500,000,000 unsecured, 364-day, committed, revolving line of credit (LOC) agreement. TheLOC was made available to finance temporarily the repurchase or redemption of shares of theFund, failed trades, payment of dividends, settlement of trades and for other short-term,temporary or emergency general business purposes. The Fund cannot borrow under the LOCif an inter-fund loan is outstanding. The Fund’s ability to borrow under the LOC also is subjectto the limitations of the Act and various conditions precedent that must be satisfied before theFund can borrow. Loans under the LOC are charged interest at a fluctuating rate per annumequal to the highest, on any day, of (a) (i) the federal funds effective rate, (ii) the one monthLondon Interbank Offered Rate (LIBOR), and (iii) 0.0%, plus (b) a margin. The LOC alsorequires the Fund to pay, quarterly in arrears and at maturity, its pro rata share of acommitment fee based on the amount of the lenders’ commitment that has not been utilized.As of May 31, 2017, the Fund had no outstanding loans. During the six months endedMay 31, 2017, the Fund did not utilize the LOC.
9. INTERFUND LENDINGPursuant to an Exemptive Order issued by the SEC, the Fund, along with other funds advisedby subsidiaries of Federated Investors, Inc., may participate in an interfund lending program.This program provides an alternative credit facility allowing the Fund to borrow from otherparticipating affiliated funds. As of May 31, 2017, there were no outstanding loans. During thesix months ended May 31, 2017, the program was not utilized.
10. REGULATORY UPDATESOn October 13, 2016, the SEC amended existing rules intended to modernize reporting anddisclosure of information. These amendments relate to Regulation S-X which sets forth theform and content of financial statements. At this time, management is evaluating theimplications of adopting these amendments and their impact on the financial statements andaccompanying notes.
Semi-Annual Shareholder Report29

Shareholder Expense Example (unaudited)As a shareholder of the Fund, you incur two types of costs: (1) transaction costs,including sales charges (“loads”) on purchase or redemption payments andredemption/exchange fees; and (2) ongoing costs, including management feesand to the extent applicable, distribution (12b-1) fees and/or other service feesand other Fund expenses. This Example is intended to help you to understandyour ongoing costs (in dollars) of investing in the Fund and to compare thesecosts with the ongoing costs of investing in other mutual funds. It is based on aninvestment of $1,000 invested at the beginning of the period and held for theentire period from December 1, 2016 to May 31, 2017.
ACTUAL EXPENSES
The first section of the table below provides information about actual accountvalues and actual expenses. You may use the information in this section, togetherwith the amount you invested, to estimate the expenses that you incurred overthe period. Simply divide your account value by $1,000 (for example, an $8,600account value divided by $1,000 = 8.6), then multiply the result by the numberin the first section under the heading entitled “Expenses Paid During Period”to estimate the expenses attributable to your investment during this period.
HYPOTHETICAL EXAMPLE FOR COMPARISON PURPOSES
The second section of the table below provides information about hypotheticalaccount values and hypothetical expenses based on the Fund’s actual expenseratio and an assumed rate of return of 5% per year before expenses, which is notthe Fund’s actual return. Thus, you should not use the hypothetical accountvalues and expenses to estimate the actual ending account balance or yourexpenses for the period. Rather, these figures are required to be provided toenable you to compare the ongoing costs of investing in the Fund with otherfunds. To do so, compare this 5% hypothetical example with the 5%hypothetical examples that appear in the shareholder reports of the other funds.
Semi-Annual Shareholder Report30
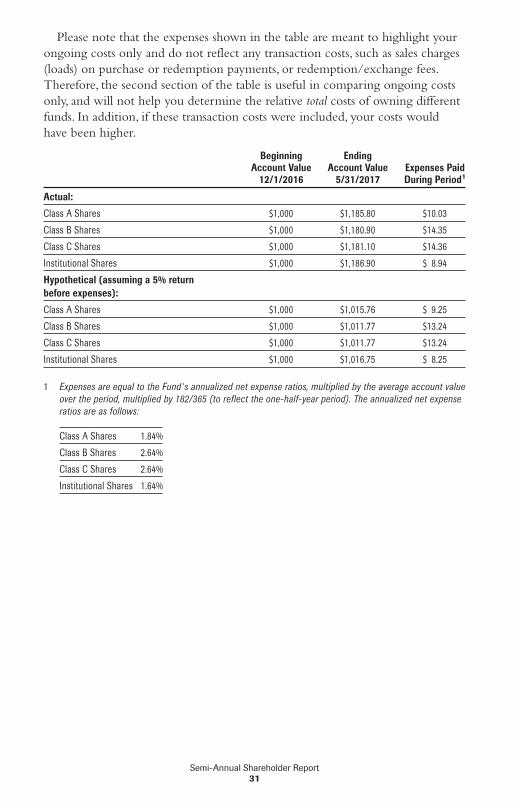
Please note that the expenses shown in the table are meant to highlight yourongoing costs only and do not reflect any transaction costs, such as sales charges(loads) on purchase or redemption payments, or redemption/exchange fees.Therefore, the second section of the table is useful in comparing ongoing costsonly, and will not help you determine the relative total costs of owning differentfunds. In addition, if these transaction costs were included, your costs wouldhave been higher.
BeginningAccount Value
12/1/2016
EndingAccount Value
5/31/2017Expenses PaidDuring Period1
Actual:
Class A Shares $1,000 $1,185.80 $10.03
Class B Shares $1,000 $1,180.90 $14.35
Class C Shares $1,000 $1,181.10 $14.36
Institutional Shares $1,000 $1,186.90 $ 8.94
Hypothetical (assuming a 5% returnbefore expenses):
Class A Shares $1,000 $1,015.76 $ 9.25
Class B Shares $1,000 $1,011.77 $13.24
Class C Shares $1,000 $1,011.77 $13.24
Institutional Shares $1,000 $1,016.75 $ 8.25
1 Expenses are equal to the Fund’s annualized net expense ratios, multiplied by the average account valueover the period, multiplied by 182/365 (to reflect the one-half-year period). The annualized net expenseratios are as follows:
Class A Shares 1.84%
Class B Shares 2.64%
Class C Shares 2.64%
Institutional Shares 1.64%
Semi-Annual Shareholder Report31

Evaluation and Approval of AdvisoryContract – May 2017FEDERATED INTERNATIONAL SMALL-MID COMPANY FUND (THE “FUND”)
Following a review and recommendation of approval by the Fund’s independentdirectors, the Fund’s Board of Directors (the “Board”) reviewed andunanimously approved the continuation of the Fund’s investment advisorycontract for an additional one-year term at its May 2017 meetings. The Board’sdecision regarding the contract reflects the exercise of its business judgment afterconsidering all of the information received on whether to continue theexisting arrangements.
The Board had previously appointed a Senior Officer, whose duties includespecified responsibilities relating to the process by which advisory fees are to becharged to a Federated fund. The Senior Officer has the authority to retainconsultants, experts, or staff as may be reasonably necessary to assist in theperformance of his duties, reports directly to the Board, and may be terminatedonly with the approval of a majority of the independent members of the Board.The Senior Officer prepared and furnished to the Board an independent,written evaluation that covered topics discussed below (the “Senior Officer’sEvaluation”). The Board considered the Senior Officer’s Evaluation, along withother information, in deciding to approve the investment advisory contract.
The Board also considered judicial decisions concerning allegedly excessiveinvestment advisory fees in its decision. Using these judicial decisions as a guide,the Board has indicated that the following factors may be relevant to an adviser’sfiduciary duty with respect to its receipt of compensation from a fund: (1) thenature and quality of the services provided by an adviser to a fund and itsshareholders (including the performance of the Fund and of comparable funds);(2) an adviser’s cost of providing the services (including the profitability to anadviser of providing advisory services to a fund); (3) the extent to which anadviser may realize “economies of scale” as a fund grows larger and, if sucheconomies of scale exist, whether they have been shared with a fund and itsshareholders or the family of funds; (4) any “fall-out financial benefits” thataccrue to an adviser because of its relationship with a fund (including researchservices received from brokers that execute fund trades and any fees paid toaffiliates of an adviser for services rendered to a fund); (5) comparative fee andexpense structures (including a comparison of fees paid to an adviser with thosepaid by similar funds); and (6) the extent of care, conscientiousness andindependence with which the Fund’s board members perform their duties andtheir expertise (including whether they are fully informed about all facts theBoard deems relevant to its consideration of an adviser’s services and fees). TheBoard noted that the Securities and Exchange Commission (“SEC”) disclosurerequirements regarding the basis for the Board’s approval of the Fund’sinvestment advisory contract generally align with the factors listed above.Consistent with the judicial decisions and SEC disclosure requirements, the
Semi-Annual Shareholder Report32

Board also considered management fees charged to institutional and otherclients of Federated Global Investment Management Corp. (the “Adviser”) andits advisory affiliates for what might be viewed as like services. The Board wasaware of these factors and was guided by them in its review of the Fund’sinvestment advisory contract to the extent it considered them to be appropriateand relevant, as discussed further below.
The Board considered and weighed these factors in light of its substantialaccumulated experience in governing the Fund and working with FederatedInvestors, Inc. and its affiliates (“Federated”) on matters relating to the Federatedfunds. The Board was assisted in its deliberations by independent legal counsel.In addition to the extensive materials that comprise and accompany the SeniorOfficer’s Evaluation, the Board received detailed information about the Fundand the Federated organization throughout the year, and in connection with itsMay meetings. Federated provided much of this information at each regularmeeting of the Board, and furnished additional information in connection withthe May meetings at which the Board’s formal approval of the investmentadvisory contract occurred. At the May meetings in addition to meeting inseparate sessions of the independent directors without management present,senior management of the Adviser also met with the independent directors andtheir counsel to discuss the materials presented and any other matters thoughtrelevant by the Adviser or the directors. Between regularly scheduled meetings,the Board also received information on particular matters as the need arose. TheBoard’s consideration of the investment advisory contract included review ofthe Senior Officer’s Evaluation, accompanying data and additional informationcovering such matters as: the Adviser’s investment philosophy, revenue,profitability, personnel and processes; investment and operating strategies; theFund’s short-term and long-term performance (in absolute terms, both on agross basis and net of expenses, as well as in terms relative to its particularinvestment program and certain competitor or “peer group” funds and/or otherbenchmarks, as appropriate) and comments on the reasons for performance; theFund’s investment objectives; the Fund’s expenses, including the advisory feeand the overall expense structure of the Fund (both in absolute terms andrelative to similar and/or competing funds), with due regard for contractual orvoluntary expense limitations; the use and allocation of brokerage commissionsderived from trading the Fund’s portfolio securities (if any); and the nature,quality and extent of the advisory and other services provided to the Fund bythe Adviser and its affiliates. The Board also considered the preferences andexpectations of Fund shareholders; the entrepreneurial risk assumed by theAdviser in sponsoring the Fund; the continuing state of competition in themutual fund industry and market practices; the range of comparable fees forsimilar funds in the mutual fund industry; the Fund’s relationship to theFederated funds which include a comprehensive array of funds with differentinvestment objectives, policies and strategies which are generally available forexchange without the incurrence of additional sales charges; compliance and
Semi-Annual Shareholder Report33

audit reports concerning the Federated funds and the Federated companies thatservice them (including communications from regulatory agencies), as well asFederated’s responses to any issues raised therein; and relevant developments inthe mutual fund industry and how the Federated funds and/or Federated areresponding to them. The Board’s evaluation process is evolutionary. The criteriaconsidered and the emphasis placed on relevant criteria change in recognition ofchanging circumstances in the mutual fund marketplace.
While mindful that courts have cautioned against giving such comparisonstoo much weight, the Board has found the use of comparisons of the Fund’sfees and expenses to other mutual funds with comparable investment programsto be relevant to its deliberations. In this regard, the Board was presented with,and considered, information regarding the contractual advisory fee rates, netadvisory fee rates, total expense ratios and each element of the Fund’s totalexpense ratio (i.e., gross and net advisory fees, custody fees, portfolio accountingfees and transfer agency fees) relative to the Fund’s peers. The Board focused oncomparisons with other similar mutual funds more heavily than non-mutualfund products or services because it is believed that they are more relevant. Forexample, other mutual funds are the products most like the Fund, in that theyare readily available to Fund shareholders as alternative investment vehicles. Also,they are the type of investment vehicle, in fact, chosen and maintained by theFund’s investors. The range of their fees and expenses, therefore, appears to be arelevant indicator of what consumers have found to be reasonable in themarketplace in which the Fund competes.
The Board reviewed the contractual advisory fee rate, net advisory fee ratewhere partially waived and other expenses of the Fund and noted the positionof the Fund’s fee rates relative to its peers. In this regard, the Board noted thatthe contractual advisory fee rate was above the median of the relevant peergroup, but the Board noted the applicable waivers and reimbursements, and thatthe overall expense structure of the Fund remained competitive in the contextof other factors considered by the Board.
For comparison, the Senior Officer has reviewed Federated’s fees forproviding advisory services to products outside the Federated funds(e.g., institutional and separate accounts and sub-adviser services). He concludedthat mutual funds and institutional accounts are inherently different products.Those differences include, but are not limited to, different types of targetedinvestors; being subject to different laws and regulations; different legalstructures; different average account sizes and portfolio management techniquesmade necessary by different cash flows and different associated costs; and thetime spent by portfolio managers and their teams, funds financial services, legal,compliance and risk management in reviewing securities pricing, addressingdifferent administrative responsibilities, addressing different degrees of risk
Semi-Annual Shareholder Report34

associated with management and a variety of different costs. The Senior Officerdid not consider the fees for providing advisory services to these outsideproducts to be determinative in judging the appropriateness of mutual fundadvisory fees.
The Senior Officer noted that the services, administrative responsibilities andrisks associated with such relationships are quite different than serving as aprimary adviser to a fund.
Following such evaluation, and full deliberations, the Board concluded thatthe expenses of the Fund are reasonable and supported renewal of the Fund’sinvestment advisory contract.
The Board considered the nature, extent and quality of the services providedto the Fund by the Adviser and the resources of the Adviser and its affiliatesdedicated to the Fund. In this regard, the Board evaluated, among other things,the Adviser’s personnel, experience, track record, overall reputation andwillingness to invest in personnel and infrastructure that benefit the Fund. Inaddition, the Board reviewed the qualifications, backgrounds and responsibilitiesof the portfolio management team primarily responsible for the day-to-daymanagement of the Fund. The Board noted the compliance programs of, andthe compliance-related resources provided to, the Fund by the Adviser. TheFund’s ability to deliver competitive performance when compared to its peergroup was also deemed to be relevant by the Board as a useful indicator of howthe Adviser is executing the Fund’s investment program. The Adviser’s ability toexecute this program was one of the Board’s considerations in reaching aconclusion that the nature, extent and quality of the Adviser’s investmentmanagement services warrant the continuation of the investmentadvisory contract.
In evaluating the Fund’s investment performance, the Board consideredperformance results in light of the Fund’s investment objective, strategies andrisks, as disclosed in the Fund’s prospectus. The Board particularly considereddetailed investment reports on the Fund’s performance that were provided tothe Board throughout the year and in connection with the May meetings. TheSenior Officer also reviewed information compiled by Federated, using datasupplied by independent fund ranking organizations, regarding the performanceof, and fees charged by, other mutual funds, noting his view that comparisons tofund peer groups may be helpful, though not conclusive, in judging thereasonableness of the proposed fees. The Board considered, in evaluating suchcomparisons, that in some cases individual funds may exhibit significant andunique differences in their objectives and management techniques whencompared to other funds within an industry peer group.
The Fund’s performance fell below the median of the relevant peer group forthe one-year, three-year and five-year periods covered by the Senior Officer’sEvaluation. The Board discussed the Fund’s performance with the Adviser andrecognized the efforts being taken by the Adviser in the context of other factorsconsidered relevant by the Board.
Semi-Annual Shareholder Report35

Following such evaluation, and full deliberations, the Board concluded thatthe performance of the Fund supported renewal of the Fund’s investmentadvisory contract.
The Board also received financial information about Federated, includinginformation regarding the compensation and ancillary (or “fall-out”) benefitsFederated derived from its relationships with the Federated funds. Thisinformation covered not only the fees under the investment advisory contracts,but also fees received by Federated’s subsidiaries for providing other services tothe Federated funds under separate contracts (e.g., for serving as the Federatedfunds’ administrator). The information also detailed any indirect benefitFederated may derive from its receipt of research services from brokers whoexecute Federated fund trades. In addition, the Board considered the fact that, inorder for a fund to be competitive in the marketplace, Federated and its affiliatesfrequently waived fees and/or reimbursed expenses and have disclosed to Fundinvestors and/or indicated to the Board their intention to do so in the future.Moreover, the Board receives regular reporting as to the institution, adjustmentor elimination of these voluntary waivers. The Board considered Federated’sprevious reductions in contractual management fees to certain funds in responseto the Senior Officer’s recommendations.
Federated furnished information, requested by the Senior Officer, thatreported revenues on a fund-by-fund basis and made estimates of the allocationof expenses on a fund-by-fund basis, using allocation methodologies specified bythe Senior Officer. The Senior Officer noted that, while these cost allocationreports apply consistent allocation processes, the inherent difficulties inallocating costs continues to cause the Senior Officer to question the precisionof the process and to conclude that such reports may be unreliable, since a singlechange in an allocation estimate may dramatically alter the resulting estimate ofcost and/or profitability of a fund and may produce unintended consequences.The allocation information, including the Senior Officer’s view that fund-by-fund estimations may be unreliable, was considered in the analysis by the Board.
The Board and the Senior Officer also reviewed information compiled byFederated comparing its profitability information to other publicly held fundmanagement companies. In this regard, the Senior Officer concluded thatFederated’s profit margins did not appear to be excessive. The Senior Officeralso noted that Federated appeared financially sound, with the resources to fulfillits obligations under its contracts with the Fund.
The Senior Officer’s Evaluation also discussed the notion of possiblerealization of “economies of scale” as a fund grows larger. In this regard, theBoard considered that the Adviser has made significant and long-terminvestments in areas that support all of the Federated funds, such as personneland processes for the portfolio management, shareholder services, compliance,internal audit and risk management functions, as well as systems technology(including technology relating to cybersecurity) and that the benefits of theseefforts (as well as any economies of scale, should they exist) were likely to be
Semi-Annual Shareholder Report36

enjoyed by the fund family as a whole. The Board noted that the Adviser’sinvestments in these areas are extensive. In addition, the Board considered thatFederated and its affiliates have frequently waived fees and/or reimbursedexpenses and that this has allowed fund shareholders to share potentialeconomies of scale from a fund’s inception. Federated, as it does throughout theyear, and in connection with the Board’s review, furnished information relativeto revenue sharing or adviser paid fees. Federated and the Senior Officer notedthat this information should be viewed to determine if there was an incentive toeither not apply breakpoints, or to apply breakpoints at higher levels. It shouldnot be viewed to determine the appropriateness of advisory fees because itwould represent marketing and distribution expenses. Finally, the Board alsonoted the absence of any applicable regulatory or industry guidelines on thissubject, which (as discussed in the Senior Officer’s Evaluation) is compoundedby the lack of any common industry practice or general pattern with respect tostructuring fund advisory fees with “breakpoints” that serve to reduce the fee asa fund attains a certain size.
While the Senior Officer noted certain items for follow-up reporting to theBoard and further consideration by management, he stated that his observationsand information accompanying the Senior Officer’s Evaluation supported afinding by the Board that the management fee for the Fund was reasonable.Under these circumstances, no changes were recommended to, and no objectionwas raised to the continuation of the Fund’s investment advisory contract.
In its decision to continue an existing investment advisory contract, the Boardwas mindful of the potential disruptions of the Fund’s operations and variousrisks, uncertainties and other effects that could occur as a result of a decision toterminate or not renew an investment advisory contract. In particular, the Boardrecognized that many shareholders have invested in the Fund on the strength ofthe Adviser’s industry standing and reputation and with the expectation that theAdviser will have a continuing role in providing advisory services to the Fund.Thus, the Board’s approval of the investment advisory contract reflected the factthat it is the shareholders who have effectively selected the Adviser by virtue ofhaving invested in the Fund. The Board concluded that, in light of the factorsdiscussed above, including the nature, quality and scope of the services providedto the Fund by the Adviser and its affiliates, continuation of the investmentadvisory contract was appropriate.
The Board based its decision to approve the investment advisory contract onthe totality of the circumstances and relevant factors and with a view to past andfuture long-term considerations. Not all of the factors and considerationsidentified above were necessarily relevant to the Fund, nor did the Boardconsider any one of them to be determinative. With respect to the factors thatwere relevant, the Board’s decision to approve the continuation of the contractreflects its determination that Federated’s performance and actions provided asatisfactory basis to support the decision to continue the existing arrangement.
Semi-Annual Shareholder Report37

Voting Proxies on Fund Portfolio SecuritiesA description of the policies and procedures that the Fund uses to determinehow to vote proxies, if any, relating to securities held in the Fund’s portfolio isavailable, without charge and upon request, by calling 1-800-341-7400. A reporton “Form N-PX” of how the Fund voted any such proxies during the mostrecent 12-month period ended June 30 is available via the Proxy Voting Record(Form N-PX) link associated with the Fund and share class name atwww.FederatedInvestors.com/FundInformation. Form N-PX filings are alsoavailable at the SEC’s website at www.sec.gov.
Quarterly Portfolio ScheduleThe Fund files with the SEC a complete schedule of its portfolio holdings, as ofthe close of the first and third quarters of its fiscal year, on “Form N-Q.” Thesefilings are available on the SEC’s website at www.sec.gov and may be reviewedand copied at the SEC’s Public Reference Room in Washington, DC.(Call 1-800-SEC-0330 for information on the operation of the PublicReference Room.) You may also access this information via the link to theFund and share class name at www.FederatedInvestors.com/FundInformation.
Semi-Annual Shareholder Report38

Mutual funds are not bank deposits or obligations, are not guaranteed by any bank andare not insured or guaranteed by the U.S. government, the Federal Deposit InsuranceCorporation, the Federal Reserve Board or any other government agency. Investment inmutual funds involves investment risk, including the possible loss of principal.
This Report is authorized for distribution to prospective investors only whenpreceded or accompanied by the Fund’s Prospectus, which contains factsconcerning its objective and policies, management fees, expenses andother information.
IMPORTANT NOTICE ABOUT FUND DOCUMENT DELIVERYIn an effort to reduce costs and avoid duplicate mailings, the Fund(s) intendto deliver a single copy of certain documents to each household in whichmore than one shareholder of the Fund(s) resides (so-called“householding”), as permitted by applicable rules. The Fund’s“householding” program covers its/their Prospectus and Statement ofAdditional Information, and supplements to each, as well as Semi-Annualand Annual Shareholder Reports and any Proxies or information statements.Shareholders must give their written consent to participate in the“householding” program. The Fund is also permitted to treat a shareholderas having given consent (“implied consent”) if (i) shareholders with the samelast name, or believed to be members of the same family, reside at the samestreet address or receive mail at the same post office box, (ii) the Fund givesnotice of its intent to “household” at least sixty (60) days before it begins“householding” and (iii) none of the shareholders in the household havenotified the Fund(s) or their agent of the desire to “opt out” of“householding.” Shareholders who have granted written consent, or havebeen deemed to have granted implied consent, can revoke that consent andopt out of “householding” at any time: shareholders who purchased sharesthrough an intermediary should contact their representative; othershareholders may call the Fund at 1-800-341-7400.
Semi-Annual Shareholder Report39

Notes
[PAGE INTENTIONALLY LEFT BLANK]

Notes
[PAGE INTENTIONALLY LEFT BLANK]

Notes
[PAGE INTENTIONALLY LEFT BLANK]

Notes
[PAGE INTENTIONALLY LEFT BLANK]

Notes
[PAGE INTENTIONALLY LEFT BLANK]

Notes
[PAGE INTENTIONALLY LEFT BLANK]

e e eratd dFederated International Small-Mid Company FundFederated Investors Funds4000 Ericsson DriveWarrendale, PA 15086-7561
Contact us at FederatedInvestors.comor call 1-800-341-7400.
Federated Securities Corp., Distributor
CUSIP 31428U748CUSIP 31428U730CUSIP 31428U722CUSIP 31428U631
G01743-02 (7/17)
Federated is a registered trademark of Federated Investors, Inc.2017 ©Federated Investors, Inc.


![Click Here Full Article Hierarchical Bayesian modeling of ...water.columbia.edu/files/2011/11/2008WR007485_final.pdf[Coles and Tawn, 1996] and amounts [Sanso and Guenni, 1999] and](https://img.pdfslide.us/doc/110x75/5f7a3937c9889078d87dc6cb/click-here-full-article-hierarchical-bayesian-modeling-of-water-coles-and-tawn.jpg)