Embed Size (px)
Citation preview

Future Needs inPulmonary and CriticalCare Medicine
November 13, 1998
Prepared forAmerican College of Chest PhysiciansAmerican Thoracic SocietySociety for Critical Care Medicine
Prepared byRobert SchmitzMary LantinAlan White
Cambridge, MALexington, MAHadley, MABethesda, MDWashington, DCChicago, ILCairo, EgyptJohannesburg, South Africa
Abt Associates Inc.55 Wheeler StreetCambridge, MA 02138

Abt Associates Inc. i
Acknowledgments
We are indebted to a number of people who have provided us with data, advice, criticism, and
support during this project. Dr. Roger Rosenblatt of the University of Washington provided us
with data on use of outpatient pulmonary care by Medicare beneficiaries in the state of Washing-
ton. Ms. Stephanie Schmid of United HealthCare Corporation also furnished useful measures of
outpatient pulmonary visits.
Louise Hadden processed the many data files necessary to construct the model. Her skill, speed,
and accommodation to constant requests for more rearrangements of the data files were re-
markable and most appreciated. Richard Burstein of MIT programmed the simulation model,
responding with grace and good humor to continuing requests for new components of the model
itself and to the user interface.
Dan Sherman, Ph.D. directed this project in its early stages before his departure from Abt Asso-
ciates. He developed the two survey instruments, authored the initial methodology for the study,
and was a valued source of advice and support throughout.
Society staff were consistently helpful in responding to numerous requests: Carl Booberg
(American Thoracic Society), Janice Jensen (Society of Critical Care Medicine), Sydney Parker
(American College of Chest Physicians) and Barbi Mathesius (American College of Chest Physi-
cians).
Pride of place must go to the Committee on Manpower for Pulmonary and Critical Care Societies
(COMPACCS). Members of the committee were: Mark Kelley MD, chairman, Derek Angus
MBChB, Dick Briggs MD, Edward Crandall MD, James Fish MD, Sue Pingleton MD, John
Popovich MD, David Powner MD, Thomas Rainey MD, Marc Shapiro MD, and Randall Young
MD.

Abt Associates Inc. 1
1.0 Introduction
The market for physicians in the United States is more highly regulated than that of nearly any
other professional occupation. Virtually all the physician post-graduate training in the U.S. is
funded by the Federal government and the profession itself sets strict standards for this training.
This training is a necessary prerequisite for medical practice in the U.S. Consequently, labor
market forces act more slowly and more weakly for physicians than for other professionals.
The 1990's have focused national attention on escalating health care costs. The growth of health
expenditures has many etiologies and one popular hypothesis is that physicians create an unbridled
demand for their services. The rapid expansion of managed care plans has curbed some of this
demand. However, there has remained a lingering concern that physicians may soon be in over-
supply, resulting in higher medical costs.
This worry has encouraged numerous models and forecasts for the physician labor market
(Schroeder and Sandy 1993). Much of the attention has been focused on both the absolute
numbers of physicians and the large numbers of specialists in the United States. Specialist care
has generally been regarded as more expensive than that of generalists, although rigorous proof
of this difference is lacking. Studies of the demand for specialty care have yielded inconsistent
results. A widely quoted study by Weiner (1994) argued that the continuing growth in the
proportion of the population enrolled in managed care plans, combined with lower use of
specialists than is typical of the fee-for-service market would lead to a substantial oversupply of
specialists by the year 2000. A similar conclusion was reached by the Council on Graduate
Medical Education (1994). However, Hart et al. (1997) analyzed Weiner’s approach to managed
care staffing and found that it did not include specialist services which were outsourced by the
HMOs. Incorporating this additional staffing led to the conclusion that there is no current
oversupply of specialists. Cooper (1995), using different methods, found little evidence to suggest
a significant physician or specialist surplus in the future.
In response to this controversy, physician groups conducted their own workforce studies, with
varying conclusions. Gastroenterology has projected an oversupply in its subspecialty and has
reduced training programs (Meyer et al. 1996 ). Both general surgery (Jonasson, Kwakwa and
Sheldon 1995) and urology (Weiner, McDaniel and Lowe 1997) have published reports which
defend their current status quo. Nephrology's forecasting model predicts increased demand for
physicians trained in this field (Neilson et al. 1997). These inconsistent results likely stem from
differing assumptions and methodologies. (Tarlov 1995).
Abt Associates Inc. 2
The physician workforce issue emerged just as the new subspecialty of critical care enjoyed rapid
growth. Nearly 9,000 physicians in internal medicine, surgery and anesthesia have been certified
in this new field. The largest cohort within critical care is comprised of pulmonary physicians
who, because of their expertise in respiratory failure, have always had a significant practice in the
intensive care unit.
Because of the controversy surrounding physician workforce projections, the pulmonary and
critical care physicians found it difficult to plan for the future of their training programs. The
major professional societies representing pulmonary and critical care physicians in the United
States are the American Thoracic Society (ATS), the American College of Chest Physicians
(ACCP), and the Society of Critical Care Medicine (SCCM). These three organizations convened
in 1995 and commissioned a study of the workforce of pulmonary and critical care physicians in
the United States. The study group, called the Committee on Manpower for the Pulmonary and
Critical Care Societies (COMPACCS), included representatives of each of the sponsoring
societies; representatives from the training directors organizations for pulmonary and critical care;
and several other experts. (Appendix A). Since considerable technical support was required for
this project, COMPACCS engaged Abt Associates, Inc., a major consulting firm with expertise
in workforce issues and medical economics.
As part of this process, COMPACCS reviewed previous reports relating to pulmonary and critical
care workforce issues. In the early 1980's, the federally sponsored Graduate Medical Education
National Advisory Committee (GMENAC) predicted a future oversupply of subspecialists, most
notably in the field of pulmonary diseases. In 1982, the Manpower Committee of the American
Thoracic Society (Bates et al. 1983), using expert consensus, liberalized these forecasts and
predicted that the supply of pulmonologists nationally would be between 4,000 and 4,800 in the
1990s. This estimate proved low, since the 1997 AMA Masterfile data documents this figure at
6,800 The vast majority of these subspecialists are board certified and gainfully employed, with
no economic indicators suggesting an oversupply.
Between 1986 and 1994, some commentators called for a reduction in pulmonary training
programs (Whitcomb 1986, 1991; George 1994) while others pointed out that pulmonary work-
force projections had ignored the pulmonologists’ role in critical care (Schwartz 1994).
Meanwhile several reports focused on describing critical care practice. In 1992 Groeger and
colleagues published a descriptive analysis of ICUs in the United States, but this study did not
address workforce issues (Groeger et al. 1992). In 1993, Gay et al published another descriptive
study which surveyed physicians in the Critical Care Council of the American College of Chest
Physicians (Gay, Dellinger and Offord 1993). Most respondents were pulmonologists who spent
about 40 percent of clinical time in the ICU. This study described practice patterns, but did not
apply them to workforce requirements.

Abt Associates Inc. 3
After reviewing this background information, COMPACCS concluded that most previous
workforce projections were flawed and often based on consensus or incomplete data. Therefore,
COMPACCS decided that its major assignment was to document the current demand for the
services of pulmonary and critical care physicians and project this demand well into the future,
namely, through the year 2030. This assignment was divided into three separate tasks:
! describe the current workforce requirements for pulmonary and critical care specialists basedon nationally representative data
! identify the factors likely to affect the future supply and demand for these specialists
! develop a computer based forecasting tool to project future requirements through the year2030. This tool could be used to study how certain key variables could influence supply anddemand for pulmonary and critical care physicians
There are several unique elements of this approach. The first is that COMPACCS chose a fore-
casting horizon of over thirty years, which is longer than most published workforce studies. The
reason is that the American population will experience major demographic changes in this time
frame. The second important point is that this study encompasses both pulmonary and critical
care physicians, because of their considerable overlap in practice. This combination complicates
the analysis since critical care physicians come from many different specialties. The third point
is that the COMPACCS decided that the current demand for care should be documented by data
which attempt to capture the wide variation in practice and economics across the country. In
virtually all previously reported workforce studies, such data were not obtained.
This report describes the construction of the workforce model for pulmonary and critical care
physicians, the data sources utilized, and the resulting projections of future workforce require-
ments. Chapter 2 outlines the structure of the model and presents the components of supply and
demand used in its estimation. It also describes the two physician surveys as well as other data
sources used to calibrate the model to the 1997 physician workforce. Chapter 3 describes the
results of the two physician surveys in considerable detail. The surveys are a rich source of
information describing both the activities of practicing specialists in pulmonary and critical care
medicine and the current organization of care for patients in critical care units. Many of the results
presented in this chapter do not bear directly on the workforce model, but are shown to better
characterize pulmonary and critical care practice in the late 1990s. In Chapter 4 the estimated
parameters of the model are presented and the model is used to forecast the future trajectory of
demand and supply for critical care and for pulmonary specialist time under the baseline (or status
quo) model and under several alternative scenarios. Chapter 5 is a summary and conclusion.

Abt Associates Inc. 4
2.0 Methods and Data
2.1 Overview of Methods
COMPACCS was assigned to study the workforce issues affecting both pulmonary and critical
care physicians. There is both overlap and diversity in the clinical practice and interests of these
physician groups. Pulmonary physicians, who are trained in the specialty of internal medicine,
subspecialize in chest disease but also care for critically ill patients. This overlap is reflected in
recent training patterns. The vast majority of recent pulmonary trainees are also trained and
certified in the subspecialty of critical care. Another group of intensivists is comprised of internists
whose subspecialty training and certification is in critical care alone.
Besides internal medicine, other specialties also sponsor formal training programs and certification
in critical care. Both surgery and anesthesia have completed workforce studies for their specialties
at large but COMPACCS felt that both anesthesia and surgical critical care were essential
dimensions in its workforce study.
COMPACCS chose not to examine the workforce issues in two subspecialties that provide critical
care — cardiology and neonatology. Cardiology had recently completed its own workforce
analysis and COMPACCS did not consider cardiac care to be a major role for pulmonary and
critical care physicians. While acknowledging neonatology as an important pediatric subspecialty,
COMPACCS decided that to focus its resources on the workforce issues related to the care of
adults. All other adult specialties or subspecialties have little impact on critical care training and
practice and were not included in the COMPACCS study.
The COMPACCS workforce model for pulmonary and critical care medicine most resembles that
employed by the Bureau of Health Professions (1991) in that it calculates future requirements
necessary to sustain per capita utilization (by age category) at its current level. Conceptually, the
COMPACCS model is based on several sequential steps.
Step 1. Describe the total amount of pulmonary and critical care presently provided to
adults in the United States.
Step 2. Estimate the percent of that care which is being provided by pulmonary and
critical care physicians.
Step 3. Describe the changes in the American population to the year 2030.
Step 4. Link these population changes with future demands for pulmonary and critical
care.

Abt Associates Inc. 5
Step 5. Compare future demands with anticipated supply of pulmonary and critical care
specialists.
Step 6. With computer modeling, document how the supply and demand would be in-
fluenced by certain key variables other than population (e.g. managed care,
changes in disease prevalence, etc.)
All studies of the physician workforce that forecast future needs must relate current and future
supply of physician time to some measure of requirements for that time. COMPACCS' approach
represents an improvement over previous published efforts to project physician workforce. Many
previous studies have been based on potentially flawed assumptions. For example, Jacobsen
(1987) and Schwartz (1988) relied on assumptions about clinical practice patterns, rather than
objective, nationally representative data. Weiner (1994) used staffing patterns from managed care
to establish future requirements but these data were subsequently challenged. (Hart et al. 1997).
Others (e.g. Steinwachs 1986) have relied on expert judgment to establish optimal physician time
per patient as a basis for time requirements.
In contrast, COMPACCS decided to base its workforce model on objective data from public
databases and from rigorous survey methodology. Furthermore, the model encompasses other
important variables which can influence the outcome. Some obvious factors which could change
over time include: specialist work habits, managed care penetration, training requirements,
physician retirement, technology, and disease prevalence. Unlike the population demographics,
predicting the changes in these variables is highly speculative. This uncertainly lends itself to a
computer model which can be used to study the interaction and influence of these variables in
certain hypothetical future scenarios. Through such an analysis, a clearer picture of workforce
demands can be painted far out into the future.
The COMPACCS workforce model is constructed from a number of constituent relationships.
1. Characterizing the Demand for Critical Care in 1997
The amount of critical care provided in the United States is captured on a variety of public
databases. Unlike other specialty care, there is no outpatient critical care and therefore hospital
databases, such as the Health Care Financing Administration’s MedPAR file, serve as rich sources
of information. These data provide the demand for critical care in specific age groups which can
then be projected into the future as the population changes in its age distribution.
The amount of critical care provided by pulmonary and critical care specialists is virtually
impossible to derive from public databases. Billing information, a potential source, is notoriously
inaccurate in identifying subspecialists. COMPACCS concluded that survey data would be

Abt Associates Inc. 6
necessary to solve this problem. Two surveys were designed, and conducted according to the
stratified sampling technique (described in detail in Section 2.3).
The first survey was directed at a nationally representative group of physicians who, on the AMA
Masterfile, reported themselves as pulmonary and/or critical care physicians. The survey asked
these physicians to describe both the quantity and type of clinical care which they provide.
Particular attention was paid to the amount of critical care. The second survey, using similar
sampling techniques, was sent to directors of intensive care units (ICUs). This survey asked the
ICU directors to describe the critical care provided in their units, with particular attention to that
proved by pulmonary and critical care physicians.
The combination of these data were then used to provide an accurate picture of critical care in
the United States. The public databases, combined with the ICU director survey, describe the
total critical care demand. The physician survey combined with the ICU director survey,
documented how much of this demand is provided by pulmonary and critical care physicians.
2. Characterizing the Demand for Pulmonary Care in 1997
Pulmonary diseases, such as asthma and emphysema, are common in clinical practice and span
both inpatient and ambulatory venues. Respiratory illnesses are treated by many types of physi-
cians. Therefore, capturing the total national demand for pulmonary care and the role of
specialists in that care is complex.
COMPACCS utilized inpatient data from the Hospital Cost and Utilization Project (HCUP-3) to
describe the hospital care for respiratory diseases in the United States. Outpatient care was des-
cribed by encounter information from United HealthCare Corporation, one of the largest
insurance companies in the United States. This information spanned a wide range of age groups
and geographic locations. These data were then used to project the total demand for respiratory
care for the U.S. population. The portion of this demand provided by pulmonary subspecialists,
both inpatient and outpatient, was captured by the physician survey.
3. Projecting Future Demand for Pulmonary and Critical Care
The one well-known fact in forecasting demand for care is that the demographics of the American
population will change from 1997 through 2030. This change will largely be reflected as growth
in the elderly population. The expected quantity of specialist time demanded is computed by
multiplying time per capita by age category. The forecasted demand can then be projected for
each year as reflected by the distribution of age categories in the population.
Changes in other variables, besides demographics, could also influence demand. In constructing
its forecasting model, COMPACCS identified several key variables: economics, access to care,

Abt Associates Inc. 7
disease prevalence, and practice patterns. As a baseline, COMPACCS assumed little or no change
in these variables over time. However, these variables were included in the computer forecasting
model to study exactly how they might influence demand in certain future scenarios.
4. Projecting Future Supply of Pulmonary and Critical Care Physicians
In describing the current workforce of pulmonary and critical care physicians, COMPACCS
utilized the AMA Masterfile, a database considered the best source of information about
physicians in the United States. These data are self reported and any physician can proclaim to
be a specialist without board certification or even formal training. COMPACCS accepted this
characteristic of the database because critical care is a young subspecialty. In theory, there could
be many physicians functioning as intensivists who had no formal training and yet were viewed
by themselves and others as critical care specialists.
However, in projecting supply of physicians, COMPACCS assumed that in the future virtually
all physicians who claimed to be specialists would be formally trained. This notion is supported
by the rigorous credentialing now required by managed care organizations and hospitals. With
few exceptions, new physicians seeking a specialty designation must have evidence of completing
formal training. Therefore the future supply of pulmonary and critical care specialists would be
reflected by the output of the training programs in these subspecialties.
Linking this supply of physicians to the demand involves several calculations. The available
clinical time devoted to pulmonary and/or critical care for each subspecialty is assumed to be the
same as that described in the physician survey. The total amount of such care available from the
national workforce of these subspecialists depends on the size of each subspecialty group at any
future point in time. This cohort size is dependent on the supply of physicians and their retirement
ages.
Variations in practice patterns (e.g. more or less intensive care; part time jobs) could influence
the supply of care available. As with the demand analysis, the trajectory of this practice variable
is hard to predict and, therefore, has been included in the computer simulation model.
2.2 Secondary Databases Used
U.S. Census of Population. The 1997 population of the U.S. by metropolitan statistical area
(MSA) was obtained from the U.S. Census Current Population Survey for four age categories:
18-64, 65-74, 75-84, and 85+.Growth rates for each of the categories were obtained from the
Census Bureau’s web site (www.census.gov). Because the census does not produce location-
specific growth rates by age category, it was necessary to assume that population growth rates

Abt Associates Inc. 8
by age group will be the same across geographic areas. Census data were used to create the
variables and the denominators for , , and , defined below inpopgt icudayg pulday IPg pulvis OP
g
Section 2.4.
American Medical Association Masterfile. The AMA Masterfile was used as the sampling frame
for the physician survey. A listing of all physicians appearing on the Masterfile as of August 1996
and reporting a primary or secondary specialty of critical care or pulmonary medicine was
obtained from the AMA. Physicians were excluded if they reported a primary or secondary
specialty of pediatrics, reported themselves as retired from practice, or listed a mailing address
outside the 50 U.S. states. Fellows and other trainees were also excluded.
The University HealthSystem Consortium (UHC). The UHC is a consortium of academic medical
centers. The UHC produces an annual classification of the degree of managed care penetration
into U.S. urban markets into four categories as displayed in Table 2.1 below.
Table 2.1UHC Market Classification Scheme: September 1996
Stage Description Typical cities
Stage 1 Unstructured Knoxville TN; Iowa City IA; Mobile AL; Charlottesville VA
Stage 2 Loose framework Gainesville FL; Pittsburgh PA; Indianapolis IN; New York NY
Stage 3 Consolidation Denver CO; Baltimore MD; Boston MA; Philadelphia PA; DallasTX
Stage 4 Hyper-competitive
Sacramento CA; Los Angeles CA; Madison WI; Tucson AZ;Minneapolis MN
The categories are based on a formula involving proportion of the population enrolled in HMOs,
the number of HMOs with more than 100,000 enrollees, the proportion of HMO enrollees in the
top three HMOs, the proportion of specialists who work under capitation arrangements, the pro-
portion of the Medicare and Medicaid population enrolled in HMOs, and several other variables.
Rural areas were not classified by UHC and were assumed to be in Stage 1. These categories
were used to model managed care penetration by geographic location.
Medical Provider Analysis and Review (MedPAR). The number of ICU days for Medicare benefi-
ciaries aged 65 and over were drawn from the 1995 Medicare hospital MedPAR file. ICU days
were disaggregated by age group (65-74, 75-84, 85+) and by primary diagnosis. For the three
oldest age groups these were used to form the variables as defined in Section 2.4. Theicudayg
diagnoses and associated ICD-9-CM codes are given in Table 2.2 below.

Abt Associates Inc. 9
Table 2.2Primary Diagnoses for ICU Stays
Diagnoses ICD-9 Codes
Trauma 800-929, 950-959
Ischemic heart disorder 410-414
Arrhythmia 426-427
Heart failure 428
Neurologic dysfunction 431-435
Respiratory insufficiency 518.81-518.82, 518.5
Hepatic failure 570, 573.4
Gastrointestinal hemorrhage 532.10, 532.50
Multiple organ system dysfunction (MOD) ICD-9 MOD Score > 1*
Sepsis 001-104, 110-118, 320,322, 461, 462
Burns 940-949
Renal failure 584
DKA 250.1, 250.3
Poisoning/overdose 960
All other conditions
* The ICD-9 MOD score is a score based on presence or absence of acute organ dysfunction in any one ofsix organ systems where one point is awarded for each organ system failing. Full details of the codes usedare available from the authors.
New Jersey Hospital Reporting System. The MedPAR data provide no information about ICU
stays for individuals not enrolled in Medicare. ICU days per capita for the population aged 18-64
were extracted from the New Jersey Hospital Reporting System. Diagnostic categories were the
same as those in Table 2.2 above.
SMG Marketing Group. The sampling frame for the survey of ICU directors was developed from
the 1996 SMG Hospital Market Database. The database was used to produce a computerized
listing of 4,440 U.S. hospitals with one or more intensive care units.
Healthcare Cost and Utilization Project (HCUP-3) from the Agency for Health Care Policy and
Research. Inpatient days for patients with a primary diagnosis indicating pulmonary disease were
drawn from Release 5 of the Nationwide Inpatient Sample of HCUP-3. Data were aggregated
to national totals using weights provided on the file. These totals were used to construct the

Abt Associates Inc. 10
variables . Diagnostic categories and associated ICD-9 codes are presented in Table 2.3pulday IPg
below.
United HealthCare Corporation. Unpublished data from United Health Care were used to
estimate outpatient visits to pulmonologists by age and diagnosis for calendar 1997. The data
represent approximately 2.5 million person-years of care from over 30 geographically dispersed
health plans. Diagnostic categories are those given in Table 2.3.
Table 2.3Pulmonary Diagnoses for Inpatient Days and Outpatient Visits
Diagnoses ICD-9 Codes Conditions
COPD 490, 491-492, 494, 496 Bronchitis, NOS; chronic bronchitis, emphy-sema; bronchiectasis; chronic airwayobstruction
Asthma 493 Asthma
Interstitial Lung Disease 500-505, 508, 516, 517,714.81, 518.3, 277.8
Pneumoconiosis, asbestosis, silicosis, radiationpneumonitis, other alveolar and parietoalveolarpneumopathy; lung involvement in conditionsclassified elsewhere; rheumatoid lung; pulmeosinophilia; eosinophilic granuloma
Pneumonia 460-466, 480-487, 507,513, 112.4, 114, 115.05,116, 117.3, 117.7, 039.1,136.3, 011
Acute resp infections; pneumonia andinfluenza, lung abscess, coccidiomycosis,histoplasmosis, blastomycosis, aspergillosis,nocardia; PCP; tuberculosis
HIV 042-044, 176.4, HIV with or causing other specified conditions,other HIV infection; Kaposi’s lung
Lung cancer 162-164, 196.1, 197.1,197.2, 197.3, 212.1-212.5
Lung cancer, intrathoracic LN, metastasis tolung, mediastinum, pleura, benign neoplasm
Pleural disease 510, 511, 512, 012, 860 Empyema; pleurisy; pneumothorax; traumaticpneumothorax and hemothorax
Respiratory failure orpulmonary insufficiency
515, 518.0, 518.4, 518.5,518.81, 518.82, 799.1,415.0
Postinflammatory pulmonary fibrosis; pulcollapse; pul edema; pulmonary insufficiency,respiratory failure; respiratory arrest; acute corpulmonale
All other respiratoryconditions
514, 518.1-518.2, 519,934, 780.5, 277.0, 470-478, 786, 415.1, 416-417, 495, 506
Pulmonary congestion; interstitial andcompensatory emphysema; foreign body intrachea, bronchus, and lung; sleep disturbance,cystic fibrosis; other diseases of the upperrespiratory tract; symptoms involvingrespiratory system; pul embolism; chronic pulheart disease; other diseases of pul circulation;;resp conditions due to chemical fumes &vapors
Abt Associates Inc. 11
2.3 Survey Data
2.3.1 Survey Techniques
While it is possible to approximate the quantity of critical care and of inpatient pulmonary care
provided in the U.S. using publicly available databases, the organization of this care and the acti-
vities of specialists providing it remains poorly understood. Staffing patterns in ICUs, the
allocation of time by pulmonary and critical care specialists to clinical and other activities, as well
as the amount of clinical time devoted to critical care, pulmonary care, and internal medicine
remain unexplored. Because this information is critical to the development of parameters for the
workforce model, two mail surveys, one of pulmonary and critical care specialists and one of ICU
directors, were carried out in 1997.
The two surveys were conducted using stratified random sampling to select a target sample of
1,000 physicians and of 1,173 ICU directors. Unlike simple random sampling, in which every
individual in the population has an equal chance of selection into the sample, stratified random
sampling permits individuals with specified characteristics to be oversampled to ensure a balance
of particular characteristics (Cochran 1968). A stratified sample is drawn by partitioning the
population into cells, defined by age, geography, specialty, and gender in the case of the physician
survey, and by hospital size, geography, and type of unit for the ICU director survey. Individuals
from the population are then drawn randomly from within each cell to construct the survey
sample. Stratified sampling of this sort is one of the most common methods for conducting
surveys.
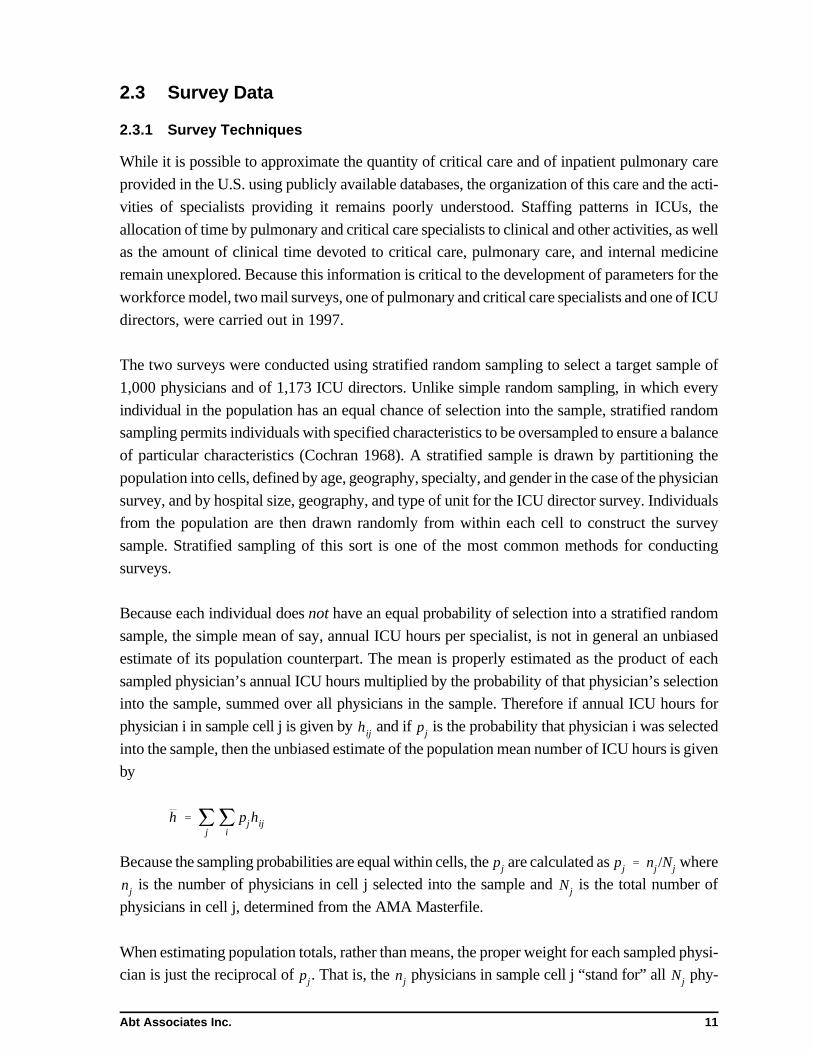
Because each individual does not have an equal probability of selection into a stratified random
sample, the simple mean of say, annual ICU hours per specialist, is not in general an unbiased
estimate of its population counterpart. The mean is properly estimated as the product of each
sampled physician’s annual ICU hours multiplied by the probability of that physician’s selection
into the sample, summed over all physicians in the sample. Therefore if annual ICU hours for
physician i in sample cell j is given by and if is the probability that physician i was selectedhij pj
into the sample, then the unbiased estimate of the population mean number of ICU hours is given
by
h ' jjj
ipjhij
Because the sampling probabilities are equal within cells, the are calculated as wherepj pj ' nj /Nj
is the number of physicians in cell j selected into the sample and is the total number ofnj Nj
physicians in cell j, determined from the AMA Masterfile.
When estimating population totals, rather than means, the proper weight for each sampled physi-
cian is just the reciprocal of . That is, the physicians in sample cell j “stand for” all phy-pj nj Nj

Abt Associates Inc. 12
sicians in cell j in the population. Each sampled physician therefore represents populationNj /nj
physicians. This weighting process (including corrections for nonresponse) will be treated further
in Chapter 3.
2.3.2 The Physician Mail Survey
The Survey Sample
The frame for the physician survey was defined as all physicians appearing on the 1996 American
Medical Association Physician Masterfile who declared a primary or secondary specialty in either
critical care or pulmonology. Physician name, address, age, telephone number, and primary and
secondary specialty were obtained from the AMA. The following individuals were excluded from
the sampling frame:
• individuals with a mailing address outside the 50 U.S. states,
• individuals who declared a primary or secondary specialty in pediatrics or neonatal
care,
• residents, fellows, and trainees,
• retirees, and
• individuals who do not have an M.D.
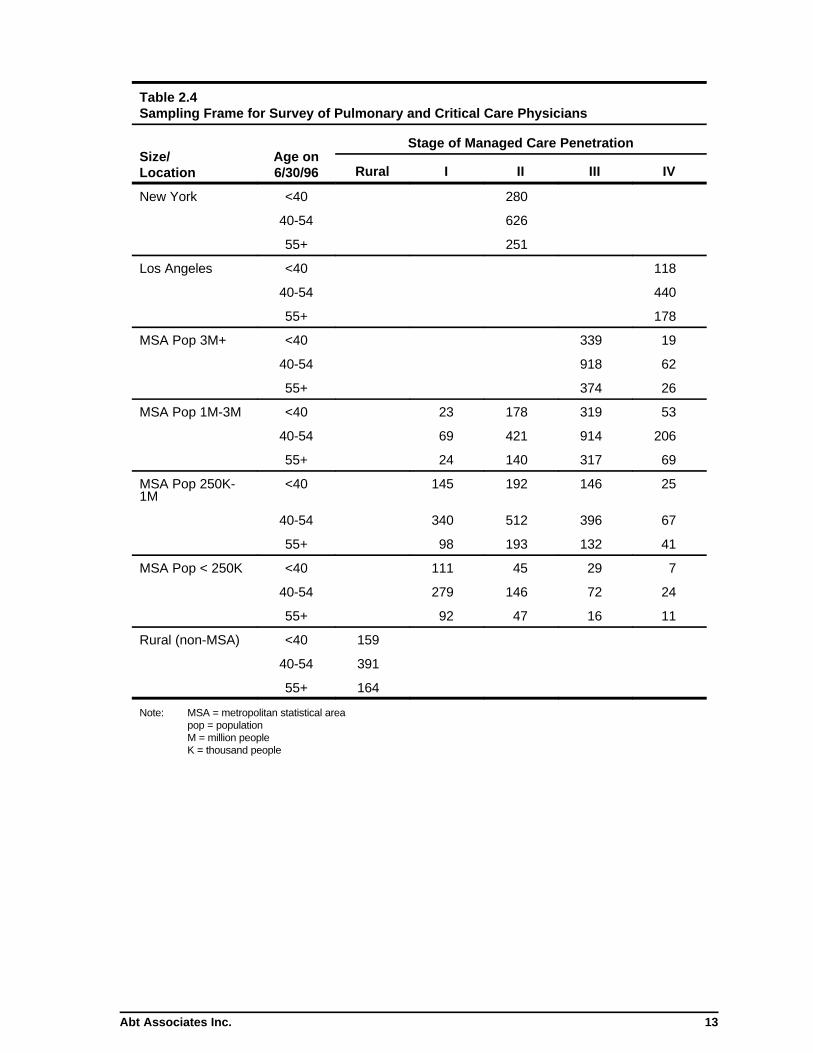
The sample was stratified on the basis of age, size of place, and extent of managed care penetra-
tion, as defined by the University Health Consortium. (See Section 2.3) The stratum values and
size of the sampling frame by cell are shown in Table 2.4. Because survey cost was identical
across cells and because there was no reason to believe that response rates or the variance of re-
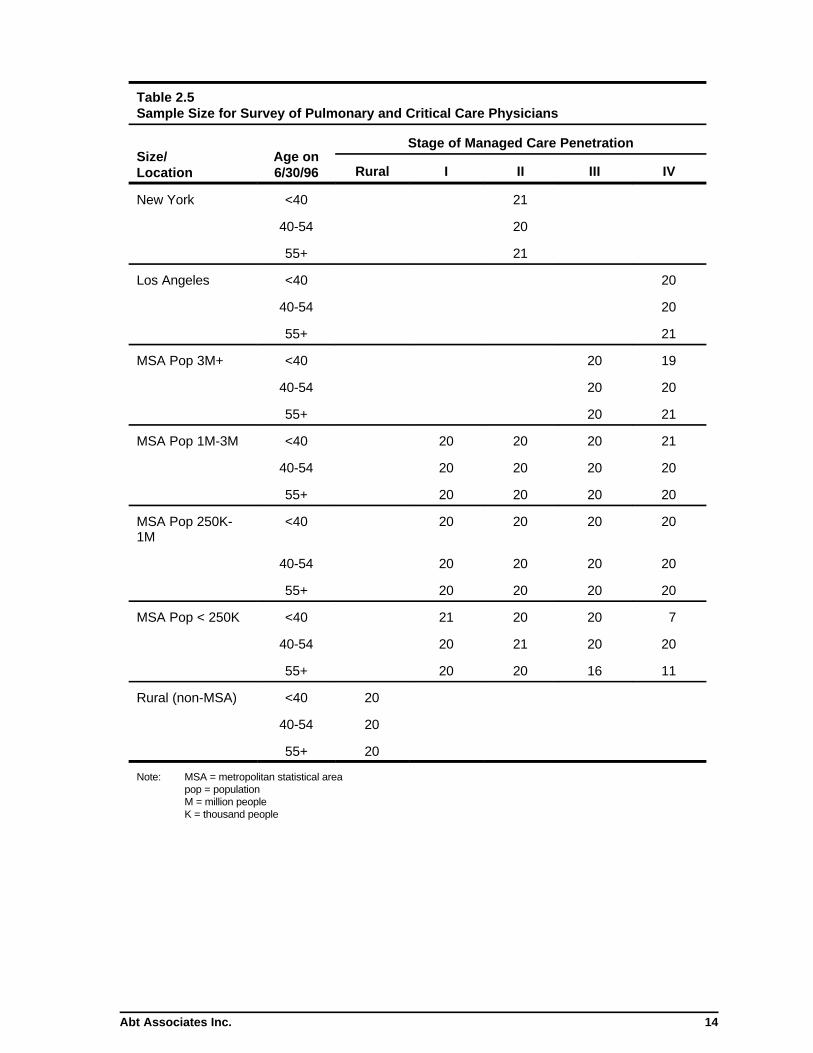
sponses varied across cells, optimum allocation required equal sample sizes for each cell. Twenty
physicians were drawn from each cell in the frame. All physicians were drawn from cells con-
taining fewer than 20 physicians. Distribution of the survey sample by cell is shown in Table 2.5.
Sampling probabilities were altered within each cell to ensure minimum representation of parti-
cular configurations of specialties. These configurations were:
• pulmonary medicine & critical care
• critical care & surgery
• critical care & anesthesia
• pulmonary medicine without critical care
• critical care and internal medicine
Abt Associates Inc. 13
Table 2.4Sampling Frame for Survey of Pulmonary and Critical Care Physicians
Size/Location
Age on6/30/96
Stage of Managed Care Penetration
Rural I II III IV
New York <40 280
40-54 626
55+ 251
Los Angeles <40 118
40-54 440
55+ 178
MSA Pop 3M+ <40 339 19
40-54 918 62
55+ 374 26
MSA Pop 1M-3M <40 23 178 319 53
40-54 69 421 914 206
55+ 24 140 317 69
MSA Pop 250K-1M
<40 145 192 146 25
40-54 340 512 396 67
55+ 98 193 132 41
MSA Pop < 250K <40 111 45 29 7
40-54 279 146 72 24
55+ 92 47 16 11
Rural (non-MSA) <40 159
40-54 391
55+ 164
Note: MSA = metropolitan statistical areapop = populationM = million peopleK = thousand people
Abt Associates Inc. 14
Table 2.5Sample Size for Survey of Pulmonary and Critical Care Physicians
Size/Location
Age on6/30/96
Stage of Managed Care Penetration
Rural I II III IV
New York <40 21
40-54 20
55+ 21
Los Angeles <40 20
40-54 20
55+ 21
MSA Pop 3M+ <40 20 19
40-54 20 20
55+ 20 21
MSA Pop 1M-3M <40 20 20 20 21
40-54 20 20 20 20
55+ 20 20 20 20
MSA Pop 250K-1M
<40 20 20 20 20
40-54 20 20 20 20
55+ 20 20 20 20
MSA Pop < 250K <40 21 20 20 7
40-54 20 21 20 20
55+ 20 20 16 11
Rural (non-MSA) <40 20
40-54 20
55+ 20
Note: MSA = metropolitan statistical areapop = populationM = million peopleK = thousand people

1 See Appendix B.
Abt Associates Inc. 15
Women were also oversampled. Consequently, the sampling weights vary within and across cells.
The distribution of women and of the listed specialty configurations in the mail sample are given
in Table 2.6.
Table 2.6Distribution of Women and Specialties in the Physician Mail Survey
Group Number of QuestionnairesMailed
Women 181
Pulmonary & critical care 170
Critical care & surgery 119
Critical care & anesthesia 158
Pulmonary without critical care 383
Critical care & internal medicine 170
Each sampled physician was mailed a 10-page questionnaire which elicited information about his
or her training, current medical practice, and time allocation.1 The questionnaire was accompanied
by a letter from Dr. Mark Kelley on behalf of the COMPACCS group. Questionnaires were
returned by Business Reply mail. In efforts to attain a high response rate, the following schedule
was implemented:
• Reminder letters were sent to all individuals 2-3 weeks after the initial mailing • Reminder telephone calls were made to those who had not responded within 1-2
weeks after the reminder letters• Questionnaires were remailed to those who did not receive the initial mailing or
who lost or discarded it. • Reminder letters were resent to those who had not yet responded within 1-2
weeks after the remailing of the questionnaires
2.3.3 The Mail Survey of ICU Directors
The Survey Sample
The frame for the mail survey of critical care units was developed from the SMG Hospital Market
Database. The sample of intensive care units (ICUs) was stratified on the basis of hospital size,
population of the city or locality in which the hospital is located, and extent of managed care

Abt Associates Inc. 16
penetration, as defined by the University Health Consortium. The stratum values and size of the
hospital sampling frame by cell are shown in Table 2.7.
Because there was reason to believe that there are a greater number of ICUs in larger hospitals,
larger hospitals were oversampled to provide greater power than would result from simple
random sampling. Consequently, sampling weights vary within and across cells. The distribution
of the survey sample by cell is shown on the next page in Table 2.8.
Table 2.7Hospital Sampling Frame for Survey of Critical Care Units
Size/Location
TotalNumber
ofHospital
Beds
Stage of Managed Care Penetration*
Rural I II III IV
New York <125 11
126-250 41
250+ 128
Los Angeles <125 47
126-250 79
250+ 80
MSA Pop 3M+ <125 72 3
126-250 129 4
250+ 224 16
MSA Pop 1M-3M <125 7 56 91 33
126-250 9 59 119 28
250+ 14 106 181 55
MSA Pop 250K-1M <125 60 71 54 19
126-250 56 82 71 12
250+ 113 125 128 19
MSA Pop < 250K <125 47 34 21 3
126-250 71 36 22 8
250+ 88 47 24 6
Rural (non-MSA) <125 1090
126-250 375
250+ 113*The categories of managed care penetration were supplied by the University Health Consortium (UHC). The UHC does not assign managedcare penetration rates to rural localities. Hence rural areas appear as a separate stratum of the sampling frame.

2 See Appendix C.
Abt Associates Inc. 17
Table 2.8Sample Size for Survey of Critical Care Units
Size/Location
TotalNumber
ofHospital
Beds
Stage of Managed Care Penetration
Rural I II III IV
New York <125 11
126-250 26
250+ 41
Los Angeles <125 26
126-250 26
250+ 26
MSA Pop 3M+ <125 25 3
126-250 41 4
250+ 41 13
MSA Pop 1M-3M <125 7 26 41 26
126-250 8 25 40 25
250+ 14 41 41 26
MSA Pop 250K-1M <125 26 26 41 18
126-250 26 26 26 12
250+ 39 40 41 18
MSA Pop < 250K <125 25 26 19 1
126-250 26 26 21 8
250+ 41 26 24 6
Rural (non-MSA) <125 41
126-250 41
250+ 41
All of the hospitals in the sample were contacted by telephone to determine the number of distinct
ICUs in the facility and the director of each unit. Individual units within each hospital were
selected to assure a representative sample of general (medical/surgical), medical, surgical, and
specialty ICUs. Facilities specifically designated as cardiac care units (CCUs) or neonatal
intensive care units were excluded. The distribution of the critical care units surveyed by type is
shown in Table 2.9.
Each sampled ICU director was mailed a questionnaire which elicited information about the
current staffing patterns of the critical care unit.2 The questionnaire was accompanied by a letter
from Dr. Mark Kelley on behalf of the COMPACCS group. Questionnaires were returned by

Abt Associates Inc. 18
Table 2.9Distribution by Type of Unit in the Mail Survey of ICU Directors
Type of Critical Care Unit Number of Questionnaires Mailed
General (Medical/Surgical) 732
Medical 127
Surgical 139
Burn 25
Neurological 40
Respiratory 17
Cardiothoracic 46
Transplant 17
Trauma 30
Business Reply mail. In efforts to attain a high response rate, the following schedule was
implemented:
• Reminder letters were sent to all individuals 2-3 weeks after the initial mailing • Reminder telephone calls were made to those who had not responded within 1-2
weeks after the reminder letters• Questionnaires were remailed to those who did not receive the initial mailing or who
lost or discarded it• Reminder telephone calls were made to those who had not yet responded within 1-2
weeks after the remailing of the questionnaires• Questionnaires were remailed to those who expressed interest in completing the
survey
2.4 Modeling Techniques
OverviewThe models described below are constructed from a number of constituent relationships between:
the size, growth, and aging of the U.S. population; the prevalence of diseases likely to be treated
by intensivists and pulmonologists; the aging, retirement and replacement of pulmonary and
critical care specialists; and the number of hours devoted to clinical practice by those specialists.
These factors describe the demand for and supply of specialist time from the present to the year
2030 under alternative scenarios of disease prevalence, physician work effort, number of new
specialists trained, and the organization of intensive care units. Both the ICU and the pulmonary
workforce models are constructed from three components:

Abt Associates Inc. 19
1. Characterizing initial (1997) equilibrium. Specialist hours per capita by diagnosis
and age category are calculated based on observed ICU days, pulmonary inpatient
days and outpatient pulmonary visits, and on estimated total pulmonary and critical
care time devoted to these forms of care.
2. Project growth in demand. The expected quantity of specialist time demanded is
computed by multiplying time per capita by age category (from 1, above) by the
forecasted growth in population by age group for each year from 1997 to 2030.
3. Project growth in supply. The quantity of specialist time supplied is computed by
multiplying the mean time devoted to each form of care by physicians of each age,
sex, and specialty by the predicted number of specialists in each age-sex-specialty
category for each year from 1997 to 2030.
Under the base model, the trajectory of demand for both pulmonary and intensivist time is
determined entirely by the growth and changing age structure of the population. Demand
increases over the next 30 years not only because of growth in the population but also because
its current demographic structure ensures that an ever-increasing share of the population will
occupy age categories with relatively high per-capita utilization. The corresponding trajectory for
supply is determined by the number of specialists in practice in 1997, their predicted hours of
work and rates of retirement, and the expected number of new entrants. There is no provision for
deaths or for entry into critical care or pulmonary medicine by physicians currently practicing in
other specialties.
2.4.1 The Critical Care Model
Initial equilibrium. The model begins by approximating the mean intensivist time per ICU day
in 1997. Because we lack the data necessary to distinguish the varying amounts of time required
by patients of varying ages and diagnoses, we must assume that time per ICU day is independent
of both. Intensivist time per ICU day in 1997, denoted by , is calculated simply by dividingkICU
total estimated intensivist time in 1997 by the estimated number of ICU patient days. Because
ICU days in each age category g can be written as the product of ICU days per capita in the age
group and the population of the age group, this division can be expressed in an equivalent way
that illustrates the effect of population growth on intensivist time requirements.
H cc1997 ' kICUj
4
g'1popg, 1997 @ icudayg[2.1]
where denotes total intensivist hours in 1997, is the 1997 population in age groupH cc1997 popg, 1997
g, and represents the number of ICU days per capita (in 1997) in age group g. Theicudayg

Abt Associates Inc. 20
population was partitioned into four age groups, defined to align as closely as possible to sources
of available data: 18-64, 65-74, 75-84, and 85+. Because hours provided by pediatricians were
not studied here, demand for ICU time by individuals under the age of 18 was not considered. For
1997, values of , , and are used to compute . H cc1997 popg, 1997 icudayg kICU
The supply of intensivist hours devoted to critical care is assumed to be determined by a
physician's age, sex, specialty, faculty status, and by the degree of managed care penetration in
the physician's metropolitan area. In order to better capture age differences in critical care hours,
interaction terms for age and sex and for age and specialty were also used. The determinants of
annual ICU time were estimated via weighted least squares. Because all covariates in the model
are available or can be calculated from information available in the AMA Masterfile, the total
number of hours of ICU care provided by intensivists in 1997 can be computed as
[2.2] Hcc
1997 ' jN
j'1j
i
á i xij,1997
where N is the number of intensivists practicing in the U.S., as determined from the Masterfile, á i
are estimated regression coefficients, and are covariate values such as age, sex, and specialty.xij
Note that the quantities in equations [2.1] and [2.2] are equal by construction, as required by our
assumption that the market is in a state of equilibrium in 1997.
The ability of the estimated regression equation, and hence of equation [2.2] to capture accurately
the effects of managed care on physician hours worked is naturally open to some question. A
widespread perception has emerged in recent years that the gradual replacement of fee-for-service
medical care, financed by indemnity insurance and patient’s resources with managed care
arrangements characterized by contractual relationships between physicians and risk-bearing
entities, would profoundly alter the nature of physician work, especially among specialists. But
the nature of the new equilibrium is difficult to discern even now, with the transition already well
underway.
The regression model underlying equation [2.2] attempts to capture the effect of managed care
by estimating the relationship between annual hours worked by intensivists and a measure of
managed care penetration into the metropolitan areas in which they practice. The measure is used
to define two indicator variables, one that is set equal to one for managed care penetration be-
tween 10 and 25 percent (zero otherwise) and a second that is equal to one for managed care
penetration exceeding 25 percent (zero otherwise). However the actual influences of managed
care on work effort are likely to be highly variable within each area and so the estimated effects
of managed care may be understated.

Abt Associates Inc. 21
Growth in demand. If the number of ICU days per capita by age group, , remainsicudayg
unchanged over time, then the number of critical care hours required in a future year, t, to provide
the same intensivist time per ICU day is given by
[2.3] H cct ' kICUj
4
g'1popgt @ icudayg
permitting calculation of the change in intensivist hours required due solely to the growth and
aging of the population.
Mean intensivist time per ICU day, , and ICU days per capita by age group (the ) arekICU icudayg
both pivotal quantities in the prediction of future demand and so are worth discussing further,
particularly because their future values are nearly impossible to predict. The base model and most
of its variations, created by introducing hypothetical changes in the number of trainees, hours
worked, and rates of retirement, all produce a calculation of the number of intensivist hours
necessary to achieve the same intensivist time per ICU day, and intensivist time per capita, as
existed in 1997. The assumption that time per ICU day and ICU days per capita by age group
will not change is probably incorrect. The evolution of new patterns of patient care and most
particularly the continuing innovations brought about by technological change will almost
certainly produce increases or decreases in and in the that may be totally unexpectedkICU icudayg
at this point. It is possible that a future technological change will sharply lower average length of
stay in ICUs, causing the s to fall and resulting in an overprediction by the model of theicudayg
number of intensivists required. Conversely, a new technology that markedly improves the
prognosis for certain ICU patients could require more continuous monitoring by intensivists with
specialized skills, thereby raising and generating a demand for intensivists far greater thankICU
that predicted by the model.
Predicting the demand for intensivists is thus very much a process of extrapolation. It projects
into the future those changes of which we are confident (the growth and aging of the population)
while maintaining at their current values those quantities whose future path cannot be reliably
forecast.
The effect of conjectured changes in the prevalence of diagnoses typical of ICU patients can also
be computed by noting that is itself equal to the sum of ICU days per capita in eachicudayg
diagnostic category. That is, the variable , may be written asicudayg
[2.4] icudayg ' j13
d
icudaygd
where is the number of ICU days per capita in age group g and diagnosis group d.icudaygd
Thirteen diagnostic categories, d, were defined for the ICU model:

Abt Associates Inc. 22
• Trauma
• Ischemic Heart Disorder
• Arrhythmia
• Heart failure
• Neurologic dysfunction
• Respiratory insufficiency
• Hepatic failure
• Gastrointestinal hemorrhage
• Multiple organ system failure
• Sepsis
• Burns
• DKA
• Other
Intensivist time per ICU day, , is understood to be an average time and, as computed, reflectskICU
the prevailing patterns of ICU staffing in the base year, 1997. Each intensivist is assumed to
practice under one of three ICU staffing models — a full-time intensivist model, a consultant
intensivist model, or a consultant specialist model. The COMPACCS Group, relying on personal
experience, billing information, pilot surveys, and examination of staffing data from Henry Ford
Health Systems, arrived at consensus estimates of mean intensivist time per patient-day under
each model:
• The full-time intensivist model. All or most of a patient’s care is directed by an inten-
sivist who has primary responsibility for care in the ICU. Mean time per patient-day
under the full-time intensivist model is assumed to be 45 minutes;
• The consultant intensivist model. An intensivist consults for another physician to co-
ordinate or assist in critical care but does not have primary responsibility for care.
Mean time per patient-day under the consultant intensivist model is assumed to be 30
minutes;
• The consultant specialist model. Multiple specialists are involved in the patient’s care.
No one is designated specifically as the consultant intensivist. The admitting physician
remains the physician of record. Mean time per patient-day under the consultant
specialist model is assumed to be 15 minutes.
A fourth staffing model, known as the single physician model and under which the primary
physician provides all physician care in the ICU, is assumed to require no intensivist time.
Changes in the distribution of staffing models, or more precisely in the distribution of ICU
patients by staffing model, will naturally produce concomitant changes in the demand for

Abt Associates Inc. 23
intensivist time. Overall intensivist time per ICU day, , is the weighted average of intensivistkICU
time per day in each of the three models,
[2.5] kICU ' s1 k (1)ICU% s2 k (2)
ICU% s3 k (3)ICU% s4 k (4)
ICU ; j si'1
where the weights are equal to the portion of total ICU days under each of the three models.si
Changes in the shares of ICU days provided under the three models can be expected to change
the value of and thus of intensivist time demanded after 1997. The are not estimated askICU k (m)ICU
we shall see, but rather are approximated on the basis of an assumed relationship among them.
Growth in supply. The supply of intensivist hours in any year is governed by the number of
specialists in practice and by the hours these individuals work in the ICU. More specifically, three
relationships must be estimated to account for the evolution of physician hours over time, which
may change due to:
• Changes in annual hours worked by intensivists in the ICU due to the changing agestructure of the intensivist population.
• The number of physicians leaving training programs and entering the practice ofcritical care.
• The number of physicians retiring from the practice of critical care.
Hours worked: The total number of hours provided by intensivists is expected to change as each
physician alters his/her hours worked with age and as the number of intensivists working, ,Nt
changes. We shall assume that the regression relationship of hours to individual characteristics
remains stable, so that total hours supplied in any year t in the future is given by
[2.6] Hcc
t ' jNt
j'1j
iá i xijt
where the are the estimated regression coefficients appearing in [2.2] and the are values ofá i xij
covariates (age, specialty, sex) for each physician in practice in year t.
Entry. The physician population is augmented each year by graduates from training programs.
The model assumes that the number of intensivists, N, is incremented annually by a predetermined
number in each of the following specialties:
• pulmonary medicine
• pulmonary/critical care
• critical care/internal med

Abt Associates Inc. 24
• critical care/surgery
• critical care/anesthesia
The number of entrants is assumed to be purely exogenous and is neither estimated as a
behavioral relationship nor calculated as a result of other model components. Although
historically, physicians have been trained in pulmonary medicine alone, it is the strong opinion of
COMPACCS that virtually all trainees now and in the future will be trained in both pulmonary
and critical care medicine. Therefore, the model assumes that all physicians trained in pulmonary
medicine after 1997 will practice critical care as well.
Retirement. Age at retirement from critical care is assumed to follow a Weibull density. The
Weibull form is widely used in economic and epidemiological research as a parametric failure-time
model (Amemiya, 1985; Collett, 1994; Cox and Oakes, 1989). The Weibull form of the survivor
function (the probability that an individual’s retirement age T, exceeds his/her current age ) isô
given by
[2.7] S (ô) ' Pr(T$ô) ' exp(&ë ôã)
where and denote the so-called scale and shape parameters. Because longitudinal data onë ã
actual retirement ages is not available, the stability of the scale and shape parameters for suc-
cessive cohorts of physicians is a maintained assumption of the model and cannot be tested. The
model estimated here expressed the scale parameter as a log-linear function of current age, :ô
[2.8] ln(ë )'á0%á1 @ô
Aging itself affects intensivist hours via the hours equation [2.6]. Total ICU hours in year t are
computed by summing the estimated number of hours for each physician (given characteristics
represented by in [2.6]) over the number of physicians, Nt, practicing in year t. The evolutionxij
of the number of intensivists in practice is in turn governed by:
[2.9] Nt ' At%pt Nt&1
where is the number of intensivists practicing in year t, is the number of intensivists enteringNt At
practice from training programs in year t, and is the proportion of physicians practicing in yearpt

3 Indices identifying the sex, age, and specialty of physicians are suppressed here for clarity. In practice, [2.9] is computed separately foreach sex-specialty configuration of intensivists.
4 Note that is a function of time only because of the dependence of the age structure of the population on time and because the totalptnumber of intensivists in practice changes over time. In a stable population, is a constant.pt
Abt Associates Inc. 25
t-1 who are also practicing in year t.3 The proportion is the mean of the conditional survivalpt
probabilities of all intensivists practicing in year t-1. That is4
[2.10] pt '1
Nt&1jNt&1
j'1sôj ; sô ' S (ô) /S (ô&1)
2.4.2 The Pulmonary Model
Initial equilibrium. Unlike the ICU model, the pulmonary model requires a distinction between
inpatient and outpatient time. On the supply side, however, we shall assume that inpatient and
outpatient pulmonary time are freely substitutable. It is quite possible, indeed likely, that this
assumption is not strictly correct. Nevertheless, the available data do not permit us to estimate
the appropriate substitution parameter and the assumption rules out the possibility of a
simultaneous surplus of pulmonary inpatient time and shortfall of pulmonary outpatient time.
Initial equilibrium is achieved as before by defining inpatient time per inpatient day, , as totalkpul IP
inpatient time divided by inpatient pulmonary days and outpatient time per visit, , as totalkpul OP
outpatient time divided by outpatient pulmonary visits. The expressions analogous to equation
[2.1] which define and for the pulmonary model arekpul IP kpul OP
[2.11] H pul IP1997 ' kpul IPj
4
g'1popg,1997 @pulday IP
g
and
[2.12] H pul OP1997 ' kpul OPj
4
g'1popg,1997 @pulvis OP
g
where and denote total hours devoted to inpatient and outpatient care by pul-H pul IP1997 H pul OP
1997
monologists in 1997, represents inpatient days per capita with pulmonary diagnoses inpulday IPg
1997, and represents outpatient visits per capita for patients with pulmonary diagnoses,pulvis OPg
also in 1997.
Growth in demand. The process for calculating growth in demand for pulmonary care closely
resembles that introduced earlier for ICU care. Given the values for and as definedkpul IP kpul OP
by [2.11] and [2.12], the values of are replaced by appropriate population values forpopg, 1997
future years, , to generate the demand for pulmonary hours in future years, andpopg t H pul IP1997

Abt Associates Inc. 26
. As before, we can decompose pulmonary inpatient days per capita and pulmonary out-H pul OP1997
patient visits per capita into the sum of days and visits for constituent pulmonary diagnoses, ie
pulday IPg ' j
9
d
pulday IPgd[2.13]
and similarly for outpatient visits, . Nine diagnostic categories were defined for thepulvis OPg
pulmonary model:
• COPD
• Asthma
• Interstitial lung disease
• Pneumonia
• HIV
• Lung cancer
• Pleural disease
• Respiratory failure/pulmonary insufficiency
• Other respiratory conditions
Growth in supply. The model’s treatment of hours supplied to pulmonary medicine is virtually
identical to the approach followed for intensivists and so will not be repeated here. Total hours
devoted to pulmonary inpatient and outpatient care in any year are calculated by summing pre-
dicted hours for each pulmonologist (computed using individual characteristics and estimated
regression coefficients) over the number of physicians projected to be practicing pulmonary or
pulmonary/critical care medicine in that year.
2.4.3 Workforce Projections Under Alternate Assumptions: The Simulation Model
The base model for workforc projections for pulmonary physicians and for critical care physicians
projects workforce requirements by assuming that the following remain constant: the relationship
of clinical hours provided by intensivists and pulmonologists to age, specialty, and managed care
measures; rates of specialist entry and retirement; age-specific per-capita utilization of critical care
and of pulmonary inpatient days and outpatient visits. Based on this assumption, the clinical hours
required and provided are calculated solely on the basis of projected demographic changes in the
population and of the projected future number and behavior of practicing specialists.
The simulation model can compute the paths of projected specialist time required and provided
under specified alternative conditions. In critical care, these variables include changes in disease-
specific ICU utilization rates, in the number and specialty-mix of new entrants to the practice of
critical care medicine, rates of retirement, alterations in the staffing of intensive care units, and

Abt Associates Inc. 27
changes in practice patterns brought about by the growth of managed care. The details of these
modeling features are described below. Changes in model assumptions of this sort can be
introduced “all at once” in any year or can be introduced gradually between 1998 and any chosen
year. In this latter case, the specified change is assumed to occur in linear fashion between 1998
and reaching the selected new value in the chosen year.
Prevalence of disease. As noted earlier, diagnostic categories were assigned to all ICU and
pulmonary inpatient days and all pulmonary outpatient visits. The base model assumes that the
number of days and visits per capita (by age group) and the distribution of diagnoses remains
constant over time. That is, , , and in equations [2.4], [2.11] and [2.12]icudaygd pulday IPgd pulvis OP
gd
do not change over time. This assumption is altered in the model by introducing specified changes
in the number of days or visits per capita by diagnosis and age group. Hence equation [2.4], for
example, is replaced by
[2.4'] icudayg ' j13
d
(icudaygd%Ägd)
where the represent chosen increases or decreases in the number of ICU days per capita inÄgd
age group g and diagnosis category d. The corresponding modifications to equation [2.11] and
[2.12] are obvious.
Entry to critical care. The base model assumes a constant annual number of entrants by
specialty as described in Section 2.1. In every year, these quantities are used as values for inAt
equation [2.9]. The model accommodates hypothetical changes in the number of new entrants by
specialty and sex by altering the value of in specified years. The value of , or moreAt At
specifically, the value of by specialty and sex is simply changed to any chosen value.At
Retirement. Hypothetical changes in retirement patterns are captured by sliding the survivor
function forward or backward by a distance sufficient to create any specified median retirement
age. This is achieved by altering the value of (see equation [2.8]) by an amount sufficient toá0
generate the desired median age of retirement. The simulation model does not allow for specialty-
specific changes in retirement behavior.
ICU Staffing models. Requirements for intensivist time are determined in part by prevailing
models through which ICUs are staffed, as shown in equation [2.5]. Increases in the proportion
of patient-days provided under the full-time intensivist model will increase the demand for
intensivist time, other things equal. Hypothetical alterations in the distribution of ICU patients by
staffing model are carried out by changing the values of the in equation [2.5]. That is, each insi si

5 The model calculates the new aggregate time requirements for intensivists under the assumption that mean patient length of stay is thesame under all staffing models.
Abt Associates Inc. 28
[2.5] is replaced by where the represent changes in the shares of patient-days providedsi%Äsi Äsi
under each model.5 Because shares must always sum to one, the model requires that .j Äsi'0
Managed care. The base model assumes that all intensivists practicing in 1997 and all new
intensivists entering practice after that time are subject to managed care influences captured by
the mean values of the managed care penetration indicator variables for 1998. Hypothetical
changes in the prevalence of managed care arrangements in the population and their effect on
workforce requirements are displayed in the model by altering the proportion of the intensivist
population practicing in areas with managed care penetration of 25 percent or more. The model
assumes that such changes are compensated by offsetting changes in the proportion of intensivists
practicing in areas with less than 10 percent and with 10-25 percent managed care penetration.

Abt Associates Inc. 29
3.0 Study Results
3.1 Survey Response Rates
3.1.1 The Physician Survey
A total of 415 usable questionnaires were received by the final receipt date, March 28 1997. The
survey completion rates by cell are given in Table 3.1.
Table 3.1Response Rate for Survey of Pulmonary and Critical Care Physicians
Size/Location
Age on6/30/96
Stage of Managed Care Penetration
Rural I II III IV
New York <40 38.1
40-54 35.0
55+ 33.3
Los Angeles <40 50.0
40-54 50.0
55+ 23.8
MSA Pop 3M+ <40 50.0 31.6
40-54 40.0 50.0
55+ 35.0 33.3
MSA Pop 1M-3M <40 40.0 40.0 55.0 42.9
40-54 55.5 45.0 50.0 55.0
55+ 25.0 30.0 60.0 40.0
MSA Pop 250K-1M <40 50.0 50.0 30.0 40.0
40-54 35.0 50.0 25.0 55.0
55+ 25.0 35.0 30.0 40.0
MSA Pop < 250K <40 61.9 40.0 60.0 71.4
40-54 45.0 52.3 65.0 35.0
55+ 35.0 20.0 25.0 27.3
Rural (non-MSA) <40 35.0
40-54 45.0
55+ 30.0
The survey response rate is compute as the ratio of completed questionnaires to eligible respon-
dents. Of the 1,000 physicians in the sample, 3 were found to be deceased, 47 were no longer in
practice, 30 said they did not practice pulmonary or critical care medicine, 3 specialized in pedia-
tric care, and 44 could not be located by mail or telephone after numerous attempts. The overall
response rate is therefore equal to 415/873 or 47.5 percent. This rate is typical of physician

Abt Associates Inc. 30
surveys. Cassel et al. (1998) achieved a response rate of 45.3 percent in a study of physician atti-
tudes toward firearm-related injury. Asch, Hansen-Flaschen, and Lanken (1995) attained a 53
percent response rate in a survey of the decision to limit or continue life-sustaining treatment by
critical care physicians.
3.1.2 The Survey of Critical Care Units
A total of 393 usable questionnaires were received by the final receipt date, August 29 1997. Theresponse rates by cells and by type of unit are given in Tables 3.2 and 3.3, respectively.
Table 3.2Response Rate for Survey of Critical Care Units
Size/Location
TotalNumber ofHospital
Beds
Stage of Managed Care Penetration
Rural I II III IV
New York <125 45.5
126-250 11.5
250+ 36.6
Los Angeles <125 19.2
126-250 15.4
250+ 26.9
MSA Pop 3M+ <125 36.0 33.3
126-250 22.0 0.0
250+ 26.8 61.5
MSA Pop 1M-3M <125 42.8 38.5 19.5 30.8
126-250 50.0 20.0 10.0 32.0
250+ 92.8 41.5 24.4 38.5
MSA Pop 250K-1M <125 38.5 23.1 22.0 55.6
126-250 30.8 19.2 23.1 41.7
250+ 30.8 22.5 34.1 50.0
MSA Pop < 250K <125 40.0 34.6 47.4 100.0
126-250 11.5 34.6 28.6 25.0
250+ 36.6 46.2 33.3 50.0
Rural (non-MSA) <125 48.8
126-250 26.8
250+ 46.3
Abt Associates Inc. 31
Table 3.3Response Rate by Type of Unit in the Mail Survey of ICU Directors
Type of Critical Care Unit N Response Rate
General (Medical/Surgical) 270 0.37
Medical 42 0.33
Surgical 39 0.28
Burn 8 0.32
Neurological 11 0.28
Cardiothoracic 9 0.20
Transplant 1 0.06
Trauma 9 0.30
Because no intensive care units were mis-identified in the sampling frame and because all could
be located, the completion rate and the response rate are identical for this survey.
Due to the low response rate of the ICU directors from the respiratory units, any questionnaires
received from respiratory units were analyzed with the responses from the directors of the medical
intensive care units.
3.2 Survey Weighting
Because it was not possible to include the universe of physicians or ICU units in the respective
surveys, survey responses were weighted to obtain estimates that are representative of the total
population. These weights were used in building the workforce model and also in producing the
population level statistics presented in Sections 3.3 and 3.4
Mathematically, the sampling weights for each survey consist of two components — an
adjustment for the probability of selection in the survey and the nonresponse adjustment. The
probability of selection for each observation is equal to the number of observations of that type
in the population (i.e., the universe size for the indicated cell) divided by the total number of
observations of that type that were included in the sampling frame. The reciprocal of this
probability is the sampling weight. The nonresponse adjustment is defined as the ratio of the
number of observations of a particular type in the sample for a given cell to the number of
observations of that type in the cell who returned a usable survey questionnaire. The final weight,
which is equal to the product of the sampling weight and the non-response weight, is given by:

Abt Associates Inc. 32
Weighti '(universe sizei)
(sampling frame sizei)×
(sampling frame sizei)
number of responsesi)
where i represents the cell from which the observation was drawn. The weight indicates how
many observations the respondent “represents” among the entire population of physicians or
ICUs.
For the physician survey, sampling probabilities within each cell were altered to ensure minimum
representation by physician speciality and gender. As a result, women were oversampled, as were
some medical specialties. This oversampling provided greater statistical power to detect differ-
ences in workforce behavior between male and female physicians, or between physicians.
Sampling weights were adjusted to reflect the higher probability of selection into the sampling
frame for women and certain types of critical care physicians. Consequently sampling weights
varied within and across cells.
Weights for the survey of ICU directors also corrected for differential sampling rates within cells.
The total number of units of each type of ICU unit (general, medica, surgical, burn, neurological,
etc) were estimated as the total number of units of that type identified by the telephone survey,
multiplied by the number of hospitals in the cell to the number contacted.
To produce population-level estimates, one can simply sum the final supplement observation
weights for all individuals having the characteristic of interest. To make estimates using con-
tinuous variables (i.e., total ICU patients treated under the full-time intensivist staffing model),
the sum of the variable is multiplied by the weight for the appropriate set of observations.
3.3 Physician Characteristics
Abt’s Survey of Selected Physicians collected detailed information on the professional charac-
teristics, practice patterns, and amount and allocation of work hours for pulmonologists and
critical care physicians. The primary purpose of the survey was to collect the information needed
to estimate the future workforce requirements of pulmonary and critical care physicians. In this
section, descriptive results from the physician survey are presented. Note that for both the physi-
cian survey and the survey of ICU directors, results have been weighted to correct for differential
sampling rates within cells to ensure that results are nationally representative.

6 These figures are based on the primary and secondary specialties reported in the AMA Master File.
Abt Associates Inc. 33
3.3.1 Baseline Data from AMA Masterfile
Based on data from the American Medical Association’s (AMA) Master File, in 1996, there were
10,244 physicians in the United States with a critical care or pulmonary specialty.6 More than
6,700 of these physicians were pulmonologists who did not report a critical care specialty.
Nationwide, of those who were self-described as critical care specialists, there were 1,349 pul-
monologists, 620 anesthesiologists, 324 surgeons and 1,220 internists (Table 3.4).
The pulmonary and critical care specialties are predominantly male. More than 90 percent of the
pulmonologists and critical care physicians in the country were males, and only 7 percent of
pulmonologists were female. The highest proportion of females were in the critical care surgeon
(13.8 percent) and critical care anesthesiologist (12 percent) specialties.
Table 3.4Universe of Critical Care Physicians and Pulmonologists by Specialtyand Gender
Physician type Total(% of total)
Male(% male)
Female(% female)
Pulmonologist 6,731(65.7%)
6,100(90.6%)
631(9.4%)
Critical care/pulmonologist 1,349(13.2)
1,252(92.9%)
97(7.1%)
Critical care/anesthesia 620(6.1%)
559(90.2%)
61(9.8%)
Critical care/surgeon 324(3.2%)
279(86.2%)
45(13.8%)
Critical care/internal medicine 1,220(11.9%)
1,076(88.2%)
144(11.8%)
Total(% of total)
10,244 9,266(90.4)
978(9.6%)
Notes: Figures are based on self-reported primary and secondary specialty.
Sources: AMA Master File
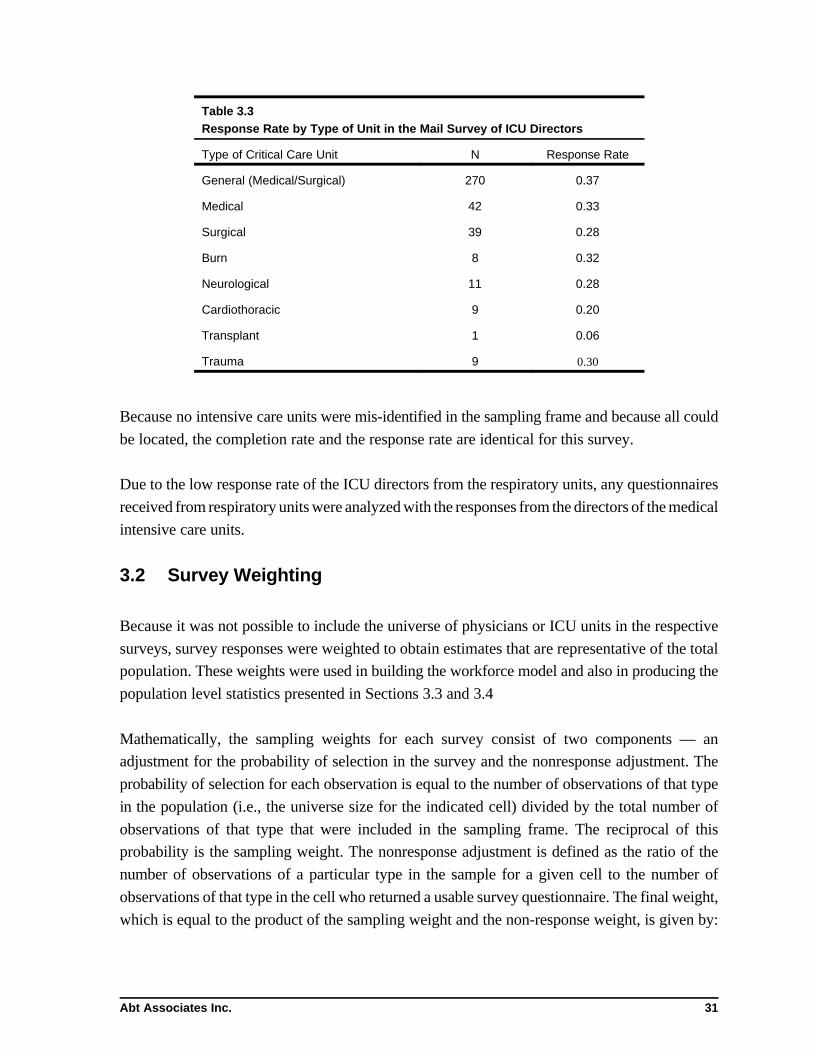
The average age of physicians with a critical care or pulmonary specialty was 47.6 years (Table
3.5). Pulmonologists tended to be older than physicians in other specialities (see Table 3.4 or
Figures 3.1 - 3.5). The average age of pulmonologists was 50 years, compared to between 43-45
years for the critical care specialists. Nearly 30 percent of pulmonologists were age 50 or over,
compared to between 4 and 10 percent for critical care physicians. These figures suggest that a

Abt Associates Inc. 34
higher proportion of pulmonologists will probably retire over the next few years than other
physicians.
Female physicians tended to be younger than their male counterparts. The average age of female
physicians was 44 years, compared to 48 years for male physicians (Table 3.6). More than 22
percent of male physicians were age 55 or over, compared to 12 percent of females.
Table 3.5Universe of Critical Care Physicians and Pulmonologists by Specialty and Age Group
Distribution of age by category
Physician type Average age Age < 40 Age 40-54 Age $$ 55
Pulmonologist 50.0 1074(16.0%)
3688(54.8%)
1969(29.3%)
Critical care/pulmonologist 43.3 382(28.3%)
906(67.2%)
61(4.5%)
Critical care/anesthesia 44.8 148(23.9%)
409(66.0%)
63(10.2%)
Critical care/surgeon 43.3 94(29.0%)
210(64.8%)
20(6.1%)
Critical care/internalmedicine
42.1 490(40.2%)
670(54.9%)
60(4.9%)
Total(% of total)
47.7 2188(21.4%)
5883(57.4%)
2173(21.2%)
Notes: Figures are based on self-reported primary and secondary specialty.
Sources: AMA Master File, 1996
Table 3.6Age Distribution of Critical Care Physicians and Pulmonologists by Gender
Distribution of age by category (percentage)
Physician type Averageage
Age < 40 Age 40-54 Age $$ 55
Male 48.1 1826(19.7%)
5383(58.1%)
2056(22.2%)
Female 43.9 362(37.0%)
500(51.1%)
116(11.9%)
Notes: Figures are based on self-reported primary and secondary specialty.
Sources: AMA Master File, 1996
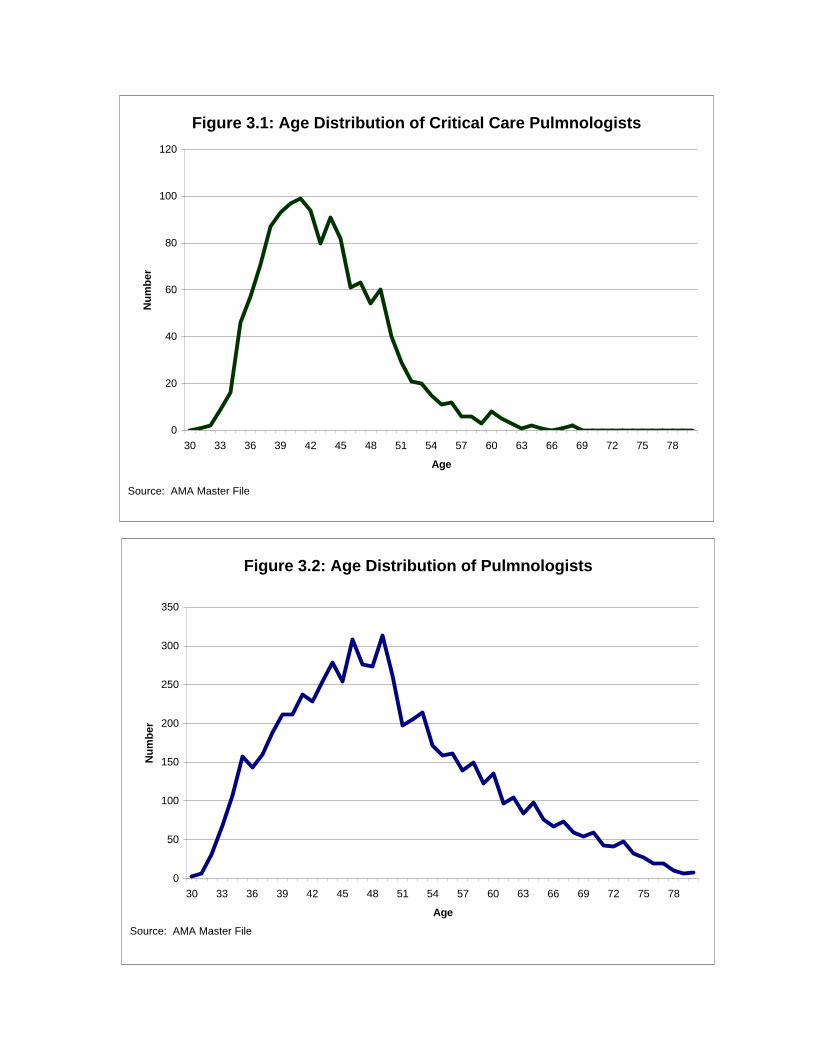
Figure 3.1: Age Distribution of Critical Care Pulmnologists
0
20
40
60
80
100
120
30 33 36 39 42 45 48 51 54 57 60 63 66 69 72 75 78
Age
Nu
mb
er
Source: AMA Master File
Figure 3.2: Age Distribution of Pulmnologists
0
50
100
150
200
250
300
350
30 33 36 39 42 45 48 51 54 57 60 63 66 69 72 75 78
Age
Nu
mb
er
Source: AMA Master File

Figure 3.3: Age Distribution of Critical Care Anesthesiologists
0
10
20
30
40
50
60
30 33 36 39 42 45 48 51 54 57 60 63 66 69 72 75 78
Age
Nu
mb
er
Source: AMA Master File
Figure 3.4: Age Distribution of Critical Care Surgeons
0
5
10
15
20
25
30
35
30 33 36 39 42 45 48 51 54 57 60 63 66 69 72 75 78
Age
Nu
mb
er
Source: AMA Master File
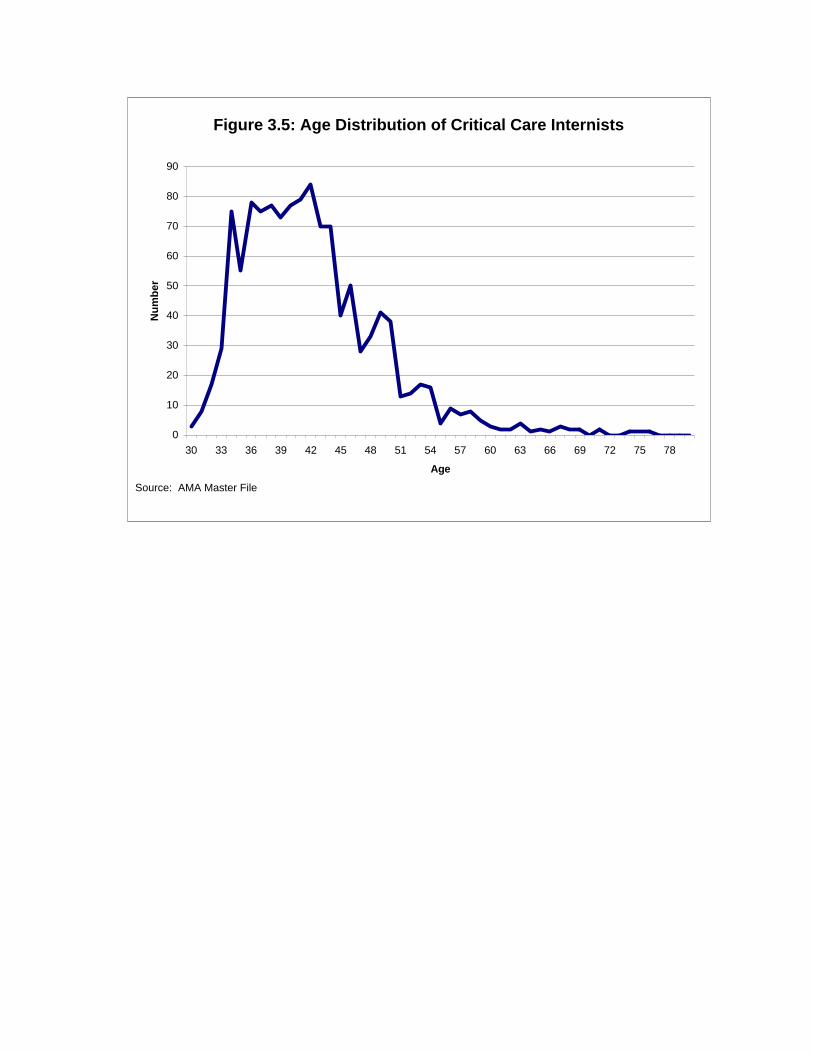
Figure 3.5: Age Distribution of Critical Care Internists
0
10
20
30
40
50
60
70
80
90
30 33 36 39 42 45 48 51 54 57 60 63 66 69 72 75 78
Age
Nu
mb
er
Source: AMA Master File

Abt Associates Inc. 38
3.3.2 Physician Characteristics and Practice from Study Survey
Faculty Status, Board Certification, and Professional Society Membership
Overall, 19 percent of critical care physicians and pulmonologists were full time faculty members
of medical schools, and 27 percent were ICU directors (Table 3.7). The proportion of full time
faculty members was highest among critical care surgeons and anesthesiologists.
Most physicians belonged to either the American College of Chest Physicians (ACCP), the
American Thoracic Society (ATS), or the Society of Critical Care Medicine (SCCM), and 13
percent belonged to all three of these professional societies. Membership in these professional
societies was lowest for critical care anesthesiologists and internists.
For physicians with an internal medicine practice, 87 percent were board certified. Nearly 95
percent of critical care surgeons were board certified in surgery, and 99 percent of critical care
anesthesiologists were board certified in anesthesia. Overall, 53 percent of physicians were certi-
fied in critical care, including 88 percent of critical care pulmonologists. More than 40 percent
of those who indicated a pulmonary, but no critical care, specialty reported being certified in
critical care. Of those currently certified in critical care, 84 percent planned to be recertified in
critical care when their current certification expired.
Table 3.7Physician Characteristics: Faculty Status, Professional Society Membership,Board Certification: Overall and by Physician Type
Type of medical professional
Characteristic Overall Pulmon.only
Crit carepulmon.
Crit careanes.
Crit caresurgery
Critical careinternist
ICU director 26.9% 23.2% 39.6% 23.3% 55.6% 28.5%
Full-time facultymember ofmedical school†
19.1% 17.4% 14.1% 37.8% 59.5% 14.2%
Societymembership
American Collegeof Chest Physi-cians (ACCP) only
12.5% 13.9% 12.6% 1.2% 0.0% 13.3%
AmericanThoracic Society(ATS) only
10.0% 13.7% 2.5% 5.8% 0.0% 1.9%
Society of CriticalCare Medicine(SCCM) only
6.2% 0.2% 0.2% 32.2% 76.1% 15.8%
ACCP and ATS 31.9% 36.9% 54.7% 0.0% 0.0% 3.8%

Table 3.7Physician Characteristics: Faculty Status, Professional Society Membership,Board Certification: Overall and by Physician Type
Type of medical professional
Characteristic Overall Pulmon.only
Crit carepulmon.
Crit careanes.
Crit caresurgery
Critical careinternist
Abt Associates Inc. 39
ACCP and SCCM 6.2% 2.4% 7.0% 9.0% 4.2% 25.9%
ATS and SCCM 0.5% 0.2% 0.5% 1.6% 0.0% 1.4%
ACCP, ATS, andSCCM
12.7% 13.7% 19.4% 0.0% 0.0% 9.6%
None 20.0% 19.1% 3.2% 50.2% 19.7% 28.3%
Board certification status‡
Internal medicine 86.5% 83.4% 99.4% n/a n/a 91.6%
Surgery 78.8% n/a n/a n/a 94.9% n/a
Anesthesia 81.6% n/a n/a 99.2% n/a n/a
Critical care certification
Certified in criticalcare
53.2% 42.6% 88.1% 59.5% 80.5% 65.6%
Plan to be recerti-fied in critical care
84.4% 84.7% 88.1% 76.8% 96.0% 77.5%
Notes: †: Full time faculty members are defined as those physicians who reported that they were full time faculty members, an academicprimary practice setting, and working at a university hospital with 300 or more beds.
‡: Board certification status is conditional on practicing in the indicated area.
Sources: Abt Physician Survey
Physician Practice Setting
Nearly 50 percent of physicians were in either a single or multi-specialty group practice (Table
3.8). For physicians in a group practice, the most common group size was 2-5, although nearly
33 percent indicated a group size of 21 or more. This figure did not vary much by physician
specialty. Other findings regarding physician practice setting included:
• Private single specialty groups were the most common type of practice setting. More
than 28 percent of physicians had this practice setting and an additional 20 percent
were in a private multi-specialty group.
• More than 25 percent of pulmonologists had a private solo practice, a much higher
proportion than for critical care physicians, with the exception of those practicing
internal medicine.

Abt Associates Inc. 40
• Physicians with a critical care surgery or critical care anesthesiology specialty were
more likely to have an academic primary practice setting.
• Less than 10 percent of the sample indicated salaried hospital staff as their primary
practice setting. This included 9 percent of pulmonologists but less than 1 percent of
critical care pulmonologists, who tended to be in group practices.
Table 3.8Physician Characteristics: Primary Practice Setting
Type of medical professional
Primary practicesetting
Overall Pulmon.only
Crit carepulmon.
Crit careanes.
Crit caresurgery
Critical careinternist
Private solo 21.5% 25.7% 7.1% 7.2% 11.8% 22.6%
Academic 15.7% 11.9% 20.7% 35.4% 46.0% 13.9%
HMO staff 1.7% 1.6% 2.4% 1.4% 0.6% 1.9%
Military/VA 3.4% 3.0% 6.9% 0.4% 6.0% 2.8%
Private singlespecialty group
28.4% 25.9% 39.8% 42.8% 19.9% 25.0%
Private multi-specialty group
20.8% 21.7% 21.9% 6.2% 3.7% 26.0%
Salaried hospitalstaff
7.3% 9.1% 0.7% 6.6% 10.9% 3.5%
Other 1.3% 1.1% 0.3% 0.0% 0.0% 4.4%
Group size (for physicians in a group practice)
2-5 38.4% 39.3% 44.9% 7.3% 69.4% 36.5%
6-10 14.3% 8.8% 20.1% 38.3% 17.5% 24.6%
11-20 14.2% 17.3% 5.0% 35.1% 8.8% 0.3%
21-50 19.3% 19.2% 18.0% 10.2% 0.0% 28.5%
51 or more 13.1% 14.7% 12.0% 9.1% 4.4% 9.1%Notes: Totals may not sum to 100% due to rounding or missing data.
Sources: Abt Physician Survey
Characteristics of the Hospitals in Which Physicians See Patients
Virtually all physicians reported seeing patients in at least one hospital. The majority of pul-
monologists and critical care pulmonologists regularly saw patients in at least two hospitals, while
most critical care anesthesiologists, critical care surgeons, and internists regularly saw patients
in only one hospital (Table 3.9). The most common hospital type was private community,
although this varied somewhat by physician specialty. Critical care anesthesiologists and critical

Abt Associates Inc. 41
care surgeons were much more likely than other physicians to see the largest number of patients
at a university hospital.
Critical care pulmonologists and other critical care physicians tended to be at larger hospitals than
pulmonologists. More than 13 percent of pulmonologists were at hospitals with less than 100
beds, compared to only 5 percent of critical care pulmonologists. Overall, about 33 percent of
pulmonologists were at hospitals with more than 300 beds, compared to 52 percent of critical
care pulmonologists, 54 percent of critical care anesthesiologists, 57 percent of critical care
surgeons, and 42 percent of internists.
Pulmonologists were more likely than other types of physicians to describe the hospital’s location
as suburban, and were less likely to see patients at urban hospitals. More than two-thirds of
critical care pulmonologists described their primary hospital’s location as urban, compared to 44
percent of pulmonologists that did not report a critical care specialty.
More than 40 percent of physicians reported that the total number of ICU beds (across all units)
was between 11 and 20. Critical care anesthesiologists, surgeons and other critical care specialists
tended to work at hospitals with larger number of ICU beds. Nearly 40 percent of other critical
care physicians, for example, reported that their primary hospital had 41 or more ICU beds,
compared to less than 10 percent of pulmonologists. Among pulmonologists, 63 percent worked
primarily at a hospital with 20 or fewer ICU beds, compared to only 39 percent of critical care
pulmonologists.
The Role of Hospitalists
Some primary care physicians consistently delegate most or all responsibility for care of their
inpatient cases to physicians other than house staff or fellows. Once the hospitalization is
complete, the patient returns to the primary care physician. This type of inpatient role has been
termed “the hospitalist.”

Abt Associates Inc. 42
Table 3.9Physician Characteristics: Statistics on Hospitals in Which Physician Sees the LargestNumber of Patients
Type of medical professional
Measure Overall Pulmon.only
Crit carepulmon.
Crit careanes.
Crit caresurgery
Critical careinternist
Number of hospitals that physician regularly sees patients
None 1.0% 0.7% 0.3% 0.0% 0.0% 4.0%
One 44.4% 37.7% 37.8% 80.4% 66.8% 65.5%
Two 38.8% 44.9% 39.7% 19.2% 18.9% 17.8%
Three or more 15.9% 16.7% 22.2% 0.4% 14.3% 12.7%
Type of hospital†
Private community 69.2% 69.6% 74.2% 59.7% 43.4% 73.9%
University 11.5% 8.7% 9.8% 35.1% 29.2% 12.2%
Public(city/county)
10.9% 12.6% 3.7% 2.6% 20.7% 10.8%
Military/VA 3.8% 3.0% 9.1% 1.4% 6.7% 3.1%
HMO 2.2% 3.2% 0.1% 0.4% 0.0% 0.0%
Other 2.4% 2.9% 3.3% 0.7% 0.0% 0.0%
Total number of beds†
< 100 beds 10.8% 13.4% 5.4% 2.1% 13.0% 5.6%
101-300 beds 49.8% 53.7% 42.9% 45.1% 30.4% 42.2%
301-500 beds 32.6% 30.2% 43.4% 32.3% 34.1% 34.2%
500+ beds 6.8% 2.7% 8.3% 20.5% 22.5% 18.0%
Location†
Urban 49.6% 44.1% 67.1% 50.9% 63.1% 58.0%
Suburban 38.5% 43.8% 24.7% 31.9% 25.5% 29.9%
Rural 11.7% 12.1% 8.1% 16.8% 11.4% 10.8%
Total number of ICU beds†
> 5 1.8% 2.5% 0.1% 0.0% 1.8% 0.2%
6-10 9.9% 11.4% 5.9% 15.6% 11.7% 2.1%
11-20 43.3% 50.1% 33.2% 21.7% 15.1% 33.9%
21-30 12.3% 7.2% 31.6% 21.8% 20.1% 14.0%
31-40 17.8% 19.1% 21.3% 8.2% 23.2% 10.1%
41 or more 14.8% 9.8% 7.9% 30.7% 27.5% 39.7%
Notes: †: Based on hospital in which the physician sees the largest number of patients
Sources: Abt Physician Survey

Abt Associates Inc. 43
Overall, 46 percent of physicians reported that hospitalists were used within the general medicine
service of their hospital (Table 3.10). This number was considerably higher for critical care
pulmonologists (67%) than for pulmonologists (42%). Nearly one-third of physicians reported
that they played a hospitalist role at the hospital in which they saw the majority of their patients.
This figure was much higher for critical care pulmonologists and internists than for pul-
monologists.
Among physicians who indicated that they played a hospitalist role, 34 percent of inpatient time
was devoted to the hospitalist role. This percentage varied considerably by physician specialty.
Pulmonologists who played a hospitalist role devoted only 21 percent of their inpatient time to
hospitalist duties, compared to 38 percent for critical care pulmonologists, 43 percent for critical
care anesthesiologists, 62 percent for critical care surgeons, and 78 percent for internists.
The survey respondents anticipate an increase in the hospitalist role over the next 3-5 years. The
proportion of physicians playing the hospitalist role is expected to be 47 percent, compared to 33
percent in 1997. Among pulmonologists, 42 percent anticipate being a hospitalist in the next 3-5
years, an increase from 29 percent today. Nearly 70 percent of critical care physicians anticipate
playing a hospitalist role over the next 3-5 years, including 44 percent of those who do not
currently act as a hospitalist. Large increases in the hospitalist role were also anticipated
Table 3.10Physician Characteristics: Role of Hospitalists
Type of medical professional
Measure Overall Pulmon.only
Crit carepulmon.
Crit careanes.
Crit caresurgery
Criticalcare
internist
Hospitalists used athospital
46.3% 41.8% 67.4% 46.3% 20.4% 53.1%
Respondent playshospitalist role
32.6% 28.7% 50.0% 16.7% 7.6% 42.2%
Percent of inpatienttime in hospitalistrole (for those whoplay this role)
33.8% 21.2% 37.6% 43.5% 61.5% 78.4%
Respondentanticipates playinga hospitalist role infive years–allsample
47.5% 41.5% 68.5% 60.2% 18.6% 49.9%

Table 3.10Physician Characteristics: Role of Hospitalists
Type of medical professional
Measure Overall Pulmon.only
Crit carepulmon.
Crit careanes.
Crit caresurgery
Criticalcare
internist
7 Note that for purposes of analysis, annual hours were truncated at 3,840 per year.
Abt Associates Inc. 44
Respondentanticipates playinga hospitalist role infive years–thosewho currently arehospitalists
82.3% 83.3% 84.7% 61.9% 100% 78.0%
Respondentanticipates playinga hospitalist role infive years–thosewho are notcurrentlyhospitalists
22.7% 18.9% 44.0% 33.2% 11.4% 26.5%
Sources: Abt Physician Survey
by critical care anesthesiologists (an increase from 17 percent to 60 percent within the next 3-5
years) and critical care surgeons (8 percent to 18 percent). A smaller increase in the hospitalist
role was anticipated by internists.
How Do Physicians Spend their Time?
The survey collected detailed information on the number of hours worked by physicians and the
allocation of this time across various practice activities, based on the distribution of time in an
average week worked by the physician. These data were converted into annual figures based on
information on the number of weeks worked each year in all professional activities.
The average physician worked 48 weeks per year, and 25 percent of the sample reported working
50 or more weeks each year. On average, physicians reported working an average of about 61
hours per week (for the weeks in which they worked), or 2,933 hours per year (Table 3.11).7
Total annual hours were slightly higher for critical care pulmonologists and internists than for the
other specialties.
Abt Associates Inc. 45
Multivariate regression analysis indicated that annual hours were significantly higher for physi-
cians under the age of 40 and were significantly lower for critical care anesthesiologists, internists,
females, and full-time faculty members (Table 3.12). The parameter estimates in the table indicate
the effect of the specified variable on total hours or direct patient care hours, holding constant the
effects of all other variables. So for example, full-time faculty members spend 1,346 fewer hours
in patient care on average, independent of any relationship of full-time faculty status to age, sex,
specialty, or managed care penetration. (Note that these regression models are not the same ones
that were used for developing the workforce models, which used separate models for
pulmonologists and critical care physicians).
On average, more than three-fourths of physician time was spent providing direct patient care.
The average physician had 2,284 annual hours of direct patient care (Table 3.13). This figure was
lower for critical care surgeons and critical care anesthesiologists. Adjusting for other factors,
hours of direct patient care were significantly lower for females and full time faculty members.
There was no consistent relationship between managed care penetration and hours of direct
patient care.
The distribution of direct patient care time by practice setting varied by physician specialty.
Pulmonologists spent a lower proportion of their direct care time in the intensive care unit than
physicians with a critical care specialty, and had the highest proportion of office-based practice.
Critical care surgeons and anesthesiologists spent a much higher proportion of their time in other
office-based practice activities.
The distribution of direct patient care time spent outside the ICU varied based on physician
specialty (Table 3.14). Physicians with a pulmonary specialty spent most of this time practicing
pulmonary internal medicine. Internists spent more than 35 percent of their non-ICU time
practicing general internal medicine, a much higher proportion than for other physician types.
Critical care surgeons and anesthesiologists spent virtually all of their non-ICU time in surgery
and anesthesiology, respectively.

Abt Associates Inc. 46
Table 3.11Physician Characteristics: How Do Physicians Spend Their Time?
Type of medical professional
Measure Overall Pulmon.only
Crit carepulmon.
Crit careanes.
Crit caresurgery
Criticalcare
internist
Total hoursworked per year†
2933 2916 3086 2679 2919 3005
Total weeksworked per year
48.1 48.2 48.3 46.7 48.2 47.9
Distribution of direct patient care time by task (annual hours)
Total direct patientcare hours
2284 2333 2363 1907 1803 2220
% of time ondirect patient care
76% 79% 73% 67% 56% 72%
Distribution of other time by task (annual hours)
Research 143 142 131 177 154 136
Resident/fellowsupervision andteaching
185 155 251 313 464 149
Conferences 88 75 95 75 162 147
Administration/paperwork
291 258 307 299 485 406
Other/unspecified 32 26 44 62 59 36
Distribution of direct patient care time by practice setting
% Intensive care(in ICUs)
26.1% 21.5% 32.8% 23.6% 25.7% 46.2%
% Inpatient care 21.2% 22.8% 23.6% 13.6% 18.9% 13.9%
% Office practice 39.2% 45.4% 34.6% 1.0% 20.1% 30.8%
% Otherprocedure-basedpractice activities
10.4% 6.6% 7.5% 62.8% 35.3% 6.1%
% Practice time inother settings
3.1% 3.7% 1.4% 1.0% 0.2% 3.1%
Notes: † Annual work hours are truncated at 3,840 per year. Sources: Abt Physician Survey

Abt Associates Inc. 47
Table 3.12Total Annual Hours: Multivariate Analysis
Total hours Direct patient care hours
Variable Parameter estimate(standard error)
Parameter estimate(standard error)
Intercept 2830.5***(108.7)
2532.1***(103.3)
Age less than 40 -98.0(119.1)
126.1(115.8)
Age 40-54 26.5(98.4)
19.1(93.5)
Female -306.6**(121.5)
-378.5***(114.2)
Full-time faculty member -297.0***(100.9)
-1346.4***(98.9)
Specialty: Pulmonary critical care 117.9(115.5)
-103.6(110.2)
Specialty: Critical careanesthesiologist
-242.6(159.0)
-267.9*(154.5)
Specialty: Critical care surgeon 80.4(218.9)
-85.3(213.1)
Specialty: Internal medicine 74.7(118.9)
-210.2*(113.5)
Managed care penetration inphysician’s MSA: 10-25%
-7.8(109.2)
-88.6(103.4)
Managed care penetration inphysician’s MSA: 25%-50%
344.4***(104.3)
314.4***(99.7)
Managed care penetration inphysician’s MSA: more than 50%
150.4(138.9)
-337.3**(131.0)
MSA size: 3 million or more 137.4(87.2)
26.6(82.8)
Notes: Annual work hours are truncated at 3,840 per year. MSA stands for “Metropolitan Statistical Area. Managed carepenetration variables are based on the managed care penetration in the MSA in which the physician is located.
***: Coefficient statistically significant at 1% level **: Coefficient statistically significant at 5% level *: Coefficient statistically significant at 10% level Sources: Abt Physician Survey

Abt Associates Inc. 48
Table 3.13Physician characteristics: Distribution of Direct Care Time
Type of medical professional
Activity Pulmon.only
Crit carepulmon.
Crit careanes.
Crit caresurgery
Criticalcare
internist
Distribution of direct patient care hours (annual)
Total direct patientcare hours
2333 2363 1908 1803 2220
ICU hours 485 780 257 359 924
Inpatient pulmonaryhours
419 638 0 1 129
Outpatient pulmonaryhours
567 606 0 0 136
General internalmedicinehours–inpatient
113 77 0 6 178
General internalmedicine hours:Outpatient7
345 68 0 0 494
Distribution of direct patient care timespent outside the ICU
Pulmonary internalmedicine
63.6% 84.7% 0.1% 0.1% 21.8%
Other medical sub-specialty
5.9% 1.8% 0.3% 0.1% 12.8%
General internalmedicine
27.8% 12.1% 0.1% 0.2% 48.8%
Surgery 0.3% 0.2% 0.7% 98.3% 3.2%
Anesthesia 1.0% 0.0% 94.8% 0.1% 5.3%
Other patient care 1.4% 1.3% 3.5% 1.1% 8.2%
Notes: † Annual work hours are truncated at 3,840 per year. The hours by activity will not necessarily equal the total
number of direct care hours, since not all possible activities were included.
Sources: Abt Physician Survey

Abt Associates Inc. 49
Distribution of Time and Patient Encounters for Intensivists
The set of questions discussed in this section were asked only to physicians who spent 10 percent
or more of their patient care time providing care to critically ill patients. General (i.e.,
medical/surgical) ICU units were the most common type of ICU for treating critical care patients
(Table 3.14). Nearly 37 percent of intensivist patient care time took place in general ICUs.
Medical ICU units were the second most common ICU type, with about 20 percent of total ICU
patient time. The average number of weekly encounters for intensivists who spent time in the
indicated ICU type varied considerably by the type of ICU. For most ICU types, less than 30
percent of the patient encounters were for the physician’s own patients, as opposed to consults.
Respiratory insufficiency/failure was the most common primary diagnosis treated by intensivists,
accounting for 36 percent of patient encounters (Table 3.15). Postoperative management
(immediately following surgery) was the second most common type of primary diagnosis,
accounting for 18 percent of patient encounters.
Table 3.14Intensivist Characteristics: Distribution of Critical Care Patients byICU Type
ICU type % of total average numberof encounters†
% yourpatients†
General(medical/surgical)
36.9% 16.4 26.7%
Medical 19.1% 15.0 29.6%
Surgical 8.1% 9.0 15.3%
Coronary care 9.3% 6.4 26.0%
Burn 0.2% 3.1 11.5%
Nephrology 2.8% 5.8 18.7%
Respiratory 8.3% 5.4 62.6%
Trauma 1.8% 7.1 31.4%
Cardiothoracic 6.4% 6.5 17.6%
Step Down Unit 5.1% 5.8 35.0%
Other setting 1.3% 1.8 14.6%
Notes: † Conditional on spending any time in indicated type of ICU.The term “your patients” refers to the percentage of patients in the unit whowere the intensivists own patients, rather than consults.
Sources: Abt Physician Survey

Abt Associates Inc. 50
Table 3.15Intensivist Practice Characteristics: Distribution of Critical CarePatients by Primary Diagnosis
Primary diagnosis % of critical care patients
Postoperative management 18.1
Ischemic heart disorder 6.6
Arrhythmia 2.3
Heart failure 6.9
Neurologic dysfunction 4.0
Respiratory insufficiency 36.1
Gastrointestinal hemorrhage 3.2
Multiple organ system failure 7.2
Sepsis 8.7
Trauma 5.0
Burns 0.3
Other 1.6
Notes: Includes physicians who reported spending time in the ICU only.Sources: Abt Physician Survey
Distribution of Pulmonary Time and Patient Encounters
The survey items discussed in this section were asked only of respondents who spent at least ten
percent of their patient care time caring for pulmonary patients. The majority of pulmonary
patient encounters were provided in an ambulatory setting (Table 3.16). Overall, 58 percent of
encounters occurred in an ambulatory setting, while 39 percent was provided in an inpatient
setting and the remainder was provided in another setting, such as home visits or nursing homes.
Chronic obstructive pulmonary disorder (COPD) was the most common primary diagnosed
complaint, for both inpatient and ambulatory encounters (Table 3.17). COPD accounted for 40
percent of the ambulatory patient care time and 35 percent of the inpatient care time for physi-
cians who spent 10 percent or more of their direct care time treating pulmonary patients. Asthma
was much more likely to be treated on an outpatient basis. More than 21 percent of pul-
monologists’ ambulatory patient care time was devoted to treating asthma patients, compared to
12 percent of inpatient time. Pneumonia, by contrast, took a disproportionate share of the
inpatient time of pulmonologists, and was treated less frequently in the ambulatory setting.

Abt Associates Inc. 51
For some patients with a chronic disease, a medical subspecialist may assume responsibility for
all of the patients’ care. This role has been termed “principal care.” For the majority of ambula-
tory patients (57 percent), pulmonologists assumed the role of principal care physician (Table
3.18). This proportion was lower (43 percent) for patients treated in the inpatient setting.
Table 3.16Characteristics of Pulmonologists: Distribution of PulmonaryCare Time and Encounters
Setting Total
Distribution of time by setting
Ambulatory 57.7%
Hospital inpatient 39.4%
Other setting 2.0%
Number of encounters per week, by setting
Ambulatory 40.2
Hospital inpatient 33.3
Other setting 1.6
Notes: Includes only physicians who spent 10 percent or more of patient care timecaring for pulmonary patients.
Sources: Abt Physician Survey
Table 3.17Characteristics of Pulmonologists: Distribution of PulmonaryTime by Setting and Primary Diagnosed Complaint
Primary diagnosis Ambulatory Inpatient
COPD 40.0% 34.5%
Asthma 21.6% 12.5%
Interstitial Lung Disease 5.7% 3.1%
Pneumonia 7.1% 15.5%
HIV 1.4% 2.2%
Lung Cancer 8.9% 7.4%
Pleural Disease 4.1% 4.9%
Respiratory failure/insufficiency 5.7% 16.9%
All other 5.8% 3.2%
Notes: Includes physicians who reported spending at least 10 percent of clinical timecaring for patients with pulmonary diagnoses.
Sources: Abt Physician Survey
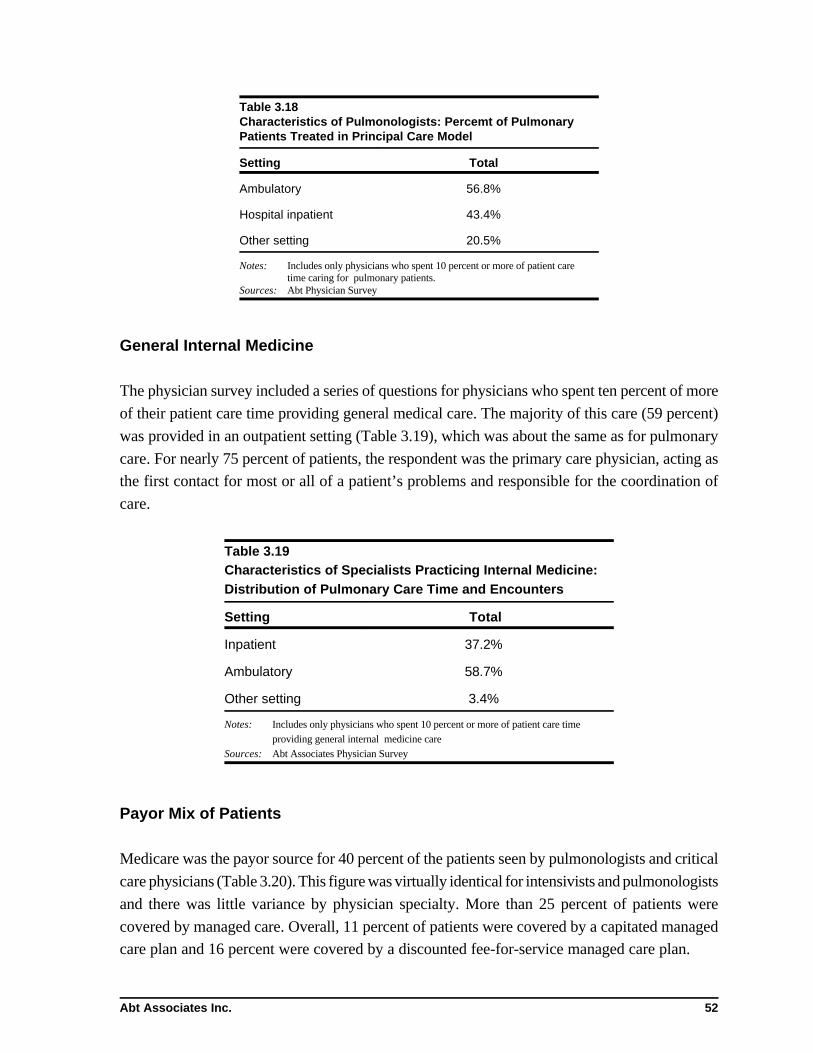
Abt Associates Inc. 52
Table 3.18Characteristics of Pulmonologists: Percemt of PulmonaryPatients Treated in Principal Care Model
Setting Total
Ambulatory 56.8%
Hospital inpatient 43.4%
Other setting 20.5%
Notes: Includes only physicians who spent 10 percent or more of patient caretime caring for pulmonary patients.
Sources: Abt Physician Survey
General Internal Medicine
The physician survey included a series of questions for physicians who spent ten percent of more
of their patient care time providing general medical care. The majority of this care (59 percent)
was provided in an outpatient setting (Table 3.19), which was about the same as for pulmonary
care. For nearly 75 percent of patients, the respondent was the primary care physician, acting as
the first contact for most or all of a patient’s problems and responsible for the coordination of
care.
Table 3.19Characteristics of Specialists Practicing Internal Medicine:Distribution of Pulmonary Care Time and Encounters
Setting Total
Inpatient 37.2%
Ambulatory 58.7%
Other setting 3.4%
Notes: Includes only physicians who spent 10 percent or more of patient care timeproviding general internal medicine care
Sources: Abt Associates Physician Survey
Payor Mix of Patients
Medicare was the payor source for 40 percent of the patients seen by pulmonologists and critical
care physicians (Table 3.20). This figure was virtually identical for intensivists and pulmonologists
and there was little variance by physician specialty. More than 25 percent of patients were
covered by managed care. Overall, 11 percent of patients were covered by a capitated managed
care plan and 16 percent were covered by a discounted fee-for-service managed care plan.

Abt Associates Inc. 53
Table 3.20Payor Mix of Patients (all settings)
Payor source Percentage of total patients
Traditional Medicare 40.0%
Traditional Medicaid 9.3%
Managed care:capitated
11.2%
Managed care:discounted FFS
15.9%
Other privateinsurer/self pay
16.6%
Uninsured 7.4%
Sources: Abt Associates physician Survey
3.4 Intensive Care Unit Characteristics
Descriptive results from the Abt Associates Survey of Critical Care Facilities are presented in this
section. The survey included information on characteristics of the hospital and critical care unit
being surveyed, the patients in the specified ICU, and the organization and staffing patterns of the
ICU unit. The SMG data used to develop the sampling frame for the survey of ICU directors
provided no details on the characteristics of intensive care units in hospitals. Therefore all
descriptive information in this section is drawn from survey responses of unit directors. In all
cases, these responses have been weighted to totals for the United States using the reciprocal of
the probability of selection as the cell weight.
3.4.1 National Statistics on Intensive Care Units
Of the 5,979 (non-coronary) ICU units in the country, two-thirds were general (medical/surgical)
ICU units (Table 3.21). This included virtually all of the ICU units in hospitals with less than 100
beds and 76 percent of the ICUs in hospitals with between 101 and 300 beds. In contrast, only
28 percent of the ICUs in hospitals with more than 500 beds were general ICU units. Medical and
surgical ICU units each accounted for about 12 percent of the nation’s ICU units, while the other
categories listed on Table 3.22 collectively account for about 10 percent of ICU units.

Abt Associates Inc. 54
Table 3.21ICU Directors Survey: The Universe of Critical Care Units
Type of ICU Number(% of total)
General (medical/surgical) 3920(66%)
Medical 713(12%)
Surgical 698(12%)
Burn 175(3%)
Neurological 127(2%)
Respiratory 56(1%)
Cardiothoracic 137(2%)
Transplant 24(0.4%)
Trauma 130(2%)
Sources: Abt Associates Survey of Critical Care Facilities, SMG Marketing
Hospital Statistics
Overall, 48 percent of the ICUs were located in private community hospitals, while 15 percent
were university hospitals, and 17 percent from city/county hospitals (Table 3.23). More than 40
percent of the ICUs were in medium sized hospitals (between 100 and 300 beds). Nearly 20 per-
cent of the ICU units were in hospitals with 301-500 beds, 17 percent were in hospitals with more
than 500 beds, and the remaining ICUs (21 percent) were in small hospitals with 100 beds or
fewer.
About 43 percent of the ICUs were part of hospitals that were associated with a medical school,
and 21 percent were both associated with a medical school and a member of the Council of
Teaching Hospitals (COTH). More than 50 percent of ICUs were neither associated with a medi-
cal school nor members of COTH.

Abt Associates Inc. 55
Table 3.22ICU Directors Survey: Hospital Statistics
Characteristic Number(% of total)
Type of hospital
Private community 2851(48%)
University 890(15%)
City/county 1031(17%)
VA hospital 47(8%)
Other 363(6%)
Missing 317(5%)
Size of hospital
< 100 beds 1262(21%)
101-300 beds 2484(42%)
301-500 beds 1145(19%)
501+ beds 1011(17%)
Missing 78(1%)
Association with medical school and membership in Council of Teaching Hospitals
Both 1231(21%)
Associated with medical school but not member of Council ofTeaching Hospitals
1349(23%)
Associated with Council of Teaching Hospitals but notassociated with a medical school
166(3%)
Neither 3177(53%)
Missing 56(1%)
Sponsorship of residency/fellowship and critical care fellowship programs
Sponsors residency/fellowship but not critical care fellowshipprograms
1638(27%)
Sponsors critical care but not residency/fellowship programs 2(0%)
Sponsors both critical care and residency/fellowshipprograms
1033(17%)

Table 3.22ICU Directors Survey: Hospital Statistics
8 Directors of such units did respond to the survey and those responses are included in the analyses that follow.
Abt Associates Inc. 56
Sponsors neither critical care nor residency/fellowshipprograms
3016(50%)
Sponsor residency/fellowship programs, missing informationon critical care programs
241(4%)
Missing 49(1%)
Sources: Abt Associates Survey of Critical Care Facilities
The survey included information about sponsorship of residency/fellowship and critical care
fellowship programs. Overall, 17 percent of ICUs were part of hospitals that sponsored both
types of programs. Twenty-seven percent of hospitals sponsored residency or fellowship pro-
grams, but no critical care fellowships, while 17 percent had critical care fellowships but did not
sponsor residency or fellowship programs. One-half of the ICU units were part of hospitals that
sponsored neither type of programs. These tended to be smaller hospitals—87 percent of the
hospitals with 100 or fewer beds and 62 of hospitals with 101-300 beds did not sponsor
residency/fellowship or critical care fellowship programs, compared with only 18 percent of
hospitals with 500 or more beds.
Intensive Care Beds and Step-Down Units
COMPACCS defined ICU beds as those with a nursing ratio greater than one to three. Using this
definition, the average number of staffed ICU beds in the hospital was 18 (Table 3.23).Of interest
is that respondents representing over 1,800 hospitals, after weighting (or 30 percent of the popu-
lation) reported that no critical care beds in the hospital met this staffing requirement (Figure
3.6).8 About 10 percent of ICU units were in hospitals with less than 5 beds, while 15 percent
were in hospitals with between 6 and 10 beds. Twelve percent of ICU units were in hospitals with
40 or more total staffed ICU beds, including 272 (4.7 percent) with more than 60 beds.
Some hospitals have beds called intermediate care or step-down units in addition to ICUs. Nearly
47 percent of hospitals reported having one or more medical step-down units, and 62 percent of
hospitals had at least one surgical step-down unit. The presence of step-down units was strongly
related to the hospital’s size. Less than 10 percent of ICU directors in hospitals with fewer than
100 beds reported a surgical step-down unit at the hospital, compared to 52 percent.

9 Note that virtually all of these ICUs had either four beds (7 percent of the sample), or five beds (5 percent of the sample). Only 2 percentof the sample reported three or fewer total critical care beds in the specified ICU.
Abt Associates Inc. 57
Table 3.23ICU Directors Survey: Intensive Care Beds and Step-down Units
Measure Mean
Intermediate or step-down units
One or more medical step-down unit in hospital 61.4%
One or more surgical step-down unit in hospital 47.7%
Total staffed step down beds 8.9
Intensive care beds
Intensive care beds in hospital 17.7
Intensive care beds in specified unit 12.1
Expansion beds (can be added within 24 hours) 2.0Sources: Abt Associates Survey of Critical Care Facilities
of those in hospitals with 101-300 beds, and 67 percent of those in hospitals with more than 300
beds. Only 26 percent of ICUs in hospitals with 100 beds or less had a medical step-down unit
at the hospital, compared to more than 70 percent of hospitals with more than 100 beds.
More than 50 percent of the ICU directors, however, reported that there were no staffed step-
down beds with a nursing ratio of 1:3 in the hospital (Figure 3.7). This included about 25 percent
of ICUs that reported a medical or surgical ICU at the hospital. Overall, about 450 of the 5,500
ICUs represented in this survey questions were part of hospitals with between one and five step-
down beds, 540 with 6-10 staffed step-down beds, 447 with 11-15 step-down beds, 468 reported
16-20 step-down beds, 684 with 21-40 step-down beds, and 177 ICUs (3 percent) with more than
40 staffed step-down beds.
The average size of the specific ICU unit specified (in contrast to the hospital-wide statistics
reported above) was 12 beds (Table 3.23). Fourteen percent of the ICU units had between 1 and
5 beds,9 40 percent had between 6-10 critical care beds, and 25 percent had between 11 and 15
beds (Figure 3.8). There were relatively few units with more than 20 beds (12 percent of the
total).
Forty percent of ICUs reported having expansion beds that could be staffed within 24 hours if
necessary (Figure 3.9). Most of the ICUs with expansion beds had fewer than five expansion
beds. Less than 5 percent of ICUs had six or more expansion beds.
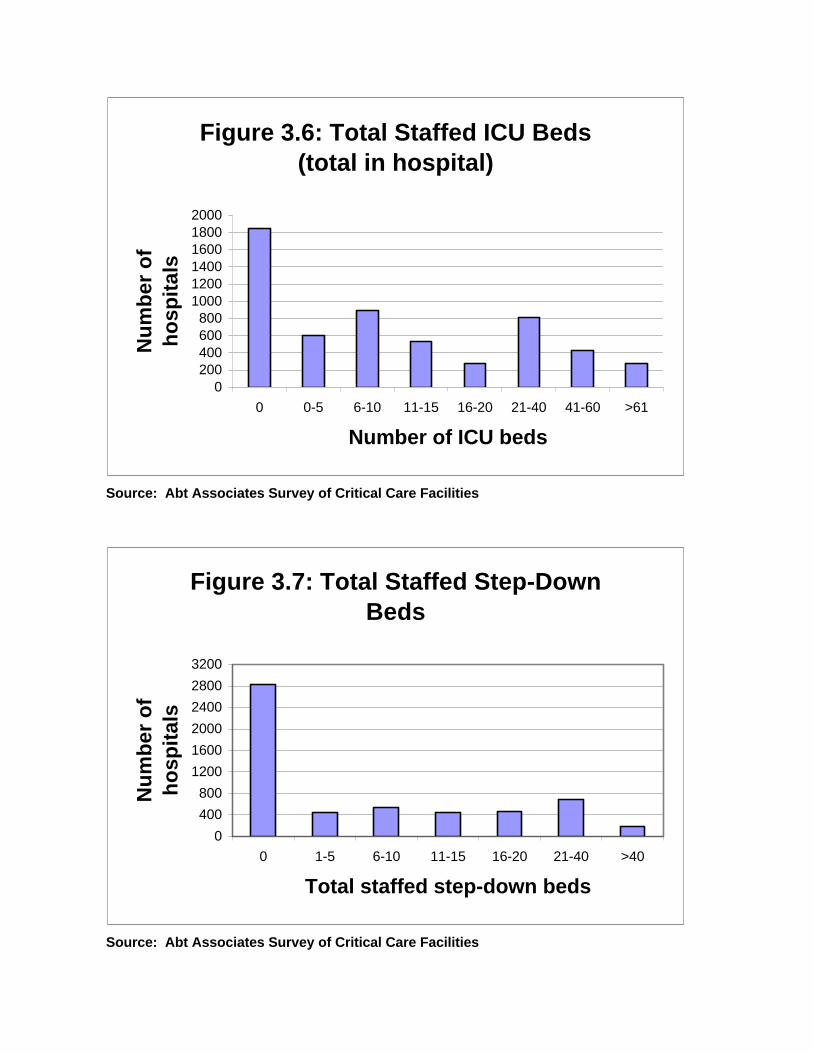
Source: Abt Associates Survey of Critical Care Facilities
Source: Abt Associates Survey of Critical Care Facilities
Figure 3.6: Total Staffed ICU Beds (total in hospital)
0200400600800
100012001400160018002000
0 0-5 6-10 11-15 16-20 21-40 41-60 >61
Number of ICU beds
Nu
mb
er o
f h
osp
ital
s
Figure 3.7: Total Staffed Step-Down Beds
0
400
800
1200
1600
2000
2400
2800
3200
0 1-5 6-10 11-15 16-20 21-40 >40
Total staffed step-down beds
Nu
mb
er o
f h
osp
ital
s

Source: Abt Associates Survey of Critical Care Facilities
Source: Abt Associates Survey of Critical Care Facilities
Figure 3.8: Total Staffed ICU Beds (in specified unit)
0
0.1
0.2
0.3
0.4
0.5
1-5 6-10 11-15 16-20 21-30 >30
Number of ICU beds
Pro
po
rtio
n o
f IC
Us
Figure 3.9: Total Expansion Beds (in specified unit)
00.10.20.30.40.50.60.70.80.9
1
0 1-2 3-5 6-10 >10
Number of expansion beds
Pro
po
rtio
n o
f IC
Us

Abt Associates Inc. 60
Future Changes in the Number of ICU and Step-down Beds
The survey suggests that the number of ICU and step-down beds has increased over the past five
years, and that this increase is expected to continue over the next 3-5 years. More than 25 percent
of ICU directors indicated that the total number of ICU beds at the hospital had increased over
the past five years (Table 3.24). For hospitals with an increase, the amount of the increase was
between 1 and 10 percent for 31% of ICUs, 11-25 percent for 40 percent of ICUs, 26-50 percent
for 21 percent of ICUs, and more than 50 percent at 8 percent of ICUs.
Only 17 percent indicated that the number of ICU beds had decreased over the past five years,
although some of these hospitals had large decreases in the number of ICU beds. Of hospitals
with a decrease, 31 percent had a decrease of between 11 and 25 percent while a decrease of 26-
50 percent occurred at 37 percent of facilities.
Thirty-one percent of ICU directors anticipate an increase in the number of ICU beds over the
next 3-5 years, while 18 percent anticipate a decrease in the total number of ICU beds during this
period. The most often anticipated increase is in the range of 11-25 percent, although 13 percent
of ICU directors anticipate an increase of 26 percent or more. Of those who anticipate a decrease
on the number of ICU beds, 32 percent anticipate a decrease of 10 percent or less, while 23
percent expect the number of ICU beds at the hospital to fall by 25 percent or more.
The number of step-down beds has increased during the past five years, and respondents
anticipated this increase to continue over the next 3-5 years (Table 3.25). During the past five
years, 42 percent of ICUs were at hospitals that increased the number of step-down beds, while
just 12 percent were at hospitals that had a decrease in the number of step-down beds. Almost
half of ICU directors anticipate that the number of step-down beds will increase in the next 3-5
years, and only 18 percent expect the number of step-down beds to decrease over this period.
During the past five years, of hospitals with an increase in the number of step-down beds, nearly
half had an increase of 26 percent or more, including 25 percent that reported an increase of 50
percent or more. In the next 3-5 years, the anticipated increases are expected to be smaller.
Among ICUs in hospitals where an increase in the number of step-down beds is anticipated, 23
percent expect an increase of 1-10 percent, and 46 percent anticipate an increase of between 11
and 25 percent. Among hospitals where the number of step-down beds is expected to decrease
over the next 3-5 years, most of the decreases are likely to be small – 31 percent of ICU directors
at hospitals where a decrease in the number of step-down beds is projected to decrease anticipate
a decrease of 1-10 percent, while 39 percent anticipate a decrease of 11-25 percent.

Abt Associates Inc. 61
Table 3.24ICU Directors Survey: Anticipated Changes in ICU Beds
Measure Compared to fiveyears ago
Projection next 3-5 years
Total number of ICU beds in all units at the hospital:
Greater 26.1% 31.3%
Same 55.4% 49.9%
Less 17.1% 17.9%
Don’t know/missing 1.4% 0.9%
Amount of increase (for ICUsreporting/expecting an increase)
1-10% 31.2% 37.6%
11-25% 40.2% 47.8%
26-50% 20.9% 10.6%
More than 50% 7.7% 2.2%
Missing/don’t know 1.8%
Amount of decrease (for ICUsreporting/expecting an decrease)
1-10% 28.2% 32.9%
11-25% 31.4% 43.3%
26-50% 36.7% 21.2%
More than 50% 1.4% 1.8%
Don’t know/missing 1.7% 0.8%
Sources: Abt Associates Survey of Critical Care Facilities

Abt Associates Inc. 62
Table 3.25ICU Directors Survey: Anticipated Changes in Step-DownBeds
Measure Compared to fiveyears ago
Projection next 3-5 years
Total number of step-down units in all units at the hospital:
Greater 42.3% 48.6%
Same 39.7% 28.5%
Less 12.0% 17.6%
Don’t know/missing 6.0% 5.4%
Amount of increase (for ICUs reporting an increase)
1-10% 17.5% 23.3%
11-25% 34.4% 46.1%
26-50% 22.2% 18.3%
More than 50% 25.1% 10.2%
Don’t know/missing 0.8% 2.1%
Amount of decrease (for ICUs reporting an decrease)
1-10% 19.5% 31.5%
11-25% 32.7% 39.0%
26-50% 11.2% 27.6%
More than 50% 25.7% 1.9%
Don’t know/missing 11.0%
Sources: Abt Associates Survey of Critical Care Facilities
Characteristics of Patients in the ICU
The survey of ICU directors included a detailed set of questions about the type of patients in the
ICU. The patient census (as of the time that the survey was completed) included an average of
9.2 total patients in the specified unit, 1.3 patients awaiting transfer out, and 0.8 patients awaiting
critical care beds in the specified unit (Table 3.26). Nearly 40 percent of the ICUs reported no
patients awaiting transfer out, while 45 percent had one or two patients awaiting transfer.
Overall, 65 percent of ICUs reported that there were no patients awaiting critical care beds at the
specified unit, and 25 percent had one or two patients awaiting a critical care bed.

Abt Associates Inc. 63
Table 3.26ICU Directors Survey: Characteristics of Patients in ICU
Measure Mean
Patient census at time of survey completion
Number of patients in specified unit 9.2
Number of patients awaiting transferout
1.3
Number of patients awaiting criticalcare beds in specified unit
0.8
Statistics for past year
Average daily census of patients 8.9
Average length of stay 4.2
Total admissions of specified ICU 940
Total patient days 6564
Age distribution of patients
% younger than age 18 1.5%
% age 18-64 42.7%
% age 65-84 50.0%
% age 85 or older 5.8%
Sources: Abt Associates Survey of Critical Care Facilities
In addition to patient statistics as of the time of survey completion, the survey also collected
patient census statistics for the past year. The average daily census over the past year was 8.9.
About 30 percent of ICUs had an average daily census of five or fewer, while 42 percent had an
average daily census of between 6 and 10 (Figure 3.10).
The average length of stay was 4.2 days, and 75 percent of ICUs reported an average length of
stay of 4 days or less (Figure 3.11). ICUs with longer lengths of stay tended to be non-general
(medical/surgical) ICU units. Only 30 percent of general ICUs had an average length of stay of
four days or more, compared to 84 percent of trauma units, 100 percent of transplant units, 83
percent of neurological units, and 89 percent of burn units.
Most of the patients treated in the ICU were elderly. At the time that the survey was completed,
50 percent of patients were age 65-84, and 6 percent were age 85 or over (Table 3.26). Less than
2 percent of ICU patients were under age 18.
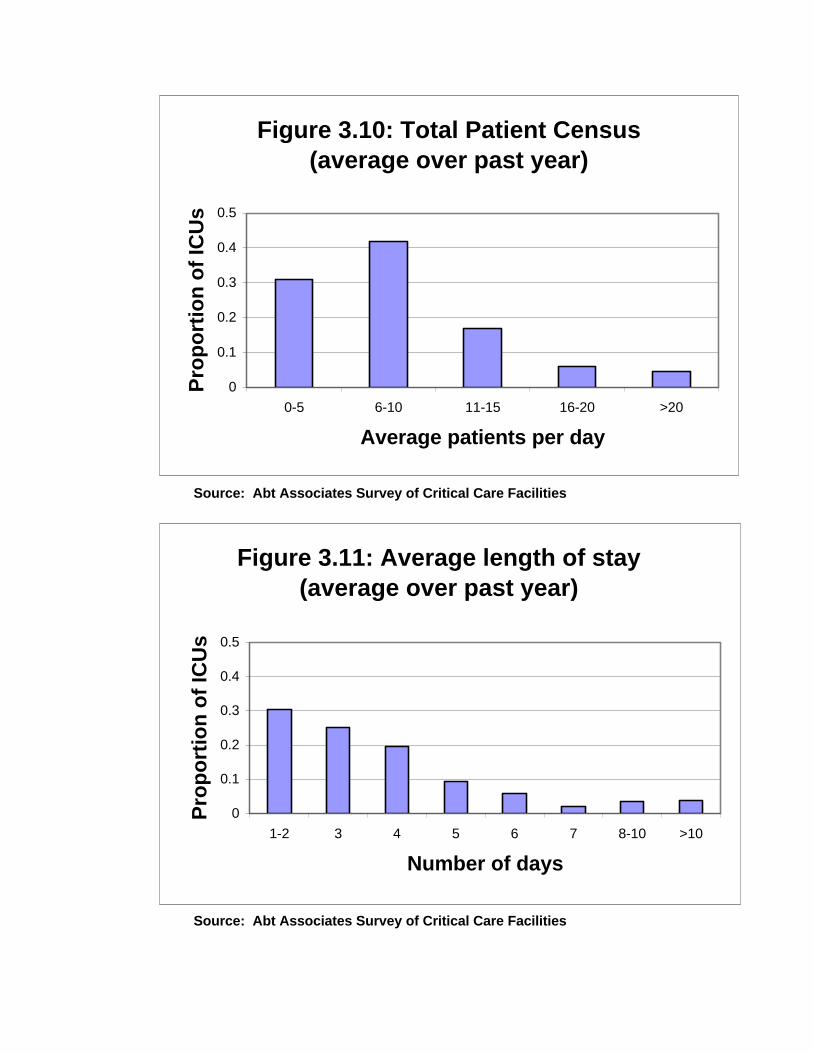
Source: Abt Associates Survey of Critical Care Facilities
Source: Abt Associates Survey of Critical Care Facilities
Figure 3.10: Total Patient Census (average over past year)
0
0.1
0.2
0.3
0.4
0.5
0-5 6-10 11-15 16-20 >20
Average patients per day
Pro
po
rtio
n o
f IC
Us
Figure 3.11: Average length of stay (average over past year)
0
0.1
0.2
0.3
0.4
0.5
1-2 3 4 5 6 7 8-10 >10
Number of days
Pro
po
rtio
n o
f IC
Us

Abt Associates Inc. 65
Diagnoses, Admission Source, and Types of Treatment Received in the ICU
ICUs treat patients with a variety of admission diagnoses. The most common admission diagnosis was
respiratory insufficiency, which accounted for 18 percent of all admissions (Table 3.27). Postoperative
(immediate) was the next most common admitting diagnosis, accounting for 10 percent of admissions.
Other major admission diagnoses included ischemic heart disorder (9 percent), cardiothoracic postoperative
(7 percent), and heart failure (6 percent).
The most common admitting source for ICU patients was the emergency room, which was the source for
41 percent of all ICU patients (Figure 3.12). Overall, 20 percent of patients were admitted from the
OR/PACU, 12 percent from the general hospital floor, 22 percent from another ICU/CCU in the hospital,
3 percent from another hospital, and 2 percent from a physician’s office.
Mechanical ventilation, which was received by 26 percent of patients was the most common
treatment/monitoring type provided in the ICU (Table 3.28). Other common types of treatment/monitoring
included invasive arterial monitoring (17 percent), vasoactive/inotropic iv medication (14 percent),
pulmonary catheter (8 percent), transfusion (8 percent), No CPR (8 percent), and intravenous anti-
arrhythmic (8 percent). It was possible for patients to be listed as receiving multiple types of
treatment/monitoring.
Table 3.27ICU Directors Survey: Number of Patients by Admitting Diagnosis
Admitting diagnosis Percentage of patients
Postoperative (immediate) 10.4%
Cardiothoracic 7.4%
Vascular 5.0%
Neurosurgery 5.4%
Other 8.8%
Trauma 5.0%
Ischemic heart disorder 9.3%
Arrhythmia 3.5%
Heart failure 6.0%
Neurologic dysfunction 4.4%
Respiratory insufficiency 17.7%
Hepatic failure 0.6%
Gastrointestinal hemorrhage 3.0%
Multiple organ system failure 3.1%
Sepsis 3.8%
Burns 2.2%
Other 3.5%
Sources: Abt Associates Survey of Critical Care Facilities

10 For the purposes of the survey, an intensivist was defined as an attending physician who, by training and/or experience, is consulted in thecare of the critically ill patient. The role includes assuming responsibility for some or all care of the patient and is more broad than thatprovided by a consulting subspecialist.
Abt Associates Inc. 66
Table 3.28ICU Directors Survey: Percent of Patients Receiving Type ofTreatment/Monitoring
Type of treatment/monitoring Percentage ofpatients
CAVH 0.6%
Hemodialysis 3.7%
Intravenous anti-arrhythmic 7.6%
Invasive arterial monitoring 17.0%
Mechanical ventilation 26.3%
Pacemaker-temporary transvenous 1.2%
IntraAortic balloon pump 0.3%
Pulmonary artery catheter 8.2%
Transfusion 8.3%
Vasoactive/inotropic iv medication 13.7%
Intracranial pressure monitoring 1.2%
Non-invasive ventilation 2.5%
No CPR (CPR not to be performed) 7.9%
Other 1.4%Sources: Abt Associates Survey of Critical Care Facilities
Organization and Staffing Patterns of ICU Units
The medicine department was the most common administrative sponsor for ICU units. Overall,37 percent of ICUs were the responsibility of the medicine department, compared to 29 percentthat were freestanding, and 16 percent that were located organizationally in the surgerydepartment (Figure 3.13).
Nearly 60 percent of ICUs reported using “intensivists” in the ICU10 (Table 3.29). A reasonablelower bound for the proportion of ICUs that will use intensivists in the next 3-5 years is given bythe overall proportion of ICU directors who considered it likely that they would use intensivistsin that period. This overall proportion is calculated using the information from Table 3.29 as 59.1(0.836) + 40.9 (0.106) = 53.7 percent. A natural upper bound on this proportion is given by theoverall proportion of directors who considered it likely or possible that they would use intensivistsin the next 3-5 years. A similar calculation gives this figure as 73.2 percent. The approximaterange of ICUs likely to use intensivists in the near future may therefore be regarded as between53.7 and 73.2 percent. Note that on average, those ICUs that did use intensivists had an averageactive staff of almost 13 intensivists (Table 3.30).

Source: Abt Associates Survey of Critical Care Facilities
Source: Abt Associates Survey of Critical Care Facilities
Figure 3.12: Admitting Source of Patients in Specified ICU
40.8%
20.3%
11.7%
21.9%
3.3%
2.0%
EROR/PACUGen hospOth ICUOth hospPhys off
Figure 3.13: Hospital Department in which the ICU unit is located
0.6%
36.7%
16.0%
29.1%
17.6%
AnesthesiaMedicineSurgeryFreestanding Other

Abt Associates Inc. 68
Table 3.29ICU Directors Survey: Current and Future Role ofIntensivists
Item Percentage of ICUsusing intensivists
Current use of intensivists
Currently use intensivists 59.1%
Future use of intensivists (within 3-5 years)
Don’t currently use intensivists– “likely” to use intensivists within 3-5years
10.6%
Don’t currently use intensivists–“possible” that intensivists will beused within 3-5 years
36.6%
Don’t currently use intensivists– “unlikely” to use intensivists within 3-5 years
51.4%
Currently use intensivists–”likely” touse intensivists within 3-5 years
83.6%
Currently use intensivists–“possible”that intensivists will be used within 3-5 years
7.6%
Currently use intensivists–“unlikely”to use intensivists within 3-5 years
8.8%
Sources: Abt Associates Survey of Critical Care Facilities
Table 3.30ICU Directors Survey: Number of Intensivists in ICU by Specialty andCertification in Critical Care
Specialty of intensivists Number activein specified ICU
Percentagetrained/certified in
critical care
General internal medicine 2.7 50.6%
Cardiology 2.0 68.9%
Pulmonary 2.3 94.1%
Other medical subspecialty 1.2 0.0%
Surgery 3.0 56.4%
Anesthesia 1.1 55.3%
Total (including otherspecialties)
12.7
Notes: Includes only those ICUs that have intensivists in the specified unit.Sources: Abt Associates Survey of Critical Care Facilities
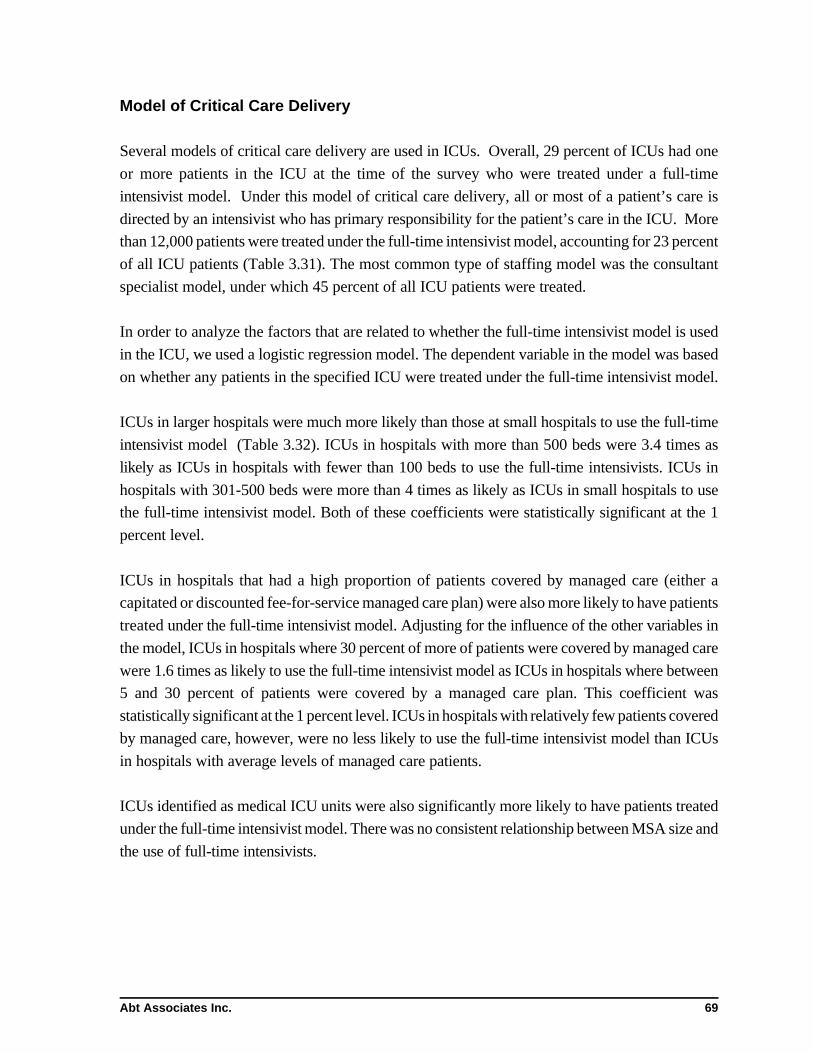
Abt Associates Inc. 69
Model of Critical Care Delivery
Several models of critical care delivery are used in ICUs. Overall, 29 percent of ICUs had one
or more patients in the ICU at the time of the survey who were treated under a full-time
intensivist model. Under this model of critical care delivery, all or most of a patient’s care is
directed by an intensivist who has primary responsibility for the patient’s care in the ICU. More
than 12,000 patients were treated under the full-time intensivist model, accounting for 23 percent
of all ICU patients (Table 3.31). The most common type of staffing model was the consultant
specialist model, under which 45 percent of all ICU patients were treated.
In order to analyze the factors that are related to whether the full-time intensivist model is used
in the ICU, we used a logistic regression model. The dependent variable in the model was based
on whether any patients in the specified ICU were treated under the full-time intensivist model.
ICUs in larger hospitals were much more likely than those at small hospitals to use the full-time
intensivist model (Table 3.32). ICUs in hospitals with more than 500 beds were 3.4 times as
likely as ICUs in hospitals with fewer than 100 beds to use the full-time intensivists. ICUs in
hospitals with 301-500 beds were more than 4 times as likely as ICUs in small hospitals to use
the full-time intensivist model. Both of these coefficients were statistically significant at the 1
percent level.
ICUs in hospitals that had a high proportion of patients covered by managed care (either a
capitated or discounted fee-for-service managed care plan) were also more likely to have patients
treated under the full-time intensivist model. Adjusting for the influence of the other variables in
the model, ICUs in hospitals where 30 percent of more of patients were covered by managed care
were 1.6 times as likely to use the full-time intensivist model as ICUs in hospitals where between
5 and 30 percent of patients were covered by a managed care plan. This coefficient was
statistically significant at the 1 percent level. ICUs in hospitals with relatively few patients covered
by managed care, however, were no less likely to use the full-time intensivist model than ICUs
in hospitals with average levels of managed care patients.
ICUs identified as medical ICU units were also significantly more likely to have patients treated
under the full-time intensivist model. There was no consistent relationship between MSA size and
the use of full-time intensivists.

Abt Associates Inc. 70
Table 3.31ICU Directors Survey: Number of Patients Treated Under Modelsof Critical Care Delivery
Model Number ofpatients
Percentage ofpatients
Full-time intensivist 12,258 23.1%
Consultant intensivist 7,286 13.7%
Consultant specialist 24,247 45.6%
Single physician 7,524 14.2%
Other model of care 1,802 3.4%
Sources: Abt Associates Survey of Critical Care Facilities
Table 3.32ICU Directors Survey: Factors Related to Use of Full-timeIntensivist Model—Logistic Regression Analysis
Variable Parameterestimate
(std error)
Odds ratio
Intercept -1.88***(0.10)
–
MSA populationindicators
MSA: 1-3 million 0.00(0.097)
1.001
MSA: 250,000 - 1 million 0.54***(0.098)
1.719
MSA: 100,000-250,000 0.02(0.12)
1.025
Non-MSA (Rural area) 0.63***(0.093)
1.880
Hospital characteristics
Hospital is a COTH member(i.e., a teaching hospital)
0.60***(0.08)
1.826
Hospital has 500 or morebeds
1.22***(0.11)
3.383
Hospital has 301-500 beds 1.46***(0.10)
4.308
Hospital has 101-300 beds -0.04(0.09)
0.960
Payor source
Low managed care (<5% ofpatients)
-0.06(0.07)
0.938
High managed care (>30%of patients)
0.47(0.07)
1.600
ICU characteristics

Table 3.32ICU Directors Survey: Factors Related to Use of Full-timeIntensivist Model—Logistic Regression Analysis
Variable Parameterestimate
(std error)
Odds ratio
Abt Associates Inc. 71
Medical ICU unit 0.31***(0.09)
1.370
Surgical ICU -0.25***(0.10)
0.775
Other type of ICU -1.28***(0.12)
0.277
Note: The dependent variable in the model was based on whether any patients in thespecified ICU were treated under the full-time intensivist model.
***: Coefficient was statistically significant at the 1% level
Sources: Abt Associates Survey of Critical Care Facilities
Staffing of ICU Units
ICUs have different staffing and coverage arrangements. Under the assumption that every ICU
patient has an attending physician, the survey collected information to capture daytime/nighttime
coverage in the unit. For purposes of the survey, daytime was defined as the normal working day
(approximately 8:00 a.m. - 6:00 p.m.), and nighttime included all other times of the day.
Use of Fellows
For about 20 percent of ICU units, fellows covered the specified unit (Table 3.33). During thedaytime on weekdays, fellows provided full-time in-unit coverage at nearly half of ICUs that usedfellows. The proportion of fellows that covered the ICU full-time in unit fell to 28 percent forweekday nights, and 10-11 percent on weekends. On weekdays, during the daytime, only 11 per-cent of the fellows providing coverage were not physically in the hospital. This proportionincreased to 68 percent during the daytime on weekends and 73 percent at nighttime on week-ends. Even for ICUs that used fellows, the actual number of fellows who provided coverage wassmall — an average of less than two during all parts of the week.
Use of Residents
Overall, 44 percent of ICUs used residents to cover the ICU unit (Table 3.34). This included 89percent of the ICUs that used fellows and 31 percent of ICUs that did not use fellows to coverthe unit. During weekday days, more than half of residents that cover units did so full-time in

Abt Associates Inc. 72
Table 3.33ICU Directors Survey: Staffing and Coverage Arrangements—Use of Fellows
Category Mean
Fellows assigned to unit 20.8%
Type of weekday daytime coverage provided by fellows
Full-time in unit 46.5%
Covers unit and remains in hospital with otherresponsibilities
40.4%
Covers unit but is not physically in hospital 11.4%
Missing/none 1.8%
Type of weekend daytime coverage provided by fellows
Full-time in unit 28.2%
Covers unit and remains in hospital with otherresponsibilities
21.7%
Covers unit but is not physically in hospital 43.0%
Missing/none 7.2%
Type of weekday nighttime coverage provided by fellows
Full-time in unit 11.2%
Covers unit and remains in hospital with otherresponsibilities
19.9%
Covers unit but is not physically in hospital 68.3%
Missing/none 0.6%
Type of weekend nighttime coverage provided by fellows
Full-time in unit 10.0%
Covers unit and remains in hospital with otherresponsibilities
7.2%
Covers unit but is not physically in hospital 73.7%
Missing/none 9.2%
Mean number of fellows providing coverage
Weekday–daytime 1.7
Weekday–nighttime 1.3
Weekend–daytime 1.4
Weekend–nighttime 1.3
Sources: Abt Associates Survey of Critical Care Facilities

Abt Associates Inc. 73
Table 3.34ICU Directors Survey: Staffing and Coverage Arrangements—Use of Residents
Category Mean
Residents assigned to unit 43.6%
Type of weekday daytime coverage provided by residents
Full-time in unit 53.4%
Covers unit and remains in hospital with other responsibilities 41.4%
Covers unit but is not physically in hospital 1.9%
Missing/none 3.3%
Type of weekend daytime coverage provided by residents
Full-time in unit 47.4%
Covers unit and remains in hospital with other responsibilities 35.7%
Covers unit but is not physically in hospital 8.6%
Missing/none 8.3%
Type of weekday nighttime coverage provided by residents
Full-time in unit 43.0%
Covers unit and remains in hospital with other responsibilities 47.4%
Covers unit but is not physically in hospital 6.7%
Missing/none 2.9%
Type of weekend nighttime coverage provided by residents
Full-time in unit 41.6%
Covers unit and remains in hospital with other responsibilities 47.7%
Covers unit but is not physically in hospital 7.2%
Missing/none 3.5%
Mean number of residents providing coverage
Weekday–daytime 3.1
Weekday–nighttime 2.0
Weekend–daytime 1.8
Weekend–nighttime 1.8
Sources: Abt Associates Survey of Critical Care Facilities
the unit, and an additional 41 percent covered the unit and remained in the hospital with other
responsibilities. The proportion of residents in the unit fell slightly at nights and on weekends,
but remained at more than 40 percent even for weekend nights. Residents were much less likely
than fellows to cover the unit while not physically in the hospital, as less than ten percent of ICUs
had residents that provided this type of coverage.
The mean number of residents providing coverage was 3 during the daytime on weekends and
around 2 for all other times. Overall, of the ICUs that were covered by residents, 75 percent used

Abt Associates Inc. 74
four or fewer residents during the weekday daytime shift, and 75 percent also used two or fewer
residents during other shifts.
Use of Staff Physicians
In some units, staff physicians are used to cover the entire ICU. They may play a variety of roles,
including serving as the attending physician, admitting patients, and backing-up emergencies.
Thirty percent of ICUs had staff physicians formally assigned to cover the unit, in the role
described above. During daytime weekdays, 27 percent of these staff physicians were full-time
in the ICU, while 44 percent were elsewhere in the hospital, and 24 percent were not physically
in the hospital (Table 3.35).
Staff physicians were unlikely to be full-time in the unit at nights or on weekends. On weekends,
less than 10 percent of staff physicians were full time in the unit, and 70 percent covered the unit
while not physically in the hospital. Among ICUs that were covered by staff physicians, the mean
number of physicians providing coverage was 3.6 during weekday days and 2 during the other
parts of the week.
Use of Non-physicians
Less than 10 percent of ICU units had non-physicians (including nurse practitioners and
physician assistants) (Table 3.36). Nurse practitioners/clinical specialists and physician assistants
were both used in about 5 percent of ICU units. They were more likely to cover the unit while
in the hospitals with other responsibilities than to be full-time in the unit or cover the unit while
not physically in the hospital. Among ICUs staffed by non-physicians, the average number of
non-physicians providing coverage was slightly more than one.

Abt Associates Inc. 75
Table 3.35ICU Directors Survey: Staffing and Coverage Arrangements—Use of Staff Physicians
Category Mean
Staff physicians assigned to unit 29.5%
Type of weekday daytime coverage provided by staff physicians
Full-time in unit 27.4%
Covers unit and remains in hospital with otherresponsibilities
44.4%
Covers unit but is not physically in hospital 23.7%
Missing/none 4.6%
Type of weekend daytime coverage provided by staff physicians
Full-time in unit 17.3%
Covers unit and remains in hospital with otherresponsibilities
32.8%
Covers unit but is not physically in hospital 44.6%
Missing/none 5.3%
Type of weekday nighttime coverage provided by staff physicians
Full-time in unit 7.3%
Covers unit and remains in hospital with otherresponsibilities
19.0%
Covers unit but is not physically in hospital 70.1%
Missing/none 3.6%
Type of weekend nighttime coverage provided by staff physicians
Full-time in unit 6.6%
Covers unit and remains in hospital with otherresponsibilities
17.8%
Covers unit but is not physically in hospital 69.2%
Missing/none 6.3%
Mean number of staff physicians providing coverage
Weekday–daytime 3.6
Weekday–nighttime 2.1
Weekend–daytime 2.2
Weekend–nighttime 1.9
Sources: Abt Associates Survey of Critical Care Facilities

Abt Associates Inc. 76
Table 3.36ICU Directors Survey: Staffing and Coverage Arrangements—Use of Non-Physicians
Category Mean
Non-physicians assigned to unit 9.1%
Nurse practitioners/clinical specialists assigned to unit 5.6%
Physician assistants assigned to unit 5.6%
Type of weekday daytime coverage provided by non- physicians
Full-time in unit 35.4%
Covers unit and remains in hospital with other responsibilities 56.6%
Covers unit but is not physically in hospital 5.0%
Missing/none 3.1%
Type of weekend daytime coverage provided by non- physicians
Full-time in unit 23.4%
Covers unit and remains in hospital with other responsibilities 30.0%
Covers unit but is not physically in hospital 17.4%
Missing/none 29.2%
Type of weekday nighttime coverage provided by non- physicians
Full-time in unit 21.2%
Covers unit and remains in hospital with other responsibilities 29.2%
Covers unit but is not physically in hospital 15.2%
Missing/none 34.5%
Type of weekend nighttime coverage provided by non- physicians
Full-time in unit 19.0%
Covers unit and remains in hospital with other responsibilities 30.0%
Covers unit but is not physically in hospital 11.7%
Missing/none 39.4%
Mean number of non-physicians providing coverage
Weekday–daytime 1.4
Weekday–nighttime 1.1
Weekend–daytime 1.1
Weekend–nighttime 1.2Sources: Abt Associates Survey of Critical Care Facilities

Abt Associates Inc. 77
4.0 A Model to Project Workforce Requirements inPulmonary and Critical Care Medicine to the Year2030
The base models for the pulmonary and critical care workforce as outlined in Chapter 2 require
the calculation of several dozen parameters from the mail surveys, from the literature and from
available secondary data sources. Section 4.1 below presents the estimated relationships used to
build the base model for critical care medicine and pulmonary medicine. Section 4.2 and 4.3 then
display results for the base models, which extend current patterns of care and training to the year
2030, as well as for some alternative scenarios involving changes in the rate at which new
specialists enter practice, in the distribution of intensive care units by mode of organization, and
in the share of time the pulmonologists devote to internal medicine.
4.1 Estimating Model Relationships
The Critical Care Model
Intensive care in the U.S. population. The number of patient-days in intensive care unitsin the U.S. cannot be calculated with precision because no common system exists for reportinghospital utilization. Inpatient care is better understood in the over-65 population because of near-universal enrollment of this group in Medicare. Total ICU days for persons over 65 wereextracted from the 1995 MedPAR file. ICU days for the 0-17 and 18-64 age groups wereestimated using data from the New Jersey Hospital Reporting System for 1995. Total ICU dayswere divided by the 1995 New Jersey population in the two age groups to compute ICU days percapita. Estimated U.S. ICU days for these age groups were then computed as the product NewJersey ICU days per capita and the 1995 U.S. population in the age group. The results are shownin Table 4.1.
Table 4.1ICU Days, Population, and Estimated ICU Days Per Capita by Age Group
Agecategory Number of ICU days
Population (in000s) ICU days per thousand pop
18-64 182,672 (NJ) 4,891 (NJ) 37.35
65-74 3,230,605 (Medicare) 18,110 178.39
75-84 2,772,359 (Medicare) 11,319 244.93
85+ 948,627 (Medicare) 4,108 230.92
Estimated U.S. total ICU days: 12,945,556
Notes: Total estimated ICU days calculated as sum of Medicare ICU days plus the product of ICU days perthousand population in NJ times U.S. population in the two age groups. U.S. population in thousands, for age 18-64: 160,481.
11 The critical care/internal medicine category also included physicians practicing critical care medicine together with specialties other thanpulmonary medicine, anesthesiology, or surgery.
Abt Associates Inc. 78
The intensivist population and hours worked in 1997. The population of intensivists
practicing in the U.S. in 1997 was defined as those individuals residing in the 50 U.S. states who
indicated a primary or secondary specialty of critical care medicine on the AMA’s survey of
physicians. Those who reported a primary or secondary specialty of pediatrics were removed from
the population. Data from the AMA Masterfile were used to categorize the 1997 population of
physicians by age, sex, and specialty using five specialty definitions: critical care/pulmonary,
critical care/surgery, critical care/anesthesiology, and critical care/internal medicine.11
For these physicians, annual hours in critical care were computed by multiplying reported ICU
hours in the past week by reported annual weeks worked. In order to better capture age
differences in critical care hours, interaction terms for age and sex and for age and pulmonary
specialty were also used. The determinants of annual ICU time were estimated via weighted least
squares. Results are shown in Table 4.2. Physicians who combined critical care with a specialty
other than internal medicine tended to spend much less time (500-700 hours) in the ICU. Hours
devoted to critical care were assumed to be determined by a physician's age, sex, specialty, faculty
status, and by the degree of managed care penetration in the physician's metropolitan area. In
order to better capture age differences in critical care hours, interaction terms for age and sex and
for age and pulmonary specialty were also used.
While annual critical care hours may decline somewhat with age among internists, surgeons, and
anesthesiologists, there is a clear tendency for ICU time to increase after age 40 among
pulmonologists. The age profile of ICU time past the age of 55 is impossible to discern due to
high standard errors.
Although women do tend to spend fewer hours per year in the ICU, this effect appears to occur
after the age of 40. Even at that age, the estimate is statistically significant only at the 0.26 level.
Specialists practicing in areas with a managed care penetration above 25 percent worked 200
hours more in the ICU than did their counterparts in other areas.
The regression estimates reported in Table 4.2 rely on covariates that are available from the AMA
Masterfile for all critical care specialists. Hence total estimated ICU hours, can be computedHcc
t
by combining values of these variables with the estimated regression coefficients as shown in
equation [2.6] in Chapter 2. Summing over all intensivists produces an estimate of total

Abt Associates Inc. 79
Table 4.2Weighted Least Squares Estimates of ICU Time
Covariate Estimate Standard error
Intercept 1092.23 134.06
Full-time faculty -143.05 94.77
Female -62.32 195.50
Age 40-54 -231.45 130.86
Age 55+ 107.56 283.18
Female aged 40+ -265.42 237.68
Specialty: pul only -519.85 133.95
Specialty: pul/cc -474.96 136.36
Specialty: surgery -702.82 186.71
Specialty: anesthesia -710.90 162.64
Pulmonologist aged 40-54 293.21 148.39
Pulmonologist aged 55+ -304.29 293.79
Managed care 10 - 25% 40.79 86.79
Managed care over 25% 201.96 79.96
n 377
R2 0.14
ICU hours by intensivists. This estimate, however, is easily seen to be too high and must be
adjusted. The regression equation for critical care hours was estimated only for those surveyed
physicians who reported nonzero hours in the ICU. Approximately seven percent of intensivists
(as identified by the AMA Masterfile) who were surveyed reported no critical care time. If one
knew which physicians reported a critical care specialty on the AMA questionnaire but did not
practice in the ICU, this would not be a problem, since the summation of predicted hours could
simply be carried out over those known to practice critical care. Because the identity of
nonpractitioners is not known, total hours, estimated as described above must be adjusted by
multiplying the sum of predicted hours by the estimated proportion practicing critical care. The
tendency for self-described intensivists to report no ICU hours was found to be more pronounced
for older physicians and for specialists in anesthesia/critical care; it was less pronounced for
pulmonologists aged 40-54. Hence a somewhat better estimate is obtained by adjusting not by
the overall probability, but by the conditional probability of practicing critical care given these
characteristics. If the estimated probability that physician j practices critical care is represented
by and if his/her estimated hours of critical care (computed using the coefficients in Table 4.2)p ccj
is given by , then total hours of critical care provided by intensivists are given byhccj

12 The reader is cautioned that is not the mean daily ICU time spent by intensivists with their patients. Rather it is the ratio of totalkICUintensivist time to all adult ICU days. Some 24 percent of ICU days were estimated to be provided under the single-physician model with
no intensivist time involved. Hence estimated time by intensivists for all ICU days on which some intensivist time is believed to beprovided is 29.92/0.76 or 39.37 minutes.
Abt Associates Inc. 80
[4.1] H cc ' j p ccj @ h cc
j
The probability of working in the ICU, , was estimated by logistic regression, using age,p cc
anesthesia specialty, and the interaction of age and pulmonary specialty as covariates. Results are
shown in Table 4.3. The probabilities , are calculated asp ccj
[4.2] p ccj ' 1%exp&ji âi zij
&1
where represent intensivist j’s values for the covariates shown in Table 4.3 and the are thezij âi
estimated logistic regression coefficients.
Using equation [2.1] together with data for all physicians identified as intensivists by the AMA
yields an estimate of 6.456 million ICU hours by intensivists in 1997. The fundamental component
of the base model, , can now be computed as the ratio of 6.456 million intensivist hours tokICU
12,945,556 ICU days (Table 4.1) or 0.499 (29.9 minutes per ICU day.)12
Table 4.3Logistic Regression Estimates for Work in ICU
Covariate Estimate Standard error
Intercept 3.23 0.38
Age 40-54 -0.87 0.49
Age 55+ -1.80 0.44
Specialty: anesthesia -1.15 0.39
Pulmonologist aged 40-54 2.01 1.08
n 418
HL 0.09
As a check on the accuracy of the model, the weighted number of ICU patient-days provided
under each of the three ICU models (full-time intensivist, consultant intensivist, and consultant
specialist) under which intensivists are employed were multiplied by the estimates of intensivist
time per patient-day under each. (See Section 2.4.) This calculation produced an estimate of
7.246 million intensivist hours in 1997. That this estimate, developed from independent data,
should differ by only 12 percent from the estimate computed from the physician survey data

Abt Associates Inc. 81
greatly increases our confidence that the model’s baseline parameter for the 1997 supply of
intensivist hours is accurate.
Retirement. All survey respondents were asked to state the age at which they expected to spend
less than 10 percent of their professional time in critical care medicine. This age was treated as
the age of retirement from the practice of critical care medicine. The retirement process was
modeled by fitting a Weibull density to the observed distribution of retirement ages. Estimated
parameters of equations [2.7] and [2.8] are shown in Table 4.4 below. Figure 4.1 displays the
fitted probability of remaining in the practice by age.
Table 4.4Weibull Retirement Parameters for Critical Care Medicine
Parameter Estimate Standard error
59.12 0.25á0
-0.90 0.01á1
4.54 0.04ã
Log-likelihood -22,993
Entry. The physician population is augmented each year by graduates from training programs.
The number of entrants is represented by the variable in equation [2.9]. The base modelAt
assumes that the number of newly trained pulmonary and critical care physicians is provided
annually by the amounts shown in Table 4.5. As noted in Chapter 2, all future trainees in
pulmonary medicine are assumed to go on to practice critical care as well.
Table 4.5New Entrants to Pulmonary and Critical Care Medicine
Specialty Annual number of entrants
pulmonary medicine 127
pulmonary/critical care 227
critical care/internalmedicine
110
critical care/surgery 67
critical care/anesthesia 63
Source: JAMA 278 (1997):

Abt Associates Inc. 82
figure 4.1

Abt Associates Inc. 83
The Pulmonary Model
Inpatient pulmonary care in the U.S. population. Total inpatient days for persons witha primary diagnosis of pulmonary disease in 1995 were extracted from the National InpatientSample of the Hospital Cost and Utilization Project (HCUP-3). Days were grouped by diagnosisusing the categories in Table 2.2. Estimated inpatient days per capita were computed by agecategory. These are shown in Table 4.6.
Table 4.6Pulmonary Inpatient Days, Population, and Estimated Inpatient Days Per Capita by Age Group
Age No. of pul inpat daysPopulation (in
000s) Inpat days per thousand pop
18-64 6,141,714 160,481 38.27
65-74 4,740,126 18,110 261.74
75-84 5,015,768 11,319 443.13
85+ 2,604,910 4,108 634.11
Estimated U.S. total pul inpat days: 18,502,518
Notes: Total estimated inpatient days calculated as sum of Medicare ICU days plus the product of ICU daysper thousand population in NJ times U.S. population in the two age groups. U.S. population in thousands, for age 18-64: 160,481.
Pulmonary outpatient care in the U.S. Population. The estimated number of outpatientpulmonary visits to pulmonary specialists per person was estimated using data provided by UnitedHealthCare Corporation for 1997. Estimates in Table 4.7 below are based on over 3.5 millionperson-years of data. When the per-capita totals are multiplied by population for each age groupand summed, the resulting national estimate is 6,816,797 outpatient visits to pulmonaryspecialists. Though not shown in the table, it is of interest that the data indicate that pul-monologists provided only 2.7 percent of total outpatient visits to patients with respiratorydiagnoses. Outpatient visits shown in the table for the 65+ population are broadly consistent withMedicare data for the state of Washington compiled by Dr. Roger Rosenblatt.
Table 4.7Outpatient Visits to Pulmonologists: 1997, Per Thousand Person-years
Age COPD Asthma ILDPneu-monia HIV
LungCA
PleuralDisease
Respfail Other
18-64 2.711 5.163 0.997 3.593 0.037 1.055 2.720 2.339 23.895
65-74 20.790 6.404 3.680 12.012 0.009 5.817 1.192 12.529 84.888
75-84 17.230 4.562 3.874 17.865 0 4.615 1.679 23.934 103.063
85+ 5.063 1.899 2.492 15.663 0 1.543 1.622 21.873 67.715
Source: United HealthCare Corporation.
Hours worked by pulmonary specialists in 1997. Total hours that pulmonary specialists
spend in inpatient and outpatient pulmonary care in 1997 were computed by weighting survey

13 Note that and have very different interpretations. The former is equal to the ratio of inpatient timekpul IP kpul OPby pulmonary specialists to all inpatient days with pulmonary diagnoses. The latter is equal to the ratio of outpatientpulmonary time by pulmonary specialists to estimated visits to pulmonologists.
Abt Associates Inc. 84
totals to the U.S. The resulting estimates were 3,849,156 hours in inpatient pulmonary care and
4,861,923 hours in pulmonary outpatient care. Values for and can therefore bekpul IP kpul OP
computed as 0.208 and 0.713 respectively.13
Weighted least squares estimates for the determinants of all pulmonary time are shown in Table
4.8. While women are estimated to work about 260 hours less in pulmonary care per year,
estimate is not significant at the conventional 0.05 level due to the high variability in work by
women. (The standard error for the effect of female sex is higher than for any other estimate.)
There appear to be no effects of age on pulmonary work until age 55 or so. Specialists aged 55
and over devote about 260 fewer hours per year, on average to pulmonary care. Finally,
physicians practicing in areas with managed care penetration exceeding 25 percent are estimated
to work some 268 additional hours per year in pulmonary medicine.
Table 4.8Weighted Least Squares Estimates of Pulmonary Time
Covariate Estimate Standard error
Intercept 1210.32 96.01
Full-time faculty -495.78 133.51
Female -259.25 144.70
Age 40-54 -8.05 130.86
Age 55+ -259.02 111.86
Specialty: pul/cc -30.84 80.51
Managed care over 25% 267.65 76.68
n 230
R2 0.12
Retirement. A Weibull density was fitted to the distribution of ages at which survey respondents
reported themselves likely to retire from the practice of pulmonary medicine. Estimated
parameters are shown in Table 4.9. The computed median age of retirement from pulmonary
medicine is 60. The probability of remaining in practice by year is displayed in Figure 4.2.

Abt Associates Inc. 85
Table 4.9Weibull Retirement Parameters for Pulmonary Medicine
Parameter Estimate Standard error
59.28 0.31á0
-0.91 0.01á1
4.66 0.04ã
Log-likelihood -19,850
Internal medicine time. In order to explore the possible effects associated with a reallocation
of clinical time by pulmonologists from internal medicine to pulmonary medicine, the relationship
of internal medicine time by pulmonologists to other characteristics was estimated by regression
as before. Results are shown in Table 4.10. Full-time faculty and pulmonary/critical care
specialists devoted substantially less time (about 360 hours per year) to the practice of internal
medicine than did other pulmonologists. Physicians aged 40-54 also tended to spend less time in
internal medicine.
Table 4.10Weighted Least Squares Estimates of Internal Medicine Hours byPulmonologists
Covariate Estimate Standard error
Intercept 700.71 70.41
Full-time faculty -361.76 104.90
Female -135.97 113.58
Age 40-54 -178.26 73.55
Age 55+ -116.84 87.20
Specialty: pul/cc -362.21 62.79
n 230
R2 0.19

Abt Associates Inc. 86
fig 4.2

Abt Associates Inc. 87
4.2 Projecting the Future of the Critical Care Workforce
The number of critical care specialists supplied and demanded as projected by the equations of
the base model presented in Chapter 2 is shown in Figure 4.3. Note that physician full-time
equivalents (FTEs) were defined in terms of the 1997 mean annual ICU hours for a pulmonary
and critical care specialist (532 hours). Intensivist time supplied and demanded remain in rough
equilibrium until the year 2012 or so, both increasing by about 17 percent over their 1997 values.
After this time the discrepancy between the demand and supply for intensivist time grows
continually. By the year 2020, demand will have increased by 38 percent, but supply only 22
percent from 1997. Consequently a shortfall of intensivist hours equal to 12 percent of demand
will exist by 2020; by 2025 it is predicted to be 18 percent of demand. The source of the growing
divergence in demand and supply is plain. The oldest children of the postwar baby boom will
reach age 65 in 2011. After that year, the proportion of the population aged 65 and over will
continue to grow at a historically unprecedented rate. Because ICU utilization by the over-65
population is four to six times greater than that of younger adults (see Table 4.1) a continuing rise
in demand is unavoidable. This steady increase is not matched by any corresponding increase in
the supply of intensivist time. Under the base model, rates of entry by new trainees remain fixed
at their 1996 levels. The emergence of a growing unsatisfied demand for intensivist time is thus
inevitable by simple arithmetic.
Alternative scenario 1: Training reductions. The consensus of the COMPACCS group
was that current training programs in critical care medicine were unlikely to be maintained at their
current level. The consensus was that programs for surgery/critical care and anesthesia/critical
care would remain at the current levels reported in Table 4.5, while programs in pulmonary
medicine, pulmonary/critical care medicine, and critical care/internal medicine would decline by
15 positions each over the next 10 years. Figure 4.4 shows the resulting projection. Because of
the reduced supply, the emergence of a shortfall of intensivist time appears about three years
earlier in 2009. This shortfall equals 18 percent of demand by 2020 and 24 percent of demand by
2025.
Alternative scenario 2: Training reductions and an increase in full-time intensivistcare. Results reported in Chapter 3 showed an association between the proportion of ICUs
operating under the full-time intensivist model and both hospital size and managed care
penetration. Because small hospitals have continued to merge or drop out of the market in recent
years and because managed care has is likely to expand further in the near future, the full-time
intensivist model is likely to become more prevalent over time. Hence, while retaining the
COMPACCS consensus on future training, the proportion or patients treated under the full-time

Figure 4.3 Supply and Demand for Intensivists Under the Base Model
0
2000
4000
6000
8000
10000
12000
14000
16000
18000
20000
1997 2000 2003 2006 2009 2012 2015 2018 2021 2024 2027 2030
Year
Ph
ysic
ian
FT
Es
ICU Demand
ICU Supply
Figure 4.4 Supply and Demand for Intensivists Under the Scenario One: Reduced Training Slots
0
2000
4000
6000
8000
10000
12000
14000
16000
18000
20000
1997 2000 2003 2006 2009 2012 2015 2018 2021 2024 2027 2030
Year
Ph
ysic
ian
FT
Es
ICU Demand
ICU Supply
Abt Associates Inc. 89
Figure 4.5 shows supply and demand under this scenario. A shortfall emerges almost immediately
and becomes pronounced by about 2007. The magnitude of the shortfall is 24 percent of demand
in 2020 and 30 percent in 2025.
4.3 Projecting the Future of the Pulmonary Medicine Workforce
Figure 4.6 displays the supply and demand for time by pulmonary medicine specialists under the
base model. The most striking aspect of the model is the immediate gradual decline in supply over
the next 20 years. In pulmonary medicine, unlike critical care, a shortfall develops quickly under
the base model and continues to widen over time. This result is a consequence of the age
structure of the current pulmonary medicine workforce. The mean age of specialists in pulmonary
medicine currently in practice is 50, compared to 43 for pulmonary and critical care specialists
and 42 for specialists in critical care/internal medicine. (See Table 3.2.) Nearly 30 percent of
pulmonologists are aged 55 and over, compared to just five percent for pulmonary/critical care
and internal medicine/critical care specialists. Because the median retirement age of
pulmonologists as reported on the mail survey of physicians is 60, the number of trainees entering
pulmonology will not be sufficient to compensate for workforce losses due to retirement. The
shortfall of pulmonary medicine FTEs is 28 percent by 2020 and 33 percent by 2025.
Alternative scenario 1: Training reductions. The COMPACCS consensus on training
reductions was applied to the pulmonary medicine model in the same fashion as for the critical
care model. For obvious reasons, only the reductions applying to pulmonary and
pulmonary/critical care medicine affect the model projections. The reduced supply tends of course
to exacerbate the shortfall, now projected to be 32 percent of demand by 2020 and 37 percent
by 2025. The scenario is displayed in Figure 4.7.
Alternative scenario 2: Training reductions and increased pulmonary time bypulmonologists. A reasonable response to the shortfall in pulmonary medicine time as seen
in the base model and in Scenario 1 is for practicing pulmonologists to devote a greater share of
their clinical time to pulmonology. To investigate the effects of such a change, supply and demand
were simulated under the assumption that over the next 10 years, pulmonologists would
reallocate 50 percent of the time now devoted to internal medicine to the practice of pulmonary
medicine. As Figure 4.8 shows, this response would tend to delay the time at which a shortfall
emerges to 2012 or so. The shortfall itself is equal to 10 percent of demand in 2020 and 14
percent in 1025, substantially lower than under the two previous scenarios.
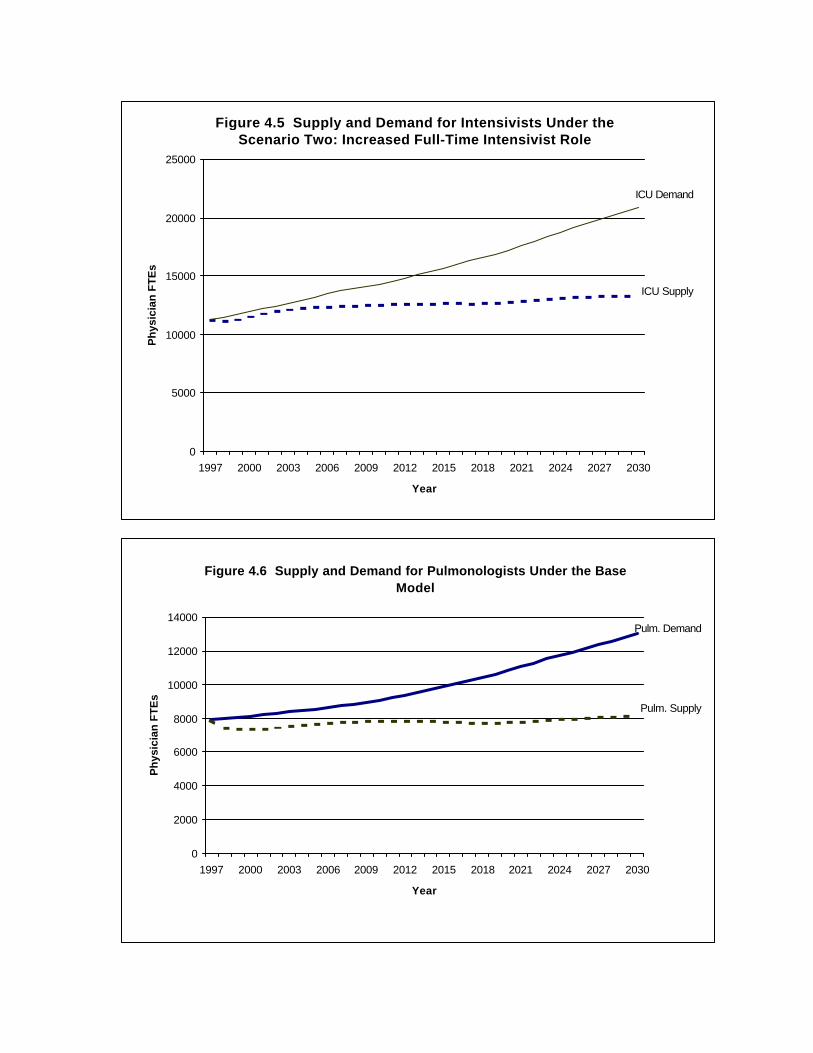
Figure 4.5 Supply and Demand for Intensivists Under the Scenario Two: Increased Full-Time Intensivist Role
0
5000
10000
15000
20000
25000
1997 2000 2003 2006 2009 2012 2015 2018 2021 2024 2027 2030
Year
Ph
ysic
ian
FT
Es
ICU Demand
ICU Supply
Figure 4.6 Supply and Demand for Pulmonologists Under the Base Model
0
2000
4000
6000
8000
10000
12000
14000
1997 2000 2003 2006 2009 2012 2015 2018 2021 2024 2027 2030
Year
Ph
ysic
ian
FT
Es
Pulm. Demand
Pulm. Supply

Figure 4.7 Supply and Demand for Pulmonologists Under Scenario 1: Reduced Training Slots
0
2000
4000
6000
8000
10000
12000
14000
1997 2000 2003 2006 2009 2012 2015 2018 2021 2024 2027 2030
Year
Ph
ysic
ian
FT
Es
Pulm. Demand
Pulm. Supply
Figure 4.8 Supply and Demand for Pulmonologists Under Scenario 2: Increased Pulmonary Clinical Time
0
2000
4000
6000
8000
10000
12000
14000
1997 2000 2003 2006 2009 2012 2015 2018 2021 2024 2027 2030
Year
Ph
ysic
ian
FT
Es
Pulm. Demand
Pulm. Supply

Abt Associates Inc. 92
4.4 Limitations of the Model
There are several limitations to the model that should be considered when interpreting the results
of the workforce model. First, the workforce model is static and has no mechanism for modeling
how physicians and ICU directors respond to any physician shortfall that occurs in the future.
Price is the major factor that keeps markets in equilibrium, but neither the price of critical care
or the wages paid to critical care physicians are incorporated into the model. In effect, relative
prices are assumed fixed across time, resulting in the physician shortages predicted by the model.
The real world, however, is dynamic, and prices to adjust to relieve shortages and surpluses.
Medical directors are likely to use a variety of financial incentives to reduce the physician
shortages predicted by the workforce model. Medical directors can be expected to offer a variety
of financial incentives to induce physicians to increase the amount of critical care or pulmonary
patient care time supplied, for example by encouraging physicians to begin treating patients in the
ICU or delay retirement. The upward pressure on the wage rates for critical care physicians and
pulmonologists is likely to increase the number of new medical students who wish to pursue
critical care medicine or pulmonology, resulting in pressure to increase the number of training
slots available.
Even if price adjustments are insufficient to relieve the anticipated workforce shortfalls, to the
extent that some of the care provided by physicians can be performed by other staff (e.g.,
residents, fellows, or non-physicians such as nurse practitioners or physician assistants), the
shortage could be mitigated by making greater use of these resources.
Another limitation of the model is its partial equilibrium nature. The model, by design, focuses
only on changes to the demand and supply of critical care physicians (for the ICU model) and
pulmonologists (for the pulmonary model). Because the model results are driven, to a large
extent, by changes in population (particularly the large increases in the aged population that are
projected by the U.S. Census Bureau), other medical specialties are likely to face potential work-
force shortages if the number of new physicians trained is not increased. These types of global
pressures may force fundamental changes in the way that health care services are provided or
financed in the future, affecting future workforce requirements. However, since it is not possible
to anticipate what those changes might be, these types of changes are not incorporated into the
model.
The demand projections for the ICU model are driven by two main factors-- the much higher
utilization of ICU days by the aged population relative to their younger counterparts, and the
large increase in the aged population that is expected over the next 10-20 years. The 18-64 popu-

Abt Associates Inc. 93
lation had 178 ICU days per 1,000 population, compared to 245 for the 65-84 population and 231
for those over the age of 85.
The ICU utilization data that was used in the workforce model came from two different sources--
data from the state of New Jersey was used for the under-65 population, while national MedPAR
data was used to estimate utilization for the over-65 Medicare population. A critical assumption
underlying the use of these data is that ICU utilization in New Jersey is representative of the
nation as a whole. If New Jersey is not representative, then our estimates of the different
utilization rates for the aged and under-65 population may be biased, as they would partly reflect
differences in ICU utilization between New Jersey and the rest of the nation that have nothing to
do with age effects. This type of bias could cause our future projections to be either too low or
too high, depending on how New Jersey differs from other states. It is not possible to test for the
presence of this type of bias, since New Jersey was the only state for which we had data on the
ICU utilization of the under-65 population.

Abt Associates Inc. 94
5.0 Conclusions
5.1 The Forecasting Model: Demand for Care Driven by FuturePopulation Demographics
Projections of the supply and demand for pulmonary and critical care time based on observed
patterns of care and physician work effort in the mid-1990s provide no evidence of a future
surplus of these specialists. Indeed there are good reasons to believe that a continuing shortfall
of pulmonary and critical care specialists will emerge by between 2010 and 2020. This shortfall
is likely to develop because of the rapid increase in the proportion of the population aged 65 and
over, beginning early in the 21st century. It may be further exacerbated in the case of pulmonary
medicine, by the retirement of a substantial portion of currently practicing pulmonologists over
the next 20 years.
While the growth of managed care and other market changes are commonly invoked as a poten-
tial brake on the growth of demand for physician time, they may well accelerate the demand for
intensivists. The survey of ICU directors undertaken for this project found that larger hospitals
and hospitals with a larger share of patients enrolled in managed care plans were more likely to
organize their intensive care units under a “full-time intensivist” model. If this model of ICU care,
currently estimated to apply to about 24 percent of ICU days, grew to 30 percent of days over
the next 10 years, demand for intensivist time by 2010 would grow by 25 percent, compared to
a 14 percent increase under the status quo.
Given a growing and aging population and constant or declining entry into pulmonary and critical
care medicine, the eventual appearance of a shortage is an arithmetic certainty. The relevant issue
is when this shortage will emerge. In pulmonary medicine, we saw that an imminent shortfall may
be delayed by 10 years or more by a reallocation of pulmonologist time away from the provision
of internal medicine and toward pulmonary care. The shortfall in critical care is sure to give rise
to a variety of market responses designed either to elicit additional hours of care by intensivists
or to find ways of substituting the time of so-called nonphysician clinicians (NPCs) for at least
some ICU time that would otherwise be provided by intensivists. Because we can only guess at
the nature of incentives likely to arise from an increasingly tight labor market for intensivists, the
nature and degree of physician response is virtually impossible to gauge. Some may increase their
ICU time or delay their retirement from critical care medicine. Physicians without formal training
in critical care may be encouraged to enter the discipline. The size of the shortage predicted by
the simulations in this paper should be regarded as an index of pressure on the current workforce
arrangements. The configuration of the U.S. population and pulmonary and critical care training

Abt Associates Inc. 95
programs at present suggests that these arrangements are likely to change significantly in the next
25 years.
5.2 Demand for Care Independent of Population Demographics
The model presented in this report was constructed with the assumption that in the future, the
patterns of pulmonary and critical care practice would be unchanged. Specifically, theCOMPACCS data demonstrate that in 1997 one third of critical care demand was provided by
intensivists and less than 3 percent of pulmonary care by pulmonologists. For the purposes ofthe COMPACCS model, these percentages were held constant when projecting future demand
for pulmonary and critical care physicians. The rationale for this approach was to avoid any con-troversy over predicting future patterns of clinical practice. Even by keeping practice patterns
constant, the COMPACCS model demonstrates that future population demographics willincrease the demand for pulmonary and critical care physicians.
However, there is evidence suggesting that practice patterns will not stay constant, particularly
in critical care. Published studies suggest that full-time intensivists improve outcomes and costsof critical care (Bach, Carson and Leff 1998; Manthous et al. 1997; Li et al. 1984; Mallick et
al. 1995). The COMPACCS data demonstrate that in the majority of hospital ICUs, intensivistsplay a significant role and that most ICU directors feel that this role will expand. Therefore,
increased emphasis on quality and cost-effectiveness may stimulate more demand for criticalcare subspecialists.
The COMPACCS data indicate that this trend may already have begun. The full-time intensivist
model is prevalent in larger hospitals, with large volumes of critically ill patients. As notedpreviously, the full-time intensivist model is also more common in hospitals for whom managed
care penetration is 30 percent or more. These two observations are statistically independent ofone another. These data suggest that both the increased volume of critically ill patients from the
aging population and any trend toward rising managed care penetration nationally may increasethe percentage of critical care provided by intensivists.
The effect of managed care has been a major issue in all physician workforce studies. In
pulmonary and critical care, managed care appears to have no negative impact on future work-force requirements. As COMPACCS data confirm, most critically ill patients are admitted from
the emergency room or other ICUs and their illnesses cannot be anticipated or managed.Managed care intervention focuses on reducing ICU length of stay, rather than access. Full-time
intensivists use resources more judiciously (Bach, Carson and Leff 1998; Mallick et al. 1995),and this may explain why this practice model is more prevalent in areas of high managed care
Abt Associates Inc. 96
penetration. Therefore, pressure to reduce ICU length of stay is likely to promote an expandedrole for intensivists.
At the other extreme, most pulmonary care is already managed by primary care physicians who
commonly treat pneumonia, asthma and COPD. COMPACCS data from health insurancesources demonstrate that less than 3% of all pulmonary care is provided by pulmonologists. This
percentage and its financial impact is already so small that pulmonary care is an unlikely targetfor any managed care intervention. This prediction is bolstered by the fact that subspecialty
carve-outs or subcapitation arrangements are rare for pulmonary care outside the ICU.
Important in all workforce studies are the roles of trainees and other health care professionals.COMPACCS data indicate that non-physician health professionals, such as nurse practitioners
and physician assistants, provide coverage in less than 10% of all ICUs. In contrast, 44% of allICUs are covered by physician residents in training who are physically in the hospital, twenty
four hours per day. This information strongly suggests that the critical care workforce is, ineffect, subsidized by postgraduate medical education.
The future of this indirect subsidy is in jeopardy since there is increasing pressure to cut
residency programs. Furthermore, all parent specialties of critical care have limited the amountof critical care experience during residency training. The result is that in some hospitals with
growing critical care demand, ICUs may have reduced resident coverage. In such institutions,a likely outcome is that critical care physicians, partnering with other health care professionals,
will provide this coverage. If this becomes a major trend nationally, the demand for intensivistsmay increase since the amount of critical care provided by residents dwarfs their teaching
demands.
A growing trend in American health care is the use of "hospitalist" physicians who concentrateon inpatient medicine (Wachter and Goldman 1996). The physicians surveyed by COMPACCS
often serve this role and see it expanding. About half of all critical care internists and criticalcare pulmonologists function as hospitalists with commitments ranging from 37 percent to 78
percent of all inpatient clinical time. Respondents across all specialties see growth in thehospitalist field. How these observations translate into workforce requirements is unknown.
Critical care physicians conveniently serve the hospitalist role because of their focus on inpatientcare. Currently, the hospitalist role requires no special training and, according to the National
Association of Inpatient Physicians, most hospitalists are internists. If demand increases for boththe hospitalist and intensivist roles, the major training impact will be in critical care.
COMPACCS considered two factors which could theoretically decrease demand for care--
reduced disease prevalence and reduced access to critical care. In its forecast model,
Abt Associates Inc. 97
COMPACCS assumed no change in disease prevalence. While some might argue for small im-provements in some diseases, COMPACCS found no data to indicate that major disease
categories such as cardiovascular disease, cancer or respiratory disorders will decline in thefuture. Conversely, COMPACCS did not foresee any increased prevalence in any major disease
category.
Nonetheless, critical care is tightly linked to the development of new therapies. The ICU is aresource required for many patients with advanced disease who are treated with new
technology. Recent examples include organ transplantation and cancer therapies. Therefore, aslong as American society pushes the envelope of treating advanced disease, there will be a
sustained demand for critical care.
Access to critical care could become an important public policy issue in the next century. Asunlikely as it seems today, society could choose to deny critical and pulmonary care to certain
patient groups. Particularly vulnerable are the very old since their care has already been rationedin some western countries. The COMPACCS forecasting model has not been tested under
different scenarios of rationing. Nevertheless, reducing access to care would obviously reducethe demand for such care.
5.3 Summary
The COMPACCS study has documented the current demand for pulmonary and critical care in
the United States at the close of the twentieth century. Pulmonary and critical care physicianstypically work in excess of sixty hours per week for at least 48 weeks annually. There are no
reports of unemployment among these physicians. Therefore the current demand for thesephysicians' services appears robust.
Early in the twentieth century, the demographics of the United States will shift and the elderly
will become a larger segment of the population by the year 2010. The result will be increaseddemand for all medical care required for aging citizens. Medicare data demonstrate that
pulmonary disease and critical illness attack the elderly in a disproportionate way. As peopleage, they require more pulmonary and critical care. There are no epidemiological forces nor
technical advances which are likely to change this fact. Therefore, it is obvious that the demandfor pulmonary and critical care will increase in the United States as its population ages. The
COMPACCS workforce computer model documents the degree of increased demand undervarying scenarios.
How does this study and its conclusions compare to other workforce reports? The most
important point is that COMPACCS projected its forecast to the year 2030, to demonstrate the

Abt Associates Inc. 98
full impact of the aging population. This looming challenge has been ignored in most workforcestudies, whose projections have rarely looked beyond the year 2005. Educational programs and
career planning have significant lead times so a generous time projection is justified evenwithout the known changes in the population.
The second point is that COMPACCS developed a data-driven and flexible forecasting model
in response to potential managed care influences on physician demand. Previous studies havebeen sensitive to this issue but have often used staff model HMO's to model physician
workforce. This modeling may be outdated and inappropriate when applied to pulmonary andcritical care physicians.
The managed care industry is currently undergoing a major transformation. Many staff model
HMOs have been disbanded or reorganized. Most health insurers are now seeking premiumincreases, raising the question of whether managed care is the ultimate solution to health care
costs (Smith 1998). While managed care may have curbed health care costs, this effect may betemporary. This doubt is most serious in the Medicare population, from which many insurers
have beat a hasty retreat because of large losses (Kassirer 1998).
This observation is important in the workforce projections of pulmonary and critical carephysicians. The COMPACCS study demonstrates that, on average, 40 percent of patients treated
by these physicians are insured by Medicare. Therefore, now and particularly in future, managedcare's penetration into the Medicare population will be important for pulmonary and critical care
physicians.
Even so, managed care may not disadvantage pulmonary and critical care physicians. Manystaff model HMOs had previously outsourced pulmonary and critical care services (Hart et al.
1997). Furthermore, the demand for care by pulmonologists is already highly managed and isunlikely to change in the future. Managed care's emphasis on quality and cost has already
increased the demand for full-time intensivists and this is likely to escalate. The hospitalist role,which appears to be growing in response to managed care, is already a significant practice niche
for pulmonary and critical care physicians.
The final innovation in this study is the use of a computer forecasting model. This tool canproject the workforce requirements under changing assumptions of physician supply, disease
prevalence, and practice patterns. This model suggests that under any reasonable scenario, thedemand for pulmonary and critical care physicians will be sustained and likely grow over the
next thirty years.

Abt Associates Inc. 99
In summary, the COMPACCS study demonstrates that sustaining the resources for trainingpulmonary and critical care physicians is necessary to meet health care demands in the United
States. As these demands grow in the next century, additional resources will likely be required.

Abt Associates Inc. 100
References
Amemiya, T. Advanced Econometrics. Harvard University Press, 1985.
Asch DA, Hansen-Flaschen J, and Lanken PN. Decisions to Limit or Continue Life-Sustaining Treatment by Critical Care Physicians in the United States: Conflicts BetweenPhysicians’ Practices and Patients’ Wishes. Am J Respir Crit Care Med, 1995. 151:279-92.
Bach, PB; Carson SS, Leff A. Outcomes and Resource Utilization for Patients withProlonged Critical Illness Managed by University-Based or Community-BasedSubspecialists. Am J Resp Crit Care Med, 1998. 158:1410-15.
Bates JH, Addington MW, Briggs DD, et al. Pulmonary Manpower Report. Report andRecommendations of the ad hoc Committee on Pulmonary Manpower. Am Rev Respir Dis,1983. 127:665-70
Carson SS, Stocking C, Podsadecki T, et al. Effects of Organizational Change in theMedical Intensive Care Unit of a Teaching Hospital: A Comparison of “Open” and“Closed” Formats. JAMA, 1996. 276:322-8.
Cassel C, Nelson E, Smith T, et al. Internists’ and Surgeons: Attitudes Toward Guns andFirearm Injury Prevention. Annals of Internal Medicine, 1998. 128:224-230.
Cochran, William. Sampling Techniques. New York: Wiley, 1974.
Collett D. Modeling Survival Data in Medical Research. Chapman and Hall, 1994.
Cooper R. Perspectives on The Physician Workforce to the Year 2020. JAMA, 1995. 274:1534-43.
Council on Graduate Medical Education. Recommendations to Improve Access to HealthCare Through Physician Workforce Reform. U.S. Department of Health and HumanServices, 1994.
Cox D.R., Oakes D. Analysis of Survival Data. Chapman and Hall, 1984.
Gay PC, Dellinger RP, Shelhamer JH, Offord K. The Practice of Critical Care Medicine: ANational Survey Report. ACCP Council on Critical Care. Chest, 1993. 104: 271-78.
George RB. Subspecialty Training and the 50% Solution. Chest, 1994. 106:985-6.
Groeger JS, Strosberg MA, Halpern NA, et al. Descriptive Analysis of Critical Care Units inthe United States. Crit Care Medicine, 1992. 20:846-63.
Hart LG, Wagner E, Pirzada S, Nelson AF, Rosenblatt RA. Physician Staffing Ratios inStaff-Model HMOs: A Cautionary Tale. Health Affairs, 1997. 16:55-70.

Abt Associates Inc. 101
Health Resources and Services Administration. Health Personnel in the United States, EightReport to Congress. US Department of Health and Human Services, 1991.
Jacobsen S., Rimm A. The Projected Physician Surplus Reevaluated. Health Affairs, 1987. 6:48-56.
Jonasson O, Kwakwa F, Sheldon GF. Calculating the Workforce in General Surgery. JAMA, 1995. 274:731-34.
Kassirer JP, Angell M. Risk Adjustment or Risk Avoidance? N Eng J Med, 1998. 339:1925-26.
Li TC, Phillips MC, Shaw L, et al. On-Site Physician Staffing in a Community HospitalIntensive Care Unit. Impact on Test and Procedure Use and on Patient Outcome. JAMA,1984. 252:2023-7.
Mallick R, Strosberg M, Lambrinos J, Groeger JS. The Intensive Care Unit MedicalDirector as Manager: Impact on Perforamce. Med Care, 1995. 33:611-24.
Manthous CA, Amoateng-Adjepong Y, al-Kharrat T, et al. Effects of a Medical Intensiviston Patient Care in a Community Teaching Hospital. Mayo Clin Proc, 1997. 72:391-9.
Meyer GS, Jacoby I, Krakauer H, et al. Gastroenterology Workforce Modeling. JAMA,1996. 276:689-94.
Multz AS, Chalfin DB, Samson M, et al. A “Closed” Medical Intensive Care Unit (MICU)Improves Resource Utilization When Compared with an “Open” MICU. Am J Respir CritCare Med, 1998. 157:1468-73.
Neilson EG, Hull AR, Wish JB, et al. The Ad Hoc Committee Report on Estimating theFuture Workforce and Training Requirements for Nephrology. Journal of the AmericanSociety of Nephrology, 1997.
Schroeder S, Sandy L. Specialty Distribution of U.S. Physicians: The Invisible Driver ofHealth Care Costs. N Eng J Med, 1993. 328:961-63.
Schwartz WB, Sloan WF, Mendelson D. Why There Will Be Little or No PhysicianSurplus Between Now and The Year 2000. N Eng J Med, 1988. 318:892-97.
Schwartz MI. Pulmonary-Critical Care Medicine in the Era of Healthcare Reform. Chest,1994. 106:986-8.
Smith S, Freeland M, Heffler S, et al. The Next Ten Years of Health Spending: What Doesthe Future Hold? Health Affairs, 1998. 17:128-140.

Abt Associates Inc. 102
Steinwachs DM, Weiner JP, Shapiro, et al. A Comparison of the Requirements for PrimaryCare Physicians in HMOs with Projections Made by the GMENAC. N Eng J Med, 1986. 314:217-22.
Tarlov AR. Estimating Physician Workforce Requirements: The Devil is in theAssumptions. JAMA, 1995. 274:1558-60.
Wachter RM, Goldman L. The Emerging Role of “Hospitalists” in the American HealthCare System. N Eng J Med, 1996. 335:514-7.
Weiner DM, McDaneil R, Lowe FC. Urologic Manpower Issues for the 21st Century: Assessing the Impact of Changing Population Demographics. Urology, 1997. 49:335-42.
Weiner J. Forecasting the Effects of Health Reform on the U.S. Physician WorkforceRequirements: Evidence from HMO Staffing Patterns. JAMA, 1994. 272:222-30.
Whitcomb ME. Pulmonary Medicine Revisited. Chest, 1991. 100:300-1.
Whitcomb ME.. Pulmonary Medicine Training. Time to Pull in the Reins. Chest, 1986. 90:473-5.