Embed Size (px)
Citation preview

INTERNATIONAL JOURNAL OF CLIMATOLOGYInt. J. Climatol. (2010)Published online in Wiley InterScience(www.interscience.wiley.com) DOI: 10.1002/joc.2200
Future climate of the Caribbean from a regional climatemodel
Jayaka D. Campbell, Michael A. Taylor,* Tannecia S. Stephenson, Rhodene A. Watsonand Felicia S. Whyte
The Climate Studies Group Mona, The University of the West Indies, Mona, Kingston 7, Jamaica, West Indies
ABSTRACT: Scenarios of rainfall and temperature changes for the period 2071–2100 under the A2 and B2 SpecialReport on Emissions scenarios are examined using the Hadley Centre Providing Regional Climates for Impacts Studiesregional climate model. The model simulates ‘present-day’ (1979–1990) rainfall and temperature climatologies reasonablywell, capturing the characteristic bimodality of Caribbean rainfall and the boreal summer maximum and winter minimumtemperatures. Seasonal spatial patterns are also reproduced, but rainfall amounts are underestimated over the northernCaribbean island masses, including Cuba, Jamaica, Hispaniola and Puerto Rico. Temperatures over the region are alsooverestimated by 1–3 °C. For the period 2071–2100, temperatures are projected to increase across the region by 1–4 °Cfor all months irrespective of the scenario. The rainfall response varies with season with one of the more robust changesbeing an intensification of a gradient pattern in November–January, in which the northern Caribbean (i.e. north of 22°N) getswetter and the southern Caribbean gets drier. There is also a robust June–October drying signal. The results point to changesin the regional circulation patterns due to the human-induced climate change and warrants further investigation. Copyright 2010 Royal Meteorological Society
KEY WORDS climate change; Caribbean; scenarios; rainfall; temperature
Received 23 February 2009; Revised 12 June 2010; Accepted 16 June 2010
1. Introduction
In recent times, due to both anthropogenic and naturaleffects, the earth’s climate has been changing. Globally,mean surface temperatures have increased by approxi-mately 0.74 ± 0.18 °C since the turn of the 19th century[Inter Governmental Panel on Climate Change (IPCC)Fourth Assessment Report] (Solomon et al., 2007), withfurther increases projected through the end of the century.This will result in shifts in regional rainfall and tem-perature regimes and climate extremes (Solomon et al.,2007).
Station observations in the Caribbean (Figure 1) showa statistically significant warming trend over the latterhalf of the 20th century (Peterson et al., 2002). Futureshifts in climate regimes will have implications for thedeveloping states within the Caribbean given the climatesensitivity of their economies (Jury, 2009). Caribbeanstates largely rely on sectors such as tourism or agricul-ture for economic sustainability and growth. The gener-ation of climate change projections and scenarios for theCaribbean at appropriate scales is therefore an importantexercise particularly for long-term planning.
* Correspondence to: Michael A. Taylor, The Climate Studies GroupMona, The University of the West Indies, Mona, Kingston 7, Jamaica,West Indies. E-mail: [email protected]
Global climate models (GCMs) are the most com-mon tools for investigating climate change and mak-ing projections for the future. GCMs are mathematicalrepresentations of physical processes in the atmosphere,ocean, cryosphere and land surface. They represent theclimate using a three-dimensional grid over the globe,typically with a horizontal resolution between 125 and600 km, 10–20 vertical layers in the atmosphere and asmany as 30 ocean layers. In recent decades, the evolu-tion of GCMs has allowed for a much better scientificunderstanding of anthropogenic global climate change,much of which has been reported in the IPCC’s Assess-ment Reports (Solomon et al., 2007). In the Caribbean,GCM realizations have been used to project a 1–2 °Ctemperature rise by the mid-2050s and increases insea-surface temperatures and vertical windshear (Singh,1997a, 1997b; Angeles et al., 2006) under a ‘businessas usual’ scenario. Other GCM-based rainfall projectionsfor the region suggest (1) a slight decline in annual rain-fall (−6.8 ± 15.8%) (Nurse and Sem, 2001); (2) a slightincrease in December–February rainfall (Nurse and Sem,2001); (3) a decrease in June–August rainfall (Nurse andSem, 2001); (4) an increase in early and late season rain-fall (Angeles et al., 2006); (5) a decrease in annual rainydays (Nurse and Sem, 2001; Solomon et al., 2007) and(6) an increase in the daily intensity of rainfall (Nurseand Sem, 2001; Solomon et al., 2007). Gamble and Curtis
Copyright 2010 Royal Meteorological Society

J. D. CAMPBELL et al.
Figure 1. Map showing PRECIS domain over the Caribbean and adjacent Caribbean region. The box shows the Caribbean rainfall index domainas defined by Chen and Taylor (2002).
(2008) present a review of Caribbean rainfall projectionsfrom GCMs.
The resolution of global models is, however, too coarseto provide information at the local and regional scalesneeded for vulnerability assessments and the develop-ment of local adaptation strategies (Aldrian et al., 2004;Xianfu, 2006). This is particularly true for the Caribbeanas most of the small islands are not represented in theGCMs. Regionalization or downscaling techniques aretherefore necessary for extracting finer scale informa-tion from GCM output, which may prove useful for theimpacts and adaptation communities. Downscaling tech-niques can be classified into three categories: (1) high res-olution and variable resolution ‘time-slice’ AtmosphereGCM experiments; (2) nested limited area (or regional)climate models (RCMs) and (3) empirical/statistical andstatistical/dynamical methods (Mearns et al., 2003). Eachcategory has its suitability depending on varying criteriaincluding the scale of climate information that is required(see discussions by Wilby and Wigley, 1997; Mearnset al., 2003; Dobler and Ahrens, 2008 ).
This paper has its foundation in type (2) downscaling,and is an examination of climate change projections forthe Caribbean region from the Hadley Centre HadRM3Pmodel (Jones et al., 2004), which is the RCM withinthe Providing Regional Climates for Impacts Studies(PRECIS) model. For this study, the RCM is driven withboundary conditions from the HadAM3P GCM. Very fewdownscaling studies for the Caribbean are to be foundin peer review literature (e.g. the sensitivity studies ofCastro et al., 2006, using the International Centre forTheoretical Physics (ICTP) RegCM3 for the simulationof summer precipitation, temperature and local windfield). The authors are unaware of any studies detailingclimate change scenarios for the Caribbean from RCMs.This study not only complements previous modellingwork for the Caribbean, but, importantly, also documents
for the first time RCM-derived future climates for theregion.
The PRECIS regional model has been widely usedto develop regional climate change scenarios worldwideand to study extremes (Moberg and Jones, 2004; Tadrosset al., 2005; Kumar et al., 2006; Zhang et al., 2006;Bloom et al., 2008; Kotroni et al., 2008; Islam et al.,2009; Marengo et al., 2009). Its choice for use in theCaribbean results from a deliberate collaborative effort todevelop regional scenarios, which was initiated in 2003.The collaboration included institutions in four Caribbeancountries (Belize, Jamaica, Cuba and Barbados) and wasdriven by the Caribbean Community Climate ChangeCentre. Details of the PRECIS-Caribbean project aregiven in Taylor et al. (2007). The overall aim is to usemultiple RCMs and driving models to generate climatescenarios for the region, as is done in other parts ofthe world. The use of PRECIS represents an attemptnot only to generate initial downscaled projections ofclimate change for the region, but also to build modellingcapacity. The effort also allows for an evaluation of thePRECIS model’s ability to simulate the climate of theCaribbean region. This is also reported in this study.
The remainder of the paper is sectioned as follows.Section 2 describes the PRECIS RCM and the subset ofmodel experiments performed. The section also detailsthe datasets used for the validation of the model. Section3 presents an evaluation of the model skill in simulat-ing present-day Caribbean climate using selected fields.Section 4 examines the model projections and Section 5presents the summary and discussion of the results.
2. Data and methodology
2.1. Model description
The study uses version 1.3 of the Hadley Centre’sregional climate modelling system – PRECIS. The PRE-CIS RCM is a dynamical downscaling atmospheric and
Copyright 2010 Royal Meteorological Society Int. J. Climatol. (2010)

FUTURE CLIMATE OF THE CARIBBEAN FROM A REGIONAL MODEL
land surface model, which generates regional-scale cli-mate scenarios at a minimum and maximum horizontalresolution of 25 and 50 km, respectively. The model,which is locatable over any part of the globe and is com-putationally inexpensive, can be used to diagnose a fullrange of meteorological variables at up to 19 levels of theatmosphere and surface variables on varying timescales.A description of the model’s physics is found in Joneset al. (2003, 2004).
In this study, lateral boundary conditions for thePRECIS RCM are from the global atmospheric GCM,HadAM3P, which has a horizontal resolution of 1.25°
latitude × 1.875° longitude. The model formulation ofthe HadAM3P is the same as for the PRECIS RCM,thereby promoting consistency between high resolutionand global model climate change projections. The PRE-CIS results reported in this paper derive from (1) a modelsimulated baseline spanning 1961–1990, which is con-sidered representative of pre-industrialised climate, (2) afull range of different but equally plausible future climatescenarios for the 2071–2100 as gleaned from one realiza-tion consistent with each of the Special Report on Emis-sions (SRES) A2 and B2 emission scenarios, and (3) anactualised climate generated from the model driven bya reanalysis of the European Centre for Medium-RangeWeather Forecast (ECMWF) dataset (ERA-15 hereafter)from 1979 to 1993.
The SRES scenarios are plausible representations offuture emissions of greenhouse gases based on a coherentand internally consistent set of assumptions about driv-ing forces such as demographics, socio–economic devel-opment and technological changes (Nakicenovic et al.,2000). The reanalysis simulation is used in the valida-tion of the model. For all the simulations, the sea-surfaceboundary conditions are derived from recent past obser-vations and from future SSTs formed from the additionof mean changes and trends calculated from the globalcoupled ocean–atmosphere GCM HadCM3 (Jones et al.,2004; Rowell, 2005).
2.2. Domain, data and methodology
Because of the region’s location, large-scale influences,which modulate the underlying climatology, come fromboth the tropical Atlantic and Pacific oceans. Theseinclude the north Atlantic subtropical High, the northeasttrade wind regime, sea-surface temperatures and theirgradients over the tropical Pacific and Atlantic, theCaribbean low-level jet, vertical shear and divergencewithin the basin, and the effects of transient tropicaland extra-tropical systems (detailed reviews of Caribbeanclimate dynamics are found in the study of Jury, 2009;Gamble and Curtis 2008; Ashby et al., 2005). Themodel’s domain was chosen such that it represents anarea large enough to allow the development of regional-scale circulations due to the above influences but not largeenough to facilitate the RCM deviating from the GCMin the centre of the domain (Kumar et al., 2006). ThePRECIS experiments were run at the 50 km resolution
over 0° –36°N and 55° –120 °W (Figure 1). The domainincludes the Caribbean, Central America, Florida and thenorthern territories of South America.
In assessing the model’s ability to simulate regionalseasonal variability, the baseline and ERA-15 drivenmodel results are first compared with precipitation mapsfor the Caribbean extracted from the Climate PredictionCenter (CPC) Merged Analysis of Precipitation (CMAP)datasets (Xie and Arkin, 1997) and surface tempera-ture maps obtained from the National Centers for Envi-ronmental Prediction–National Centers for AtmosphericResearch (NCEP-NCAR) reanalysis-1 dataset (Kalnayet al., 1996). The CMAP dataset is based on gaugeobservations, satellite estimates and model output con-structed on a 2.5° longitude–latitude grid from 1979 tothe present. The horizontal resolution for the reanaly-sis dataset is 2.5° × 2.5°. Because the Caribbean basin islargely ocean, the climatologies of individual islands areto a large extent determined by their location in the back-ground spatial patterns. Consequently, these initial com-parisons evaluate the model’s ability to capture seasonalvariability in the large-scale patterns over the Caribbeanbasin (a must for any model used over the region), eventhough it is recognized that the resolutions of the vali-dating datasets are too coarse to enable comparison ofthe finer details produced by the PRECIS model (Castroet al., 2006).
Validation at the scale of the model is howeverimportant as further sub-regional climatological varia-tions across the islands are induced by (among otherthings) the impact of orography and the orientation of theislands (see Hastenrath, 1976; Chen et al., 1997; Gian-nini et al., 2000; Chen and Taylor, 2002; Taylor et al.,2002 for more on Caribbean climatology). Ideally vali-dation at the RCM scale is done by comparison to stationobservations, but Caribbean station data are notoriouslysparse. Consequently, evaluation of the model biases forseasonal precipitation and temperature fields were doneusing difference maps between a 0.5° × 0.5° observa-tional dataset from the Climatic Research Unit (CRU)(New et al., 2001) and both the ERA-15 and baselinesimulations.
Simulated and observed monthly, seasonal and annualtime series were also computed for present-day andfuture periods by averaging over the whole domain (tem-perature) or over 10° –20°N and 65° –83 °W (rainfall).The latter domain coincides with the Caribbean rain-fall index of Taylor et al. (2002) (Figure 1). The seasonsused were February–April (FMA), May–July (MJJ),August–October (ASO) and November–January (NDJ)to be consistent with the seasonality of the region asidentified by Chen and Taylor (2002).
In determining climate change scenarios for the region,the absolute change in temperature and percentage changein precipitation for the period 2071–2100 relative to thesimulated baseline under the A2 and B2 SRES scenarioswere also computed. The changes are depicted using plotsof monthly, seasonal and annual change values for the
Copyright 2010 Royal Meteorological Society Int. J. Climatol. (2010)

J. D. CAMPBELL et al.
Table I. List of extreme indices and their associated meanings.
Variable name Definition
Consecutive dry days (CDD) Maximum number of consecutive days with RR <1 mmNumber of heavy precipitation days (R10) Annual count of days when PRCP > = 10 mmMaximum 5-day precipitation amount (Rx5 day) Monthly maximum consecutive 5-day precipitationVery wet days (R95p) Annual total PRCP when RR >95th percentileCool nights (TN10p) Percentage of days when TN <10thpercentileCool days (TX10p) Percentage of days when TX <10th percentileWarm nights (TN90p) Percentage of days when TN >90th percentileWarm days (TX90p) Percentage of days when TX >90th percentile
Table II. Metadata for eight Caribbean stations.
Station Country Metadata Data
Length (years) Missing (%)
Le Raizet Guadeloupe 16.27N 61.60W 25 38.7Freeport Bahamas 26.55N 78.70W 23 25.7Worthy Park Jamaica 18.50N 77.92W 40 30.4Catie Costa Rica 9.90N 63.75W 43 15.7Casa Blanca Cuba 23.17N 82.35W 43 0Santa Rosa de Copan Honduras 14.78N 88.78W 43 3.5Picaro Iap Trinidad & Tobago 10.37N 61.21W 43 7.2Hewanorra St. Lucia 13.75N 60.95W 35 7.1
Caribbean rainfall and temperature indices defined aboveand using seasonal and annual spatial maps.
Finally, an attempt was made to assess the model’sability to (1) simulate current trends in climate extremesand (2) project changes in the extremes. The validationwas hampered by the sparse station data distribution inthe region and in the end eight indices representativeof short term climate events were calculated for eightstations, which had daily time series of reasonable lengths(20 or more years). The indices are listed in Table I andthe stations are given in Table II. Future changes in theindices for the same stations were also calculated forthe A2 and B2 scenarios. Because of the limited sample,caution is taken in interpreting the results.
3. Model validation
3.1. Precipitation
The PRECIS model demonstrates reasonable skill inreproducing the global-scale climatological patterns ofprecipitation across the Caribbean basin. The main fea-ture of precipitation over the Caribbean is a well-definedannual cycle, which exhibits maximum precipitation fromMay through November and a dry period peaking inFebruary–March. The wet season is also bimodal (Chenet al., 1997) with peaks in May–June (early season) andAugust–October (late season). The latter peak coincideswith peak hurricane activity.
Figure 2 shows the seasonal rainfall patterns fromCMAP (row 1), PRECIS model simulated baseline (row2) and for CRU minus model simulated baseline (row3). All maps are for the period 1979–1990, which is the
common period of overlap for all the three datasets. Theprecipitation analyses are also restricted to a 5° –28°Nand 57° –90 °W domain because of our primary interestin the Caribbean. The large-scale seasonal variability inthe Caribbean basin is well simulated by the model. Thereis a clear shift towards greater rainfall amounts with theonset of the rainfall season in MJJ (row 2) and the basinis driest in FMA.
The spatial patterns of each season are also equallywell simulated. The zonal band of dryness which spansthe Caribbean basin and the Caribbean coastline ofCentral America in FMA (between 10°N and 25°N) isevident in the model. In the wet seasons (MJJ andASO), the precipitation centre off the Caribbean coastlineof Panama associated with the Caribbean low-level jet(Whyte et al., 2008) is captured, as well as heavy rainfallin the equatorial Pacific (lower left corner of the domain).The dry belt over the southern Caribbean NetherlandAntilles islands is also simulated for all seasons exceptNDJ, which is in keeping with the climatology of thoseislands (Martis et al., 2002). The model however extendsthe area of wetness associated with the southwesternCaribbean basin in NDJ further eastward, and places alarger rainfall maximum than seen in the CMAP datasetjust east of Trinidad and Tobago. The benefit of thegreater resolution in differentiating finer scale features,particularly over Caribbean landmasses, is also to benoted.
The difference maps depicting CRU observationsminus model baseline (row 3) suggest that over most of
Copyright 2010 Royal Meteorological Society Int. J. Climatol. (2010)

FUTURE CLIMATE OF THE CARIBBEAN FROM A REGIONAL MODEL
Figure 2. Diagram showing the spatial distribution of seasonal NDJ, FMA, MJJ and ASO precipitations, respectively, for CMAP (top row),PRECIS model simulated baseline (middle row) and CRU minus PRECIS model simulated baseline (bottom). All averages are for the period
1979–1990. Units are in cm. This figure is available in colour online at www.interscience.wiley.com/ijoc
the domain shown, regardless of season, the model under-estimates precipitation. The only place where the modeloverestimates precipitation is over portions of northernSouth America, i.e. over northern Columbia for all sea-sons and over north western Venezuela in NDJ and ASO.The patterns over northern South America are similar tothose shown by Alves and Marengo (2009) in winter andsummer validation maps for the continent using the PRE-CIS model. The model also produces more rainfall thanobserved over Panama and the Pacific coast of Guatemalain NDJ.
Over the Caribbean region, the model’s dry bias isevident in all seasons over all island masses. PRECISis consistent in simulating 1–2 mm/day less rainfallover Cuba, Hispaniola, Jamaica and Puerto Rico for allseasons. Alves and Marengo (2009) note that rainfallunderestimations in PRECIS are likely related to poorrepresentation of some components of the hydrologicalcycle (soil moisture, surface fluxes and vegetation types)or the convective parameterization. It is also noted thatthe maps in row 3 were essentially the same whether thedifferences were with respect to the simulated baselineor the model simulations using ERA reanalysis. For thisreason the latter differences are not shown.
Finally, quantitative estimates of the model’s precip-itation biases and a more detailed analysis of its mean
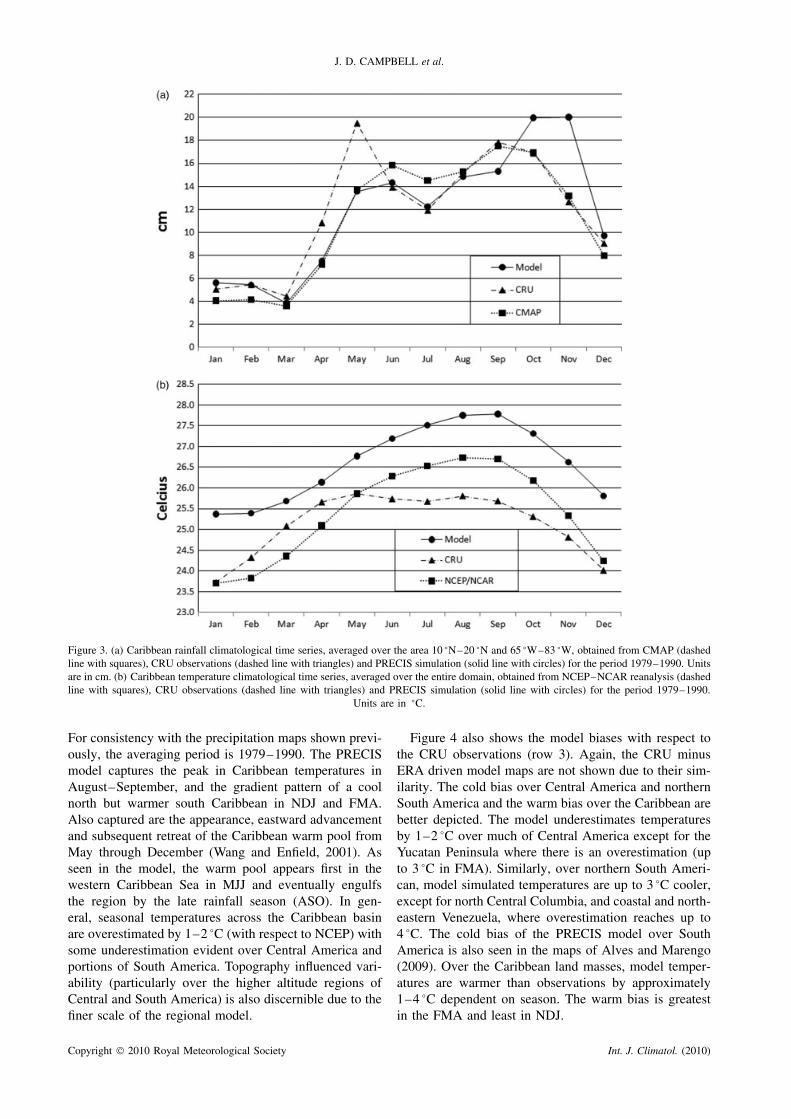
annual cycle are obtained from Figure 3. Figure 3(a)shows the simulated, observed (CRU) and CMAP reanal-ysis rainfall climatologies averaged over the Caribbeanindex region defined earlier (Figure 1). In the case ofCRU only the land points in the domain are averaged.Key characteristics of the rainfall climatology, whichare reproduced by the RCM include (1) lowest rainfallamounts at the start of the year; (2) distinct early (MJJ)and late wet seasons (ASO) and (3) a mid-summer rain-fall minimum in July (Chen et al., 1997; Chen and Taylor,2002). However, also evident is an overestimation of rain-fall amounts in the late rainfall season months of Octoberand November. The overestimation, though seeminglyincongruous with the dry bias for the Caribbean notedearlier, is as a result of the rainfall maximum simu-lated over the waters south of Jamaica in NDJ (Figure 2),which falls within the Caribbean index domain. If onlyland points are averaged for the RCM, then the simulatedlate season values become comparable with the observed.
3.2. Temperature
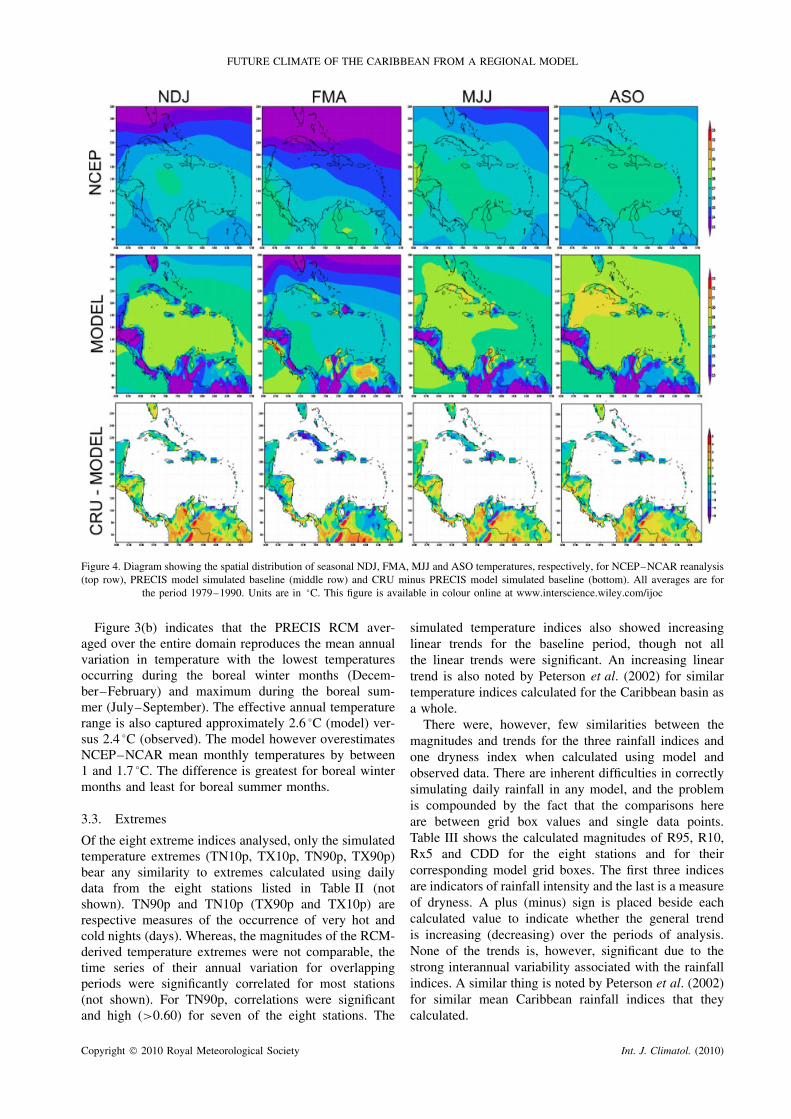
The seasonal variability and general patterns associatedwith temperature are also well captured by the model.Figure 4 shows seasonal temperature patterns from NCEP(row 1) and PRECIS model simulated baseline (row 2).
Copyright 2010 Royal Meteorological Society Int. J. Climatol. (2010)
J. D. CAMPBELL et al.
Figure 3. (a) Caribbean rainfall climatological time series, averaged over the area 10 °N–20 °N and 65 °W–83 °W, obtained from CMAP (dashedline with squares), CRU observations (dashed line with triangles) and PRECIS simulation (solid line with circles) for the period 1979–1990. Unitsare in cm. (b) Caribbean temperature climatological time series, averaged over the entire domain, obtained from NCEP–NCAR reanalysis (dashedline with squares), CRU observations (dashed line with triangles) and PRECIS simulation (solid line with circles) for the period 1979–1990.
Units are in °C.
For consistency with the precipitation maps shown previ-ously, the averaging period is 1979–1990. The PRECISmodel captures the peak in Caribbean temperatures inAugust–September, and the gradient pattern of a coolnorth but warmer south Caribbean in NDJ and FMA.Also captured are the appearance, eastward advancementand subsequent retreat of the Caribbean warm pool fromMay through December (Wang and Enfield, 2001). Asseen in the model, the warm pool appears first in thewestern Caribbean Sea in MJJ and eventually engulfsthe region by the late rainfall season (ASO). In gen-eral, seasonal temperatures across the Caribbean basinare overestimated by 1–2 °C (with respect to NCEP) withsome underestimation evident over Central America andportions of South America. Topography influenced vari-ability (particularly over the higher altitude regions ofCentral and South America) is also discernible due to thefiner scale of the regional model.
Figure 4 also shows the model biases with respect tothe CRU observations (row 3). Again, the CRU minusERA driven model maps are not shown due to their sim-ilarity. The cold bias over Central America and northernSouth America and the warm bias over the Caribbean arebetter depicted. The model underestimates temperaturesby 1–2 °C over much of Central America except for theYucatan Peninsula where there is an overestimation (upto 3 °C in FMA). Similarly, over northern South Ameri-can, model simulated temperatures are up to 3 °C cooler,except for north Central Columbia, and coastal and north-eastern Venezuela, where overestimation reaches up to4 °C. The cold bias of the PRECIS model over SouthAmerica is also seen in the maps of Alves and Marengo(2009). Over the Caribbean land masses, model temper-atures are warmer than observations by approximately1–4 °C dependent on season. The warm bias is greatestin the FMA and least in NDJ.
Copyright 2010 Royal Meteorological Society Int. J. Climatol. (2010)
FUTURE CLIMATE OF THE CARIBBEAN FROM A REGIONAL MODEL
Figure 4. Diagram showing the spatial distribution of seasonal NDJ, FMA, MJJ and ASO temperatures, respectively, for NCEP–NCAR reanalysis(top row), PRECIS model simulated baseline (middle row) and CRU minus PRECIS model simulated baseline (bottom). All averages are for
the period 1979–1990. Units are in °C. This figure is available in colour online at www.interscience.wiley.com/ijoc
Figure 3(b) indicates that the PRECIS RCM aver-aged over the entire domain reproduces the mean annualvariation in temperature with the lowest temperaturesoccurring during the boreal winter months (Decem-ber–February) and maximum during the boreal sum-mer (July–September). The effective annual temperaturerange is also captured approximately 2.6 °C (model) ver-sus 2.4 °C (observed). The model however overestimatesNCEP–NCAR mean monthly temperatures by between1 and 1.7 °C. The difference is greatest for boreal wintermonths and least for boreal summer months.
3.3. Extremes
Of the eight extreme indices analysed, only the simulatedtemperature extremes (TN10p, TX10p, TN90p, TX90p)bear any similarity to extremes calculated using dailydata from the eight stations listed in Table II (notshown). TN90p and TN10p (TX90p and TX10p) arerespective measures of the occurrence of very hot andcold nights (days). Whereas, the magnitudes of the RCM-derived temperature extremes were not comparable, thetime series of their annual variation for overlappingperiods were significantly correlated for most stations(not shown). For TN90p, correlations were significantand high (>0.60) for seven of the eight stations. The
simulated temperature indices also showed increasinglinear trends for the baseline period, though not allthe linear trends were significant. An increasing lineartrend is also noted by Peterson et al. (2002) for similartemperature indices calculated for the Caribbean basin asa whole.
There were, however, few similarities between themagnitudes and trends for the three rainfall indices andone dryness index when calculated using model andobserved data. There are inherent difficulties in correctlysimulating daily rainfall in any model, and the problemis compounded by the fact that the comparisons hereare between grid box values and single data points.Table III shows the calculated magnitudes of R95, R10,Rx5 and CDD for the eight stations and for theircorresponding model grid boxes. The first three indicesare indicators of rainfall intensity and the last is a measureof dryness. A plus (minus) sign is placed beside eachcalculated value to indicate whether the general trendis increasing (decreasing) over the periods of analysis.None of the trends is, however, significant due to thestrong interannual variability associated with the rainfallindices. A similar thing is noted by Peterson et al. (2002)for similar mean Caribbean rainfall indices that theycalculated.
Copyright 2010 Royal Meteorological Society Int. J. Climatol. (2010)

J. D. CAMPBELL et al.
Tabl
eII
I.Ta
ble
show
ing
calc
ulat
edm
agni
tude
sof
rain
fall
extr
eme
indi
ces:
R95
,R
10,
Rx5
and
CD
Dfo
rei
ght
Car
ibbe
anst
atio
nsan
dfo
rth
eir
corr
espo
ndin
ggr
idbo
xes
from
ER
A15
and
base
line
sim
ulat
ions
resp
ectiv
ely.
The
plus
‘+’
and
min
us‘−
’si
gns
repr
esen
ta
posi
tive
orne
gativ
elin
ear
tren
d,re
spec
tivel
y,ov
erth
epe
riod
ofob
serv
atio
nor
sim
ulat
ion.
Stat
ions
Obs
erve
d(1
970
–19
89)
ER
A15
(197
9–
1992
)B
asel
ine
(197
0–
1989
)
CD
DT
rend
Rx5
Tre
ndR
95T
rend
R10
Tre
ndC
DD
Tre
ndx5
Tre
ndR
95T
rend
R10
Tre
ndC
DD
Tre
ndR
x5T
rend
R95
Tre
ndR
10T
rend
Bah
amas
23.3
0−
168.
14−
355.
54+
40.6
5+
21.4
3+
146.
54−
277.
24−
41.2
9−
18.6
0+
142.
55−
295.
23−
53.5
0−
Cos
taR
ica
14.6
8−
250.
60+
727.
39+
77.1
1+
11.4
3+
86.2
1−
245.
79+
37.0
0+
25.5
0+
52.0
5−
139.
77−
8.10
−C
uba
30.6
0C
172.
76+
318.
83+
33.8
5+
40.5
0+
74.6
8−
141.
55−
10.0
0−
31.6
0+
77.0
4−
151.
33−
12.4
5−
Gua
delo
upe
NaN
NaN
NaN
NaN
14.5
0−
81.2
1−
212.
19−
21.5
0−
11.2
5+
82.9
2−
211.
30−
37.0
0−
Hon
dura
s29
.60
+15
9.05
+38
7.23
+47
.05
+23
.07
+84
.63
−20
8.59
−24
.93
−18
.80
+76
.00
−21
1.80
−24
.50
+Ja
mai
caN
aNN
aNN
aNN
aN46
.36
−67
.68
+94
.31
+3.
43−
32.0
0+
72.7
0−
117.
92−
4.80
−St
.L
ucia
21.5
0+
199.
34−
495.
36+
59.9
3+
16.5
0+
55.1
0−
202.
50−
38.5
0−
13.0
5+
49.2
6−
199.
95−
43.5
5−
Tri
nida
dan
dTo
bago
16.7
3+
149.
57+
458.
62+
36.7
3+
28.7
1+
73.7
4−
115.
75−
8.07
+17
.65
+66
.59
+12
6.35
+12
.05
+
The signs of the modelled rainfall extremes suggest atendency towards decreasing heavy rainfall and increas-ing dry days over the baseline period. It is the oppositetendencies, which are however reported by Peterson et al.(2002) and which are seemingly suggested by the sta-tion data. The model does not seemingly capture therainfall extreme trends. We reiterate, however, that caremust be taken when interpreting the results as only eightstations are analysed and the trends are not significant. Amore detailed analysis of the model’s ability to simulateextremes will be the subject of a future paper.
4. Projections
Annual and seasonal projections under the A2 (mediumhigh) and B2 (medium low) SRES emission scenariosfor the period 2071–2100 relative to the model baseline(1961–1990) are examined. The A2 SRES scenariorepresents a very heterogeneous world with continuouslyincreasing global population and regionally orientedeconomic growth that is more fragmented and slowerin comparison to other scenarios. The B2 scenariorepresents an emphasis on local solutions to economic,social and environmental sustainability with continuouslyincreasing population (lower than A2) and intermediateeconomic development (Nakicenovic, 2000). Assumingstationarity in model biases, changes seen are primarilydue to climate change.
Annual (panel a) and seasonal spatial patterns (panelsb through e) of change are presented in Figures 5 and6 for rainfall and temperature, respectively, for the A2scenario. In general the change patterns are similar forthe B2 scenario but with smaller magnitudes (not shown).Changes in the monthly, seasonal and annual values ofthe Caribbean index are also presented in panel F. As anindication of the robustness of the change, the standarddeviation is also plotted in panel F for both rainfall andtemperature. The standard deviation is calculated usingthe CMAP and NCEP datasets for the 1979–1990 periodand is plotted as a measure of typical change due tonatural variability.
4.1. Rainfall
4.1.1. Annual
With the exception of the far northern latitudes (i.e.southern Florida, the Bahamas and northern Cuba),projections show a decrease in annual rainfall underboth A2 (Figure 5(a)) and B2 scenarios (not shown)for much of the Caribbean. The decrease ranges from25–50% and is largest over the Lesser Antilles and theCentral Caribbean basin, under the A2 scenario, includingJamaica and Puerto Rico (i.e. ∼10–20°N). The pattern ofdrying is similar under the B2 scenario, but the largestchange (∼50%) is now located in the Netherland Antilles.Under both scenarios, the northern edge of the Caribbeanis becoming wetter: ∼25% for A2 and between 0–25%for the B2 projections.
Copyright 2010 Royal Meteorological Society Int. J. Climatol. (2010)

FUTURE CLIMATE OF THE CARIBBEAN FROM A REGIONAL MODEL
Figure 5. Rainfall projections for the period 2071–2100 relative to theperiod 1961–1990 baseline under the A2 scenario. Percentage changeis presented. Panels (a), (b), (c), (d) and (e) represent annual, NDJ,FMA, MJJ and ASO, respectively. Panel (f) shows monthly, seasonaland annual changes calculated by averaging over the domain shown in(a)–(e). The solid line represents one standard deviation as calculatedfrom the CMAP dataset. This figure is available in colour online at
www.interscience.wiley.com/ijoc
This spatial pattern of the changes is consistent withthat obtained by Christensen et al. (2007) using 21 globalmodels under the A1B SRES scenario. Of the 21 models,15 models projected decreased annual rainfall over theCaribbean, excepting parts of the far north basin, from2080–2099 relative to 1980–1999. Approximately tenmodels projected an increase over southern Florida. Theresults are also consistent with the annual precipitationdecline projected by Nurse and Sem (2001). The annualrainfall total derived from the Caribbean index also showsa decrease of approximately 20% for the A2 Scenario
Figure 6. Temperature projections for the period 2071–2100 relative tothe period 1961–1990 baseline under the A2 scenario. Absolute changeis presented. Panels (a), (b), (c), (d) and (e) represent annual, NDJ,FMA, MJJ and ASO, respectively. Panel (f) shows monthly, seasonaland annual changes calculated by averaging over the domain shown in(a)–(e). The solid line represents one standard deviation as calculatedfrom the NCEP–NCAR reanalysis dataset. This figure is available in
colour online at www.interscience.wiley.com/ijoc
[Figure 5(f)] and approximately 10% for the B2 Scenario(not shown). Though this lies within the range of GCM-based projected change for the region (−6.8 ± 15.8%)(Nurse and Sem, 2001), it is also comparable to thechange seen in annual rainfall amounts in the recenthistorical record as indicated by the standard deviation(Figure 5(f)).
4.1.2. Seasonal
Projections of seasonal rainfall changes for the Caribbeanfor the period 2071–2100 under the A2 scenario areshown in Figure 5(b–e). The gradient pattern of a wetter
Copyright 2010 Royal Meteorological Society Int. J. Climatol. (2010)
J. D. CAMPBELL et al.
north–drier south Caribbean is a strong feature during thedry seasons NDJ and FMA. The projections indicate up toa 75% increase over the northern Caribbean (above 25°N)under the A2 scenario, even as the central Caribbeanexhibits a strong decrease (∼50%) in rainfall. The wetternorth–drier south pattern is absent in MJJ when uniformdrying (∼50%) across the plotted domain is the trend,but begins to re-emerge in the late wet season (ASO). InASO, the expanse of wetness is, however, greatly reducedin comparison to NDJ and FMA. The significance of theprojected wetter north–drier south pattern during the dryseason is discussed in the following section.
A drier Caribbean during MJJ and ASO(Figure 5(d–e)) is also noteworthy. Angeles et al. (2006)similarly show decreased summer rainfall over Cuba bymid-century using a fully coupled GCM. Christensenet al. (2007) show a robust drier Caribbean by the 2090sfor a June–August season. A mechanism for the pro-jected summer drying has been proposed by Neelin et al.(2003). We also discuss the summer drying further in thefollowing section.
Simulated changes in the seasonal and monthly indices[Figure 5(f)] indicate that the general tendency is fordrying over the Caribbean and adjacent regions in threeof the four defined seasons by the 2071–2100 period.The change exceeds that due to natural variability forboth MJJ (∼28 vs 15%) and ASO (∼35 vs 17%). Themonthly indices further suggest that the tendency towardsdrying is robust for the entire period June–October whenall the monthly changes projected are clearly outside therange of natural variability.
4.2. Temperature
4.2.1. Annual
Temperatures are projected to increase over the Caribbean(including Central and South America) under both theA2 [Figure 6(a)] and B2 scenarios (not shown). Projec-tions are for 2–5 °C (2–4 °C) rise over the Caribbeanregion under the A2 (B2) scenario. The larger Caribbeanislands, i.e. Cuba, Jamaica and Hispaniola, exhibit thegreatest warming. The annual temperature change scenar-ios are comparable with IPCC projections of 1.5–4.5 °Cincrease in average global temperature (above pre-industrial levels) under the A1B by the end of thecentury (Solomon et al. 2007). The results also agreewith increased temperatures projected using the Statisti-cal DownScaling Model (Wilby et al., 2002) for stationsin Trinidad (2.2 °C/1.6 °C), Barbados (2.3 °C/0.7 °C) andJamaica (2.0–3.0 °C/1.5–2.3 °C) for the A2/B2 scenario(Chen et al., 2006).
The annual index shown in Figure 6(f) suggests anincrease of approximately 2.9 °C over the domain. Thechange is well outside the range of natural variability asindicated by the one standard deviation value.
4.2.2. Seasonal
The seasonal temperature projections [Figure 6(b–e)]show increased temperatures across the Caribbean region
including Central America and northern South America.The warming is strongest over land, particularly overCuba, Jamaica, Hispaniola, Central America and northernSouth America, where the increase is approximately2–5 °C (2–4 °C) under the A2 (B2) scenario acrossall seasons. The seasonal indices [Figure 6(f)] showthat FMA and NDJ exhibit the strongest temperatureresponse, i.e. approximately 3.1 and 2.9 °C, respectively,though across seasons the projections are within 0.5 °Cof each other. As for the annual index, the temperaturechange in all months and in all seasons (irrespective ofscenario) far exceeds that due to natural variability.
4.2.3. Extremes
Figure 7(a) shows the map of the Caribbean on whichbar plots of R95 (very wet days) and Rx5 (maximum5-day precipitation) for seven of the eight stations aresuperimposed. The plots show the magnitude of the indexaveraged over the baseline and future periods. Figure 7(b)is identical but for R10 (number of heavy precipitationdays) and CDD (consecutive dry days). The generalpattern is such that the far northern Caribbean stations(Bahamas and Cuba) and the Honduras station showincreases in rainfall intensity in the future. This is true forR95 and Rx5 for all three stations, and for R10 (exceptfor Cuba, which shows marginal decline). The northernCaribbean stations also show a decline in consecutivedry days by the 2071–2100 period [Figure 7(b)]. Theopposite pattern is true for the remaining Caribbeanstations. All show a decrease in the rainfall intensityindices and an increase in the dryness index. The patternsindicated by the seven stations are consistent with themean projections for the basin (Section 4.1). It seems thatthe wetter north–drier south pattern of the 2071–2100period is characterized by more (less) intense rainfall andless (more) dry days in the northern (southern) Caribbeanbasin. We consider, what this may mean in the followingsection.
5. Summary and discussion
The aim of this paper was twofold: to evaluate the per-formance of the PRECIS model in simulating observedclimate variability over the Caribbean and to use it toproduce climate change scenarios for the region for the2071–2100 period. The PRECIS RCM shows reasonableskill in simulating ‘present-day’ rainfall and temperaturevariability over the Caribbean and adjacent regions. Thesimulated temperature climatology reproduces the sum-mer maximum–winter minimum temperatures but witha bias ranging from +1 to +1.7 °C. The seasonal spatialpatterns of temperature are also well simulated includingthe north–south temperature gradient in boreal wintermonths and the eastward expansion of the Caribbeanwarm pool from spring onwards.
Similarly, the simulated rainfall climatology of thecentral Caribbean basin (as represented by area aver-aged rainfall over the Caribbean index domain shown
Copyright 2010 Royal Meteorological Society Int. J. Climatol. (2010)

FUTURE CLIMATE OF THE CARIBBEAN FROM A REGIONAL MODEL
Figure 7. Observed and simulated (baseline and A2) magnitudes for extreme rainfall events indices: (a) maximum 5-day precipitation, Rx5, andvery wet days, R95, (solid bar), (b) number of days precipitation was greater than or equal to 10 mm, R10 (striped bar) and the number of days
precipitation was below 1 mm, CDD (solid bar), for seven Caribbean territories.
in Figure 1) captures the bimodal characteristics ofCaribbean rainfall though overestimating the late sea-son peak rainfall and displacing the rainfall maximumto November. Both the overestimation and the displacedpeak are seemingly due to the model’s eastward exten-sion of a rainfall maximum found in the far southwestcorner of the basin (off the coast of Panama) at thistime, such that it now falls within the Caribbean indexdomain. This is seen in the seasonal maps of simulatedrainfall (Figure 3). If, however, only land points are aver-aged, the overestimation disappears and the peak nowoccurs in October (not shown). Otherwise, the expected
seasonal spatial patterns of rainfall for the Caribbeandomain are well captured, not withstanding a dry biasover the Caribbean island masses.
The placement of the NDJ rainfall maximum southof Jamaica in NDJ is interesting and suggests that themodel may be over or underestimating the strength ofthe Caribbean low-level jet (CLLJ). The CLLJ is simi-larly located and influences rainfall totals in its Caribbeanentrance and exit regions and along the Caribbean coastof Central America, as well as moisture flux to the south-eastern United States (Wang, 2007; Munoz et al., 2008;Whyte et al., 2008). Calculations of the magnitude of the
Copyright 2010 Royal Meteorological Society Int. J. Climatol. (2010)

J. D. CAMPBELL et al.
CLLJ index defined by Whyte et al. (2008) (not shown)reveal a slight overestimation of the winter strength bythe PRECIS model, which could in part explain the NDJpattern. It may also suggest a particular sensitivity ofPRECIS simulated rainfall in the Caribbean to modelledtrade wind speeds, which should be borne in mind wheninterpreting the future climates simulated by the model.
The annual and seasonal projections under the A2and B2 scenarios reveal three other key features worthhighlighting. Firstly, for 2071–2100, the annual rain-fall is projected to increase north of 22 °N and decrease(∼25–50%) south of this demarcation. The pattern iseven more pronounced during the dry seasons NDJ andFMA. This gradient pattern, already the dominant modeof NDJ and FMA rainfall variability (Giannini et al.,2000; Spence et al., 2004; Stephenson et al., 2007), islinked to the Hadley overturning of the north tropicalAtlantic. It is also the pattern manifested during theCaribbean dry season for warm phases of El Nino South-ern Oscillation (ENSO) events (Stephenson et al., 2007).The implication is that under a climate changed worldmarked by global warming, there may be a favouringof or possible strengthening of ‘present-day’ circulationpatterns over the region – at least for the boreal wintermonths.
Secondly, by the 2071–2100 period, there is a pro-jected drying (up to 35% under the A2 scenario) dur-ing MJJ and ASO, which is a basin-wide feature. Themonthly indices indicate that the drying tendency isrobust for June–October and in excess of the range ofvariability currently observed. This observation is in linewith the consensus from previous GCM work that thedrying signal during the summer months is a significantfeature over the Caribbean and is very likely (followingIPCC notation) to manifest in the future. This has strongimplications for the use of water resources, especiallywhen coupled with the previous idea of a probable drierdry season.
Given the previous observations about the likely linkbetween trade wind speeds and rainfall in the Caribbeandomain in the PRECIS model, it is noteworthy thatthe simulated CLLJ index shows an increase in thephenomenon’s strength between June and August by theend of the century (not shown). Strengthening of thesummer manifestation of the CLLJ is associated with adrier Caribbean basin (Whyte et al., 2008) partially dueto the increased vertical wind shear. Angeles et al. (2006)also noted moderate increases in wind shear during theCaribbean wet season by the end of the century. Againthis is something worthy of further investigation (as iscurrently being done), especially as trade wind strengthand the CLLJ are key components of a wider dynamicalregime that is known to control the Caribbean wet season(Gamble and Curtis, 2008), which might seemingly bestrengthened in the future.
Finally, it is noteworthy that Caribbean tempera-tures are projected to increase (1–4 °C) following globaltrends. The increased temperatures are projected for alllocations in the domain and are irrespective of scenario.
The changes over land are larger than over open water,and the magnitude of the increase exceeds by far due tonatural variability.
It is clear from the analysis that the projected changes,should they materialize, are indicative of altered dynam-ical circulation patterns in both the dry and wet seasons.These would in turn lead to changes in the intensity andfrequency of rainfall events as indicated by the projectedchanges in the extreme indices. The changes in the atmo-spheric dynamics that govern Caribbean climate under amuch warmer world scenario need to be further inves-tigated. It must also be borne in mind that the changesdepicted in this paper, though consistent with GCM pro-jections for the region, derive from simulations from onlyone regional model. Future work must involve the use ofadditional RCMs to engender greater confidence in theprojections.
The analysis, however, does highlight the additionaldetail obtainable from the use of an RCM, e.g. differentialrainfall and heating over land versus ocean points orvariable patterns over land due to orography. Such detailis not available from GCMs. Scope exists, therefore,for using the projections from PRECIS to deliver morerefined climates for climate impact studies, in turnenabling more tailored adaptation options to the threatof climate change within the Caribbean region.
Acknowledgements
This work was conducted as part of a collaborative effortbetween Cuba (Instituto de Meterologia de la Republica),Barbados (the Department of Computer Science, Math-ematics and Physics, the University of the West Indies)and Jamaica (The Climate Studies Group Mona, The Uni-versity of the West Indies). The project was funded by theCaribbean Community Climate Change Centre (Belize).Special thanks to the Hadley Centre (UK) for the PRECISmodel support.
References
Aldrian E, Dumenil-Gate L, Jacob D, Podzun R, Gunawan D. 2004.Long-term simulation of Indonesian rainfall with the MPI regionalmodel. Climate Dynamics 22: 794–814, DOI: 10.1007/s00382-004-0418-9.
Alves LM, Marengo JA. 2009. Assessment of Regional Seasonalpredictability using the PRECIS regional climate modeling systemover South America. Theoretical and Applied Climatology 100:337–350, DOI: 10.1007/s00704-009-0165-2.
Angeles ME, Gonzalez JE, Erickson DJ III, Hernandez JL. 2006.Predictions of future climate change in the Caribbean regionusing global general circulation models. International Journal ofClimatology 27(5): 555–569, DOI: 10.1002/joc.1416.
Ashby SA, Taylor MA, Chen AA. 2005. Statistical models forpredicting rainfall in the Caribbean. Theoretical and AppliedClimatology 82: 65–80, DOI: 10.1007/s00704-004-0118-8.
Bloom A, Kotroni V, Lagouvardos K. 2008. Climate change impactof wind energy availability in the Eastern Mediterranean using theregional climate model PRECIS. Natural Hazards and Earth SystemSciences (NHESS) 8: 1249–1257.
Castro DM, da Rocha RP, Benzanilla-Morlot A, Alvarez-Escudero L,Reyes-Fernandez JP, Silva-Vidal Y, Arritt RW. 2006. Sensitivitystudies of the RegCM3 simulation of summer precipitation,temperature and local wind field in the Caribbean region. Theoretical
Copyright 2010 Royal Meteorological Society Int. J. Climatol. (2010)
FUTURE CLIMATE OF THE CARIBBEAN FROM A REGIONAL MODEL
and Applied Climatology 86: 5–22, DOI: 10. 1007/s00704-005-0201-9.
Chen AA, Rhoden CL, Taylor MA. 2006. Climate change scienceand future climate change scenarios. In Climate Change Impacton Dengue: The Caribbean Experience, Chen AA, Chadee DD, andRawlins S (eds). Climate Studies Group Mona, University of theWest Indies: Mona, Jamaica; 66–77.
Chen AA, Roy A, McTavish J, Taylor MA, Marx L. 1997. UsingSST Anomalies to Predict Flood and Drought Conditions for theCaribbean. COLA Report 49.
Chen AA, Taylor MA. 2002. Investigating the link between earlyseason Caribbean rainfall and the El Nino +1 year. InternationalJournal of Climatology 22: 87–106, DOI: 10.1002/joc.711.
Christensen JH, Hewitson B, Busuioc A, Chen A, Gao X, Held I,Jones R, Kolli RK, Kwon W-T, Laprise R, Magana Rueda V,Mearns L, Menendez CG, Raisanen J, Rinke A, Sarr A, Whetton P.2007. Regional climate projections. In Climate Change 2007: ThePhysical Science Basis. Contribution of Working Group I to theFourth Assessment Report of the Intergovernmental Panel on ClimateChange, Solomon S, Qin D, Manning M, Chen Z, Marquis M,Averyt KB, Tignor M, Miller HL (eds). Cambridge University Press:Cambridge, United Kingdom and New York, NY, USA; 847–940.
Dobler A, Ahrens B. 2008. Precipitation by a regional climate modeland bias correction in Europe and Asia. Meteorologische Zeitschrift17(4): 499–509.
Gamble DW, Curtis S. 2008. Caribbean precipitation: review, modeland prospect. Progress in Physical Geography 32(3): 265–276.
Giannini A, Kushnir Y, Cane MA. 2000. Inter-annual variability ofCaribbean rainfall, ENSO, and the Atlantic Ocean. Journal ofClimate 13: 297–311.
Hastenrath S. 1976. Variations in low-latitude, circulation and extremeclimatic events in the tropical Americas. Journal of AtmosphericSciences 33: 202–215.
Islam S, Rehman N, Sheikh MM. 2009. Future change in the frequencyof warm and cold spells durations over Pakistan simulated by thePRECIS regional climate model. Climate Change 94: 35–45, DOI10.1007/s10584-009-9557-7.
Jones RG, Hassell D, Hudson D, Wilson S, Jenkins G, Mitchell J.2003. Workbook on Generating High Resolution Climate ChangeScenarios Using PRECIS. UNDP: New York.
Jones RG, Noguer M, Hassell D, Hudson D, Wilson S, Jenkins G,Mitchell J. 2004. Generating High Resolution Climate ChangeScenarios Using PRECIS. Met Office Hadley Centre: Exeter, UK.
Jury MR. 2009. A quasi-decadal cycle in Caribbean climate. Journal ofGeophysical Research 114: D13102, DOI:10.1029/2009JD011741.
Kalnay E, Kanamitsu M, Kistler R, Collins W, Deaven D, Gandin L,Iredell M, Saha S, White G, Woollen J, Zhu Y, Leetmaa A,Reynolds R, Chelliah M, Ebisuzaki W, Higgins W, Janowiak J,Mo KC, Ropelewski C, Wang J, Jenne R, Joseph D. 1996. TheNCEP/NCAR 40-year reanalysis project. Bulletin of the AmericanMeteorological Society 77(3): 437–471.
Kotroni V, Lykoudis S, Lagouvardos K, Lalas D. 2008. A fineresolution regional climate change experiment for the EasternMediterranean: Analysis of the present climate simulations. Globaland Planetary Change 64(1–2): 93–104.
Kumar KR, Sahai AK, Kumar KK, Patwardhan SK, Mishra PK,Revadekar JV, Kamala K, Pant GB. 2006. High-resolution climatechange scenarios for India for the 21st century Indian Institute ofTropical Meteorology. Current Science 90(3): 334–345.
Marengo JA, Jones R, Alves LM, Valverde MC. 2009. Future changeof temperature and precipitation extremes in South America asderived from the PRECIS regional climate modeling system.International Journal of Climatology, DOI: 10.1002/joc.1863.
Martis A, van Oldenborgh GJ, Burgers G. 2002. Predicting rainfall inthe Dutch Caribbean – more than El Nino?. International Journal ofClimatology 22: 1219–1234.
Mearns LO, Giorgi F, Whetton P, Pabon D, Hulme M, Lal M. 2003.Guidelines for Use of Climate Scenarios Developed from RegionalClimate Model Experiments. DDC IPCC TGCIA.
Moberg A, Jones PD. 2004. Regional climate models simulations ofdaily maximum and minimum near-surface temperatures acrossEurope compared with observed station data for 1961–1990. ClimateDynamics 23: 695–715.
Munoz E, Busalacchi AJ, Nigam S, Ruiz-Barradas A. 2008. Winterand summer structure of the Caribbean Low-Level Jet. Journal ofClimate 21: 1260–1276.
Nakicenovic N, Swart R (eds).2000. Special Report on EmissionsScenarios. A Special Report of Working Group III of the
Intergovernmental Panel on Climate Change. Cambridge UniversityPress: Cambridge, United Kingdom and New York, NY, USA; 599.
Neelin JD, Chou C, Su H. 2003. Tropical drought regions in globalwarming and El Nino teleconnections. Geophysical Research Letters30(24): 2275, DOI: 10.1029/2003GL018625.
New M, Todd M, Hulme M, Jones P. 2001. Precipitation measure-ments and trends in the twentieth century. International Journal ofClimatology 21: 1899–1922.
Nurse LA, Sem G. 2001. Small island states. In Climate change2001 – the scientific basis. Contribution of Working Group 1to the Third Assessment Report of the Intergovernmental Panelon Climate Change (IPCC). Houghton. JT, Ding Y, Griggs DJ,Noguer M, van der Linden PJ, Xiaosu D (eds). CambridgeUniversity Press:Cambridge; 843–875.
Peterson TC, Taylor MA, Demeritte R, Duncombe DL, Burton S,Thompson F, Porter A, Mercedes M, Villegas E, Fils RS,Klein Tank A, Martis A, Warner R, Joyette A, Mills W, Alexan-der L, Gleason B. 2002. Recent changes in climate extremes in theCaribbean region. Journal of Geophysical Research 107(D21): 4601,DOI: 10.1029/2002JD002251.
Rowell DP. 2005. A scenario of European climate change for the late21st century seasonal means and inter-annual variability. ClimateDynamics 25: 837–849.
Singh B. 1997a. Climate-related global changes in the southernCaribbean: Trinidad and Tobago. Global and Planetary Change 15:93–111.
Singh B. 1997b. Climate changes in the greater and southernCaribbean. International Journal of Climatology 17: 10936–1114.
Solomon S, Qin D, Manning M, Chen Z, Marquis M, Averyt KB,Tignor M, Miller HL. 2007. Summary for Policymakers. CambridgeUniversity Press: Cambridge.
Spence JM, Taylor MA, Chen AA. 2004. The effect of concurrent seasurface temperature anomalies in the tropical Pacific and Atlanticon Caribbean Rainfall. International Journal of Climatology 24:1531–1541, DOI: 10.1002/joc.1068.
Stephenson TS, Chen AA, Taylor MA. 2007. Toward the developmentof prediction models for the primary Caribbean dry season,accepted. Theoretical and Applied Climatology 92: 87–101, DOI:10.1007/s00704-007-0308-2.
Tadross M, Jack C, Hewitson B. 2005. On RCM-based projections ofchange in southern African summer climate. Geophysical ResearchLetters 32: L23713, DOI:10.1029/2005GL024460.
Taylor MA, Centella A, Charlery J, Borrajero I, Bezanilla A, Camp-bell J, Rivero R, Stephenson TS, Whyte F, Watson R. 2007. InGlimpses of the Future: A Briefing from the PRECIS Caribbean Cli-mate Change Project. Caribbean Community Climate Change Cen-tre: Belmopan, Belize.
Taylor MA, Enfield DB, Chen AA. 2002. Influence of the tropicalAtlantic versus the tropical Pacific on Caribbean rainfall. Journal ofGeophysical Research 107(C9): 3127, DOI: 10,1029/2001JC001097.
Wang C. 2007. Variability of the Caribbean low-level jet and itsrelations to climate. Climate Dynamics 29: 411–422.
Wang C, Enfield DB. 2001. The tropical Western Hemisphere warmpool. Geophysical Research Letters 28(8): 1635–1638.
Whyte FS, Taylor MA, Stephenson TS, Campbell JD. 2008. Featuresof the Caribbean low level jet. International Journal of Climatology28: 119–128.
Wilby RL, Dawson CW, Barrow EM. 2002. SDSM – A decisionsupport tool for the assessment of regional climate change impacts.Environmental Modelling and Software 17: 147–159.
Wilby RL, Wigley TML. 1997. Downscaling general circulation modeloutput: A review of methods and limitations. Progress in PhysicalGeography 21(4): 530–548.
Xianfu L. 2006. Guidance on the development of regional climatescenarios for vulnerability and adaptation assessments within theFramework of National Communications from Parties not Includedin Annex I to the United Nations Framework Convention on ClimateChange, National Communications Support Programme, UNDP-UNEP-GEF New York, USA, 1–41.
Xie P, Arkin PA. 1997. Global Precipitation: A 17-year monthlyanalysis based on gauge observations, satellite estimates, andnumerical model outputs. Bulletin of the American MeteorologicalSociety 78(11): 2539–2558.
Zhang Y, Yinlong X, Wenjie D, Lijuan C, Sparrow M. 2006. A futureclimate scenario of regional changes in extreme climate eventsover China using the PRECIS climate model. Geophysical ResearchLetters 33: L24702, DOI:10.1029/2006GL027229.
Copyright 2010 Royal Meteorological Society Int. J. Climatol. (2010)


![[GCCA Caribbean Regional Project]](https://img.pdfslide.us/doc/110x75/6169dc8711a7b741a34c2f1d/gcca-caribbean-regional-project.jpg)