Embed Size (px)
Citation preview

ARISTOTLE UNIVERSITY THESSALONIKI
SCHOOL OF ENGINEERING
DEPT. OF MECHANICAL ENGINEERING
LABORATORY OF APPLIED THERMODYNAMICS
Future automotive efficiency and
exhaust emissions challenges - Emphasis on nanoparticle Real Driving
Emissions
10th International AVL Exhaust Gas and Particulate Emissions
Ludwigsburg, 21 February 2018
Zissis SamarasProfessor
ERTRAC Vice Chairman

Acknowledgments
For the CO2 Scenarios:
Dr. Stephan Neugebauer (BMW, ERTRAC Chairman)
Dr. Jette Krause (European Commission, DG JRC)
The ERTRAC colleagues of the evaluation group
For the DownToTen Project:
Prof. Jorma Keskinen, Dr. Panu Karjalainen (Tampere University of Technology)
Dr. Athanasios Mamakos (AVL)
Prof. Alexander Bergmann (Graz University of Technology)
Mr. Jon Andersson (Ricardo)
Prof. Leonidas Ntziachristos (LAT)
2
Outline
Environmental Challenges for the Road Transport System
CO2 emissions
Pollutant Emissions
Focus on Nanoparticles – how small and why?
The DownToTen Research Project “Measuring automotive exhaust particles
down to 10 nanometers”
Summary and outlook
3

European CO2 objectives for Transport
Demanding CO2 objectives……………..despite projected strong activity growth
EU28 all transport GHG (CO2–equivalent)
Data source: European Environment Agency, 2015 updateEU28 activity projection
Data source: IIASA, TSAP
4

The ERTRAC CO2 Emission Scenarios
(European Road Transport Research Advisory Council)
Working
Group
measure
sheetEvaluation
Group
CO2-Effect
of
each measure
Working
GroupWorking
Group xy
create and
describe ideas
calculates
the CO2-effect
considering the interactions between
the different measures
using the JRC fleet model DIONE
CO2
Road transport
t/year
total
Status
2010
interaction
Target
2030 / 2050
5
www.ertrac.org
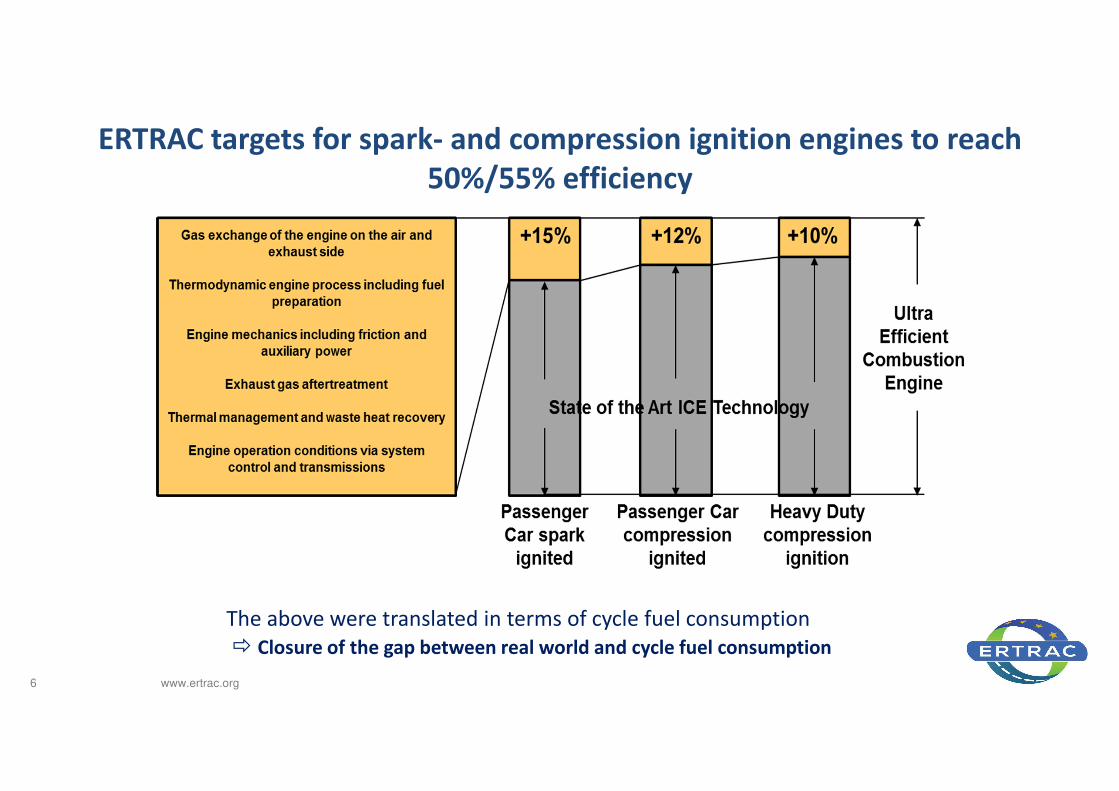
ERTRAC targets for spark- and compression ignition engines to reach
50%/55% efficiency
6
The above were translated in terms of cycle fuel consumption
Closure of the gap between real world and cycle fuel consumption

7
2050 Fleet Activity by Powertrain
Highly Electrified (HE) Highly Electrified & Hydrogen
(HEH)
Mix ScenarioPartly Electrified (PE)
79%Battery
Electric *
16%
PHEV
5%
Advanced
Combustion
Engine
8%
PHEV
78%Battery
Electric*
60%Battery
Electric*
Ve
hic
le k
ilo
me
ters 9%
Fuel Cell
Electric
Vehicle
* Remark PHEV: First 50 km of driving-cycle always in electric mode
6%
Advanced
Combustion
Engine
34%
PHEV
36%
Advanced
Combustion
Engine
34%
PHEV
60%Battery
Electric*
4%
Advanced
Combustion
Engine
30%Battery
Electric*

8
2050 Total CO2 Emissions Road Transport EU
Fleet Mix scenarios + all efficiency measuresC
O2
(M
t)
Road Transport
EU 2016
EU Target 2050
(min. 60%
Reduction of
2010)
Optimistic-
Pessimistic Range
HE Scenario,
All Measures
Optimistic-
Pessimistic Range
HE-H Scenario,
All Measures
Optimistic-
Pessimistic
Range
PE Scenario,
All Measures
732
< 281
190
130
80115
140
240270
435
Conclusion:
1. In combination with all efficiency measures also scenarios with lower
electrification can achieve the CO2-reduction.
Remark: economical/societal impact is not considered !
2. With lower electrification the influence of efficiency measures is more important.
3. The “Mix Scenario” can meet CO2 targets in the optimistic case however the
pessimistic case would require additional measures (e.g. reduced carbon intensity)
Optimistic-
Pessimistic
Range
MIX Scenario,
All Measures

Annual Mean Air Quality in the EU (PM and NO2)
Some European areas show high PM and NO2 concentrations.
The average contribution of local traffic to urban PM10, PM2.5 and NO2
is estimated at 15%, 35% and 46%, respectively.
9 Source: EEA 2016

NOx projections
Source: Kleefeld and Ntziachristos (2012) TSAP Review10

Impact of failing NOx on air quality exceedances
Source: Borken-Kleefeld (IIASA)11

PM2.5 projections
Baseline:
Reductions until 2030 vs. 2005
>90%: diesel HDV&LDV, locos, NRMM
~70% other mobile machines
Road abrasion, tyre, clutch and brake
wear increase with traffic volume,
>80% of emissions from road vehicles
in 2030
0
100
200
300
400
500
2000 2010 2020 2030 2040 2050
kt
PM
2.5
Inl. vessels + ships
Agric. + forestry machines
Construction machines
Rail - diesel only
Other non-road machinery
Heavy trucks - diesel
Cars and light trucks - gasoline
Cars and light trucks - diesel
Mopeds + Motorcycles
Buses + all other
Tyre, brake, abrasion
Source: Kleefeld and Ntziachristos (2012) TSAP Review

The fraction of the GDI vehicles in the
vehicle fleet is forecast to grow
significantly during the next years
GDI vehicles offer lower fuel
consumption and NOx emission but the
knowledge related to exhaust particles is
not at the same level as the knowledge
of diesel exhaust particles
Evidence that solid nucleation mode of
particles <23 nm can be emitted and
sometimes in high concentrations
Nanoparticles: how small? (1)
13

Nanoparticles: how small? (2)
As a result of these concerns and criticism for the direct application of the PMP protocol to
gasoline vehicles, there is on-going research and discussion on the extension of the PMP
to control particles in the sub-23nm range
3 Horizon 2020 projects (SUREAL-23, PEMs4Nano and DownToTen) have been launched in
this area. In all these projects, the size of approximately 10nm is selected to ensure that
sub 23nm particles are regulated while avoiding measurement artefacts that may arise in
the <10nm range
14

HORIZON 2020
Call: H2020-GV-2016-2017
Technologies for low emission light duty
powertrains
Action:
“Measuring automotive exhaust particles
down to 10 nanometres – DownToTen”

Project Partners
In collaboration with:
The University of California at Riverside,
National Traffic Safety and Environmental Lab (Japan)
and
National Metrology Institute (Japan)
16
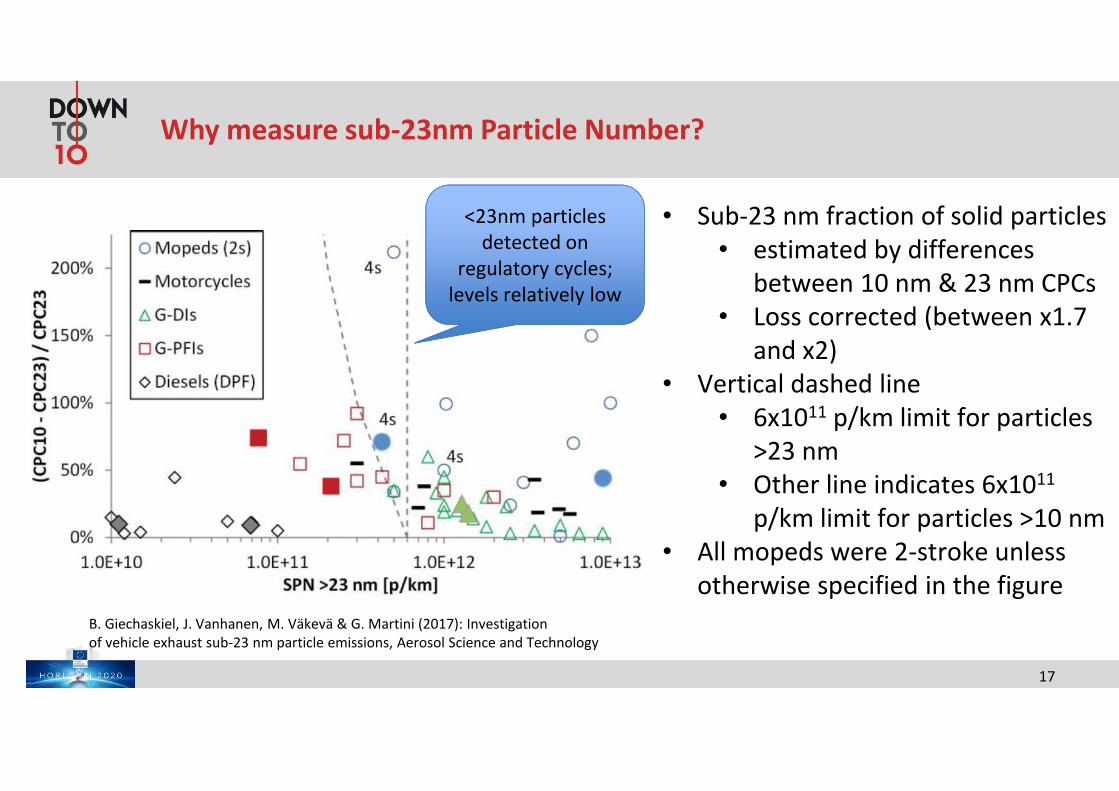
Why measure sub-23nm Particle Number?
• Sub-23 nm fraction of solid particles
• estimated by differences
between 10 nm & 23 nm CPCs
• Loss corrected (between x1.7
and x2)
• Vertical dashed line
• 6x10¹¹ p/km limit for particles
>23 nm
• Other line indicates 6x10¹¹
p/km limit for particles >10 nm
• All mopeds were 2-stroke unless
otherwise specified in the figure
B. Giechaskiel, J. Vanhanen, M. Väkevä & G. Martini (2017): Investigation
of vehicle exhaust sub-23 nm particle emissions, Aerosol Science and Technology
17
<23nm particles
detected on
regulatory cycles;
levels relatively low

Some interesting results: <23nm non-volatile PN from
diesel fuel cuts and >23nm particles derived from urea-SCR
Light-duty (1.4L, 66kW) turbocharged diesel engine
Amanatidis et al. (2017) J Aerosol SciAmanatidis et al. (2014) ES&T
18
Driving events and ECT
do produce <23nm
particles: further
investigation required

Aim of the project
To propose a robust approach for the measurement of particles from about 10 nm both for
PMP and RDE, complementing and building upon regulation development activities and
addressing topics not tackled so far
The objective is a PN-Portable Emission Measurement System (PEMS) demonstrator with
high efficiency in determining PN emissions of current and future engine technologies in the
real worldc
19

Exhaust emission related particle types
Time scale
Seconds Seconds to minutes Hours to days
Exhaust pipe aerosol contains primary
particles
Fresh (emitted) exhaust aerosol includes delayed
primary aerosol
Aged aerosol includes also secondary aerosol

Questions to be answered within the new size range
1. What is the number fraction of exhaust particles below 23 nm?
2. What is the specific chemistry of the particles?
3. How to define the particle species: accumulation – nucleation mode, volatile
– non-volatile, solid –liquid, Black Carbon – Elemental Carbon (BC-EC)
4. What fraction of exhaust particles corresponds to which species?
5. Which is the appropriate exhaust particle cut size?
6. How potentially un-regulated particles are linked to secondary aerosol
formation
7. How to robustly correlate raw exhaust sampling suitable for both RDE engine
development with dilution methods and sampling approaches employed
during engine and vehicle type approval?
21PEMS Conference March 2017

Sampling setup specifications
• A setup was designed to maximize the penetration of non-volatile particles below
23 nm, while avoiding the creation of gaseous artefacts
• Important factors like robustness against artefacts (re-nucleation, growth of sub-cut
particles), losses of (solid) particles, storage/release effects of gas phase
compounds are being assessed in detail
22Meeting on the Particle Measurements Projects (DownToTen, PEMS4Nano, SUREAL-23), Brussels. June 29, 2017

Sampling Setup to measure (primary) particles Overview
• 2-3 Dilution stages:
1. Stage (hot or cold) Porous Tube (PD1) 30 lpm
2. Stage (cold) Porous Tube (PD2) 30 lpm
3. Stage (cold) Ejector (ED) 1:10
• 2x MFC 60 lpm against ambient pressure
• 2x MFC >150 lpm against vacuum
• Exchangable volatile particle remover:
Catalytic stripper or evaporation tube
• Vacuum pump 100 lpm
• NI myRIO + LabVIEW virtual instrument
• Online chemical analysis with MS with ionization source Mostly appropriate for volatile
and semi-volatile species
• Offline chemical analyses of sub-23 nm particles

Porous tube dilutor as primary dilutor
24PEMS Conference March 2017
Ntziachristos and Samaras. JAWMA 2009Mikkanen et. al., SAE Paper 2001-01-0219

Identified losses with the DTT system
(silver particle tests at TUT)
Particle Losses
• Thermophoretic losses are mainly caused by cooling down the sample with an ejector diluter (ED).
Using a porous tube diluter (PTD) to cool down the diluted exhaust expected to reduce thermophoretic losses.
• The catalytic stripper (CS) is the dominating source of diffusional losses. They are reduced by downsizing the CS.
Temperature 350 ˚C

Different techniques to measure secondary particles and the one selected in
our project
Equiv. atmospheric age days hours hours- days
Experimental
throughput-time hours -days hours <2min residence time
Continuous flow oxidation reactors enable vehicle technology development to reduce SA?
Concept of Potential
Aerosol Mass: Kang et
al. 2007
Selected in our project

Chassis dyno testingSetup
Instrumentation
Engine out:
• AVL MSS
• AVL APC (23 nm)
• AVL APC + CS (10 nm)
Tailpipe:
• AVL APC + CS (10 nm + 23 nm)
• AVL PN-PEMS
CVS:
• AVL APC (23 nm) reference
• AVL APC + CS@350 (10 nm + 23 nm)
• 10:1 cold dilution + CS@350 + EEPS
• DTT (PD + CS@350 + PD + Ejector + 10 nm + 23 nm)
• AVL MSS

Interesting result: Elective testing of active DPF regeneration
Real-time data at 100kph
28
Baseline
23nm
difference
to SPCS
Release of <23nm
particles as regen
commences
(x30 increment)
Release event short-
lived:
Ash/C release from
substrate?
• Real-time traces of PN production indicate specific <23nm production at regeneration outset
• Short-lived event, but ~35x increase in >7nm relative to >23nm range
– Ash / carbon release from substrate?
– Calculations show this event is not sufficient to take the weighted vehicle emissions above 6x10¹¹#/km on WLTC (Ki factor)

AVL Research Networking Day 2017
GDI & PFI3WC with and without
GPFReference Petrol and
biofuel admixtures
NEDC, WLTC, 3
RDE cycles;
real PEMS
trips
uPGrAdE,
PaREGEn
SI-Hybrid3WC with and without
GPF
A hybrid from
GV-2-2016
DieselSCR and/ or NSC with
DPFReference diesel and
biofuel admixtures
DiePeR
CI-Hybrid SCR/NSC with DPFA hybrid from
GV-2-2016
CNG3WC with and without
GPFDifferent qualities GasON
Diesel SCR and DPFReference diesel and
biofuel admixtures
WHVC,
standard CO2-
vehicle test
cycles; PEMS
trips
To be decided
CNG Not decided yet Different qualities To be decided
>500ccm 3WCReference Petrol and
biofuel admixtures
WMTC, RDE
cycles, PEMS
test for
>500ccm
Suggestions
from the
German
programme50ccm 3WC
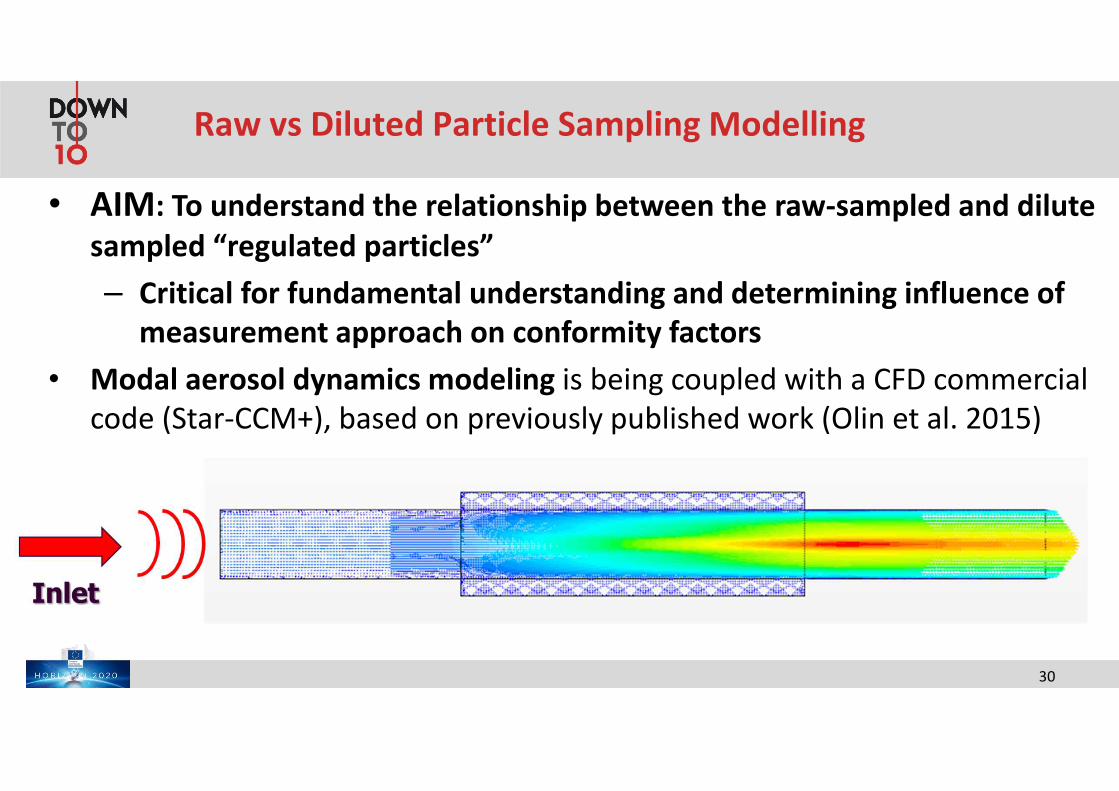
Raw vs Diluted Particle Sampling Modelling
• AIM: To understand the relationship between the raw-sampled and dilute
sampled “regulated particles”
– Critical for fundamental understanding and determining influence of
measurement approach on conformity factors
• Modal aerosol dynamics modeling is being coupled with a CFD commercial
code (Star-CCM+), based on previously published work (Olin et al. 2015)
30

• Inlet• Outlet
Porous Passage
Exhaust Inlet
CFD porous diluter cross section
P0 Pressure atmospheric
Air-pressure Higher than P0
Prescribed Variable Flowrate

Summary and Outlook
CO2 control will continue to be in the forefront of EU policy and related
technological advances
Variable degrees of hybridization, Shift to low carbon intensity fuels, Technology and
infrastructure based efficiency improvements
ICEs will continue to be the powertrains of option for the foreseeable
future.
ICEs have to be virtually emissions free under all driving conditions
In this context research work is undertaken to expand PN measurement to
particle sizes < 23 nm and to expand to total particles under real driving
conditions. Special focus on GDI.
32

Any
questions
?