Embed Size (px)
Citation preview


FUTURE AIRTRANSPORT
An industry dedicated
to continuous improvement
in global air travel. TRAVEL DEMAND ANDAIRLINE MARKETS >> .....................................15
Air Transport in a Global Economy ........................16Airline Strategies .....................................................18
AIRPLANE DELIVERYFORECAST >> ......................................................3
New Airplane Markets .............................................. 4More Travel Choices ................................................ 6Demand by Airplane Size .......................................10Air Cargo Markets ...................................................14
HIGHLIGHTS OFTHE OUTLOOK >> ...............................................2
THE OUTLOOKBY REGION >> ...................................................21
USEFUL
Region Comparison ................................................22Asia-Pacific Overview .............................................24Middle East .............................................................29North America .........................................................30Europe .....................................................................32Latin America ..........................................................34Africa .......................................................................35
DATA >> ...............................................................35Passenger Traffic ....................................................36Fleet Size and Development ..................................38New Airplane Deliveries..........................................40Traffic and Growth ..................................................42

THE BOEING COMPANY 2006CURRENT MARKET OUTLOOK
HIGHLIGHTS OFTHE OUTLOOK
2
THE NEXT20 YEARS >>
IMPROVING AIR TRAVEL FOR EVERYONETOTAL AIRPLANE DELIVERIES >>
SERVING HIGH-DENSITY TRAVELLARGE AIRPLANE DELIVERIES >>
NEW DIRECT SERVICESTWIN-AISLE DELIVERIES >>
HIGH-FREQUENCY MARKETSSINGLE-AISLE DELIVERIES >>
MOVING TO LARGER JETSREGIONAL JET DELIVERIES >>
PASSENGER AND FREIGHTTOTAL MARKET VALUE >>
$2.6T
3,450
16,540
6,230
990
27,210

AIRPLANE DELIVERYFORECAST >>
3
TOTAL FLEETEND OF YEAR 2025 >>
AIRPLANES CONVERTEDTO FREIGHTERS >>
NEW AIRPLANESFOR GROWTH >>
NEW AIRPLANESREPLACING OLD >>
TOTAL FLEETEND OF YEAR 2005 >>
17,330
9,580
17,630
2,220
35,970
For fleet development, see page 5.

AIRPLANE DELIVERYFORECAST >>
THE BOEING COMPANY 2006CURRENT MARKET OUTLOOK
NEW AIRPLANEMARKETS
The next 20 years will
see an annual world economic
growth rate of 3.1 percent,
a passenger travel growth rate
of 4.9 percent, and a freight
growth rate of 6.1 percent.
4
THE GLOBAL MARKET FOR NEW AIRPLANES WILL BE WORTH $2.6 TRILLION
The market will require 27,210 new airplanes, and the fleet will grow from 17,330 to 35,970 airplanes by 2025.
Africa 2%
Single aisle41%
Market value by region
MARKET VALUE BY SIZE AND REGION >> $2.6 TRILLION, 2005 DOLLARS
DELIVERIES BY SIZE AND REGION >> 27,210
NEW AIRPLANE DELIVERIES AND MARKET VALUE
Latin America4%
Twin aisle45%
Middle East 6%
Europe24%
Asia-Pacific36%
North America28%
Market value by size
Regional jets4%
747 and larger10%
Single aisle61%
Deliveries by region
Europe24%
Twin aisle23%
Middle East 4%
Latin America6%
Africa2%
Asia-Pacific29%
North America35%
Deliveries by size
Regional jets13%
747 and larger3%

ANNUAL GROWTH
GDP 3.1%RPKs 4.9%RTKs 6.1%
Value, $B 2,600New airplanes 27,210Regional jets 3,450Single aisle 16,540Twin aisle 6,230747 and larger 990
WORLD TOTAL >>
DELIVERIES
TOTAL FLEET
2005 17,3302025 35,970
5
A diverse global marketThe global market for new airplanes over the next 20 years will be diverse across regions, travel patterns, and airline business models.
Airlines in Asia-Pacific will acquire the highest value of new airplanes, with 36 percent of the overall $2.6 trillion market.
Airlines in North America will require the largest number of new airplanes, with 35 percent of the overall 27,210 airplanes required, compared to 29 percent for Asia-Pacific and 24 percent for Europe.
Over the next 20 yearsThe growing world economy, world trade, and airline competition in liberalized markets will generate annual passenger traffic growth of 4.9 percent and freight growth of 6.1 percent.
17,630 airplanes will be needed to accommodate the anticipated growth in passenger travel and air freight.
9,580 new airplanes, or 35 percent of the total, will replace less-efficient airplanes that will no longer be used in their current roles. While most of the airplanes replaced will be permanently retired, 2,220 passenger airplanes will be converted to freighters, and 770 new freighters will be delivered.
9,580
17,630
0
17,330
HOW THE FLEET GROWS
Airp
lane
uni
ts
747 and largerTwin aisleSingle aisleRegional jets
35,970
Fleet 200517,330
Fleet 202535,970
New airplane deliveries27,210
Airplanesconverted to
freighters1,210
1,010Airplanes
converted tofreighters
Removedor converted
airplanes10,790
FLEET DEVELOPMENT 2005 TO 2025 >>
CHANGE IN FLEET
Fleet 200517,330
Fleet 202535,970
BY SIZE >>

AIRPLANE DELIVERYFORECAST >>
THE BOEING COMPANY 2006CURRENT MARKET OUTLOOK
MORE TRAVELCHOICES
Global airline markets will
grow steadily over time.
6
A RESILIENT PASSENGER TRAVEL MARKET
The market for air travel is set to grow at an average of 4.9 percent each year.
The resilience that global airline markets have shown over time is reflected in average annual passenger traffic growth of 4.8 percent and air cargo growth of 6.3 percent over the past 20 years. This growth was founded on world economic growth of 2.9 percent and further stimulated by liberalization of market regulations in many countries.
Looking ahead over the next 20 years, the world economy is set to grow at 3.1 percent. Because airline passengers will continue to prefer traveling on nonstop flights, growth will be accommodated mainly by an increased number of flights (frequencies) rather than by larger airplanes, as seen in the chart.
AIR TRAVEL GROWTH PARAMETERS INDEXED TO 1990
MORE FREQUENT, DIRECT FLIGHTS >>
6.0
5.0
4.0
3.0
2.0
1.0
0
Frequency growthAir travel growthNonstopsAverage airplane size
1990 1995 2000 End of year2005
2010 2015 2020 End of year2025
For routes over 5000 kilometers.

Fundamental importance of liberalized marketsReduced market regulation is a key component of bringing wider availability of affordable air travel, which is so critical to maintaining personal relationships, developing future business, transporting purchased goods, and improving living conditions worldwide.
Liberalization typically stimulates immediate market growth of 12 to 35 percent.1 Furthermore, if markets connecting another 320 country pairs were liberalized, 24 million new jobs would be created, and an additional $490 billion would be added to the world economy (GDP).
Airline business modelsCompetition in liberalized markets enables airlines to implement service strategies, or business models, tailored to their target markets.
The primary airline business models are short haul, low cost; global and broad network; long-haul network; charter and inclusive tour (leisure); and freight operators. Of these, the global and broad network carriers will need the largest share (59 percent) of new airplanes in the future, with the short-haul, low-cost carriers needing 34 percent. There is further discussion of airline business models on page 20.
7
The most efficient travel optionAirlines are operating at their most efficient levels ever, as measured by utilization of their airplanes and how full those aircraft are on each revenue flight. This efficiency favors the use of the newest airplanes, which have the highest utilization rates. As airlines seek to build the profitability of their business in an environment of high fuel prices, they will tend to bring forward fleet replacement.
Airplanes have the highest levels of utilization of any form of transport. The world average single-aisle utilization in August 2005 was 8.4 flight-hours a day and that for all twin-aisle and large airplanes was 10.7 flight-hours a day.2 2005 also saw the highest global airline load factors ever (percentage of available seats occupied by fare-paying passengers) at over 76 percent. SHARE OF DELIVERIES BY AIRLINE TYPE >>
NEW AIRPLANE DELIVERIES BY BUSINESS MODEL
For more on airline business models, see page 20.
34%Short haul,low cost
2%Charter andinclusive tour
1%Freightoperators
4%Long-haulnetwork
59%Global and broad network
1 The Economic Impact of Air Service Liberalization InterVISTAS-ga2 Consulting 2006.
2 ACAS.

AIRPLANE DELIVERYFORECAST >>
THE BOEING COMPANY 2006CURRENT MARKET OUTLOOK
8
GLOBAL PASSENGER TRAVEL PATTERNS
Passenger travel is analyzed by regional traffic flow.
As people travel by air from one place to another, they do so either within or between regions. In the Current Market Outlook, passenger travel is analyzed according to these flows at a very detailed level (see pages 36 and 37) and is shown here aggregated into the main travel regions of the world.
Travel growth rates in each market are affected by factors in the countries or regions at each end of, or within, the flow.
ASIA-PACIFIC WILL BECOME THE LARGEST REGION >> WITHIN OR BETWEEN REGIONS >>
PASSENGER TRAFFIC DEVELOPMENT, RPKs (BILLIONS) ANNUAL GROWTH RATE, 2005–2025
2,500
2,000
Asia-Pacific, including China 6.4%
Within North America 3.6%
Asia-Pacific, excluding China 5.4%
Within Europe 3.4%
North Atlantic 4.5%
Within China 8.8%
Europe–Asia-Pacific 5.5%
Transpacific 5.8%
North America–Latin America 4.9%
Europe–Latin America 5.1%
Within Latin America 6.9%
Africa–Europe 5.0%
Middle East–Asia-Pacific 6.0%
1,500
1,000
500
0End of year
2005End of year
2025

9
Factors affecting growth in each marketThe size of each economy and its growth rate have the largest effect on the growth of passenger travel in each market. The rate of change of airfares will affect travel growth (to airlines, this means changing yields, or revenue per passenger kilometer). In many markets, the biggest influence on growth rates is the degree to which governments open market access to airlines based either within their own territory or outside (i.e., the degree of liberalization in each country’s markets).
Other important factors to consider include the propensity for people of a given culture to travel, especially to distant countries, and the outlook for change in any government-imposed restrictions on travel.
The varying relationship between GDP and passenger travel (and also air freight traffic) is clearly shown for each region in the section “The Outlook by Region,” beginning on page 21.
Passenger market growth by regionAsia-Pacific (including within China) will become the largest internal market over the next 20 years,overtaking the market within North America. Markets in Asia-Pacific have powerful combinations of large economies, rapid economic growth, and liberalizing markets.
Although the large internal markets of North America and Europe will see lower growth rates than other markets, their size will result in large amounts of additional traffic.
The Europe–Latin America and North America– Latin America markets are almost the same size as each other at both the beginning and end of the period because they are both expected to grow at around 5 percent each year.
Airplane use on each flowAirline service in markets connecting distant regions generally needs larger airplanes than that within regions, which tend to offer more flightson a given day (i.e., higher frequencies) and often a choice of airports close to the larger cities.
The exception is markets within Asia-Pacific, which can involve long flights or very high traffic volumes with restricted choice of airports that can be served. This suits the use of larger airplanes.
Concentration of single-aisle demand within regionsThe need for single-aisle airplanes is focused on serving markets where low fares and choice of destination airports are highly essential to travelers. These markets tend to be within regions, particularly where internal market regulations are highly relaxed or there is a free market.
AIRLINE CAPACITY BY AIRPLANE SIZE
TWIN-AISLE AIRPLANES FOR LONGER DISTANCE >>
3,500
3,000
2,500
2,000
1,500
1,000
500
0747 and largerTwin aisleSingle aisleRegional jets
Annu
al A
SKs
(billi
ons)
2005 2025Asia-Europe
2005 2025Transpacific
2005 2025North America
2005 2025Europe
2005 2025Asia-Pacific
2005 2025North Atlantic

AIRPLANE DELIVERYFORECAST >>
THE BOEING COMPANY 2006CURRENT MARKET OUTLOOK
DEMAND BYAIRPLANE SIZE
Traffic volumes, competition,
route distance, and airline strategies
shape demand for airplane
size in each region.
10
AIRPLANE SIZE BY REGION
Demand by region where the airline is based.
In contrast to the previous section, which discusses demand for airplanes to serve traffic flows within and between geographic regions, the fleet development discussion here refers to the fleets of airlines according to where they are based. Freight airplanes are included in the charts and numbers in this section.
Distinct influences on choice of airplane sizeTraffic volumes, distances in key markets, competitive strategies, availability of alternative forms of transport, and market access influence the size of airplane used in any given region.
In general, if market regulation allows airlines to make their own choices regarding how to compete, they will use smaller aircraft and provide more frequent service.
NEW AIRPLANE DELIVERIES BY SIZE AND REGION
27,210 NEW AIRPLANE DELIVERIES >>
10,000
8,000
6,000
4,000
2,000
0Europe Latin
AmericaAsia-
PacificNorth
AmericaAfrica and
Middle East
For new and converted freighters, see page 15.
747 and largerTwin aisleSingle aisleRegional jets

11
Already common in developed markets, this approach is also the prevalent trend in market development foreseen in the most rapidly growing regions. The result will be more frequent service on existing routes and more pairs of cities connected for the first time.
Reduced size of airplanes for most long-range marketsMedium- and long-range markets are primarily served with twin-aisle and large airplanes.
The shifting balance toward smaller twin-aisle airplanes in the future is driven by passengers who prefer to travel directly between their points of origin and destination. Airlines are able to provide more economical service on an increasing number of these routes through the improvement in operating economics of each new generation of airplane.
Some markets need larger airplanesScheduling constraints and market regulations in a few of the world’s intercontinental markets limit the number of possible flights any one airline can offer. On these routes and those with particularly high demand, airplanes of 747 size and larger will be required. Good examples of such routes would be Singapore or Hong Kong to London Heathrow.
HOW THE FLEET WILL DEVELOP OVER THE NEXT 20 YEARS
Fleet end of the year 2005
Region Regional jets Single aisle Twin aisle 747 and larger Regional total
North America 1,890 4,300 1,060 170 7,420
Asia-Pacific 170 1,800 830 470 3,270
Europe 560 2,760 640 230 4,190
Latin America 20 950 120 10 1.100
Africa and Middle East 70 770 420 90 1,350
WORLD TOTAL >> 2,710 10,580 3,070 970 17,330
Fleet end of the year 2025
Region Regional jets Single aisle Twin aisle 747 and larger Regional total
North America 3,200 7,820 2,330 240 13,590
Asia-Pacific 670 5,340 2,830 770 9,610
Europe 550 5,270 1,660 240 7,720
Latin America 440 1,920 350 10 2,720
Africa and Middle East 180 1,120 900 130 2,330
WORLD TOTAL >> 5,040 21,470 8,070 1,390 35,970
For deliveries by airplane size and region, see pages 40 and 41.

AIRPLANE DELIVERYFORECAST >>
THE BOEING COMPANY 2006CURRENT MARKET OUTLOOK
New passengerairplane deliveries 26,440
7,360retired passengerairplanes
Convertedto freighter2,220
2005 passenger fleet 15,540
2025 passenger fleet 32,400
>> PASSENGER FLEET
PARKED
USED
IN SERVICE
2005 TOTAL PASSENGER AND FREIGHTER FLEET >> 17,330
THE AIRPLANE MARKET LIFE CYCLE
A systematic view of the airplane life cycle.
As airplanes age, some of the oldest ones are removed from the system, and new ones are acquired for replacement or growth. In an environment of high fuel prices, replacement of older airplanes is accelerated. Airplanes that are retired are those that are no longer in service at the end of the forecast period.
Movement within the fleetThere is also considerable movement within the overall fleet; most of the 2,220 airplanes that will be converted from passenger to freight roles will be acquired by different operators. Over the past decade, the majority of airplanes converted have been between 15 and 19 years old, although the optimum conversion age varies by airplane type and condition. Some of the fleet will change operators through sale, lease, or other forms of exchange.
Aircraft become less productive with ageNewer airplanes are used more intensively than older ones: around 9 flight-hours a day for a current generation single-aisle airplane in passenger service compared to 7 to 8 hours a day for a 15-year-old airplane and as low as 2 to 3 hours a day for a 25-year-old converted freighter.
12

New freighterairplane deliveries
770
1,210retired freighter
airplanes
Convertedfrom passenger
2,220
2005 freighter fleet 1,790
2025 freighter fleet 3,570
2025 TOTAL PASSENGER AND FREIGHTER FLEET >> 35,970
Newer airplanes favored as the fleet agesThe passenger fleet is getting older at a slowing rate, with its average age now stabilizing at around 12 years. New airplanes added to the fleet have much better performance, economic, and environmental characteristics than those that are removed.
The cost of periodic maintenance increases as aircraft age, although each new generation of airplanes has a longer period of lower initial maintenance costs. As operating expenses such as fuel, crew, and online engine and airframe maintenance increase for older airplanes compared to newer ones, older airplanes are more likely to be retired and replaced with newer types.
Regulations governing aircraft noise and emissions or aircraft age limits may also prompt airplane retirement.
Airplanes parked for a variety of reasonsAn airplane may be parked for a few weeks or months during maintenance, modification, conversion, or transfer between owners. In these cases, the airplane may be in a hangar or parking area at an airport or maintenance facility. When an airplane is no longer economically viable to operate, it may be stored for longer periods at a dedicated facility, perhaps with its engines removed, doors and windows sealed, and in dry desert conditions. The age and condition of the airplane, its model type, and overall market conditions will affect the length of time it is parked.
Larger numbers of airplanes are becoming economically obsolete and are being scrapped. Efforts to appropriately dispose of airplanes include disassembling them to salvage parts and components and separating valuable materials for reclamation. These actions increase aircraft scrap values, enable reuse of their structural materials, and reduce the environmental impact of recycling airplanes.
13
FREIGHTER FLEET <<
PARKED
USED
IN SERVICE
AIRPLANE DELIVERYFORECAST >>
AIR CARGOMARKETS
THE BOEING COMPANY 2006CURRENT MARKET OUTLOOK
14
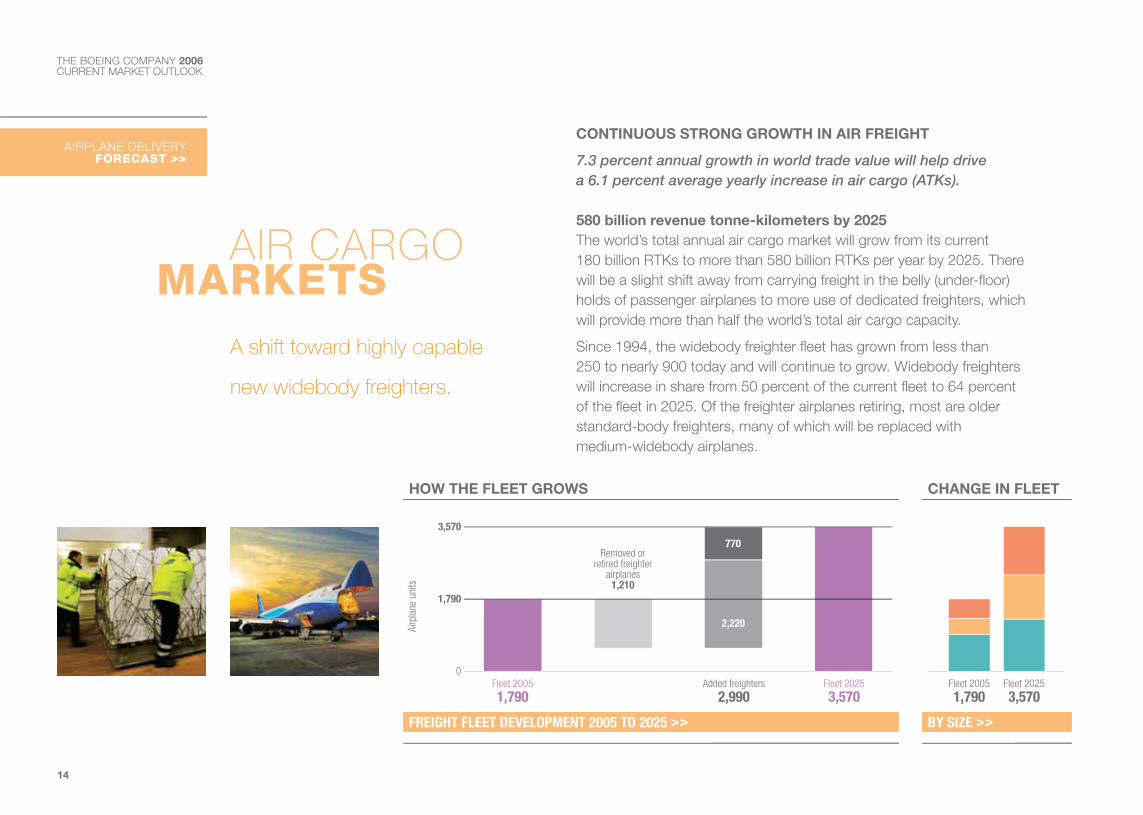
CONTINUOUS STRONG GROWTH IN AIR FREIGHT
7.3 percent annual growth in world trade value will help drive a 6.1 percent average yearly increase in air cargo (ATKs).
580 billion revenue tonne-kilometers by 2025The world’s total annual air cargo market will grow from its current 180 billion RTKs to more than 580 billion RTKs per year by 2025. There will be a slight shift away from carrying freight in the belly (under-floor) holds of passenger airplanes to more use of dedicated freighters, which will provide more than half the world’s total air cargo capacity.
Since 1994, the widebody freighter fleet has grown from less than 250 to nearly 900 today and will continue to grow. Widebody freighters will increase in share from 50 percent of the current fleet to 64 percent of the fleet in 2025. Of the freighter airplanes retiring, most are older standard-body freighters, many of which will be replaced with medium-widebody airplanes.
2,220
770
0
1,790
HOW THE FLEET GROWS
Airp
lane
uni
ts
CHANGE IN FLEET
3,570
Fleet 20051,790
Fleet 20253,570
Added freighters2,990
Fleet 202535,970
Fleet 20051,790
Fleet 20253,570
FREIGHT FLEET DEVELOPMENT 2005 TO 2025 >> BY SIZE >>
Removed orretired freighter
airplanes1,210
A shift toward highly capable
new widebody freighters.

TRAVEL DEMAND ANDAIRLINE MARKETS >>
15
Dedicated freighter fleet will shift toward widebodiesThe freighter fleet will just about double over the next 20 years, from 1,790 to 3,570 airplanes. There will be 1,210 retirements and 2,990 airplanes added to the freighter fleet by 2025.
Three-quarters (2,220) of the airplanes added to the freighter fleet will come from converted passenger or combi airplanes.1 The remaining 770 airplanes added will be new production freighters, with a market value of $169 billion. Many airlines prefer the advanced technical features, improved reliability, and better fuel efficiency of new airplanes. Nearly 62 percent of all additions to the fleet will be widebody airplanes because of airline needs for long-range, low-unit-cost service.
Operators in Asia-Pacific will account for more than 37 percent of world freight capacity and 38 percent of the freighters added. Airlines in North America will account for 32 percent of world capacity but will require 48 percent of all deliveries, taking a higher proportion of standard-body freighter airplanes.
NEW AND CONVERTED FREIGHTERS
BY SIZE AND REGION >>
2,000
1,000
0Europe Latin
AmericaAsia-
PacificAfrica and
Middle East
Large(more than 75 tonnes)
Medium-widebody(40 to 75 tonnes)
Standard-body(less than 45 tonnes)
NorthAmerica
1 Mixed passenger and freight configuration, such as the 747-400 Combi.

TRAVEL DEMAND ANDAIRLINE MARKETS >>
THE BOEING COMPANY 2006CURRENT MARKET OUTLOOK
AIR TRANSPORT IN AGLOBAL ECONOMY
Air transport is crucial to personal
relationships, to future business,
to transporting purchased goods,
and to improving living conditions
around the world.
16
URGENT FREIGHT >>
BUSINESS TRAVEL >>
FAMILY TRAVEL >>
LEISURE TRAVEL >>
PUNITAA research biologist who urgently needs samples for her study to assist humanitarian aid programs. Expensive, heavily packed samples that will degrade beyond use if they aren't delivered in time are dispatched from New York. Fortunately, they are sent on the air freight service that stops in Delhi on its way around the world.
SAKAMOTO SANDeveloping international business that supports the livelihood of 14,800 employees. Often undertakes long, multistop trips such as from Tokyo to London via Dubai, returning back home after three weeks of meetings with customers.
ALFREDOWorks near Miami, likes to visit family back home in Brazil once in a while with wife and two kids.
JASMINETakes a break
from studying by going on a long
weekend in Spain twice a year, thanks to low-cost airlines.

GROWTH RATES Worldaggregate gross domesticproduct(GDP)
Global air transport
World trade:Exported goods andservicescontribute34%
Measure Historic FutureGDP 2.9% 3.1%Passenger traffic 4.8% 4.9%Air cargo 6.3% 6.1%
PERIOD >> 1985–2005 2005–2025
Distance 1 700 kmPassengers 1Airfare $155Yield 9¢ per km
LOWEST FARE AIR TRANSPORTOf the world economy, air transport contributes 8%
TXL > PMI > TXL
Distance 6 600 kmPassengers 4Airfare $1,124Yield 17¢ per km
ECONOMY
MIA > GRU > MIA
Distance 23 000 kmPassengers 1Airfare $10,866Yield 47¢ per km
BUSINESS
NRT > DXB > LHR > NRT
Distance 13 000 kmWeight 20 kgAirfare $434Yield 3¢ per km
JFK > DEL
17
FREIGHT
Flights 28 millionKilometers 34 billion
SPENDINGThe additional spending by all travelers on these trips contributes a further 2%.
Visiting family and friendscontributes 2%
Businesstravelcontributes 2%
Air transportation of cargo contributes 1%
Leisure travelcontributes 3%

TRAVEL DEMAND ANDAIRLINE MARKETS >>
THE BOEING COMPANY 2006CURRENT MARKET OUTLOOK
AIRLINE STRATEGIES
Well over 500 scheduled
airlines compete in worldwide
passenger travel markets.
18
GROWING IN COMPETITIVE MARKETS
Airlines match service levels to demand to maximize their return on investment.
Airline investment in capital facilities, equipment, highly skilled personnel, and building market presence demands high utilization of these assets to maintain a viable business. Growth brings economies of scale but often brings them into more competitive markets.
Competitive pressure and this need for growth have driven a high rate of new technology adoption and innovation in the airline business.
Driven to high load factorsBecause an airline’s product is the service it provides, once the airline product is delivered, it cannot be recovered and used again. If a seat on Tuesday’s flight from Delhi to Kuala Lumpur is empty once the flight has left, it cannot be sold at a later date. This generally drives airlines to maintain as high a proportion of seats filled as possible (i.e., to achieve high load factors).
To do this, airlines offer a product as close as possible to anticipated passenger demands. The main criteria they strive to meet are cost, time, place, and service quality.
Europe–Asia-PacificWithin EuropeTranspacificWithin Asia-PacificNorth AtlanticWorldWithin North America

19
Generally, minimal market regulation gives rise to more competition and service more directly tailored to passenger needs, rather than tailored to meet government-imposed regulations regarding price, frequency, and identity of service provider.
It is for this reason that the anticipated continual liberalization of markets around the world will bring a 50 percent increase in the number of airport pairs connected every 15 years.
Providing direct servicesMost passengers like to get to their intended destination as quickly as possible, taking a nonstop flight whenever they can.
While a hubbing strategy enables a high number of cities to be reached from smaller cities through a central transfer point, if providing direct service in a given market is viable, this is typically preferred.
About 3 million routes would exist if all viable points of origin and destination around the world were connected with direct service. Only around half a percent of these possible routes are actually served today—around 15,500 airport pairs. Looking back over the past 20 years, the chart shows the rate at which routes have been added in each of the world’s major markets.
Strong potential for new routesThe fastest rate of adding new airport pairs was seen in Europe–Asia-Pacific markets, with more than three times the number of routes served in 2005 as 20 years ago.
The extension of Europe’s internal free market to additional countries and the completion of deregulation there generated continual growth in new market opportunities.
Markets within Asia-Pacific, within Europe, or connecting Europe and Asia-Pacific were hardly affected immediately after 2001. Those regions that did suffer a reduction in airport pairs connected are seeing more connections added and approaching their pre-2001 levels of network spread.
Within the North American market, the most developed in the world, there has been continual long-term growth in the number of routes served.
WORLD: 1.7 TIMES MORE AIRPORTS CONNECTED IN 2005 THAN IN 1985 >>
NUMBER OF AIRPORT PAIRS CONNECTED INDEXED TO 1985
1990
1989
1988
1987
1986
1985
1995
1994
1993
1992
1991
2000
1999
1998
1997
1996
2005
2004
2003
2002
2001
1.0
1.5
2.0
2.5
3.0

TRAVEL DEMAND ANDAIRLINE MARKETS >>
THE BOEING COMPANY 2006CURRENT MARKET OUTLOOK
20
HIGHEST MARGINTop 30 airlines with the highestreported operating margin.1
AIRLINE FINANCIAL PERFORMANCE
Strong airline financial performance is not limited to particular regions or business models.
Airlines purchase new airplanes largely to improve their financial performance, replacing older airplanes with more efficient types and acquiring the capacity to address growth markets.
A review of the most profitable airlines worldwide shows that, by this measure, there is no dominant region or business model. The rankings shown are compiled by Airline Business each year and change considerably between reporting periods so should be considered only as illustrative.
While Airline Business’ top 30 airlines by each profitability measure are shown here, the analysis behind the Current Market Outlook considers about 1,000 operators from around the world, of all sizes and operating across the complete variety of business models.
Larger airlines generally deliver higher absolute profitsThe top 10 airlines in terms of absolute operating profit are largely carriers with global networks. They are led by a freight airline and include a U.S. low-cost operator and originate from four of the six world regions (see pages 22 and 23). Perhaps surprisingly, four U.S. regional airlines also appear in this top 30. Some of the world’s largest airlines by revenue were not in the 2005 list but can be expected to reappear in the near term.
A third of the most profitable airlines do not appear on the list of those with the highest operating margin, indicating that their relative size generates a larger scale of income. The lowest operating margin of any airline in the operating result list is around 2 percent.
LARGEST PROFITSTop 30 airlines with the largestreported operating profits.1
1 Airline Business, August 2006.
NUMBER OF AIRLINES
Africa 1Asia-Pacific 10Europe and CIS 7Latin America 3Middle East 1North America 8 TOTAL
30
NUMBER OF AIRLINES
Broad network 8Charter, inclusive tour 0Freight operators 2Global network 12Low cost 4Regional 4
TOTAL
30
NUMBER OF AIRLINES
Africa 4Asia-Pacific 7Europe and CIS 6Latin America 2Middle East 2North America 9 TOTAL
30
NUMBER OF AIRLINES
Broad network 11Charter, inclusive tour 1Freight operators 3Global network 5Low cost 4Regional 6 TOTAL
30
BY REGION >>
BUSINESS MODEL >>
IN 2005 >>
IN 2005 >>

THE OUTLOOKBY REGION >>
21
Operating margin ignores airline size and business modelOperating margin is the ratio of operating profit to operating revenues. This indicates how profitable airlines are regarding their own business operations, rather than in relation to how large they or their competitors are. This measure shows an even greater spread of the top performers in 2005 across regions and business models.
The operating margins reported by airlines represented in the right-hand table range from 43 percent to 7 percent. Most are below 23 percent, and about half are below 10 percent.
The highest profit margins are widely spreadThe operating margin ranking is particularly interesting as it reflects an even greater spread across airline size, business model, and region. All six world regions are represented by the top seven airlines, and six of the top 30 are from Africa or Latin America.
The five main business models are also represented in the top 10,with only one being a global network carrier.
Future strategiesIn a global sense, there will not be a dominance of one particular region or business model in defining the profitable airlines of the future.
We are likely to see a mixture of specialist airlines addressing their area of strength and multiple strategies being executed within single airline groupings. Some midsized airlines can also clearly demonstrate strong profitability.

THE OUTLOOKBY REGION >>
THE BOEING COMPANY 2006CURRENT MARKET OUTLOOK
22
22%
68%
7,900new airplanes
100%
75% 32%
50%
25% 54%
0%
3,270airplanes
9,610airplanes
21%15%
62%
2% 3% 7%
2005 2025 7% 7%
Every one of the six major regions
of the world compared here has
a unique significance.
Share of fleet Delivery units
6,600new airplanes
100%
75%
50%
25%
0%
4,190airplanes
7,720airplanes
2005 2025
EUROPE
Share of fleet Delivery units
9,490new airplanes
100%
75%
50%
25%
0%
7,420airplanes
13,590airplanes
2005 2025
NORTH AMERICA
VALUE >> $740 BILLION VALUE >> $620 BILLION
Share of fleet Delivery units
ASIA-PACIFICChina, Oceania, Northeast Asia, Southeast Asia, Southwest Asia
VALUE >> $930 BILLION
REGIONCOMPARISON

23
39%
49%
15%
26%
58%
747 and largerTwin aisleSingle aisleRegional jets
11% 15%
73%
1% 1%
7% 5%
AIRPLANE MARKET BY REGION
Demand for air travel on the world’s major traffic flows is translated into a requirement for passenger and freight airplanes for the airlines of each region.
HighlightsAsia-Pacific has the highest value market, while North America will take the most airplane deliveries.
Europe is second of the six regions in each of the single-aisle, twin-aisle, and large-airplane sectors.
The average new Middle Eastern airplane will be worth 50 percent more than the world average.
In Latin America, regional jets and single-aisle airplanes account for 86 percent of airplane deliveries.
Africa has the largest shift in fleet share toward twin-aisle airplanes.
1,110new airplanes
100%
75%
50%
25%
0%
630airplanes
1,300airplanes
2005 2025
Share of fleet Delivery units
1,680new airplanes
100%
75%
50%
25%
0%
1,100airplanes
2,720airplanes
2005 2025
LATIN AMERICACentral America, South America
Share of fleet Delivery units
430new airplanes
100%
75%
50%
25%
0%
720airplanes
1,030airplanes
2005 2025
AFRICA
VALUE >> $110 BILLION VALUE >> $40 BILLION
Share of fleet Delivery units
MIDDLE EAST
VALUE >> $160 BILLION

THE OUTLOOKBY REGION >>
THE BOEING COMPANY 2006CURRENT MARKET OUTLOOK
ANNUAL GROWTH
GDP 3.8%RPKs 6.2%RTKs 7.0%
Value, $B 930New airplanes 7,900Regional jets 580Single aisle 4,230Twin aisle 2,520747 and larger 570
ASIA-PACIFIC >>
DELIVERIES
TOTAL FLEET
2005 3,2702025 9,610
24
ASIA-PACIFIC
The only region with more than half its traffic in internal markets.
The Asia-Pacific region is so extensive and fast growing that it is analyzed in five distinct areas that are presented on pages 25 to 28.
These regions are
China............................................................ 25Northeast Asia.............................................. 26Southeast Asia ............................................. 27Oceania (Australasia) .................................... 27Southwest Asia (including India).................... 28
The rates of growth for both passenger and freight traffic are the fastest of any major world region.
The highest value market$930 billion worth of new airplanes will be delivered, a higher market value than for any other region.
The focus on widebody airplanes (39 percent of deliveries) is stronger than in any region except the Middle East, although the widebody market in Asia-Pacific is five times the size of that in the Middle East.
Single-aisle and regional jets will account for 61 percent of deliveries.
ASIA-PACIFICOVERVIEW
Growing faster than other parts
of the world, with high economic
growth rates and many developing
markets, to become the largest
region in terms of passenger
traffic by 2025.
1 China National Bureau of Statistics.
2 Chinese Academy of Social Sciences.
3 World Tourism Organization.

ANNUAL RANK GROWTH 1–10
GDP 6.6% 1RPKs 7.9% 1RTKs 7.1% 3
Value, $B 280 3New airplanes 2,880 3Regional jets 290 3Single aisle 1,840 3Twin aisle 660 5747 and larger 90 5
CHINA >>
Ranked by the 10 regions discussed in detail in this section.
DELIVERIES
TOTAL FLEET
2005 1,030 42025 3,900 3
25
CHINA
China is the largest commercial aviation market outside the United States.
Rapid economic growthChina’s economy currently benefits from annual growth rates in excess of 9 percent and is expected to average 6.6 percent growth over the next 20 years. New airplane deliveries to China will account for more than 35 percent of demand in the Asia-Pacific region.
As China’s wealth increases, the proportion of the population classified as middle class is expected to rise from 13 percent in 20101 to around 40 percent in 2020.2 By 2020, China is forecast to rise to the world’s top most popular tourist destination, with 180 million tourists each year, from fourth place today. Also by that time, more than 100 million outbound travelers will make China the fourth largest source of outbound travel in the world.3
Potential for domestic growthLiberalization of all Chinese markets will continue, as will the formation of partnerships and alliances with foreign airlines intent on benefiting from the growth in China.
More than 700 domestic airport pairs serve 1.3 billion Chinese people today, compared to 2,550 airport pairs and a population of around 300 million in the United States. The number of flights and airline capacity within China are both forecast to grow fivefold over 20 years.
The decline in domestic average airplane size since 2000 will continue, reflecting passenger demand for more frequent service and more nonstop flights. The Golden Triangle shown in the chart (Beijing, Shanghai, Guangzhou) represents around 10 percent of domestic capacity and the trunk routes a further 40 percent.
Balanced demand by airplane sizeAs the highly varied Chinese market continues to develop, the mix of airplane requirements by size will be very close to the world average.
August OAG, including Hong Kong and Macau.
4,5004,0003,5003,0002,5002,000
Weekly ASKs, million
1,5001,000500
1990 1995
9590
20002005 < Trunk routes
2000
< All Chinese domestic markets >2005
20051990
0
DOMESTIC CHINESE AIRPLANE SIZE >>
AVERAGE AIRPLANE SIZE IS ABOUT THE SAME AS 15 YEARS AGO
50
100
150
200
250
300
< Golden Triangle200095
Aver
age
seat
s pe
r airp
lane
per
trip

THE OUTLOOKBY REGION >>
THE BOEING COMPANY 2006CURRENT MARKET OUTLOOK
ANNUAL RANK GROWTH 1–10
GDP 1.8% 10RPKs 5.6% 5RTKs 6.9% 5
Value, $B 240 5New airplanes 1,570 6Regional jets 40 9Single aisle 530 7Twin aisle 810 3747 and larger 190 2
NORTHEAST ASIA >>
DELIVERIES
TOTAL FLEET
2005 630 72025 1,780 6
NORTHEAST ASIA
A large market with a unique emphasis on widebody airplanes.
Northeast Asia has a unique emphasis on twin-aisle airplanes, with more than half (51 percent) of its future demand for new airplanes being of this size, the largest proportion for any world region. This will drive up the average value of each new airplane delivered to $150 million.
The region’s overall economy ranks third after North America and Europe, with South Korea to join Japan in the top 10 economies by 2025.
Northeast Asia is highly urbanized with many densely populated cities. The economy relies heavily on imported resources, and its people have a significantly higher propensity to travel than the world average. Recently expanded air service agreements will draw new airlines to enter the increasingly fragmented China-Japan-Korea market, where competition will generate more frequent flights. Air travel within Northeast Asia is expected to grow by 5.4 percent each year, with 5.7 percent annual traffic growth to and from Northeast Asia.
A strong 6.9 percent freight traffic growth rate will lead to many of the new large airplanes being delivered as freighters.
Investment in new airport infrastructureInvestment in airport capacity will help expand market access and stimulate air travel growth. Capacity is being added at Korea’s Incheon airport (Seoul), Japan’s Narita and Haneda (both serving Tokyo), Kobe, Kansai (Osaka), and at new regional airports such as at Nagoya.
About a third (540) of the 1,570 new airplanes needed will be added to serve markets within Northeast Asia, with the remaining two-thirds (1,030) for routes to North America, Europe, and other Asia-Pacific markets. In particular, many new intermediate twin aisles will be used to provide a greater choice of nonstop destinations.
26
800
600
400
200
0
MAINLY FOR INTERNATIONAL ROUTES >>
MORE THAN HALF THE NEW DELIVERIES WILL BE TWIN-AISLE AIRPLANES
New
airp
lane
del
iverie
s 20
06 to
202
5
Regional Single aisle Twin aisle Large
International routesWithin Northeast Asia

ANNUAL RANK GROWTH 1–10
GDP 4.4% 4RPKs 5.5% 6RTKs 6.6% 6
Value, $B 260 4New airplanes 1,990 4Regional jets 170 5Single aisle 910 5Twin aisle 670 4747 and larger 240 1
SOUTHEAST ASIA >>
DELIVERIES
TOTAL FLEET
2005 960 52025 2,250 5
ANNUAL RANK GROWTH 1–10
GDP 2.5% 8RPKs 3.7% 10RTKs 7.6% 2
Value, $B 60 9New airplanes 440 9Regional jets 20 10Single aisle 210 10Twin aisle 180 9747 and larger 30 7
OCEANIA >>
DELIVERIES
TOTAL FLEET
2005 340 92025 540 10
OCEANIA (AUSTRALASIA)
Strong strategic response to domesticand international competition.
Oceania has highly competitive markets, pioneering airlines, and the second highest freight traffic growth (7.6 percent) of any region. Further liberalization of international air service agreements will increase competition as additional carriers enter the market.
Inbound tourism is a major source of travel demand. Flights to Europe are mostly routed through Asia or the Middle East, but nonstop flights are likely as the capabilities of longer range twin-engine aircraft are proven.
Competitive strategiesWithin Oceania, the influence of international carriers is strong. It has the largest share of service within the region accounted for by airlines from outside, at around 5 percent compared to less than 1 percent in most other regions.
Local airlines have established strategies to reduce cost complexity and maintain profitability through service innovation, separate lower cost business units, and investment in overseas markets.
27
SOUTHEAST ASIA
Important local and long-haul markets driving airplane requirements.
Southeast Asia will take delivery of more airplanes of 747 size or larger than any other region. A third of the 240 new large airplanes will be freighters. At the same time, growth in local markets in Taiwan, Indonesia, and Malaysia in particular will require the most single-aisle airplanes (910) of any Asian region outside China.
Endorsement of the low-cost airline business model has been accompanied by dedicated facilities such as low-cost terminals at major airports, leading to some of the fastest growth rates for such markets anywhere in the world. In contrast, some of the more established carriers have recently been forced to restructure to address poor financial performance. Travel within Asia accounts for 63 percent of airline capacity.
Extending international networksThe region is rooted in international trade and finance, and larger airlines have capitalized on its strategic location to develop extensive, profitable global networks. Longer range twin-engine airplanes will enable the region’s airlines to serve a wider selection of important North American markets with direct service.

THE OUTLOOKBY REGION >>
THE BOEING COMPANY 2006CURRENT MARKET OUTLOOK
ANNUAL RANK GROWTH 1–10
GDP 5.4% 2RPKs 7.1% 2RTKs 9.1% 1
Value, $B 90 8New airplanes 1,030 8Regional jets 70 6Single aisle 750 6Twin aisle 200 7747 and larger 10 8
SOUTHWEST ASIA >>
DELIVERIES
TOTAL FLEET
2005 310 102025 1,140 8
SOUTHWEST ASIA (INCLUDING INDIA)
Global interest in liberalized markets is stimulating rapid air transport growth.
The largest air transport market in Southwest Asia is that of India, where government policy toward market liberalization has produced strong growth. Air travel in the Indian domestic market has grown rapidly as a result of fare dilution of 35 to 50 percent. Almost three-quarters of the requirement in the region will be for single-aisle aircraft, much of which is simply catching up from a decade of limited growth. The current order backlog for 370 jets is larger than the entire fleet in any of the past 20 years.1
28
Transfer from rail servicesIn 2005, domestic Indian air travel amounted to 22 billion RPKs. The 49,000-mile Indian rail network has for a long time been the only practical mode of intercity travel. Around 40 percent of the nearly 5 billion rail passengers each year travel on intercity services. If all premium class rail travelers (around 3 percent of total rail passengers) flew instead, this would represent a gain of around 5 to 10 billion RPKs in any year.
Investment in growthGlobal companies are particularly encouraged to outsource to the region, advancing the case for investment in the infrastructure necessary to support growing air services.
MARKET LIBERALIZATION >>
NUMBER OF AIRLINES IN INDIA
4
2
6
0
8
10
12
1985
1987
1989
1991
1993
1995
1997
1999
2001
2003
2005
Liberalized market >
40
80
GROWTH CATCHING UP >>
PASSENGER JETS IN INDIA
1985
1987
1989
1991
1993
1995
1997
1999
2001
2003
2005
120
160
200Current growth trend >
1990s growth trend >
1 Airclaims, August 2005.

ANNUAL RANK GROWTH 1–10
GDP 4.1% 5RPKs 5.5% 6RTKs 6.9% 4
Value, $B 160 6New airplanes 1,110 7Regional jets 60 8Single aisle 430 8Twin aisle 540 6747 and larger 80 6
MIDDLE EAST >>
DELIVERIES
TOTAL FLEET
2005 630 72025 1,300 7
MIDDLE EAST
Carefully planned economic development in concert with far-reaching global airline networks.
Emphasis on long-haul servicesThe Middle East region stretches from Egypt to Iran and includes the Arabian Gulf. Most countries are well developed, and their airlines have grown rapidly through use of a business model that could be described as providing independent global connectivity. As there are no internal markets in countries such as the UAE nations, Qatar, and Bahrain, highly effective liberal air service agreements have been used to gain access to international markets. Other airlines rely more on local service or to the neighboring continents of Africa, Europe, and Asia.
Services to Europe accounted for 36 percent of traffic in 2005, but a focus on growing longer haul routes will lead to a shift in share to Asia and North America, which will respectively grow to 38 percent and 14 percent of the market over 20 years. Demand for these services is reflected in an emphasis on long-range, twin-aisle airplanes in the current order backlog, as shown in the chart.
Ambitious growth plansThe ambitious development of centers of commerce and tourism, along with a modern air transport infrastructure, has been carefully coordinated to ensure sustainable growth. Much of the required labor originates from outside the region, particularly Southwest and Southeast Asia.
The competitive success of individual airlines has forced a refocusing of traditional state airline enterprises on specific hub operations or diversification to include independently branded lower cost short- or medium-haul products.
29
747 and largerTwin aisleSingle aisleRegional jets
350
250
300
150
200
100
50
0
TWIN AISLES DOMINANT >>
2005 fleet: 630 airplanes Backlog: 200 airplanes
FLEET AND ORDER BACKLOG
2%
49%
40%
9%
4% 9%
62%
25%

THE OUTLOOKBY REGION >>
THE BOEING COMPANY 2006CURRENT MARKET OUTLOOK
ANNUAL RANK GROWTH 1–10
GDP 2.9% 7RPKs 4.1% 9RTKs 5.7% 8
Value, $B 740 1New airplanes 9,490 1Regional jets 2,040 1Single aisle 5,880 1Twin aisle 1,410 2747 and larger 160 4
NORTH AMERICA >>
30
NORTH AMERICA
Structural shifts continue in the world’s largest air travel market.
World leader in passenger trafficThe sheer size of the North American market means that it will absorb the largest share of global demand for new airplanes, with 9,490 new deliveries forecast, or 35 percent of the world total. 62 percent of these will be single-aisle airplanes, and 17 percent will be twin aisles and large airplanes.
Fundamental shifts are under way in the North American market. Low-cost airlines continue to increase their market share.
Regional airlines are expanding with larger aircraft and network carriers are both using their assets more efficiently and shifting capacity from domestic to international routes to optimize earnings and margins.
Increasing use of airplane assetsLow-cost airlines produced a 20 percent share of domestic airline capacity (ASKs) in 2005, and hold nearly 60 percent of the firm order backlog for single-aisle airplanes. This demonstrates the strong growth in the low-cost airline sector. At the same time, network carriers with large fleets of single-aisle airplanes to be replaced and expanded have focused on making the most of their existing airplane assets by increasing utilization through better scheduling and reduced turntimes.
500
1,000
0
1,500
2,000
2,500
1996
1997
1998
1999
2000
2001
2002
2003
2004
2005
2006
AVERAGE AIRPLANE SEATS >>
60
80
40
100
120
140
1996
1997
1998
1999
2000
2001
2002
2003
2004
2005
2006
NUMBER OF NONSTOP MARKETS >>
DELIVERIES
TOTAL FLEET
2005 7,420 12025 13,590 1
INCREASE IN DOMESTIC NONSTOP MARKETS WITH SMALLER AIRPLANES
31
Network carriers will require large numbers of new airplane deliveries during the next 20 years.
Driven by the preference of many passengers for direct service, the lowest fares and a distinctive travel experience, U.S. low-cost airlines have innovated in areas such as focusing on Internet-based ticket sales, one-way pricing without restrictions, leather seats with free live television, buy-on-board meals, and other services.
Shifting capacity to international routesNetwork carriers will continue the redeployment of airplanes to international routes where the revenue environment has continued to be strong. They take advantage of liberalized air service agreements to make use of the intercontinental range capability of airplanes formerly used for domestic service, such as the 757 (550 airplanes in fleet) and 767 (345 airplanes). Current expansion is focused on Europe and South America.
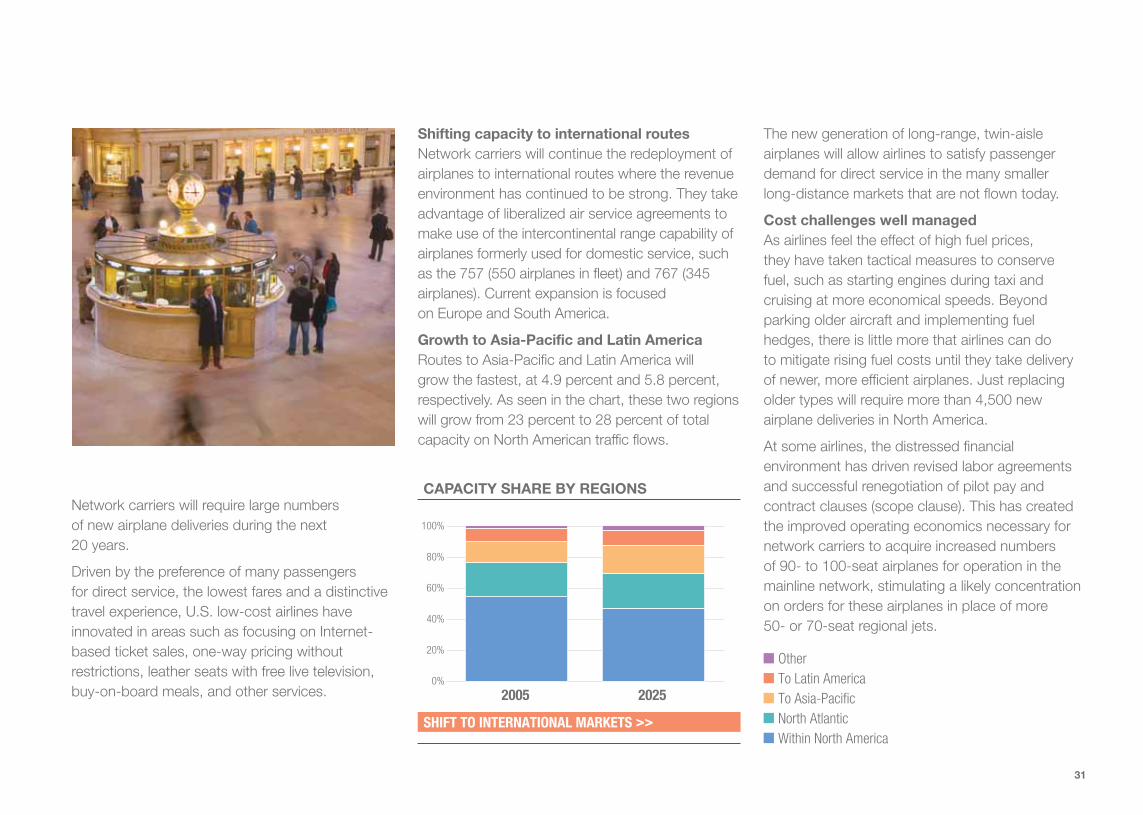
Growth to Asia-Pacific and Latin AmericaRoutes to Asia-Pacific and Latin America will grow the fastest, at 4.9 percent and 5.8 percent, respectively. As seen in the chart, these two regions will grow from 23 percent to 28 percent of total capacity on North American traffic flows.
The new generation of long-range, twin-aisle airplanes will allow airlines to satisfy passenger demand for direct service in the many smaller long-distance markets that are not flown today.
Cost challenges well managedAs airlines feel the effect of high fuel prices, they have taken tactical measures to conserve fuel, such as starting engines during taxi and cruising at more economical speeds. Beyond parking older aircraft and implementing fuel hedges, there is little more that airlines can do to mitigate rising fuel costs until they take delivery of newer, more efficient airplanes. Just replacing older types will require more than 4,500 new airplane deliveries in North America.
At some airlines, the distressed financial environment has driven revised labor agreements and successful renegotiation of pilot pay and contract clauses (scope clause). This has created the improved operating economics necessary for network carriers to acquire increased numbers of 90- to 100-seat airplanes for operation in the mainline network, stimulating a likely concentration on orders for these airplanes in place of more 50- or 70-seat regional jets.
SHIFT TO INTERNATIONAL MARKETS >>
CAPACITY SHARE BY REGIONS
OtherTo Latin AmericaTo Asia-PacificNorth AtlanticWithin North America
80%
60%
40%
20%
0%
2005 2025
100%

THE OUTLOOKBY REGION >>
THE BOEING COMPANY 2006CURRENT MARKET OUTLOOK
ANNUAL RANK GROWTH 1–10
GDP 2.1% 9RPKs 4.3% 8RTKs 5.4% 9
Value, $B 620 2New airplanes 6,600 2Regional jets 440 2Single aisle 4,530 2Twin aisle 1,460 1747 and larger 170 3
EUROPE >>
1Airline Business.
2 CIA/Wikipedia, at 2005 levels.
3 AEA, 1st half 2006.
DELIVERIES
TOTAL FLEET
2005 4,190 22025 7,720 2
32
EUROPE
Expansion moderating as new European Union member countries are consolidated.
Europe is home to the largest airline group in the world by revenues, the most profitable passenger airline in 2005 by absolute earnings, and the airline with the fourth highest operating margin.1 Both network and low-cost airline business models have been consistently profitable for larger airlines in European markets.
This is largely due to continual innovation in service development, pioneering use of technology to lower costs, and a focus on labor productivity driven by relatively high employment costs in much of Europe.
Airline capacity growth has been cautious, with traffic growing faster than capacity in every market. Record high load factors averaged 76 percent over the year 2005 for all markets.
The largest economic areaInfluence of the expanding European Union on the wider European region is profound as countries joining the Union have gained full access to the world’s largest single economic area. Economic growth will be stimulated as the less well off gain the opportunity to earn higher incomes elsewhere in the Union. The size of the EU population is two-thirds higher than that of the United States, and its share of world trade is disproportionately large at 44 to 52 percent depending on the class of trade measured.
The 2004 enlargement added 10 nations, 19 percent more people, and 10 percent more economic activity (GDP). If Turkey joins the European Union, which is possible by 2015, this will add a further 74 million people (15 percent) and $660 billion GDP (5 percent).2 It will also substantially change the ethnic mix and bring closer cultural ties to the Middle East.
Members prior to 200410 nations joined in 2004Joining in 2007Official candidate countriesPotential candidate countries
EXPANDING THE EUROPEAN UNION
POTENTIAL EUROPEAN UNION BY 2025 >>

33
Slower internal growthLooking into the next 20 years, a slowdown in traffic growth within Europe is expected. The additive effect of the recent and most significant European Union enlargement will lessen, while travel outside the region will continue to grow substantially. The fastest growing passenger traffic flows are currently to Latin America (up by 13 percent), Asia-Pacific (up 12 percent), and North Africa (up 8 percent).3
Migration of the workforce within Europe on a temporary basis (as often as weekly, even for those on low incomes) is in part facilitated by the affordability of travel on low-fare airlines and contributes to the growth of those carriers.
Central to intercontinental traffic flowsThe central position of Europe in traffic flows between major world regions and the long-standing strength of its world influence provide the opportunity for profitable service on both direct routes between emerging economic centers and connecting travelers between other continents.
Some European airlines have succeeded in subcontracting delivery of their mainline service to lower cost providers in specific market segments, such as on leisure-oriented routes or to developing nations. This has enabled them to continue selling flights into markets carrying higher commercial risk while maintaining profitable service.
Fleet emphasis on the middle marketThe single-aisle market will benefit from the move of many airlines up from the larger regional jets they have historically favored.
Although only a tiny proportion of the possible routes from Europe to Asia-Pacific are currently served, it is the world’s most developed market in that sense, showing a strong preference for nonstop connections (see page 19). Europe will take the largest number of twin-aisle airplanes smaller than the 747 (1,460 new deliveries) to support growth on these direct long-haul services.
Total fare from London to Warsaw
Mixed approach to chargesAll airlines give visibility of taxes and charges in advance of ticket purchases, with a careful balance struck between lower initial fares and additional charges.
Internet fare search and booking allows the consumer to make an informed choice between schedule and fare flexibility.
For a typical highly competitive route within Europe, the chart below on the left shows sample total prices paid for a one-way ticket, and that on the right illustrates the varying level of fees included.
CHEAPEST FARE AVAILABLE
300
250
200
150
100
50
0
TAXES AND CHARGES
INCLUDING TAXES AND CHARGES >> EXCLUDES BOOKING AND BAGGAGE FEES >>
One-
way
fare
, £
1 day ahead 1 week 1 month 6 months
BritishAirways
easyJet
WizzAir
LOTPoland
CentralWings
300
250
200
150
100
50
0
One-
way
fare
, £
BritishAirways
easyJet
WizzAir
LOTPoland
CentralWings

ANNUAL RANK GROWTH 1–10
GDP 3.8% 6RPKs 6.2% 3RTKs 6.1% 7
Value, $B 110 7New airplanes 1,680 5Regional jets 260 4Single aisle 1,220 4Twin aisle 190 8747 and larger 10 10
LATIN AMERICA >>
DELIVERIES
TOTAL FLEET
2005 1,100 32025 2,720 4
LATIN AMERICA
New low-fare airlines and market liberalization.
Fastest growth within the regionTraffic growth within Latin America (at around 7 percent each year) will continue to outpace traffic growth into the region. 90 percent of new deliveries are expected to be in the regional jet or single-aisle categories, as many new airlines have adopted a low-cost, low-fare model using standardized fleets of single-aisle airplanes.
Liberalization and an influx of private investment capital have benefited established network carriers in Brazil, Chile, and Panama, enabling expansion through subsidiary airlines in neighboring countries.
Volume traffic transfer from roadsIn the past six years, 2.5 million Mexican and 6 million Brazilian households have joined the middle class. Many of these people are transferring from bus to air travel due to the time savings for air travel compared to long, arduous bus trips as shown in the chart. Personal and business travelers will take advantage of growth in the flight network and as they do so will stimulate regional economies.
Foreign visitation will be a key influenceBusiness and tourism contribute to the growth of travel from outside Latin America, with foreign visitors increasing 7.9 percent in 2005 (compared to the world average of 5.6 percent). The region’s second largest tourist market, Brazil, is only a quarter the size of the largest, Mexico, but in 2005 grew by 12 percent, twice as fast as that in Mexico. Even the smaller market to Argentina boosted tourism earnings by more than 30 percent as foreign visitors flocked to attractions such as Buenos Aires, Patagonia, and the Iguaçu Falls.
Focus on single-aisle airplanesStrong internal markets will demand a focus on single-aisle airplanes, accounting for nearly three-quarters of future deliveries.
TRANSFERRING FROM BUS TO AIR TRAVEL
Bus travelAir travel
BRAZIL: BUS VERSUS AIRPLANE >>
100
80
60
40
20
0Rio de Janeiro–
São PauloRio de Janeiro–
SalvadorBelo Horizonte–
SalvadorSão Paulo–Porto Alegre
São Paulo–Brasilia
São Paulo–Curitiba
2 hr24 hr
2 hr23 hr
1.5 hr
18 hr2.5 hr
14 hr
1 hr6 hr
1 hr
6 hr
One-
way
fare
, US$
THE OUTLOOKBY REGION >>
THE BOEING COMPANY 2006CURRENT MARKET OUTLOOK
34
ANNUAL RANK GROWTH 1–10
GDP 4.4% 3RPKs 5.7% 4RTKs 4.8% 10
Value, $B 40 10New airplanes 430 10Regional jets 60 7Single aisle 250 9Twin aisle 110 10747 and larger 10 9
AFRICA >>
DELIVERIES
TOTAL FLEET
2005 720 62025 1,030 9
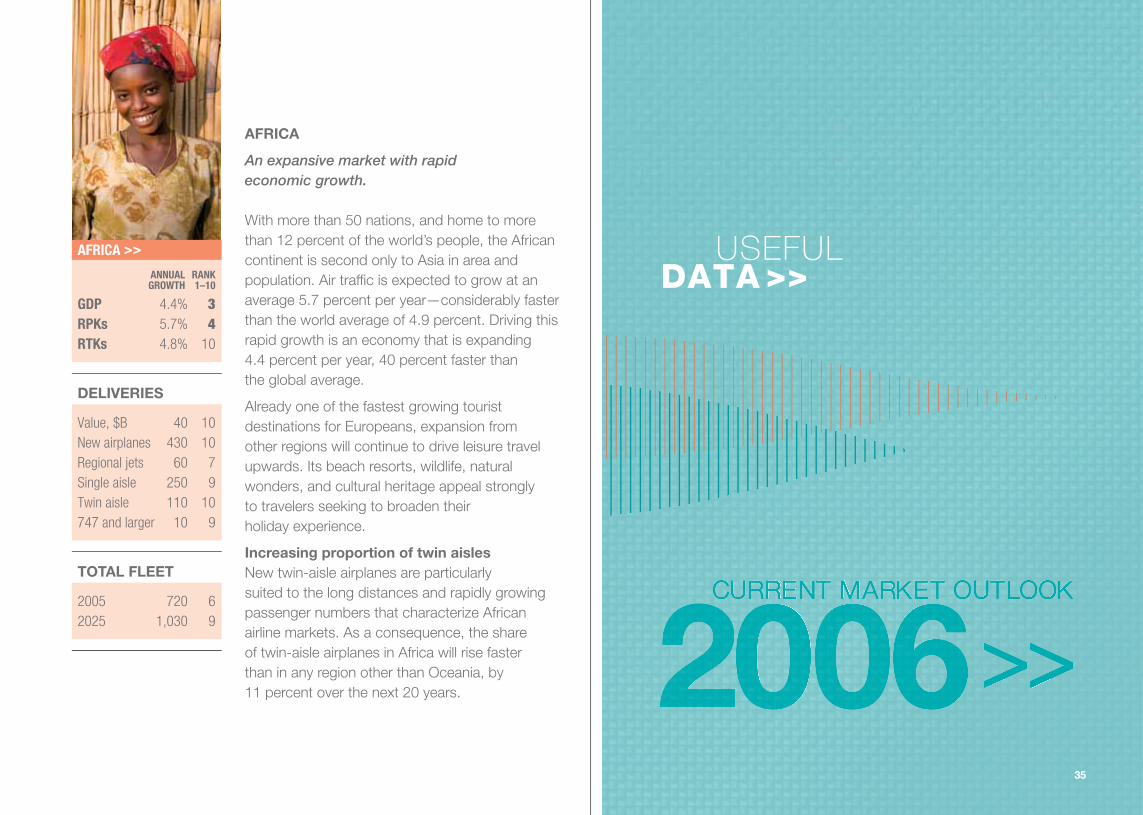
AFRICA
An expansive market with rapid economic growth.
With more than 50 nations, and home to more than 12 percent of the world’s people, the African continent is second only to Asia in area and population. Air traffic is expected to grow at an average 5.7 percent per year—considerably faster than the world average of 4.9 percent. Driving this rapid growth is an economy that is expanding 4.4 percent per year, 40 percent faster than the global average.
Already one of the fastest growing tourist destinations for Europeans, expansion from other regions will continue to drive leisure travel upwards. Its beach resorts, wildlife, natural wonders, and cultural heritage appeal strongly to travelers seeking to broaden their holiday experience.
Increasing proportion of twin aislesNew twin-aisle airplanes are particularly suited to the long distances and rapidly growing passenger numbers that characterize African airline markets. As a consequence, the share of twin-aisle airplanes in Africa will rise faster than in any region other than Oceania, by 11 percent over the next 20 years.
USEFULDATA >>
35

USEFULDATA >>
THE BOEING COMPANY 2006CURRENT MARKET OUTLOOK
PASSENGERTRAFFIC
World passenger traffic will grow
from 4,020 billion RPKs in 2005
to 10,550 billion in 2025.
36
WORLD TOTAL >> 1,573 2,182 2,567 3,381 3,290
GROWTH BY REGIONAL FLOW
RPKs in billions 1985 1990 1995 2000 2001 Africa–Africa 13.5 14.7 14.8 19.4 19.9 Africa–Europe 43.0 47.7 57.2 99.4 96.2 Africa–Middle East 5.2 7.4 6.5 9.8 10.6 Africa–North America 1.2 1.3 2.6 4.4 4.6 Africa–Southeast Asia 0.3 0.9 3.2 3.2 3.4 Central America–Central America 12.8 14.3 18.3 24.0 23.0 Central America–Europe 17.9 27.6 44.2 66.4 69.8 Central America–North America 43.3 63.7 71.1 90.1 88.6 Central America–South America 3.3 3.5 4.3 7.3 7.2 China–China 8.4 18.3 56.6 76.7 86.9 China–Europe 9.6 16.9 26.6 40.1 40.2 China–North America 7.8 13.4 21.6 33.2 36.2 China–Northeast Asia 6.8 10.9 16.0 19.4 18.4 China–Oceania 3.0 5.8 9.2 12.1 12.4 China–Southeast Asia 8.1 14.5 23.0 29.3 31.7 CIS Region–CIS Region 175.8 224.2 63.4 39.4 43.5 CIS Region–International 15.9 24.1 33.9 42.9 48.1 Europe–Europe 170.0 258.3 306.8 440.1 449.3 Europe–Middle East 43.4 41.5 44.9 65.0 59.8 Europe–North America 158.6 230.7 278.9 420.0 373.8 Europe–Northeast Asia 17.0 29.3 46.5 63.6 55.8 Europe–South America 12.2 22.3 32.9 53.2 52.1 Europe–Southeast Asia 26.6 46.4 65.9 95.8 95.9 Europe–Southwest Asia 11.9 17.5 20.7 26.2 27.5 Middle East–Middle East 17.7 19.5 20.7 27.8 27.1 Middle East–North America 5.0 6.6 10.3 16.1 12.0 Middle East–Northeast Asia 0.1 0.1 0.3 1.5 1.2 Middle East–Oceania 0.0 0.0 0.0 0.0 0.0 Middle East–Southeast Asia 15.1 11.0 20.6 24.0 22.9 Middle East–Southwest Asia 14.5 16.6 23.2 29.4 29.9 North America–North America 470.6 589.1 670.5 857.5 812.8 North America–Northeast Asia 46.9 95.2 121.5 140.2 127.5 North America–Oceania 11.0 19.0 24.1 30.0 27.6 North America–South America 14.5 19.6 35.9 47.2 44.8 North America–Southeast Asia 8.0 15.3 25.9 32.1 29.3 North America–Southwest Asia 0.0 0.0 0.0 0.0 0.0 Northeast Asia–Northeast Asia 32.3 50.0 67.4 79.0 80.2 Northeast Asia–Oceania 6.1 12.9 31.8 24.1 22.5 Northeast Asia–Southeast Asia 16.0 32.5 44.3 48.5 47.8 Oceania–Oceania 18.6 26.2 42.7 49.2 50.7 Oceania–Southeast Asia 12.2 24.3 33.1 46.2 47.6 South America–South America 29.5 33.8 39.7 53.5 50.8 Southeast Asia–Southeast Asia 17.7 29.9 53.8 53.7 57.0 Southeast Asia–Southwest Asia 5.7 5.8 8.1 10.9 11.6 Southwest Asia–Southwest Asia 10.5 11.6 15.2 16.0 16.6 Rest of the world 5.6 7.2 8.9 13.7 14.9

37
3,279 3,304 3,754 4,018 10,551 4.8 4.9
PERCENT PER YEAR
2002 2003 2004 2005 2025 1985–2005 2005–202521.2 22.5 24.0 28.1 91.8 3.7 6.197.2 99.1 105.2 112.5 298.6 4.9 5.013.2 13.9 13.9 16.4 53.5 5.9 6.14.3 4.4 3.9 3.8 15.6 5.8 7.43.6 3.7 3.9 4.7 16.6 15.2 6.5
23.4 24.8 26.0 26.8 103.6 3.8 7.068.1 69.8 75.7 79.6 184.7 7.8 4.387.7 92.0 103.5 109.1 243.7 4.7 4.1
7.1 7.1 8.3 9.6 33.1 5.5 6.4101.5 106.9 143.8 163.8 885.1 16.0 8.842.6 37.5 51.2 60.1 196.6 9.6 6.133.2 24.9 34.4 43.6 153.7 9.0 6.524.5 20.1 27.3 29.0 89.5 7.6 5.813.2 10.6 15.0 19.1 45.3 9.7 4.436.9 27.7 41.2 48.9 145.5 9.4 5.646.9 50.2 54.7 55.8 159.9 -5.6 5.451.4 56.4 63.0 65.5 180.6 7.3 5.2
453.8 474.7 521.2 557.2 1,087.5 6.1 3.458.6 58.9 67.7 78.5 204.4 3.0 4.9
346.0 349.5 375.7 387.7 935.0 4.6 4.553.3 48.3 59.8 60.9 188.1 6.6 5.849.2 49.5 57.9 69.7 215.1 9.1 5.896.4 95.0 104.5 110.6 282.6 7.4 4.827.6 29.5 35.7 43.0 130.3 6.7 5.727.5 28.1 32.0 34.6 91.8 3.4 5.010.4 9.6 12.6 14.4 46.3 5.4 6.0
1.2 1.2 2.2 3.6 11.6 21.9 6.00.4 1.2 4.1 4.5 21.5 0.0 8.2
24.0 26.4 29.2 30.5 89.0 3.6 5.531.1 33.8 35.6 37.9 121.6 4.9 6.0
783.5 828.3 927.7 954.6 1,936.6 3.6 3.6121.2 103.0 120.8 128.1 395.6 5.2 5.8
26.5 25.9 30.1 31.3 69.9 5.4 4.142.7 37.6 39.9 43.6 156.4 5.7 6.630.5 26.8 33.6 38.3 130.0 8.1 6.3
0.0 0.0 1.5 2.0 22.3 0.0 12.885.0 86.1 83.6 83.1 238.0 4.8 5.424.5 22.8 27.1 25.7 70.9 7.5 5.254.4 45.7 61.5 70.2 200.8 7.7 5.450.2 55.5 58.8 63.0 95.5 6.3 2.146.6 42.0 54.6 58.6 138.7 8.2 4.452.7 47.9 52.9 59.3 225.0 3.6 6.960.6 59.4 73.9 84.4 260.6 8.1 5.812.6 12.5 14.9 18.9 63.0 6.2 6.217.4 17.7 21.3 24.4 134.5 4.3 8.915.2 15.8 18.8 23.1 91.1 7.3 7.1

USEFULDATA >>
THE BOEING COMPANY 2006CURRENT MARKET OUTLOOK
FLEET SIZE ANDDEVELOPMENT
The fleet, including freighters,
will grow from 17,330 to 35,970
airplanes by 2025.
38
FLEET BY SIZE
End of year 2005 2005 2025 2025
Size Airplanes in Fleet Airplanes in Fleet category service share service share
Total regional jets 2,710 16% 5,040 14%
Single aisle 90 to 175 seats 9,040 52% 18,560 52% More than 175 seats 1,540 9% 2,910 8%
Total single aisle 10,580 61% 21,470 60%
Twin aisle Small 1,800 10% 4,390 12% Medium 1,270 7% 3,680 10% Large 970 6% 1,390 4%
Total twin aisle 4,040 23% 9,460 26%
TOTAL FLEET >> 17,330 100% 35,970 100%
SINGLE AISLE
Regional jets Fokker 70, F28 BAe 146-100, -200 Avro RJ70, RJ85 Bombardier CRJ Embraer 170, 175 ERJ-135, -140, -145
90 to 175 seats Boeing 717-200, 727 Boeing 737-100 through -500 Boeing 737-600, -700, -800 Airbus A318, A319, A320 Boeing/MDC DC-9, MD-80, MD-90 Fokker 100 BAe 146-300 Avro RJ100 Embraer 190, 195
More than 175 seats Boeing 707, 757 Boeing 737-900 Airbus A321 Boeing/MDC DC-8
TWIN AISLE
Small 2 class: 230 to 310 seats 3 class: 180 to 250 seats
Boeing 767, 787 Airbus A300, A310, A330-200 Airbus A350 Boeing/MDC DC-10 Lockheed L-1011
Medium 2 class: 310 to 400 seats 3 class: 250 to 370 seats
Boeing 777 Airbus A330-300, A340, A350 Boeing/MDC MD-11
Large 3 class: more than 400 seats
Boeing 747 Airbus A380
Bold: In production or launched.
39
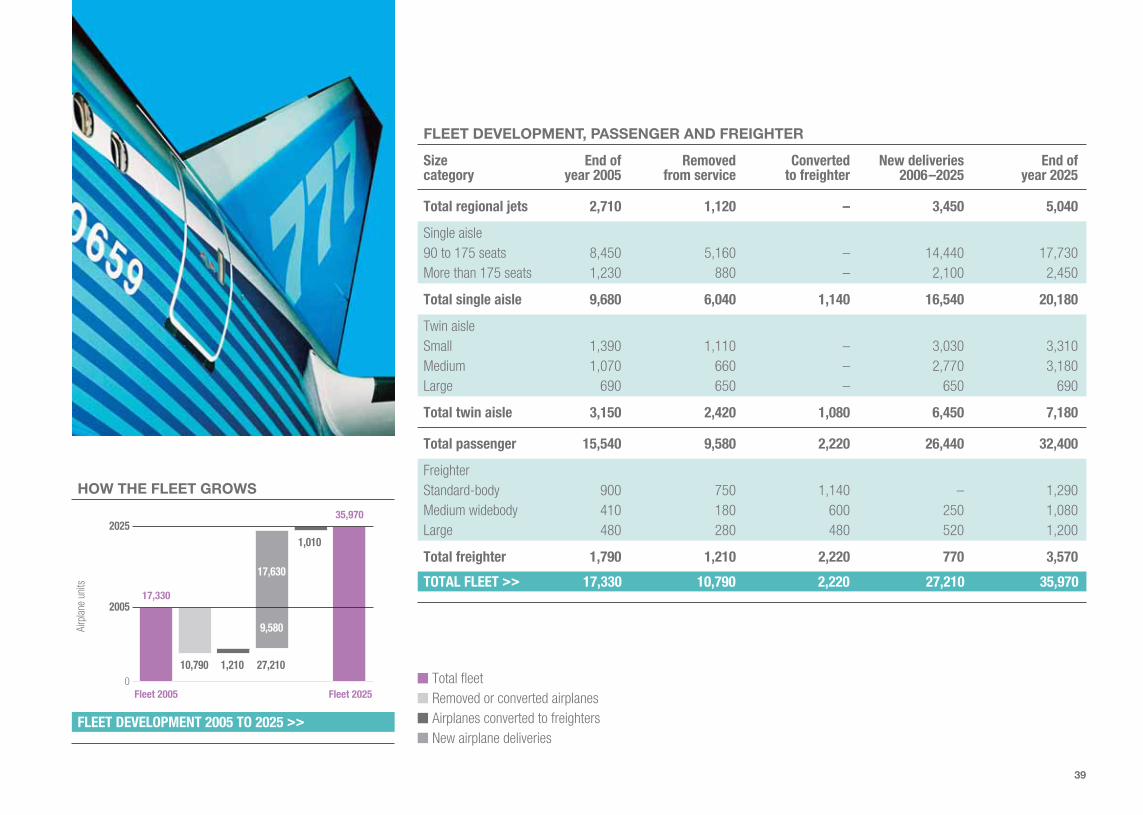
FLEET DEVELOPMENT, PASSENGER AND FREIGHTER
Size End of Removed Converted New deliveries End of category year 2005 from service to freighter 2006–2025 year 2025
Total regional jets 2,710 1,120 – 3,450 5,040
Single aisle 90 to 175 seats 8,450 5,160 – 14,440 17,730 More than 175 seats 1,230 880 – 2,100 2,450
Total single aisle 9,680 6,040 1,140 16,540 20,180
Twin aisle Small 1,390 1,110 – 3,030 3,310 Medium 1,070 660 – 2,770 3,180 Large 690 650 – 650 690
Total twin aisle 3,150 2,420 1,080 6,450 7,180
Total passenger 15,540 9,580 2,220 26,440 32,400
Freighter Standard-body 900 750 1,140 – 1,290 Medium widebody 410 180 600 250 1,080 Large 480 280 480 520 1,200
Total freighter 1,790 1,210 2,220 770 3,570
TOTAL FLEET >> 17,330 10,790 2,220 27,210 35,970
10,790 1,210 27,210
9,580
17,630
0
2005
2025
17,330
35,970
1,010
Total fleetRemoved or converted airplanesAirplanes converted to freightersNew airplane deliveries
FLEET DEVELOPMENT 2005 TO 2025 >>
HOW THE FLEET GROWS
Airp
lane
uni
ts
Fleet 2005 Fleet 2025

40
DELIVERIES BY SIZE
2006–2025 Market value Market share Deliveries Market share
Size category 2005 $B $ value New airplanes Units
Regional jets 90 4% 3,450 13%
Single aisle 90 to 175 seats 890 34% 14,440 53% More than 175 seats 190 7% 2,100 8%
Total single aisle 1,080 41% 16,540 61%
Twin aisle Small 520 20% 3,270 12% Medium 650 25% 2,960 11% Large 260 10% 990 3%
Total twin aisle 1,430 55% 7,220 26%
TOTAL >> 2,600 100% 27,210 100%
USEFULDATA >>
THE BOEING COMPANY 2006CURRENT MARKET OUTLOOK
NEW AIRPLANEDELIVERIES
Single-aisle airplanes account
for the most deliveries, 61 percent.
Twin-aisle airplanes account for the
highest market value, 55 percent.

41
DELIVERIES BY REGION
Size category Asia-Pacific North America Europe Middle East Latin America Africa World
Regional jets 580 2,040 450 60 260 60 3,450
Single aisle 4,230 5,880 4,530 430 1,220 250 16,540
Twin aisle 2,520 1,410 1,460 540 190 110 6,230
747 and larger 570 160 160 80 10 10 990
TOTAL DELIVERIES >> 7,900 9,490 6,600 1,110 1,680 430 27,210
Delivery numbers above 20 are rounded to the nearest 10.
MARKET VALUE BY REGION
Size category Asia-Pacific North America Europe Middle East Latin America Africa World
Regional jets 15 50 12 2 6 2 90
Single aisle 280 380 300 30 70 17 1,080
Twin aisle 480 270 260 110 30 20 1,170
747 and larger 150 40 50 20 1 2 260
MARKET VALUE >> $930 $740 $620 $160 $110 $40 $2,600
Market value is in dollars in billions, and numbers above 20 are rounded to the nearest 10.

USEFULDATA >>
THE BEING COMPANY 2006CURRENT MARKET OUTLOOK
TRAFFIC ANDGROWTH
Relatively slow growth in the
largest markets can generate
more traffic than rapid growth in
many of the smaller markets.
42
Traf
fic b
etw
een
regi
ons
in 2
005 Traffic betw
een regions in 2025
2,370
Asia-Pacific
240
270
2
80
5
690
1,940
750
NorthAmerica
390
150
14
4
950
1,090
800
940
Europe
150
80
110
560
360
9
400
400
LatinAmerica
–
2
100
90
240
50
200
–
MiddleEast
16
30
90
17
16
300
9
50
Africa
30
PASSENGER TRAFFIC WITHIN AND BETWEEN REGIONS
Traffic within regions in 2005, RPKs (billions)
Traffic within regions in 2025, RPKs (billions)

43
Hist
oric
gro
wth
bet
wee
n re
gion
s Future growth betw
een regions
6.4%
Asia-Pacific
6.1%
7.5%
14.5%
4.9%
11.4%
8.1%
3.6%
5.9%
NorthAmerica
4.6%
5.0%
5.4%
5.8%
3.6%
3.4%
5.5%
4.5%
Europe
8.3%
3.0%
4.9%
6.1%
6.9%
8.8%
4.9%
5.1%
LatinAmerica
–
2.9%
3.8%
5.0%
6.0%
6.0%
4.9%
–
MiddleEast
5.9%
3.4%
6.1%
6.3%
7.4%
5.0%
8.7%
6.1%
Africa
3.7%
PASSENGER TRAFFIC GROWTH RATES WITHIN AND BETWEEN REGIONS
Historic growth within regions, 1985–2005
Future growth within regions, 2005–2025
HOW TO READ THE TABLES
Look up from the region name and across for future data or down and across for historic data.
For example• 2025 traffic within Asia-Pacific will be 2,370 billion RPKs.
• 2005 traffic between Europe and Africa was 110 billion RPKs.
• Future growth between Asia-Pacific and Europe is 5.5 percent.
• Past growth between North America and Middle East was 5.4 percent.
Because growth between Latin America and the Middle East is at an early stage of development, the data available is insufficient to represent in these tables.
44
GLOSSARY
ASK: Available seat-kilometers. The number of seats on an airplane multiplied by the number of kilometers flown by that airplane (i.e., airline capacity).
CIS: Commonwealth of Independent States. The former Soviet Union, with the addition of Mongolia and exception of the Baltic states.
GDP: Gross domestic product. The total output of goods and services produced within a country.
Liberalization: The removal or reduction in government-imposed regulation of the market for air services. Also known as deregulation.
Load factor: The measure of how full flights are. The number of fare-paying passengers divided by the total number of seats on that flight.
RPK: Revenue passenger-kilometers. The number of fare-paying passengers multiplied by the number of kilometers they fly (i.e., airline traffic).
Yield: Revenues divided by revenue passenger-kilometers (i.e., the money received by an airline for each kilometer flown by each passenger).
EXAMPLES
Capacity: If an airplane with 100 seats flies 1000 km, a capacity of 100 x 1000 = 100 000 available seat-kilometers (ASK) is generated by that flight.
Load factor: If 76 fare-paying passengers are on the airplane, 76% of the seats available will be occupied, which represents the load factor of the flight.
Traffic: The traffic generated by the 76 passengers on the 1000-km flight will be 76 x 1000 = 76 000 revenue passenger-kilometers (RPK).
Yield: If the average net fare received from each of the 76 passengers is $200, the yield is $200/1000 = $0.20 per passenger-kilometer.
PHOTO CREDITS
David Morrell ..........................pages 12 and 13
Massimo Pesenti ................................. page 10
Anthony Ponton........................pages 8 and 42
DATA SOURCES
ACAS
Airclaims
Air Transport Association
Association of Asia Pacific Airlines (AAPA)
Association of European Airlines (AEA)
Boeing primary research
European Regions Airline Association (ERA)
Global Insight
International Air Transport Association
International Civil Aviation Organization (ICAO)
Jet Information Services
Official Airline Guide (OAG)
Regional Airlines Association (RAA)
ROM Associates
U.S. Department of Transportation (Form 41)
Historical data are in some cases estimates based on Boeing analysis. Data for 2005 may be subject to revision.


Printed in U.S.A. CMO68247 09/06
The statements contained herein are based on good faith assumptions and provided for general informationpurposes only. These statements do not constitute an offer, promise, warranty, or guarantee of performance.Actual results may vary depending on certain events or conditions. This document should not be used or relied upon for any purpose other than that intended by Boeing.
Boeing Commercial AirplanesMarket AnalysisP.O. Box 3707, MC 21-28Seattle, WA 98124-2207 USAwww.boeing.com/commercial/cmo
Boeing is a trademark of Boeing Management Company. Copyright © 2006 Boeing. All rights reserved.