Embed Size (px)
Citation preview
MEDIA RELEASE 15 November 2018
FURTHER COPPER AND GOLD MINERALISATION IDENTIFIED AT CHICKEN RANCH AND MINYARI DOME
HIGHLIGHTS
• High‐grade and shallow gold mineralisation remains open along strike at Chicken Ranch, with recent intercepts including:
• 3.0m at 4.05 g/t gold from 63m down hole in 18CRC0011; and
• 13.0m at 1.43 g/t gold from 47m down hole in 18CRC0001.
• Reconnaissance drilling at Minyari Dome has identified new zones of gold and copper mineralisation, including:
• 4.0m at 1.02 g/t gold from 60m down hole in 18MYC0176; and
• 1.0m at 1.47 g/t gold from 104m down hole in 18MYC0174.
• Antipa continues to prioritise the eleven recently identified, priority one electromagnetic conductor targets, within the highly prospective and shallow El
Paso Structural Corridor.
OVERVIEW
Antipa Minerals Limited (ASX: AZY) (“Antipa”, “the Company”) is pleased to provide an update on further results from the recent air core and reverse circulation (“RC”) drilling at the Chicken Ranch prospect and RC drilling at Minyari Dome, that form part of its 100%‐owned Paterson and North Telfer Projects respectively together with further information on the previously identified electromagnetic conductivity targets in the El Paso Structural Corridor. Antipa’s Chicken Ranch deposit and Minyari Dome resources are located 15 and 40km respectively from Newcrest Mining Ltd’s Telfer gold mine and approximately 100km from Rio Tinto’s newly established exploration camp in Western Australia’s Paterson Province (Figure 5).
CHICKEN RANCH AREA
Chicken Ranch
The Chicken Ranch air core programme (195 drill holes for 10,105m) was focused on identifying new mineralisation in proximity to the existing (historic) high‐grade gold mineralisation, including parallel trends (Figures 1 and 2). In addition to the air core programme, Antipa completed an initial RC programme at Chicken Ranch (16 drill holes for 2,058m) focussed on the immediate resource growth opportunity. Results for the final 60 air core and initial 16 RC drill holes have been received and include:
13.0m at 1.43 g/t gold from 47m down hole in 18CRC0001, including:
1.0m at 6.64 g/t gold from 53m.
3.0m at 4.05 g/t gold from 63m down hole in 18CRC0011, including:
1.0m at 7.88 g/t gold from 63m.
2.0m at 2.77 g/t gold from 27m down hole in 18CRC0011, including:
1.0m at 4.53 g/t gold from 27m.
Available results together with historical drill intersections confirm the high‐grade gold potential of the Chicken Ranch area, positioned just 25km south of the Company’s existing
Minyari Dome Mineral Resources. The Company will focus on delivering a maiden Mineral Resource for the Chicken Ranch deposit during the first quarter of 2019. Refer to Figures 1 and 2 for plan views summarising the drilling results and Table 1a and Tables 2a‐b for drill hole intersection and collar details. In addition, the Company has recently completed follow‐up RC drilling (4 holes for 475m), with results for these drill holes expected within the next few weeks. Antipa would like to acknowledge the Western Australia Government’s Exploration Incentive Scheme (EIS), through which it secured co‐funding grants totalling up to $149,500 for up to 4,600m of the 2018‐19 Chicken Ranch RC drilling. Turkey Farm
In other exploration activities undertaken across the broader Chicken Ranch area, a prospecting exercise identified significant coarse gold, including gold nuggets, within surface laterite (oxide) material at the Company’s Turkey Farm prospect located just 1km west of the Chicken Ranch deposit (refer to Figures 2 and 4a‐b). The identification of coarse gold in combination with significant historic drill intersections grading up to 12.1 g/t gold, from broad 200m spaced drill holes, confirms the Company’s view on prospectivity, including the potential for additional shallow gold resources.
MINYARI DOME
The initial phase of the Minyari Dome 2018 RC drill programme consisted of 45 RC drill holes for 7,241m and was focused on identifying new mineralisation in close proximity to the existing high‐grade 723,000 ounce gold, 26,400 tonne copper and 4,000 tonne cobalt Mineral Resources1 of Minyari and WACA (Figure 3). Results have now been received for a further 18 RC holes, which tested various targets within 130m to 7.2km of the defined Minyari Dome resources. Refer to Figure 3 for a plan view summarising the drilling results and Table 1b and Tables 2c for drill hole intersection and collar details. Minyari North
Highlights of Minyari North drilling include:
A new zone of gold mineralisation at Minyari North has been identified approximately 720m north of the current Minyari resource. While the target remains preliminary in nature, mineralisation appears to remain open along strike and requires follow up drilling, key intercepts include:
4.0m at 1.02 g/t gold from 60m down hole in 18MYC0176; and
1.0m at 1.47 g/t gold from 104m down hole in 18MYC0174. Gonzo
Following from eight shallow air core drill holes (i.e. five historic and three 2017 holes) the company has identified a new zone of copper + gold‐cobalt‐silver mineralisation at depth and approximately 1.6km northwest of the defined Minyari resource. Drill hole 18MYC0171 is
1 Refer to Minyari Deposit and WACA Deposit Mineral Resource Statement in the Competent Persons Statement section of this document.
2
located on the north‐eastern edge of the Gonzo co‐incident AEM conductivity and magnetic anomaly which measures approximately 500m by 220m (Figure 3) and returned:
3m at 0.36% copper and 0.10 g/t gold from 213m down hole in 18MYC0171, including:
1m at 0.78% copper, 0.18 g/t gold, 0.04% cobalt and 2.24 g/t silver. The Company’s review of the Gonzo target is ongoing. Recent drill results that identify new zones of potentially significant mineralisation in combination with previously reported high‐grade results (see ASX releases 1 August and 2 October 2018) including 18m at 3.05g/t gold, 0.32% copper and 0.05% cobalt from 47m at Minyari South and at Judes 45m at 0.56% copper, 0.10 g/t gold and 2.21 g/t silver from 72m including 10m at 2.05% copper, 0.19 g/t gold and 9.11 g/t silver from 106m, highlight the potential to add new zones of high‐grade gold‐copper resource across the Minyari Dome. In addition, the Company has recently completed follow‐up RC drilling (5 holes for 605m), with results for these drill holes expected within the next few weeks. Antipa would like to acknowledge the Western Australia Government’s Exploration Incentive Scheme (EIS), through which it secured co‐funding grants totalling up to $298,000 for up to 8,000m of the 2018 Minyari Dome RC drilling.
EL PASO ELECTROMAGNETIC TARGETS
The previously announced aerial electromagnetic (“AEM”) survey (dated 15 October 2018) covered a total strike length of 70km across the highly prospective El Paso Structural Corridor and identified a total of eleven high priority EM conductivity targets for further exploratory work. The Company has since had the opportunity to further prioritise these targets and undertake additional field‐based activities, including establishing access tracks. The exploration work programme involves ongoing drill planning, completion of a heritage survey during November and subsequent drill programmes. The current timeline envisages the completion of an air core drill programme during the first quarter of 2019 and, contingent upon results, a follow‐up RC drill programme. AEM has been instrumental in several significant Paterson Province discoveries and this is the first geophysical survey of this type over this area.
Ongoing exploration activities at the Company’s Paterson Province Projects this year include:
Awaiting assays for first tranche of RC drill holes at Tim’s Dome and follow‐up RC holes at both Minyari Dome and Chicken Ranch;
Aerial EM target drill planning including heritage survey;
Turkey Farm prospect drill planning including heritage survey; and
3D geological modelling and Mineral Resource estimation. For further information, please visit www.antipaminerals.com.au or contact:
Roger Mason Managing Director Antipa Minerals Ltd +61 (0)8 9481 1103
Stephen Power Executive Chairman Antipa Minerals Ltd +61 (0)8 9481 1103
Luke Forrestal Senior Account Director Media & Capital Partners +61 (0)8 9389 4270
3
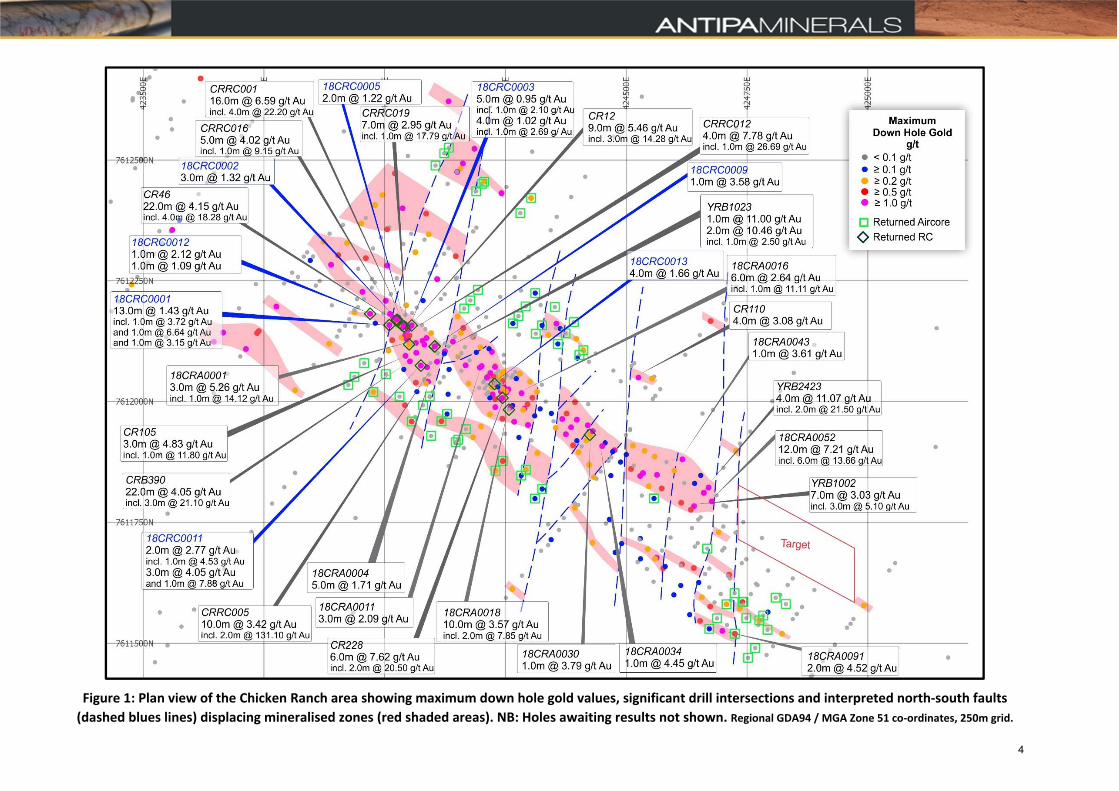
Figure 1: Plan view of the Chicken Ranch area showing maximum down hole gold values, significant drill intersections and interpreted north‐south faults
(dashed blues lines) displacing mineralised zones (red shaded areas). NB: Holes awaiting results not shown. Regional GDA94 / MGA Zone 51 co‐ordinates, 250m grid.
4
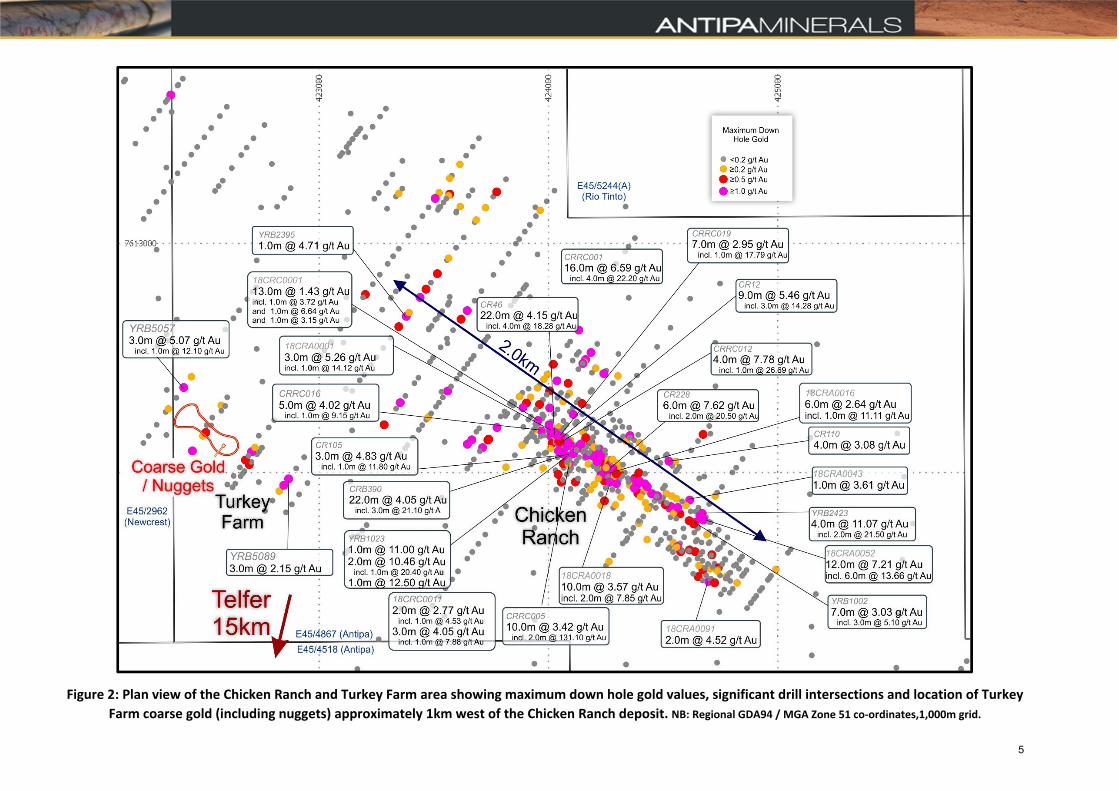
Figure 2: Plan view of the Chicken Ranch and Turkey Farm area showing maximum down hole gold values, significant drill intersections and location of Turkey
Farm coarse gold (including nuggets) approximately 1km west of the Chicken Ranch deposit. NB: Regional GDA94 / MGA Zone 51 co‐ordinates,1,000m grid.
5
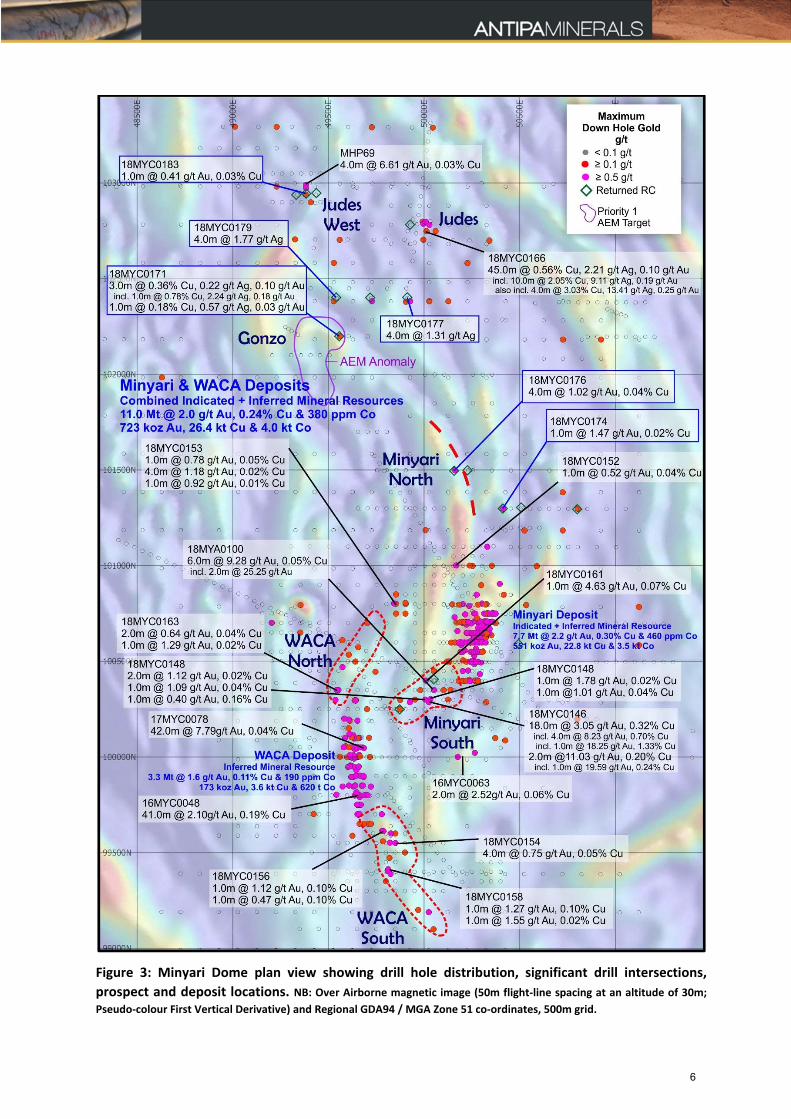
Figure 3: Minyari Dome plan view showing drill hole distribution, significant drill intersections,
prospect and deposit locations. NB: Over Airborne magnetic image (50m flight‐line spacing at an altitude of 30m;
Pseudo‐colour First Vertical Derivative) and Regional GDA94 / MGA Zone 51 co‐ordinates, 500m grid.
6
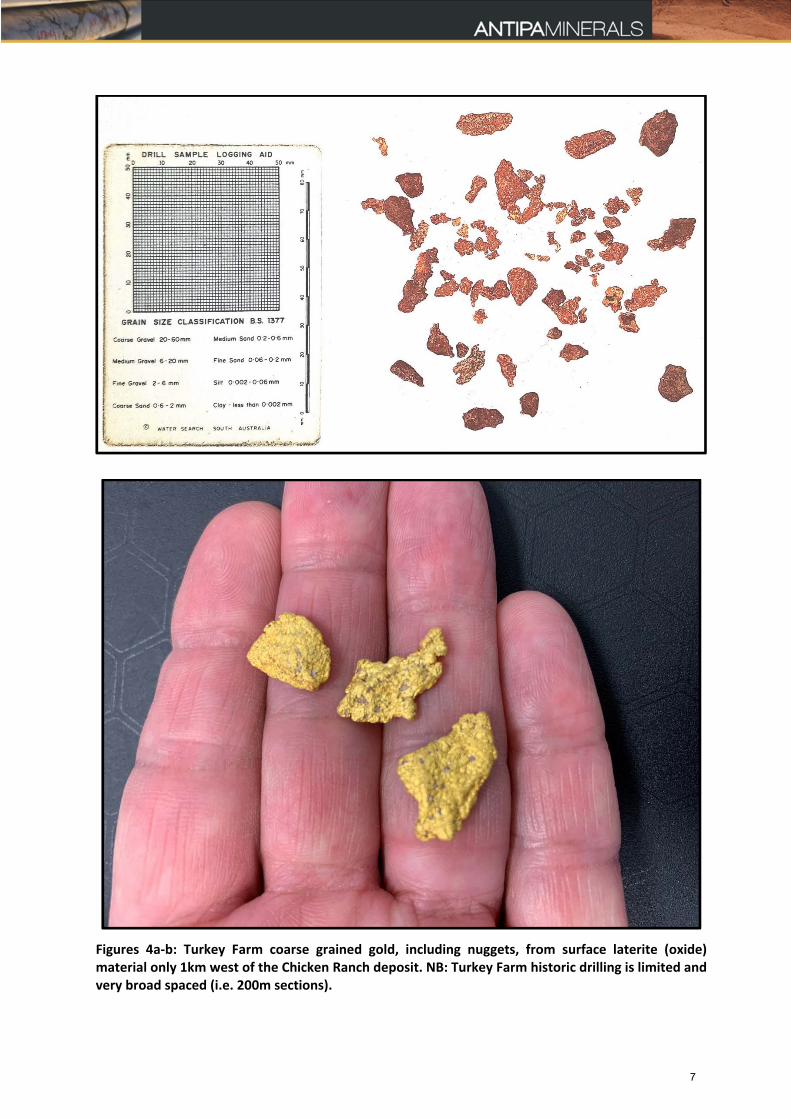
Figures 4a‐b: Turkey Farm coarse grained gold, including nuggets, from surface laterite (oxide) material only 1km west of the Chicken Ranch deposit. NB: Turkey Farm historic drilling is limited and very broad spaced (i.e. 200m sections).
7
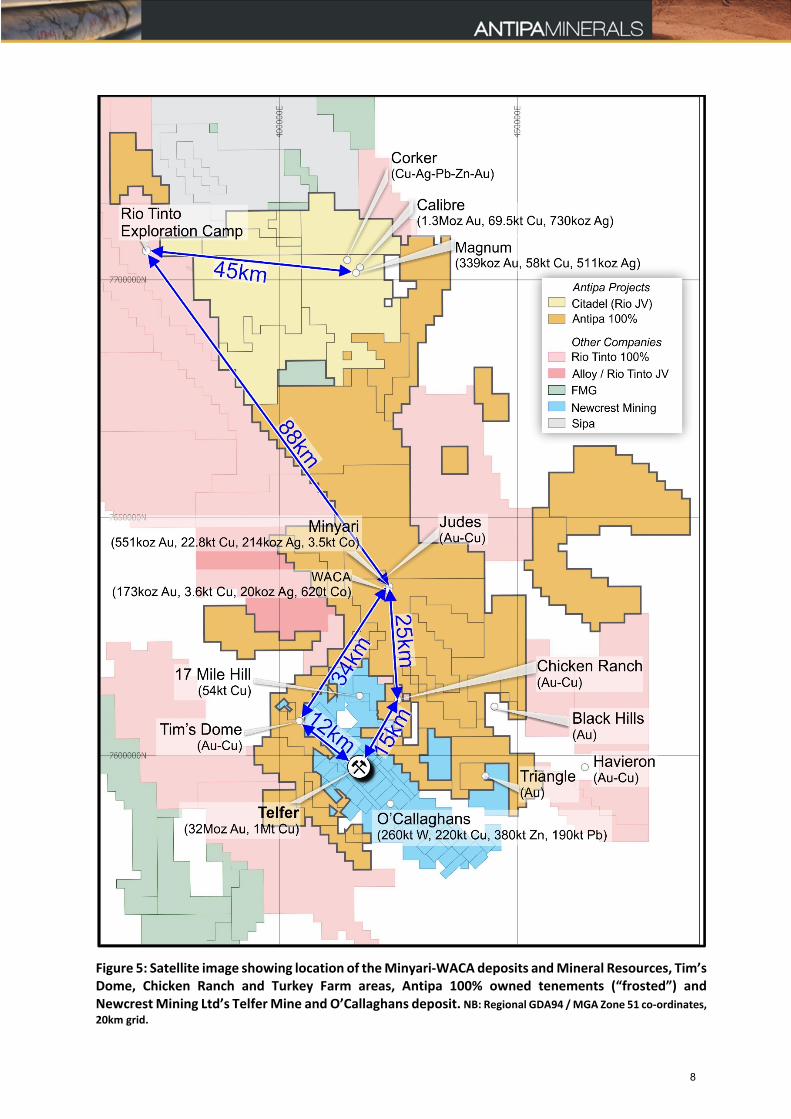
Figure 5: Satellite image showing location of the Minyari‐WACA deposits and Mineral Resources, Tim’s Dome, Chicken Ranch and Turkey Farm areas, Antipa 100% owned tenements (“frosted”) and Newcrest Mining Ltd’s Telfer Mine and O’Callaghans deposit. NB: Regional GDA94 / MGA Zone 51 co‐ordinates,
20km grid.
8
About Antipa Minerals:
Antipa Minerals Ltd is an Australian public company which was formed with the objective of identifying under‐explored mineral projects in mineral provinces which have the potential to host world‐class mineral deposits, thereby offering high leverage exploration and development potential. The Company owns 5,785km2 of tenements in the Paterson Province of Western Australia, including a 1,335km2 package of prospective granted tenements known as the Citadel Project. The Citadel Project is located approximately 75km north of Newcrest’s Telfer Gold‐Copper‐Silver Mine and includes the gold‐copper‐silver±tungsten Mineral Resources at the Calibre and Magnum deposits and high‐grade polymetallic Corker deposit. Under the terms of a Farm‐in and Joint Venture Agreement with Rio Tinto Exploration Pty Limited (“Rio Tinto”), a wholly owned subsidiary of Rio Tinto Limited, Rio Tinto can fund up to $60 million of exploration expenditure to earn up to a 75% interest in Antipa’s Citadel Project.
The Company has an additional 1,310km2 of granted exploration licences, known as the North Telfer Project which hosts the high‐grade gold‐copper Minyari and WACA Mineral Resources and extends its ground holding in the Paterson Province to within 20km of the Telfer Gold‐Copper‐Silver Mine and 30km of the O’Callaghans tungsten and base metal deposit. The Company has also acquired, from the Mark Creasy controlled company Kitchener Resources Pty Ltd, additional exploration licences in the Paterson Province which cover 831km2 and the Company owns a further 312km2 of exploration licences (including both granted tenements and applications), which combined are known as the Paterson Project, which comes to within 3km of the Telfer Mine and 5km of the O’Callaghans deposit.
9
Competent Persons Statement – Exploration Results:
The information in this report that relates to the Exploration Results is based on and fairly represents information and supporting documentation compiled by Mr Roger Mason, a Competent Person who is a Member of The Australasian Institute of Mining and Metallurgy. Mr Mason is a full‐time employee of the Company. Mr Mason is the Managing Director of Antipa Minerals Limited, is a substantial shareholder of the Company and is an option holder of the Company. Mr Mason has sufficient experience relevant to the style of mineralisation and type of deposit under consideration and to the activity being undertaking to qualify as a Competent Person as defined in the 2012 Edition of the ‘Australasian Code for Reporting of Exploration Results, Mineral Resources and Ore Reserves’. Mr Mason consents to the inclusion in the report of the matters based on his information in the form and context in which it appears.
Competent Persons Statement – Mineral Resource Estimations for the Minyari‐WACA Deposits:
The information in this report that relates to relates to the estimation and reporting of the Minyari‐WACA deposits Mineral Resources is extracted from the report entitled “Minyari/WACA Deposits Maiden Mineral Resources” created on 16 November 2017, which is available to view on www.antipaminerals.com.au and www.asx.com.au. The Company confirms that it is not aware of any new information or data that materially affects the information included in the original market announcements. The Company confirms that the form and context in which the Competent Person’s findings are presented have not been materially modified from the original market announcements.
For completeness, the current Minyari Deposit and WACA Deposits Mineral Resource Statement is reproduced below:
Deposit and Au Cut-off Grade*
Resource Category
Tonnes (kt)
Au (g/t)
Cu (%)
Ag (g/t)
Co (ppm)
Au (oz) Cu (t) Ag (oz) Co (t)
Minyari 0.5 Au Indicated 3,160 1.9 0.30 0.7 590 193,000 9,500 75,700 1,860Minyari 0.5 Au Inferred 660 1.7 0.24 0.6 340 36,300 1,600 13,400 230
Minyari 0.5 Au Sub-Total 3,820 1.9 0.29 0.7 550 229,300 11,100 89,100 2,090
Minyari 1.7 Au Indicated 230 2.6 0.29 0.9 430 18,800 700 6,800 100Minyari 1.7 Au Inferred 3,650 2.6 0.30 1.0 370 302,400 10,900 117,200 1,360
Minyari 1.7 Au Sub-Total 3,870 2.6 0.30 1.0 380 321,200 11,600 124,000 1,450
Minyari Total 7,700 2.2 0.29 0.9 460 550,500 22,700 213,100 3,540
WACA 0.5 Au Inferred 2,780 1.4 0.11 0.2 180 122,000 3,100 15,900 490WACA 1.7 Au Inferred 540 2.9 0.10 0.2 230 50,900 500 3,800 120
WACA Total 3,320 1.6 0.11 0.2 190 172,800 3,700 19,700 620
Minyari +
WACA Deposits
Grand Total
11,020 2.0 0.24 0.7 380 723,300 26,400 232,800 4,160
*0.5 Au = Using a 0.5 g/t gold cut-off grade above the 50mRL (NB: potential “Open Cut” cut-off grade)
*1.7 Au = Using a 1.7 g/t gold cut-off grade below the 50mRL (NB: potential “Underground” cut-off grade)
Various information in this report which relates to Chicken Ranch Exploration Results have been extracted from the following announcements:
Report entitled “Antipa Secures High Grade Chicken Ranch Deposit” created on 2 August 2017;
Report entitled “Antipa to Commence Major Exploration Programme” created on 1 June 2018;
Report entitled “RIU Explorers Conference Presentation” created on 27 March 2018;
Report entitled “Updated Corporate Presentation April 2018” created on 12 April 2018;
Report entitled “WA Govt Exploration Drilling Grants increase to $710,000” created on 31 May 2018;
Report entitled “Major Exploration Campaign Commences” created on 25 June 2018;
Report entitled “2018 Exploration Programme Update” created on 16 July 2018;
Report entitled “2018‐19 Exploration Programme Overview and Update ‐ August” created on 15 August 2018; and
Report entitled “Further High‐Grade Gold Mineralisation at Chicken Ranch” created on 19 September 2018.
10
Various information in this report which relates to Minyari Dome Ranch Exploration Results have been extracted from the following announcements:
Report entitled “North Telfer Project Update on Former NCM Mining Leases” created on 3 December 2015;
Report entitled “High Grade Gold Mineralisation at Minyari Dome” created on 8 February 2016;
Report entitled “Minyari Deposit Drilling to Commence May 2016” created on 2 May 2016;
Report entitled “Minyari Phase 1 Drilling Commences” created on 2 June 2016;
Report entitled “Further Historical High‐grade Gold Intersections at Minyari” created on 14 June 2016;
Report entitled “Minyari Reprocessed IP Survey Results” created on 5 July 2016;
Report entitled “Minyari Phase 1 Drilling Update No. 1” created on 20 July 2016;
Report entitled “Completion of Phase 1 Minyari Deposit RC Drilling Programme” created on 9 August 2016;
Report entitled “Minyari Drilling Update No. 3” created on 17 August 2016;
Report entitled “New Gold Opportunity ‐ Tim's Dome South” created on 22 September 2016;
Report entitled “Minyari Drilling Update No. 4” created on 29 September 2016;
Report entitled “Minyari Dome ‐ Phase 2 Exploration Programme Commences” created on 31 October 2016;
Report entitled “North Telfer and Citadel Exploration Programme Update” created on 16 November 2016;
Report entitled “Minyari Dome Drilling Update No. 1” created on 16 December 2016;
Report entitled “Minyari Dome and Citadel – Phase 2 Update” created on 9 February 2017;
Report entitled “Minyari Dome 2017 Exploration Programme” created on 27 March 2017;
Report entitled “Minyari Dome 2017 Phase 1 Exploration Programme Commences” created on 13 April 2017;
Report entitled “Minyari Dome Positive Metallurgical Test Work Results” created on 13 June 2017;
Report entitled “High‐Grade Gold Intersected at North Telfer Project Revised” created on 21 June 2017;
Report entitled “Drilling Extends High‐Grade Gold Mineralisation at WACA” created on 25 July 2017;
Report entitled “Antipa Secures High‐Grade Chicken Ranch Deposit” created on 2 August 2017;
Report entitled “High‐Grade Gold Mineralisation Strike Extension at Minyari Deposit” created on 4 August 2017;
Report entitled “Minyari Dome Phase 1 Final Assay Results” created on 31 August 2017;
Report entitled “Minyari/WACA Deposits Maiden Mineral Resource” created on 16 November 2017;
Report entitled “Calibre Deposit Mineral Resource Update” created on 17 November 2017;
Report entitled “Air Core Programme Highlights Minyari and WACA Deposit” created on 5 December 2017;
Report entitled “Minyari Dome 2017 Air Core Drilling Results” created on 29 January 2018; and
Report entitled “Tim’s Dome 2017 Air Core Drilling Results ” created on 31 January 2018;
Report entitled “Citadel Project 2018 Exploration Programme” created on 27 March 2018;
Report entitled “Antipa to Commence Major Exploration Programme” created on 1 June 2018;
Report entitled “Major Exploration Programme Commences” created on 25 June 2018;
Report entitled “2018 Exploration Programme Update” created on 16 July 2018;
Report entitled “Minyari Dome – Initial Drill Results” created on 1 August 2018;
Report entitled “2018‐19 Exploration Programme Overview and Update ‐ August” created on 15 August 2018;
Report entitled “Minyari Dome Excellent Metallurgical Test‐work Results” created on 27 August 2018;
Report entitled “Minyari Dome – Initial Drill Results” created on 1 August 2018; and
Report entitled “Thick High‐grade Copper Mineralisation Intersected” created on 2 October 2018.
All of which are available to view on www.antipaminerals.com.au and www.asx.com.au. The company confirms that it is not aware of any new information or data that materially affects the information included in the original market announcements.
Forward‐Looking Statements:
This document may include forward‐looking statements. Forward‐looking statements include, but are not limited to, statements concerning Antipa Mineral Ltd’s planned exploration programme and other statements that are not historical facts. When used in this document, the words such as "could," "plan," "estimate," "expect," "intend," "may," "potential," "should," and similar expressions are forward‐looking statements. Although Antipa Minerals Ltd believes that its expectations reflected in these forward‐looking statements are reasonable, such statements involve risks and uncertainties and no assurance can be given that actual results will be consistent with these forward‐looking statements.
11
Table 1a: Chicken Ranch Air Core and Reverse Circulation 2018 Drill Hole Key Assay Results: Gold‐Silver
Hole ID From (m) To (m) Interval (m) Gold (g/t)
Silver (g/t)
18CRA0138 36.0 44.0 8.0 0.11 3.86 18CRA0139 0.0 6.0 6.0 0.00 1.03 18CRA0155 18.0 22.0 4.0 0.00 6.59 18CRA0156 20.0 21.0 1.0 0.01 2.04 18CRA0156 44.0 50.0 6.0 0.80 18CRA0167 18.0 26.0 8.0 0.44 18CRA0168 26.0 30.0 4.0 0.04 1.68 18CRA0169 46.0 50.0 4.0 0.58 18CRA0174 14.0 18.0 4.0 0.66 18CRA0176 38.0 42.0 4.0 0.53 18CRA0193 0.0 2.0 2.0 0.54 18CRC0001 47.0 60.0 13.0 1.43 including 47.0 48.0 1.0 3.72 including 53.0 54.0 1.0 6.64 including 59.0 60.0 1.0 3.15 18CRC0002 49.0 52.0 3.0 1.32 18CRC0003 15.0 20.0 5.0 0.95 including 15.0 16.0 1.0 2.10 18CRC0003 32.0 36.0 4.0 1.02 including 35.0 36.0 1.0 2.69 18CRC0004 66.0 67.0 1.0 2.62 18CRC0005 62.0 63.0 1.0 0.87 18CRC0005 85.0 87.0 2.0 1.22 18CRC0005 108.0 110.0 2.0 0.64 18CRC0006 135.0 136.0 1.0 0.63 18CRC0007 83.0 84.0 1.0 0.71 18CRC0007 118.0 119.0 1.0 0.66 18CRC0007 126.0 128.0 2.0 0.69 18CRC0007 135.0 136.0 1.0 0.62 18CRC0007 198.0 199.0 1.0 1.73 18CRC0009 52.0 53.0 1.0 3.58 18CRC0010 97.0 98.0 1.0 0.83 18CRC0010 100.0 101.0 1.0 1.06 18CRC0011 27.0 29.0 2.0 2.77 including 27.0 28.0 1.0 4.53 18CRC0011 63.0 66.0 3.0 4.05 including 63.0 64.0 1.0 7.88 18CRC0012 36.0 37.0 1.0 2.12 18CRC0012 50.0 59.0 9.0 0.52 18CRC0012 69.0 70.0 1.0 1.09 18CRC0013 64.0 68.0 4.0 1.66 18CRC0014 80.0 81.0 1.0 0.99 18CRC0016 28.0 32.0 4.0 0.49
Table 1b: Minyari Dome 2018 Reverse Circulation Drill Hole Key Assay Results: Gold‐Copper‐Silver‐Cobalt (i.e. ≥ 1.0m with Au ≥ 0.4 g/t and/or Cu ≥ 1,000ppm and/or Co ≥ 300ppm and/or Ag ≥ 1.0 g/t)
Hole ID Deposit From (m) To (m) Interval (m) Gold (g/t)
Copper (%)
Silver (g/t)
Cobalt (ppm)
18MYC0171 Gonzo 213.0 216.0 3.0 0.10 0.36 0.22 0.02 including 214.0 215.0 1.0 0.18 0.78 2.24 0.04
18MYC0171 Gonzo 236.0 237.0 1.0 0.03 0.18 0.57 0.01 18MYC0174 Minyari North 104.0 105.0 1.0 1.47 0.02 0.05 0.0018MYC0174 Minyari North 143.0 156.0 13.0 0.03 0.05 0.10 0.00 18MYC0176 Minyari North 60.0 64.0 4.0 1.02 0.04 0.14 0.01 18MYC0176 Minyari North 74.0 76.0 2.0 0.07 0.06 0.05 0.07 18MYC0177 ‐ 84.0 88.0 4.0 0.01 0.01 1.31 0.0018MYC0179 ‐ 80.0 84.0 4.0 0.00 0.00 1.77 0.00 18MYC0183 Judes West 39.0 40.0 1.0 0.41 0.03 0.01 0.00
Notes (Intersection Tables above): Table 1 Intersections are composited from individual assays using the following criteria:
Intersection Interval = Nominal cut‐off grade scenarios:
≥ 0.4 g/t gold which also satisfy a minimum down‐hole interval of 1.0m; and/or
12
≥ 1.0 g/t silver which also satisfy a minimum down‐hole interval of 1.0m; and/or
≥ 0.1% copper which also satisfy a minimum down‐hole interval of 1.0m; and/or
≥ 0.03% cobalt which also satisfy a minimum down‐hole interval of 1.0m.
NB: In some instances, zones grading less than the cut‐off grade/s have been included in calculating composites or to highlight mineralisation trends.
NB: For the purpose of highlighting significant (generally isolated) results some intersections may be included in this Table which do not satisfy the criteria above.
No top‐cutting has been applied to assay results for gold, copper, cobalt or silver; * Unless specified otherwise where a 27 g/t gold top‐cut has been applied.
Intersections are down hole lengths, true widths not known with certainty.
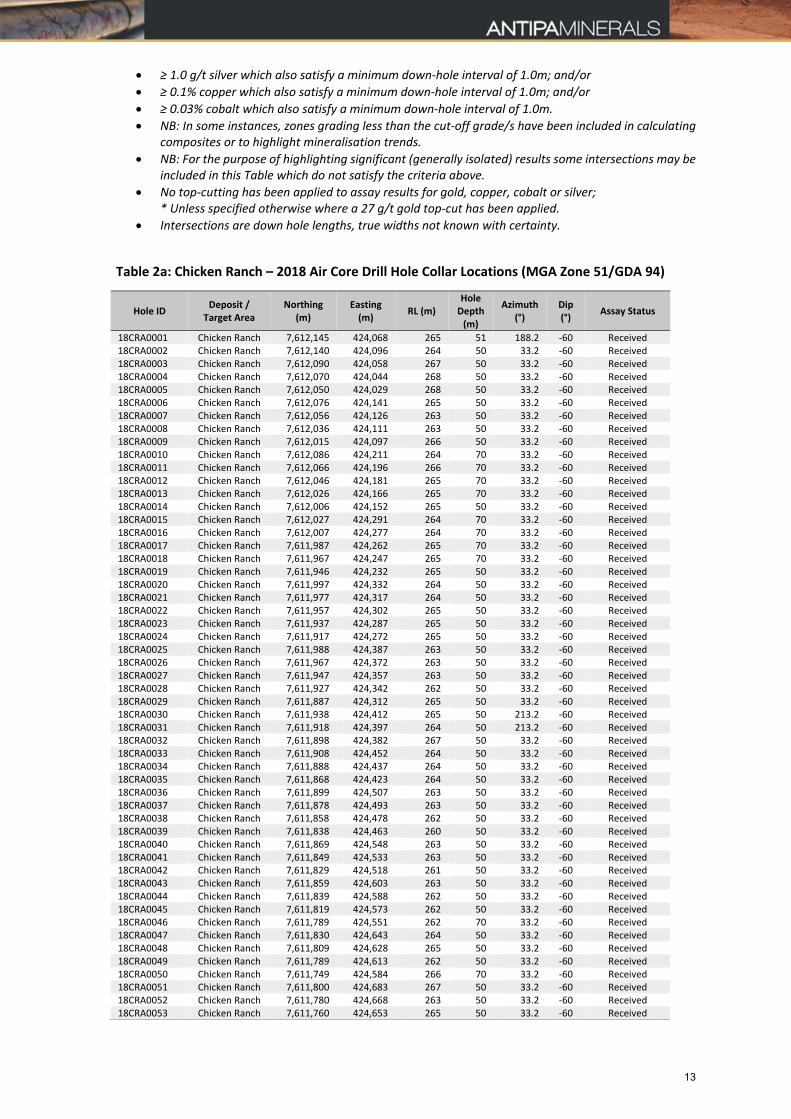
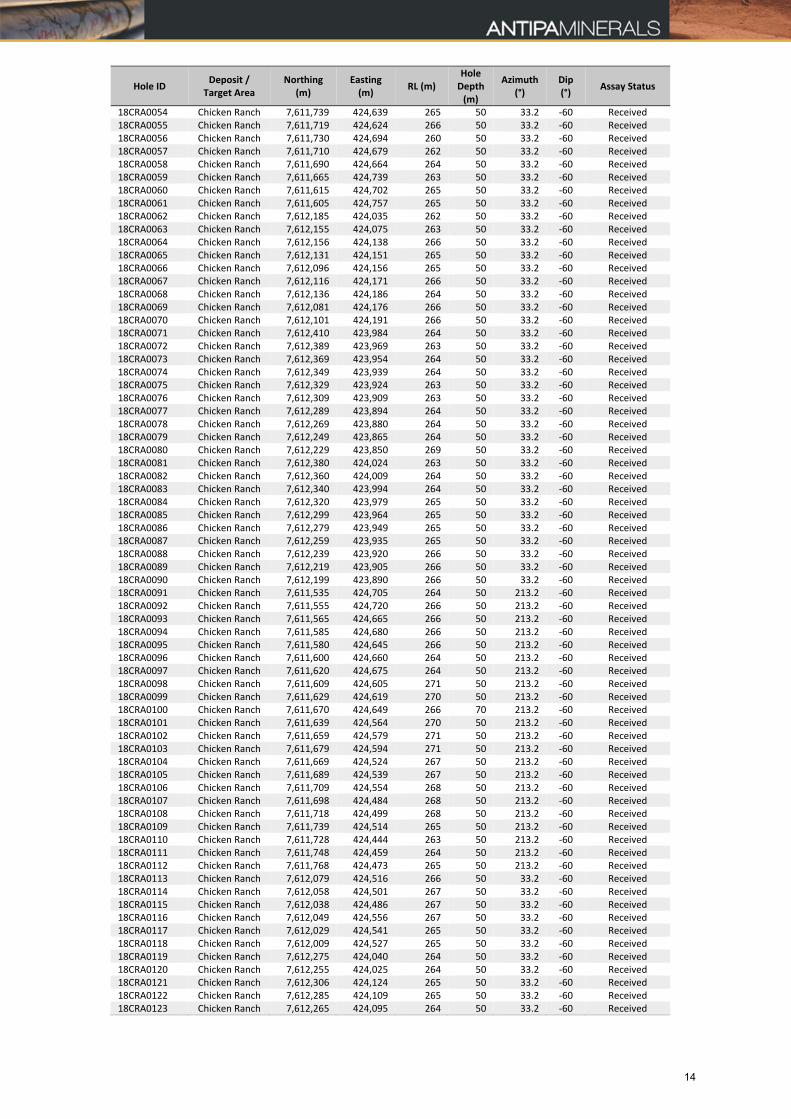
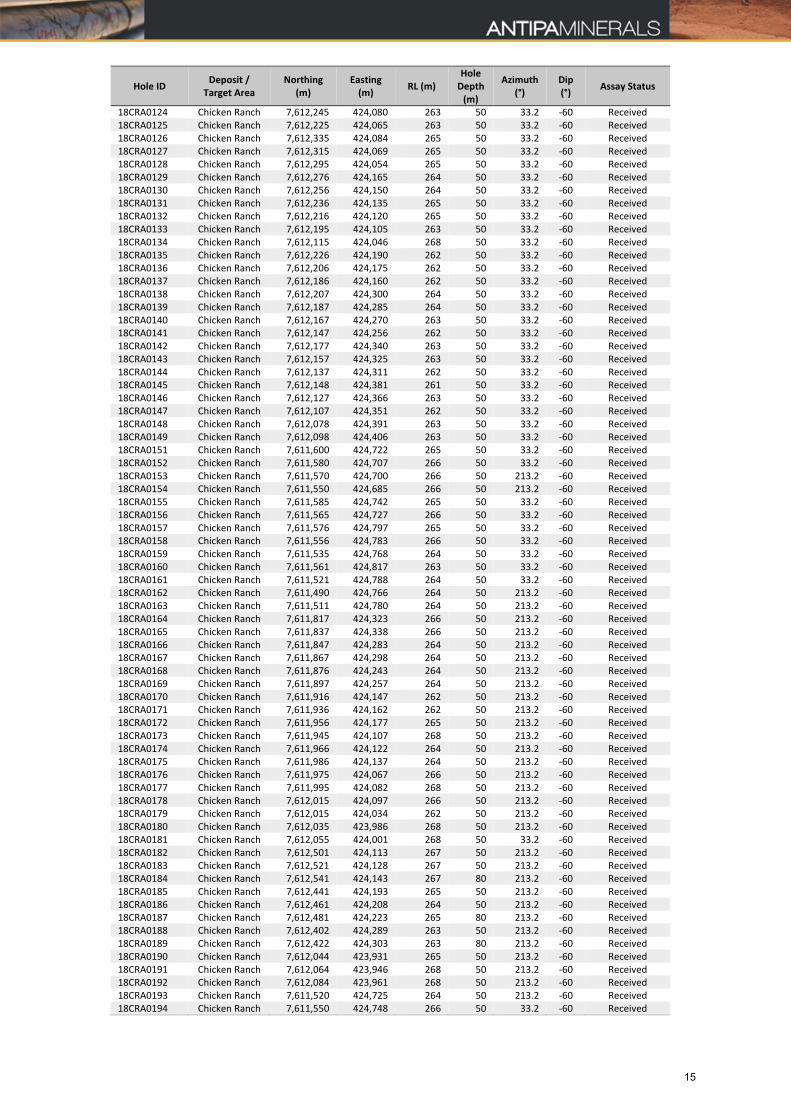
Table 2a: Chicken Ranch – 2018 Air Core Drill Hole Collar Locations (MGA Zone 51/GDA 94)
Hole ID Deposit /
Target Area Northing
(m) Easting (m)
RL (m) Hole Depth (m)
Azimuth (°)
Dip (°)
Assay Status
18CRA0001 Chicken Ranch 7,612,145 424,068 265 51 188.2 ‐60 Received 18CRA0002 Chicken Ranch 7,612,140 424,096 264 50 33.2 ‐60 Received 18CRA0003 Chicken Ranch 7,612,090 424,058 267 50 33.2 ‐60 Received 18CRA0004 Chicken Ranch 7,612,070 424,044 268 50 33.2 ‐60 Received 18CRA0005 Chicken Ranch 7,612,050 424,029 268 50 33.2 ‐60 Received 18CRA0006 Chicken Ranch 7,612,076 424,141 265 50 33.2 ‐60 Received 18CRA0007 Chicken Ranch 7,612,056 424,126 263 50 33.2 ‐60 Received 18CRA0008 Chicken Ranch 7,612,036 424,111 263 50 33.2 ‐60 Received 18CRA0009 Chicken Ranch 7,612,015 424,097 266 50 33.2 ‐60 Received 18CRA0010 Chicken Ranch 7,612,086 424,211 264 70 33.2 ‐60 Received 18CRA0011 Chicken Ranch 7,612,066 424,196 266 70 33.2 ‐60 Received 18CRA0012 Chicken Ranch 7,612,046 424,181 265 70 33.2 ‐60 Received 18CRA0013 Chicken Ranch 7,612,026 424,166 265 70 33.2 ‐60 Received 18CRA0014 Chicken Ranch 7,612,006 424,152 265 50 33.2 ‐60 Received 18CRA0015 Chicken Ranch 7,612,027 424,291 264 70 33.2 ‐60 Received 18CRA0016 Chicken Ranch 7,612,007 424,277 264 70 33.2 ‐60 Received 18CRA0017 Chicken Ranch 7,611,987 424,262 265 70 33.2 ‐60 Received 18CRA0018 Chicken Ranch 7,611,967 424,247 265 70 33.2 ‐60 Received 18CRA0019 Chicken Ranch 7,611,946 424,232 265 50 33.2 ‐60 Received 18CRA0020 Chicken Ranch 7,611,997 424,332 264 50 33.2 ‐60 Received 18CRA0021 Chicken Ranch 7,611,977 424,317 264 50 33.2 ‐60 Received 18CRA0022 Chicken Ranch 7,611,957 424,302 265 50 33.2 ‐60 Received 18CRA0023 Chicken Ranch 7,611,937 424,287 265 50 33.2 ‐60 Received 18CRA0024 Chicken Ranch 7,611,917 424,272 265 50 33.2 ‐60 Received 18CRA0025 Chicken Ranch 7,611,988 424,387 263 50 33.2 ‐60 Received 18CRA0026 Chicken Ranch 7,611,967 424,372 263 50 33.2 ‐60 Received 18CRA0027 Chicken Ranch 7,611,947 424,357 263 50 33.2 ‐60 Received 18CRA0028 Chicken Ranch 7,611,927 424,342 262 50 33.2 ‐60 Received 18CRA0029 Chicken Ranch 7,611,887 424,312 265 50 33.2 ‐60 Received 18CRA0030 Chicken Ranch 7,611,938 424,412 265 50 213.2 ‐60 Received 18CRA0031 Chicken Ranch 7,611,918 424,397 264 50 213.2 ‐60 Received 18CRA0032 Chicken Ranch 7,611,898 424,382 267 50 33.2 ‐60 Received 18CRA0033 Chicken Ranch 7,611,908 424,452 264 50 33.2 ‐60 Received 18CRA0034 Chicken Ranch 7,611,888 424,437 264 50 33.2 ‐60 Received 18CRA0035 Chicken Ranch 7,611,868 424,423 264 50 33.2 ‐60 Received 18CRA0036 Chicken Ranch 7,611,899 424,507 263 50 33.2 ‐60 Received 18CRA0037 Chicken Ranch 7,611,878 424,493 263 50 33.2 ‐60 Received 18CRA0038 Chicken Ranch 7,611,858 424,478 262 50 33.2 ‐60 Received 18CRA0039 Chicken Ranch 7,611,838 424,463 260 50 33.2 ‐60 Received 18CRA0040 Chicken Ranch 7,611,869 424,548 263 50 33.2 ‐60 Received 18CRA0041 Chicken Ranch 7,611,849 424,533 263 50 33.2 ‐60 Received 18CRA0042 Chicken Ranch 7,611,829 424,518 261 50 33.2 ‐60 Received 18CRA0043 Chicken Ranch 7,611,859 424,603 263 50 33.2 ‐60 Received 18CRA0044 Chicken Ranch 7,611,839 424,588 262 50 33.2 ‐60 Received 18CRA0045 Chicken Ranch 7,611,819 424,573 262 50 33.2 ‐60 Received 18CRA0046 Chicken Ranch 7,611,789 424,551 262 70 33.2 ‐60 Received 18CRA0047 Chicken Ranch 7,611,830 424,643 264 50 33.2 ‐60 Received 18CRA0048 Chicken Ranch 7,611,809 424,628 265 50 33.2 ‐60 Received 18CRA0049 Chicken Ranch 7,611,789 424,613 262 50 33.2 ‐60 Received 18CRA0050 Chicken Ranch 7,611,749 424,584 266 70 33.2 ‐60 Received 18CRA0051 Chicken Ranch 7,611,800 424,683 267 50 33.2 ‐60 Received 18CRA0052 Chicken Ranch 7,611,780 424,668 263 50 33.2 ‐60 Received 18CRA0053 Chicken Ranch 7,611,760 424,653 265 50 33.2 ‐60 Received
13
Hole ID Deposit /
Target Area Northing
(m) Easting (m)
RL (m) Hole Depth (m)
Azimuth (°)
Dip (°)
Assay Status
18CRA0054 Chicken Ranch 7,611,739 424,639 265 50 33.2 ‐60 Received 18CRA0055 Chicken Ranch 7,611,719 424,624 266 50 33.2 ‐60 Received 18CRA0056 Chicken Ranch 7,611,730 424,694 260 50 33.2 ‐60 Received 18CRA0057 Chicken Ranch 7,611,710 424,679 262 50 33.2 ‐60 Received 18CRA0058 Chicken Ranch 7,611,690 424,664 264 50 33.2 ‐60 Received 18CRA0059 Chicken Ranch 7,611,665 424,739 263 50 33.2 ‐60 Received 18CRA0060 Chicken Ranch 7,611,615 424,702 265 50 33.2 ‐60 Received 18CRA0061 Chicken Ranch 7,611,605 424,757 265 50 33.2 ‐60 Received 18CRA0062 Chicken Ranch 7,612,185 424,035 262 50 33.2 ‐60 Received 18CRA0063 Chicken Ranch 7,612,155 424,075 263 50 33.2 ‐60 Received 18CRA0064 Chicken Ranch 7,612,156 424,138 266 50 33.2 ‐60 Received 18CRA0065 Chicken Ranch 7,612,131 424,151 265 50 33.2 ‐60 Received 18CRA0066 Chicken Ranch 7,612,096 424,156 265 50 33.2 ‐60 Received 18CRA0067 Chicken Ranch 7,612,116 424,171 266 50 33.2 ‐60 Received 18CRA0068 Chicken Ranch 7,612,136 424,186 264 50 33.2 ‐60 Received 18CRA0069 Chicken Ranch 7,612,081 424,176 266 50 33.2 ‐60 Received 18CRA0070 Chicken Ranch 7,612,101 424,191 266 50 33.2 ‐60 Received 18CRA0071 Chicken Ranch 7,612,410 423,984 264 50 33.2 ‐60 Received 18CRA0072 Chicken Ranch 7,612,389 423,969 263 50 33.2 ‐60 Received 18CRA0073 Chicken Ranch 7,612,369 423,954 264 50 33.2 ‐60 Received 18CRA0074 Chicken Ranch 7,612,349 423,939 264 50 33.2 ‐60 Received 18CRA0075 Chicken Ranch 7,612,329 423,924 263 50 33.2 ‐60 Received 18CRA0076 Chicken Ranch 7,612,309 423,909 263 50 33.2 ‐60 Received 18CRA0077 Chicken Ranch 7,612,289 423,894 264 50 33.2 ‐60 Received 18CRA0078 Chicken Ranch 7,612,269 423,880 264 50 33.2 ‐60 Received 18CRA0079 Chicken Ranch 7,612,249 423,865 264 50 33.2 ‐60 Received 18CRA0080 Chicken Ranch 7,612,229 423,850 269 50 33.2 ‐60 Received 18CRA0081 Chicken Ranch 7,612,380 424,024 263 50 33.2 ‐60 Received 18CRA0082 Chicken Ranch 7,612,360 424,009 264 50 33.2 ‐60 Received 18CRA0083 Chicken Ranch 7,612,340 423,994 264 50 33.2 ‐60 Received 18CRA0084 Chicken Ranch 7,612,320 423,979 265 50 33.2 ‐60 Received 18CRA0085 Chicken Ranch 7,612,299 423,964 265 50 33.2 ‐60 Received 18CRA0086 Chicken Ranch 7,612,279 423,949 265 50 33.2 ‐60 Received 18CRA0087 Chicken Ranch 7,612,259 423,935 265 50 33.2 ‐60 Received 18CRA0088 Chicken Ranch 7,612,239 423,920 266 50 33.2 ‐60 Received 18CRA0089 Chicken Ranch 7,612,219 423,905 266 50 33.2 ‐60 Received 18CRA0090 Chicken Ranch 7,612,199 423,890 266 50 33.2 ‐60 Received 18CRA0091 Chicken Ranch 7,611,535 424,705 264 50 213.2 ‐60 Received 18CRA0092 Chicken Ranch 7,611,555 424,720 266 50 213.2 ‐60 Received 18CRA0093 Chicken Ranch 7,611,565 424,665 266 50 213.2 ‐60 Received 18CRA0094 Chicken Ranch 7,611,585 424,680 266 50 213.2 ‐60 Received 18CRA0095 Chicken Ranch 7,611,580 424,645 266 50 213.2 ‐60 Received 18CRA0096 Chicken Ranch 7,611,600 424,660 264 50 213.2 ‐60 Received 18CRA0097 Chicken Ranch 7,611,620 424,675 264 50 213.2 ‐60 Received 18CRA0098 Chicken Ranch 7,611,609 424,605 271 50 213.2 ‐60 Received 18CRA0099 Chicken Ranch 7,611,629 424,619 270 50 213.2 ‐60 Received 18CRA0100 Chicken Ranch 7,611,670 424,649 266 70 213.2 ‐60 Received 18CRA0101 Chicken Ranch 7,611,639 424,564 270 50 213.2 ‐60 Received 18CRA0102 Chicken Ranch 7,611,659 424,579 271 50 213.2 ‐60 Received 18CRA0103 Chicken Ranch 7,611,679 424,594 271 50 213.2 ‐60 Received 18CRA0104 Chicken Ranch 7,611,669 424,524 267 50 213.2 ‐60 Received 18CRA0105 Chicken Ranch 7,611,689 424,539 267 50 213.2 ‐60 Received 18CRA0106 Chicken Ranch 7,611,709 424,554 268 50 213.2 ‐60 Received 18CRA0107 Chicken Ranch 7,611,698 424,484 268 50 213.2 ‐60 Received 18CRA0108 Chicken Ranch 7,611,718 424,499 268 50 213.2 ‐60 Received 18CRA0109 Chicken Ranch 7,611,739 424,514 265 50 213.2 ‐60 Received 18CRA0110 Chicken Ranch 7,611,728 424,444 263 50 213.2 ‐60 Received 18CRA0111 Chicken Ranch 7,611,748 424,459 264 50 213.2 ‐60 Received 18CRA0112 Chicken Ranch 7,611,768 424,473 265 50 213.2 ‐60 Received 18CRA0113 Chicken Ranch 7,612,079 424,516 266 50 33.2 ‐60 Received 18CRA0114 Chicken Ranch 7,612,058 424,501 267 50 33.2 ‐60 Received 18CRA0115 Chicken Ranch 7,612,038 424,486 267 50 33.2 ‐60 Received 18CRA0116 Chicken Ranch 7,612,049 424,556 267 50 33.2 ‐60 Received 18CRA0117 Chicken Ranch 7,612,029 424,541 265 50 33.2 ‐60 Received 18CRA0118 Chicken Ranch 7,612,009 424,527 265 50 33.2 ‐60 Received 18CRA0119 Chicken Ranch 7,612,275 424,040 264 50 33.2 ‐60 Received 18CRA0120 Chicken Ranch 7,612,255 424,025 264 50 33.2 ‐60 Received 18CRA0121 Chicken Ranch 7,612,306 424,124 265 50 33.2 ‐60 Received 18CRA0122 Chicken Ranch 7,612,285 424,109 265 50 33.2 ‐60 Received 18CRA0123 Chicken Ranch 7,612,265 424,095 264 50 33.2 ‐60 Received
14
Hole ID Deposit /
Target Area Northing
(m) Easting (m)
RL (m) Hole Depth (m)
Azimuth (°)
Dip (°)
Assay Status
18CRA0124 Chicken Ranch 7,612,245 424,080 263 50 33.2 ‐60 Received 18CRA0125 Chicken Ranch 7,612,225 424,065 263 50 33.2 ‐60 Received 18CRA0126 Chicken Ranch 7,612,335 424,084 265 50 33.2 ‐60 Received 18CRA0127 Chicken Ranch 7,612,315 424,069 265 50 33.2 ‐60 Received 18CRA0128 Chicken Ranch 7,612,295 424,054 265 50 33.2 ‐60 Received 18CRA0129 Chicken Ranch 7,612,276 424,165 264 50 33.2 ‐60 Received 18CRA0130 Chicken Ranch 7,612,256 424,150 264 50 33.2 ‐60 Received 18CRA0131 Chicken Ranch 7,612,236 424,135 265 50 33.2 ‐60 Received 18CRA0132 Chicken Ranch 7,612,216 424,120 265 50 33.2 ‐60 Received 18CRA0133 Chicken Ranch 7,612,195 424,105 263 50 33.2 ‐60 Received 18CRA0134 Chicken Ranch 7,612,115 424,046 268 50 33.2 ‐60 Received 18CRA0135 Chicken Ranch 7,612,226 424,190 262 50 33.2 ‐60 Received 18CRA0136 Chicken Ranch 7,612,206 424,175 262 50 33.2 ‐60 Received 18CRA0137 Chicken Ranch 7,612,186 424,160 262 50 33.2 ‐60 Received 18CRA0138 Chicken Ranch 7,612,207 424,300 264 50 33.2 ‐60 Received 18CRA0139 Chicken Ranch 7,612,187 424,285 264 50 33.2 ‐60 Received 18CRA0140 Chicken Ranch 7,612,167 424,270 263 50 33.2 ‐60 Received 18CRA0141 Chicken Ranch 7,612,147 424,256 262 50 33.2 ‐60 Received 18CRA0142 Chicken Ranch 7,612,177 424,340 263 50 33.2 ‐60 Received 18CRA0143 Chicken Ranch 7,612,157 424,325 263 50 33.2 ‐60 Received 18CRA0144 Chicken Ranch 7,612,137 424,311 262 50 33.2 ‐60 Received 18CRA0145 Chicken Ranch 7,612,148 424,381 261 50 33.2 ‐60 Received 18CRA0146 Chicken Ranch 7,612,127 424,366 263 50 33.2 ‐60 Received 18CRA0147 Chicken Ranch 7,612,107 424,351 262 50 33.2 ‐60 Received 18CRA0148 Chicken Ranch 7,612,078 424,391 263 50 33.2 ‐60 Received 18CRA0149 Chicken Ranch 7,612,098 424,406 263 50 33.2 ‐60 Received 18CRA0151 Chicken Ranch 7,611,600 424,722 265 50 33.2 ‐60 Received 18CRA0152 Chicken Ranch 7,611,580 424,707 266 50 33.2 ‐60 Received 18CRA0153 Chicken Ranch 7,611,570 424,700 266 50 213.2 ‐60 Received 18CRA0154 Chicken Ranch 7,611,550 424,685 266 50 213.2 ‐60 Received 18CRA0155 Chicken Ranch 7,611,585 424,742 265 50 33.2 ‐60 Received 18CRA0156 Chicken Ranch 7,611,565 424,727 266 50 33.2 ‐60 Received 18CRA0157 Chicken Ranch 7,611,576 424,797 265 50 33.2 ‐60 Received 18CRA0158 Chicken Ranch 7,611,556 424,783 266 50 33.2 ‐60 Received 18CRA0159 Chicken Ranch 7,611,535 424,768 264 50 33.2 ‐60 Received 18CRA0160 Chicken Ranch 7,611,561 424,817 263 50 33.2 ‐60 Received 18CRA0161 Chicken Ranch 7,611,521 424,788 264 50 33.2 ‐60 Received 18CRA0162 Chicken Ranch 7,611,490 424,766 264 50 213.2 ‐60 Received 18CRA0163 Chicken Ranch 7,611,511 424,780 264 50 213.2 ‐60 Received 18CRA0164 Chicken Ranch 7,611,817 424,323 266 50 213.2 ‐60 Received 18CRA0165 Chicken Ranch 7,611,837 424,338 266 50 213.2 ‐60 Received 18CRA0166 Chicken Ranch 7,611,847 424,283 264 50 213.2 ‐60 Received 18CRA0167 Chicken Ranch 7,611,867 424,298 264 50 213.2 ‐60 Received 18CRA0168 Chicken Ranch 7,611,876 424,243 264 50 213.2 ‐60 Received 18CRA0169 Chicken Ranch 7,611,897 424,257 264 50 213.2 ‐60 Received 18CRA0170 Chicken Ranch 7,611,916 424,147 262 50 213.2 ‐60 Received 18CRA0171 Chicken Ranch 7,611,936 424,162 262 50 213.2 ‐60 Received 18CRA0172 Chicken Ranch 7,611,956 424,177 265 50 213.2 ‐60 Received 18CRA0173 Chicken Ranch 7,611,945 424,107 268 50 213.2 ‐60 Received 18CRA0174 Chicken Ranch 7,611,966 424,122 264 50 213.2 ‐60 Received 18CRA0175 Chicken Ranch 7,611,986 424,137 264 50 213.2 ‐60 Received 18CRA0176 Chicken Ranch 7,611,975 424,067 266 50 213.2 ‐60 Received 18CRA0177 Chicken Ranch 7,611,995 424,082 268 50 213.2 ‐60 Received 18CRA0178 Chicken Ranch 7,612,015 424,097 266 50 213.2 ‐60 Received 18CRA0179 Chicken Ranch 7,612,015 424,034 262 50 213.2 ‐60 Received 18CRA0180 Chicken Ranch 7,612,035 423,986 268 50 213.2 ‐60 Received 18CRA0181 Chicken Ranch 7,612,055 424,001 268 50 33.2 ‐60 Received 18CRA0182 Chicken Ranch 7,612,501 424,113 267 50 213.2 ‐60 Received 18CRA0183 Chicken Ranch 7,612,521 424,128 267 50 213.2 ‐60 Received 18CRA0184 Chicken Ranch 7,612,541 424,143 267 80 213.2 ‐60 Received 18CRA0185 Chicken Ranch 7,612,441 424,193 265 50 213.2 ‐60 Received 18CRA0186 Chicken Ranch 7,612,461 424,208 264 50 213.2 ‐60 Received 18CRA0187 Chicken Ranch 7,612,481 424,223 265 80 213.2 ‐60 Received 18CRA0188 Chicken Ranch 7,612,402 424,289 263 50 213.2 ‐60 Received 18CRA0189 Chicken Ranch 7,612,422 424,303 263 80 213.2 ‐60 Received 18CRA0190 Chicken Ranch 7,612,044 423,931 265 50 213.2 ‐60 Received 18CRA0191 Chicken Ranch 7,612,064 423,946 268 50 213.2 ‐60 Received 18CRA0192 Chicken Ranch 7,612,084 423,961 268 50 213.2 ‐60 Received 18CRA0193 Chicken Ranch 7,611,520 424,725 264 50 213.2 ‐60 Received 18CRA0194 Chicken Ranch 7,611,550 424,748 266 50 33.2 ‐60 Received
15
Hole ID Deposit /
Target Area Northing
(m) Easting (m)
RL (m) Hole Depth (m)
Azimuth (°)
Dip (°)
Assay Status
18CRWB01 Water Bore 7,612,109 424,216 264 72 0.0 ‐90 Received 18CRWB02 Water Bore 7,612,151 424,363 263 72 0.0 ‐90 Received
Table 2b: Chicken Ranch – 2018 RC Drill Hole Collar Locations (MGA Zone 51/GDA 94)
Hole ID Deposit /
Target Area Northing
(m) Easting (m)
RL (m) Hole Depth (m)
Azimuth (°)
Dip (°)
Assay Status
18CRC0001 Chicken Ranch 7,612,180 424,025 263 60 215.0 ‐60 Received 18CRC0002 Chicken Ranch 7,612,190 424,040 262 90 215.0 ‐60 Received 18CRC0003 Chicken Ranch 7,612,170 424,050 263 60 215.0 ‐60 Received 18CRC0004 Chicken Ranch 7,612,185 424,055 262 90 215.0 ‐60 Received 18CRC0005 Chicken Ranch 7,612,133 424,000 265 123 35.0 ‐60 Received 18CRC0006 Chicken Ranch 7,612,112 423,985 268 201 35.0 ‐60 Received 18CRC0007 Chicken Ranch 7,612,076 423,999 268 201 35.0 ‐60 Received 18CRC0008 Chicken Ranch 7,612,079 424,023 268 171 35.0 ‐60 Received 18CRC0009 Chicken Ranch 7,612,093 424,089 265 183 35.0 ‐60 Received 18CRC0010 Chicken Ranch 7,612,073 424,074 267 123 35.0 ‐60 Received 18CRC0011 Chicken Ranch 7,612,048 424,057 267 183 35.0 ‐60 Received 18CRC0012 Chicken Ranch 7,612,164 423,958 267 153 35.0 ‐55 Received 18CRC0013 Chicken Ranch 7,612,063 424,246 267 171 215.0 ‐60 Received 18CRC0014 Chicken Ranch 7,612,040 424,267 261 81 215.0 ‐60 Received 18CRC0015 Chicken Ranch 7,612,030 424,290 267 123 215.0 ‐60 Received 18CRC0016 Chicken Ranch 7,611,943 424,433 267 45 215.0 ‐60 Received 18CRC0017 Chicken Ranch 7,611,782 424,701 262 40 215.0 ‐60 Pending 18CRC0018 Chicken Ranch 7,611,802 424,715 262 99 215.0 ‐60 Pending 18CRC0019 Chicken Ranch 7,611,897 424,631 263 153 215.0 ‐55 Pending 18CRC0020 Chicken Ranch 7,611,988 424,465 266 183 215.0 ‐60 Pending
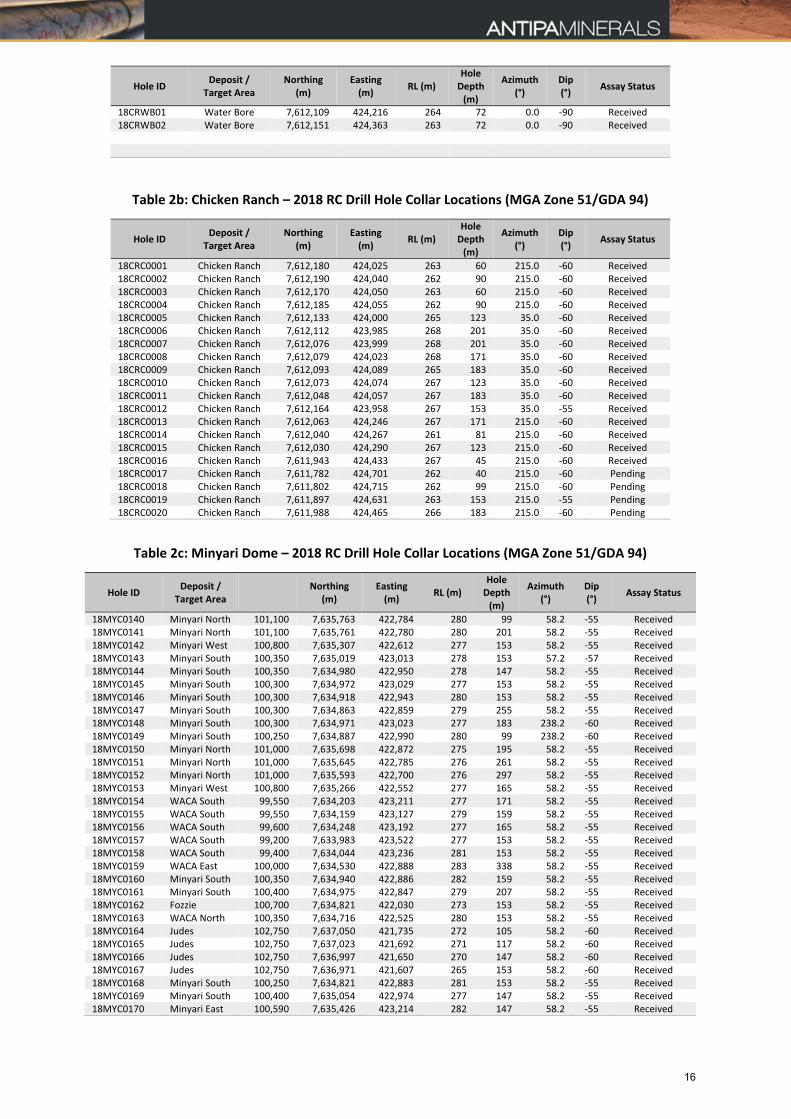
Table 2c: Minyari Dome – 2018 RC Drill Hole Collar Locations (MGA Zone 51/GDA 94)
Hole ID Deposit /
Target Area
Northing
(m) Easting (m)
RL (m) Hole Depth (m)
Azimuth (°)
Dip (°)
Assay Status
18MYC0140 Minyari North 101,100 7,635,763 422,784 280 99 58.2 ‐55 Received18MYC0141 Minyari North 101,100 7,635,761 422,780 280 201 58.2 ‐55 Received 18MYC0142 Minyari West 100,800 7,635,307 422,612 277 153 58.2 ‐55 Received 18MYC0143 Minyari South 100,350 7,635,019 423,013 278 153 57.2 ‐57 Received 18MYC0144 Minyari South 100,350 7,634,980 422,950 278 147 58.2 ‐55 Received18MYC0145 Minyari South 100,300 7,634,972 423,029 277 153 58.2 ‐55 Received 18MYC0146 Minyari South 100,300 7,634,918 422,943 280 153 58.2 ‐55 Received 18MYC0147 Minyari South 100,300 7,634,863 422,859 279 255 58.2 ‐55 Received 18MYC0148 Minyari South 100,300 7,634,971 423,023 277 183 238.2 ‐60 Received18MYC0149 Minyari South 100,250 7,634,887 422,990 280 99 238.2 ‐60 Received 18MYC0150 Minyari North 101,000 7,635,698 422,872 275 195 58.2 ‐55 Received 18MYC0151 Minyari North 101,000 7,635,645 422,785 276 261 58.2 ‐55 Received 18MYC0152 Minyari North 101,000 7,635,593 422,700 276 297 58.2 ‐55 Received18MYC0153 Minyari West 100,800 7,635,266 422,552 277 165 58.2 ‐55 Received 18MYC0154 WACA South 99,550 7,634,203 423,211 277 171 58.2 ‐55 Received 18MYC0155 WACA South 99,550 7,634,159 423,127 279 159 58.2 ‐55 Received 18MYC0156 WACA South 99,600 7,634,248 423,192 277 165 58.2 ‐55 Received18MYC0157 WACA South 99,200 7,633,983 423,522 277 153 58.2 ‐55 Received 18MYC0158 WACA South 99,400 7,634,044 423,236 281 153 58.2 ‐55 Received 18MYC0159 WACA East 100,000 7,634,530 422,888 283 338 58.2 ‐55 Received 18MYC0160 Minyari South 100,350 7,634,940 422,886 282 159 58.2 ‐55 Received 18MYC0161 Minyari South 100,400 7,634,975 422,847 279 207 58.2 ‐55 Received18MYC0162 Fozzie 100,700 7,634,821 422,030 273 153 58.2 ‐55 Received 18MYC0163 WACA North 100,350 7,634,716 422,525 280 153 58.2 ‐55 Received 18MYC0164 Judes 102,750 7,637,050 421,735 272 105 58.2 ‐60 Received 18MYC0165 Judes 102,750 7,637,023 421,692 271 117 58.2 ‐60 Received18MYC0166 Judes 102,750 7,636,997 421,650 270 147 58.2 ‐60 Received 18MYC0167 Judes 102,750 7,636,971 421,607 265 153 58.2 ‐60 Received 18MYC0168 Minyari South 100,250 7,634,821 422,883 281 153 58.2 ‐55 Received 18MYC0169 Minyari South 100,400 7,635,054 422,974 277 147 58.2 ‐55 Received18MYC0170 Minyari East 100,590 7,635,426 423,214 282 147 58.2 ‐55 Received
16
Hole ID Deposit /
Target Area
Northing
(m) Easting (m)
RL (m) Hole Depth (m)
Azimuth (°)
Dip (°)
Assay Status
18MYC0171 Gonzo 102,200 7,636,256 421,498 272 249 58.2 ‐55 Received18MYC0172 Minyari North 101,300 7,636,172 423,068 282 147 58.2 ‐55 Received 18MYC0173 Minyari North 101,300 7,636,029 422,839 278 153 58.2 ‐55 Received 18MYC0174 Minyari North 101,300 7,635,977 422,754 276 165 58.2 ‐55 Received 18MYC0175 Minyari North 101,500 7,636,078 422,538 273 105 58.2 ‐55 Received18MYC0176 Minyari North 101,500 7,636,025 422,453 278 105 58.2 ‐55 Received 18MYC0177 ‐ 102,400 7,636,647 421,749 268 153 58.2 ‐55 Received 18MYC0178 ‐ 102,400 7,636,541 421,580 272 153 58.2 ‐55 Received 18MYC0179 ‐ 102,400 7,636,436 421,410 270 153 58.2 ‐55 Received18MYC0180 AEM 107,600 7,640,087 417,436 263 201 58.2 ‐60 Received 18MYC0181 AEM 107,600 7,639,992 417,283 262 201 58.2 ‐55 Received 18MYC0182 Judes West 102,940 7,636,868 421,083 265 105 58.2 ‐55 Received 18MYC0183 Judes West 102,940 7,636,842 421,040 269 105 58.2 ‐55 Received18MYC0184 Judes West 102,940 7,636,816 420,998 270 105 58.2 ‐55 Received
17
CHICKEN RANCH AREA – 2018 Air Core and Reverse Circulation Drill Hole Sampling
JORC Code 2012 Edition: Table 1 - Section 1 Sampling Techniques and Data (Criteria in this section shall apply to all succeeding sections)
Criteria JORC Code explanation Commentary
Sampling techniques
Nature and quality of sampling (e.g. cut channels, random chips, or specific specialised industry standard measurement tools appropriate to the minerals under investigation, such as down hole gamma sondes, or handheld XRF instruments, etc). These examples should not be taken as limiting the broad meaning of sampling.
Include reference to measures taken to ensure sample representivity and the appropriate calibration of any measurement tools or systems used.
Aspects of the determination of mineralisation that are Material to the Public Report.
In cases where ‘industry standard’ work has been done this would be relatively simple (e.g. ‘reverse circulation drilling was used to obtain 1 m samples from which 3 kg was pulverised to produce a 30 g charge for fire assay’). In other cases more explanation may be required, such as where there is coarse gold that has inherent sampling problems. Unusual commodities or mineralisation types (e.g. submarine nodules) may warrant disclosure of detailed information.
NOTE: For detailed descriptions of the JORC Criteria for the various Chicken Ranch region exploration programmes completed between 1970 to 2016, some of which are referred to in this public disclosure, refer to the Company’s public disclosure (i.e. ASX Website www.asx.com.au and
Antipa Minerals Ltd Website http://antipaminerals.com.au/) report entitled “Antipa Secures High Grade Chicken Ranch Deposit” created on 2 August 2017.
2018 (July‐August) Air Core (AC) Drilling
Prospects/targets have been sampled by 195 AC drill holes, totaling 10,105 m, with an average drill
hole depth of 51.8 m.
Assays have been received for all 2018 AC drill holes.
AC drill holes were generally drilled on a nominal 25 m (along line) and 50 m across line infill and
trend‐extensional basis only, testing geological and geochemical targets.
Drill hole locations for all 2018 holes are tabulated in the body of this report.
2018 (August‐October) Reverse Circulation Core (RC) Drilling
Prospects/targets have been sampled by 20 Reverse Circulation (RC) drill holes, totaling 2,533 m,
with an average drill hole depth of 126.7 m.
To date assays have been received for 16 of the 2018 RC drill holes.
RC drill holes were drilled within, below and along strike of known mineralisation, testing geological
and geochemical targets.
Drill hole locations for all 2018 holes are tabulated in the body of this report.
AC Sampling
AC Sampling was carried out under Antipa protocols and QAQC procedures as per industry best
practice.
One metre samples were collected from a cyclone into a plastic bucket and then laid out on the
ground in rows of 10 or 20.
Compositing AC samples in lengths between 2 to 4 m was undertaken via combining ‘Spear’ samples
of the 1.0 m intervals to generate a 2 kg (average) sample. Areas of anomalous portable XRF Device
(Niton) (‘pXRF’) results or zones of encouraging geological observations were sampled as single
metres. All samples are pulverised at the laboratory to produce material for assay.
RC Sampling
RC Sampling was carried out under Antipa protocols and QAQC procedures as per industry best
practice.
RC samples were drilled using a 140mm diameter face sampling hammer and sampled on intervals of
1.0m using a rig mounted cone splitter from which a 2 kg (average) sample which was pulverised at
18
Criteria JORC Code explanation Commentary
the laboratory to produce material for assay.
Compositing of unmineralised regions (guided by Niton portable XRF field analysis) of between 2 to
4m was undertaken via combining ‘Spear’ samples of the unmineralised sample intervals to generate
a 2 kg (average) sample which was pulverised at the laboratory to produce material for assay.
Drilling techniques
Drill type (e.g. core, reverse circulation, open‐hole hammer, rotary air blast, auger, Bangka, sonic, etc) and details (e.g. core diameter, triple or standard tube, depth of diamond tails, face‐sampling bit or other type, whether core is oriented and if so, by what method, etc).
Air Core Circulation Drilling
AC Drilling was undertaken with a Bostech Drillboss 200 4WD truck mounted rig. The rig has a depth
capacity of approximately 150 m with an on‐board compressor producing 600 cfm at 250 psi.
All drill holes were completed using an 85 mm AC blade. If hard drilling conditions are encountered a
97 – 102 mm RAB hammer with a crossover sub (not face sampling) is utilised; however, this drilling
technique was not required at Chicken Ranch.
Drill holes were directed towards local grid east (135 holes), west (57 holes) and southwest (one
hole), with an inclination angle of ‐60°.
Reverse Circulation Drilling
RC Sampling was carried out under Antipa protocols and QAQC procedures as per industry best
practice.
RC samples were drilled using a 140mm diameter face sampling hammer and sampled on intervals of
1.0m using a rig mounted cone splitter from which a 2 kg (average) sample which was pulverised at
the laboratory to produce material for assay.
Compositing of unmineralised regions (guided by Niton portable XRF field analysis) of between 2 to
4m was undertaken via combining ‘Spear’ samples of the unmineralised sample intervals to generate
a 2 kg (average) sample which was pulverised at the laboratory to produce material for assay.
Drill sample recovery
Method of recording and assessing core and chip sample recoveries and results assessed.
Measures taken to maximise sample recovery and ensure representative nature of the samples.
Whether a relationship exists between sample recovery and grade and whether sample bias may have occurred due to preferential loss/gain of fine/coarse material.
AC Drill Samples
AC sample recovery and sample quality was recorded via visual estimation of sample volume and
condition of the drill spoils.
AC sample recovery typically ranges from 90 to 100%, with only very occasional samples with less
than 70% recovery.
AC sample recovery was maximized by endeavoring to maintain a dry drilling conditions as much as
practicable; the AC samples were almost exclusively dry.
Relationships between recovery and grade are not evident and are not expected given the generally
excellent and consistently high sample recovery.
RC Drill Samples
RC sample recovery was recorded via visual estimation of sample volume.
RC sample recovery typically ranges from 90 to 100%, with only very occasional samples with less
than 70% recovery.
RC sample recovery was maximized by endeavoring to maintain a dry drilling conditions as much as
practicable; the RC samples were almost exclusively dry.
19
Criteria JORC Code explanation Commentary
All samples were split on a 1m interval using a rig‐mounted cone splitter. Adjustments were made to
ensure representative 2 to 3kg sample volumes were collected.
Relationships between recovery and grade are not evident and are not expected given the generally
excellent and consistently high sample recovery.
RC sample recovery and sample quality was recorded via visual estimation of sample volume and
condition of the drill spoils.
RC results are generated for the purpose of exploration and potentially for Mineral Resource
estimations.
Logging Whether core and chip samples have been geologically and geotechnically logged to a level of detail to support appropriate Mineral Resource estimation, mining studies and metallurgical studies.
Whether logging is qualitative or quantitative in nature. Core (or costean, channel, etc) photography.
The total length and percentage of the relevant intersections logged.
AC Drill Logging
Geological logging of 100% of all AC sample intervals was carried out recording colour, weathering,
lithology, mineralogy, alteration, veining and sulphides.
Logging includes both qualitative and quantitative components.
All logging is entered directly into a notebook computer using the Antipa Proprietary Logging System
which is based on Microsoft Excel. The logging system uses standard look up tables that does not
allow invalid logging codes to be entered. Further data validation is carried out during upload to
Antipa’s master Access SQL database.
Selected AC sample intervals were measured for magnetic susceptibility using a handheld Magnetic
Susceptibility meter.
AC samples are generally analyzed in the field using a pXRF for the purposes of geochemical and
lithological interpretation and the selection of sampling intervals.
RC Drill Logging
All RC material is logged.
Logging includes both qualitative and quantitative components.
All logging is entered directly into a notebook computer using the Antipa Proprietary Logging System
which is based on Microsoft Excel. The logging system uses standard look up tables that does not
allow invalid logging codes to be entered. Further data validation is carried out during upload to
Antipa’s master Access SQL database.
Geological logging of 100% of all RC sample intervals was carried out recording colour, weathering,
lithology, mineralogy, alteration, veining and sulphides.
RC sample intervals were routinely measured for magnetic susceptibility using a handheld Magnetic
Susceptibility meter.
RC samples are generally analyzed in the field using a Portable XRF Device (Niton) for the purposes of
geochemical and lithological interpretation and the selection of sampling intervals.
Sub‐sampling techniques and
If core, whether cut or sawn and whether quarter, half or all core taken.
If non‐core, whether riffled, tube sampled, rotary split, etc and whether sampled wet or dry.
AC Samples
One metre samples were collected from a cyclone into a plastic bucket and then laid out on the
ground in rows of 10 or 20.
20
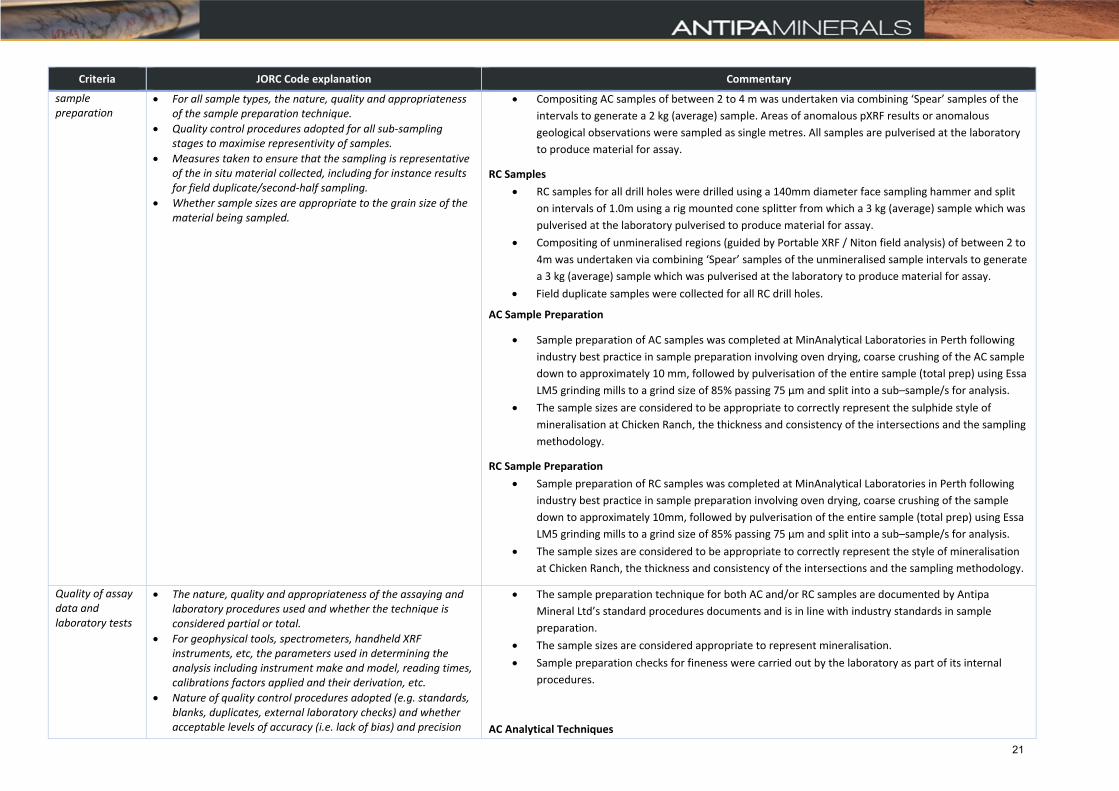
Criteria JORC Code explanation Commentary
sample preparation
For all sample types, the nature, quality and appropriateness of the sample preparation technique.
Quality control procedures adopted for all sub‐sampling stages to maximise representivity of samples.
Measures taken to ensure that the sampling is representative of the in situ material collected, including for instance results for field duplicate/second‐half sampling.
Whether sample sizes are appropriate to the grain size of the material being sampled.
Compositing AC samples of between 2 to 4 m was undertaken via combining ‘Spear’ samples of the
intervals to generate a 2 kg (average) sample. Areas of anomalous pXRF results or anomalous
geological observations were sampled as single metres. All samples are pulverised at the laboratory
to produce material for assay.
RC Samples
RC samples for all drill holes were drilled using a 140mm diameter face sampling hammer and split
on intervals of 1.0m using a rig mounted cone splitter from which a 3 kg (average) sample which was
pulverised at the laboratory pulverised to produce material for assay.
Compositing of unmineralised regions (guided by Portable XRF / Niton field analysis) of between 2 to
4m was undertaken via combining ‘Spear’ samples of the unmineralised sample intervals to generate
a 3 kg (average) sample which was pulverised at the laboratory to produce material for assay.
Field duplicate samples were collected for all RC drill holes.
AC Sample Preparation
Sample preparation of AC samples was completed at MinAnalytical Laboratories in Perth following
industry best practice in sample preparation involving oven drying, coarse crushing of the AC sample
down to approximately 10 mm, followed by pulverisation of the entire sample (total prep) using Essa
LM5 grinding mills to a grind size of 85% passing 75 µm and split into a sub–sample/s for analysis.
The sample sizes are considered to be appropriate to correctly represent the sulphide style of
mineralisation at Chicken Ranch, the thickness and consistency of the intersections and the sampling
methodology.
RC Sample Preparation
Sample preparation of RC samples was completed at MinAnalytical Laboratories in Perth following
industry best practice in sample preparation involving oven drying, coarse crushing of the sample
down to approximately 10mm, followed by pulverisation of the entire sample (total prep) using Essa
LM5 grinding mills to a grind size of 85% passing 75 µm and split into a sub–sample/s for analysis.
The sample sizes are considered to be appropriate to correctly represent the style of mineralisation
at Chicken Ranch, the thickness and consistency of the intersections and the sampling methodology.
Quality of assay data and laboratory tests
The nature, quality and appropriateness of the assaying and laboratory procedures used and whether the technique is considered partial or total.
For geophysical tools, spectrometers, handheld XRF instruments, etc, the parameters used in determining the analysis including instrument make and model, reading times, calibrations factors applied and their derivation, etc.
Nature of quality control procedures adopted (e.g. standards, blanks, duplicates, external laboratory checks) and whether acceptable levels of accuracy (i.e. lack of bias) and precision
The sample preparation technique for both AC and/or RC samples are documented by Antipa
Mineral Ltd’s standard procedures documents and is in line with industry standards in sample
preparation.
The sample sizes are considered appropriate to represent mineralisation.
Sample preparation checks for fineness were carried out by the laboratory as part of its internal
procedures.
AC Analytical Techniques
21
Criteria JORC Code explanation Commentary
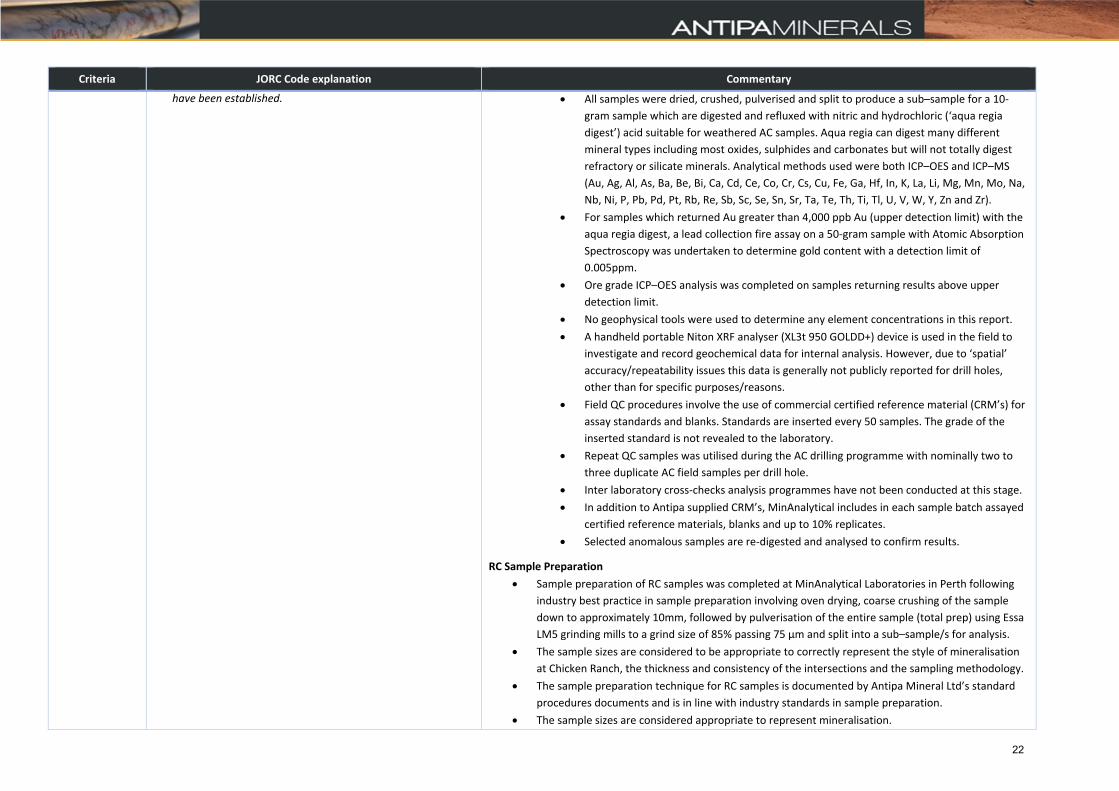
have been established. All samples were dried, crushed, pulverised and split to produce a sub–sample for a 10‐
gram sample which are digested and refluxed with nitric and hydrochloric (‘aqua regia
digest’) acid suitable for weathered AC samples. Aqua regia can digest many different
mineral types including most oxides, sulphides and carbonates but will not totally digest
refractory or silicate minerals. Analytical methods used were both ICP–OES and ICP–MS
(Au, Ag, Al, As, Ba, Be, Bi, Ca, Cd, Ce, Co, Cr, Cs, Cu, Fe, Ga, Hf, In, K, La, Li, Mg, Mn, Mo, Na,
Nb, Ni, P, Pb, Pd, Pt, Rb, Re, Sb, Sc, Se, Sn, Sr, Ta, Te, Th, Ti, Tl, U, V, W, Y, Zn and Zr).
For samples which returned Au greater than 4,000 ppb Au (upper detection limit) with the
aqua regia digest, a lead collection fire assay on a 50‐gram sample with Atomic Absorption
Spectroscopy was undertaken to determine gold content with a detection limit of
0.005ppm.
Ore grade ICP–OES analysis was completed on samples returning results above upper
detection limit.
No geophysical tools were used to determine any element concentrations in this report.
A handheld portable Niton XRF analyser (XL3t 950 GOLDD+) device is used in the field to
investigate and record geochemical data for internal analysis. However, due to ‘spatial’
accuracy/repeatability issues this data is generally not publicly reported for drill holes,
other than for specific purposes/reasons.
Field QC procedures involve the use of commercial certified reference material (CRM’s) for
assay standards and blanks. Standards are inserted every 50 samples. The grade of the
inserted standard is not revealed to the laboratory.
Repeat QC samples was utilised during the AC drilling programme with nominally two to
three duplicate AC field samples per drill hole.
Inter laboratory cross‐checks analysis programmes have not been conducted at this stage.
In addition to Antipa supplied CRM’s, MinAnalytical includes in each sample batch assayed
certified reference materials, blanks and up to 10% replicates.
Selected anomalous samples are re‐digested and analysed to confirm results.
RC Sample Preparation
Sample preparation of RC samples was completed at MinAnalytical Laboratories in Perth following
industry best practice in sample preparation involving oven drying, coarse crushing of the sample
down to approximately 10mm, followed by pulverisation of the entire sample (total prep) using Essa
LM5 grinding mills to a grind size of 85% passing 75 µm and split into a sub–sample/s for analysis.
The sample sizes are considered to be appropriate to correctly represent the style of mineralisation
at Chicken Ranch, the thickness and consistency of the intersections and the sampling methodology.
The sample preparation technique for RC samples is documented by Antipa Mineral Ltd’s standard
procedures documents and is in line with industry standards in sample preparation.
The sample sizes are considered appropriate to represent mineralisation.
22
Criteria JORC Code explanation Commentary
Sample preparation checks for fineness were carried out by the laboratory as part of its internal
procedures.
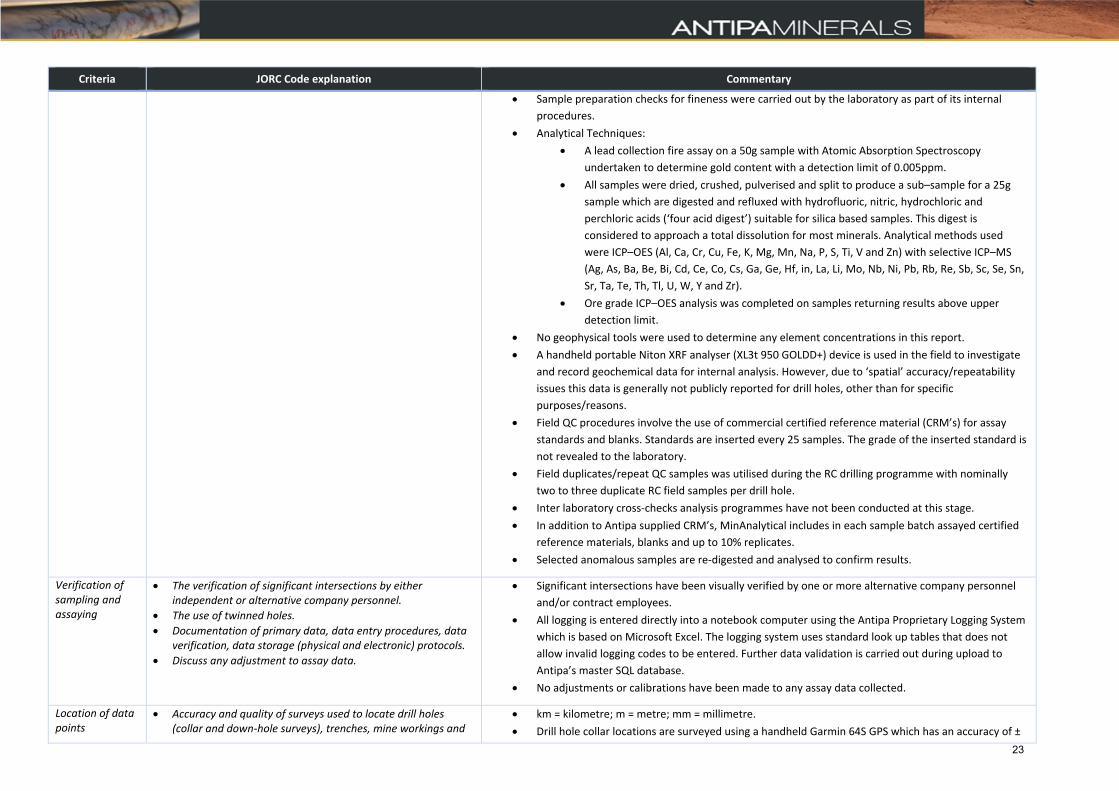
Analytical Techniques:
A lead collection fire assay on a 50g sample with Atomic Absorption Spectroscopy
undertaken to determine gold content with a detection limit of 0.005ppm.
All samples were dried, crushed, pulverised and split to produce a sub–sample for a 25g
sample which are digested and refluxed with hydrofluoric, nitric, hydrochloric and
perchloric acids (‘four acid digest’) suitable for silica based samples. This digest is
considered to approach a total dissolution for most minerals. Analytical methods used
were ICP–OES (Al, Ca, Cr, Cu, Fe, K, Mg, Mn, Na, P, S, Ti, V and Zn) with selective ICP–MS
(Ag, As, Ba, Be, Bi, Cd, Ce, Co, Cs, Ga, Ge, Hf, in, La, Li, Mo, Nb, Ni, Pb, Rb, Re, Sb, Sc, Se, Sn,
Sr, Ta, Te, Th, Tl, U, W, Y and Zr).
Ore grade ICP–OES analysis was completed on samples returning results above upper
detection limit.
No geophysical tools were used to determine any element concentrations in this report.
A handheld portable Niton XRF analyser (XL3t 950 GOLDD+) device is used in the field to investigate
and record geochemical data for internal analysis. However, due to ‘spatial’ accuracy/repeatability
issues this data is generally not publicly reported for drill holes, other than for specific
purposes/reasons.
Field QC procedures involve the use of commercial certified reference material (CRM’s) for assay
standards and blanks. Standards are inserted every 25 samples. The grade of the inserted standard is
not revealed to the laboratory.
Field duplicates/repeat QC samples was utilised during the RC drilling programme with nominally
two to three duplicate RC field samples per drill hole.
Inter laboratory cross‐checks analysis programmes have not been conducted at this stage.
In addition to Antipa supplied CRM’s, MinAnalytical includes in each sample batch assayed certified
reference materials, blanks and up to 10% replicates.
Selected anomalous samples are re‐digested and analysed to confirm results.
Verification of sampling and assaying
The verification of significant intersections by either independent or alternative company personnel.
The use of twinned holes.
Documentation of primary data, data entry procedures, data verification, data storage (physical and electronic) protocols.
Discuss any adjustment to assay data.
Significant intersections have been visually verified by one or more alternative company personnel
and/or contract employees.
All logging is entered directly into a notebook computer using the Antipa Proprietary Logging System
which is based on Microsoft Excel. The logging system uses standard look up tables that does not
allow invalid logging codes to be entered. Further data validation is carried out during upload to
Antipa’s master SQL database.
No adjustments or calibrations have been made to any assay data collected.
Location of data points
Accuracy and quality of surveys used to locate drill holes (collar and down‐hole surveys), trenches, mine workings and
km = kilometre; m = metre; mm = millimetre.
Drill hole collar locations are surveyed using a handheld Garmin 64S GPS which has an accuracy of ±
23
Criteria JORC Code explanation Commentary
other locations used in Mineral Resource estimation.
Specification of the grid system used.
Quality and adequacy of topographic control.
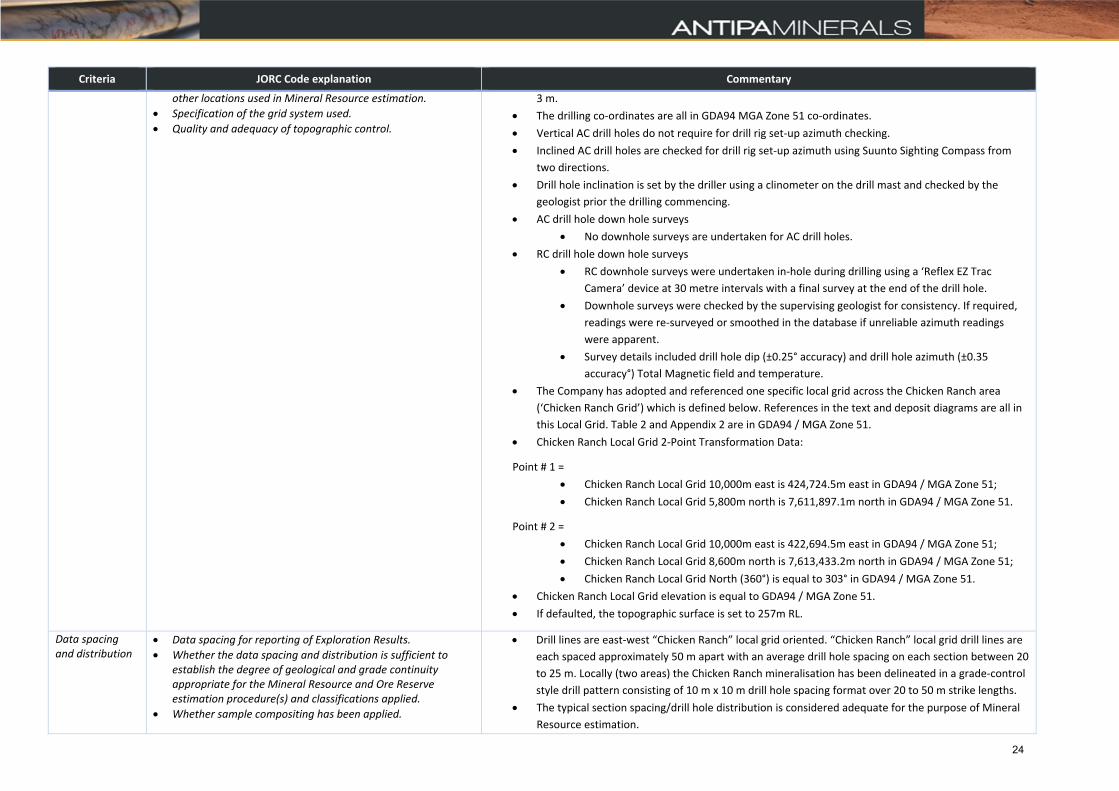
3 m.
The drilling co‐ordinates are all in GDA94 MGA Zone 51 co‐ordinates.
Vertical AC drill holes do not require for drill rig set‐up azimuth checking.
Inclined AC drill holes are checked for drill rig set‐up azimuth using Suunto Sighting Compass from
two directions.
Drill hole inclination is set by the driller using a clinometer on the drill mast and checked by the
geologist prior the drilling commencing.
AC drill hole down hole surveys
No downhole surveys are undertaken for AC drill holes.
RC drill hole down hole surveys
RC downhole surveys were undertaken in‐hole during drilling using a ‘Reflex EZ Trac
Camera’ device at 30 metre intervals with a final survey at the end of the drill hole.
Downhole surveys were checked by the supervising geologist for consistency. If required,
readings were re‐surveyed or smoothed in the database if unreliable azimuth readings
were apparent.
Survey details included drill hole dip (±0.25° accuracy) and drill hole azimuth (±0.35
accuracy°) Total Magnetic field and temperature.
The Company has adopted and referenced one specific local grid across the Chicken Ranch area
(‘Chicken Ranch Grid’) which is defined below. References in the text and deposit diagrams are all in
this Local Grid. Table 2 and Appendix 2 are in GDA94 / MGA Zone 51.
Chicken Ranch Local Grid 2‐Point Transformation Data:
Point # 1 =
Chicken Ranch Local Grid 10,000m east is 424,724.5m east in GDA94 / MGA Zone 51;
Chicken Ranch Local Grid 5,800m north is 7,611,897.1m north in GDA94 / MGA Zone 51.
Point # 2 =
Chicken Ranch Local Grid 10,000m east is 422,694.5m east in GDA94 / MGA Zone 51;
Chicken Ranch Local Grid 8,600m north is 7,613,433.2m north in GDA94 / MGA Zone 51;
Chicken Ranch Local Grid North (360°) is equal to 303° in GDA94 / MGA Zone 51.
Chicken Ranch Local Grid elevation is equal to GDA94 / MGA Zone 51.
If defaulted, the topographic surface is set to 257m RL.
Data spacing and distribution
Data spacing for reporting of Exploration Results.
Whether the data spacing and distribution is sufficient to establish the degree of geological and grade continuity appropriate for the Mineral Resource and Ore Reserve estimation procedure(s) and classifications applied.
Whether sample compositing has been applied.
Drill lines are east‐west “Chicken Ranch” local grid oriented. “Chicken Ranch” local grid drill lines are
each spaced approximately 50 m apart with an average drill hole spacing on each section between 20
to 25 m. Locally (two areas) the Chicken Ranch mineralisation has been delineated in a grade‐control
style drill pattern consisting of 10 m x 10 m drill hole spacing format over 20 to 50 m strike lengths.
The typical section spacing/drill hole distribution is considered adequate for the purpose of Mineral
Resource estimation.
24
Criteria JORC Code explanation Commentary
AC and RC drill sample compositing has been applied for the reporting of exploration results.
Orientation of data in relation to geological structure
Whether the orientation of sampling achieves unbiased sampling of possible structures and the extent to which this is known, considering the deposit type.
If the relationship between the drilling orientation and the orientation of key mineralised structures is considered to have introduced a sampling bias, this should be assessed and reported if material.
The location and orientation of the Chicken Ranch drilling is appropriate given the strike, dip and
morphology of the mineralisation.
No consistent and/or documented material sampling bias resulting from a structural orientation has
been identified at Chicken Ranch at this point; however, both folding, multiple vein directions and
faulting have been recorded via diamond drilling and surface mapping.
Sample security The measures taken to ensure sample security. Chain of sample custody is managed by Antipa to ensure appropriate levels of sample security.
Samples are stored on site and delivered by Antipa or their representatives to Port Hedland and
subsequently by Toll Ipec Transport from Newman to the assay laboratory in Perth.
Audits or reviews The results of any audits or reviews of sampling techniques and data.
Sampling techniques and procedures are regularly reviewed internally, as is the data.
Consultants Snowden, during completion of the 2013 Calibre Mineral Resource estimate, undertook
a desktop review of the Company’s sampling techniques and data management and found them to
be consistent with industry standards.
CHICKEN RANCH AREA – 2018 Air Core and Reverse Circulation Drill Hole Sampling
Section 2 – Reporting of Exploration Results (Criteria listed in the preceding section also apply to this section)
Criteria JORC Code explanation Commentary
Mineral tenement and land tenure status
Type, reference name/number, location and ownership including agreements or material issues with third parties such as joint ventures, partnerships, overriding royalties, native title interests, historical sites, wilderness or national park and environmental settings.
The security of the tenure held at the time of reporting along with any known impediments to obtaining a licence to operate in the area.
Tenement E45/4867 was applied for by Antipa Resources Pty Ltd on the 19th of January 2017.
Multiple parties ‘simultaneously’ lodged applications over the area, and the decision went to a ballot
before the Warden’s Court in July 2017.
Tenement E45/4867 was awarded in full to Antipa and was subsequently granted on the 3rd of
January 2018.
Antipa Minerals Ltd has a 100% interest in E45/4867 and no existing royalties or prior agreements
apply.
Tenement E45/4867, including the Chicken Ranch and Turkey Farm deposits, is not subject to the
Citadel Project Farm‐in Agreement with Rio Tinto Exploration Pty Ltd.
All tenements are contained completely within land where the Martu People have been determined
to hold native title rights. To the Company’s knowledge no historical or environmentally sensitive
sites have been identified in the area of work.
Land Access and Exploration Agreements are in place with the Martu People.
Antipa maintains a positive relationship with the Martu People, who are Native Title parties in the
area.
The tenement is in good standing and no known impediments exist.
25
Criteria JORC Code explanation Commentary
Exploration done by other parties
Acknowledgment and appraisal of exploration by other parties.
The exploration of the Chicken Ranch area was conducted by the following major resources
companies:
Newmont Pty Ltd (early 1970s to 1986);
Carr Boyd Minerals Limited (1973 to 1975);
Geopeko Limited (JV with Carr Boyd) (1975 to 1978);
Marathon Petroleum Australia Limited (1979);
Western Mining Corporation Limited (WMC) (1980);
Duval Mining (Australia) Limited (Carr Boyd JV with Picon Exploration Pty Ltd) (1984 to
1986);
Mount Burgess Gold Mining Company N.L. (1989 to 2001);
Carpentaria (MIM JV with Mount Burgess) (1990 to 1996);
Normandy (JV with Mount Burgess) (1998 to 2000);
Newcrest Mining Limited (2009 to 2015);
Quantum Resources Limited (2012 to 2016); and
Antipa Minerals Limited (2016 to current).
Geology Deposit type, geological setting and style of mineralisation. Chicken Ranch Tenement Area:
The geology of the is dominated by a northwest trending sequence of moderate to steeply east
dipping meta‐sediments, including siltstone, carbonate siltstone, dolomite, and subordinate fine‐
grained sandstone of the Puntapunta Formation.
This sequence occurs on the northeast flank of the Camp Dome complex, a regional scale doubly
plunging anticline. Regional mapping undertaken by previous explorers indicates that the Chicken
Ranch prospect may be related to a parasitic fold on the flank of the Camp Dome, or a separate fold
structure altogether.
High‐grade gold with minor copper mineralisation as gossanous zones within and related to
northwest trending, steeply dipping quartz veins hosted by deeply oxidized meta‐sediments,
including goethite pseudomorphs after massive pyrite alteration (some cubic ex‐pyrite oxide
pseudomorphs up to 2cm in size, similar in size to those collected in the early 1970’s associated with
the then outcropping Telfer gold mineralisation).
The entire zone is deeply oxidized.
Main zone consists of two or more northwest trending zones of mineralisation within a corridor up
to 70m in width.
The southwest lens of mineralisation is more persistent and has a strike length of approximately
1,300m.
Several additional northwestern trending mineralisation zones to the east and west of the main
zone.
The Turkey Farm prospect occurs 800m west‐northwest of the Chicken Ranch deposit, and gold with
minor copper mineralisation within northwest trending, steeply dipping quartz ironstone veins and
possible shallow (25° to 30°) east dipping zones hosted by deeply oxidized meta‐sediments.
The area is prospective for high‐grade Telfer ‘Reef Style’ gold mineralisation and vein and/or
stockwork style mineralisation.
26
Criteria JORC Code explanation Commentary
North‐south striking fault zones (possible Telfer “Graben Fault” generation), appear to offset
stratigraphy and mineralisation dominantly with an apparent sinistral sense which may represent
simple normal displacement with east‐block up / west‐block down of northeasterly dipping
stratigraphy.
Drill hole Information
A summary of all information material to the understanding of the exploration results including a tabulation of the following information for all Material drill holes:
easting and northing of the drill hole collar
elevation or RL (Reduced Level – elevation above sea level in metres) of the drill hole collar
dip and azimuth of the hole
down hole length and interception depth
hole length.
If the exclusion of this information is justified on the basis that the information is not Material and this exclusion does not detract from the understanding of the report, the Competent Person should clearly explain why this is the case.
A summary of all available information material to the understanding of the Chicken Ranch region
exploration results can be found in previous Western Australia (WA) DMIRS publicly available
reports.
All the various technical and Chicken Ranch region exploration reports are publicly accessible via the
WA DMIRS’ online WAMEX system.
The specific WA DMIRS WAMEX and other reports related to the exploration information the subject
of this public disclosure have been referenced in previous public reports.
Antipa Minerals Ltd publicly disclosed reports provide details of all exploration completed by the
Company since 2017; these reports are all available to view on www.antipaminerals.com.au and
www.asx.com.au.
Data aggregation methods
In reporting Exploration Results, weighting averaging techniques, maximum and/or minimum grade truncations (e.g. cutting of high grades) and cut‐off grades are usually Material and should be stated.
Where aggregate intercepts incorporate short lengths of high grade results and longer lengths of low grade results, the procedure used for such aggregation should be stated and some typical examples of such aggregations should be shown in detail.
The assumptions used for any reporting of metal equivalent values should be clearly stated.
Reported aggregated intervals have been length weighted.
No density or bulk density is available and so no density weighting has been applied when calculating
aggregated intervals.
No top‐cuts to gold or copper have been applied (unless specified otherwise).
A nominal 0.40 g/t gold or 0.10% copper lower cut‐off grade is applied.
Higher grade intervals of mineralisation internal to broader zones of mineralisation are reported as
included intervals.
Metal equivalence is not used in this report.
Relationship between mineralisation widths and intercept lengths
These relationships are particularly important in the reporting of Exploration Results.
If the geometry of the mineralisation with respect to the drill hole angle is known, its nature should be reported.
If it is not known and only the down hole lengths are reported, there should be a clear statement to this effect (e.g. ‘down hole length, true width not known’).
Given the variety of drill hole types and distribution, the intersection angles for the various historic
drilling generations are likely to be quite variable. The reported downhole intersections are
estimated to commonly be in the range of 30% to 70% ± 10% of the true width.
Diagrams Appropriate maps and sections (with scales) and tabulations of intercepts should be included for any significant discovery being reported These should include, but not be limited to a plan view of drill hole collar locations and appropriate sectional views.
All appropriate maps and sections (with scales) and tabulations of intercepts are reported or can
sometimes be found in previous WA DMIRS WAMEX publicly available reports.
Antipa Minerals Ltd publicly disclosed reports provide maps and sections (with scales) and
tabulations of intercepts generated by the Company since 2017; these reports are all available to
view on www.antipaminerals.com.au and www.asx.com.au.
27
Criteria JORC Code explanation Commentary
Balanced reporting
Where comprehensive reporting of all Exploration Results is not practicable, representative reporting of both low and high grades and/or widths should be practiced to avoid misleading reporting of Exploration Results.
All significant results are reported or can sometimes be found in previous WA DMIRS WAMEX
publicly available reports.
Antipa Minerals Ltd publicly disclosed reports provide details of all significant exploration results
generated by the Company since 2017; these reports are all available to view on
www.antipaminerals.com.au and www.asx.com.au.
Other substantive exploration data
Other exploration data, if meaningful and material, should be reported including (but not limited to): geological observations; geophysical survey results; geochemical survey results; bulk samples – size and method of treatment; metallurgical test results; bulk density, groundwater, geotechnical and rock characteristics; potential deleterious or contaminating substances.
All meaningful and material information has been included in the body of the text or can sometimes
be found in previous WA DMIRS WAMEX publicly available reports.
Zones of mineralisation and associated waste material have not been measured for their bulk
density. Multi element assaying was conducted variously for a suite of potentially deleterious
elements including arsenic, sulfur, lead, zinc and magnesium.
Downhole ‘logging’ of a selection of Chicken Ranch 2018 RC drill holes using an OBI40 Optical
Televiewer generated an oriented 360° image of the drill hole walls via a CCD camera recorded
digital image. The OBI40 system utilised also included a North Seeking Gyro‐scope to measure drill
hole location/deviation, and the downhole survey also measured rock density, magnetic
susceptibility, natural gamma and included a borehole caliper device for measuring drill hole
diameter. The combined dataset collected via the OBI40 Optical Televiewer downhole survey data
has multiple geological and geotechnical uses, including but not limited to the detection and
determination of in‐situ lithological, structural and mineralisation feature orientations (i.e. dip and
strike), determination and orientation of fracture frequency, general ground conditions/stability,
oxidation conditions, ground‐water table and clarity, etc. To date the following Chicken Ranch
deposit downhole ‘logging’ surveys have been completed:
A programme of OBI40 Optical Televiewer downhole ‘logging’ for a selection of 2018 RC
Chicken Ranch drill holes (total of 3 holes for 198 m) was completed during October 2018.
No Geotechnical logging (e.g. Recovery, RQD and Fracture Frequency) was obtained from the WA
DMIRS WAMEX reports.
Limited information on structure type, dip, dip direction, alpha angle, beta angle, gamma angle,
texture and fill material was obtained from the WA DMIRS WAMEX reports.
No metallurgical test‐work results are available for the Chicken Ranch deposits.
Further work The nature and scale of planned further work (e.g. tests for lateral extensions or depth extensions or large‐scale step‐out drilling).
Diagrams clearly highlighting the areas of possible extensions, including the main geological interpretations and future drilling areas, provided this information is not commercially sensitive.
Planned further work:
Ongoing review and interpretations of the 2018 and historical Chicken Ranch and Turkey
Farm exploration data;
Planning and potential future execution of exploration activities to identify both depth and
lateral extensions to potential high‐grade gold mineralisation;
Full geological interpretation, 3D modelling and subsequent Mineral Resource estimation.
All appropriate maps and sections (with scales) and tabulations of intercepts are reported or can
sometimes be found in previous WA DMIRS WAMEX publicly available reports.
28
MINYARI DOME AREA – 2018 Reverse Circulation Drilling Programme
JORC Code 2012 Edition: Table 1 - Section 1 Sampling Techniques and Data (Criteria in this section shall apply to all succeeding sections)
Criteria JORC Code explanation Commentary
Sampling techniques
Nature and quality of sampling (e.g. cut channels, random chips, or specific specialised industry standard measurement tools appropriate to the minerals under investigation, such as down hole gamma sondes, or handheld XRF instruments, etc). These examples should not be taken as limiting the broad meaning of sampling.
Include reference to measures taken to ensure sample representivity and the appropriate calibration of any measurement tools or systems used.
Aspects of the determination of mineralisation that are Material to the Public Report.
In cases where ‘industry standard’ work has been done this would be relatively simple (e.g. ‘reverse circulation drilling was used to obtain 1 m samples from which 3 kg was pulverised to produce a 30 g charge for fire assay’). In other cases more explanation may be required, such as where there is coarse gold that has inherent sampling problems. Unusual commodities or mineralisation types (e.g. submarine nodules) may warrant disclosure of detailed information.
2018 Reverse Circulation (RC) Drilling
Minyari Dome Area Prospects/Targets:
Air Core and geophysical targets have been evaluated by the 2018 RC drilling programme.
A total of fifty‐one (51) 2018 RC drill holes were completed at the Minyari Dome, totaling 8,077m,
with an average maximum drill hole depth of 162m.
The eighteen (18) 2018 RC drill holes which are the subject of this public disclosure are 18MYC0167
to 18MYC0184 inclusive, totaling 2,778m, with an average maximum drill hole depth of 154m.
Assay results for 2018 RC drill hole 18MYC0146, hole depth 153m, were previously publicly reported
on the 1 August 2018.
Assay results for twenty‐six (26) 2018 RC drill holes being 18MYC0140 to 18MYC0145 and
18MYC0147 to 18MYC0166, totaling 4,541m, with an average maximum drill hole depth of 175m,
were previously publicly reported on the 2 October 2018.
Assay results are pending for five (5) 2018 RC drill holes (i.e. 18MYC0185 to 18MYC0189), totaling
605m with an average maximum drill hole depth of 121m.
Drill hole locations for these 2018 holes are tabulated in the body of this report.
RC Sampling:
RC Sampling was carried out under Antipa protocols and QAQC procedures as per industry best
practice.
RC samples were drilled using a 140mm diameter face sampling hammer and sampled on intervals of
1.0m using a rig mounted cone splitter from which a 2 kg (average) sample which was pulverised at
the laboratory to produce material for assay.
Compositing of unmineralised regions (guided by Niton portable XRF field analysis) of between 2 to
4m was undertaken via combining ‘Spear’ samples of the unmineralised sample intervals to generate
a 2 kg (average) sample which was pulverised at the laboratory to produce material for assay.
Drilling techniques
Drill type (e.g. core, reverse circulation, open‐hole hammer, rotary air blast, auger, Bangka, sonic, etc) and details (e.g. core diameter, triple or standard tube, depth of diamond tails, face‐sampling bit or other type, whether core is oriented and if so, by what method, etc).
Reverse Circulation Drilling
All drill holes were completed using 140mm RC face sampling hammer drill bit from surface to the
end of hole.
Drill holes were predominantly angled towards local grid east (058o Magnetic), with some drill holes
directed to local grid west, all drill holes at an inclination angle of between ‐55° to ‐65°.
Drill sample recovery
Method of recording and assessing core and chip sample recoveries and results assessed.
Measures taken to maximise sample recovery and ensure representative nature of the samples.
Whether a relationship exists between sample recovery and
RC Drill Samples
RC sample recovery was recorded via visual estimation of sample volume.
RC sample recovery typically ranges from 90 to 100%, with only very occasional samples with less
than 70% recovery.
RC sample recovery was maximized by endeavoring to maintain a dry drilling conditions as much as
29
Criteria JORC Code explanation Commentary
grade and whether sample bias may have occurred due to preferential loss/gain of fine/coarse material.
practicable; the RC samples were almost exclusively dry.
All samples were split on a 1m interval using a rig‐mounted cone splitter. Adjustments were made to
ensure representative 2 to 3kg sample volumes were collected.
Relationships between recovery and grade are not evident and are not expected given the generally
excellent and consistently high sample recovery.
RC sample recovery and sample quality was recorded via visual estimation of sample volume and
condition of the drill spoils.
RC results are generated for the purpose of exploration and potentially for Mineral Resource
estimations.
Logging Whether core and chip samples have been geologically and geotechnically logged to a level of detail to support appropriate Mineral Resource estimation, mining studies and metallurgical studies.
Whether logging is qualitative or quantitative in nature. Core (or costean, channel, etc) photography.
The total length and percentage of the relevant intersections logged.
RC Drill Logging
All RC material is logged.
Logging includes both qualitative and quantitative components.
All logging is entered directly into a notebook computer using the Antipa Proprietary Logging System
which is based on Microsoft Excel. The logging system uses standard look up tables that does not
allow invalid logging codes to be entered. Further data validation is carried out during upload to
Antipa’s master Access SQL database.
Geological logging of 100% of all RC sample intervals was carried out recording colour, weathering,
lithology, mineralogy, alteration, veining and sulphides.
RC sample intervals were routinely measured for magnetic susceptibility using a handheld Magnetic
Susceptibility meter.
RC samples are generally analyzed in the field using a Portable XRF Device (Niton) for the purposes of
geochemical and lithological interpretation and the selection of sampling intervals.
Sub‐sampling techniques and sample preparation
If core, whether cut or sawn and whether quarter, half or all core taken.
If non‐core, whether riffled, tube sampled, rotary split, etc and whether sampled wet or dry.
For all sample types, the nature, quality and appropriateness of the sample preparation technique.
Quality control procedures adopted for all sub‐sampling stages to maximise representivity of samples.
Measures taken to ensure that the sampling is representative of the in situ material collected, including for instance results for field duplicate/second‐half sampling.
Whether sample sizes are appropriate to the grain size of the material being sampled.
RC Samples
RC samples for all drill holes were drilled using a 140mm diameter face sampling hammer and split
on intervals of 1.0m using a rig mounted cone splitter from which a 3 kg (average) sample which was
pulverised at the laboratory pulverised to produce material for assay.
Compositing of unmineralised regions (guided by Portable XRF / Niton field analysis) of between 2 to
4m was undertaken via combining ‘Spear’ samples of the unmineralised sample intervals to generate
a 3 kg (average) sample which was pulverised at the laboratory to produce material for assay.
Field duplicate samples were collected for all RC drill holes.
RC Sample Preparation
Sample preparation of RC samples was completed at MinAnalytical Laboratories in Perth following
industry best practice in sample preparation involving oven drying, coarse crushing of the sample
down to approximately 10mm, followed by pulverisation of the entire sample (total prep) using Essa
LM5 grinding mills to a grind size of 85% passing 75 µm and split into a sub–sample/s for analysis.
The sample sizes are considered to be appropriate to correctly represent the sulphide style of
mineralisation at Minyari, the thickness and consistency of the intersections and the sampling
30
Criteria JORC Code explanation Commentary
methodology.
Quality of assay data and laboratory tests
The nature, quality and appropriateness of the assaying and laboratory procedures used and whether the technique is considered partial or total.
For geophysical tools, spectrometers, handheld XRF instruments, etc, the parameters used in determining the analysis including instrument make and model, reading times, calibrations factors applied and their derivation, etc.
Nature of quality control procedures adopted (e.g. standards, blanks, duplicates, external laboratory checks) and whether acceptable levels of accuracy (i.e. lack of bias) and precision have been established.
The sample preparation technique for RC samples is documented by Antipa Mineral Ltd’s standard
procedures documents and is in line with industry standards in sample preparation.
The sample sizes are considered appropriate to represent mineralisation.
Sample preparation checks for fineness were carried out by the laboratory as part of its internal
procedures.
Analytical Techniques:
A lead collection fire assay on a 50g sample with Atomic Absorption Spectroscopy
undertaken to determine gold content with a detection limit of 0.005ppm.
All samples were dried, crushed, pulverised and split to produce a sub–sample for a 25g
sample which are digested and refluxed with hydrofluoric, nitric, hydrochloric and
perchloric acids (‘four acid digest’) suitable for silica based samples. This digest is
considered to approach a total dissolution for most minerals. Analytical methods used
were ICP–OES (Al, Ca, Cr, Cu, Fe, K, Mg, Mn, Na, P, S, Ti, V and Zn) with selective ICP–MS
(Ag, As, Ba, Be, Bi, Cd, Ce, Co, Cs, Ga, Ge, Hf, in, La, Li, Mo, Nb, Ni, Pb, Rb, Re, Sb, Sc, Se, Sn,
Sr, Ta, Te, Th, Tl, U, W, Y and Zr).
Ore grade ICP–OES analysis was completed on samples returning results above upper
detection limit.
No geophysical tools were used to determine any element concentrations in this report.
A handheld portable Niton XRF analyser (XL3t 950 GOLDD+) device is used in the field to investigate
and record geochemical data for internal analysis. However, due to ‘spatial’ accuracy/repeatability
issues this data is generally not publicly reported for drill holes, other than for specific
purposes/reasons.
Field QC procedures involve the use of commercial certified reference material (CRM’s) for assay
standards and blanks. Standards are inserted every 25 samples. The grade of the inserted standard is
not revealed to the laboratory.
Field duplicates/repeat QC samples was utilised during the RC drilling programme with nominally
two to three duplicate RC field samples per drill hole.
Inter laboratory cross‐checks analysis programmes have not been conducted at this stage.
In addition to Antipa supplied CRM’s, MinAnalytical includes in each sample batch assayed certified
reference materials, blanks and up to 10% replicates.
Selected anomalous samples are re‐digested and analysed to confirm results.
Verification of sampling and assaying
The verification of significant intersections by either independent or alternative company personnel.
The use of twinned holes.
Documentation of primary data, data entry procedures, data verification, data storage (physical and electronic) protocols.
Significant intersections of the drilling have been visually verified by highly experienced Antipa
Project geologists.
All logging is entered directly into a notebook computer using the Antipa Proprietary Logging System
which is based on Microsoft Excel. The logging system uses standard look up tables that does not
allow invalid logging codes to be entered. Further data validation is carried out during upload to
31
Criteria JORC Code explanation Commentary
Discuss any adjustment to assay data. Antipa’s master SQL database.
No adjustments or calibrations have been made to any assay data collected.
Location of data points
Accuracy and quality of surveys used to locate drill holes (collar and down‐hole surveys), trenches, mine workings and other locations used in Mineral Resource estimation.
Specification of the grid system used.
Quality and adequacy of topographic control.
km = kilometre; m = metre; mm = millimetre.
Drill hole collar locations are surveyed using a handheld Garmin 64S GPS which has an accuracy of ±
3m.
The drilling co‐ordinates are all in GDA94 MGA Zone 51 co‐ordinates.
The Company has adopted and referenced one specific local grid across the Minyari Dome region
(‘Minyari’ Local Grid) which is defined below. References in the text and the Minyari deposit
diagrams are all in this specific Minyari Local Grid.
Minyari Local Grid 2‐Point Transformation Data:
Minyari Local Grid 47,400m east is 421,462.154m east in GDA94 / MGA Zone 51;
Minyari Local Grid 99,000m north is 7,632,467.588 m north in GDA94 / MGA Zone 51;
Minyari Local Grid 47,400m east is 414,078.609m east in GDA94 / MGA Zone 51;
Minyari Local Grid 113,000m north is 7,644,356.108m north in GDA94 / MGA Zone 51;
Minyari Local Grid North (360°) is equal to 330° in GDA94 / MGA Zone 51;
Minyari Local Grid elevation is equal to GDA94 / MGA Zone 51.
The topographic surface has been defaulted to 257m RL.
Rig orientation was checked using Suunto Sighting Compass from two directions.
Drill hole inclination was set by the driller using a clinometer on the drill mast and checked by the
geologist prior the drilling commencing.
The topographic surface has been compiled using the drill hole collar coordinates.
RC downhole surveys were undertaken in‐hole during drilling using a ‘Reflex EZ Trac Camera’ device
at 30 metre intervals with a final survey at the end of the drill hole.
Downhole surveys were checked by the supervising geologist for consistency. If required, readings
were re‐surveyed or smoothed in the database if unreliable azimuth readings were apparent.
Survey details included drill hole dip (±0.25° accuracy) and drill hole azimuth (±0.35 accuracy°) Total
Magnetic field and temperature.
Data spacing and distribution
Data spacing for reporting of Exploration Results.
Whether the data spacing and distribution is sufficient to establish the degree of geological and grade continuity appropriate for the Mineral Resource and Ore Reserve estimation procedure(s) and classifications applied.
Whether sample compositing has been applied.
The drill section spacing, at this stage, is insufficient to establish the degree of geological and grade
continuity necessary to support future Mineral Resource estimations.
RC drill sample compositing has been applied for the reporting of exploration results.
Orientation of data in relation to geological structure
Whether the orientation of sampling achieves unbiased sampling of possible structures and the extent to which this is known, considering the deposit type.
If the relationship between the drilling orientation and the orientation of key mineralised structures is considered to have
The drill section spacing and sampling, at this stage, is insufficient to establish the presence of any
possible sampling bias.
Based on the limited data currently available, the relationship between drilling orientation and key
mineralised structures is uncertain.
32
Criteria JORC Code explanation Commentary
introduced a sampling bias, this should be assessed and reported if material.
Sample security The measures taken to ensure sample security. Chain of sample custody is managed by Antipa to ensure appropriate levels of sample security.
Samples are stored on site and delivered by Antipa or their representatives to Newman and
subsequently by Centurion Transport from Newman to the assay laboratory in Perth.
Audits or reviews The results of any audits or reviews of sampling techniques and data.
Sampling techniques and procedures are regularly reviewed internally, as is the data.
Consultants Snowden, during completion of the 2013 Calibre Mineral Resource estimate, undertook
a desktop review of the Company’s sampling techniques and data management and found them to
be consistent with industry standards.
MINYARI DOME AREA – 2018 Reverse Circulation Drilling Programme
Section 2 – Reporting of Exploration Results (Criteria listed in the preceding section also apply to this section)
Criteria JORC Code explanation Commentary
Mineral tenement and land tenure status
Type, reference name/number, location and ownership including agreements or material issues with third parties such as joint ventures, partnerships, overriding royalties, native title interests, historical sites, wilderness or national park and environmental settings.
The security of the tenure held at the time of reporting along with any known impediments to obtaining a licence to operate in the area.
The Minyari Dome drilling and other exploration data is located wholly within Exploration Licenses
E45/3919 and E45/3917 (granted).
Antipa Minerals Ltd has a 100% interest in E45/3919 and E45/3917.
A 1% net smelter royalty payable to Paladin Energy on the sale of product on all metals applies to
these tenements as a condition of a Split Commodity Agreement with Paladin Energy in relation to
the Company’s North Telfer Project.
The North Telfer Project, including the Minyari deposit, is not subject to the Citadel Project Farm‐in
Agreement with Rio Tinto Exploration Pty Ltd.
All tenements are contained completely within land where the Martu People have been determined
to hold native title rights. To the Company’s knowledge no historical or environmentally sensitive
sites have been identified in the area of work.
Land Access and Exploration Agreements are in place with the Martu People.
Antipa maintains a positive relationship with the Martu People, who are Native Title parties in the
area.
The tenement is in good standing and no known impediments exist.
Exploration done by other parties
Acknowledgment and appraisal of exploration by other parties.
The Minyari and WACA deposits were greenfield discoveries by the Western Mining Corporation Ltd
during the early 1980’s.
Exploration of the Minyari Dome region has involved the following companies:
Western Mining Corporation Ltd (1980 to 1983);
Newmont Holdings Pty Ltd (1984 to 1990);
MIM Exploration Pty Ltd (1990 to 1991);
Newcrest Mining Limited (1991 to 2015); and
33
Criteria JORC Code explanation Commentary
Antipa Minerals Ltd (2016 onwards).
Geology Deposit type, geological setting and style of mineralisation. The geological setting is Paterson Province Proterozoic aged meta‐sediment hosted hydrothermal
shear, fault and strata/contact controlled precious and/or base metal mineralisation which is
typically sulphide bearing. The mineralisation in the region is interpreted to be granite related. The
Paterson is a low grade metamorphic terrane but local hydrothermal alteration and/or contact
metamorphic mineral assemblages and styles are indicative of a high‐temperature local
environment. Mineralisation styles include vein, stockwork, breccia and skarns.
Drill hole Information
A summary of all information material to the understanding of the exploration results including a tabulation of the following information for all Material drill holes:
easting and northing of the drill hole collar
elevation or RL (Reduced Level – elevation above sea level in metres) of the drill hole collar
dip and azimuth of the hole
down hole length and interception depth
hole length.
If the exclusion of this information is justified on the basis that the information is not Material and this exclusion does not detract from the understanding of the report, the Competent Person should clearly explain why this is the case.
A summary of all available information material to the understanding of the Minyari Dome region
exploration results can be found in previous WA DMIRS publicly available reports.
All the various technical Minyari Dome region exploration reports are publicly accessible via the
DMIRS’ online WAMEX system.
The specific WAMEX and other reports related to the exploration information the subject of this
public disclosure have been referenced in previous public reports.
Antipa Minerals Ltd publicly disclosed reports provide details of all exploration completed by the
Company since 2016; these reports are all available to view on www.antipaminerals.com.au and
www.asx.com.au.
Data aggregation methods
In reporting Exploration Results, weighting averaging techniques, maximum and/or minimum grade truncations (e.g. cutting of high grades) and cut‐off grades are usually Material and should be stated.
Where aggregate intercepts incorporate short lengths of high grade results and longer lengths of low grade results, the procedure used for such aggregation should be stated and some typical examples of such aggregations should be shown in detail.
The assumptions used for any reporting of metal equivalent values should be clearly stated.
Reported aggregated intervals have been length weighted.
No density or bulk density is available and so no density weighting has been applied when calculating
aggregated intervals.
No top‐cuts to gold or copper have been applied (unless specified otherwise).
A nominal 0.40 g/t gold or 0.10% copper lower cut‐off grade is applied during data aggregation.
Higher grade intervals of mineralisation internal to broader zones of mineralisation are reported as
included intervals.
Metal equivalence is not used in this report.
Relationship between mineralisation widths and intercept lengths
These relationships are particularly important in the reporting of Exploration Results.
If the geometry of the mineralisation with respect to the drill hole angle is known, its nature should be reported.
If it is not known and only the down hole lengths are reported, there should be a clear statement to this effect (e.g. ‘down hole length, true width not known’).
The drill section spacing and sampling, at this stage, is insufficient to establish the geometrical
relationships between the drill holes and the mineralised structures.
Therefore, at this stage the reported intersection lengths are down hole in nature and the true
width, which will be dependent on the local mineralisation geometry/setting, is not known.
Diagrams Appropriate maps and sections (with scales) and tabulations of intercepts should be included for any significant discovery being reported These should include, but not be limited to a
All appropriate maps and sections (with scales) and tabulations of intercepts are reported or can
sometimes be found in previous WA DMIRS WAMEX publicly available reports.
Antipa Minerals Ltd publicly disclosed reports provide maps and sections (with scales) and
34
Criteria JORC Code explanation Commentary
plan view of drill hole collar locations and appropriate sectional views.
tabulations of intercepts generated by the Company since 2016; these reports are all available to
view on www.antipaminerals.com.au and www.asx.com.au.
Balanced reporting
Where comprehensive reporting of all Exploration Results is not practicable, representative reporting of both low and high grades and/or widths should be practiced to avoid misleading reporting of Exploration Results.
All significant results are reported or can sometimes be found in previous WA DMIRS WAMEX
publicly available reports.
Antipa Minerals Ltd publicly disclosed reports provide details of all significant exploration results
generated by the Company since 2016; these reports are all available to view on
www.antipaminerals.com.au and www.asx.com.au.
Other substantive exploration data
Other exploration data, if meaningful and material, should be reported including (but not limited to): geological observations; geophysical survey results; geochemical survey results; bulk samples – size and method of treatment; metallurgical test results; bulk density, groundwater, geotechnical and rock characteristics; potential deleterious or contaminating substances.
All meaningful and material information has been included in the body of the text or can sometimes
be found in previous WA DMIRS WAMEX publicly available reports.
The details of the Minyari Dome region historic Induced Polarisation survey, including IP
Chargeability and resistivity anomalies, can be found in WA DMIRS publicly available WAMEX reports
A81227 (2008), A86106 (2009) and A89687 (2010).
The details of the Company’s reprocessing, review and modelling of the Minyari Dome region historic
Induced Polarisation survey, including IP Chargeability and resistivity anomalies, can be found in the
Company’s ASX report titled “Minyari Reprocessed IP Survey Results” created on 5 July 2016.
Zones of mineralisation and associated waste material have not been measured for their bulk
density; however, Specific Gravity (‘Density’) measurements will be taken from the 2016 diamond
drill core.
Multi element assaying was conducted variously for a suite of potentially deleterious elements
including arsenic, sulfur, lead, zinc and magnesium.
Geotechnical logging was carried out on three Minyari deposit diamond drill holes for Recovery, RQD and Fracture Frequency.
No Geotechnical logging (e.g. Recovery, RQD and Fracture Frequency) was obtained from the
WAMEX reports.
Downhole ‘logging’ of a selection of Minyari Dome RC drill holes drilled since 2016 using an OBI40
Optical Televiewer generated an oriented 360° image of the drill hole walls via a CCD camera
recorded digital image. The OBI40 system utilised also included a North Seeking Gyro‐scope to
measure drill hole location/deviation, and the downhole survey also measured rock density,
magnetic susceptibility, natural gamma and included a borehole caliper device for measuring drill
hole diameter. The combined dataset collected via the OBI40 Optical Televiewer downhole survey
data has multiple geological and geotechnical uses, including but not limited to the detection and
determination of in‐situ lithological, structural and mineralisation feature orientations (i.e. dip and
strike), determination and orientation of fracture frequency, general ground conditions/stability,
oxidation conditions, ground‐water table and clarity, etc. To date the following Minyari Dome area
downhole ‘logging’ surveys have been completed:
A programme of OBI40 Optical Televiewer downhole ‘logging’ for a selection of Minyari
deposit RC drill holes (i.e. Total 33 drill holes for 2,341m) was completed during 2016.
35
Criteria JORC Code explanation Commentary
A programme of OBI40 Optical Televiewer downhole ‘logging’ for a selection of 2017 Phase
1 RC drill holes (i.e. Total 16 holes for 3,279m = 13 holes for 2,771m at the WACA deposit, 2
holes for 428m at the Minyari deposit and 1 hole for 80m at the Jude’s prospect) was
completed during 2017.
A programme of OBI40 Optical Televiewer downhole ‘logging’ for a selection of 2018 RC
drill holes (Total of 8 holes for 638m = 6 holes for 448m at the Minyari South area and 2
holes for 190m at the Judes area) was completed between August and October 2018.
Information on structure type, dip, dip direction, alpha angle, beta angle, gamma angle, texture and
fill material derived mainly from diamond drilling is stored in the Company’s technical SQL database.
No information on structure type, dip, dip direction, alpha angle, beta angle, gamma angle, texture
and fill material was obtained from the WAMEX reports.
Preliminary metallurgical test‐work results are available for both the Minyari and WACA deposits.
Details of this 2017 metallurgical test‐work programme can be found on the ASX or Antipa websites
– Public release dated 13 June 2017 and titled “Minyari Dome Positive Metallurgical Test‐work
Results”. In summary both oxide and primary gold mineralisation (with accessory copper and cobalt)
responded very satisfactorily to conventional gravity and cyanidation processes, with flotation to
recovery copper and cobalt by‐products the subject of ongoing evaluation.
In addition, the following information in relation to metallurgy was obtained from WA DMIRS
WAMEX reports:
Newmont Holdings Pty Ltd collected two bulk (8 tonnes each) metallurgical samples of
oxide mineralisation in 1987 (i.e. WAMEX 1987 report A24464) from a 220m long costean
across the Minyari deposit. The bulk samples were 8 tonnes grading 1.5 g/t gold and 8
tonnes grading 3.57 g/t gold from below shallow cover in the costean. However, it would
appear the Newmont metallurgical test‐work for these two bulk samples was never
undertaken/competed as no results were subsequently reported to the WA DMIRS;
Newmont Holdings Pty Ltd also collected drill hole metallurgical samples for Minyari
deposit oxide and primary mineralisation (i.e. WAMEX 1986 report A19770); however,
subsequent reporting of any results to the WA DMIRS could not be located suggesting that
the metallurgical test‐work was never undertaken/competed.
Newcrest Mining Ltd describe the Minyari deposit gold‐copper mineralisation as being
typical of the Telfer gold‐copper mineralisation. In 2004 and 2005 (WAMEX reports A71875
and A74417) Newcrest commenced metallurgical studies for the Telfer Mine and due to
the similarities with the Minyari mineralisation a portion of this Telfer metallurgical test‐
work expenditure was apportioned to the then Newcrest Minyari tenements. Whilst Telfer
metallurgical results are not publicly available, the Telfer Mining operation (including ore
processing facility) was materially expanded in the mid‐2000’s and continues to operate
with viable metallurgical recoveries (for both oxide and primary mineralisation).
36
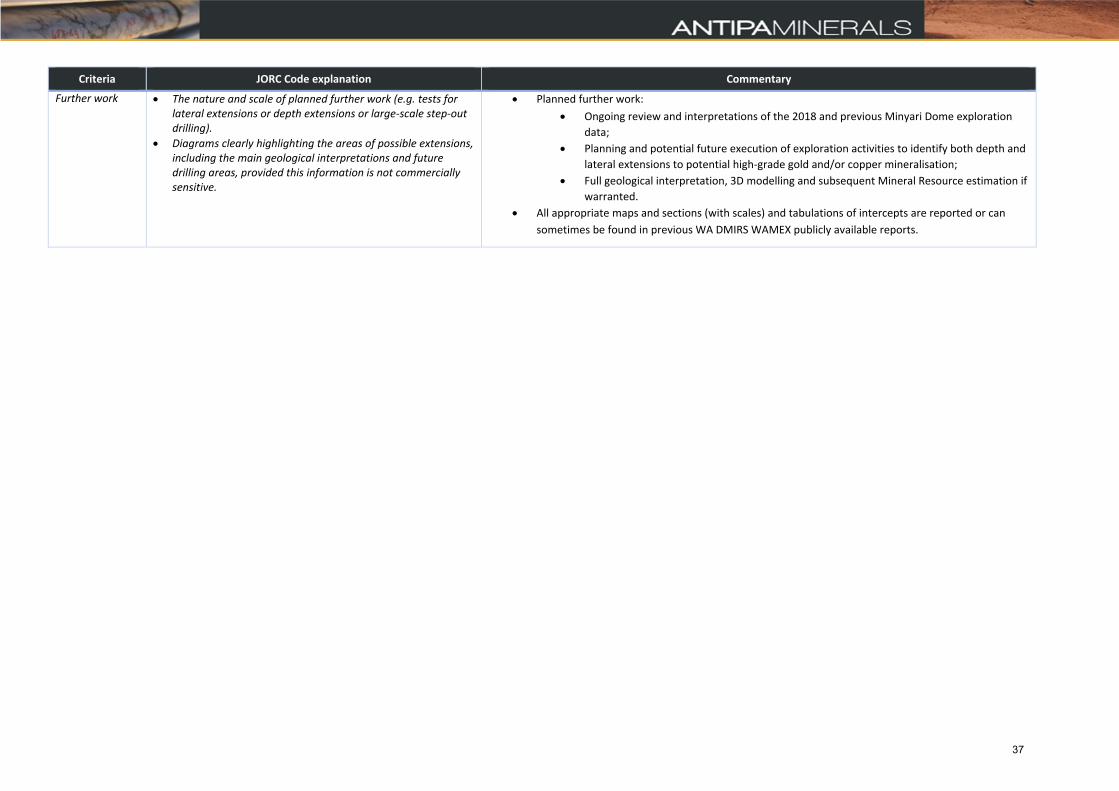
Criteria JORC Code explanation Commentary
Further work The nature and scale of planned further work (e.g. tests for lateral extensions or depth extensions or large‐scale step‐out drilling).
Diagrams clearly highlighting the areas of possible extensions, including the main geological interpretations and future drilling areas, provided this information is not commercially sensitive.
Planned further work:
Ongoing review and interpretations of the 2018 and previous Minyari Dome exploration
data;
Planning and potential future execution of exploration activities to identify both depth and
lateral extensions to potential high‐grade gold and/or copper mineralisation;
Full geological interpretation, 3D modelling and subsequent Mineral Resource estimation if
warranted.
All appropriate maps and sections (with scales) and tabulations of intercepts are reported or can
sometimes be found in previous WA DMIRS WAMEX publicly available reports.
37
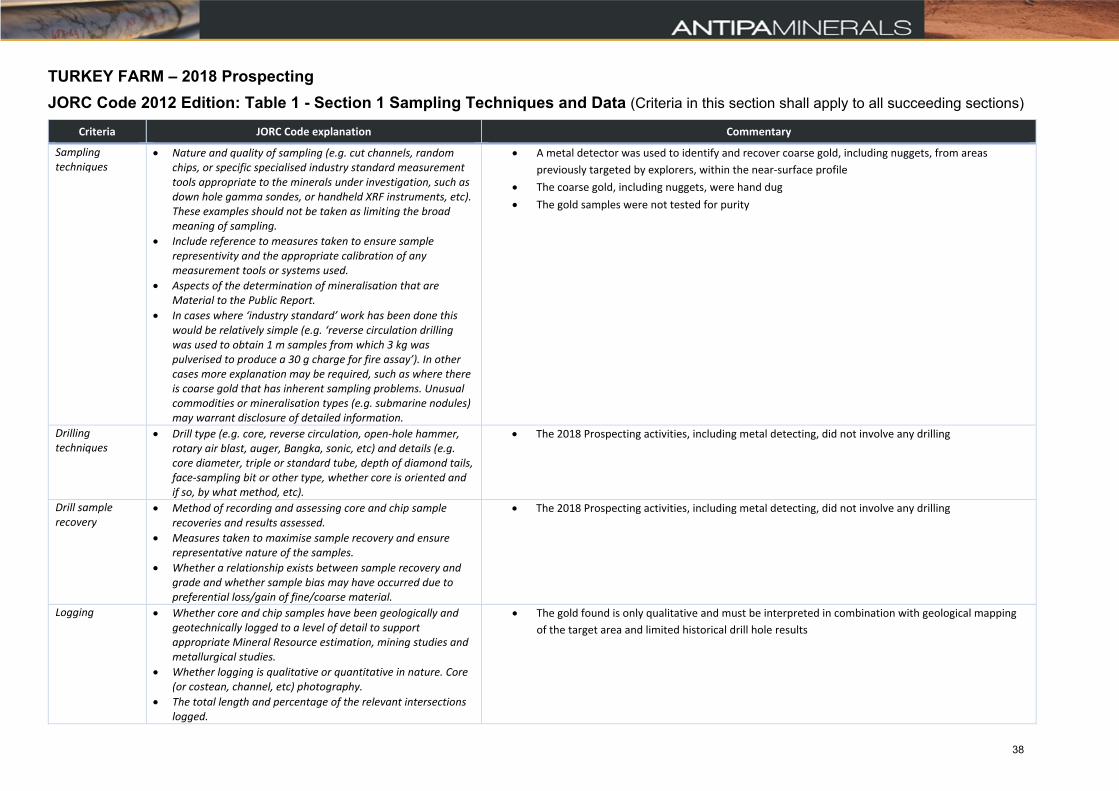
TURKEY FARM – 2018 Prospecting
JORC Code 2012 Edition: Table 1 - Section 1 Sampling Techniques and Data (Criteria in this section shall apply to all succeeding sections)
Criteria JORC Code explanation Commentary
Sampling techniques
Nature and quality of sampling (e.g. cut channels, random chips, or specific specialised industry standard measurement tools appropriate to the minerals under investigation, such as down hole gamma sondes, or handheld XRF instruments, etc). These examples should not be taken as limiting the broad meaning of sampling.
Include reference to measures taken to ensure sample representivity and the appropriate calibration of any measurement tools or systems used.
Aspects of the determination of mineralisation that are Material to the Public Report.
In cases where ‘industry standard’ work has been done this would be relatively simple (e.g. ‘reverse circulation drilling was used to obtain 1 m samples from which 3 kg was pulverised to produce a 30 g charge for fire assay’). In other cases more explanation may be required, such as where there is coarse gold that has inherent sampling problems. Unusual commodities or mineralisation types (e.g. submarine nodules) may warrant disclosure of detailed information.
A metal detector was used to identify and recover coarse gold, including nuggets, from areas
previously targeted by explorers, within the near‐surface profile
The coarse gold, including nuggets, were hand dug
The gold samples were not tested for purity
Drilling techniques
Drill type (e.g. core, reverse circulation, open‐hole hammer, rotary air blast, auger, Bangka, sonic, etc) and details (e.g. core diameter, triple or standard tube, depth of diamond tails, face‐sampling bit or other type, whether core is oriented and if so, by what method, etc).
The 2018 Prospecting activities, including metal detecting, did not involve any drilling
Drill sample recovery
Method of recording and assessing core and chip sample recoveries and results assessed.
Measures taken to maximise sample recovery and ensure representative nature of the samples.
Whether a relationship exists between sample recovery and grade and whether sample bias may have occurred due to preferential loss/gain of fine/coarse material.
The 2018 Prospecting activities, including metal detecting, did not involve any drilling
Logging Whether core and chip samples have been geologically and geotechnically logged to a level of detail to support appropriate Mineral Resource estimation, mining studies and metallurgical studies.
Whether logging is qualitative or quantitative in nature. Core (or costean, channel, etc) photography.
The total length and percentage of the relevant intersections logged.
The gold found is only qualitative and must be interpreted in combination with geological mapping
of the target area and limited historical drill hole results
38
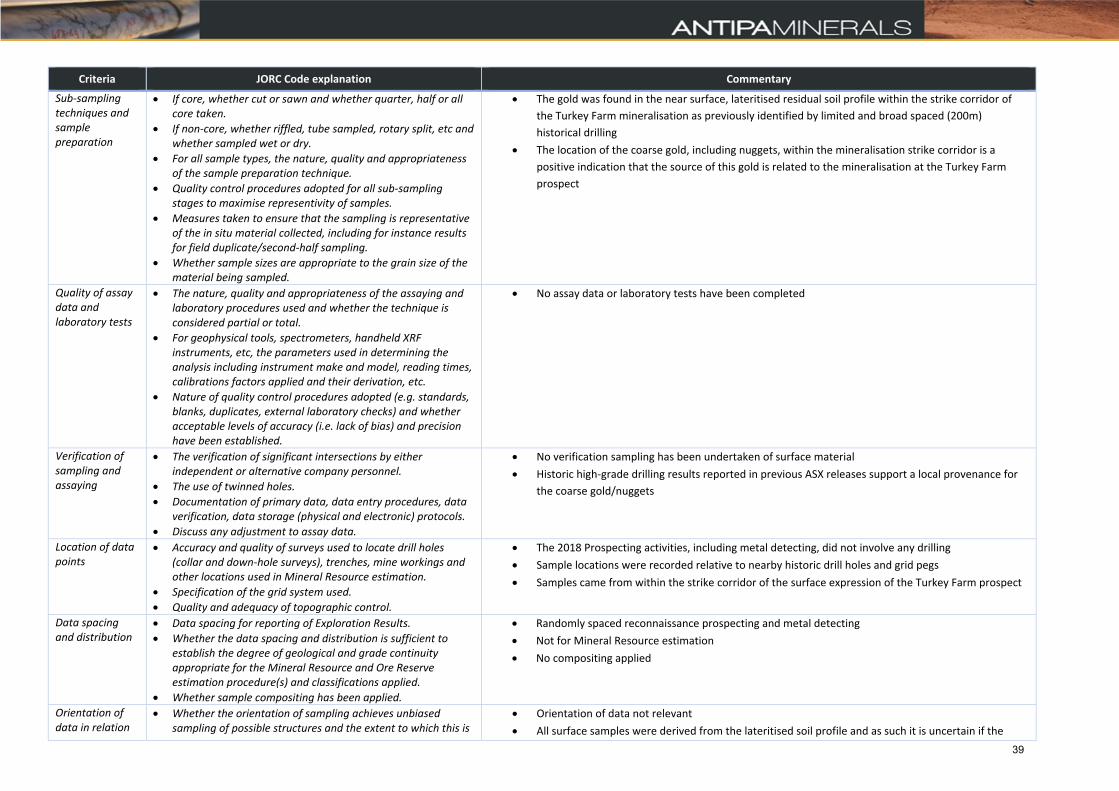
Criteria JORC Code explanation Commentary
Sub‐sampling techniques and sample preparation
If core, whether cut or sawn and whether quarter, half or all core taken.
If non‐core, whether riffled, tube sampled, rotary split, etc and whether sampled wet or dry.
For all sample types, the nature, quality and appropriateness of the sample preparation technique.
Quality control procedures adopted for all sub‐sampling stages to maximise representivity of samples.
Measures taken to ensure that the sampling is representative of the in situ material collected, including for instance results for field duplicate/second‐half sampling.
Whether sample sizes are appropriate to the grain size of the material being sampled.
The gold was found in the near surface, lateritised residual soil profile within the strike corridor of
the Turkey Farm mineralisation as previously identified by limited and broad spaced (200m)
historical drilling
The location of the coarse gold, including nuggets, within the mineralisation strike corridor is a
positive indication that the source of this gold is related to the mineralisation at the Turkey Farm
prospect
Quality of assay data and laboratory tests
The nature, quality and appropriateness of the assaying and laboratory procedures used and whether the technique is considered partial or total.
For geophysical tools, spectrometers, handheld XRF instruments, etc, the parameters used in determining the analysis including instrument make and model, reading times, calibrations factors applied and their derivation, etc.
Nature of quality control procedures adopted (e.g. standards, blanks, duplicates, external laboratory checks) and whether acceptable levels of accuracy (i.e. lack of bias) and precision have been established.
No assay data or laboratory tests have been completed
Verification of sampling and assaying
The verification of significant intersections by either independent or alternative company personnel.
The use of twinned holes.
Documentation of primary data, data entry procedures, data verification, data storage (physical and electronic) protocols.
Discuss any adjustment to assay data.
No verification sampling has been undertaken of surface material
Historic high‐grade drilling results reported in previous ASX releases support a local provenance for
the coarse gold/nuggets
Location of data points
Accuracy and quality of surveys used to locate drill holes (collar and down‐hole surveys), trenches, mine workings and other locations used in Mineral Resource estimation.
Specification of the grid system used.
Quality and adequacy of topographic control.
The 2018 Prospecting activities, including metal detecting, did not involve any drilling
Sample locations were recorded relative to nearby historic drill holes and grid pegs
Samples came from within the strike corridor of the surface expression of the Turkey Farm prospect
Data spacing and distribution
Data spacing for reporting of Exploration Results.
Whether the data spacing and distribution is sufficient to establish the degree of geological and grade continuity appropriate for the Mineral Resource and Ore Reserve estimation procedure(s) and classifications applied.
Whether sample compositing has been applied.
Randomly spaced reconnaissance prospecting and metal detecting
Not for Mineral Resource estimation
No compositing applied
Orientation of data in relation
Whether the orientation of sampling achieves unbiased sampling of possible structures and the extent to which this is
Orientation of data not relevant
All surface samples were derived from the lateritised soil profile and as such it is uncertain if the
39
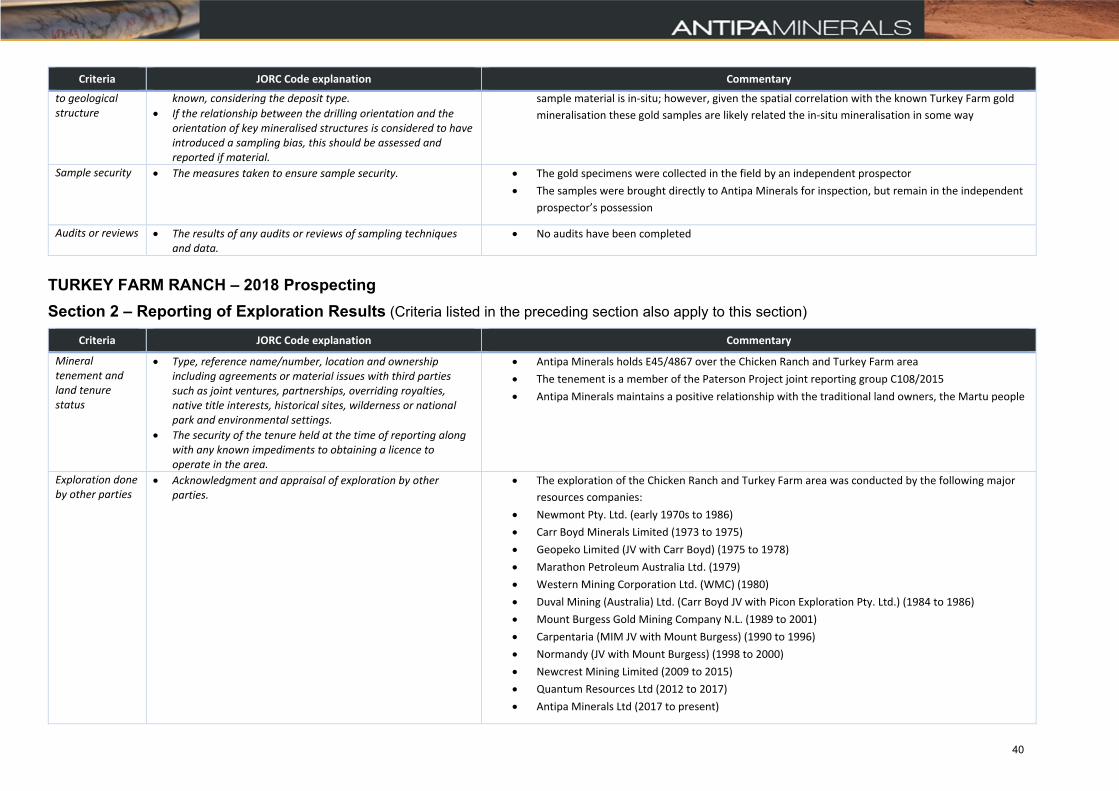
Criteria JORC Code explanation Commentary
to geological structure
known, considering the deposit type.
If the relationship between the drilling orientation and the orientation of key mineralised structures is considered to have introduced a sampling bias, this should be assessed and reported if material.
sample material is in‐situ; however, given the spatial correlation with the known Turkey Farm gold
mineralisation these gold samples are likely related the in‐situ mineralisation in some way
Sample security The measures taken to ensure sample security. The gold specimens were collected in the field by an independent prospector
The samples were brought directly to Antipa Minerals for inspection, but remain in the independent
prospector’s possession
Audits or reviews The results of any audits or reviews of sampling techniques and data.
No audits have been completed
TURKEY FARM RANCH – 2018 Prospecting
Section 2 – Reporting of Exploration Results (Criteria listed in the preceding section also apply to this section)
Criteria JORC Code explanation Commentary
Mineral tenement and land tenure status
Type, reference name/number, location and ownership including agreements or material issues with third parties such as joint ventures, partnerships, overriding royalties, native title interests, historical sites, wilderness or national park and environmental settings.
The security of the tenure held at the time of reporting along with any known impediments to obtaining a licence to operate in the area.
Antipa Minerals holds E45/4867 over the Chicken Ranch and Turkey Farm area
The tenement is a member of the Paterson Project joint reporting group C108/2015
Antipa Minerals maintains a positive relationship with the traditional land owners, the Martu people
Exploration done by other parties
Acknowledgment and appraisal of exploration by other parties.
The exploration of the Chicken Ranch and Turkey Farm area was conducted by the following major
resources companies:
Newmont Pty. Ltd. (early 1970s to 1986)
Carr Boyd Minerals Limited (1973 to 1975)
Geopeko Limited (JV with Carr Boyd) (1975 to 1978)
Marathon Petroleum Australia Ltd. (1979)
Western Mining Corporation Ltd. (WMC) (1980)
Duval Mining (Australia) Ltd. (Carr Boyd JV with Picon Exploration Pty. Ltd.) (1984 to 1986)
Mount Burgess Gold Mining Company N.L. (1989 to 2001)
Carpentaria (MIM JV with Mount Burgess) (1990 to 1996)
Normandy (JV with Mount Burgess) (1998 to 2000)
Newcrest Mining Limited (2009 to 2015)
Quantum Resources Ltd (2012 to 2017)
Antipa Minerals Ltd (2017 to present)
40
Criteria JORC Code explanation Commentary
Geology Deposit type, geological setting and style of mineralisation. The geology of the Chicken Ranch and Turkey Farm area is dominated by a northwest trending
sequence of moderate to steeply east dipping siltstone, carbonate siltstone, dolomite, and
subordinate fine‐grained sandstone of the Puntapunta Formation.
This sequence occurs on the northeast flank of the Camp Dome complex, a regional scale doubly
plunging anticline. Regional mapping undertaken by previous explorers indicates that the Chicken
Ranch prospect may be related to a parasitic fold on the flank of the Camp Dome, or a separate fold
structure altogether.
Mineralization occurs mainly in two discrete northwest trending gossanous lenses and is associated
with goethite pseudomorphs after massive pyrite alteration.
The entire zone is deeply oxidized. “Fresh rock” mineralization has not yet been identified.
The southwest lens of mineralisation is more persistent and ha a strike length of approximately
1,200m.
The Turkey Farm prospect is located approximately 1.0 km west of Chicken Ranch, and is hosted by
irregular, sub‐vertical northwest trending quartz‐ironstone veins to 0.5m width. Unmineralised
quartz veins in the same orientation are also present and are interpreted to be axial planar to the
regional fold structure.
Drill hole Information
A summary of all information material to the understanding of the exploration results including a tabulation of the following information for all Material drill holes:
easting and northing of the drill hole collar
elevation or RL (Reduced Level – elevation above sea level in metres) of the drill hole collar
dip and azimuth of the hole
down hole length and interception depth
hole length.
If the exclusion of this information is justified on the basis that the information is not Material and this exclusion does not detract from the understanding of the report, the Competent Person should clearly explain why this is the case.
All drillhole results have been reported previously in open file WAMEX reports and can be accessed
using the DMP’s online system.
The specific WAMEX and other reports related to the exploration information the subject of this
public disclosure have been referenced in previous public reports.
Antipa Minerals Ltd publicly disclosed reports provide details of all exploration completed by the
Company since 2016; these reports are all available to view on www.antipaminerals.com.au and
www.asx.com.au.
Data aggregation methods
In reporting Exploration Results, weighting averaging techniques, maximum and/or minimum grade truncations (e.g. cutting of high grades) and cut‐off grades are usually Material and should be stated.
Where aggregate intercepts incorporate short lengths of high grade results and longer lengths of low grade results, the procedure used for such aggregation should be stated and some typical examples of such aggregations should be shown in detail.
The assumptions used for any reporting of metal equivalent values should be clearly stated.
N/A
Metal equivalence is not used in this report
41
Criteria JORC Code explanation Commentary
Relationship between mineralisation widths and intercept lengths
These relationships are particularly important in the reporting of Exploration Results.
If the geometry of the mineralisation with respect to the drill hole angle is known, its nature should be reported.
If it is not known and only the down hole lengths are reported, there should be a clear statement to this effect (e.g. ‘down hole length, true width not known’).
The 2018 Prospecting activities, including metal detecting, did not involve any drilling
Diagrams Appropriate maps and sections (with scales) and tabulations of intercepts should be included for any significant discovery being reported These should include, but not be limited to a plan view of drill hole collar locations and appropriate sectional views.
All appropriate maps and sections (with scales) and tabulations of intercepts are reported or can
sometimes be found in previous WA DMIRS WAMEX publicly available reports.
Antipa Minerals Ltd publicly disclosed reports provide maps and sections (with scales) and
tabulations of intercepts generated by the Company since 2016; these reports are all available to
view on www.antipaminerals.com.au and www.asx.com.au.
Balanced reporting
Where comprehensive reporting of all Exploration Results is not practicable, representative reporting of both low and high grades and/or widths should be practiced to avoid misleading reporting of Exploration Results.
All significant results are reported or can sometimes be found in previous WA DMIRS WAMEX
publicly available reports.
Antipa Minerals Ltd publicly disclosed reports provide details of all significant exploration results
generated by the Company since 2016; these reports are all available to view on
www.antipaminerals.com.au and www.asx.com.au.
Other substantive exploration data
Other exploration data, if meaningful and material, should be reported including (but not limited to): geological observations; geophysical survey results; geochemical survey results; bulk samples – size and method of treatment; metallurgical test results; bulk density, groundwater, geotechnical and rock characteristics; potential deleterious or contaminating substances.
All meaningful and material information has been included in the body of the text or can sometimes
be found in previous WA DMIRS WAMEX publicly available reports.
The 2018 Prospecting activities, including metal detecting, did not involve any drilling
No metallurgical test‐work results are available
Further work The nature and scale of planned further work (e.g. tests for lateral extensions or depth extensions or large‐scale step‐out drilling).
Diagrams clearly highlighting the areas of possible extensions, including the main geological interpretations and future drilling areas, provided this information is not commercially sensitive.
Planned further work:
Ongoing review and interpretations of the 2018 prospecting results and historic Turkey
Farm exploration data;
Planning and future execution of exploration activities to identify both depth and lateral
extensions to potential high‐grade gold and/or copper mineralisation;
All appropriate maps and sections (with scales) and tabulations of intercepts are reported or can
sometimes be found in previous WA DMIRS WAMEX publicly available reports.
42