Embed Size (px)
Citation preview
2-1
Copyright © 2018 McGraw-Hill Education. All rights reserved. No reproduction or distribution without the prior written consent of McGraw-Hill Education.
FUNDAMENTALS OF STRUCTURAL ANALYSIS
5th Edition
Kenneth M. Leet, Chia-Ming Uang, Joel T. Lanning, and Anne M. Gilbert
SOLUTIONS MANUAL
CHAPTER 2: DESIGN LOADS AND STRUCTURAL FRAMING

2-2
Copyright © 2018 McGraw-Hill Education. All rights reserved. No reproduction or distribution without the prior written consent of McGraw-Hill Education.
Compute the weight/ft. of cross section @ 120 lb/ft3.
Compute cross sectional area:
( ) ( ) ( )2
1Area 0.5 6 2 0.5 2.67 0.67 2.5 1.5 1
2
7.5 ft
æ ö÷ç¢ ¢ ¢ ¢ ¢ ¢ ¢ ¢= ´ + ´ ´ + ´ + ´÷ç ÷ç ÷è ø=
Weight of member per foot length:
2 3wt/ft 7.5 ft 120 lb/ft 900 lb/ft.= ´ =
P2.1. Determine the deadweight of a 1-ft-long
segment of the prestressed, reinforced concrete
tee-beam whose cross section is shown in
Figure P2.1. Beam is constructed with
lightweight concrete which weighs 120 lbs/ft3.
18ʺ
Section
24ʺ
12ʺ
6ʺ6ʺ
48ʺ
72ʺ
8ʺ
P2.1
2-3
Copyright © 2018 McGraw-Hill Education. All rights reserved. No reproduction or distribution without the prior written consent of McGraw-Hill Education.
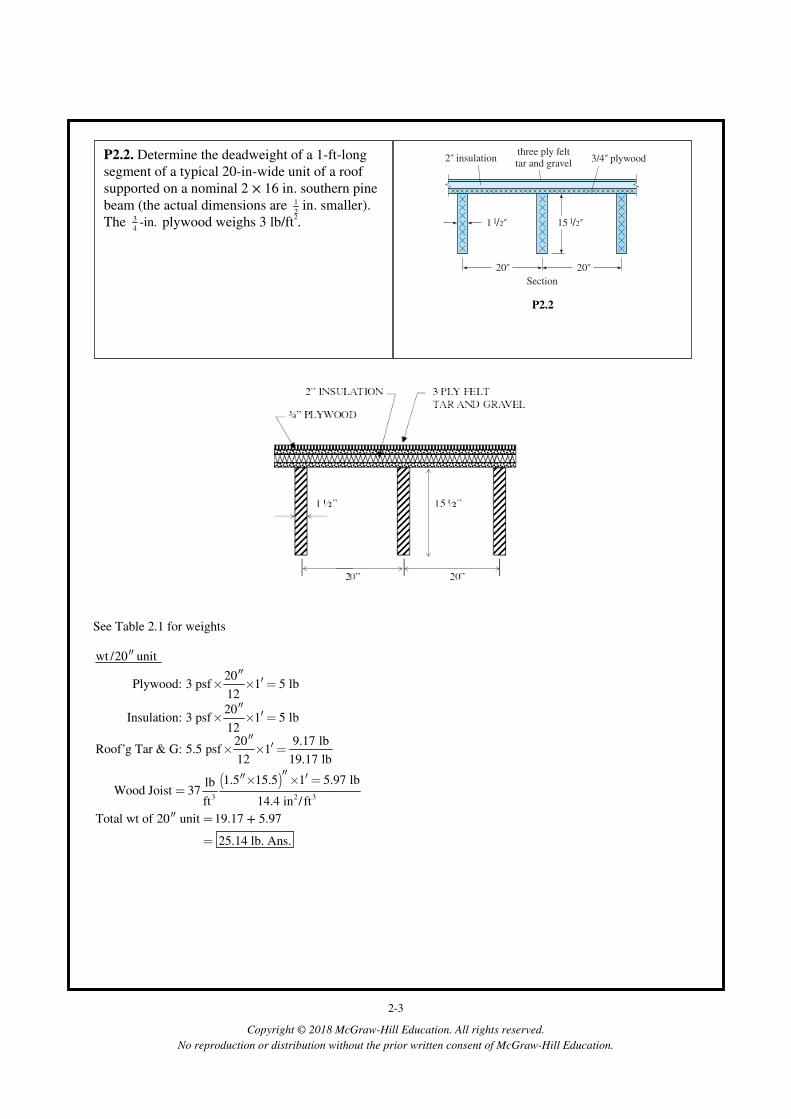
See Table 2.1 for weights
( )3 2 3
wt / 20 unit
20Plywood: 3 psf 1 5 lb
12
20Insulation: 3 psf 1 5 lb
1220 9.17 lb
Roof’g Tar & G: 5.5 psf 112 19.17 lb
1.5 15.5 1 5.97 lblbWood Joist 37
ft 14.4 in / ft
Total wt of 20 unit 19
¢¢
¢¢¢´ ´ =
¢¢¢´ ´ =
¢¢¢´ ´ =
¢¢¢¢ ¢´ ´ ==
¢¢ = .17 + 5.97
25.14 lb. Ans.=
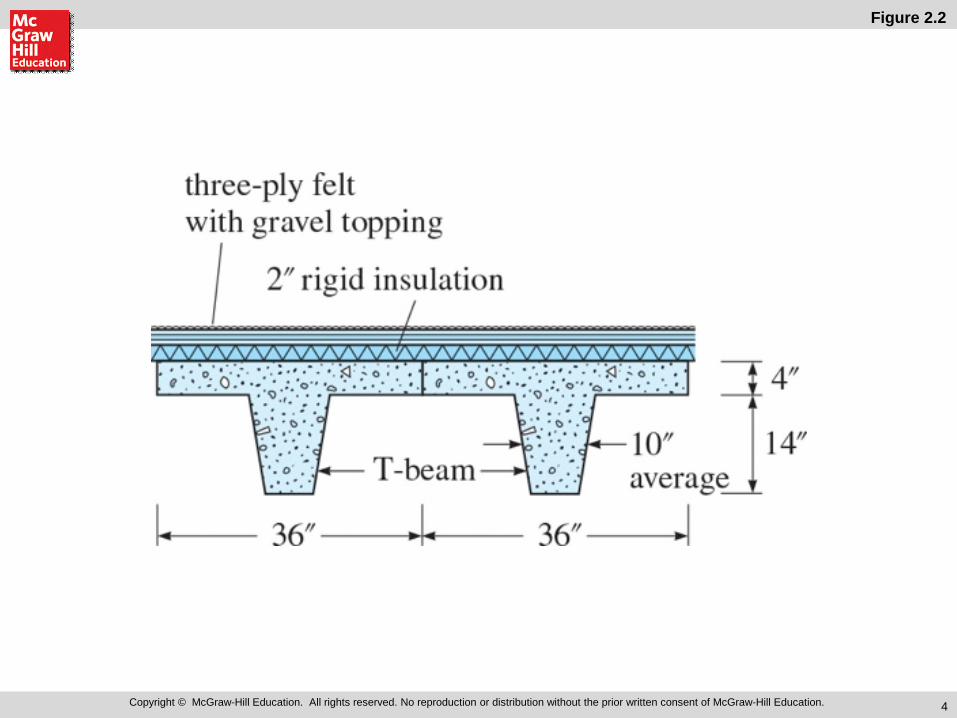
P2.2. Determine the deadweight of a 1-ft-long
segment of a typical 20-in-wide unit of a roof
supported on a nominal 2 × 16 in. southern pine
beam (the actual dimensions are 1
2in. smaller).
The 3
4-in. plywood weighs 3 lb/ft
2.
20ʺ 20ʺ
2ʺ insulationthree ply felttar and gravel
3/4ʺ plywood
15 1/2ʺ1 1/2ʺ
Section
P2.2

2-4
Copyright © 2018 McGraw-Hill Education. All rights reserved. No reproduction or distribution without the prior written consent of McGraw-Hill Education.
Uniform Dead Load WDL Acting on the Wide Flange Beam:
Wall Load:
9.5 (0.09 ksf) 0.855 klf
Floor Slab:
10 (0.05 ksf) 0.50 klf
Steel Frmg, Fireproof’g, Arch’l Features, Floor Finishes, & Ceiling:
10 (0.024 ksf) 0.24 klf
Mech’l, Piping & Electrical Systems:
10 (0.006 ks
¢ =
¢ =
¢ =
¢ f) 0.06 klf
Total 1.66 klfDLW=
=
P2.3. A wide flange steel beam shown in Figure
P2.3 supports a permanent concrete masonry wall,
floor slab, architectural finishes, mechanical and
electrical systems. Determine the uniform dead
load in kips per linear foot acting on the beam.
The wall is 9.5-ft high, non-load bearing and
laterally braced at the top to upper floor framing
(not shown). The wall consists of 8-in. lightweight
reinforced concrete masonry units with an average
weight of 90 psf. The composite concrete floor slab
construction spans over simply supported steel
beams, with a tributary width of 10 ft, and weighs
50 psf.
The estimated uniform dead load for structural
steel framing, fireproofing, architectural features,
floor finish, and ceiling tiles equals 24 psf, and for
mechanical ducting, piping, and electrical systems
equals 6 psf.
concrete floor slab
piping
wide flange steelbeam with fireproofing
ceiling tile and suspension hangers
Section
mechanicalduct
8ʺ concrete masonrypartition
9.5ʹ
P2.3

2-5
Copyright © 2018 McGraw-Hill Education. All rights reserved. No reproduction or distribution without the prior written consent of McGraw-Hill Education.
2
2
20 ft
Method 2
8 8( ) Method 1: 40 3
2 2
1320 4 4(4) 28: 8
2ft
T T
T T
a A A
AA
2
2
ft
Method 2:
6.67( ) Method 1:
20 66.72
166.7 2 3.33(3.33) 55.6 ft
2
T T
T T
b A
A
A
A
2
2
ft
Method 2
6.67( ) Method 1: 20 10(10)
2
166.7
1 1166.7 2 3.33(3.33) 5(5)
2 2
180
:
. ft6
2
T
T
T
T
A
c A
A
A
2
2
ft
Metho
40 20( ) Method 1: 36
2 2
1080
11080 2 4(4d 2: )
2
10 ft96
T
T
T
T
A
d A
A
A
2
2
; 40 20
( ) 2002 2
40 20 40 2
ft
0( ; ) 900
2f
2 2 2t
T T
T T
e A
f A
A
A
P2.4. Consider the floor plan shown in Figure
P2.4. Compute the tributary areas for (a) floor
beam B1, (b) floor beam B2, (c) girder G1,
(d) girder G2, (e) corner column C1, and
(f ) interior column C
A
40ʹ 20ʹ
B1G2
G4
G3
C3 C1
C4
C2
G1B2
B4
6 @ 6.67ʹ = 40ʹ
B32 @ 10ʹ = 20ʹ
5 @ 8ʹ = 40ʹ
1 2 3
B
C
P2.4
5 ft
G1
10 ft
5 ft
6.66 ft6.67 ft 6.67 ft
G1
10 ft
Right
Side
Left
Side
4 ft 4 ft
36 ft
G2
36 ft
G2
B1
4 ft
B1
36 ft 4 ft
6.66 ft6.67 ft 6.67 ft
B4
AT,C2
AT,C1

2-6
Copyright © 2018 McGraw-Hill Education. All rights reserved. No reproduction or distribution without the prior written consent of McGraw-Hill Education.
2
2
2
0 ft
Method 2:
( ) Method 1: 10 20
20
120
f
0 4 52
15 t0
T
T
T
T
A
A
a
A
A
2
2
2
ft
Metho
( ) Method 1:
d 2:
f
6.67 20 133.4
1133.4 4 3.33
2
111.2 t
T T
T
T
b A
A
A
A
2
22
ft
Method 2:
( ) Method 1: 36 20
720
1720 2 4 73 t6
2 f
T T
T T
A
A
c A
A
2
2
2 2
ft
Method 2
( ) Method 1: 4 40 33.33(10)
493.4
1 1493.4 2 4 2 3.33
2 2:
4 ft88.5
T
T
T
T
A
A
d A
A
2
2
( ) 30 20 600
( ) 10 10 10
; ft
; t0 f
T T
T T
e A
f A
A
A
A
40ʹ 20ʹ
B1G2
G4
G3
C3 C1
C4
C2
G1B2
B4
6 @ 6.67ʹ = 40ʹ
B32 @ 10ʹ = 20ʹ
5 @ 8ʹ = 40ʹ
1 2 3
B
C
P2.4
P2.5. Refer to Figure P2.4 for the floor plan.
Calculate the tributary areas for (a) floor beam
B3, (b) floor beam B4, (c) girder G3, (d) girder
G4, (e) edge column C3, and (f ) corner column
C4.
B4
B3
5 ft
B4
B3
10 ft 5 ft
6.66 ft6.67 ft 6.67 ft
3.33 ft
G3
33.33 ft
G3
33.33 ft
Right
Side
Left
Side
4 ft 4 ft
36 ft
G4
36 ft
G4
3.33 ft
4 ft 36 ft 4 ft
B4
AT,C3
AT,C4

2-7
Copyright © 2018 McGraw-Hill Education. All rights reserved. No reproduction or distribution without the prior written consent of McGraw-Hill Education.
2( ) 8(40) 320 ft , 2, 640 400
15 6060 0.25 50.6 psf
2640
8(50.6) 404.8 lb/ft 0.40 kips/ft
, ok
T LL T LLa A K A K
L
w
= = = = >
= + = >
= = =
æ ö÷ç ÷ç ÷çè ø
26.67( ) (20) 66.7 ft , 2, 133.4 400, No Reduction
2
6.67(60) 200.1 lb/ft 0.20 kips/ft
2
T LL T LLb A K A K
w
= = = = <
= = =
2
trib beam
6.67( ) (20) 10(10) 166.7 ft , 2, 333.4 400, No Reduction
2
6.67(60) 200.1 lb/ft 0.20 kips/ft
2
( )( ) 60(10)(20)6000 lbs 6 kips
2 2
T LL T LLc A K A K
w
q W LP
= + = = = <
= = =
= = = =
240 20( ) 36 1080 ft , 2, 2160 400
2 2
15 6060 0.25 34.4
22160
34.4 psf
40 208(34.4) 8256 lbs 8.26 kips
2 2
, ok
T LL T LLd A K A K
L
L
P
= + = = = >
= + = >
=
= + = =
æ ö÷ç ÷ç ÷çè øæ ö÷ç ÷ç ÷çè ø
æ ö÷ç ÷ç ÷çè ø
A
40ʹ 20ʹ
B1G2
G4
G3
C3 C1
C4
C2
G1B2
B4
6 @ 6.67ʹ = 40ʹ
B32 @ 10ʹ = 20ʹ
5 @ 8ʹ = 40ʹ
1 2 3
B
C
P2.4
P2.6. The uniformly distributed live load on the
floor plan in Figure P2.4 is 60 lb/ft2. Establish
the loading for members (a) floor beam B1,
(b) floor beam B2, (c) girder G1, and (d) girder
G2. Consider the live load reduction if
permitted by the ASCE standard.
w
B1 and B2
wP
G1
PPPP
5 spaces @ 8’ each
G2

2-8
Copyright © 2018 McGraw-Hill Education. All rights reserved. No reproduction or distribution without the prior written consent of McGraw-Hill Education.
2( ) 10(20) 200 ft , 2, 400 400
1560 0.25 60 psf
400
10(60) 600 lb/ft 0.60 kips/ft
T LL T LLa A K A K
L
w
= = = = >
= + =
= = =
æ ö÷ç ÷ç ÷çè ø
2( ) 6.67(20) 133.4 ft , 2, 266.8 400, No Reduction
6.67(60) 400.2 lb/ft 0.40 kips/ft
T LL T LLb A K A K
w
= = = = <
= = =
2
trib beam
( ) 36(20) 720 ft , 2, 1440 400
15 6060 0.25 38.7 psf > , ok
21440
( )( ) 38.7(8)(40)6192 lbs 6.19 kips
2 2
T LL T LLc A K A K
L
q W LP
= = = = >
= + =
= = = =
æ ö÷ç ÷ç ÷çè ø
28( ) 40 33.33(10) 493.3 ft , 2, 986.6 400
2
15 6060 0.25 43.7 , ok
2986.6
43.7(4) 174.8 lb/ft 0.17 kips/ft
43.7(6.67(20)2914.8 lbs 2.91 kips
2
T LL T LLd A K A K
L
w
P
= + = = = >
= + = >
= = =
= = =
æ ö÷ç ÷ç ÷çè øæ ö÷ç ÷ç ÷çè ø
A
40ʹ 20ʹ
B1G2
G4
G3
C3 C1
C4
C2
G1B2
B4
6 @ 6.67ʹ = 40ʹ
B32 @ 10ʹ = 20ʹ
5 @ 8ʹ = 40ʹ
1 2 3
B
C
P2.4
P2.7. The uniformly distributed live load on the
floor plan in Figure P2.4 is 60 lb/ft2. Establish
the loading for members (a) floor beam B3,
(b) floor beam B4, (c) girder G3, and girder G4.
Consider the live load reduction if permitted by
the ASCE standard.
w
B3 and B4
PPPP
5 spaces @ 8’ each
G3
PPPP
6 spaces @ 6.67’ each
Pw
G4

2-9
Copyright © 2018 McGraw-Hill Education. All rights reserved. No reproduction or distribution without the prior written consent of McGraw-Hill Education.
2
3rd
1st
40 20 40 20( ) 900 ft , 4, 3600 400
2 2 2 2
15 6060 0.25 30 psf ok (minimum permitted)
23600
900(30) 27000 lbs 27 kips
(3)900(30) 27000 lbs 81 kips
,
T LL T LLa A K A K
L
P
P
= + + = = = >
= + = =
= = =
= = =
æ öæ ö÷ ÷ç ç÷ ÷ç ç÷ ÷ç çè øè øæ ö÷ç ÷ç ÷÷çè ø
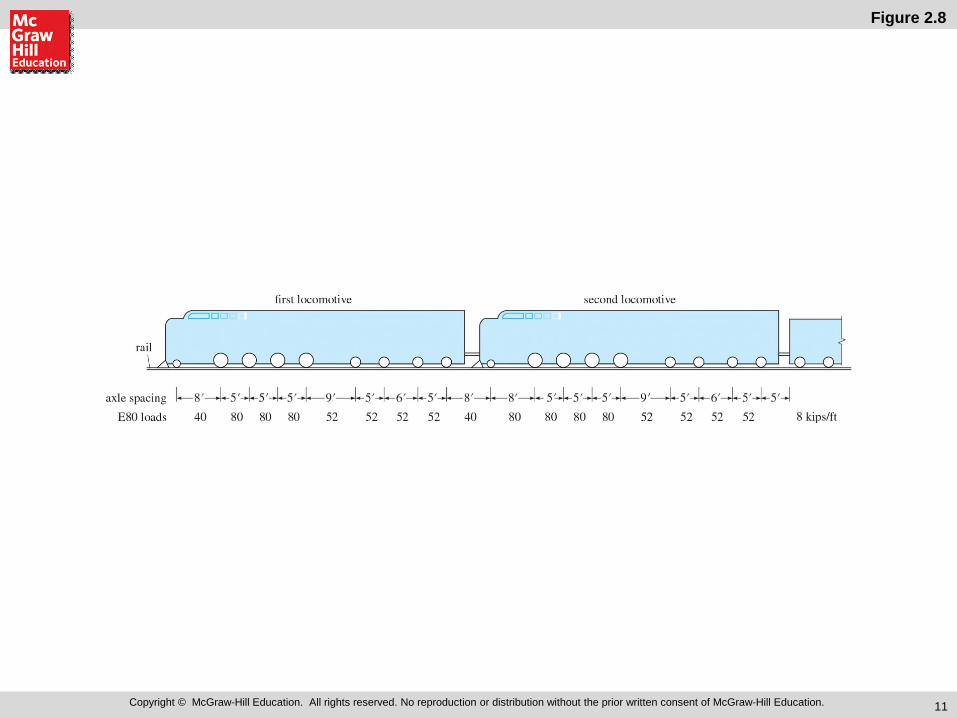
P2.8. The building section associated with the
floor plan in Figure P2.4 is shown in Figure
P2.8. Assume a live load of 60 lb/ft2 on all three
floors. Calculate the axial forces produced by
the live load in column C1 in the third and first
stories. Consider any live load reduction if
permitted by the ASCE standard.
20ʹ40ʹ
3 @
12ʹ =
36ʹ
C3 C1
Building Section
P2.8
P3rd
P1st
C2
PLAN
ELEVATION
B4
AT,C2
AT,C1

2-10
Copyright © 2018 McGraw-Hill Education. All rights reserved. No reproduction or distribution without the prior written consent of McGraw-Hill Education.
2
3rd
1st
40 20( ) 20 600 ft , 4, 2400 400
2 2
15 6060 0.25 33.4 psf , ok
22400
600(33.4) 20040 lbs 20.0 kips
(3)600(33.4) 60120 lbs 60.1 kips
T LL T LLa A K A K
L
P
P
= + = = = >
= + = =
= = =
= = =
æ ö÷ç ÷ç ÷çè øæ ö÷ç ÷ç ÷çè ø
20ʹ40ʹ
3 @
12ʹ =
36ʹ
C3 C1
Building Section
P2.8
P2.9. The building section associated with the
floor plan in Figure P2.4 is shown in Figure
P2.8. Assume a live load of 60 lb/ft2 on all three
floors. Calculate the axial forces produced by
the live load in column C3 in the third and first
stories. Consider any live load reduction if
permitted by the ASCE standard.
B4
AT,C3
AT,C4
PLAN
ELEVATION
P3rd
P1st
C3

2-11
Copyright © 2018 McGraw-Hill Education. All rights reserved. No reproduction or distribution without the prior written consent of McGraw-Hill Education.
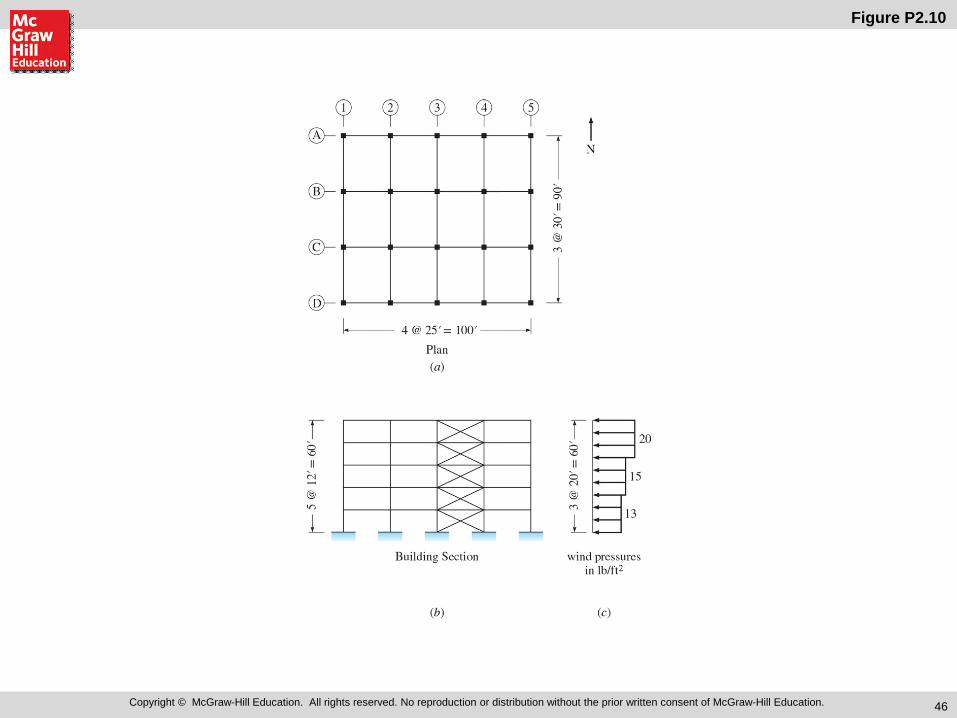
a) Resulant Wind Forces
Roof 20 psf (6 × 90) = 10,800 lb
5th floor 20 psf (12 × 90) = 21,600 lb
4th floor 20 psf (2 × 90) + 15 (10 × 90) = 17,100 lb
3rd floor 15 psf (10 × 90) + 13 (2 × 96) = 15,800 lb
2nd
floor 13 psf (12 × 90) = 14,040 lb
b) Horizontal Base Shear VBASE
= Σ Forces at Each Level =
10.8k + 21.6
k + 17.1
k + 15.8
k + 14.04
k = (a)
VBASE
= 79.34k
Overturning Moment of the Building =
Σ (Force @ Ea. Level × Height above Base)
10.8k (60′)+ 21.6 (48′) + 17.1 (36′) +
15.8k (24′)+ 14.04
k(12′) =
M overturning = 2, 848ft.k
(a)
Plan
Building Section
N
(b) (c)
A
1
3 @
20ʹ =
60ʹ
3 @
30ʹ =
90ʹ
4 @ 25ʹ = 100ʹ
13
wind pressuresin lb/ft2
15
20
5 @
12ʹ =
60ʹ
2 3 4 5
B
C
D
P2.10
P2.10. A five-story building is shown in Figure
P2.10. Following the ASCE standard, the wind
pressure along the height on the windward side
has been established as shown in Figure
P2.10(c). (a) Considering the windward pressure
in the east-west direction, use the tributary area
concept to compute the resultant wind force at
each floor level. (b) Compute the horizontal
base shear and the overturning moment of the
building.

2-12
Copyright © 2018 McGraw-Hill Education. All rights reserved. No reproduction or distribution without the prior written consent of McGraw-Hill Education.
a) Live Load Impact Factor = 20%
b) Total LL
Machinery = 1.20 (4 kips) = 4.8k
Uniform LL = ((10′ × 16′) ‒ (5′ × 10′)) (0.04 ksf) = 4.4k
Total LL = 9.2k
∴ Total′ LL Acting on One Hanger = 9.2k/4 Hangers = 2.3
klps
c) Total DL
Floor Framing = 10′ × 16′ (0.025 ksf) = 4k
∴ Total DL Acting on one Hanger = 4k/4 Hangers = 1 kip
∴ Total DL + LL on One Hanger = 2.3k + l
k = 3.3 kips
hanger
hanger
hanger
hanger
hanger
floor grating
mechanicalsupport framing
vertical lateral bracing beyond
floor framing above supports
Mechanical Floor Plan(beams not shown)
(a)
Section
(b)
edge of mechanical support framing
vertical lateral bracing, located on4 sides of framing (shown dashed)
hanger
2.5ʹ
3ʹ 3ʹ10ʹ
2.5ʹ
5ʹmechanical
unit
mechanicalunit
P2.11
P2.11. A mechanical support framing system is
shown in Figure P2.11. The framing consists of
steel floor grating over steel beams and entirely
supported by four tension hangers that are
connected to floor framing above it. It supports
light machinery with an operating weight of
4000 lbs, centrally located. (a) Determine the
impact factor I from the Live Load Impact Factor, Table 2.3. (b) Calculate the total live
load acting on one hanger due to the machinery
and uniform live load of 40 psf around the
machine. (c) Calculate the total dead load acting
on one hanger. The floor framing dead load is
25 psf. Ignore the weight of the hangers. Lateral
bracing is located on all four edges of the
mechanical floor framing for stability and
transfer of lateral loads.

2-13
Copyright © 2018 McGraw-Hill Education. All rights reserved. No reproduction or distribution without the prior written consent of McGraw-Hill Education.
Use I = 1
2
2 2
0.613 (Eq. 2.4b)
0.613(40) = 980.8 N/m
980.8(1)( )(1)(0.85) = 833.7
s
z s z zt d
z z z
q V
q q IK K K
q K K
=
=
=
=
2
2
2
2
0 4.6m: 833.7(0.85) 708.6 N/m
4.6 6.1m: 833.7(0.90) 750.3 N/m
6.1 = 7.6 m: 833.7(0.94) = 783.7 N/m
7.6 = 9 m: 833.7(0.98) = 817.1 N/m
z
z
z
z
qqq
q
- = =
- = =
=
=
For the Windward Wall
= (Eq. 2.7)
where = 0.85(0.8) = 0.68
= 0.68
z p
p
z
p q GC
GCp q
2
2
2
2
0 4.6 m 481.8 N/m
4.6 6.1 m 510.2 N/m
6.1 7.6 m 532.9 N/m
7.6 9 m 555.6 N/m
pppp
- =
- =
- =
- =
Total Windforce, FW, Windward Wall
481.8[4.6 × 20] + 510.2[1.5 × 20]
+ 532.9[1.5 × 20] + 555.6[1.4 × 20]
91,180 N
W
W
F
F
=
=
For Leeward Wall
2
2
(0.85)( 0.2)
at 9m 817.1 N/m (above)
817.1 (0.85)( 0.2) 138.9 N/m
h p h
h z
p q GC qq qp
= = -
= =
= - =-
Total Windforce, FL, on Leeward Wall
*(20 9)( 138.9) 25,003 N
Total Force
91,180 N 25,003
116,183.3 N
L
W L
FF F
= ´ - = -= += +
=
*Both FL and FN Act in Same Direction.
P2.12. The dimensions of a 9-m-high warehouse
are shown in Figure P2.12. The windward and
leeward wind pressure profiles in the long
direction of the warehouse are also shown.
Establish the wind forces based on the following
information: basic wind speed = 40 m/s, wind
exposure category = C, Kd = 0.85, Kzt = 1.0,
G = 0.85, and Cp = 0.8 for windward wall and
‒0.2 for leeward wall. Use the Kz values listed in
Table 2.4. What is the total wind force acting in
the long direction of the warehouse?
qzGCp qhGCp
40 m
9 m20 m
(not to scale)
P2.12

2-14
Copyright © 2018 McGraw-Hill Education. All rights reserved. No reproduction or distribution without the prior written consent of McGraw-Hill Education.
TABLE P2.13 Roof Pressure Coefficient Cp *θ defined in Figure P2.13
Windward Leeward Angle θ 10 15 20 25 30 35 45 ≥60 10 15 ≥20
Cp −0.9 −0.7 −0.4 −0.3 −0.2 −0.2 0.0 0.01θ* −0.5 −0.5 −0.6
0.0 0.2 0.2 0.3 0.4
Mean Roof Height, h 24 ft
1 16tan 33.69 (for Table 2.10)
24θ - æ ö¢ ÷ç= = ÷ç ÷ç ÷¢è ø
Consider Positive Windward Pressure on Roof, i.e. left side.
Interpolate in Table P2.10
( )( )
33.69 300.2 0.1
35 30
0.2738(Roof only)
p
p
C
C
-= + ´
-=
From Table 2.4 (see p48 of text)
0.57, 0 15
0.62, 15 20
0.66, 20 25
0.70, 25 30
0.76, 30 32
zK ¢= -¢ ¢= -¢ ¢= -¢ ¢= -¢ ¢= -
(b)
(a)
48ʹ
Section
80ʹ
wind
16ʹ
16ʹ
h
qhGCp
qhGCpqzGCp
qhGCp
θ
P2.13
P2.13. The dimensions of an enclosed gabled building are shown in Figure P2.13a. The external pressures for the wind load perpendicular to the ridge of the building are shown in Figure P2.13b. Note that the wind pressure can act toward or away from the windward roof surface. For the particular building dimensions given, the Cp value for the roof based on the ASCE standard can be determined from Table P2.13, where plus and minus signs signify pressures acting toward and away from the surfaces, respectively. Where two values of Cp are listed, this indicates that the windward roof slope is subjected to either positive or negative pressure, and the roof structure should be designed for both loading conditions. The ASCE standard permits linear interpolation for the value of the inclined angle of roof 𝜃. But interpolation should only be carried out between values of the same sign. Establish the wind pressures on the building when positive pressure acts on the windward roof. Use the following data: basic wind speed = 100 mi/h, wind exposure category = B, Kd = 0.85, Kzt = 1.0, G = 0.85, and Cp = 0.8 for windward wall and 0.2 for leeward wall.

2-15
Copyright © 2018 McGraw-Hill Education. All rights reserved. No reproduction or distribution without the prior written consent of McGraw-Hill Education.
P2.13. Continued
2
2 2
2
2
2
1.0, 0.85, 1
0.00256 (Eq 2.4a)
0.00256(100) 25.6 lb/ft
0 15 ; 25.6 (1)(0.57)(1)(0.85)
12.40 lb/ft
15 16 ; 13.49 lb/ft
24; 14.36 lb/ft
zt d
s
s
z s z zt d
z
z
z
K K Iq V
qq q IK K Kq
qh q
= = =
=
= =
=¢ =
=
¢ =
= =
–
–
Wind Pressure on Windward Wall & Roof
Wall 0 15 12.40 × 0.85 × 0.80
8.43 psf
z PP q GCP
P
=¢ =
=
–
Wall, 15 16 13.49 × 0.85 × 0.8 = 9.17 psfP¢ ¢ =–
Roof, 14.36 × 0.85 × 0.2738
3.34 psf
P
P
=
=
Wind Pressure on Leeward Side
2
For Wall
For 24 ; 14.36 lb/ft
h p
h z
P q G Ch q q=
¢= = =
Cp ‒0.2 for wall 0.6 for roof
2
14.36 (0.85)(0.2)
2
For
.44
Wall
lb/ft
PP=
=
2
14.36 (0.85)( 0.6)
7.32 lb/
For Roo
ft (up i
f
l ft)
P = -
= -

2-16
Copyright © 2018 McGraw-Hill Education. All rights reserved. No reproduction or distribution without the prior written consent of McGraw-Hill Education.
TABLE P2.13 Roof Pressure Coefficient Cp *θ defined in Figure P2.11
Windward Leeward Angle θ 10 15 20 25 30 35 45 ≥60 10 15 ≥20
Cp −0.9 −0.7 −0.4 −0.3 −0.2 −0.2 0.0 0.01θ* −0.5 −0.5 −0.6
0.0 0.2 0.2 0.3 0.4
See P2.13 Solution
Windward Roof (Negative Pressure)
33.7
Interpolate between 30 and 35 for negative Cp value in Table P2.12
2
0.274
21.76(0.66) 0.85( 0.274)
3.34 lb/ft (Suction)
p
h p
Cp q GC=-= = -
= -
Note: Wind pressures on other 3 surfaces are the same as in P2.13.
(b)
(a)
48ʹ
Section
80ʹ
wind
16ʹ
16ʹ
h
qhGCp
qhGCpqzGCp
qhGCp
θ
P2.13
P2.14. Establish the wind pressures on the
building in Problem P2.13 when the windward
roof is subjected to an uplift wind force.

2-17
Copyright © 2018 McGraw-Hill Education. All rights reserved. No reproduction or distribution without the prior written consent of McGraw-Hill Education.
(a) Compute Variation of Wind Pressure on Windward
Face
2
2
Eq 2.8
0.00256 Eq 2.6a
0.00256(140)
50.176 psf; Round to 50.18 psf
z s z zt d
s
s
q q IK K Kq V
q
=
=
==
1.15 for hospitals
1; 0.85zt d
IK K
== =
Kz, Read in Table 2.4
Elev. (ft) 0 35 70 105 140
Kz 1.03 1.19 1.34 1.44 1.52
50.18 (1.15)( ) 1 (0.85)
49.05
z z
z z
q Kq K
==
Compute Wind Pressure “p” on Windward Face
49.05 z p z pp q GC K GC= =
where G 0.85 for natural period less than 1 sec.
= 0.8 on windward side
49.05 (0.85)(0.8) 33.354
p
z z
C
p k K= =
Compute “p” for Various Elevations
Elev. (ft) 0 35 70 105 140
p (psf) 34.36 39.69 44.69 48.03 50.70
Compute Wind Pressure on Leeward Wall
p qz GCp; Use Value of qz at 140 ft. i.c. Kz 152
0.5 49.05(1.52) 74.556
74.556 74.556(0.85)( 0.5)
31.68 psf ANS.
p z
p
C qp GC
p
=- = == = -
= -
Wind Pressure on Side Walls
49.05(1.52)(0.85)( 0.7)
44.36 psf
z pp q GC
p
= = -
= -
(b) Variation of Wind Pressure on Windward and
Leeward Sides
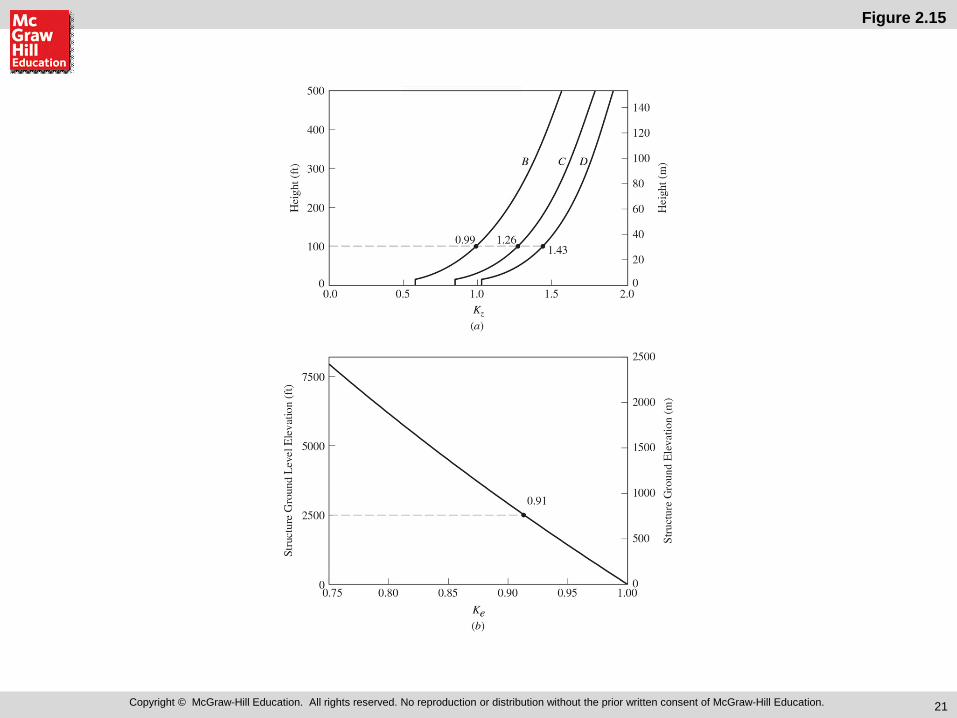
P2.15. (a) Determine the wind pressure
distribution on the four sides of the 10-story
hospital shown in Figure P2.15. The building is
located near the Georgia coast where the wind
velocity contour map in the ASCE Standard
specifies a design wind speed of 140 mph. The
building, located on level flat ground, is
classified as stiff because its natural period is
less than 1 s. On the windward side, evaluate the
magnitude of the wind pressure every 35 ft in
the vertical direction. (b) Assuming the wind
pressure on the windward side varies linearly
between the 35-ft intervals, determine the total
wind force on the building in the direction of the
wind. Include the negative pressure on the
leeward side.
80ʹ
140ʹ
160ʹ
wind140 mph
leeward
D
C
B
E
F
G
H
A
P2.15

2-18
Copyright © 2018 McGraw-Hill Education. All rights reserved. No reproduction or distribution without the prior written consent of McGraw-Hill Education.
P2.15. Continued
Compute Total Wind Force (kips)
( )
1
2
3
4
5
50.7 48.02 35 160276.42 kips
2 1000
48.03 44.69 35 160259.62 k
2 1000
44.69 39.69 35 160236.26 k
2 1000
39.69 34.36 35 160207.39 k
2 1000
31.68 140 160709.63k
1000
F
F
F
F
F
é ù+ ´ê ú= =ê úë ûé ù+ ´ê ú= =ê úë ûé ù+ ´ê ú= =ê úë ûé ù+ ´ê ú= =ê úë û
´= =
1 2 3 4 5Total Wind Force Σ
1689.27 kips
F F F F F= + + + +
=

2-19
Copyright © 2018 McGraw-Hill Education. All rights reserved. No reproduction or distribution without the prior written consent of McGraw-Hill Education.
Fundamental Period
4/ 4
3/4
2 2
[ 0.035 for steel moment frames]
0.035(60)
0.75 sec.
4(100 90) 90 lb/ft (100 90) 70 lb/ft
3,870,000 lbs 3,870 kips
nt tT C h CT
TW
= =
=
=
= ´ + ´
= =
( )
1
max
1 for office bldgs.( / )
0.4 3870258kips
0.75(8/1)
0.9(3870)
/ 8/1
435kips
D
DS
S WV I
T R I
V
S WV
R I
= =
= =
= =
=
min0.0441
0.0441 (1)(0.9)(3870)
153.6 kips
DSV I S W=
=
=
Therefore, Use 258 kipsV =
I 0.51 1.125
2k -= + =
1
kx x
x n ki ii
W hF V
W h=
=å
(a)
Plan
Building Section
N
(b) (c)
A
1
3 @
20
ʹ = 6
0ʹ
3 @
30
ʹ = 9
0ʹ
4 @ 25ʹ = 100ʹ
13
wind pressuresin lb/ft2
15
205
@ 1
2ʹ =
60
ʹ
2 3 4 5
B
C
D
P2.10
P2.16. Consider the five-story building shown
in Figure P2.10. The average weights of the
floor and roof are 90 lb/ft2 and 70 lb/ft
2,
respectively. The values of SDS and SD1 are equal
to 0.9g and 0.4g, respectively. Since steel moment frames are used in the north-south
direction to resist the seismic forces, the value
of R equals 8. Compute the seismic base shear
V. Then distribute the base shear along the
height of the building.

2-20
Copyright © 2018 McGraw-Hill Education. All rights reserved. No reproduction or distribution without the prior written consent of McGraw-Hill Education.
P2.16. Continued Forces at Each Floor Level
Floor
Weight Wi, (kips)
Floor Height hi (ft)
k
i iW h Σ
kx x
ki i
W hW h
Fx (kips)
Roof 630 60 63,061 0.295 76.1
5th 810 48 63,079 0.295 76.1
4th 810 36 45,638 0.213 56.0
3rd 810 24 28,922 0.135 34.8
2nd 810 12 13,261 0.062 16.0
3,870 213,961 258

2-21
Copyright © 2018 McGraw-Hill Education. All rights reserved. No reproduction or distribution without the prior written consent of McGraw-Hill Education.
ASCE Approximate Fundamental Period:
0.1
5 0.5seconds
0.3 6750810 kips
0.5(5/1)
T NN T
V
== \ =
´= =
The simpler approximate method produces a larger value of base shear.
P2.17. When a moment frame does not exceed 12 stories in height and the story height is at least 10 ft,
the ASCE standard provides a simpler expression to compute the approximate fundamental period:
T = 0.1N where N number of stories. Recompute T with the above expression and compare it with that
obtained from Problem P2.16. Which method produces a larger seismic base shear?

2-22
Copyright © 2018 McGraw-Hill Education. All rights reserved. No reproduction or distribution without the prior written consent of McGraw-Hill Education.
(a) Wind Loads Using Simplified Procedure:
Design Wind Pressure Ps Kzt IPS30
1.66 Table 2.8, Mean Roof Height 30ʹ
30 30 30Zones 1.66(1)1.15 1.909
A 12.8 psf 24.44 psf
C 8.5 psf 16.22 psf
S S S SP P P P= =
Resultant Force at Each Level; Where Distance a 0.1(100) 10; 0.4(30) 12; 3
10 Controls & 2a 20 Regio An( )a ¢ ¢= =
( )
( )roof
roof
15 20( ) 24.44 psf 3.67
2 100015 80
( ) 16.3psf 9.782 1000
: Zone A :
Zone C :
Resultant 13.45
k
k
k
F
F
¢ ¢=
=
¢ ¢=
( )
( )2nd
k
2nd
: Zone A :
Zone C :
20( ) 15 24.44 psf 7.33
100080
( ) 15 16.3 psf 19.5
Resul
61000
tant = 26.89
k
k
F
F
¢¢ =
¢¢ =
base roof 2ndBase Sheak = + = .34 40 kV F F
O.T.
.
O.T.
Overturning Moment = Σ
= 13.45 30 + 26.89 15( ) ( ) = 806.9
i i
k k ft k
M F h
M ¢ ¢
P2.18. (a) A two-story hospital facility shown in
Figure P2.18 is being designed in New York
with a basic wind speed of 90 mi/h and wind
exposure D. The importance factor I is 1.15 and
Kz 1.0. Use the simplified procedure to
determine the design wind load, base shear, and
building overturning moment. (b) Use the
equivalent lateral force procedure to determine
the seismic base shear and overturning moment.
The facility, with an average weight of 90 lb/ft2
for both the floor and roof, is to be designed for
the following seismic factors: SDS 0.27g and
SD1 0.06g; reinforced concrete frames with an
R value of 8 are to be used. The importance
factor I is 1.5. (c) Do wind forces or seismic
forces govern the strength design of the
building?
15ʹ
15ʹ
100ʹ
100ʹ
P2.18

2-23
Copyright © 2018 McGraw-Hill Education. All rights reserved. No reproduction or distribution without the prior written consent of McGraw-Hill Education.
P2.18. Continued
(b) Seismic Loads by Equivalent Lateral Force Procedure Given: W 90 psf Floor & Roof;
SDS 0.27g, SD1 0.06g; R = 8, I 1.5
( )1
baseBase Shear
R/I
DS WV
T=
Where W Total Building Dead Load
2
roof
2
2nd
total
90 psf 100 900
90 psf 100
( )
( ) 900
1800
k
k
k
WW
W
¢= =
¢= =
=
And = = 0.342 sec. xT nT C h
0.016 Reinf. Concrete Frame
0.9 Reinf. Concrete Frame
30 Building Height
TCXh
==
¢=
( )( )( )
( )
( )( )( )
base
max.
min.
0.06 1800 59.20.033
Controls0.342sec 8/1.5
0.27 18000.051 91.1
R/I (8/1.5)
0.044 0.044 0.27 1.5 1800
0.0178 32.1
k k
kDS k
kDS
k
V W
S WV W
V S IWW
= = =
= = = =
= =
= =
base base, Where 59.2
ΣForce @ Each Level
kkX x
X ki i
W hF V V
W h= =
T < 0.5 Sec. Thus K 1.0
Level Wi Hi ki iW h k k
x x i iW h W h Force @ Ea. Level:
Roof 900k 30 27000 0.667 F
roof 39.5
k
2nd
900k 15 13500 0.333 F
2nd 19.76
k
base
Σ = 40500 Σ = = 59.2 k ki i xW h F V
O.T.Overturning Moment Σ x iM F h=
O.T. = 39.5 30 19.( ) ( )76 15 1,481.4 ftk kM k¢ ¢+ = ⋅
(c) Seismic Forces Govern the Lateral Strength Design.

2-24
Copyright © 2018 McGraw-Hill Education. All rights reserved. No reproduction or distribution without the prior written consent of McGraw-Hill Education.
Sloped Roof Snow Load PS CS pf Where pf Flat Roof Snow Load
pf 0.7 CeCt I pg
1
0.7 Windy Area
1.0 Heated Building
1.0 Type II Occupancy
40 psf for Boston
Based on Roo16
Tanf Slope 33.724
s
CeCt
IPg
C θ - æ ö¢ ÷ç= = ÷ç ÷ç ÷¢è ø
====
=
From Fig. P2.17 Cs is Approximately 0.9 (Non-Slippery
Surface)
( )( )( )( )( )
0.7 0.7 1.0 1.0 40 psf 19.6 psf
0.9 19.6 psf 17.64 psf
f
s s s
P
P C P
= =
= = =
Uniform Load Acting on Trusses Spaced @ 16o.c.
snow17.64 psf 16 282. plf( ) 2W ¢= =
P2.19. In the gabled roof structure shown in
Figure P2.13, determine the sloped roof snow
load Ps. The building is heated and is located in
a windy area in Boston. Its roof consists of
asphalt shingles. The building is used for a
manufacturing facility, placing it in a type II
occupancy category. Determine the roof slope
factor, Cs using the ASCE graph shown in
Figure P2.19. If roof trusses are spaced at 16 ft
on center, what is the uniform snow load along a
truss?
unobstructedslipperysurfaces withthermal resistance,R ≥ 30°F·h·ft2/Btu(5.3°C·m2/W) forunventilated roofsor R ≥ 20°F·h·ft2/Btu(3.5°C·m2/W) forventilated roofs
roofs withobstructions ornon-slippery
surfaces
Roof Slope
Cs
0
0
0.2
0.4
0.6
0.8
5°
1.0
30° 60° 90°
Roof slope factor Cswith warm roofs and Ct ≤ 1.0
P2.19
(b)
Section
h
qhGCp
qhGCpqzGCp
qhGCp
θ
P2.13

2-25
Copyright © 2018 McGraw-Hill Education. All rights reserved. No reproduction or distribution without the prior written consent of McGraw-Hill Education.
Load Combinations-Factored Strength
End Moments
( )( )O
1.4 1.4 180ft k 252ft k
1.2 1.6 0.5 orR
DL
DL LL L S
= - ⋅ =- ⋅
+ + ( ) ( )
( )
*
O
1.2 180 1.6 150 456ft k
1.2 1.0 0.2DL E LL S
= - + - =- ⋅
+ + ( ) ( ) ( )1.2 180 80 150 446ft k= - + - + - =- ⋅
Mid-Span Moments
( )( ) ( ) ( )
( )
O*
1.4 1.4 90 ft k 126 ft k
1.2 1.6 0.5 or 1.2 90 1.6 150 348ft k
1.2 1.0 0.2
R
DL
DL LL L S
DL E LL S
= + ⋅ =+ ⋅
+ + = + + + =+ ⋅
+ + ( ) ( )O
1.2 90 0 150 258ft k= + + =+ ⋅
Beam Needs to be Designed for Max. End Moment 456 ftk
Max. Mid-Span Moment 348 ftk
P2.20. A beam that is part of a rigid frame has end moments and mid-span moments for dead, live,
and earth-quake loads shown below. Determine the governing load combination for both negative and
positive moments at the ends and mid-span of the beam. Earthquake load can act in either direction,
generating both negative and positive moments in the beam.
End Moments (ft-kip) Mid-Span Moments (ft-kip) Dead Load 180 90
Live Load 150 150
Earthquake 80 0

2-26
Copyright © 2018 McGraw-Hill Education. All rights reserved. No reproduction or distribution without the prior written consent of McGraw-Hill Education.
s
container
γ 70.4(3)(8)(20)
33792 lbs
33.8 kips
33.8 kips 5.1 kips
Yes, the container will be carried away.
V W
V
V
F VF
FW
= ==
=
> =
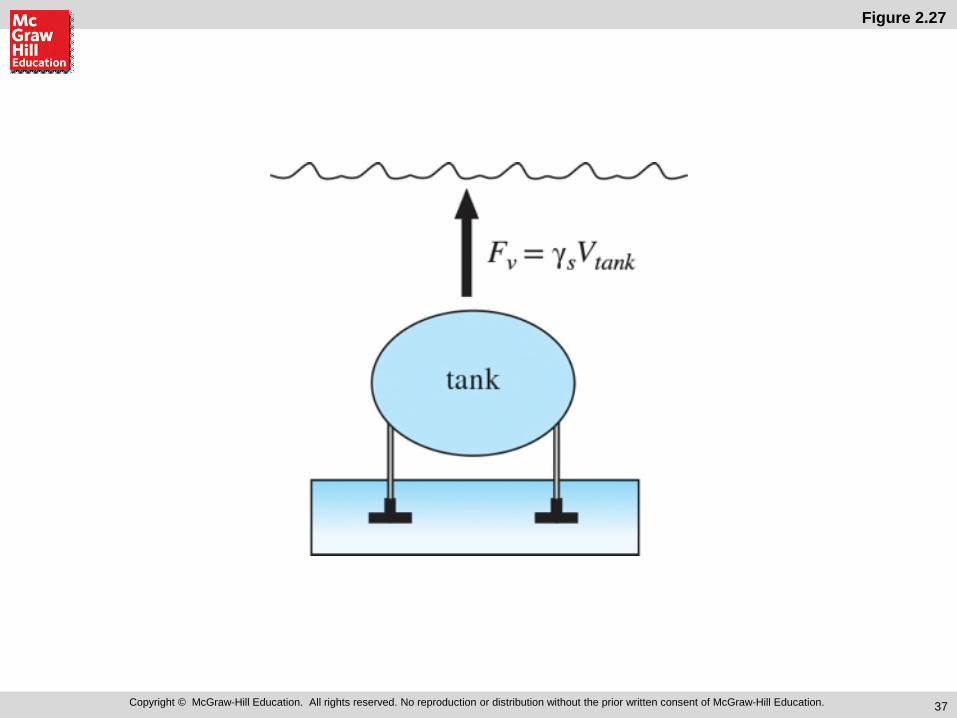
P2.21. Calculate the vertical hydrostatic load on
the 5100-lb empty shipping container in Figure
P2.19 subjected to a tsunami inundation height
of 3ʹ. Assuming the container is water-tight, will
the tsunami wave be capable of carrying away
the container as debris?
8ʹ
20ʹ
8.6ʹ
P2.21

2-27
Copyright © 2018 McGraw-Hill Education. All rights reserved. No reproduction or distribution without the prior written consent of McGraw-Hill Education.
max
max
Load Case 2:
222 ft
3
20 ft/sec
des
des
h h
u u
= =
= =
Hydrodynamic, Load Case 2 Hydrodynamic, Load Case 3
Hydrostatic on interior walls
2 21 1γ 70.4(35)3
2 2
11.1 kips
h s des
h
F bh
F
= =
=
Debris Impact on CD
330 330(0.65)(1.0)
214.5 kips
i o tsu
h
F C I
F
= =
=
P2.22. Consider the building in Figure P2.22,
which has a width into the page of 35 ft.
Maximum inundation height, hmax
, and flow
velocity, umax
, have been determined as 33 ft
and 20 ft/sec, respectively. Calculate the
hydrodynamic and hydrostatic resultant load and
location on the walls ABC and IJKL for Load
Cases 2 and 3, due to both inflow and outflow
directions. If windows are inundated, calculate
the expected hydrostatic loading on the adjacent
outside walls due to water retained by the floor,
or floors. Finally, calculate the debris impact
load to be applied to the free-standing column
CD. Assume Itsu = 1.0 and Cd = 1.25.
30ʹ
16ʹ
16ʹ
16ʹ
30ʹ
3ʹ
A
B
C
D
E
F
G
H
I
J
K
L
OPEN
IN Flow
OUT Flow
P2.22
K 6 ftFdK
J
3 ft
Load Case 2
8 ft
8 ft
K8 ft
FdK
J
3 ft
Load Case 3
1 ft
8 ft
8 ft
8 ft
FdJ
Fh K
J
3 ft
Hydrostatic on inside walls
33 ft
,
2
,
2
Trib height 8 6 14 ft
1γ ( )( )( )( )( )(20 )
2
170.4(1.0)(1.25)(1.0)(35)(14)(20 )
2
8624 kips
des K
dK s tsu d cx des K
dK
dK
h
F I C C B h
F
F
= = + =
=
=
=
,
2
,
2
Trib height 1 8 9 ft
170.4(1.0)(1.25)(1.0)(35)(9)(6.67 )
2
616 kips
Trib height 8 8 16 ft
170.4(1.0)(1.25)(1.0)(35)(16)(6.67 )
2
1096.2 kips
des J
dJ
dJ
des K
dK
dK
h
F
F
h
F
F
= = + =
=
=
= = + =
=
=
max
max
Load Case 3:
33 ft
16.67 ft/sec
3
des
des
h h
u u
= =
= =

1Copyright © McGraw-Hill Education. All rights reserved. No reproduction or distribution without the prior written consent of McGraw-Hill Education.
Design Loads and Structural Framing
Chapter 2

2Copyright © McGraw-Hill Education. All rights reserved. No reproduction or distribution without the prior written consent of McGraw-Hill Education.
Chapter Opener

3Copyright © McGraw-Hill Education. All rights reserved. No reproduction or distribution without the prior written consent of McGraw-Hill Education.
Figure 2.1
4Copyright © McGraw-Hill Education. All rights reserved. No reproduction or distribution without the prior written consent of McGraw-Hill Education.
Figure 2.2

5Copyright © McGraw-Hill Education. All rights reserved. No reproduction or distribution without the prior written consent of McGraw-Hill Education.
Figure 2.3

6Copyright © McGraw-Hill Education. All rights reserved. No reproduction or distribution without the prior written consent of McGraw-Hill Education.
Figure 2.4

7Copyright © McGraw-Hill Education. All rights reserved. No reproduction or distribution without the prior written consent of McGraw-Hill Education.
Figure 2.5

8Copyright © McGraw-Hill Education. All rights reserved. No reproduction or distribution without the prior written consent of McGraw-Hill Education.
Figure 2.5(Continued)

9Copyright © McGraw-Hill Education. All rights reserved. No reproduction or distribution without the prior written consent of McGraw-Hill Education.
Figure 2.6

10Copyright © McGraw-Hill Education. All rights reserved. No reproduction or distribution without the prior written consent of McGraw-Hill Education.
Figure 2.7
11Copyright © McGraw-Hill Education. All rights reserved. No reproduction or distribution without the prior written consent of McGraw-Hill Education.
Figure 2.8

12Copyright © McGraw-Hill Education. All rights reserved. No reproduction or distribution without the prior written consent of McGraw-Hill Education.
Figure 2.9

13Copyright © McGraw-Hill Education. All rights reserved. No reproduction or distribution without the prior written consent of McGraw-Hill Education.
Photo 2.1

14Copyright © McGraw-Hill Education. All rights reserved. No reproduction or distribution without the prior written consent of McGraw-Hill Education.
Figure 2.10

15Copyright © McGraw-Hill Education. All rights reserved. No reproduction or distribution without the prior written consent of McGraw-Hill Education.
Figure 2.11

16Copyright © McGraw-Hill Education. All rights reserved. No reproduction or distribution without the prior written consent of McGraw-Hill Education.
Figure 2.12

17Copyright © McGraw-Hill Education. All rights reserved. No reproduction or distribution without the prior written consent of McGraw-Hill Education.
Figure 2.13

18Copyright © McGraw-Hill Education. All rights reserved. No reproduction or distribution without the prior written consent of McGraw-Hill Education.
Photo 2.2

19Copyright © McGraw-Hill Education. All rights reserved. No reproduction or distribution without the prior written consent of McGraw-Hill Education.
Figure 2.14

20Copyright © McGraw-Hill Education. All rights reserved. No reproduction or distribution without the prior written consent of McGraw-Hill Education.
Photo 2.3
21Copyright © McGraw-Hill Education. All rights reserved. No reproduction or distribution without the prior written consent of McGraw-Hill Education.
Figure 2.15

22Copyright © McGraw-Hill Education. All rights reserved. No reproduction or distribution without the prior written consent of McGraw-Hill Education.
UNFigure 2.1

23Copyright © McGraw-Hill Education. All rights reserved. No reproduction or distribution without the prior written consent of McGraw-Hill Education.
Figure 2.16

24Copyright © McGraw-Hill Education. All rights reserved. No reproduction or distribution without the prior written consent of McGraw-Hill Education.
Figure 2.17

25Copyright © McGraw-Hill Education. All rights reserved. No reproduction or distribution without the prior written consent of McGraw-Hill Education.
Figure 2.18

26Copyright © McGraw-Hill Education. All rights reserved. No reproduction or distribution without the prior written consent of McGraw-Hill Education.
Figure 2.19

27Copyright © McGraw-Hill Education. All rights reserved. No reproduction or distribution without the prior written consent of McGraw-Hill Education.
Figure 2.19(Continued)

28Copyright © McGraw-Hill Education. All rights reserved. No reproduction or distribution without the prior written consent of McGraw-Hill Education.
Photo 2.4a

29Copyright © McGraw-Hill Education. All rights reserved. No reproduction or distribution without the prior written consent of McGraw-Hill Education.
Photo 2.4b

30Copyright © McGraw-Hill Education. All rights reserved. No reproduction or distribution without the prior written consent of McGraw-Hill Education.
Figure 2.20

31Copyright © McGraw-Hill Education. All rights reserved. No reproduction or distribution without the prior written consent of McGraw-Hill Education.
Figure 2.21

32Copyright © McGraw-Hill Education. All rights reserved. No reproduction or distribution without the prior written consent of McGraw-Hill Education.
Figure 2.22

33Copyright © McGraw-Hill Education. All rights reserved. No reproduction or distribution without the prior written consent of McGraw-Hill Education.
Figure 2.23

34Copyright © McGraw-Hill Education. All rights reserved. No reproduction or distribution without the prior written consent of McGraw-Hill Education.
Figure 2.24

35Copyright © McGraw-Hill Education. All rights reserved. No reproduction or distribution without the prior written consent of McGraw-Hill Education.
Figure 2.25

36Copyright © McGraw-Hill Education. All rights reserved. No reproduction or distribution without the prior written consent of McGraw-Hill Education.
Figure 2.26
37Copyright © McGraw-Hill Education. All rights reserved. No reproduction or distribution without the prior written consent of McGraw-Hill Education.
Figure 2.27
38Copyright © McGraw-Hill Education. All rights reserved. No reproduction or distribution without the prior written consent of McGraw-Hill Education.
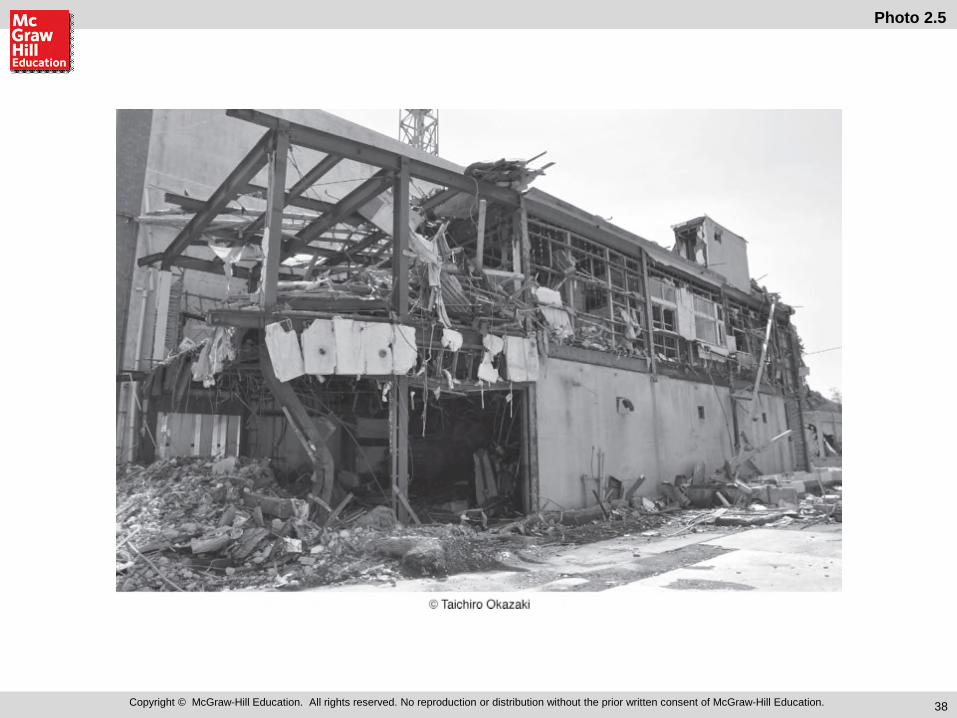
Photo 2.5

39Copyright © McGraw-Hill Education. All rights reserved. No reproduction or distribution without the prior written consent of McGraw-Hill Education.
Figure 2.28

40Copyright © McGraw-Hill Education. All rights reserved. No reproduction or distribution without the prior written consent of McGraw-Hill Education.
UNFigure 2.2

41Copyright © McGraw-Hill Education. All rights reserved. No reproduction or distribution without the prior written consent of McGraw-Hill Education.
Figure P2.1

42Copyright © McGraw-Hill Education. All rights reserved. No reproduction or distribution without the prior written consent of McGraw-Hill Education.
Figure P2.2

43Copyright © McGraw-Hill Education. All rights reserved. No reproduction or distribution without the prior written consent of McGraw-Hill Education.
Figure P2.3

44Copyright © McGraw-Hill Education. All rights reserved. No reproduction or distribution without the prior written consent of McGraw-Hill Education.
Figure P2.4

45Copyright © McGraw-Hill Education. All rights reserved. No reproduction or distribution without the prior written consent of McGraw-Hill Education.
Figure P2.8
46Copyright © McGraw-Hill Education. All rights reserved. No reproduction or distribution without the prior written consent of McGraw-Hill Education.
Figure P2.10

47Copyright © McGraw-Hill Education. All rights reserved. No reproduction or distribution without the prior written consent of McGraw-Hill Education.
Figure P2.11

48Copyright © McGraw-Hill Education. All rights reserved. No reproduction or distribution without the prior written consent of McGraw-Hill Education.
Figure P2.12

49Copyright © McGraw-Hill Education. All rights reserved. No reproduction or distribution without the prior written consent of McGraw-Hill Education.
Figure P2.13

50Copyright © McGraw-Hill Education. All rights reserved. No reproduction or distribution without the prior written consent of McGraw-Hill Education.
Figure P2.15

51Copyright © McGraw-Hill Education. All rights reserved. No reproduction or distribution without the prior written consent of McGraw-Hill Education.
Figure P2.18

52Copyright © McGraw-Hill Education. All rights reserved. No reproduction or distribution without the prior written consent of McGraw-Hill Education.
Figure P2.19

53Copyright © McGraw-Hill Education. All rights reserved. No reproduction or distribution without the prior written consent of McGraw-Hill Education.
Figure P2.21

54Copyright © McGraw-Hill Education. All rights reserved. No reproduction or distribution without the prior written consent of McGraw-Hill Education.
Figure P2.22