Embed Size (px)
Citation preview

Fundamentals of Die Casting Design
G. Bar-Meir, Ph. D.
1107 16^ Ave S. E.
Minneapolis, MN 55414-2411This book is licensed under Gnu Free document License or
Permission is granted to make and distribute verbatim copies of this book provided
the copyright notice and this permission notice are preserved on all copies.
Permission is granted to process the document source code through TffX or other
formatters and print the results, and distribute the printed document, provided
the printed document carries a copying permission notice identical to this one,
including the references to where the source code can be found and the official
home page.
Permission is granted to copy and distribute modified versions of this book under
the conditions for verbatim copying, provided that the entire resulting derived work
is distributed under the terms of a permission notice identical to this one.
Permission is granted to copy and distribute translations of this book into another
language, under the above conditions for modified versions.
The author would appreciate a notification of modifications, translations, and
printed versions. Thank you.

¦ i . / — . ~r.r.r. i r> m ¦ What have your membership duescopyright ©, 2000, by Dr. Bar-Meir , ,
done for you today? plagiarism?

Preface
This book, Fundamental of Die Casting Design, describes the fundamental of design of the
die casting process and die mold/runner. It is intended for people who have at least someknowledge of the basics of fundamental science, such as calculus, physics etc. This book will
benefit the die casting engineer (the project and process engineers) as well as managers andanyone else who deals with the die casting operations will find this information useful.
The structure of this book is such that many of the chapters should be usable independently.
For example, if you need information about, say, pQ 2 diagram, you can read just chapter 7.
I hope this makes the book easier to use as a reference manual. However, this manuscript is
first and foremost a text book, and secondly a reference manual only as a lucky coincidence.
I have tried to describe why the theories are the way they are, rather than just listing "seven
easy steps" for each task. This means a lot of information is presented which is not necessary
for everyone. These explanations have been marked as such and can be skipped. 1 Readingeverything will, naturally, increase your understanding of the fundamentals of die casting design.
This work was done on a volunteer basis: I believe professionals working in the die casting
design field will benefit from this information and that this is the best way to get the information
out to all people in this profession. I also believe that information / "stories" of die casting designmust be told. My experience has been that the "cartel" of "scientists", and in general of the
die casting establishment, have controlled what information is shared 2 . Like all volunteer work,there is a limit to how much effort I have been able to put into book and its' research. Most
of my knowledge of die casting was developed in the Twin Cities and Tel-Aviv. It never has
been funded. Hence, this knowledge has limits and more research is welcome. This book will
be better when good research projects are funded and outstanding scientists (such as Prof.
x At present, the book is not well organized and the marking will be in the next addition.
2 As scientist, I feel this book should be dedicated only to die casting design and its issues only. I apologiesfor dealing with issues which are not science. I feel, however that if those driving the industry don't change, the
die casting industry will change dramatically. Check out your company: has it been sold? or is it bankrupt orin financial troubles?

Eckert of U. of M.) carry it out. Moreover, due to my poor English and time limitation,
the explanations are not as good as if I had a few years to perfect them. As you read, you
will notice I have not worked out all the details of the explanations/examples in some areaswhere my research and knowledge have not yet matured. At present, there is no satisfactory
theory/model/ knowledge in these areas 3 . I have left some issues which have unsatisfactoryexplanations/knowledge in the book, however marked with a question mark. I hope to writeabout these area in the future.
I have tried to make this text of the highest quality possible and am interested in your
comments and ideas on how to make it better. Bad language, errors, ideas for new areas to
cover, rewritten sections, more fundamental material, more mathematics (or less mathematics);I am interested in all. If you want to be involved in the editing, graphic design, or proofreading,
please drop me a line. You may contact me via eMail at "[email protected]".
Several people have helped me with this book, directly or indirectly. I would like to especially
thank Prof. R.E.G. Eckert, whose work on dimensionless analysis study of die casting was the
inspiration for this book. I would like to acknowledge that some of the material in this book
was revised due to George Wilson of Sparta Light Metal, Inc.
The symbol META need to add typographical conventions for blurb here. This is mostly
for the author's purposes and also for your amusement. There are also notes in the margin,
but those are for the author's purposes only. They will be remove in the next edition.
I encourage anyone with a penchant for writing, editing, graphic ability, I^T^X knowledge,
and a desire to carry out experiments to join me in improving this book. If you have Internet
e-mail access, you can contact me at "[email protected]".
3 I have found either major mistakes or problems in the "common" models of these area or no research wasdone by scientists from other fields.
¦ ¦ . / — . ~r.r.r. i r> m ¦ What have your membership duescopyright ©, 2000, by Dr. Bar-Meir , , iv
done for you today? plagiarism?

Would NADCA continue to sponsorerroneous research works?
NADCA, for all practical purposes, controls all the public funding in USA for die casting
research. NADCA has supported the researchers who have produced work which violates basic
physics laws such as Brevick from Ohio State University (research work about the critical shot
sleeve velocity). I have informed NADCA about these research works years ago and to my
great astonishment NADCA continues to support these researchers (for example, NADCA is
still sponsoring Brevick's research on plunger velocity). Why?
This book lists some of researchers who produce erroneous or/and poor research work, suchas Al Miller from Ohio State University, Nguyen from CSIRO and many others. Would NADCA
continue support their research? You will be the judge.
Perhaps they will ask you, "How can everybody be wrong and only this newcomer be right?"
Ask yourself the following questions and make your own conclusion: Do you know of anyone
who knows how to correctly calculate any of the die casting process parameters, such as plunger
diameter, gate area etc.? Even better, do you know anyone who know hows to calculate the
actual profit (or loss) of their die casting production? Do you know of anyone who really uses
calculations to get improved casting and is successful?
Consider this: Doehler Jarvis, up to two years ago, was very active in NADCA research.
They participated in NADCA committees and also took an active role in the research done by
NADCA supported researchers. Guess what happened to the biggest die casting companyin the world?

¦ i . / — . ~r.r.r. i r> m ¦ What have your membership duescopyright ©, 2000, by Dr. Bar-Meir , ,
done for you today? plagiarism?

Will I Be in Trouble?
Many people have said I will be in trouble because I am telling the truth. Those with a vested
interest in the status quo (I hope you, the reader, know who they are) will try to use their
power to destroy me. In response, I challenge my opponents to show that they are right. If
they can do that, I will stand wherever they want and say that I am wrong and they are right.
However, if they cannot prove their models and practices are based on solid scientific principles,
nor find errors with my models (and I do not mean typos and English mistakes), then they
should accept my results and help the die-casting industry prosper.
People have also suggested that I get life insurance and/or good lawyer because my op-ponents are very serious and mean business; the careers of several individuals are in jeopardy
because of the truths I have exposed. If something does happen to me, then you, the reader,
should punish them by supporting science and engineering and promoting the die-casting in-
dustry. By doing so, you prevent them from manipulating the industry and gaining additionalwealth.
For the sake of my family, I have, in fact, taken out a life insurance policy. If something
does happen to me, please send a thank you and work well done card to my family.
vii

¦ i . / — . ~r.r.r. i r> m ¦ What have your membership duescopyright ©, 2000, by Dr. Bar-Meir , ,
done for you today? plagiarism?

The conception of this Book
This book started as a series of articles to answer both specific questions that I have been
asked, as well as questions that I was curious about myself. While addressing these questions,
I realized that many commonly held "truths" about die-casting were scientifically incorrect.
Because of the importance of these results, I have decided to make them available to the wider
community of die-casting engineers. However, there is a powerful group of individuals who
want to keep their monopoly over "knowledge" in the die-casting industry and to prevent the
spread of this information. 4 Because of this, I have decided that the best way to disseminatethis information is to write a book. Please be advised that English is my weak point 5 . Thisbook is my attempt to put this information, and more, in one place.
4 Please read my correspondence with NADCA editor Paul Bralower and Steve Udvardy. Also, please readthe references and my comments on pQ 2 .
5 I am looking for volunteer(s) to proofread this book
ix

¦ i . / — . ~r.r.r. i r> m ¦ What have your membership duescopyright ©, 2000, by Dr. Bar-Meir , ,
done for you today? plagiarism?

Volunteers
This chapter is dedicated to people who have volunteered to improve this book directly or
indirectly. We, the whole the die casting industry, should be thankful to these individuals for
their contributions to enhance the quality of this book and the knowledge of the die casting
process design.
If you want to contribute to this work and to have your name printed here, please contactme.
Volunteers
John Joansson
Adeline Ong
Robert J. Fermin
Mary Fran Riley
Joy Branlund
Denise Pfeifer
xi

¦ i . / — . ~r.r.r. i r> m ¦ What have your membership duescopyright ©, 2000, by Dr. Bar-Meir , ,
done for you today? plagiarism?

How this book is organized
This book is divided into two parts. The first discusses the basic science required by a die-
casting engineer; the second is dedicated to die-casting-specific science. The die-casting specific
is divided into several chapters. Each chapter is divided into three sections: section 1 describes
the "commonly" believed models; section 2 discusses why this model is wrong or unreasonable;
and section 3 shows the correct, or better, way to do the calculations. I have made great
efforts to show what existed before science "came" to die casting. I have done this to show
the errors in previous models which make them invalid, and to "prove" the validity of science.
I hope that, in the second edition, none of this will be needed since science will be accepted
and will have gained validity in the die casting community. Please read about my battle to getthe information out and how the establishment react to it.
xiii

¦ i . / — . ~r.r.r. i r> m ¦ What have your membership duescopyright ©, 2000, by Dr. Bar-Meir , ,
done for you today? plagiarism?

Plea for I^TgX usage
Why the smart guys who control the publication in the die casting industry are using poor
word processors? Is it only an accident that both the quality of the typesetting of papers in die
casting congress and their technical content quality is so low? I believe there is a connection.
All the major magazines of the the scientific world using TeX or I^TeX, why? Because it is very
easy to use and transfer (via the Internet) and, more importantly, because it produces high
quality documents. NADCA continued to produce text on a low quality word processor. Look
for yourself; every transaction is ugly.
Linux has liberated the world from the occupation and control of Microsoft OS. We hope
to liberate the NADCA Transaction from such a poor quality word processor. T^X and all (the
good ones) supporting programs are free and available every where on the web. There is no
reason not to do it. Please join me in improving NADCA's Transaction by supporting the use
of I5TeX by NADCA.
xv

¦ i . / — . ~r.r.r. i r> m ¦ What have your membership duescopyright ©, 2000, by Dr. Bar-Meir , ,
done for you today? plagiarism?

Abstract
Die-casting engineers have to compete not only with other die-casting companies, but also
against other industries such as plastics, and composite materials. Clearly, the "black art"
approach, which has been an inseparable part of the engineer's tools, is in need of being
replaced by a scientific approach. Excuses that "science has not and never will work" need to
be replaced with "science does work" . All technologies developed in recent years are described
in a clear, simple manner in this book. All the errors of the old models and the violations of
physical laws are shown. For example, the "common" pQ 2 diagram violates many physical
laws, such as the first and second laws of thermodynamics. Furthermore, the "common" pQ 2
diagram produces trends that are the opposite of reality, which are described in this book.
The die casting engineer's job is to produce maximum profits for the company. In order to
achieve this aim, the engineer must design high quality products at a minimum cost. Thus,
understanding the economics of the die casting design and process are essential. These are
described in mathematical form for the first time in this volume. Many new concepts and ideas
are also introduced. For instance, how to minimize the scrap/cost due to the runner system,and what size of die casting machine is appropriate for a specific project.
The die-casting industry is undergoing a revolution, and this book is part of it. One reason
(if one reason can describe the situation) companies such as Doehler Jorvis (the biggest die
caster in the world) and Shelby are going bankrupt is that they do not know how to calculate
and reduce their production costs. It is my hope that die-casters will turn such situations
around by using the technologies presented in this book. I believe this is the only way to keep
the die casting professionals and the industry itself, from being "left in the dust."
xvii

¦ i . / — . ~r.r.r. i r> m ¦ What have your membership duescopyright ©, 2000, by Dr. Bar-Meir , ,
done for you today? plagiarism?

CONTENTS
I BASIC SCIENCE 1
1 Introduction 3
1.1 The importance of reducing production costs 4
1.2 Designed/Undesigned Scrap/Cost 51.3 Linking the Production Cost to the Product Design 6
1.4 Historical Background 61.5 Numerical Simulations 8
1.6 "Integral" Models 111.7 Conclusion 12
2 Basic Fluid Mechanics 13
2.1 Introduction 13
2.2 What is fluid? Shear streass 14
2.2.1 Thermodynamics and mechanics concepts 14
Thermodynamics 142.2.2 Control Volume, c.v 15
2.2.3 Energy Equation 16
2.2.4 Momentum Equaton 16
2.2.5 Compressible flow 16
3 Dimensional Analysis 173.1 Introduction 20
3.2 The processes in die casting 21
3.2.1 Filling the shot sleeve 213.2.2 Shot sleeve 22
3.2.3 Runner system 24
3.2.4 Die cavity 26
3.2.5 Intensification period and after 27
xix

CONTENTS
3.3 Special topics 28
3.3.1 Is the flow in die casting is turbulent? 28
Additional note on numerical simulation 30
3.3.2 Dissipation effect on the temperature rise 30
3.3.3 Gravity effects 31
3.4 Estimates of the time scales in die casting 31
3.4.1 Utilizing semi dimensional analysis for characteristic time 31
Miller's approach 33
Present approach 34
3.4.2 The ratios of various time scales 36
3.5 Similarity applied to Die cavity 37
3.5.1 Governing equations 37
3.5.2 Design of Experiments 40
3.6 Summary of dimensionless numbers 40
3.7 Summary 42
3.8 Questions 42
4 Fundamentals of Pipe Flow 47
4.1 Introduction 47
4.2 Universality of the loss coefficients 47
4.3 A simple flow in a straight conduit 49
4.3.1 Examples of the calculations 50
4.4 Typical Components in the Runner andVent Systems 51
4.4.1 bend 51
4.4.2 Y connection 52
4.4.3 Expansion/Contraction 52
4.5 Putting it all to Together 52
4.5.1 Series Connection 52
4.5.2 Parallel Connection 53
5 Flow in Open Channels 55
5.1 Introduction 55
5.2 Typical diagrams 58
5.3 Hydraulic Jump 58
II DIE CASTING DESIGN 59
6 Runner Design 61
6.1 Introduction 61
6.1.1 Backward Design 61
6.1.2 Connecting runner seqments 62
6.1.3 Resistance 63
copyright ©, 2000, by Dr. Bar-MeirWhat have your membership dues
done for you today? plagiarism?

CONTENTS
7 pQ 2 Diagram Calculations 677.1 Introduction 68
7.2 The "common" pQ 2 diagram 68
7.3 The validity of the "common" diagram 747.3.1 Is the "common" model valid? 74
7.3.2 Are the trends reasonable? 76
Plunger area/diameter variation 76Gate area variation 77
7.3.3 Variations of the Gate area, A 3 78
7.4 The reformed pQ 2 diagram 797.4.1 The reform model 79
7.4.2 Examining the solution 81
The gate area effects 81
General conclusions from example 7.4.2 85
The die casting machine characteristic effects 86
Plunger area/diameter effects 89Machine size effect 93
Precondition effect (wave formation) 947.4.3 Poor design effects 947.4.4 Transient effects 94
7.5 Design Process 947.6 The Intensification Consideration 95
7.7 Summary 96
7.8 Questions 96
8 Critical Slow Plunger Velocity 978.1 Introduction 98
8.2 The "common" models 98
8.2.1 Garber's model 98
8.2.2 Brevick's Model 101
The square shot sleeve 101
8.2.3 Brevick's circular model 102
8.2.4 Miller's square model 102
8.3 The validity of the "common" models 1038.3.1 Garber's model 103
8.3.2 Brevick's models 103
square model 103
Improved Garber's model 1038.3.3 Miller's model 103
8.3.4 EKK's model (numerical model) 1048.4 The Reformed Model 104
8.4.1 The reformed model 104
8.4.2 Design process 106
8.5 Summary 107
8.6 Questions 107
What have your membership dues
done for you today? plagiarise?copyright ©, 2000, by Dr. Bar-Meir

CONTENTS
9 Venting System Design 1099.1 Introduction 109
9.2 The "common" models 110
9.2.1 Early (etc.) model 1109.2.2 Miller's model Ill
9.3 General Discussion 112
9.4 The Analysis 1139.5 Results and Discussion 115
9.6 Summary 118
9.7 Questions 118
10 Clamping Force Calculations 119
III MORE INFO: Appendixes 121
A What The Establishment's Scientists Say 123
A.l Summary of Referee positions 124
A. 2 Referee 1 (from hand written notes) 125A.3 Referee 2 126
A.4 Referee 3 129
B My Relationship with Die Casting Establishment 135
C Density change effects 151
D Fanno Flow 155
D.l Introdcion 156
E Reference 159
copyright ©, 2000, by Dr. Bar-MeirWhat have your membership dues
done for you today? plagiarism?

Part I
BASIC SCIENCE
l


CHAPTER 1
Introduction
In the recent years many die casting companies have gone bankrupt (Doehler-Jarvis and Shelby
to name a few) and many other die casting companies have been sold (St. Paul Metalcraft,
Tool Products, OMC etc.). What is/are the reason/s for this situation? Some blame poormanagement. Others blame bad customers (which is mostly the automobile industry). Perhaps
there is something to these claims. Nevertheless one can see that the underlying reasons is
the missing knowledge of how to calculate the when profits are made and how to design sothat costs will be minimized. To demonstrate how the absurd situation is the fact that there
is not even one company today that can calculate the actual price of any product that they
are producing. Moreover, if a company is able to produce a specific product, no one in that
company looks at the redesign (mold or process) in order to reduce the cost systematically. If
there is a company which does such A thing, the author will be more then glad to learn aboutit.
In order to compete with other industries, the die casting industry must reduce cost as
much as possible (20% to 40%) and lead time significantly (by 1/2 or more). To achieve thesegoals, the engineer must learn to connect mold design to the cost of production (charged to
the customer) and to use the correct scientific principals involved in the die casting process to
reduce/eliminate the guess work. This book is part of the revolution in die casting by whichscience is replacing the black art of design. For the first time, a link between the cost and the
design is spelled out. Many new concepts, based on scientific principles, are introduced. The
old models, which plagued by the die casting industry for many decades, are analyzed, their
errors are explained and the old models are superseded.
"Science is good, but it is not useful in the floor of our plant!!" George Reed, the former
president of SDCE, recently announced in a meeting in the local chapter (16) of NADCA.He does not believe that there is A relationship between "science" and what he does with
the die casting machine. He said that because he does not follow NADCA recommendations,
he achieves good castings. For instance, he stated that in the conventional recommendation
in order to increase the gate velocity, plunger diameter needs to be decreased. He said that
3

Chapter 1. Introduction
because he does not follow this recommendation, and/or others, that is the reason he succeedsin obtaining good castings. He is right and wrong. He is right not to follow the conventional
recommendations since they violate many basic scientific principles. One should expect that
models violating scientific principles would produce unrealistic results. When such results occur,
this should actually strengthen the idea that science has validity. The fact that models which
appear in books today are violating scientific principals and therefore do not work should actually
convince him, and others, that science does have validity. Mr. Reed is right (in certain ranges)
to increase the diameter in order to increase the gate velocity as will be covered in Chapter 7.
The above example is but one of many of models that are errant and in need of correction.
To date, the author has not found so much as a single "commonly" used model that has been
correct in its conclusions, trends, and/or assumptions. The wrong models/methods that haveplagued the industry are: 1) critical slow plunger velocity, 2) pQ 2 diagram, 3) plunger diameter
calculations, 4) runner system design, 5) vent system design, etc 1 . These incorrect models arethe reasons that "science" does not work. The models presented in this book are here for the
purpose of answering the questions of design in a scientific manner which will result in reduced
costs and increased product quality.
Once the reasons to why "science" did not work are clear, one should learn the correct
models for improving quality, reducing lead time and reducing production cost. The main
underlying reason people are in the die casting business is to make money. One has to use
science to examine what the components of production cost/scrap are and how to minimize oreliminate each of them to increase profitability. The underlying purpose of this book it to help
the die caster to achieve this target.
1.1 The importance of reducing production costs
Contrary to popular belief, a reduction of a few percentage points of the production cost/scrapdoes not translate into the same percentage of increase in profits. The increase is a more
complicated function. To study the relationship further see Figure 1.1 where profits are plotted
as a function of the scrap. A linear function describes the relationship when the secondary
operations are neglected. The maximum loss occurs when all the material turned out to be
scrap and it is referred to as the "investment cost" . On the other hand maximum profits occur
when all the material becomes products (no scrap of any kind). The breakeven point (BEP)
has to exist somewhere between these two extremes. Typically, for the die casting industry,
the breakeven point lies within the range of 65%-75% product (or 25%-35% scrap). Typicalprofits in the die casting industry are about 20%. 2
Example 1.1
1_ The author would like to find/learn about even about a single model presently used in the industry that iscorrect in any area of the process modeling (understanding).
2 lf it below 15% the author would expect the owner to consider to invest in the stock exchange. There is apossibility to make more profits this way. Perhaps this is the reason that so many die casting companies sold in
these days.m(1.1)
copyright ©, 2000, by Dr. Bar-MeirWhat have your membership dues
done for you today? plagiarism?4

Section 1.2. Designed/Undesigned Scrap/Cost
profits ¦ l breakeven
point
p20
iX
cmaximum
profits
invesment
cost
so
-65-75 78 80 100 no oscrap /Vo
oscrap
p100
Figure 1.1: The profits as a function of the amount of the scrap
what would be the effect on the profits of a small change (2%) in a amount of scrap for
a job with 22% scrap (78% product) and with breakeven point of 65%?
a reduction of 2% in a amount of the scrap to be 20% (80% product) results in increaseof more then 15.3% in the profits.
This is a very substantial difference. Therefore a much bigger reduction in scrap will result
1.2 Designed/ Undesigned Scrap/Cost
There are many definitions of scrap. The best definition suited to the die casting industry
should be defined as all the metal that did not turn-out to be a product. There are two kinds of
scrap/cost: 1) those that can be eliminated, and 2) those that can only be minimized. The firstkind is referred to here as the undesigned scrap, and the second is referred as designed scrap.
What is the difference? It is desired not to have rejection of any part (the rejection should be
zero) and, of course it is not designed and this is the undesigned scrap/cost. However, it isimpossible to eliminate the runner completely, and it is desirable to minimize its size in such
a way that the cost will be minimized. This is minimization of cost and this is the designed
Solution
iin much, much bigger profits. to put figure about this point
(relative profits)
What have your membership dues
done for you today? plagiarise?copyright ©, 2000, by Dr. Bar-Meir

Chapter 1. Introduction
scrap/cost. The die casting engineer must distinguish between these two scrap components inorder to be able to determine what should be done and what cannot be done.
Science can make a significant difference; for example, it is possible to calculate the critical
slow plunger velocity and thereby eliminating (almost) air entrainment in the shot sleeve in
order to minimize the air porosity. This means that air porosity will be reduced and marginal
products (even poor products in some cases) are converted into good quality products. In this
way, the undesigned scrap is eliminated. This topic will studied further in Chapter ??.
Two different examples of designed scrap/cost and undesigned scrap/cost have been pre-
sented. There is also the possibility that a parameter which reduces the designed scrap/costwill, at the same time, reduce the undesigned scrap/cost. An example of such a parameter isthe venting system design. It can easily be shown that there is a critical design below which
air/gas is exhausted easily and above which air is trapped. In the later case, the air/gas pressurebuilds up and results in a poor casting (large amount of porosity) 3 .. The analysis of the ventsystem demonstrates that a design much above the critical design and design just above the
critical design yielding has almost the same results,- small amount of air entrainment. One can
design the vent just above the critical design so the design scrap/cost is reduced to a minimumamount possible. Now both targets have been achieved: less rejections (undesigned scrap) and
less vent system volume (designed scrap).
1.3 Linking the Production Cost to the Product Design
It is sound accounting practice to tie the cost of every aspect of production to the cost to
be charged to the customer. Unfortunately, the practice today is such that the price of the
products are determined by some kind of average based on the part weight plus geometry and
not on the actual design and production costs. Furthermore, this idea is also perpetuated by
researchers who do not have any design factor (El-Mehalawi, Liu and Millerl997). Here it
is advocated to price according to the actual design and production costs. It is believed that
better pricing results from such a practice. In today's practice, even after the project is finished,
no one calculates the actual cost of production, let alone calculating the actual profits. The
consequences of such a practice are clear: it results in no push for better design, and with
no idea which jobs make profits and which do not. Furthermore, considerable financial cost
is incurred which could easily be eliminated. Several chapters in this book are dedicated to
linking the design to the cost (end-price).
1.4 Historical Background
Die casting is relatively speaking a very forgiving process, in which after tinkering with the
several variables one can obtain a medium quality casting. For this reason there has not been
any real push toward doing good research. Hence, all the major advances in the understanding
of the die casting process were not sponsored by any of die casting institutes/associations.Many of the people in important positions in the die casting industry suffer from what is know
as the "Detroit attitude" which is very difficult to change. "We are making a lot of money so
3 The meaning of the critical design and above and below critical design will be discussed in Chapter 9
copyright ©, 2000, by Dr. Bar-MeirWhat have your membership dues
done for you today? plagiarism?

Section 1.4. Historical Background
why change?" . Moreover, the controlling personnel on the research funds believe that the die
casting is a metallurgical manufacturing process and therefore the research has to be carried
out by either Metallurgical Engineers or Industrial Engineers. Furthermore, this come as no
surprise - that people-in-charge of the research funding fund their own research. One cannot
wonder if there is a relationship between so many erroneous models which have been produced
and the personnel controlling the research funding. A highlight of the major points of the
progress of the understanding is described herein.
The vent system design requirements were studied by some researchers, for example Suchs,
Veinik, and Draper and others. These models, however, are unrealistic and do not provide a
realistic picture of the real requirements or of the physical situation since they ignore the major
point, the air compressibility. Yet, they provide a beginning in moving the die casting process
towards being a real science.
One of the secrets of the black art of design was that there is a range of gate velocity
which creates good castings depending on the alloy properties being casted. The existence
of a minimum velocity hints that a significant change in the liquid metal flow pattern occurs.
Veinik (Veinikl962) linked the gate velocity to the flow pattern (atomization) and provide a
qualitative physical explanation for this occurrence. Experimental work (Maierl974) showed
that liquid metals, like other liquids, flow in three main patterns: a continuous flow jet, a
coarse particle jet, and an atomized particle jet. Other researchers utilized the water analogy
method to study flow inside the cavity for example, (Bochvar et al.1946). At present, the
(minimum) required gate velocity is supported by experimental evidence which is related to the
flow patterns. However, the numerical value is unknown because the experiments were poorly
conducted for example, (Stuhrke and Wallacel966) the differential equations that have been
"solved" are not typical to die casting 4 .
In the late 70's an Australian group (Davisl975) suggested adopting the pQ 2 diagram fordie casting in order to calculate the gate velocity, the gate area and other parameters. As with
all the previous models they missed the major points of the calculations. As will be shown
in Chapter 7, the Australian's model produce incorrect results and predict trends opposite to
reality. This model took root in die casting industry for the last 25 years. Yet, one can only
wonder why this well established method (supply and demand theory) which was introduced
into fluid mechanics in the early of this century reached the die casting only in the late seventies
and was then erroneously implemented.
Until the 1980 there was no model that assisted the understanding air entrapment in the shot
sleeve. Garber described the hydraulic jump in the shot sleeve and called it the "wave" , probably
because he was not familiar with this research area. He also developed erroneous model which
took root in the industry in spite of the fact that it never works. One can only wonder why
the major die casting institutes/associations have not published this fact. Moreover, NADCA
and other institutes continue to funnel large sums of money to the researchers (for example,
Brevick from Ohio State) who used Garber's model even after they knew that Garber's model
is totally wrong.
The turning point of the understanding was when Prof. Eckert, the father of modern heat
transfer, introduced the dimensional analysis applied to the die casting process. This established
a scientific approach which provided a uniform schemata for uniting experimental work with the
4 Read about this in Chapter 3.
What have your membership dues
done for you today? plagiarise?copyright ©, 2000, by Dr. Bar-Meir
Chapter 1. Introduction
actual situations in the die casting process. Dimensional analysis demonstrates that the fluid
mechanics processes, such as filling of the cavity with liquid metal and evacuation /extractionof the air from the mold, can be dealt when the heat transfer is assumed to be negligible.However, the fluid mechanics has to be taken into account in the calculations of the heat
transfer process (the solidification process).
This proved an excellent opportunity for "simple" models to predict the many parameters
in the die casting process, which will be discussed more fully in this book. Here two examples
of new ideas that mushroomed in the inspiration of prof. Eckert's work. It has been shown
that (Bar-Meirl995b) the net effect of the reactions is negligible. 5 The development of thecritical vent area concept provided the major guidance for 1) the designs to the venting system
2) when the vacuum system needs to be used. In this book, many of the new concepts and
models, such as economy of the runner design, plunger diameter calculations, minimum runner
design, etc are described for the first time.
1.5 Numerical Simulations
Numerical simulations have been found to be very useful in many areas which lead many
researchers attempting to implement them into die casting process. Considerable research work
has been carried out on the problem of solidification including fluid flow which is known also as
Stefan problems (Hu and Argyropoulosl996). Minaie et al in one of the pioneered work (Minaie,
Stelson and Vollerl991) use this knowledge and simulated the filling and the solidification of the
cavity using finite difference method. Hu et al (Hu et al.1992) used the finite element method toimprove the grid problem and to account for atomization of the liquid metal. The atomization
model in the last model was based on the mass transfer coefficient. Clearly, this model is
in waiting to be replaced by a realistic model to describe the mass transfer 6 . The Enthalpymethod was further exploded by Swaminathan and Voller (Swaminathan and Vollerl993) and
others to study the filling and solidification problem.
While numerical simulation looks very promising, all the methods (finite difference, finite
elements, or boundary elements etc) 7 suffer from several major drawbacks that prevent fromthem yielding reasonable results.
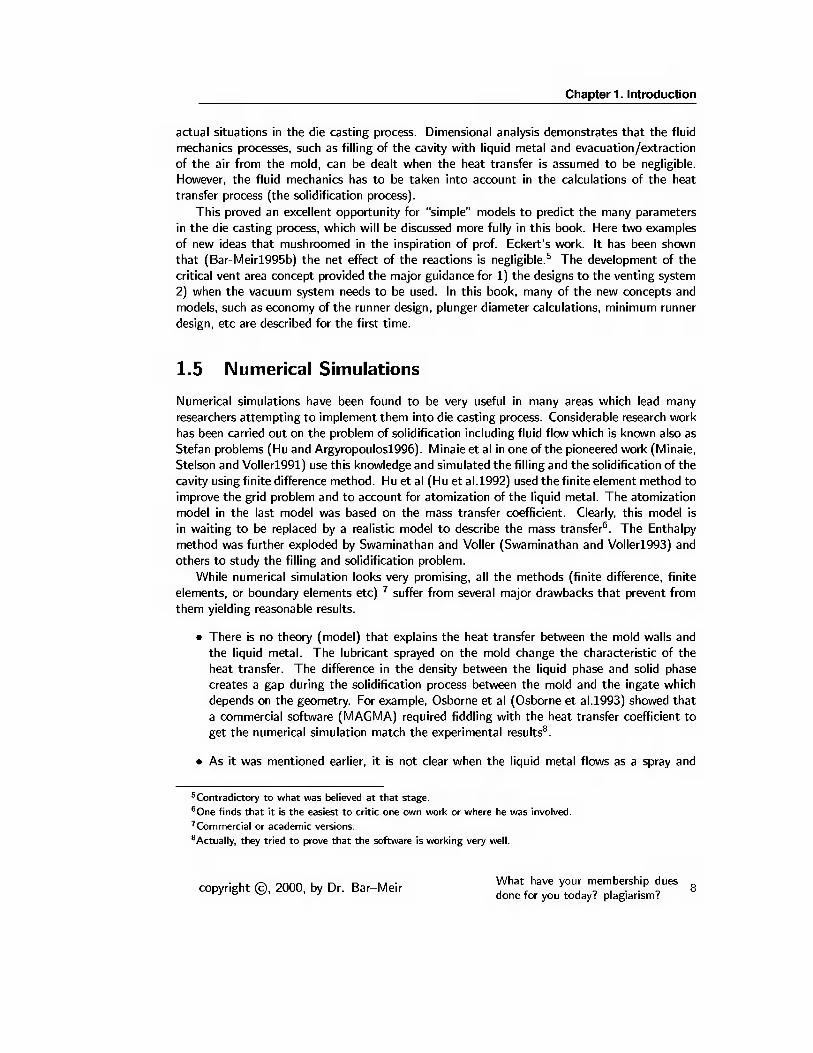
• There is no theory (model) that explains the heat transfer between the mold walls and
the liquid metal. The lubricant sprayed on the mold change the characteristic of the
heat transfer. The difference in the density between the liquid phase and solid phase
creates a gap during the solidification process between the mold and the ingate which
depends on the geometry. For example, Osborne et al (Osborne et al.1993) showed that
a commercial software (MAGMA) required fiddling with the heat transfer coefficient toget the numerical simulation match the experimental results 8 .
• As it was mentioned earlier, it is not clear when the liquid metal flows as a spray and
Contradictory to what was believed at that stage.6 One finds that it is the easiest to critic one own work or where he was involved.
Commercial or academic versions.
8 Actually, they tried to prove that the software is working very well.
copyright ©, 2000, by Dr. Bar-Meir

Section 1.5. Numerical Simulations
when it flows as continuous liquid. Experimental work has demonstrated that the flow,
for large part of the filling time, is atomized (Bar-Meirl995a).
• The pressure in the mold cavity in all the commercial codes are calculated without taking
into account the resistance to the air flow out. Thus, built-up pressure in the cavity
is poorly estimated and therefore the characteristic flow of the liquid metal in the mold
cavity is poorly estimated as well.
• The flow in all the simulations is assumed to be turbulent flow. However, time and space
are required to achieved a fully turbulent flow. For example, if the flow at the entrance to
a pipe with the typical conditions in die casting is laminar (actually it is a plug flow) it will
take a runner with a length of about 10[m] to achieved fully developed flow. With thisin mind, clearly some part of the flow is laminar. Additionally, the solidification process
is faster compared to the dissipation process in the initial stage so it is also a factor in
changing the flow from a turbulent (in case the flow is turbulent) to a laminar flow.
• The liquid metal velocity at the entrance to the runner is assumed in the numerical
simulation and not calculated. In reality this velocity has to be calculated utilizing pQ 2
diagram.
• If turbulence is exist in the flow field, what is the model that describes it adequately?
Clearly, model such k — e are based on isentropic homogeneous with mild change in
the properties cannot describes situations where the flow changes into two-phase flow
(solid-liquid flow) etc.
• The heat extracted from the die is done by cooling liquid (oil or water). In most models
(all the commercial models) the mechanism is assumed to be by "regular cooling". In
actuality, some part of the heat is removed by boiling heat transfer.
• The governing equations in all the numerical models, I am aware of, neglecting the
dissipation term in during the solidification. The dissipation term is the most importterm in that case.
One wonders how, with unknown flow pattern (or correct flow pattern), unrealistic pressure
in the mold, wrong heat removal mechanism (cooling method), erroneous governing equation inthe solidification phase, and inappropriate heat transfer coefficient, a simulation could produce
any realistic results. Clearly, much work is need to be done in these areas before any realistic
results should be expected from any numerical simulation. Furthermore, to demonstrate this
point, there are numerical studies that assume that the flow is turbulent, continuous, no air
exist (or no air leaving the cavity) and proves with their experiments that their model simulate
"reality" (Kim and Santl995). On the other hand, other numerical studies assumed that the
flow does not have any effect on the solidification and of course have their experiments to back
this claim (Davey and Boundsl997). Clearly, this contradiction suggest several options:
• Both of the them are right and the model itself does not matter.
• One is right and the other one is wrong.
• Both of them are wrong.
What have your membership dues
done for you today? plagiarise?copyright ©, 2000, by Dr. Bar-Meir

Chapter 1. Introduction
The third research we mentioned here is an example where the calculations can be shown to be
totally wrong and yet the researchers have experimental proofs to back them up. Viswanathan
et al (Viswanathan et al.1997) studied a noble process in which the liquid metal is poured intothe cavity and direct pressure is applied to the cavity. In their calculations the authors assumed
that metal enter to the cavity and fill the whole entrance (gate) to the cavity. Based on this
assumption their model predict defects in certain geometry. Now lets look at this model a bit
more in critical examination. The assumption of no air flow out by the authors (was "explained"
to me privately that air amount is small and therefore not important) is very critical as will
be shown here. The volumetric air flow rate into the cavity has to be on average equal to
liquid metal flow rate (conservation of volume for constant density). Hence, air velocity hasto be approximately infinite to achieve zero vent area. Conversely, if the assumption that the
air flows in same velocity as the liquid entering the cavity, liquid metal flow area is a half what
is assume in the researchers model. In realty, the flow of the liquid metal is in the two phase
region and in this case it is like turning a bottle full of water over and liquid inside flows as
"blobs" 9 . In this case the whole calculations do not have much to do with reality since thevelocity is not continuous and different from the calculated.
Another example of such study is the model of the flow in the shot sleeve by Backer and Sant
from EKK (Backer and Santl997). The researchers assumed that the flow is turbulent and they
justified it because they calculated an found a "jet" with extreme velocity. Unfortunately, all
the experimental evidence demonstrate that there is no such jet (Madsen and Svendsenl983).It seems that this jet is results from the "poor" boundary and initial conditions 10 . In thepresentation, the researchers also stated that results they obtained for laminar and turbulent
flow were the same 11 while a simple analysis can demonstrate the difference is very large. Also,one can wonder how liquid with zero velocity to be turbulent. With these results one can
wonder if the code is of any value or the implementation is at fault.
The bizarre belief that the numerical simulations are a panacea to the all the design problem
is very popular in the die casting industry. I am convinced that any model has to describes the
physical situation in order to be useful. I cannot see experimental evidence supporting wrong
models as a real evidence 12 . I would like to see numerical calculations that produce realistic
results based on the real physics understanding. Until that point come, I will suggest to be
suspicious about any numerical model and its supporting evidence. 13
9 Try it your self! fill a bottle and turn it upside and see what happens.
10 The boundary and initial conditions were not spelled out in the paper!! However they were implicitly statedin the presentation.
11 So why to use the complicate turbulent model?
12 Clearly some wrong must be there. For example, see the paper by Murray and colleague in which they usethe fact that two unknown companies were using their model to claim that it is correct.
13 With all this harsh words, I would like to take the opportunity for the record, I do think that work by Davey's
group is a good one. They have inserted more physics (for example the boiling heat transfer) into their modelswhich I hope in the future lead us to have realistic numerical models.
copyright ©, 2000, by Dr. Bar-MeirWhat have your membership dues
done for you today? plagiarism?

Section 1.6. "Integral" Models
1.6 "Integral" Models
Unfortunately, the numerical simulations of the liquid metal flow and solidification do not yield
reasonable results at the present time. This problem has left the die casting engineers with the
usage of the "integral approach" method. The most important tool in this approach is the pQ 2
diagram, one of the manifestations of supply and demand theory. In this diagram, an engineer
insures that die casting machine ability can fulfill the die mold design requirements; the liquid
metal is injected at the right velocity range and the filling time is small enough to prevent
premature freezing. One can, with the help of the pQ 2 diagram, and by utilizing experimental
values for desired filling time and gate velocities improve the quality of the casting. The gate
velocity has to be above certain value to assure atomization and below a critical value to prevent
erosion of the mold. This two values are experimental and no reliable theory is available today
known to the author (Bar-Meirl995a). The correct model for the pQ 2 diagram has beendeveloped and will be discussed in Chapter 7. A by-product of the above model is the plunger
diameter calculations and it is discussed in Chapter 7.
It turns out that many of the design parameters in die casting have a critical point above
which good castings are produced and below which poor castings are produced. Furthermore,
much above and just above the critical point do not change much but costs much more.
This is where the economical concepts plays a significant role. Using these concepts, one can
increase the probably significantly and, obtain very quality casting and reduce the leading time.
Additionally, the main cost components (machine cost and other) are analyzed and have to be
taken into considerations when one chooses to design the process with will be discussed in the
Chapter ?? on the economy of the die casting.
Porosity can be divided into two main categories; shrinkage porosity and gas/air entrain-ment. The porosity due to entrapped gases constitutes a large part of the total porosity. The
creation of gas/air entrainment can be attributed to at least four categories: lubricant evap-oration (and reaction processes 14 ), vent locations (last place to be filled), mixing processes,and vent/gate area. The effects of lubricant evaporation have been found to be insignificant.The vent location(s) can be considered partially solved since only qualitative explanation exist.The mixing mechanisms are divided into two zones: the mold, and the shot sleeve. Some
mixing processes have been investigated and can be considered solved. The requirement on the
vent/gate areas is discussed in Chapter 9. When the mixing processes are very significant in themold other methods are used and they include: evacuating the cavities (vacuum venting), Pore
Free Technique (in zinc and aluminum casting) and squeeze casting. The first two techniques
are used to extract the gases/air from the shot sleeve and die cavity before the gases have theopportunity to mix with the liquid metal. The squeeze casting is used to increase the capillary
forces and, therefore, to minimize the mixing processes. All these solutions are cumbersome
and more expensive and should be avoided if possible.
The mixing processes in the runners, where the liquid metal flows vertically against gravity
in a relative large conduit, are considered to be insignificant 15 . The enhanced air entrainmentin the shot sleeve is attributed to operational conditions for which a blockage of the gate by
14 Some researchers view the chemical reactions (e.g. release of nitrogen during solidification process) ascategory by itself.
15 Some work has been carried out and hopefully will be published soon.
What have your membership dues
done for you today? plagiarise?copyright ©, 2000, by Dr. Bar-Meir

Chapter 1. Introduction
a liquid metal wave occurs before the air is exhausted. Consequently, the residual air is forced
to be mixed into the liquid metal in the shot sleeve. Now with Bar-Meir's formula one can
calculate the correct critical slow plunger velocity and this will be discussed in Chapter 8.
1.7 Conclusion
It is an exciting time in the die casing industry because for the first time an engineer can start
using real science in the designing the runner/mold and the die casting process. Many modelshave been corrected and and many new techniques have been added. It is the new revolution
in the die casting industry.
copyright ©, 2000, by Dr. Bar-MeirWhat have your membership dues
done for you today? plagiarism?

CHAPTER 2
Basic Fluid Mechanics
2.1 Introduction
My experince show that many engineers/researchers in die casting are lacking the understandingof the basic fluid mechanics. This is my attempt to introduced this fundametal aspect of science
to the die casting community. As someone who grow most his life around people who are experts
in this area, I feel strongly that this knowldge cannot be avoided. The design of the process
as well as the properties of cassting (sepcially magnsem alloys) are deterimed by the fluid
mechanics/heat transer processes. I hope that others will join me to spread this knowldge.
There are numerous books about introdctery fluid mechanics 1 I would suggest to redearwho want to expained thier knowldge to read the book "Fluid Mechanics" by A.G. Hansen.
1967. I found this book to provide a clear illustretive picture of the physics. This chapter is a
kind of summary of that book. I add only the most fundemantal asspects of the topic known
as two phase flow. 2 I hope that you will find this intersting and you will further continue readbooks which are dealing with fluid mechanics.
First we will interodce the nature of fluids and basic concepts from thermodynamics. Later
we deals with the intergral analyses which will be divied into introduction of the control volume
concept and Continuity equations. The energy equation will expained in the next section. Later
will we will be descussing momentum equation. Lastly, the chapter will be dealing with the flow
compressible gases. We refrain from dealing with to many topic such boundary layers, non-
viscous flow, machinary flow etc because we believe that they are not essential to understand
the rest of this book. Nevertheless, they are important and it is advaceble that the reader will
1 \ grow on Streeter's and Shames' books, I feel that they are examples of too much material for reader asintroductry text books.
2 The knowledge on that topic come from Tel-Aviv University The department of Fluid Mechanics and HeatTransfer were I obtained my M.Sc. That department have a concentration of world formost experts in this area
such Dr. Y. Taitle, and other. Many of figures and discusions are borred from there.
13
Chapter 2. Basic Fluid Mechanics
read on these topics as well.
2.2 What is fluid? Shear streass
Fluid in this book is considered as a substance that "moves" continously when exposed to a
shear stress. The liquid metals are an example of such substance. However, the liquid metals
do not have to be in the liquidous phase to be considerd liquid. Aluminum at aproximatly
400°[C] is continously deformed when shear stress are aplied. The whole semi-solid die castingarea deals with materials that "looks" solid but behaves as liquid.
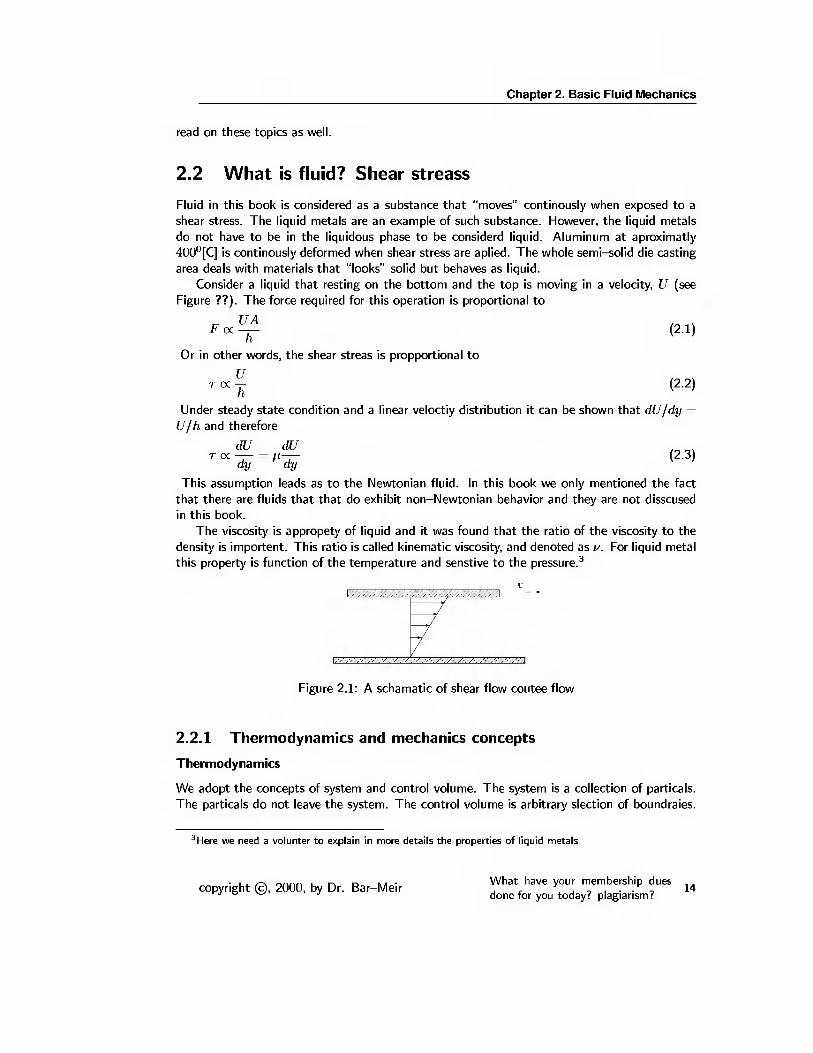
Consider a liquid that resting on the bottom and the top is moving in a velocity, U (see
Figure ??). The force required for this operation is proportional to
Or in other words, the shear streas is propportional to
r oc \ (2.2)Under steady state condition and a linear veloctiy distribution it can be shown that dU/dy =
U/h and therefore
dU dU
This assumption leads as to the Newtonian fluid. In this book we only mentioned the fact
that there are fluids that that do exhibit non-Newtonian behavior and they are not disscusedin this book.
The viscosity is appropety of liquid and it was found that the ratio of the viscosity to the
density is importent. This ratio is called kinematic viscosity, and denoted as v. For liquid metal
this property is function of the temperature and senstive to the pressure. 3/V///////////////////////////////////////////////////A
Figure 2.1: A schamatic of shear flow coutee flow
2.2.1 Thermodynamics and mechanics concepts
Thermodynamics
We adopt the concepts of system and control volume. The system is a collection of particals.
The particals do not leave the system. The control volume is arbitrary slection of boundraies.
3 Here we need a volunter to explain in more details the properties of liquid metals
copyright ©, 2000, by Dr. Bar-MeirWhat have your membership dues
done for you today? plagiarism?

Section 2.2. What is fluid? Shear streass
Particls can leave the system and boundaries can move. These two concepts will used extensivley
through the book. The first law applied to the non accelarting system can be written as d= P =„t on coordinate, di s -
/orignal energyX /energy re-x /energy trans-\
within a sys- + Cleved b Y the = , , + + ferred from (V tem J Wstem J \ the J We system J
The mathematical represention of equaition 2.4 is given by
— +gzi+ui+q = — + gz 2 + u 2 + w (2.5)
Note that it is a very good approximation to assume that the mass is a constant for system. Th« Ne»to„ i a » of motion t__ . 1111 ¦ 1 ¦ ¦ ¦ 1 1 ¦ take from scriven with the in-
The pressure and the hydrostatic pressure discusion with example vmtrury pump Ration
2.2.2 Control Volume, c.v.
The control volume was introduced by L. Euler 4 In the control volume, c.v we are looking atspesific volume which mass can enter and leave. The simplest c.v. is when the boundry are
fixed and it is refered to as the Non-deformable c.v.. The conservation of mass to such system
can be very good approximated by
A / pdV = - [ P V rn dA (2.6)
This equation states the change in the volume come from the difference of masses being
added through the boundary.
put two examples of simple for mass conservation.For deformable c.v.
^ - L d i iV + L/ v " dA (27)
Example 2.1
Empting a tank
put picture of the tank throw empty process
A tank as shown in the picture emptys from the exit, write the mass conservation
equations that discribe the physical situation
Solution
The continutity equation 2. 7
put another example
4 a blind man known as the master of calculus, made his living by being a tutor, can you imagne he hadeleven kids: where he had the time and energy to develop all the great things he has done.
, ,- What have your membership dues . , ^ ^ ^nnn 1 r> n m ¦15 , , copyright ©, 2000, by Dr. Bar-Meir
done for you today? plagiarise?

Chapter 2. Basic Fluid Mechanics
2.2.3 Energy Equation
Find the time that it will take to empty the tank given in previose example.
2.2.4 Momentum Equaton
The second Newton law of motion is written mathematically as
Dt
This exparetion, of course, for fluid particales can be written as
2.2.5 Compressible flow
My experience teaching this material is that take more than simester to good student to have
good undersding of this complex material. Yet to give very minimal information is seems to me
esential to the derstanding of the venting design. I made a great effort to disscuse the physics
with minimum mathematical detials. I found Shapiro's book to be excelent soure for those who
want to know in creater details this material. I will appreciat comments from the readers on
how to present this complex issue without bourning the reader with exrta mathematical/physics
(2.9)
or in more explisity it can be written as
r(2.10)
stuff.
copyright ©, 2000, by Dr. Bar-MeirWhat have your membership dues
done for you today? plagiarism?16
CHAPTER 3
Dimensional Analysis
The shear, S, at the ingate is determined by the average velocity,
U, of the liquid and by the ingate thickness, t. Dimensional
analysis shows that is directly proportional to (U jt). The
constant of proportionality is difficult to determine, . . .*
Murray, CSIRO Australia
Contents
3.1 Introduction 20
3.2 The processes in die casting 21
3.2.1 Filling the shot sleeve 21
3.2.2 Shot sleeve 22
3.2.3 Runner system 24
3.2.4 Die cavity 26
3.2.5 Intensification period and after 27
3.3 Special topics 28
3.3.1 Is the flow in die casting is turbulent? 28
Additional note on numerical simulation 30
3.3.2 Dissipation effect on the temperature rise 30
"This was taken from "The Design of feed systems for thin walled zinc high pressure die castings" , Metallur-
gical and materials transactions B Vol. 27B, February 1996, pp. 115-118. This is an excellent example of poor
research. Here, I will change this book approach and I will not discuss specific mistakes which are numerous. I
would like only to point out how dimensional analysis can take "cluttered' paper such as this one and turn it
into a real valuable. This example will appear in next addition of this book in a form of question to the student.
Bytheway, the authors mentioned that in Australia their idea is working. Is the physics laws are really different
over there? As the proof to their model, the researchers mentioned two unknown companies as fact that their
model is working. What a nice proof! Of course, the problem in the company was exactly as described in the
model and solution requires to use the model.
17
Chapter 3. Dimensional Analysis
3.3.3 Gravity effects 31
3.4 Estimates of the time scales in die casting 31
3.4.1 Utilizing semi dimensional analysis for characteristic time ... 31
Miller's approach 33
Present approach 34
3.4.2 The ratios of various time scales 36
3.5 Similarity applied to Die cavity 37
3.5.1 Governing equations 37
3.5.2 Design of Experiments 40
3.6 Summary of dimensionless numbers 40
3.7 Summary 42
3.8 Questions 42
copyright ©, 2000, by Dr. Bar-MeirWhat have your membership dues
done for you today? plagiarism?

One of the important tools to understand and to design in the die casting process is di-
mensional analysis. Fifty years ago this method transformed the fluid mechanics/heat transferinto an "uniform" understanding. In this book I am attempting to introduce to the die casting
field this established method 1 . Experimental studies will be "expended /generalized" as it wasdone in convective heat transfer. It is hoped that as a result, separate sections for aluminum,
zinc and magnesium will not exist in anymore die casting conferences. This chapter is based
partially on Dr. Eckert's book, notes and article on dimensional analysis applied to die casting.
Several conclusions are derived from this analysis and they will be presented throughout this
chapter. This chapter is intent for a reader who want to know why the formulation in the
book is in the dimensionless form. It also can bring a great benefit to researchers who want
to built their research on a solid foundation. For those who are dealing with the numerical
research /calculation, it can be useful to learn when some parameters should be taken intoaccount and why. Considerable amount of physical explanation is provided in this Chapter.
In dimensional analysis, the number of the effecting parameters is reduced to a minimum by
replacing the dimensional parameters by dimensionless parameters. Some researchers point out
that the chief advantages of this analysis are "to obtain experimental results with a minimum
amount of labor, results in a form having maximum utility" (Hansenl967, pp. 395). The
dimensional analysis has several other advantages which include l)increase of understanding,
2) knowing what is important, and 3)compacting the presentation 2 . ,houid»=inciud=,di,. . ' . i i ¦ i about advantages of tl
Dimensionless parameters are parameters that represent a ratio that do not have a physical P act of P ,e,entation
dimension. In this chapter only things related to die casting are presented. The experimental
study assists to solved problem when the solution of the governing equation can not be solved
To achieve this, we design experiments that are "similar" to the situation that we simulating.
This method is called the similarity theory in which the governing differential equations needed
to solve are defined and design experiments with the same governing differential equations. This
does not necessarily means that we have to conduct experiments exactly as they were in reality.
An example how the similarity is applied to the die cavity is given in the section 3.5. Casting
in general and die casting in particular, I am not aware of experiments that utilize this method.
For example, after the Russians (Bochvar et al.1946) introduced the water analogy method (in
casting) in the 40's all the experiments (known to the author such by Wallace's group, CSIRO
etc) conducted poorly design experiments. For example, experimental study of Gravity Tiled
Die Casting (low pressure die casting) performed by Nguyen's group in 1986 comparing twoparameters Re and We. The flow is "like" free falling for which the velocity is a function of the
height (U ~ \fgH). Hence, the equation Re model = Re actua i should lead only to H dode i =
Hactuai and not to any function of U mode i/U actua i. The value of U mode i/U act uai is actuallyconstant for constant for height ratio. Many other important parameters which controlling the
governing equations are not simulated (Nguyen and Carrigl986). The governing equations inthat case include several other important parameters which have not been controlled, monitored
and simulated 3 . Moreover, the Re number is controlled by the flow rate and the characteristics
1 Actually, Prof. E R G. Eckert introduced the dimensional analysis to the die casting long before me. I amonly his zealous disciple, all the credit should go to him. Of course, all the mistakes are mine and none of Dr.
Eckert's. All the typos in Eckert's paper were my responsibility (there are many typos) for which I apologize.
2 The importance of compact presentation I attribute to Prof. M. Bentwitch who was my mentor during mymaster studies.
3 Besides many conceptual physical mistakes, the authors have a conceptual mathematical mistake. They
What have your membership dues
done for you today? plagiarise?copyright ©, 2000, by Dr. Bar-Meir

Chapter 3. Dimensional Analysis
of the ladle opening and not as in the pressurized pipe flow as the authors assumed.
3.1 Introduction
RFigure 3.1: Rode in to the hole example
Lets take a trivial example of fitting a rode into a circular hole (see Figure 3.1). To havesolve this problem, it is required to know two parameters; one the diameter of the rode and
second the diameter of the hole. Actually it is required to have the only one parameter, theratio of the rode diameter to the hole diameter. The ratio is a dimensionless number and with
this number one can say that for a ratio larger than one, the rode will not enter the hole; and
ratio smaller than one rode is too small. Only when the ratio is equal to one the rode is said to
be fitting. This allows one to draw the situation by using only one coordinate. Furthermore, if
one wants to deal with tolerances, the dimensional analysis can easily be extended to say that
when the ratio is equal from 0.99 to 1.0 the rode is fitting, and etc. When one will use the two
diameters description he will need more than this simple sentence to describe it.
In preceding simplistic example the advantages are minimal. In many real problems, in-
cluding the die casting process, this approach can remove clattered views and put the problem
in a focus. It also helps to use information from different problems to a similar" situation.
Throughout the book the reader will notice that the systems/equations are converted to adimensionless form to augment the understanding.
tried to achieve the same Re and Ft numbers in the experiments as in reality for low pressure die casting. They
derived equation for the velocity ratio based on equal Re numbers (model and actual). They have done thesame for Ft numbers. Then they equate the velocity ratio based on equal Re to velocity ratio based on equal
Ft numbers. However velocity ratio based on equal Re is a constant and does vary with the tunnel dimension
(as opposed to distance from the starting point.). The fact that these ratios have the same symbols does notmean that they are really the same. These two ratios are different and cannot be equated.
copyright ©, 2000, by Dr. Bar-MeirWhat have your membership dues
done for you today? plagiarism?

Section 3.2. The processes in die casting
3.2 The processes in die casting
The die casting process can be broken to many separated processes which are controlled by
different parameters. The simplest division of the process for a cold chamber is as the following:
1) filling the shot sleeve, 2) slow plunger velocity, 3) filling the runner system 4) filling the
cavity and overflows, and 5) solidification process (also referred as intensification process).This division to such subprocesses results in a clear picture on each process. On the one hand,
in processes 1 to 3, we would like to have a minimum heat transfer/solidification to take placefor the obvious reason. On the other hand, in the rest of the processes, the solidification is the
major concern.
In die casting, the information/conditions down-stream do not travel upstream. For exam-ple, the turbulence does not travel from some point at the cavity to the runner and of course to
the shot sleeve. This kind of relationship is customarily denoted as a parabolic process (because
in mathematics the differential equations describes this kind of cases called parabolic). To large
extent it is true in die casting. The pressure in the cavity does not effect the flow in the sleeve
or the runner when vent system are well designed. In other words, the design of the pQ 2 dia-gram is not controlled by down-stream conditions. Another example, the critical slow plunger
velocity is not affected by the air/gas flow/pressure in the cavity. In general, the turbulencegenerated down-stream does not travel up-stream in this process. One has to restrict this
characterization to some points. One particularly has to be mentioned here: the poor design of
the vent system effects the pressure in the cavity and therefore effects does travel down stream.
For example, the pQ 2 diagram calculations are affected by poor vent system design.
3.2.1 Filling the shot sleeve
The flow from the ladle to the shot sleeve did not receive much attention in the die castingofhydralic
jump
HhFigure 3.2: Filling of the shot sleeve
21What have your membership dues
done for you today? plagiarise?copyright ©, 2000, by Dr. Bar-Meir

Chapter 3. Dimensional Analysis
depend on the readers re-
insert the calculations for the
time scale for hydraulic jumpcreation
put estimate on when hy-
draulic jump disappear.
graph for the esti-and velocity in that
3 plug flow, why?
change of density effect?
research 4 because it is believed that it does not play a significant role. For low pressure diecasting, the flow of liquid metal from the ladle through "channel/s" to the die cavity playsan important role 5 . The importance of the understanding of this process can show us howto minimize the heat transfer, layer created on the sleeve (solidification layer), and sleeve
protection [ a) erosion b) plunger problem].At first the hydraulic jump is created when the liquid metal enters the sleeve. As the liquid
metal level in the sleeve rises, the location of the jump moves closer to the impinging center.
At certain point, the jump disappears due to the liquid depth level (the critical depth level). At
this stage, air bubbles are entrained in the liquid metal which augment the heat transfer. At
present, we have an extremely limited knowledge about the heat transfer during process and ofcourse less about minimization of it.
The heat transfer from the liquid metal to the surroundings is affected by the velocity
and the flow patterns since the mechanism of heat transfer is changed from a like natural
convection to a like force convection. In addition the liquid metal jet surface is also effected by
heat transfer to some degree by change in the properties. As first approximation the radius of
the jet changes due to the velocity change. For a laminar flow the velocity goes as ~ -Jx wherex is the distance from the ladle. For a constant flow rate assumption the radius will change
as r ~ \ j\fx. Note that this relationship is not valid vary near the ladle proximity (r/x ~(why?)). The heat transfer increases as a function of x for these two reasons.
The heat transfer to the sleeve in the impinging area is the most significant and at present
only very limited knowledge is available due complexity.
discuss the fluid mechanics
during the quieting time. Dis-
sipation problems during so-lidification. Residual flow in
the sleeve and effects on
the critical plunger velocity.
What is optimum quietingminimum heat transfer and
maximum removal of residual
flow, open problem!
3.2.2 Shot sleeve
In this section we examine the solidification effects. One of the assumptions in the analysis
of the critical slow plunger velocity was that the solidification process does not play important
role (see Figure 3.3). The typical time for heat to penetrate a typical layer in air/gas phase is
in order of minutes. Moreover, the density of the air/gas is 3 order magnitude smaller than theliquid metal. Hence, most of the resistance to heat transfer is in the gas phase.
Meta Additionally, it has been shown that the liquid metal surface is continuously replaced
by slabs of material below the surface which is known in the scientific literature as
the renewal surface theory.
End
to show the calculations of
natural convection between
perhaps to put forn
paper derivations orshow minimum errot
Osizic's
pipes to
Therefore, if we look at the heat transfer from the liquid metal surface to the air as shown
in Figure 3.3 (mark as process 1) the air acts as insulator to the liquid metal. The solidified
layer thickness can be approximated by looking at the case of a plate with temperature below
melting point of the liquid metal when the liquid metal initial temperature is constant and
above the freezing point (above the mushy zone and ^ <C 1).
4 I have found only very few of papers dealing with this aspect. If you know about research concerning thisissue or you would like to work on this topic, please drop me a line.
5 I have made some elementary estimates of fluid mechanics and heat transfer and I am waiting to finish itand to find a journal without the kind of referees mentioned in Appendix A. Or perhaps it will appear in the
copyright ©, 2000, by Dr. Bar-MeirWhat have your membership dues
done for you today? plagiarism?

Section 3.2. The processes in die casting
rFigure 3.3: Heat transfer processes in the shot sleeve
(liquid)
_liquid metal
(solid)
shot sleeve (steel)
^^^^^^^^insulation
Figure 3.4: Solidification of the shot sleeve time estimates
The governing equation in the sleeve is
dT d 2 T(3.1)
where the subscript d denote the properties should be taken for the sleeve material.
Boundary condition between the sleeve and the air/gas is
dT
dn= (3.2)
y=0
next addition of this book. If you would like to help me to finish the work on this problem, please drop me aline.
What have your membership dues
done for you today? plagiarise?copyright ©, 2000, by Dr. Bar-Meir

Chapter 3. Dimensional Analysis
Where n represent the perpendicular direction to the die. Boundary conditions between the
liquid metal (solid) and sleeve
''steel
( dT
\dy= k A L ( t^-
y =i \9y(3.3)
y=l
The governing equation for the liquid metal (solid phase)
dT , fd 2 T
PimC PlmTt =k lm ^ w j (3.4)where Im denote that the properties should be taken for the liquid metal. We also neglect the
dissipation and the velocity due to the change of density and natural convection.
Boundary condition between the phases of the liquid metal is given by
v s p s h s f = kidT
dyk s
y=l+S
dT
dy
- T s )
y=l+& dy(3.5)
y=l+S
h s f the heat of solidificationp s liquid metal density at the solid phase
v n velocity of the liquid/solid interfacek conductivity
The governing equation in the liquid phase with neglecting of the natural convection and
density change is
9T , d 2 T
The dissipation function can be assumed to be negligible in this case.
There are three different periods in the heat transfer 1) filling the shot sleeve 2)during the
quieting time, and 3)during the plunger movement. In the first period heat transfer is relatively
very large (major solidification). At present we don't know much about the fluid mechanics
not to say much about the solidification process/heat transfer. The second period can besimplified and analyzed as if we know more the initial velocity profile. A simplified assumption
can be made considering the fact that Pr number is very small (large thermal boundary layer
compared to fluid mechanics boundary layer). Additionally, it can be assumed that the natural
p=,h,ps modified Goodman', convection effects are marginal. In the last period, the heat transfer is composed from two
ran'b^appfcd tae,al ™ hod) zones: one) behind the jump and two) ahead of the jump. The heat transfer head of the jumpis the same as in the second period while the heat transfer behind the jump is like heat transfer
in to a plug flow for low Pr number. The heat transfer in such cases have been studied in the
past. The reader can refer to, for example, the book "Heat and Mass Transfer" by Eckert andDrake.
continue with Goodman s
derivations
perhaps to put a short discus-
sion about the "I 5 applicationto this case.
to check what it is in the new
version and put the exact ref
put the typical solution, or
just the ref
3.2.3 Runner system
The flow in the runner system has to be divided into sections 1) flow with free surface 2)
filling the cavity when the flow is pressurized (see Figures 3.5 and 3.6). In the first section the
¦ u* r\ innn u n d m ¦ What have your membership dues _„copyright ©, 2000, by Dr. Bar-Meir , , 24
done for you today? plagiarism?

Section 3.2. The processes in die casting
liquidmetal
air streaks
Figure 3.5: Entrance of liquid metal to the runner
gravity affects the air entrainment. A dominate parameter in this case is We number. This
phenomenon determines how much metal has to be flushed out. It is well known that the
should ™ h.ert th. proof to liquid interface cannot be a straight line. Above certain velocity (typical to die casting, high
Re number) air leaves streaks of air/gas slabs behind as shown in Figure 3.5. These streakscreate a low heat transfer zone at the head of the "jet" and "increases" its velocity. The
air entrainment created in this case supposed to be flushed out through the vent system in a
proper process design. Unfortunately, at present we know very little about this issue especially
as concerned with geometry typical to die casting. to insert the dcui.tion of theFr, We numbers to scales of
Meta In the second phase, the flow in the runner system is pressurized and the typical
runner length is in order of 0.1[m]. In that case, if we have a large velocity let say
10[m/sec]. The velocity due to gravity is « 2.5[m/sec]. The Fr number assumes thevalue ~ 10 2 for which gravity play a limited role.
End
The converging nozzle such as the transition into runner system (what a good die casting
engineer should design) tents to reduce the turbulence and can even eliminate it. In that view,
the liquid metal enters the runner system (almost) as a laminar flow (actually close to a plug
flow). For a duct with a typical dimension of 10 [mm] and a mean velocity, U = 10[m/sec],(during the second stage), for aluminum die casting, the Reynolds number is:
Re = — « 5 x KT 7v
which is a supercritical flow. However, the flow is probably laminar flow due to the short time.
Meta Another look at turbulence: The boundary layer is a function of the time (during the
filling period) is of order6 = I2vt
What have your membership dues
done for you today? plagiarise?copyright ©, 2000, by Dr. Bar-Meir

Chapter 3. Dimensional Analysis
pressure
Figure 3.6: Flow in runner when during pressurizing process
The boundary layer in this case can be estimated as 6 for time of the first phase. Anyhow,
the utilizing the time of 0.01[sec] the viscosity of aluminum the boundary layer is of thethickness of 0.25[mm] which indicate that flow is laminar.
End
Meta To include dimensional analysis of this aspect? Similar to Streeter presentation with
additional discussion about branching in instantaneous starting flow. Flow switching to
turbulence pattern by poor design increase resistance in the middle of the filling process
in one branch with the poor design. Branching in runner system is discussed in chapter 4
End
3.2.4 Die cavity
All the numerical simulation of die filling are done almost exclusively assuming that the flow
is turbulent and continuous (no two phase flow). In the section 3.3.1 a discussion about theexistence of turbulence and what kind of model is appropriate or not are presented. The liquid
metal enters the cavity as a non-continuous flow. Actually, it is preferred that the flow will
m^t th= ,=f about th« pape, be atomized (spray) . While that there is considerable literature about many geometries nonabout atomization , the exper- •ill ¦ ¦ ¦ ¦ • c ¦ 7 ~i~ in ¦ • ¦ • I • I •
imems about critical entrance available to typical die casting conf igu ra t ion s ' . The flow can be atomized as either in a laminar
or turbulent region. The experiments by the author and by others showed that the flow turns
into spray in many cases ( See Figures 3.7).
6 only during the flow in the runner system, no filling of the cavity
7 I just wonder who were the opposition to this research? perhaps one of the referees as in the Appendix Afor the all clues I have received.
copyright ©, 2000, by Dr. Bar-MeirWhat have your membership dues
done for you today? plagiarism?

Section 3.2. The processes in die casting
In the section 3.4.1 it will be shown that the time for atomization is very fast compared with
any other process (filling time scale and, of course, the conduction heat transfer or solidification
time scales). Atomization requires to have two streams with a significant velocity difference.
Numerous experimental studies had shown that castings obtained when the injected velocity is
above certain value are superior. This fact alone is enough to convince us that the preferred
flow pattern is a spray flow. Yet, very small number of numerical models exist and used for die
casting assuming spray flow (for example the paper by Hu at el (Hu et al.1992).). Experimental
work commonly cited as a "proof" of turbulence was conducted in the mid 60's (Stuhrke and
Wallacel966) utilizing water analogy 8 . The "white" spats they observed in their experimentsare atomization of the water. Because these experiments were poorly conducted (no similarity
to die casting process) the observation/information from these studies is very limited. Yet withthis limitation in mind, one can conclude that the spray flow does exist.
Experiments Fondse et al (Fondse, Jeijdens and Oomsl983) show that atomization is larger P utth,fuii,«f«,
in a laminar flow compared to a turbulent flow in a certain range. This fact further confusing
what is the critical velocity needed in die casting. Since the experiments which measure the
critical velocity were poorly conducted no reliable information is available on what is the flow
pattern and what is the critical velocity 9 .
3.2.5 Intensification period and after
The main concern in this phase is to extract heat from the die and to solidify the liquid metal as
aptly as possible. The main resistance to the heat flow is in the die and the cooling liquid (oil
or water based solution) . The heat transfered to the cooling liquid is via boiling mechanism
in some part of the process. However, the characteristic boiling heat transfer time to achieve a
steady state is larger than the whole process occurs and the typical equations (steady state) for
the preferred situation (heat transfer only in the first mode) are not accurate. Thus, when we
have very limited understanding of so many aspects of the process clearly, the effects of each
process on other processes is also cluttered.
Meta the relationship between the pressure, density, and temperature. Insert the derivations
about the void creation in sharp corners during solidification. Insert the other papers
about the experiments about this issue.
End
8 The problems in these experiments were, among other things, the dimensional numbers not simulated suchas Re, Geometry etc. and therefore different differential equations not typical to die casting were "solved" . The
researchers also look at what is known as a "poor design" in which disturbances to flow downstream (this is
like putting screen in the flow). However, a good design requires smooth contours.
9 Beside other problems such as different flow velocity in different gates which never really measured, thepressure in the cavity and quality of the liquid metal entering the cavity (is it in two phase?) never been recorded.
put reference to the english
group
put boiling graph of Q vr.AT and to discuss the dif-
ferent mechanisms for steadystate and when.
What have your membership dues
done for you today? plagiarise?copyright ©, 2000, by Dr. Bar-Meir

Chapter 3. Dimensional Analysis
3.3 Special topics
3.3.1 Is the flow in die casting is turbulent?
Transition from laminar to turbulent
It commonly assumed that the flow is turbulent in the shot sleeve, runner system, and the
duration of the filling of the cavity. Further, it also assumed that the k— e model can reasonably
represent the turbulence structure. These assumptions are examined herein. We examine the
flow in 1) the shot sleeve, 2) the runner system, and 3) the mold cavity. Note, that even if the
turbulence is exist in some regions it doesn't necessarily mean that all the flow field is turbulent.
Figure 3.8 exhibits the transition to a turbulent flow for instantaneous starting flow in a
circular pipe. The abscissa represents time and the y-axis represents the Re number at which
transition to turbulence occurs. The points on the graphs show the transition to a turbulence.
This figure demonstrates that a large time is required to turn the flow pattern to a turbulent
which measured in several seconds. The figure demonstrates that the transition does not occur
below a certain critical Re number (known as the critical Re number for steady state). Italso shows that a considerable time has to elapse before transition to turbulence occurs even
for a relatively large Reynolds number. The geometry in die casting however is different and
therefore it is expected that the transition occurs at different times. Our present knowledge
of this area is very limited. Yet, a similar transition delay is expected to occur after the
"instantaneous" start-up which probably will be measured in seconds. The flow in die casting
in many situations is very short (in order of milliseconds) and therefore it is expected that thetransition to a turbulent flow does not occur. After the liquid metal is poured, it is normally
repose for sometime in a range of 10's seconds. This fact is known in the scientific literature
as the quieting time for which the existed turbulence (if exist) is reduced and after enough
time (measured in seconds) is illuminated. Hence, if turbulence was created during the fillingprocess of the shot sleeve is "disappeared". Now we can examine the question, is the flow in
the duration of the slow plunger velocity is turbulent (see Figure 3.9).
Clearly, the flow in the substrate (a head the wave) is still (almost zero velocity) andtherefore the turbulence does not exist. The Re number behind the wave is above the critical
Re number (which is in the range of 2000-3000). The typical time for the wave to travel to the
end of the shot sleeve are in the range of a ~ 10° second. At present there are no experimentsTo di,cuss th= f,ee interface on the flow behind the wave 10 . The estimation can be done by looking at what is known in theas oppose to solid interface. ¦¦ , ¦ ¦ ¦ n i i i
literature about the transition to turbulence in instantaneous starting pipe flow. It has been
shown (Wygnanski and Champanl973) that the flow changes from a laminar flow to turbulentflow occurs in an abrupt meaner for a flow with supercritical Re number. A typical velocity
of the propagating front (transition between laminar to turbulent) is about at same velocity asthe mean velocity of the flow. Hence, it is reasonable to assume that the turbulence is confined
to a small zone in the wave front since the wave is traveling in a faster velocity than the mean
¦houid »« insert a g,aph velocity. N ote that the thickness of the transition layer is a monotone increase function of time
"hr™n°vd«i™.ndtn. (traveling distance). The Re number in the shot sleeve based on the diameter is in a range of »eioct, m the shot siee.e ^ ^ 4 means tnat t h e b o u n d a ry layer has not developed much. Therefore, the flow can10 lt has to be said that similar situations are found in two phases flow but they different by the fact the flow
in two phase flow is a sinusoidal in some respects.
copyright ©, 2000, by Dr. Bar-MeirWhat have your membership dues
done for you today? plagiarism?

Section 3.3. Special topics
be assumed as almost a plug flow with the exception of the front region. »h,t, bout m.. did i.,.,*.skimmed to "increase" the
plunger head and effects onthe flow.
A note on numerical simulations
The most common model for turbulence that used in the die casting industry for simulating
the flow in cavity is k-e . This model is based on several assumptions
1. isentropic homogeneous turbulence,
2. constant material properties (or a mild change of the properties),
3. continuous medium (only liquid (or gas), no mixing of the gas, liquid and solid what so
ever), and
4. the dissipation does not play a significant role (transition to laminar flow).
The k-e model is considered reasonable for the cases where these assumptions are not far from
reality. It has been shown, and should be expected, that in cases where assumptions are far from
reality, the k-e model produces erroneous results. Clearly, if we cannot determine whether the
flow is turbulent and in what zone, the assumption of isentropic homogeneous turbulence is very
questionable. Furthermore, if the change to turbulence just occurred, one cannot expect the
turbulence to have sufficient time to become isentropic homogeneous. As if this is not enough
complication, we have to consider the effects of change of properties as results temperature
change. Large changes in the properties such as viscosity have between observed in many alloys
especially in the mushy zone.
While the assumption of the continuous medium is a semi reasonable in the shot sleeve
and runner, it is far from reality in the die cavity. As discussed previously, the flow is atomized
and it is expected to have a large fraction of the air in the liquid metal and conversely some
liquid metal drops in the air/gas phase. In such cases, the isentropic homogeneous assumptionis very dubious.
For these reasons the assumption of k-e model seems unreasonable unless good experimentscan show that the choice of the turbulence model does not matter for the calculation.
Meta To discuss the effect of the solidification on k-e model. Different properties in different
zones due to large thermal boundary layer.
End
Meta If we know close to nothing regarding what particles size we would preferred to have,
how we cannot design the process and the gate.
End
Meta The question whether the flow in die cavity is turbulent or laminar is secondary. Since
the two phase flow effects have to be considered such atomization, air/gas entrainmentetc.
End
What have your membership dues
done for you today? plagiarise?copyright ©, 2000, by Dr. Bar-Meir

Chapter 3. Dimensional Analysis
Additional note on numerical simulation
The solution of momentum equation for certain situations may lead to unstable solution. Such
case is the two jets with deferent velocity flow into a medium and they are adjoint (see Figure
3.10). The solution of such flow can show that the velocity field can obtain unstable solution forwhich the flow moderately change to became like wave flow. However, in many cases this flow is
turnout to be full with vortexes and such. The reason that this happened is the introduction of
instabilities. Numerical calculations intrinsically are introducing instabilities because truncation
of the calculations. In many cases, these truncations results over-shooting or under-shooting
of the nature instability. In cases where the flow is unstable, a careful study is required to make
sure that the solution did not produce an unrealistic solution in which larger or smaller than
reality introduced instabilities. An excellent example of such a poor understating is a work
made in EKK company (Backer and Santl997). In that work, the flow in the shot sleeve wasanalyzed. The nature of the flow is two dimensional which can be seem by all the photos taken
by numerous people (staring from the 50's). The presenter of that work explained that theyhave used 3D calculations because they want to study additionally the instabilities perpendicular
to the flow direction. The numerical "instability" in this case are larger than real instabilities
and therefore, the numerical results shows phenomena not exist in reality.
Reverse transition from turbulent flow to laminar flow
After the filling the die cavity, during the solidification process and intensification, the attained
turbulence (if exist) is reduced and probably eliminated, i.e. the flow is laminar in a large portion
of the solidification process. At present we don't comprehend when the transition point/criteriaoccurs and we must resort to experiments. It is a hope that some real good experiments using
the similarity technique, outline in this book, will be performed. So more knowledge can be
gained and hopefully will appear in this book.
3.3.2 Dissipation effect on the temperature rise
The large velocities of the liquid metal (particularly at the runner) theoretically can increasethe liquid metal temperature. To study this phenomenon lets look at the case where all the
kinetic energy is transformed into thermal energy.
Discuss the characteristic of
the value to be inserted into
equation 3.8. Put a footnote
about squeeze casting.
to put the explanation about
the temperature difference
only regular die casting
U 2
This equation leads to the definition of Eckert number
U 2Ec =
c P AT
(3.7)
(3.8)
When Ec number is very large it means that the dissipation plays a significant role and
conversely when Ec number is small the dissipation effects are minimal.
Meta The effect of temperature on the properties of the liquid metal are considerable in the
range of the mushy zone.
Endcontinue the discussion here
about the squeeze casting?
where small change in the
temperature create large
change in the material
properties. And calculate theBr number and discuss the
significance
What have your membership dues
done for you today? plagiarism?30

Section 3.4. Estimates of the time scales in die casting
3.3.3 Gravity effects
The gravity has a large effect only when gravity force is large relatively to other forces. A
typical velocity ranges generated by the gravity is the same as for a object falling in air. The
air effects can be neglected since the air density is very small compared with the liquid metal
density. The momentum is the other dominate force in the filling the cavity. Thus, the ratio
of the momentum forces to the gravity force, also known as Froude number, determines if the
gravity effects are important. The Froude number is defined here as
Where U is the velocity, I is the characteristic length g is the gravity force. For example, the
characteristic pouring length is in order of 0.1[m], in extreme cases the velocity can reach 1.6[m]with characteristic time of 0.1[sec]. The author is not aware of experiments to verify the flowpattern in such cases (low Pr number due to solidification effect) 11 . Yet, it is reasonable toassume that the liquid metal in such a case is laminar even though the Re number is relatively
large (~ 10 4 ) because of the short time and the short distance. The Re number is defined bythe flow rate and the thickness of the exiting typical dimension. Note, the velocity reach its
maximum value just before impinging on the sleeve surface.
The gravity has dominate effect on the flow in the shot sleeve since the typical value of the
Froude number in that case (especially during the slow plunger velocity period) are in the range
of 1. Clearly, any analysis of the flow has to take the gravity into consideration (see Chapter
3.4 Estimates of the time scales in die casting
3.4.1 Utilizing semi dimensional analysis for characteristic time
The characteristic time scales determine the complexity of the problem. For example, if the
time for heat transfer/solidification process in the die cavity is much larger than the filling time
than the problem can broken into three separate cases l)the fluid mechanics, the filling process,
and 2)the heat transfer and solidification 3) dissipation (maybe considered with solidification).Conversely, the real problem in die filling is that we would like to the heat transfer process to
be slower than the filling process to ensure a proper filling. The same can be said about other
processes.
filling time
The characteristic time for filling a die cavity is determined by
8).
(3.10)
I would like to learn about such experiments. Please drop me a line if you know.
31What have your membership dues
done for you today? plagiarise?copyright ©, 2000, by Dr. Bar-Meir

Chapter 3. Dimensional Analysis
discussion about the typicalL estimates and how to cal-
culate it
Where L denotes the characteristic length of the die and U denotes the average filling velocity,
determined by the pQ 2 diagram, in most practical cases this time typically is in order of 5-100
[millisecond]. Note, this time is not the actual filling time but related to it.
Atomization time
The characteristic time for atomization for a low Re number (large viscosity) is given by
t« t = — (3.H)
where v is the kinematic viscosity, a is the surface tension, and I is the thickness of the gate.
The characteristic time for atomization for large Re number is given by
«— (3.12)
The results obtained from these equations are different and the actual atomization time in die
casting has to be between these two values.
Conduction time (die mold)
The governing equation the heat transfer for die reads
8T d fd 2 T d ^d 2 T d d 2 T d \p d c Pd _=^_ + _ + _j (3.13)
To obtain the characteristic time we dimensionlessed the governing equation and present it
with a group of constants that determine value of of the characteristic time by set it to unity.Lets define
t • x , y , z „ T-T B ,„ , ,td = T~ '¦> x d = T > = T > z d = T > ° d = r ^~ ( 3 - 14 )
t Cd L L L j-m — ±B
L the characteristic path of the heat transfer from the die inner surface
to the cooling channels
subscript
B boiling temperature of cooling liquid
M liquid metal melting temperature
With these definitions equation (3.13) is transformed to
d6d _ to^od f^9d , &0d\dt ~ l 2 \dx' 2 + dy' 2 + dz' 2 J ( '
which leads into estimate of the characteristic time as
l 2tc d ~ — (3.16)
Note the characteristic time is not effected by the definition of the 0<j.
¦ u* r\ innn u n d hA ¦ What have your membership duescopyright ©, 2000, by Dr. Bar-Meir , , 32
done tor you today r plagiarism f

Section 3.4. Estimates of the time scales in die casting
Conduction time in the liquid metal (solid)
The governing heat equation in the solid phase of the liquid metal is the same as equation (3.13)
with changing properties to liquid metal solid phase. The characteristic time for conduction is
derived similarly as done previously by introducing the dimensional parameters
t' = —;x' = - t \ y' = r,z' = -¦ 0. = £^£- (3.17)t Cs ' £ £ £ Tm — Tb '
where t Cs is the characteristic time for conduction process and, £, denotes the main path ofthe heat conduction process die cavity. With these definitions, similarly as was done before the
characteristic time is given by
tc aoc.
(3.18)
Note again that a s has to be taken for properties of the liquid metal in the solid phase. Also
note that the solidified length, £, changes during the process and discussing the case where
whole die is solidified is not of the interest. Initially the thickness, £ = (or very small). The
characteristic time for very thin layers is very small, t Cs ~ 0. As the solidified layer increasesthe characteristic time increase. However, the temperature profile is almost established (if
other processes where to remain in the same conditions). Similar situation can be found in a
semi infinite slab undergoes solidification with AT changes as well as results of increase in the
resistance. For the forgoing reasons the characteristic time is very small.
Solidification time
Miller's approach
Following Eckert's work, Miller and his student (Horacio and Millerl997) altered the calcula-tions 12 and based the assumption that the conduction heat transfer characteristic time in die
(liquid metal in solid phase) is the same order magnitude as the solidification time. This as-
sumption leads them to conclude that the main resistance to the solidification is in the interface
between the die and mold 13 . Hence they conclude that the solidified front moves according tothe following
ph d v n = hAT (3.19)
12 M i ller and his student calculate the typical forces required for clamping. The calculations Mr. Miller hasmade show interesting phenomenon in which small casting (2[A)</]) requires larger force than heavier casting
(20[A;g])?! Check it out in their paper page 43 in NADCA Transaction 1997! If the results extrapolated to
about 50[A;s] casting, no force will be required for clamping. Furthermore, the force for 20 [kg] casting wascalculated to be in the range of 4000[iV]. In reality this kind of casting will made on 1000 [ton] machine ormore (3 order of magnitude larger than Miller calculation suggested). The typical required force should bedetermined by the plunger force and the machine parts transient characteristics and etc. Guess, how sponsoredthis research and how much it cost!
13 Why? What is the logic?
What have your membership dues
done for you today? plagiarise?copyright ©, 2000, by Dr. Bar-Meir

Chapter 3. Dimensional Analysis
Where here h is the innovative heat transfer coefficient between solid and solid 14 and v n is
front velocity. Then the filling time is given by the equation
*. = (3.20)
where I designates the half die thickness. As a corollary conclusion one can arrived from this
construction is that the filling time is linearly proportional to the die thickness since ph s i/hATis essentially constant (according to Miller). This interesting conclusion contradicts all the
previous research about solidification problem (also known as the Stefan problem). The author
not aware of any solidification problem to show similar results. Of course, Miller has all the
experimental evidence to back it up.
Present approach
Heat balance at the liquid-solid interface yields
p s h 8 fv n = k — (3.21)
where n is perpendicular to the surface and p has to be taken at the solid phase see Appendix
C. Additionally, note that in many alloys the density change during the solidification is quite
substantial which has a significant effect on the moving of the liquid/solid front. We notice
that at the die interface k s dT/dn = kadT/dn and further assume that temperature gradient
in the liquid side, OT/dn ~ , negligible compared to other fluxes. Hence, the speed of thesolid/liquid front moves
k 8T S - Tj kAT MBv„ = — r 5 — ~- (3.22)
The main resistance to the heat transfer from the die to the mold (cooling liquid) is in the
die mold. Hence, the characteristic heat transfer from the mold is proportional to ATmb/L 15 .The characteristic temperature difference is between the melting temperature and the boiling
temperature. The time scale for the front can be estimated by
Psh al £ 2 (f )*• = - = I AT ( 3 - 23 )
Note that the solidification time isn't a linear function of the die thickness, £, but a function
of ~ (£ 2 ) 16 .
14 Anyone have any explanation? This coefficient is commonly used either between solid and liquid, orto represent the resistance between two solids. I do not think, and hope, that they refer that this coefficient
represents the resistance between the two solids since it is a minor factor and does not determine the characteristictime.
15 The estimate can be improved by converting the resistances of the die to represented die length and thesame for the other resistance into the cooling liquid i.e. El//t + L/k + ¦ ¦ ¦ + 1/hi .
16 L can be represented by t for example see the more simplified assumption leads to pure = I 2 .
copyright ©, 2000, by Dr. Bar-MeirWhat have your membership dues
done for you today? plagiarism?

Section 3.4. Estimates of the time scales in die casting
Dissipation time
Examples how dissipation is governing the flow can be found abundantly in nature. Since the
dissipation characteristic time isn't commonly studied in a "regular" fluid mechanics we first
introduce two classical examples of dissipation problems. One problem is dealing with the
oscillating manometer and two, "rigid body" brought to a rest in a thin cylinder.
Example 3.1
A liquid in manometer is disturbed from a rest by a distance of H. Assume that the flow
is laminar and neglected secondary flows. Describe H as function of time. Defined 3
cases: l)under damping, 2) critical damping, and 3) over damping. Discuss the physical
significance of the critical damping. Compute the critical radius to create the critical
damping.
Solution
d 2 X (&n\dX 3g~W + {&)^t + 2L X - (324)
Similarity to spring with damping.
Example 3.2
A thin (t/D <C 1) cylinder full with liquid is rotating in a velocity, ui. The rigid body isbrought to a stop. Assuming no secondary flows (Bernard's cell, etc.), describe the flow
as a function of time. Utilize the ratio 1 3> t/D.
Solution
d 2 X
dt 2+
f H \ dX\P) ~dt
+ X = (3.25)
Discuss the case of rapid damping, and the case of the characteristic dampingperhaps the exampl
These examples illustrate that the characteristic time of dissipation can be assessed by ,mportant?
~ p,(du/d"y") 2 thus given by £ 2 /u. Note the analogy between t s and tdi 88 , for which I 2appears in both of them, the characteristic length, I, appears as the typical die thickness.
put Eckert's explanation
Meta
^+u^+v—+w—dt dx dy dz
= Oilo 2 e t 9% d 2 e t
dx 2 dy 2 dz 2
Where $ is the dissipation function is defined as
(3.26)
put more expanded explar
tion for this equation
$ = 2
dw
dx J
( dv
dv
it- + ^r-dy J \dz
+
dy
dw\
l~dy~)
9yJ
v
+du~
dx ) + \dy +2 f du dv dw\'
3 + dy~ + ~dz~) (3.27)
What have your membership dues
done for you today? plagiarise?copyright ©, 2000, by Dr. Bar-Meir

Chapter 3. Dimensional Analysis
is it important to discuss the
2/3?
End
3.4.2 The ratios of various time scales
Now we can look at several time ratios. The ratio of solidification time to filling time
tj_ ^ Lk d AT M B _ Ste ( pun \ ( _fcd_^ f Vt s ~ Up s h s i£L ~ Pr Re \ p a ) \ki„
where
Re Reynolds number
Ste Stefan number
(3.28)
Vlr KT MB
Here we augment the discussion on the importance of equation (3.28). The ratio is extremely
important since it actually define the required filling time.
At the moment, the "constant" , C, is unknown and its value has to come out from experiments.
Furthermore, the "constant" is not really a constant and is a very mild function of the geometry,
discuss the geometry shape Note that this equation also different from all the previously proposed filling time equations,
since it take into account solidification and filling process into account 17 .The ratio of liquid metal conduction characteristic time to characteristic filling time is given
by
t CH UL 2 U£ v L 2 „ „ L 2— ~ ^— = = Re Pr— (3.30tf La v a LI LI v '
The solidification characteristic time to conduction characteristic time is given by
t s p g hsitLa d _ 1 i y s J | -p lm \ i <¦ \ (3 31)oto k d AT M BL 2 Ste \p d
The ratio of the filling time and atomization is
ta vi3co3ity vlU =Ca f*\„ 6x 1Q -8 (3.32)tf uL \L
Note that t, in this case, is the thickness of the gate and not of the die cavity.
f °— « = We ( ~ 0.184 (3.33)t f aL \LJ v '
which means that if atomization occurs, it will be very fast compared to the filling process.
17 l have take the liberty to call this equation Eckert-BarMeir's equation. I would like to have a goodexperimental work so we can add your name to this equation.
¦ u* r\ onnn u d iv/i ¦ What have your membership dues _,copyright ©, 2000, by Dr. Bar-Meir , , 36
done for you today? plagiarism?

Section 3.5. Similarity applied to Die cavity
The ratio of the dissipation time to solidification time is given by
tdiss t 2 k d AT M B ( Ste\ ( k d \ f pirn\ ft
PPr kl n10° (3.34)
this equation yields typical values for many situations in the range of 10° indicating that thesolidification process is as fast as the dissipation. It has to be noted that when the solidification
progress, the die thickness decreases. The ratio, l/L, reduced as well. As results the last stageof the solidification can be considered as a pure conduction problem as was done by the "english"
group.
3.5 Similarity applied to Die cavity
3.5.1 Governing equations
The filling of the mold cavity can be divided into two periods. In the first period (only fluid
mechanics; minimum heat transfer/solidification) and the second period in which the solidifi-cation and dissipation occur. We discuses how to conduct experiments in die casting 18 . It hasto stress that the conditions down-stream have to be understood prior to experiment with the
die filling. The liquid metal velocity profile and flow pattern are still poorly understood at this
stage. However, in this discussion we will assume that they are known or understood to same
degree 19 .The governing equations are given in the preceding sections and now we discuses the bound-
ary conditions. The boundary condition at the solid interface for the gas/air and for the liquidmetal are assumed to be "no-slip" condition which reads
U„ =V„ =W„ = Ul m = Vl m = Wl m = (3.35)
n +r 2Ap (3.36)
18 ln this addition I had only time to discuss how to conduct experiments about the filling of the die. In thefuture, other zones and different processes will be discussed.
19 Again the die casting process is a parabolic process.
20 Note the liquid surface cannot be straight, for unsteady state, because it results in no pressure gradient andtherefore no movement.
put the nu
equations
ibers of governing
is it true for lai
discussion
where we use the subscript g indicates the gas phase. It noteworthy to mention that this also
applied to the case where liquid metal is mixed with air/gas and both are touching the surface.At the interface between the liquid metal and gas/air pressure jump is expressed as
where r\ and r 2 are the principal radii of the free surface curvature, and, a, is the surface
tension between the gas and the liquid metal. The surface geometry is determined by several
factors which include the liquid movement 20 instabilities etc.
Now to the difficult parts, the velocity at gate has to be determined from the pQ 2 diagram
or previous studies on the runner and shot sleeve. The difficulties arise due to fact that we
cannot assign a specific constant velocity and assume only liquid flow out. It has to be realized
that due to the mixing processes in the shot sleeve and the runner (especially in a poor design
37What have your membership dues
done for you today? plagiarise?copyright ©, 2000, by Dr. Bar-Meir

Chapter 3. Dimensional Analysis
process and runner system, now commonly used in the industry) some portion at the beginning
has a significant part which contains air/gas. There are several possibilities that the conditionscan be prescribed. The first possibility is to describe the pressure variation at the entrance.
The second possibility is to describe the velocity variation (as a function of time). The velocity
here is the parabolic process IS reduced during the filling of the cavity and is a function of the cavity geometry. The change
in the velocity is a sharp in the initial part of the filling due to the change from a free jet to an
immersed jet. The pressure varies also at the entrance, however, the variations are more mild.
Thus, it is better possibility 21 to consider the pressure prescription. The simplest assumptionjust to get the average value is COnStant prCSSUTCand to explain how to get thefunction later
p = P = ^pU 2 (3.37)
We also assume that the air/gas obeys the ideal gas model.
P 9 = ^f (3-38)where R is the air/gas constant and T is gas/air temperature. Here we must insert the previousassumption of negligible heat transfer and further assume that the process is polytropic 22 . Wedefine the dimensionless gas density as
P _ f Po
atic
l = JL= ,tl\ ( 3.3 9)Po \P J
:heck the subscript is system- The subscript denotes the atmospheric condition.
The air/gas flow rate out the cavity is assumed to behave according to the model in Chapter9. Thus, the knowledge of the vent relative area and are important parameters. For cases
where the vent is well design (vent area is near the critical area or above the density, p g canbe determine as was done by (Bar-Meirl995b)).
To study the controlling parameters the equations are dimensionlessed. The mass conser-
vation for the liquid metal becomes
dPi™ Opi m U' lm Opirn V'lm dfHrn w' lm . -
df + dx> + dy> + dz< ~ U ( * UJ
where x' = |, y' = yjl , z' = zjl , u' = u/Uo, v' = v/Uq, w' = w/Uq and the dimensionlesstime is defined as t' = where U = y/2P /p.
Equation (3.40) can be the same simplified under the assumption of constant density toread
du'l m dv'l m dw'lm
^ + ^ + ^ =0 (3 - 41)
21 At this stage, we must reserved ourself to an intelligent guessing.
22 There are several possibilities, I have chose this one only to obtain the main controlling parameters.
¦ ¦ . , — . i r>> r> n * ¦ What have your membership duescopyright ©, 2000, by Dr. Bar-Meir , ,
done for you today? plagiarism?38

Section 3.5. Similarity applied to Die cavity
Please note that we cannot use this simplification for the gas phase. The momentum equation
for the liquid metal in the x-coordinate assuming constant density and no body forces reads
dpi m u' lm ,dp lm u' lm ,dpi m u' lm ,dp lm u' lm
dp'i m 1 ( 9 2 u' d 2 v' d 2 w' \+ irA + 7T~, 2 + ~7T~, 2 (3-42)
dx' Re \ dx' 2 dy'J dz[.Im Im J
where Re = Uoi/vi m and p' = p/Po-
The gas phase continuity equation reads
The gas/air momentum equation 23 is transformed into
dp'u' dp'u' dp'u' dp'u'9 q i '9 g i '9 g i ' 9 q
+ U — „ , + V — - , + W -dt' dx 1 dy 1 dz'
^ + !^MlB + ^ + ^ f344l' dx' + v 9 p lm Re \ dx' 2 dy' 2 dz' 2 j ( '
Note that in this equation additional terms were added, (yi m / 'v g )(p g0 / Plm) ¦The "no-slip" conditions are converted to:
u ' g = v ' g=w ' g = u ' lm = v' lm = w' lm = (3.45)
The surface between the liquid metal and the air satisfy
p'{r' 1 +r' 2 ) = ±- e (3.46)where the p' , r[, and r' 2 are defined as r[ = r\fl r' 2 = r 2 /£
The solution to equations has the from of
Ac U Plm Vru' = f u ^x',y',z',Re,We,—,^,n
v> = f v (x',y',z',Re,We,^-,^,n,-^,^Ac Plm Vg
P =
= f w ( x ',y', z ',Re,We,^,M±,n,^,^-)\ A C Plm V g J
f p fx', y', z', Re, We,^-,^,n,-^-,^) (3.47)V A C U Plm V g J
s ln writing this equation it is assumed that viscosity of the air independent of pressure and temperature.
~ n What have your membership dues . ,. ^ , .-. D ...39 , , copyright ©, 2000, by Dr. Bar-Meir
done for you today? plagiarise?

Chapter 3. Dimensional Analysis
v'
w'
p'
If it will be found that equation (3.44) can be approximated by
du' Q ,du' Q ,du' Q ,du' Q dp'
i>i +u id +v w +w id*-7d (3 - 48)then the solution is reduced to
u' = f u (x',y',z',Re,We,-^,^,n^f v (^x',y',z',Re,We, ^-,njf w (^',y', z ',Re,We,^-,^,r^f p ^ x ',y', z ',Re,We,^-,^,r?j (3.49)
At this stage we do not know if it the case and it has to come-out from the experiments. The
density ratio can play a role because two phase flow characteristic in major part of the filling
process.
3.5.2 Design of Experiments
Under Construction 25
3.6 Summary of dimensionless numbers
In this section we summarize all the major dimensionless parameters what effect the die casting
process.
Reynolds number
pU 2 /£ inertail ForcesRe =
uU/£ 2 viscouse forces
Reynolds number represent the ratio of the momentum forces to the viscous forces. In die
casting Reynolds number play a significant role which determine the flow pattern in the runner
and the vent system. The discharge coefficient, C D , is used in the pQ 2 diagram is determinedlargely by the Re number through the value of friction coefficient, f, in side the runner.
Eckert number
l/2pU 2 _ inertial energyEc =
l/2pc p AT termal energy
Eckert number determines if the role of the momentum energy transfered to thermal energy is
significant.
24 This topic is controversial in the area of two phase flow.
25 see for time being Eckert's paper
¦ L^. /~\ innn i. r\ d n /i ¦ What have your membership dues „_copyright ©, 2000, by Dr. Bar-Meir , , 40
done for you today? plagiarism?

Section 3.6. Summary of dimensionless numbers
Brinkman number
_ pU 2 ft 2 _ heat production by viscouse dissapetionkAT/t 2 heat transer transport by conduction
Brinkman number is a measure of the importance of the viscous heating relative the conductive
heat transfer. This number is important in cases where large velocity changes occurs over short
distances such as lubricant flow (perhaps, flow in the gate). In die casting this number has
small values indicating that practically the viscous heating is not important.
Mach number
Ma =
mFor ideal gas (good assumption for the mixture of the gas leaving the cavity). It becomes
U charecteristic velocityMa E* ; = —
V7i?T gas sound velocity
Mach number determine the characteristic of flow in the vent system where the air/gas velocityis reaching to the speed of sound. The air is chocked at the vent exit and in some cases other
locations as well for vacuum venting. In atmospheric venting the flow is not chocked for large
portion of the process. Moreover, the flow, in well design vent system, is not chocked. Yet
the air velocity is large enough so that the Mach number has to be taken into account for
reasonable calculation of the C n .
Ozer number
_mo» f A 3 \ iPmax effective static pressure enegeryOz = 7t = — Cd = ; : :
f Qrna^y \Q max J P a va rge ke n i ma t ic en ergyI A * )
One of the must import number in the pQ 2 diagram calculation is Ozer number. This number
represent the how good the runner is designed.
Froude number
„ pU 2 It inertial forcesFr = — =
pg gravity forces
Fr number represent the ratio of the gravity forces to the momentum forces. It is very important
in determining the critical slow plunger velocity. This number is determine by the hight of the
liquid metal in the shot sleeve. The Froude number does not play a significant role in the filling
of the cavity.
What have your membership dues
done for you today? plagiarise?copyright ©, 2000, by Dr. Bar-Meir
Chapter 3. Dimensional Analysis
Capillary number
pU 2 /£ inertial forcesCo =
pg gravity forces
capillary number (Ca) determine when the flow during the filling the cavity is atomized or
is continuous flow (for relatively low Re number).
Weber number
l/2pU 2 inertial forcesWe =
l/2a/£ surface forces
We number is the other parameter that govern the flow pattern in the die. The flow in die
casting is atomized and, therefore, We with combinations of the gate design also determining
the drops sizes and distribution.
Critical vent area
V(0)A c =
vmax ±VJ -max
The critical area is the area for which the air/gas is well vented.
3.7 Summary
The dimensional analysis demonstrates that the fluid mechanics process, such as filling of the
cavity with liquid metal and evacuation /extraction of the air from the mold, can be dealt whenthe heat transfer is negligible. This proved an excellent opportunity for simple models to predict
many parameters in the die casting process which are discussed in this book. It is recommended
for interested readers to read Eckert's book "Analysis of Heat and Mass transfer" to have better
put ,=f to th« iate,t Eckert. and more general understanding of this topic.book.
3.8 Questions
3.3.1 Calculate the liquid metal velocity in transition for typical shot sleeve, runner.
3.3.1 What is the critical velocity for pipe with diameter of 0.1 [m] when critical Re numberis 2300?
Under construction
copyright ©, 2000, by Dr. Bar-MeirWhat have your membership dues
done for you today? plagiarism?
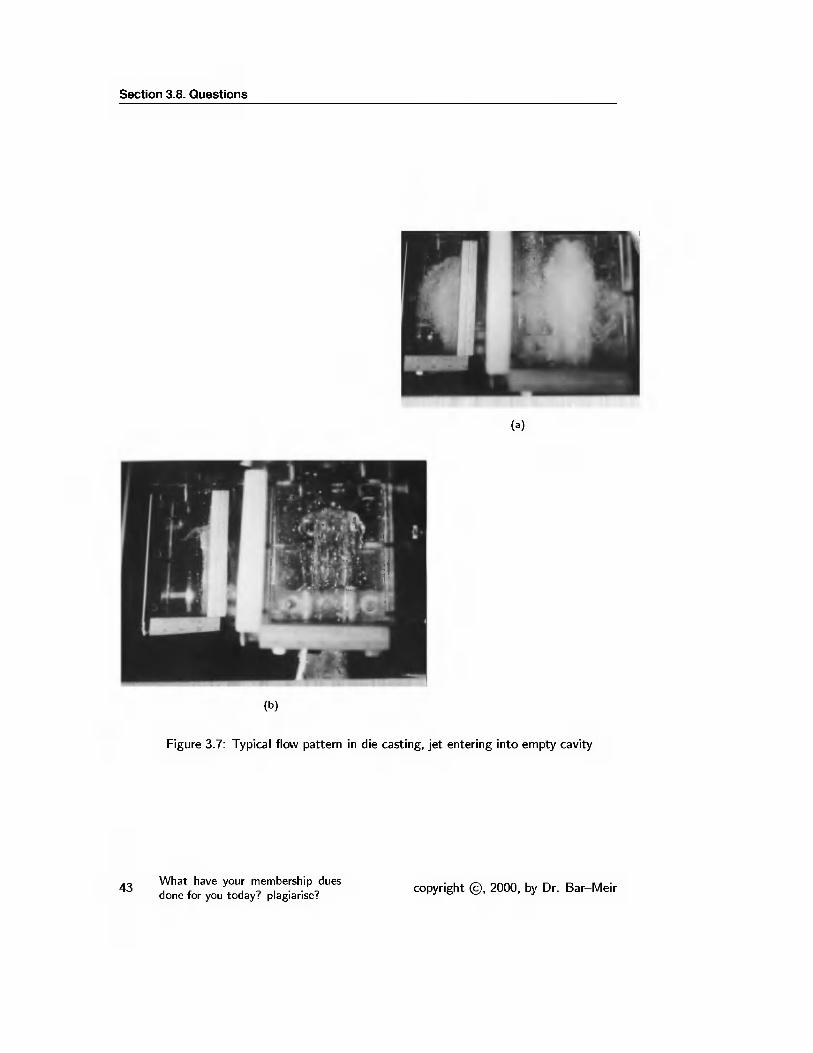
Section 3.8. Questions
F(b)
Figure 3.7: Typical flow pattern in die casting, jet entering into empty cavity
What have your membership dues
done for you today? plagiarise?copyright ©, 2000, by Dr. Bar-Meir

Chapter 3. Dimensional Analysis
12.00-
11.00-
10.00-
9.00-
m 8.00-
o
"J ™»-a.
6.00 -
5.00-
4.00-
3.00-
2.00-
0.00 1.00 2.00 3.00 4.00 5.00 6.00 7.00 8.00 9.00 10.00
Time [sec]
Figure 3.8: Transition to turbulent flow in circular pipe for instantaneous flow after Wygnanski
and others by interpolation
eni^^^^^ f low
oOFgboundary
Figure 3.9: Flow pattern in the shot sleeve
o O
Figure 3.10: Two streams of fluids into a medium
copyright ©, 2000, by Dr. Bar-MeirWhat have your membership dues
done for you today? plagiarism?44

Section 3.8. Questions
rFigure 3.11: Schematic of heat transfer processes in the die
e(b)
Figure 3.12: The oscillating manometer for the example 3.4.1
What have your membership dues
done for you today? plagiarise?copyright ©, 2000, by Dr. Bar-Meir
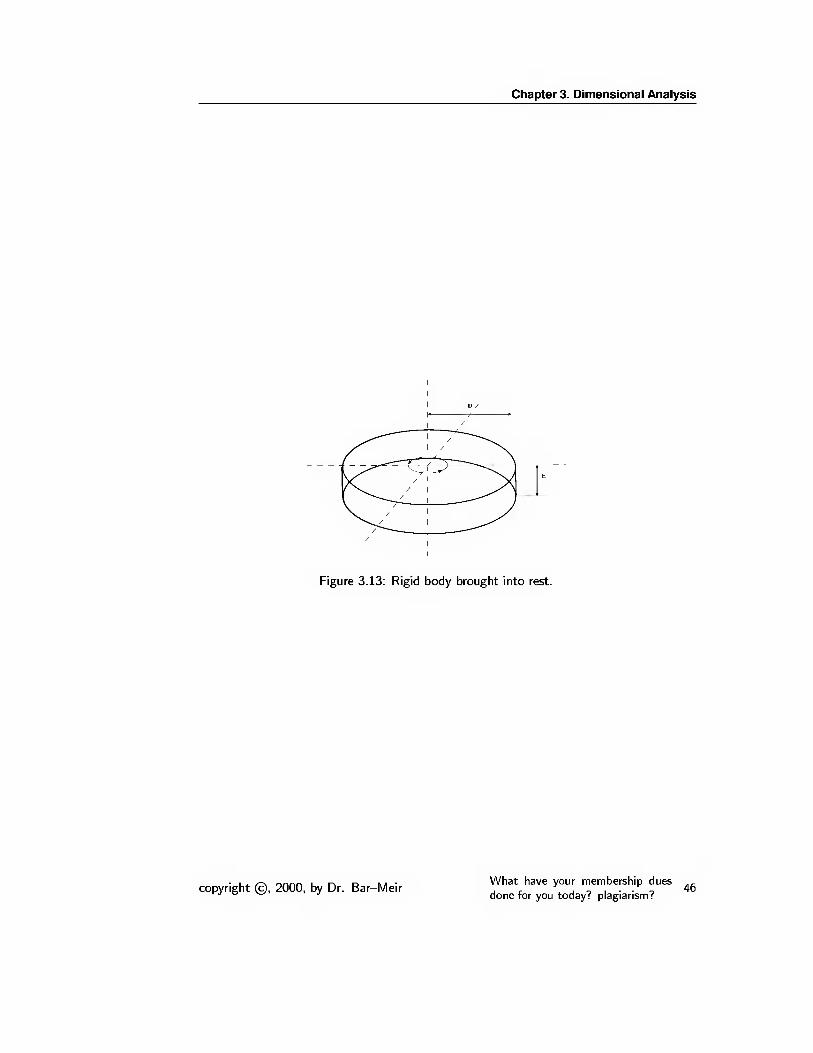
Chapter 3. Dimensional Analysis
rFigure 3.13: Rigid body brought into rest.
copyright ©, 2000, by Dr. Bar-MeirWhat have your membership dues
done for you today? plagiarism?

CHAPTER 4
Fundamentals of Pipe Flow
Chapter Under construction
4.1 Introduction
The die casting engineer encounters many aspects of network flow. For example, the liquid
metal flows in the runner is a network flow. The flow of the air and other gases out of the mold
through the vent system is also another example network flow. The pQ 2 diagram also requires
intimate knowledge of the network flow. However, most die casting engineers/researchers areunfamiliar with fluid mechanics and furthermore have a limited knowledge and understanding
of the network flow. Therefore, this chapter is dedicated to describe a brief introduction to a
flow in a network. It is assumed that the reader does not have extensive background in fluid
mechanics. However, it is assumed that the reader is familiar with the basic concepts such as
pressure and force, work, power. More comprehensive coverage can be found in books dedicated
to fluid mechanics and pipe flow (network for pipe). First a discussion on the relevancy of the
data found for other liquids to the die casting process is presented. Later a simple flow in
a straight pipe/conduit is analyzed. Different components which can appear in network arediscussed. Lastly, connection of the components in series and parallel are presented.
Figure 4.1: Flow in a pipe with an orifice for different liquids
4.2 Universality of the loss coefficients
Die casting engineers who are not familiar with fluid mechanics ask whether the loss coefficients
obtained for other liquids should/could be used for the liquid metal. To answer this question,
47

Chapter 4. Fundamentals of Pipe Flow
1 1 1 1 1 1 1 1
<„ 0-1<5
A3 o.oiE
tr o.ooi(A
°0.0001~o
S le-05X
le-06
le-07
n/ y
J*j«*f*
o Air
? Crude Oil
- Hydrogen
Mercury
Water
"
rO § O o 3 O —
o o o o o
Velocity[m/sec]
Figure 4.2: The results for the flow in a pipe with orifice
many experiments have been carried out for different liquids flowing in different components in
the last 300 years. An example of such experiments is a flow of different liquids in a pipe with
an orifice (see Figure 4.1). Different liquids create significant head loss for the same velocity.Moreover, the differences for the different liquids are so significant that the similarity is unclear
as shown in Figure 4.2. As the results of the past geniuses work, it can be shown that when
results are normalized by Reynolds number (Re) instated of the velocity and when the head loss
is replaced by the loss coefficient, j^jTg one obtains that all the lines are collapsed on to a singlesimplified »e,sion of the di- line as shown in Figure 4.3. This result indicates that the experimental results obtained formensional analysis. Perhaps
to refer to the dim chapter
1.2 i 1
u
o.o 1 — i — i i i i 1 1 1 1 — i — i i i i 1 1100 1000 10000
Reynolds Number
Figure 4.3: The results for the flow in a pipe with orifice
one liquid can be used for another liquid metal provided the other liquid is a Newtonian liquid 1 .Researchers shown that the liquid metal behaves as Newtonian liquid if the temperature is
above the mushy zone temperature. This example is not correct only for this spesific geometry
but is correct for all the cases where the results are collapsed into a single line. The parameters
which control the problem are found when the results are "collapsed" into a single line. It was
found that the resistance to the flow for many components can be calculated (or extracted
from experimental data) by knowing the Re number and the geometry of the component. In
a way you can think about it as a prof of the dimensional analysis (presented in Chapter ??).
1 Newtonian liquid obeys the following stress law t = n^LLbcopyright ©, 2000, by Dr. Bar-MeirWhat have your membership dues
done for you today? plagiarism?

Section 4.3. A simple flow in a straight conduit
4.3 A simple flow in a straight conduit
.Figure 4.4: General simple conduit description
A simple and most common component is a straight conduit as shown in Figure 4.4. The
simplest conduit is a circular pipe which would be studied here first. The entrance problem
and the unsteady aspects will be discussed later. The parameters that the die casting engineers
interested are the liquid metal velocity, the power to drive this velocity, and the pressure
difference occur for the required /desired velocity. What determine these parameters? Thevelocity is determined by the pressure difference applied on the pipe and the resistance to the
flow. The relationship between the pressure difference, the flow rate and the resistance to the
flow is given by the experimental equation (4.1). This equation is used because it works 2 . Thepressure difference determined by the geometrical parameters and the experimental data which
expressed by / 3 which can be obtained from Moody's diagram.
Moody Diagram (Plot of Cole I) rook's Correlation)
D1.E-HD3 1.E+04 1.E-HD5 1.E-HD6 1.E+07 1.E-HD8
Reynolds Number
Figure 4.5: Moody's diagram
AP = fp ^El. AH = f ^El (4.1)D 2 D 2g v '
Note, head is energy per unit weight of fluid (i.e. Force x Length/Weight = Length) and it
2 Actually there are more reasons but they are out of the scope of this book
3 At this stage, we use different definition than one used in Chapter D. The difference is by a factor of 4.Eventially we will adapt one system for the book.
What have your membership dues
done for you today? plagiarise?copyright ©, 2000, by Dr. Bar-Meir
Chapter 4. Fundamentals of Pipe Flow
has units of length. Thus, the relationship between the Head (loss) and the pressure (loss) is
AP=^ (4.2)pg
The resistance coefficient for circular conduit can be defined as
Kf = /§ (4.3)This equation is written for a constant density flow and a constant cross section. The flow
rate is expressed as
Q = UA (4.4)
The cross sectional area of circular is A = nr 2 = nD 2 /4, using equation (4.4) and substitutingit into equation (4.1) yields
The equation (4.5) shows that the required pressure difference, AP, is a function of 1/D 3which demonstrates the tremendous effect the diameter has on the flow rate. The length, on
the other hand, has mush less significant effect on the flow rate.
The power which requires to drive this flow is give by
V = Q-V (4.6)
These equations are very important in the understanding the economy of runner design,
and will be studied in Chapter ?? in more details.
The power in terms of the geometrical parameters and the flow rate is given
4.3.1 Examples of the calculations
Example 4.1
calculate the pressure loss (difference) for a circular cross section pipe for driving alu-
minum liquid metal at velocity of 10[m/sec] for a pipe length of 0.5 [m] (like a medium
quality runner) with diameter of 5[mm] 10[mm] and 15[mm]
Solution
This is example 4.3.1
Example 4.2
calculate the power required for the above example
Solution
copyright ©, 2000, by Dr. Bar-MeirWhat have your membership dues
done for you today? plagiarism?

Section 4.4. Typical Components in the Runner andVent Systems
4.4 Typical Components in the Runner andVent Systems
In the calculations of the runner the die casting engineer encounter beside the straight pipe
which was dealt in the previous section but other kind of components. These components
include the bend, Y-connection and tangential gate, "regular gate" , the extended Y connection
and expansion /contraction (including the abrupt expansion/contraction). In this section ageneral discussion on the good design practice for the different component is presented. A
separate chapter is dedicated to the tangential runner due to its complication.
The resistance in the bend is created because a change in the momentum and the flow pattern.
Engineers normally convert the bend to equivalent conduit length. This conversion produces
adequate results in same cases while in other it might introduce larger error. The knowledge
of this accuracy of this conversion is very limited because limited study have been carry out
for the characteristic of flows in die casting. From the limited information the author of this
book gadered it seem that it is reasonable to carry this conversion for the calculations of liquid
metal flow resistance while in the air/liquid metal mixture it far from adequate. Moreover,"hole" of our knowledge of the gas flow in vent system are far more large. Nevertheless, for bad english, change it pl<
the engineering purpose at this stage it seem that some of the errors will cancel each other andthe end result will be much better.
The schematic of a bend commonly used in die casting is shown in Figure 4.6. The resistance
of the bend is a function of several parameters: angle, 6, radius, R and the geometry before
and after the bend. Commonly, the runner is made with the same geometry before and after
the bend. Moreover, we will assume in this discussion that downstream and upstream do not
influence that flow in the flow. This assumption is valid when there is no other bend or other
change in the flow nearby. In cases that such a change(s) exists more complicated analysis isrequired.
In the light of the for going discussion, we left with two parameters that control the re-
sistance, the angle, 6, and the radius, R As larger the angle is larger the resistance will be.
In the practice today, probably because the way the North American Die Casting Association
teaching, excessive angle can be found through the industry. It is recommended never to exceed
the straight angle (90°). Figure 4.7 made from a data taken from several sources. From theFigure it is clear that optimum radius should be around 3 *> continue ,h,< the
4.4.1 bend
WFigure 4.6: A sketch of the bend in die casting
finished
51What have your membership dues
done for you today? plagiarise?copyright ©, 2000, by Dr. Bar-Meir

Chapter 4. Fundamentals of Pipe Flow
picture of Y connection
Figure 4.7: A geometrical description of the resistance in a bend
4.4.2 Y connection
The Y-connection reprsent a split in the runner system. The resistence
4.4.3 Expansion/Contraction
One of the undisirable element is the runner system is sudden change in the conduict area. In
some instance they are inevodeble. We will disscuss how to design and what are the better
design options which availble for the engineer.
4.5 Putting it all to Together
There are two main kinds of connections; series and parallel. The resistance in the series
connection has to be added in a fashion similar to electrical resistance i.e. every resistance
has to be added plainly to the total resistance. There are many things that contribute to
the resistance besides the regular length, i.e. bends, expansions, contractions etc. All these
connections are of series type.
4.5.1 Series Connection
The flow rate in different locations is a function of the temperature. Eckert (Eckertl989)demonstrated that the heat transfer is insignificant in the duration of the filling of the cavity,
and therefore the temperature of the liquid metal can be assumed almost constant during the
filling period (which in most cases is much less 100 milliseconds). As such, the solidification
is insignificant (the liquid metal density changes less than 0.1% in the runner); therefore, thevolumetric flow rate can be assumed constant:
Qi = Qi = Qs = Qi (4.8)
Clearly, the pressure in the points is different and
Pi ± Pi ± Ps ± n (4.9)
However the total pressure loss is composed of from all the small pressure loss
Pi ~ Pend = (Pi - Pi) + (P 2 - P 3 ) + ¦ ¦ ¦ (4.10)
Every single pressure loss can be written as
p i _ 1 -n = K~ (4.11)
There is also resistance due to parallel connection i.e. y connections, y splits and manifolds
etc. First, lets look at the series connection (see Figure 4.8). where:
¦ u* r\ innn u n d m ¦ What have your membership dues ,__copyright ©, 2000, by Dr. Bar-Meir , , 52
done tor you today r plagiarism r

Section 4.5. Putting it all to Together
to add a figure and change it
Figure 4.8: A connection in series
Kbend the resistance in the bend
L length of the duct (vent),
/ friction factor, and
4.5.2 Parallel Connection
An example of the resistance of parallel connection (see Figure ??).
The pressure at point 1 is the same for two branches however the total flow rate iscombination
Qtotal = Qi + Qj (4-
between two branches and the loss in the junction is calculated as
To add a figure and check if the old one is good
Figure 4.9: A parallel connection
What have your membership dues
done for you today? plagiarise?copyright ©, 2000, by Dr. Bar-Meir

Chapter 4. Fundamentals of Pipe Flow
¦ u» innn u n d m ¦ What have your membership dues rAcopyright ©, 2000, by Dr. Bar-Meir , , 54
done for you today? plagiarism?

CHAPTER 5
Flow in Open Channels
5.1 Introduction
One of the branches of the fluid mechanics discussed in Chapter 2. Here we expand this
issue further because it is give the basic understanding to the "wave" phenomenon. There are
numerous books that dealing with open channel flow and the interested reader can broader
his/her knowledge by reading book such as Open-Channel Hydraulics by Ven Te Chow (NewYork: McGraw-Hill Book Company, Inc. 1959). Here a basic concepts for the non-Fluid
Mechanics Engineers are given.
:w
The flow in open channel flow in steady state is balanced by between the gravity forces and
mostly by the friction at the channel bed. As one might expect, the friction factor for open
channel flow has similar behaver to to one of the pipe flow with transition from laminar flow
to the turbulent at about Re ~ 10 3 . Nevertheless, the open channel flow has several respects
the cross section are variable, the surface is at almost constant pressure and the gravity force
are important.
The flow of a liquid in a channel can be characterized by the specific energy that is associated
with it. This specific energy is comprised of two components: the hydrostatic pressure and the
liquid velocity 1 .
The energy at any point of height in a rectangular channel is
u 2 P , c . >e=- + 7+ , (5.1)
why? explain
1 The velocity is an average velocity
55

Chapter 5. Flow in Open Channels
rFigure 5.1: Equilibrium of Forces in an open channel
and, since ^ + z = y for any point in the cross section (free surface),
T 2
i/here:
e specific energy per unit
y height of the liquid in the channel
g acceleration of gravity
U average velocity of the liquid
If the velocity of the liquid is increased, the height, y, has to change to keep the same flow
rate Q = qb = byU. For a specific flow rate and cross section, there are many combinations
of velocity and height. Plotting these points on a diagram, with the y-coordinate as the height
and the x-coordinate as the specific energy, e, creates a parabola on a graph. This line is known
as the "specific energy curve". Several conclusions can be drawn from Figure 5.2. First, there
is a minimum energy at a specific height known as the "critical height". Second, the energy
increases with a decrease in the height when the liquid height is below the critical height. In
this case, the main contribution to the energy is due to the increase in the velocity. This flow
is known as the "supercritical flow". Third, when the height is above the critical height, the
energy increases again. This flow is known as the "subcritical flow", and the energy increase
is due to the hydrostatic pressure component.
The minimum point of energy curve happens to be at
U = Jgy~c (5.3)
copyright ©, 2000, by Dr. Bar-MeirWhat have your membership dues
done for you today? plagiarism?

Section 5.1. Introduction
ewhere the critical height is defined byu(5.4)
Thrust is defined as
v 2 U 2
z y
The minimum thrust also happens to be at the same point U = y/gy. Therefore, one candefine the dimensionless number as:
Fr = ^ (5.6)U
Dividing the velocity by y/gy provides one with the ability to check if the flow is above orbelow critical velocity. This quantity is very important, and its significance can be studied from
many books on fluid mechanics. The gravity effects are "measured" by the Froude number
which is defined by equation (5.6).
What have your membership dues
done for you today? plagiarise?copyright ©, 2000, by Dr. Bar-Meir

Chapter 5. Flow in Open Channels
5.2 Typical diagrams
5.3 Hydraulic Jump
The flow can change only from a supercritical flow to a subcritical flow, in which the height
increases and the velocity decreases. There is no possibility for the flow to go in the reverse
direction because of the Second Law of Thermodynamics (the explanation of which is out of the
scope of this discussion). If there is no energy loss, the flow moves from point 1 to point 2 in
Figure 5.2. In actuality, energy loss occurs in any situation, but sometimes it can be neglected
in the calculations. In cases where the flow changes rapidly (such as with the hydraulic jump),
the energy loss must be taken into account. In these cases, the flow moves from point 1 to
point 3 and has energy loss {El)- In many cases the change in the thrust is negligible, such as
the case of the hydraulic jump, and the flow moves from point 1 to point 3 as shown in Figure5.2.
In 1981, Garber "found" the hydraulic jump in the shot sleeve which he called a "wave".
Garber built a model to describe this wave, utilizing mass conservation and Bernoulli's equation
(energy conservation). This model gives a set of equations relating plunger velocity and wave
velocity to other geometrical properties of the shot sleeve. Over 150 years earlier, Belanger
(Belangerl828) demonstrated that the energy is dissipated, and that energy conservation mod-els cannot be used to solve hydraulic jump. He demonstrated that the dissipation increases
with the increase of the liquid velocity before the jump. This conclusion is true for any kind of
geometry.
A literature review demonstrates that the hydraulic jump in a circular cross-section (like
in a shot sleeve) appears in other cases, for example a flow in a storm sewer systems. An
analytical solution that describes the solution is Bar-Meir's formula and is shown in Figure 8.4.
The energy loss concept manifests itself in several designs, such as in the energy-dissipating
devices, in which hydraulic jumps are introduced in order to dissipate energy. The energy-
dissipating devices are so common that numerous research works have been performed on
them in the last 200 hundreds years. An excellent report by the U.S. Bureau of Reclamation
(Branchl958) shows the percentage of energy loss. However, Garber, and later other researchers
from Ohio State University (Brevick, Armentrout and Chul994), failed to know/understand/usethis information.
copyright ©, 2000, by Dr. Bar-MeirWhat have your membership dues
done for you today? plagiarism?

Part II
DIE CASTING DESIGN
59


CHAPTER 6
Runner Design
Under construction please ignore the rest of the chapter.
6.1 Introduction
In this chapter the desisgn and the different relationship between runner secments are studied
herein. The first step in runner design is to diveded the mold into several logical sections.
The volume of every section has to be calculated. Then the design has to ensure that the
gate velocity and the filling time of every section to be as recommend by experimental results.
At this stage there is no known relaible theory/model known to the author to predits thesevalues. The values are based havily on semi-rilaible experiments. The Backword Design is
discuused. The reader with knolege in electrical enginnering (electrical circtes) will notice in
some similarities. However, hydralulic circuts are more complex. Part of the expressions are
simplified to have analytical expressions. Yet, in actuality all the terms should be taken intoconsiderations and commercial software such DiePerfect ™ should be used.
6.1.1 Backward Design
Suppose that we have n sections with n gates. We know that volume to be delivered at gate i
and is denoted by Vj. The gate velocity has to be in a known range. The filling time has to be
in a known function and we recomend to use Eckert/Bar-Meir's formula. For this discussion itis assumed that the filling has to be in known range and the flow rate can be calculated by
Thus, gate area for the section
(6.1)
(6.2)
61

Chapter 6. Runner Design
To vent in the picture. To put Armed with this knowledge, one can start design the runner system.ref to the picture
:Figure 6.1: A geometry of runner connection
6.1.2 Connecting runner seqments
Design of connected runner secments have insure that the flow rate at each secment has to
be designed one. In Figure 6.1a branches / and j are connected to branch k at point K. The
pressure drop (difference) on branches / and j has to be the same since the pressure in the moldcavity is the same for both secments. The sum of the flow rates for both branch has to be
equal to flow rate in branch k
Qk = Qi + Qj ==>¦ Qj = Q K - Qi (6.3)
The flow rate in every branch is related to the pressure difference by
AP
Qi = -5- (6.4)
Where the subscrit / in this case also means any branch e.g. /, j and so on. For example, one
can write for branch j
AP
Qj = -5- (6.5)
Utilizing the mass conservation for point K in which Q K = Q% + Qj and the fact that thepressure difference, AP, is the same thus we can write
Qk = ^ + ^ = AP ^i_ (6 . 6)Ri Rj Ri + Rj
where we can define equalent resistance by
R = (6-7)JXi + Itj
¦ u*. r\ innn u n d ¦ What have your membership duescopyright ©, 2000, by Dr. Bar-Meir , , 62
done for you today? plagiarism?

Section 6.1. Introduction
Lets further manipolte the equations to get some more important relationships. Using equation
(??) and equation (??)
APi = APj => = QjRj (6.8)
The flow rate in a branch j can be related to flow rate in branch /'and corresponding resistances
Ri
Rj
Using equation (??) and equation (??) one can obtain
Qi Rj
Q k ~ Rj + Ri
Solving for the resistance ratio since the flow rate is known
Ri Qi
Rj Qk1
(6.9)
(6.10)
(6.11)
6.1.3 Resistance
What does the resistance include? How to achieve resistance ratio in the previous equation
(??) will be discussed herein further. The total resistence reads
yFigure 6.2: y connection
R — Rii ~\~ R$ ~\~ Rgeometery ~t~ ^contraction ~t~ Rki ~t~ Rexit (6.12)
The contraction resistence, R CO ntraction< is tne due the contraction of the gate. The exit
resistence, R ex u, is due to resitence of the liquid metal in mold cavity. Or in other words, the
exit resistence is due the lost of energy of emersed jet. The angle resistence, Rg is due to the
change of direction. The R^i is the resistence due to flow in the branch k on branch i. The
geometry resistence R ge0 metery is due to who rounded the connection.
AP
P H D 2(6.13)
63What have your membership dues
done for you today? plagiarise?copyright ©, 2000, by Dr. Bar-Meir

Chapter 6. Runner Design
since Ui = ^
^ = /AM. ( 6.i4)
^ = ( C )/Af ,e. 15)Lets assume further that Li = Lj, = known
fi = fj=f (6.16)
Comparison between scrap between (multi-lines) two lines to one line
first find the diameter equalent to two lines
(6.18)
= (C)f^ = (C)f± iQi +f )2 (6.19)
Q\ = ~H D \ (6.20)
subtitling in to
H^= tf{H D \+H D ) (6.21)
Now we know the relationship between the hydraulic radius. Let see what is the scrapdifference between them.
put drawing of the trapezoid
let scrap denoted by n
converting the equation
¦ u*. r\ innn u n d m ¦ What have your membership dues ,„copyright ©, 2000, by Dr. Bar-Meir , , 64
done for you today? plagiarism?

Section 6.1. Introduction
the ratio of the scrap is
Vi + Vj _ (Hdi + 2 + H D ?)Vk H D \
and now lets write Hr> k in term of the two other
(Hp'i + Hp])
(H D ? + H D f) I
(6.23)
(6.24)
,.- What have your membership dues . , . ^ u n d ka ¦65 . c copyright ©, 2000, by Dr. Bar-Meir

Chapter 6. Runner Design
¦ u» innn u n d mi ¦ What have your membership dues ,,copyright ©, 2000, by Dr. Bar-Meir , , 66
done for you today? plagiarism?

CHAPTER 7
PQ 2 Diagram Calculations
In conclusion, it's just a plain sloppy piece of work.
Referee II, see In the appendix A
Contents
7.1 Introduction 68
7.2 The "common" pQ 2 diagram 68
7.3 The validity of the "common" diagram 74
7.3.1 Is the "common" model valid? 74
7.3.2 Are the trends reasonable? 76
Plunger area/diameter variation 76
Gate area variation 77
Energy conservation (power supply machine characteristic) 77
Energy conservation (power supply) 77
Energy conservation (dissipation problem) 77
Mass conservation (strike) 78
Mass conservation (hydraulic pump): 78
7.3.3 Variations of the Gate area, A3 78
7.4 The reformed pQ 2 diagram 797.4.1 The reform model 79
7.4.2 Examining the solution 81
The gate area effects 81
Qmax effect 81
{Az/Ai) 2 effects 81K F effects 82
The combined effects 83
General conclusions from example 7.4.2 85
67

Chapter 7. pQ 2 Diagram Calculations
The die casting machine characteristic effects 86
Plunger area/diameter effects 89
Machine size effect 93
Precondition effect (wave formation) 94
7.4.3 Poor design effects 94
7.4.4 Transient effects 94
7.5 Design Process 94
7.6 The Intensification Consideration 95
7.7 Summary 96
7.8 Questions 96
7.1 Introduction
The pQ 2 diagram is the most common calculation, if any at all, are used by most die casting
engineers. The importance of this diagram can be demonstrated by the fact that tens of
millions of dollars have been invested by NADCA, NSF, and other major institutes here and
abroad in the pQ 2 diagram research. The pQ 2 diagram is one of the manifestations of supply
and demand theory which was developed by Alfred Marshall (1842-1924) in the turn of the
century. It was first introduced to the die casting industry in the late'70s (Davisl975). In thisdiagram, an engineer insures that die casting machine ability can fulfill the die mold design
requirements; the liquid metal is injected at the right velocity range and the filling time is small
enough to prevent premature freezing. One can, with the help of the pQ 2 diagram, and by
utilizing experimental values for desired filling time and gate velocities improve the quality of
the casting.
»h. P s put this section in In the die casting process (see Figure 7.1), a liquid metal is poured into the shot sleeve
where jt js p r0 p e || ed by the p | U nger through the runner and the gate into the mold. The gate
thickness is very narrow compared with the averaged mold thickness and the runner thickness
to insure that breakage point of the scrap occurs at that gate location. A solution of increasing
the discharge coefficient, C D , (larger conduits) results in a larger scrap. A careful design of therunner and the gate is required.
First, the "common" pQ 2 diagram 1 is introduced. The errors of this model are analyzed.Later, the reformed model is described. Effects of different variables is studied and questions
for students are given in the end of the chapter.
7.2 The "common" pQ 2 diagram
The injection phase is (normally) separated into three main stages which are: slow part, fast
part and the intensification (see Figure 7.2). In the slow part the plunger moves in the critical
velocity to prevent wave formation and therefore expels maximum air/gas before the liquidmetal enters the cavity. In the fast part the cavity supposed to be filled in such way to prevent
1 as this model is described in NADCA's books
copyright ©, 2000, by Dr. Bar-MeirWhat have your membership dues
done for you today? plagiarism?

Section 7.2. The "common" pQ 2 diagram
apremature freezing and to obtain the right filling pattern. The intensification part is to fill the
cavity with additional material to compensate for the shrinkage porosity during the solidification
process. The pQ 2 diagram deals with the second part of the filling phase.
In the pQ 2 diagram, the solution is determined by finding the intersecting point of the
runner/mold characteristic line with the pump (die casting machine) characteristic line. Theintersecting point sometime refereed to as the operational point. The machine characteristic
line is assumed to be understood to some degree and it requires finding experimentally two
coefficients. The runner/mold characteristic line requires knowledge on the efficiency/discharge
coefficient, C D , thus it is an essential parameter in the calculations. Until now, C D has beenevaluated either experimentally, to be assigned to specific runner, or by the liquid metal proper-
ties (Cr> oc p) (Cocksl986) which is de facto the method used today and refereed herein as the
"common" pQ 2 diagram 2 . Furthermore, C D is assumed constant regardless to any change inany of the machine/operation parameters during the calculation. The experimental approach isarduous and expensive, requiring the building of the actual mold for each attempt with average
cost of $5,000-$10,000 and is rarely used in the industry 3 . A short discussion about this issueis presented in the Appendix A comments to referee 2.
Herein the "common" model (constant C D ) is constructed. The assumptions made in theconstruction of the model as following
1. C D assumed to be constant and depends only the metal. For example, NADCA recom-mend different values for aluminum, zinc and magnesium alloys.
2 Another method has been suggested in the literature in which the Cp is evaluated based on the volume tobe filled (Cocks and Walll983). The author does not know of anyone who use this method and therefore is notdiscussed in this book. Nevertheless, this method is as "good" as the "common" method.
3 if you now of anyone who use this technique please tell me about it.
What have your membership dues
done for you today? plagiarise?copyright ©, 2000, by Dr. Bar-Meir
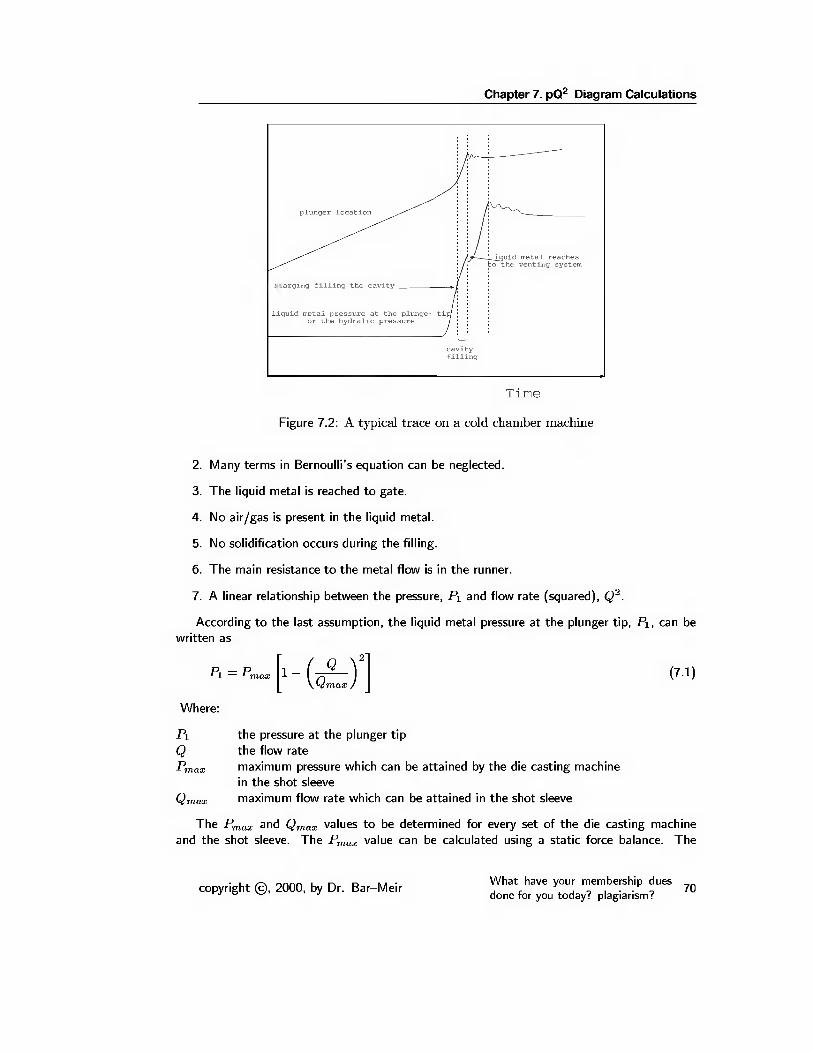
Chapter 7. pQ 2 Diagram Calculations
plunger location
starging filling the cavity
liquid metal pressure at the plunger tior the hydralic pressure
a^licjuid metal reachesto the venting system
Time
Figure 7.2: A typical trace on a cold chamber machine
2. Many terms in Bernoulli's equation can be neglected.
3. The liquid metal is reached to gate.
4. No air/gas is present in the liquid metal.
5. No solidification occurs during the filling.
6. The main resistance to the metal flow is in the runner.
7. A linear relationship between the pressure, Pi and flow rate (squared), Q 2 .
According to the last assumption, the liquid metal pressure at the plunger tip, Pi, can bewritten as
Pi =P„ 1 -Q
(7.1)
Where:
Pi
Q
Qr
the pressure at the plunger tipthe flow rate
maximum pressure which can be attained by the die casting machinein the shot sleeve
maximum flow rate which can be attained in the shot sleeve
The Pmax an d Qmax values to be determined for every set of the die casting machine
and the shot sleeve. The P max value can be calculated using a static force balance. The
copyright ©, 2000, by Dr. Bar-MeirWhat have your membership dues
done for you today? plagiarism?70
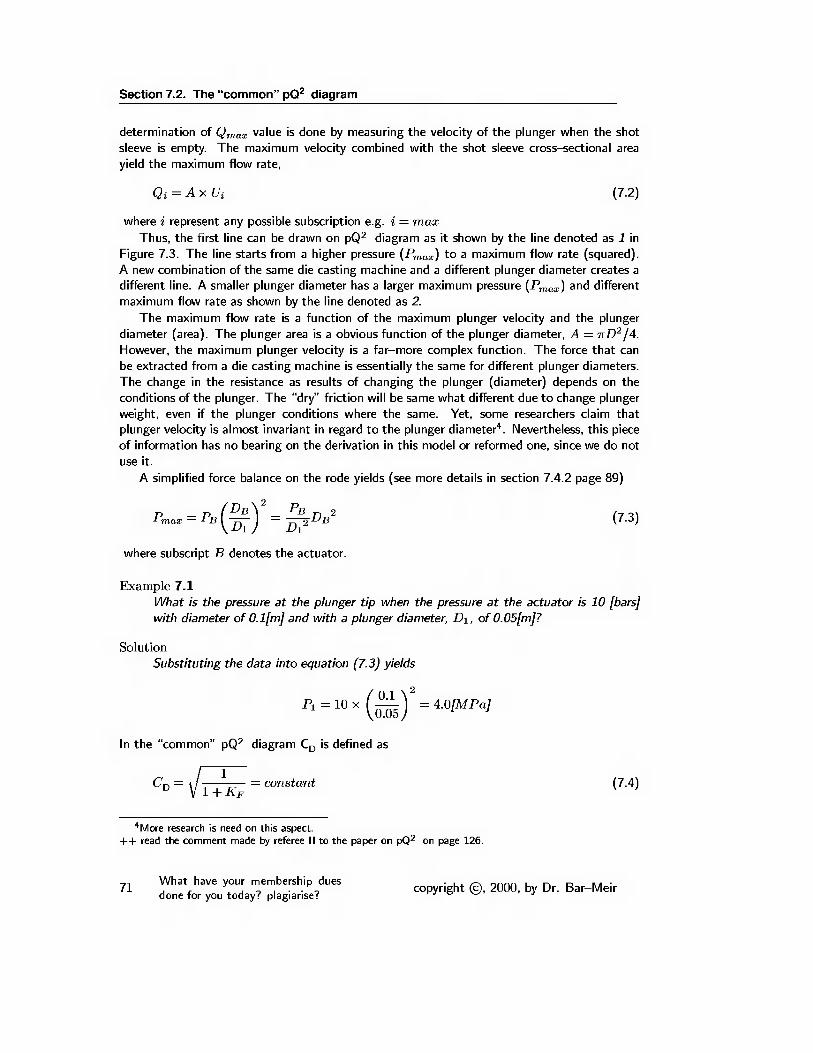
Section 7.2. The "common" pQ 2 diagram
determination of Q max value is done by measuring the velocity of the plunger when the shot
sleeve is empty. The maximum velocity combined with the shot sleeve cross-sectional area
yield the maximum flow rate,
where i represent any possible subscription e.g. i = max
Thus, the first line can be drawn on pQ 2 diagram as it shown by the line denoted as 1 in
Figure 7.3. The line starts from a higher pressure (P max ) to a maximum flow rate (squared).
A new combination of the same die casting machine and a different plunger diameter creates a
different line. A smaller plunger diameter has a larger maximum pressure {P max ) and different
maximum flow rate as shown by the line denoted as 2.
The maximum flow rate is a function of the maximum plunger velocity and the plunger
diameter (area). The plunger area is a obvious function of the plunger diameter, A = nD' 2 /4.However, the maximum plunger velocity is a far-more complex function. The force that can
be extracted from a die casting machine is essentially the same for different plunger diameters.
The change in the resistance as results of changing the plunger (diameter) depends on the
conditions of the plunger. The "dry" friction will be same what different due to change plunger
weight, even if the plunger conditions where the same. Yet, some researchers claim that
plunger velocity is almost invariant in regard to the plunger diameter 4 . Nevertheless, this pieceof information has no bearing on the derivation in this model or reformed one, since we do notuse it.
A simplified force balance on the rode yields (see more details in section 7.4.2 page 89)
where subscript B denotes the actuator.
Example 7.1
What is the pressure at the plunger tip when the pressure at the actuator is 10 [bars]
with diameter of 0.1[m] and with a plunger diameter, D\, of 0.05[m]?
Qi = AxUi (7.2)
n(7.3)
Solution
Substituting the data into equation (7.3) yieldssIn the "common" pQ 2 diagram C D is defined asa(7.4)
4 More research is need on this aspect.++ read the comment made by referee II to the paper on pQ 2 on page 126.
71What have your membership dues
done for you today? plagiarise?copyright ©, 2000, by Dr. Bar-Meir

Chapter 7. pQ 2 Diagram Calculations
,Note, therefore Kp is also defined as a constant for every metal 5 . Utilizing Bernoulli's equa-
to make question about rbalance
U 3 = C D ^j^ (7.5)The flow rate at the gate can be expressed as
Q 3 =A 3 C D] j^- (7.6)The flow rate in different locations is a function of the temperature. However, Eckert (Eck-
ertl989) 7 demonstrated that the heat transfer is insignificant in the duration of the filling ofthe cavity, and therefore the temperature of the liquid metal can be assumed almost constant
during the filling period (which in most cases is much less 100 milliseconds). As such, the
solidification is insignificant (the liquid metal density changes less than 0.1% in the runner);therefore, the volumetric flow rate can be assumed constant:
Qi=Q 2 = Q 3 = Q (7.7)
5 The author would like to learn who came-out with this "clever" idea.
6 for more details see section 7.4 page 79.
7 read more about it in Chapter 3.
copyright ©, 2000, by Dr. Bar-MeirWhat have your membership dues
done for you today? plagiarism?

Section 7.2. The "common" pQ 2 diagram
•D D
Q„
Pmax
Q
D 1
Figure 7.4: P max and Q max as a function of the plunger diameter according to "common"model.
Hence, we have two equations (7.1) and (7.6) with two unknowns (Q and Pi) for which thesolution is
p
Fl ~ 1 2C n 2 P m „.^~ ( ? - 8 J
Example 7.2
What is the pressure at plunger tip (metal side), the flow rate and gate velocity when
the following are given: liquid metal material is aluminum, P max = [5]MPa, Q max =0.016/m 3 / sec] and the gate area 3 x I0~ 5 [m 2 ]? Use NADCA's recommended value ofC D = 0.55 (Kp ~ 3.3).
Solution
Utilizing equation (7.8)
Pi =1 _ 2x(0.55) 2 X5x(3xl0- 5 ) 2
2350x0. 016 2
the gate velocity can by obtained by utilizing equation (7.5)
The flow rate can be obtained by utilizing equation (7.2)
Q = x3 x 1(T 5
What have your membership dues
done for you today? plagiarise?copyright ©, 2000, by Dr. Bar-Meir

Chapter 7. pQ 2 Diagram Calculations
Example 7.3
Repeat previous example with C D ranging from 0.4 to 0.9 draw a diagram
Solution
under construction
insert a discu
to the trends
iion in regards
insert the calculation with re-
"7.3 The validity of the "common" diagram
In the construction of the "common" model, two main assumptions were made: one C D isa constant which depends only on the liquid metal material, and two) many terms in the
energy equation (Bernoulli's equation) can be neglected. Unfortunately, the examination of thevalidity of these assumptions was missing in all the previous studies. Here, the question when
the "common" model valid or perhaps whether the "common' model valid at all is examined.
Some argue that even if the model is wrong and do not stand on sound scientific principles,
it still has a value if it produces reasonable trends. Therefore, this model should produce
reasonable results and trends when varying any parameter in order to have any value. Part of
the examination is done by varying parameters and checking to see what happen to trends.
7.3.1 Is the "common" model valid?
Is the mass balance really satisfied in the "common" model? Lets examine this point. Equation
(7.7) states that the mass (volume, under constant density) balance is exist.
So, what is the condition on C D to satisfy this condition? Can C D be a constant as stated
in assumption 1? To study this point let derive an expression for C D . Utilizing equation (7.5)yields
A x Ux = A 3 U 3 (7.9)
h(7.10)
From the machine characteristic, equation (7.1), it can be shown that
Ul — U ma x\/Pimax -Pi (7.11)
Substituting equation (7.11) into equation (7.10) yield,r(7.12)
It can be shown that equation (7.12) can be transformed into
j-i Ai U max\f~P(7.13)
copyright ©, 2000, by Dr. Bar-MeirWhat have your membership dues
done for you today? plagiarism?

Section 7.3. The validity of the "common" diagram
According to the "common" model U max , and P max are independent of the gate area, A3.
The term A3 ^ p- ^' 1 _p 1 is not a constant and is a function of ^3 (possibility other parameters).To maintain the mass balance C D must be a function at least of the gate area, A3. Since the
"common" pQ 2 diagram assumes that C D is a constant it diametrically opposite the massconservation principle. Moreover, in the "common" model, a major assumption is that the
value of C D depends on the metal, therefore, the mass balance is probably never achieved inmany cases. This violation demonstrates, once for all, that the "common" pQ 2 diagram iserroneous.
Example 7.4
Use the information from example 7.2 and check what happened to the flow rate at two
location ( 1) gate 2) plunger tip) when discharge coefficient is varied C D = 0.4-0.9
Solution
under construction
P
eAr
Figure 7.5: P as A± to be relocated
What have your membership dues
done for you today? plagiarise?copyright ©, 2000, by Dr. Bar-Meir

Chapter 7. pQ 2 Diagram Calculations
Pbar
eA3
Figure 7.6: P as A3 to be relocated
7.3.2 Are the trends reasonable?
Now second part, are the trends predicted by the "common" model are resumable (correct)?
To examine that, we vary the plunger diameter, (Ai or Di) and the gate area, A 3 to see if anyviolation of the physics laws occurs as results. The comparison between the real trends and the
"common" trends is discussed in the following section.
Plunger area/diameter variation
First, the effect of plunger diameter size variation is examined. In section 7.2 it was shown that
Pmax 1/-Di 2 - Equation (7.8) demonstrates that Pi increases with an increase of P ma x 8 -The value P TOOX can attained is an infinite value (according to the "common" model)
therefore Pi is infinite as well. The gate velocity, U3, increases as the plunger diameter decreases
as shown in Figure 7.7. Armed with this knowledge now, several cases can be examined if the
8 lt also demonstrates that the value of P never can exceed
, 2
=§(c^r) (7i4)
copyright ©, 2000, by Dr. Bar-MeirWhat have your membership dues
done for you today? plagiarism?
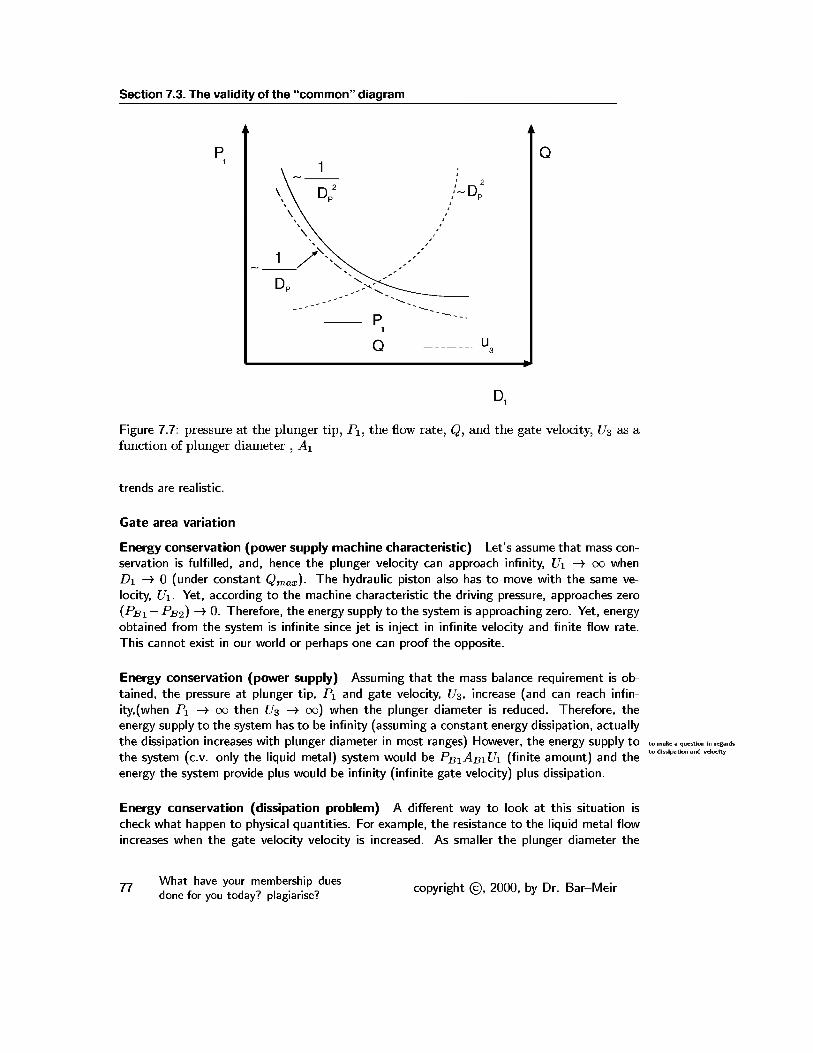
Section 7.3. The validity of the "common" diagram
gD
Figure 7.7: pressure at the plunger tip, Pi, the flow rate, Q, and the gate velocity, U3 as a
function of plunger diameter , A\
trends are realistic.
Gate area variation
Energy conservation (power supply machine characteristic) Let's assume that mass con-servation is fulfilled, and, hence the plunger velocity can approach infinity, U\ — > 00 when
Di — > (under constant Q max ). The hydraulic piston also has to move with the same ve-
locity, U\. Yet, according to the machine characteristic the driving pressure, approaches zero
(Pbi —Pb2) — ^ 0- Therefore, the energy supply to the system is approaching zero. Yet, energy
obtained from the system is infinite since jet is inject in infinite velocity and finite flow rate.
This cannot exist in our world or perhaps one can proof the opposite.
Energy conservation (power supply) Assuming that the mass balance requirement is ob-tained, the pressure at plunger tip, Pi and gate velocity, U3, increase (and can reach infin-
ity, (when Pi — > 00 then U3 — > 00) when the plunger diameter is reduced. Therefore, the
energy supply to the system has to be infinity (assuming a constant energy dissipation, actually
the dissipation increases with plunger diameter in most ranges) However, the energy supply to t S m.k. q ^i«i. V d.
the system (c.v. only the liquid metal) system would be Pbi^biUi (finite amount) and the *° "" patlonan v<!OC " yenergy the system provide plus would be infinity (infinite gate velocity) plus dissipation.
Energy conservation (dissipation problem) A different way to look at this situation ischeck what happen to physical quantities. For example, the resistance to the liquid metal flow
increases when the gate velocity velocity is increased. As smaller the plunger diameter the
What have your membership dues
done for you today? plagiarise?copyright ©, 2000, by Dr. Bar-Meir

Chapter 7. pQ 2 Diagram Calculations
P1
2
Pmax
Figure 7.8: Pi as a function of P max
larger the gate velocity and the larger the resistance. However, the energy supply to the system
has a maximum ability. Hence, this trend from this respect is unrealistic.
Mass conservation (strike) According to the "common" model, the gate velocity decreaseswhen the plunger diameter increases. Conversely, the gate velocity increases when the plunger
diameter decreases 9 . According to equation (7.2) the liquid metal flow rate at the gate increasesas well. However, according to the "common" pQ 2 diagram, the plunger can move only in a
finite velocity lets say in the extreme case U max 10 . Therefore, the flow rate at the plunger tipdecreases. Clearly, these diametrically opposing trends cannot coexist. Either the "common"
pQ 2 diagram wrong or the mass balance concept is wrong, take your pick.
Mass conservation (hydraulic pump): The mass balance also has to exist in hydraulic pump(obviously). If the plunger velocity have to be infinite to maintain mass balance in the metal
side, the mass flow rate at the hydraulic side of the rode also have to be infinite. However, the
to put tabi, with different pump has maximum capacity for flow rate. Hence, mass balance can be obtained.trends as a function of A-^and may be with a figure.
7.3.3 Variations of the Gate area, A 3
under construction
'check again Figure 7.4
"this is the velocity attained when the shot sleeve is empty
copyright ©, 2000, by Dr. Bar-MeirWhat have your membership dues
done for you today? plagiarism?

Section 7.4. The reformed pQ 2 diagram
7.4 The reformed pQ 2 diagram
The method based on the liquid metal properties is with disagreement with commonly agreed
on in fluid mechanics (Paol961, pp. 235-299). It is commonly agreed that C D is a func-tion of Reynolds number and the geometry of the runner design. The author (Bar-Meir and
Winklerl994) suggested adopting an approach where the C D is calculated by utilizing data offlow resistance of various parts (segments) of the runner. The available data in the literature
demonstrates that a typical value of C D can change as much as 100% or more just by changingthe gate area (like valve opening). Thus, the assumption of a constant C D , which is used in"common" pQ 2 calculations 11 , is not valid. Here a systematic derivation of the pQ 2 diagram
is given. The approach adapted in this book is that everything (if possible) should be presentedin dimensionless form.
7.4.1 The reform model
Equation (7.1) can be transformed into dimensionless from as
Q = y/l-P (7.15)
Where:
P reduced pressure, P\jP m ax
Q reduced flow rate, Qi/Qmax
Eckert (Eckertl989) also demonstrated that the gravity effects are negligible 12 . Assumingsteady state 13 and utilizing Bernoulli's equation between point (1) on plunger tip and point (3)at the gate area (see Figure 7.1) yields
Pi US P 3 tfa* , 71 .,- + — = - + — +h h3 (7.16)
where:
U velocity of the liquid metal
p the liquid metal density
/ii,3 energy loss between plunger tip and gate exitsubscript
1 plunger tip
2 entrance to runner system
3 gate
It has been shown that the pressure in the cavity can be assumed to be about atmospheric
(for air venting or vacuum venting) providing vents are properly designed Bar-Meir at el (Bar-
Meir, Eckert and Goldsteinl996; Bar-Meir, Eckert and Goldsteinl997) 14 . This assumption is
or as it is suggested by the referee II
see for more details chapter 3
read in the section 7.4.4 on the transition period of the pQ 2
Read a more detailed discussion in Chapter 9
What have your membership dues
done for you today? plagiarise?copyright ©, 2000, by Dr. Bar-Meir
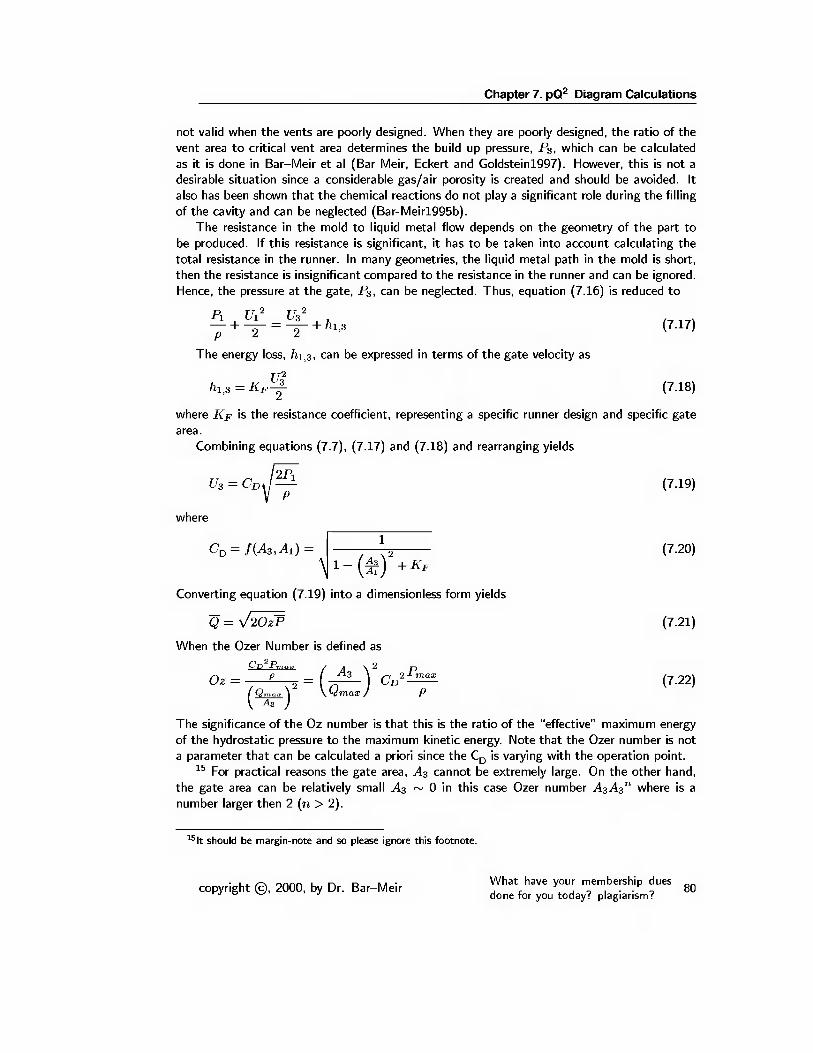
Chapter 7. pQ 2 Diagram Calculations
not valid when the vents are poorly designed. When they are poorly designed, the ratio of the
vent area to critical vent area determines the build up pressure, P3, which can be calculated
as it is done in Bar-Meir et al (Bar-Meir, Eckert and Goldsteinl997). However, this is not a
desirable situation since a considerable gas/air porosity is created and should be avoided. Italso has been shown that the chemical reactions do not play a significant role during the filling
of the cavity and can be neglected (Bar-Meirl995b).
The resistance in the mold to liquid metal flow depends on the geometry of the part to
be produced. If this resistance is significant, it has to be taken into account calculating the
total resistance in the runner. In many geometries, the liquid metal path in the mold is short,
then the resistance is insignificant compared to the resistance in the runner and can be ignored.
Hence, the pressure at the gate, P3, can be neglected. Thus, equation (7.16) is reduced to
« + f = f + ftl , 3 ,7,7)p 2 2
The energy loss, hi^, can be expressed in terms of the gate velocity as
hi, 3 =K F ^l (7.18)where Kp is the resistance coefficient, representing a specific runner design and specific gatearea.
Combining equations (7.7), (7.17) and (7.18) and rearranging yields
(7.19)
qC D = f(A 3 ,A 1 ) =
Converting equation (7.19) into a dimensionless form yields
Q = V20zP (7.21)
When the Ozer Number is defined as
Cn 2 P ma , , A \ 2
(7.20)
Oz= - 9 x2 = (j^-) C D 2 ^- (7.22)(%r)'
The significance of the Oz number is that this is the ratio of the "effective" maximum energy
of the hydrostatic pressure to the maximum kinetic energy. Note that the Ozer number is not
a parameter that can be calculated a priori since the C D is varying with the operation point.15 For practical reasons the gate area, ^3 cannot be extremely large. On the other hand,
the gate area can be relatively small ^3 ~ in this case Ozer number ^3^3" where is a
number larger then 2 (n > 2).
15 lt should be margin-note and so please ignore this footnote.
¦ L^. /~\ innn i. r\ d n /i ¦ What have your membership duescopyright ©, 2000, by Dr. Bar-Meir , , ' , _ . . . K , 80
done for you today? plagiarism?

Section 7.4. The reformed pQ 2 diagram
Solving equations (7.21) with (7.15) for P, and taking only the possible physical solution,
yields
75 = TT20-* (723)
which is the dimensionless form of equation (7.8).
7.4.2 Examining the solution
This solution provide a powerful tool to examine various parameters and their effects on the
design. The important factors that every engineer has to find from these calculations are: gate
area, plunger diameters, the machine size, and machine performance etc 16 . These issues areexplored further in the following sections.
The gate area effects
Gate area affects the reduced pressure, P, in two ways: via the Ozer number which include
two terms: one, (A 3 /Q max ) and, two, discharge coefficient Cd- The discharge coefficient, C Dis also affected by the gate area affects through two different terms in the definition (equation
7.20), one, {A 3 /Ai) 2 and two by K F .
Qmax effect is almost invariant with respect to the gate area up to small gate area sizes 17 .Hence this part is somewhat clear and no discussion is need.
(A3/A1) 2 effects Lets look at at the definition of C D equation (7.20). For illustrationpurposes let assume that Kp is not a function of gate area, Kp(A 3 ) = const. A small
perturbation of the gate area results in Taylor series,
AC D = C D (A 3 + AA 3 ) - C D (A 3 ) (7.24)1 A 3 AA 3
"T" 3 ~T
perhaps to put discussion
pending on the readers re-
+ 0(AA 3 y
how Ozer number behaves as a function of the gate area?
Pmax A3OZ :
pQmax 2 1- (£k.) 2 + X F
16 The machine size also limited by a second parameter known as the clamping forces to be discussed inChapter 10
17 This is reasonable speculation about this point. More study is well come
01 What have your membership dues . . . „„„„ , r-. D ¦81 , , copyright ©, 2000, by Dr. Bar-Meir
done for you today? plagiarise?

Chapter 7. pQ 2 Diagram Calculations
In this case equation (7.8) still hold but C D has to be reevaluated.
Example 7.5
repeat the example 7.2 with Kp = 3.3
Solution
First calculate the discharge coefficient, C D for various gate area starting from 2.4 10~ 6[m 2 ] to 3 10~ 4 [m 2 ] using equation 7.20.
This example demonstrate the very limited importance of the inclusion of the term (A3/A1) 2into the calculations.
Kp efFects The change in the gate area increases the resistance to the flow via several
contributing factors which include: the change in the flow cross section, change in the direction
of the flow, frictional loss due to flow through the gate length, and the loss due to the abrupt
expansion after the gate. The loss due to the abrupt expansion is a major contributor and
its value changes during the filling process. The liquid metal enters the mold cavity in the
initial stage as a "free jet" and sometime later it turns into an immersed jet which happens
in many geometries within 5%-20% of the filling. The change in the flow pattern is believed
to be gradual and is a function of the mold geometry. A geometry with many changes in
the direction of the flow and/or a narrow mold (relatively thin walls) will have the change toimmersed jet earlier. Many sources provide information on Kp for various parts of the designs
of the runner and gate. Utilizing this information produces the gate velocity as a function of
the given geometry. To study further this point consider a case where Kp is a simple function
of the gate area. When A3 is very large then the effect on Kp are relatively small. Conversely,
when A3 the resistance, Kp — > 00. The simplest function, shown in Figure 7.9, that
represent such behavior is
KE
KO3A3
Figure 7.9: Kp as a function of gate area, A3r(7.25)
copyright ©, 2000, by Dr. Bar-Meir 82

Section 7.4. The reformed pQ 2 diagram
C\ and Ci are constants and can be calculated (approximated) for a specific geometry.The value of C\ determine the value of the resistance where A3 effect is minimum and C2
determine the range (point) where A3 plays a significant effect. In practical, it is found that
C2 is in the range where gate area are desired and therefore program such as DiePerfect ™are important to calculated the actual resistance.
Example 7.6Under construction
create a question with respect to the function 7.25
Solution
Under construction
The combined effects Consequently, a very small area ratio results in a very large resistance,
and when ^ — > therefore the resistance — > 00 resulting in a zero gate velocity (like a closedvalve). Conversely, for a large area ratio, the resistance is insensitive to variations of the gate
area and the velocity is reduced with increase the gate area. Therefore a maximum gate velocity
must exist, and can be found by
which can be solved numerically. The solution of equation (7.26) requires full information on
the die casting machine.
A general complicated runner design configuration can be converted into a straight conduit
with trapezoidal cross-section, provided that it was proportionally designed to create equal gate
velocity for different gate locations 18 . The trapezoidal shape is commonly used because of thesimplicity, thermal, and for cost reasons.
Example 7.7
To illustrate only the effects of the gate area change two examples are presented: one,
a constant pressure is applied to the runner, two, a constant power is applied to the
runner. The resistance to the flow in the shot sleeve is small compared to resistance in
the runner, hence, the resistance in the shot sleeve can be neglected. The die casting
machine performance characteristics are isolated, and the gate area effects on the the gate
velocity can be examined. Typical dimensions of the design are presented in Figure 7.10.
The short conduit of0.25[m] represents an excellent runner design and the longest conduit
of 1.50[m] represents a very poor design. The calculations were carried for aluminum alloywith a density of 2385[kg/m 3 ] and a kinematic viscosity of 0.544 x 10~ 6 [m 2 /sec] andrunner surface roughness of 0.01 [mm]. For the constant pressure case the liquid metal
pressure at the runner entrance is assumed to be 1.2[MPa] and for the constant power
case the power loss is [IKw].
leave it for now, better pre-sentation needed
18 read about poor design effect on pQ 2 diagram
What have your membership dues
done for you today? plagiarise?copyright ©, 2000, by Dr. Bar-Meir

Chapter 7. pQ 2 Diagram Calculations
Solution
The gate velocity is exhibited as a function of the ratio of the gate area to the conduit
area as shown in Figure 7.11 for a constant pressure and in Figure 7.12 for a constant
power.
3 moldgatearea
0.01 [m]
/ — ? \/ 0.008 [m\ A-AI
gravity
0.01438 [m]
flow direction
n1shot
sleevenrunner
entrance
Figure 7.10: Design and dimensions of the runner for the example 7.4.2. The length, L,
represents different runner design qualities. The gate design is made of straight lines to
the gate area, creating a symmetrical gate.
Figure 7.11: Gate velocities as a function of the area ratio for constant pressure.
copyright ©, 2000, by Dr. Bar-MeirWhat have your membership dues
done for you today? plagiarism?

Section 7.4. The reformed pQ 2 diagram
Figure 7.12: Gate velocities as a function of the area ratio for constant power.
General conclusions from example 7.4.2
For the constant pressure case the "common" 19 assumption yields a constant velocity even fora zero gate area.
The solid line in Figure 7.11 represents the gate velocity calculated based on the common
assumption of constant C D while the other lines are based on calculations which take into
account the runner geometry and the Re number. The results for constant C D represent
"averaged" of the other results. The calculations of the velocity based on a constant C D valueare unrealistic. It overestimates the velocity for large gate area and underestimates for the area
ratio below ~ 80% for the short runner and 35% for the long runner. Figure 7.11 exhibits that
there is a clear maximum gate velocity which depends on the runner design (here represented
by the conduit length). The maximum indicates that the preferred situation is to be on the
"right hand side branch" because of shorter filling time. The gate velocity is doubled for the
excellent design compared with the gate velocity obtained from the poor design. This indicates
that the runner design is more important than the specific characteristic of the die casting
machine performance. Operating the die casting machine in the "right hand side" results in
smaller requirements on the die casting machine because of a smaller filling time, and therefore
will require a smaller die casting machine.
For the constant power case, the gate velocity as a function of the area ratio is shown in
Figure 7.12. The common assumption of constant C D yields the gate velocity U3 oc Ai/A 3shown by the solid line. Again, the common assumption produces unrealistic results, with the
gate velocity approaching infinity as the area ratio approaches zero. Obviously, the results with
a constant C D overestimates the gate velocity for large area ratios and underestimates it forsmall area ratios. The other lines describe the calculated gate velocity based on the runner
geometry. As before, a clear maximum can also be observed. For large area ratios, the gate
velocity with an excellent design is almost doubled compared to the values obtained with a
poor design. However, when the area ratio approaches zero, the gate velocity is insensitive to
the runner length and attains a maximum value at almost the same point.
In conclusion, this part has been shown that the use of the "common" pQ 2 diagram with
the assumption of a constant C D may lead to very serious errors. Using the pQ 2 diagram, theengineer has to take into account the effects of the variation of the gate area on the discharge
coefficient, C D , value. The two examples given inhere do not represent the characteristics ofthe die casting machine. However, more detailed calculations shows that the constant pressure
is in control when the plunger is small compared to the other machine dimensions and when the
runner system is very poorly designed. Otherwise, the combination of the pressure and power
limitations results in the characteristics of the die casting machine which has to be solved.
As it is written in NADCA's books
What have your membership dues
done for you today? plagiarise?copyright ©, 2000, by Dr. Bar-Meir

Chapter 7. pQ 2 Diagram Calculations
dThe die casting machine characteristic effects
There are two type of operation of the die casting machine, one) the die machine is operated
directly by hydraulic pump (mostly on the old machines), two) utilizing the non continuous
demand for the power, the power is stored in a container and released when need (mostly on
the newer machines). The container is normally a large tank contain nitrogen and hydraulic
liquid 20 . The effects of the tank size and gas/liquid ratio on the pressure and flow rate caneasily be derived.
Meta The power supply from the tank with can consider almost as a constant pressure but
the line to actuator is with variable resistance which is a function of the liquid velocity.
The resistance can be consider, for a certain range, as a linear function of the velocity
square, "Ub 2 " ¦ Hence, the famous a assumption of the "common" die casting machinep oc Q 2 .
End
The characteristic of the various pumps have been studied extensively in the past (Fair-
insert the discussion about banksl959). The die casting machine is a pump with some improvements which are patentedpump characteristic with the ¦ ¦ ¦ rr r ~i~ i c • i i i i i ¦ i* i i
figure f,om the red foide, by difFerent in a n uf a ct u res . The new configurations, such as double pushing cylinders, change
1 somewhat the characteristics of the die casting machines. First let discuss some general char-acteristic of a pump (issues like empelor, speed are out of the scope of this discussion). A
pump is mechanical devise that transfers and electrical power (mostly) into "hydraulic" power.
A typical characteristic of a pump are described in Figure 7.14.
"This similar to operation of water system in a ship, many of the characteristics are the same. Furthermore,the same differential equations are governing the situation. The typical questions such as the necessarily
container size and the ratio of gas to hydraulic liquid were part of my study in high school (probably the
simplified version of the real case). If demand to this material raised, I will insert it here in the future.
copyright ©, 2000, by Dr. Bar-MeirWhat have your membership dues
done for you today? plagiarism?

Section 7.4. The reformed pQ 2 diagram
rFigure 7.14: General characteristic of a pump
Two similar pumps can be connect in two way series and parallel. The parallel connection
increase mostly the flow rate as shown in Figure 7.14. The serious connection increase mostly
the pressure as shown in Figure 7.14. The series connection if "normalized" is very close to the
original pump. However, the parallel connection when "normalized" show a better performance.
To study the effects of the die casting machine performances, the following functions are
examined (see Figure 7.15):
Q = 1-P (7.27a)
Q = Vl-P (7.27b)
Q = \J\-P (7.27c)
The functions (7.27a), (7.27b) and (7.27c) represent a die casting machine with a poor per-
formance, the common performance, and a die casting machine with an excellent performance,
respectively.
Combining equation (7.21) with (7.27) yields
1-P = V20zP (7.28a)
Vl-P = V20zP (7.28b)
y/l-P = V20zP (7.28c)
rearranging equation (7.28) yields
P 2 - 2(1 + Oz)P + 1 = (7.29a)
What have your membership dues
done for you today? plagiarise?copyright ©, 2000, by Dr. Bar-Meir

:ulations
0.6
0.2
00.1 0.2 0.3 0.4 0.5 0.6 0.7 O.S 0.9 1
Figure 7.15: Various die casting machine performances
l-P(l + 20z) = (7.29b)
40zP 2 +P-l = (7.29c)
Solving equations (7.29) for P, and taking only the possible physical solution, yields
P = l+Oz- y/(2 + Oz) Oz (7.30a)
P =
P =
1
1 +2 0z
Vl + I60z 2 -1
80z 2
(7.30b)
(7.30c)
The reduced pressure, P, is plotted as a function of the Oz number for the three die casting
machine performances as shown in Figure 7.16.
Figure 7.16: Reduced pressure, P, for various machine performances as a function of the Oznumber
Figure 7.16 demonstrates that P monotonically decreases with an increase in the Oz number
for all the machine performances. All the three results convert to the same line which is a
plateau after Oz = 20. For large Oz numbers the reduced pressure, P, can be considered to
be constant P ~ 0.025. The gate velocity, in this case, is
U 3 ~ 0.22C™ (7.31)
The Ozer number strongly depends on the discharge coefficient, C D , and P mox . The valueof Qmax is relatively insensitive to the size of the die casting machine. Thus, this equation
copyright ©, 2000, by Dr. Bar-MeirWhat have your membership dues
done for you today? plagiarism?

Section 7.4. The reformed pQ 2 diagram
is applicable to a well designed runner (large C D ) and/or a large die casting machine (large
The reduced pressure for a very small value of the Oz number equals to one, P ~ 1
or P m ax = Pi, due to the large resistance in the runner (when the resistance in the runner
approaches infinity, K F — > oo, then P = 1). Hence, the gate velocity is determined by theapproximation of
U3 ~ Cd\I2P„
P(7.32)
The difference between the various machine performances is more considerable in the middle
range of the Oz numbers. A better machine performance produces a higher reduced pressure,
P. The preferred situation is when the Oz number is large and thus indicates that the machine
performance is less important than the runner design parameters. This observation is further
elucidated in view of Figures 7.11 and 7.12.
Plunger area/diameter effects
r1
PB.
hydraulicpiston
atmospheric
D pressureR
rode
plunger
explain what we trying toachieve here
Figure 7.17: Schematic of the plunger and piston balance forces
The pressure at the plunger tip can be evaluated from a balance forces acts on the hydraulic
piston and plunger as shown in Figure 7.17. The atmospheric pressure that acting on the left
side of the plunger is neglected. Assuming a steady state and neglecting the friction, the forces (why? perhaps to create £¦ I 1 I'll question for the students)
balance on the rod yields
(Pbi - PB2) +D R 2 ir Di 2 n
±B2 — - A "l
In particular, in the stationary case the maximum pressure obtains
D B 2 n(•Pbi - PB2)
D R 2 nH -. — ^Bl\
D 2 -k
(7.33)
(7.34)
The equation (7.34) is reduced when the rode area is negligible; plus, notice that P\\Pmax to read
E£l(P p v - Dj2n p-, \ r B\ — r Bl)\ max — -. J^max (7.35)
89What have your membership dues
done for you today? plagiarise?copyright ©, 2000, by Dr. Bar-Meir

Chapter 7. pQ 2 Diagram Calculations
Figure 7.18: Reduced liquid metal pressure at the plunger tip and reduced gate velocity as a
function of the reduced plunger diameter
Rearranging equation (7.35) yields
(Pbi - PB2)Pmax — (Pbi — PjB2)
Db(7.36)
pe.h.ps. discus.
21
The gate velocity relates to the liquid metal pressure at plunger tip according to the following
equation combining equation (7.5) and (7.30b) yields
U 3 = C D J-(Pbi ~ p B2)\ max
1 + f(^f) ( P Bl-PB,)\ max {^)(7.37)
— 2 — — 2
Under the assumption that the machine characteristic is Pi oc Q P = 1 — Q ,
Meta the solution for the intersection point is given by equation ? To study equation
(7.37), let's define
X U (P Si -Pb2)1
and the reduced gate velocity
U 3 A 3
Qr
C D A 3
yQr
D B(7.38)
(7.39)
Using these definitions, equation (7.37) is converted to a simpler form:
V =r + i
(7.40)
21 Note that P\\ max ^ [Pi] m ax- The difference is that Pi\ max represents the maximum pressure of theliquid metal at plunger tip in the stationary case, where as [P\] max represents the value of the maximumpressure of the liquid metal at the plunger tip that can be achieved when hydraulic pressure within the piston is
varied. The former represents only the die casting machine and the shot sleeve, while the latter represents the
combination of the die casting machine (and shot sleeve) and the runner system.
Equation (7.14) demonstrates that the value of [Pi] max is independent of Pmax (for large values of Pmax)under the assumptions in which this equation was attained (the "common" die casting machine performance,
etc). This suggests that a smaller die casting machine can achieve the same job assuming average performancedie casing machine.
copyright ©, 2000, by Dr. Bar-MeirWhat have your membership dues
done for you today? plagiarism?90

Section 7.4. The reformed pQ 2 diagram
End
With these definitions, and denoting
p 2 (CdM = 20zP (7.41)
one can obtain from equation (7.30b) that (make a question about how to do it?)
1
nX 2 +1
(7.42)
The coefficients of Pi in equation (7.41) and D\ in equation (7.38) are assumed
constant according to the "common" pQ 2 diagram. Thus, the plot of y and tj as
a function of x represent the affect of the plunger diameter on the reduced gate
velocity and reduced pressure. The gate velocity and the liquid metal pressure at
plunger tip decreases with an increase in the plunger diameters, as shown in Figure
7.18 according to equations (7.40) and (7.42).
more discussion on the
ing of the results
oFigure 7.19: A general schematic of the control volume of the hydraulic piston with the plunger
and part of the liquid metal
A control volume as it is shown in Figure 7.19 is constructed to study the effect of the
plunger diameter, (which includes the plunger with the rode, hydraulic piston, and shot sleeve,
but which does not include the hydraulic liquid or the liquid metal jet). The control volume is
stationary around the shot sleeve and is moving with the hydraulic piston. Applying the first law
of thermodynamics, when that the atmospheric pressure is assumed negligible and neglecting
the dissipation energy, yields
Q + Th in ( h in + = m out +U
+dm
~dte +
In writing equation (7.43), it should be noticed that the only change in the control volume is
in the shot sleeve. The heat transfer can be neglected, since the filling process is very rapid.
There is no flow into the control volume (neglecting the air flow into the back side of the
plunger and the change of kinetic energy of the air, why?), and therefore the second term on
the right hand side can be omitted. Applying mass conservation on the control volume for the
liquid metal yields
dm . .
-jr = -mout (7.44)
should be included in
+ WU7.43)
91What have your membership dues
done for you today? plagiarise?copyright ©, 2000, by Dr. Bar-Meir

Chapter 7. pQ 2 Diagram Calculations
The boundary work on the control volume is done by the left hand side of the plunger and can
be expressed by
Wc.v. = -(Pfli - P B2 )A B U 1
The mass flow rate out can be related to the gate velocity
m out = pA 3 U 3
Mass conservation on the liquid metal in the shot sleeve and the runner yields
A 1 U 1 = A 3 U 3 U 2 = U 2 3 (J±Substituting equations (7.44-7.47) into equation (7.43) yields
(Pbi ~ Pb2)A b U 3 A 1 = pA 3 U 3
Rearranging equation (7.48) yields
U 2 ( {hout - e) + -j- I 1 A 1
( p B1 _p fla) |£. =( ^,_ e)+ a^_(42Solving for U 3 yields
U 3 =
2 '(Pbi ~
t(hout - e)
soUM
Or in term of the maximum values of the hydraulic piston
U 3 =
2 (PBi-PB 2 )\ ma!e A B- [hout - e)1+2 Oz Aip2mWhen the term (h ou t — e) is neglected (C p ~ C v for liquid metal)
( P Bi- P B-2)\ ma!i Ab1+2 Oz Axp
u 3 =
Normalizing the gate velocity equation (7.52) yields
U 3 A 3y
Qr
C D
X 2 [l + 2 0z] -(*)'
(7.45)
(7.46)
(7.47)
(7.48)
(7.49)
(7.50)
(7.51)
(7.52)
(7.53)
copyright ©, 2000, by Dr. Bar-MeirWhat have your membership dues
done for you today? plagiarism?92
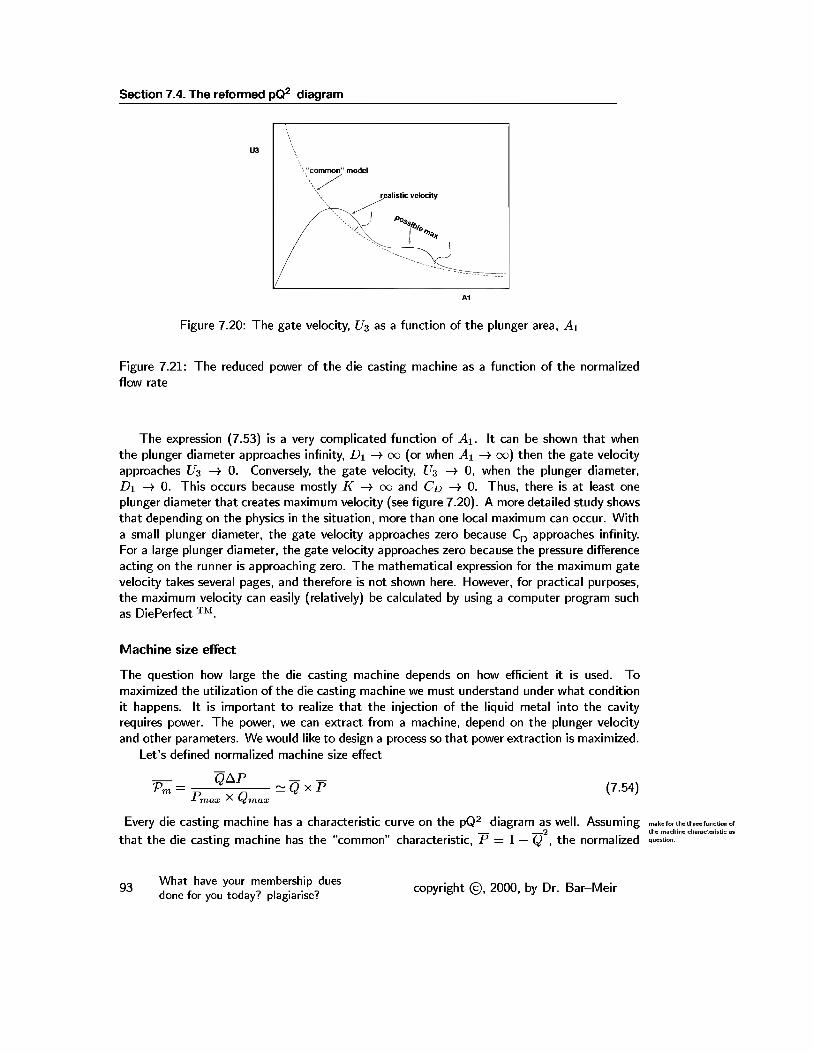
Section 7.4. The reformed pQ 2 diagram
U3
V'common" model
eorealistic velocity
ue/ • \
J ^
oiyA1
Figure 7.20: The gate velocity, U3 as a function of the plunger area, A±
Figure 7.21: The reduced power of the die casting machine as a function of the normalizedflow rate
The expression (7.53) is a very complicated function of A±. It can be shown that when
the plunger diameter approaches infinity, D\ — > 00 (or when A\ — > 00) then the gate velocity
approaches U3 — > 0. Conversely, the gate velocity, U3 — > 0, when the plunger diameter,
Di — > 0. This occurs because mostly K — > 00 and Cd — > 0. Thus, there is at least one
plunger diameter that creates maximum velocity (see figure 7.20). A more detailed study shows
that depending on the physics in the situation, more than one local maximum can occur. With
a small plunger diameter, the gate velocity approaches zero because C D approaches infinity.For a large plunger diameter, the gate velocity approaches zero because the pressure difference
acting on the runner is approaching zero. The mathematical expression for the maximum gate
velocity takes several pages, and therefore is not shown here. However, for practical purposes,
the maximum velocity can easily (relatively) be calculated by using a computer program suchas DiePerfect ™.
Machine size effect
The question how large the die casting machine depends on how efficient it is used. To
maximized the utilization of the die casting machine we must understand under what condition
it happens. It is important to realize that the injection of the liquid metal into the cavity
requires power. The power, we can extract from a machine, depend on the plunger velocity
and other parameters. We would like to design a process so that power extraction is maximized.Let's defined normalized machine size effect
^= P ®to (754)r max A Wmax
Every die casting machine has a characteristic curve on the pQ 2 diagram as well. Assuming make f or the three function of2 tne machine characteristic as
that the die casting machine has the "common" characteristic, P = 1 — Q , the normalized q-=«»n-
What have your membership dues
done for you today? plagiarise?copyright ©, 2000, by Dr. Bar-Meir

Chapter 7. pQ 2 Diagram Calculations
power can be expressed
V^ = Q{\- Q 2 ) =Q 2 -Q 3 (7.55)
where V m is the machine power normalized by P ma x x Qmax- The maximum power of this kind
of machine is at 2/3 of the normalized flow rate, Q, as shown in Figure 7.21. It is recommendedto design the process so the flow rate occurs at the vicinity of the maximum of the power. For
a range of 1/3 of Q that is from 0.5Q to 0.83(5, the average power is 0.1388 PmaxQmax, asshown in Figure 7.21 by the shadowed rectangular. One may notice that this value is above
the capability of the die casting machine in two ranges of the flow rate. The reason that this
number is used is because with some improvements of the the runner design the job can be
performed on this machine, and there is no need to move the job to a larger machine 22 .
Precondition effect (wave formation)
Meta discussion when Qi ^ Q 3
End
7.4.3 Poor design effects
Meta discussed the changes when different velocities are in different gates. Expanded on
the sudden change to turbulent flow in one of the branches.
End
7.4.4 Transient effects
Under construction
insert only general remarks To put the discussion about the inertia of the system and compressibility.until the paper will submitted . . .... rr
for publication the magnitude analysis before intensification efrectsinsert the notes froi
low folder
7.5 Design Process
Now with these pieces of information how one design the process/runner system. A designengineer in a local company have told me that he can draw very quickly the design for the mold
and start doing the experiments until he gets the products running well. Well, the important
part should not be how quickly you get it to try on your machine but rather how quickly you
can produce a good quality product and how cheap ( little scrap as possible and smaller die
casting machine). Money is the most important factor in the production. This design process is
longer than just drawing the runner and it requires some work. However, getting the production
going is much more faster in most cases and cheaper (less design and undesign scrap and less
2 Assuming that requirements on the clamping force is meet.
copyright ©, 2000, by Dr. Bar-MeirWhat have your membership dues
done for you today? plagiarism?

Section 7.6. The Intensification Consideration
experiments/starting cost). Hence, for given die geometry, four conditions (actually there aremore) need to satisfied
|| = „ 56 ,
the clamping force, and satisfy the power requirements.
For these criteria the designer has to check the runner design to see if gate velocity are
around the recommended range. A possible answer has to come from financial considerations,
since we are in the business of die casting to make money. Hence, the optimum diameter is the
one which will cost the least (the minimum cost). How, then, does the plunger size determine
cost? It has been shown that plunger diameter has a value where maximum gate velocity is
created. General relationship between, , ,. . , ,. . i ¦ / i i ¦ i i runner hydraulic diameter and
A very large diameter requires a very large die casting machine (due to physical size and P iu ng er diameto
the weight of the plunger). So, one has to chose as first approximation the largest plunger on
a smallest die casting machine. Another factor has to be taken into consideration is the scrap
created in the shot sleeve. Obviously, the liquid metal in the sleeve has to be the last place to
solidify. This requires the biscuit to be of at least the same thickness as the runner.
^runner ^biscuit (7.58)
Therefore, the scrap volume should be
^ -L biscuit ^ runner \' -™)
When the scrap in the shot sleeve becomes significant, compared to scrap of the runner
7r£>i 2 _
^ Trunner ^-^runner (7.60)
Thus, the plunger diameter has to be in the range of
(7.61)
To discussed that the plungerdiameter should not be use as
varying the plunger diameter
to determine the gate velocity
7.6 The Intensification Consideration
Intensification is a process in which pressure is increased making the liquid metal flows during the
solidification process to ensure compensation for the solidification shrinkage of the liquid metalrWhat have your membership dues
done for you today? plagiarise?copyright ©, 2000, by Dr. Bar-Meir

Chapter 7. pQ 2 Diagram Calculations
put schematic figure of how it
is done from the patent by die
casting companies
why? to put discussion
(up to 20%). The intensification is applied by two methods: one) by applying additional pump,
two) by increasing the area of the actuator (the multiplier method, or the prefill method) 23 .. The first method does not increase the intensification force to "P ma x" by much. However,
the second method, commonly used today in the industry, can increase considerably the ratio.
Meta Analysis of the forces demonstrates that as first approximation the plunger diameter
does not contribute any additional force toward pushing the liquid metal.
End
A very small plunger diameter creates faster solidification, and therefore the actual force is
reduced. Conversely, a very large plunger diameter creates a very small pressure for driving the
discuss the the resistance as a liquid metal.function of the diameter
7.7 Summary
In this chapter it has been shown that the "common" diagram is not valid and produces
unrealistic trends therefore has no value what so ever 24 . The reformed pQ 2 diagram was
introduced. The mathematical theory/presentation based on established scientific principleswas introduced. The effects of various important parameters was discussed. The method of
designing the die casting process was discussed. The plunger diameter has a value for which
the gate velocity has a maximum. For Di — > gate velocity, U 3 — > when Di — > 00 the
same happen U 3 — > 0. Thus, this maximum gate velocity determines whether an increase in
the plunger diameter will result in an increase in the gate velocity or not. An alternative way
has been proposed to determine the plunger diameter.
7.8 Questions
7.2 Prove that the maximum flow rate, Q ma x is reduced and that Q ma x oal/Dp 2 (see Figure7.4). if U max is a constant
7.3.1 Derive equation 7.11. Start with machine characteristic equation (7.1)
7.3.1 Find the relationship between C D and Ozer number that satisfy equation (7.13)
7.3.1 find the relationship between ^A 3 ^ — Pl _ Pl j and A 37.3.1 A 3 what other parameters that C D depend on which do not provide the possibility Cd =constant?
23 A note for the manufactures, if you would like to have your system described here with its advantages,please drop me a line and I will discuss with you about the material that I need. I will not charge you any
money.
24 Beside the historical value
copyright ©, 2000, by Dr. Bar-MeirWhat have your membership dues
done for you today? plagiarism?

Critical Slow Plunger Velocity
CHAPTER 8
Garber concluded that his model was not able to predict an
acceptable value for critical velocity for fill percentages lower than50% ...
Brevick, Ohio
Contents
8.1 Introduction 98
8.2 The "common" models 98
8.2.1 Garber's model 98
8.2.2 Brevick's Model 101
The square shot sleeve 101
8.2.3 Brevick's circular model 102
8.2.4 Miller's square model 102
8.3 The validity of the "common" models 103
8.3.1 Garber's model 103
8.3.2 Brevick's models 103
square model 103
Improved Garber's model 103
8.3.3 Miller's model 103
8.3.4 EKK's model (numerical model) 104
8.4 The Reformed Model 104
8.4.1 The reformed model 104
8.4.2 Design process 106
8.5 Summary 107
8.6 Questions 107
97

Chapter 8. Critical Slow Plunger Velocity
8.1 Introduction
This Chapter deals with the first stage of the injection in a cold chamber machine in which
the desire (mostly) is to expel maximum air/gas from the shot sleeve. Porosity is a major
production problem in which air/gas porosity constitutes a large portion. Minimization of Air
Entrainment in the Shot Sleeve (AESS) is a prerequisite for reducing air/gas porosity. This canbe achieved by moving the plunger at a specific speed also known as the critical slow plunger
velocity. It happens that this issue is related to the hydraulic jump, which was discussed in the
previous Chapters 5 (accidently? you thought!).
The "common" model, also known as Garber's model, with its extensions made by Brevick 1 ,Miller 2 , and EKK's model are presented first here. The basic fundamental errors of these models
are presented. Later, the reformed and "simple" model is described. It followed by the transient
and poor design effects 3 . Afterwards, as usual questions are given at the end of the chapter.
8.2 The "common" models
In this section the "common" models are described. Since the "popular" model also known
as Garber's model never work (even by its own creator) 4 , several other models have appeared.These models are described here to have a clearer picture of what was in the pre Bar-Meir's
model. First, a description of Garber's model is given later Brevick's two models along with
Miller's model 5 are described briefly. Lastly, the EKK's numerical model is described.
8.2.1 Garber's model
wnt]
Figure 8.1: A schematic of wave formation in stationary coordinates
The description in this section is based on one of the most cited paper in the die casting
research (Garberl982). Garber's model deals only with a plug flow in a circular cross-section.
industrial and Systems Engineering (ISE) Graduate Studies Chair, ISE department at The Ohio StateUniversity
2 The chair of ISE Dept. at OSU3 lt be added in the next addition
4 I wonder if Garber and later Brevick have ever considered that their the models were simply totally false.
5 This model was developed at Ohio State University by Miller's Group in the early 1990's.
copyright ©, 2000, by Dr. Bar-MeirWhat have your membership dues
done for you today? plagiarism?

Section 8.2. The "common" models
In this section, we "improve" the model to include any geometry cross section with any velocity
profile 6 .
Consider a duct (any cross section) with a liquid at level hi and a plunger moving from
the left to the right, as shown in Figure 8.1. Assuming a quasi steady flow is established after
a very short period of time, a unique height, hi, and a unique wave velocity, V w , for a given
constant plunger velocity, V p are created. The liquid in the substrate ahead of the wave isstill, its height, h-2, is determined by the initial fill. Once the height, h\, exceeds the hight of
the shot sleeve, H, there will be splashing. The splashing occurs because no equilibrium can
be achieved (see Figure 8.2a). For h\ smaller than H , a reflecting wave from the opposite
wall appears resulting in an enhanced air entrainment (see Figure 8.2b). Thus, the preferred
situation is when hi = H (in circular shape H = 2R) in which case no splashing or a reflectingwave result.
> r
1
coel(a)
eFigure 8.2: A schematic of reflecting wave formation in sub and supper critical velocity
It is easier to model the wave with coordinates that move at the wave velocity, as shown
in Figure 8.3. With the moving coordinate, the wave is stationary, the plunger moves back at
6 This addition to the original Garber's paper is derived here. I assumed that in this case, some mathematicswill not hurt the presentation.
What have your membership dues
done for you today? plagiarise?copyright ©, 2000, by Dr. Bar-Meir

Chapter 8. Critical Slow Plunger Velocity
a velocity (V w — V p ), and the liquid moves from the right to the left. Dashed line shows thestationary control volume.
ue8®
ceaivl
ewviFigure 8.3: A schematic of the wave with moving coordinates
Mass conservation of the liquid in the control volume reads:
f P V w dA= [ p( Vl -V p )dA (8.1)where v\ is the local velocity. Under quasi-steady conditions, the corresponding average velocity
equals the plunger velocity:
M L v 1 dA=W[ = V p (8.2)
Assuming that heat transfer can be neglected because of the short process duration 7 . Therefore,
the liquid metal density (which is a function of temperature) can be assumed to be constant,
buiid » question about what Under the a bove assumptions, equation (8.1) can be simplified tohappens if the temperature
changes by a few degrees. ^ .
Srstn'S'^z: v w A{h 2 ) = {v w -v p )A{h 1 ) ; A{hi)= ' <la (8.3),e,s? Jo
Where i in this case can take the value of 1 or 2. Thus,
=f{hiM) (8.4){v w - V p )
where /(/ii,/i2) = A(hJ) ' s a dimensionless function. Equation (8.4) can be transformed intoa dimensionless form:
f{h 1 ,h 2 ) = -^ Vj (8.5a)
where v = Xf-. Assuming energy is conserved (the Garber's model assumption), and underconditions of negligible heat transfer, the energy conservation equation for the liquid in the
control volume (see Figure 8.3) reads:
\2-
I [ft + ^.-r,)- | r mJa 1 IP 2 J Ja 2 L p
- 2 V^+ 2 V w dA (8.6)
see Chapter 3 for a detailed discussion
copyright ©, 2000, by Dr. Bar-MeirWhat have your membership dues
done for you today? plagiarism?

Section 8.2. The "common" models
where
7u
The shape factor, 7 le , is introduced to account for possible deviations of the velocity profile at
section 1 from a pure plug flow. Note that in die casting, the flow is pushed by the plunger
and can be considered as an inlet flow into a duct. The typical Re number is 10 5 , and for thisvalue the entry length is greater than 50m, which is larger than any shot sleeve by at least two
orders of magnitude.
The pressure in the gas phase can be assumed to be constant. The hydrostatic pressure in
the liquid can be represent by Ry^gp (Rajaratnaml965), where Ry^ is the center of the cross
section area. For a constant liquid density equation (8.6) can be rewritten as:
RVcig + lle 7T~ (V w - V v )A{h{) = Ry&9 + -y- V w A{h 2 ) (8.8)
Garber (and later Brevick) put this equation plus several geometrical relationships as the so-lution. Here we continue to obtain an analytical solution. Defining a dimensionless parameterFr as
Fr = Rg_V 2 '
Utilizing definition (8.9) and rearranging equation (8.8) yields
2Fr e xy^ + >y le (v- l) 2 = 2Fr e xy^ + v 2
Solving equation (8.10) for Fr t the latter can be further rearranged to yield:
Fr f =2facl ~ Vc2)
(l+7iO/(/»i,>»2) _
(8.9)
(8.10)
(8.11)
Given the substrate height, equation (8.11) can be evaluated for the Fr e , and the corresponding
plunger velocity ,V P . which is defined by equation (8.9). This solution will be referred hereinas the "energy solution" .
8.2.2 Brevick's Model
The square shot sleeve
Since Garber's model never work Brevick and co-workers go on a "fishing expedition" in the
fluid mechanics literature to find equations to describe the wave. They found in Lamb's book
several equations relating the wave velocity to the wave height for a deep liquid (water) 8 . Sincethese equations are for a two dimensional case, Brevick and co-workers built it for a squared
I have checked the reference and I still puzzled by the equations they found?
What have your membership dues
done for you today? plagiarise?copyright ©, 2000, by Dr. Bar-Meir

Chapter 8. Critical Slow Plunger Velocity
shot sleeve. Here are the equations that they used. The "instantaneous" height difference
(Ah = hi — h 2 ) is given as
Ah = hi + 1 -ho
[2Vgh^
This equation (8.12), with little rearranging, obtained a new form
iV p = 2^gh 2
The wave velocity is given by
V w = \fgh~2Ah
3 A /1 + — -2h 2
(8.12)
(8.13)
(8.14)
Brevick introduces the optimal plunger acceleration concept. "By plotting the height and
position of each incremental wave with time, their model is able to predict the 'stability' of the
resulting wave front when the top of the front has traveled the length of the shot sleeve." 9 .They then performed experiments on this "miracle acceleration 10 ."
8.2.3 Brevick's circular model
Probably, because it was clear to the authors that the previous model was only good for a
square shot sleeve 11 . They say let reuse Garber's model for every short time steps and withdifferent velocity (acceleration).
8.2.4 Miller's square model
Miller and his student borrowed a two dimensional model under assumption of turbulent flow.
They assumed that the flow is "infinite" turbulence and therefor it is a plug flow 12 . Since thesolution was for 2D they naturally build model for a square shot sleeve 13 . The mass balancefor square shot sleeve
V w h 2 = (V w - V p )h
Momentum balance on the same control volume yield
Pb , {V w -V p fV P
+ (V w - V p )/l! =P2 K/
IP 2V w h 2
(8.15)
(8.16)
9 What an interesting idea?? Any physics?
10 As to say this is not good enough a fun idea, they also "invented" a new acceleration units "cm/sec-cm" .
n lt is not clear whether they know that this equations are not applicable even for a square shot sleeve.
12 How they come-out with this conclusion?
13 Why are these two groups from the same university and the same department not familiar with each otherswork.
copyright ©, 2000, by Dr. Bar-MeirWhat have your membership dues
done for you today? plagiarism?102

Section 8.3. The validity of the "common" models
and the solution of these two equations is
lfti (h xFr mMe r = ~(^ + l) (8.17)
8.3 The validity of the "common" models
8.3.1 Garber's model
Energy is known to dissipate in a hydraulic jump in which case the equal sign in equation (8.11)does not apply and the criterion for a nonsplashing operation would read
Fv e < Ft optimal (8.18)
A considerable amount of research work has been carried out on this wave, which is known
in the scientific literature as the hydraulic jump. The hydraulic jump phenomenon has been
studied for the past 200 years. Unfortunately, Garber, ( and later other researchers in die
casting - such as Brevick and his students from Ohio State University (Brevick, Armentrout
and Chul994), (Thome and Brevickl995)) 14 , ignored the previous research. This is the realreason that their model never works.
8.3.2 Brevick's models
square model
There are two basic mistakes in this model, first) the basic equations are not applicable to the
shot sleeve situation, second) the square geometry is not found in the industry. To illustrate
why the equations Brevick chose are not valid, take the case where 1 > /11//12 > 4/9. For thatcase V w is positive and yet the hydraulic jump opposite to reality (hi < /12).
Improved Garber's model
Since Garber's model is scientific erroneous any derivative that is based on it no better thanits foundation 15 .
8.3.3 Miller's model
The flow in the shot sleeve in not turbulent 16 . The flow is a plug flow because entry lengthproblem 17 .
Besides all this, the geometry of the shot sleeve is circular. This mistake is discussed in the
comparison in the discussion section of this chapter.
14 Even with these major mistakes NADCA under the leadership of Gary Pribyl and Steve Udvardy continuesto award Mr. Brevick with additional grands to continue this research until now, Why?
15 1 wonder how much NADCA paid Brevick for this research?
16 Unless someone can explain and/or prove otherwise.17 see Chapter 3.
What have your membership dues
done for you today? plagiarise?copyright ©, 2000, by Dr. Bar-Meir

Chapter 8. Critical Slow Plunger Velocity
8.3.4 EKK's model (numerical model)
This model based on numerical simulations based on the following assumptions: 1) the flow is
turbulent, 2) turbulence was assume to be isentropic homogeneous every where (k-e model),
3) un-specified boundary conditions at the free interface (how they solve it with this kind ofcondition?), and 4) unclear how they dealt with the "corner point" in which plunger premiter
in which smart way is required to deal with zero velocity of the sleeve and known velocity of
plunger.
Several other assumptions implicitly are in that work 18 such as no heat transfer, a constantpressure in the sleeve etc.
According to their calculation a jet exist somewhere in the flow field. They use the k-e
model for a field with zero velocity! They claim that they found that the critical velocity to be
the same as in Garber's model. The researchers have found same results regadless the model
used, turbulent and laminar flow!! One can only wonder if the usage of k-e model (even forzero velocity field) was enough to produce these erroneous results or perhaps the problem layswithin the code itself 19 .
The hydraulic jump appears in steady-state and unsteady-state situations. The hydraulic
jump also appears when using different cross-sections, such as square, circular, and trapezoidal
shapes. The hydraulic jump can be moving or stationary. The "wave" in the shot sleeve is a
moving hydraulic jump in a circular cross-section. For this analysis, it does not matter if the
jump is moving or not. The most important thing to understand is that a large portion of the
energy is lost and that this cannot be neglected. All the fluid mechanics books 20 show thatGarber's formulation is not acceptable and a different approach has to be employed. Today,
the solution is available to die casters in a form of a computer program - DiePerfect ™.
8.4.1 The reformed model
In this section the momentum conservation principle is applied on the control volume in Figure
8.3. For large Re (~ 10 5 ) the wall shear stress can be neglected compared to the inertial terms(the wave is assumed to have a negligible length). The momentum balance reads:
8.4 The Reformed Model
(8.19)
where
7im =mJAi[ (V w - Vl ) 2 dA
1rdA (8.20)
This paper is a good example of poor research related to a poor presentation and text processing,
see remark on pape 30
in the last 100 years
copyright ©, 2000, by Dr. Bar-MeirWhat have your membership dues
done for you today? plagiarism?104

Section 8.4. The Reformed Model
Given the velocity profile v±, the shape factor jim can be obtained in terms of v. The expres-
sions for 71M for laminar and turbulent velocity profiles at section 1 easily can be calculated.
Based on the assumptions used in the previous section, equation (8.19) reads:
[mrg + Hm(V w - V p f\ A(h!) = [img + Vw 2 ] A(h 2 )Rearranging equation (8.21) into a dimensionless form yields:
f(hi,h 2 ) [y^Fr + ~f 1M (v-lY = VciFr + v 2
Combining equations (8.5) and (8.22) yields
(8.21)
(8.22)
(8.23)[f(hi,h 2 )y cl - y c2 ]
where Ftm is the Ft number which evolves from the momentum conservation equation.
Equation (8.23) is the analogue of equation (8.11) and will be referred herein as the "Bar-Meir's solution" .
Ft m =
1
Fr
i i r
0.00 0.17 0.33 0.49 0.66 0.83
R
0.99 1.16 1.32 1.49 1.65
Figure 8.4: The Froude number as a function of the relative height
It has been found that the solutions of the "Bar-Meir's solution" 21 and the "energysolution" can be presented in a simple form. Moreover, these solutions can be applied to
1 This model was constructed with a cooperation of a another researcher.
105What have your membership dues
done for you today? plagiarise?copyright ©, 2000, by Dr. Bar-Meir

Chapter 8. Critical Slow Plunger Velocity
any cross section for the transition of the free surface flow to pressurized flow. The discussion
here focuses on the circular cross section, since it is the only one used by diecasters. Solutions
for other velocity profiles, such as laminar flow (Poiseuille paraboloid), are discussed in theAppendix 22 . Note that the Froude number is based on the plunger velocity and not on theupstream velocity commonly used in the two-dimensional hydraulic jump.
The experimental data obtained by Garber (Garberl982), and Kami (Karnil991) and the
transition from the free surface flow to pressurized flow represented by equations (8.11) and(8.23) for a circular cross section are presented in Figure 8.4 for a plug flow. The Miller's
model (two dimensional) of the hydraulic jump is also presented in Figure 8.4. This Figureshows clearly that the "Bar-Meir's solution" is in agreement with Kami's experimental results.
The agreement between Garber's experimental results and the "Bar-Meir's solution," with the
exception of one point (at h 2 = R), is good.The experimental results obtained by Kami were taken when the critical velocity was ob-
tained (liquid reached the pipe crown) while the experimental results from Garber are interpre-
tation (kind of average) of subcritical velocities and supercritical velocities with the exception
of the one point at /12/i? = 1.3 (which is very closed to the "Bar-Meir's solution"). Hence,it is reasonable to assume that the accuracy of Kami's results is better than Garber's results.
However, these data points have to be taken with some caution 23 . Non of the experimental
data sets were checked if a steady state was achieved and it is not clear how the measurementscarried out.
It is widely accepted that in the two dimensional hydraulic jump small and large eddies
are created which are responsible for the large energy dissipation (Hendersonl966). Therefore,energy conservation cannot be used to describe the hydraulic jump heights. The same can be
said for the hydraulic jump in different geometries. Of course, the same has to be said for the
circular cross section. Thus, the plunger velocity has to be greater than the one obtained by
Garber's model, which can be observed in Figure 8.4. The Froude number for the Garber's
model is larger than the Froude number obtained in the experimental results. Froude number
inversely proportional to square of the plunger velocity, Fr oc 1/V^ 2 and hence the velocity issmaller. The Garber's model therefore underestimates the plunger velocity.
8.4.2 Design process
To obtain the critical slow plunger velocity, one has to follow this procedure:
1. Calculate/estimate the weight of the liquid metal.
2. Calculate the volume of the liquid metal (make sure that you use the liquid phase propertyand not the solid phase).
3. Calculate the percentage of filling in the shot sleeve, he ^ ht .
4. Find the Fr number from Figure 8.4.
5. Use the Fr number found to calculate the plunger velocity by using equation (8.9).
To appear in the next addition.
Results of good experiments performed by serious researchers are welcome.
copyright ©, 2000, by Dr. Bar-MeirWhat have your membership dues
done for you today? plagiarism?

Section 8.5. Summary
8.5 Summary
In this Chapter we analyzed the flow in the shot sleeve and developed a explicit expression to
calculated the required plunger velocity. It has been shown that Garber's model is totally wrong
and therefore Brevick's model is necessarily erroneous as well. The same can be said to all the
other models discussed in this Chapter. The connection between the "wave" and the hydraulic
jump has been explained. The method for calculating the critical slow plunger velocity has
been provided.
8.6 Questions
8.2.1 What is justification for equation 8.2?
8.2.1 Show that A^) = 2nR' 2 for h x = 2R
8.2.1 under-construction
8.3.1 Show the relative error created by Garber's model when the substrate height h-2 is the
varying parameter.
What have your membership dues
done for you today? plagiarise?copyright ©, 2000, by Dr. Bar-Meir

Chapter 8. Critical Slow Plunger Velocity
¦ L^. /~\ innn i. r\ d t, « ¦ What have your membership duescopyright ©, 2000, by Dr. Bar-Meir , , ' , _ . . . K , 108
done for you today? plagiarism?

CHAPTER 9
Venting System Design
The difference between the two is expressed by changing standard
atmospheric ambient conditions to those existing in the vacuumtank.
Miller's student, p. 102
9.1 Introduction
Proper design of the venting system is one of the requirements for reducing air/gas porosity.Porosity due to entrainment of gases constitutes a large portion of the total porosity, especially
when the cast walls are very thin (see Figure 9.1). The main causes of air/gas porosity areinsufficient vent area, lubricant evaporation (reaction processes), incorrect placement of thevents, and the mixing processes. The present chapter considers the influence of the vent area
(in atmospheric and vacuum venting) on the residual gas (in the die) at the end of the fillingprocess.
shrinkage
porosity
maximum
porosityiwall thickness
Figure 9.1: The relative shrinkage porosity as a function of the casting thickness
109

Chapter 9. Venting System Design
Atmospheric venting, the most widely used casting method, is one in which the vent is
opened to the atmosphere and is referred herein as air venting. Only in extreme cases are
other solutions required, such as vacuum venting, Pore Free Technique (in zinc and aluminum
casting) and squeeze casting. Vacuum is applied to extract air/gas from the mold before ithas the opportunity to mix with the liquid metal and it is call vacuum venting. The Pore
Free technique is a variation of the vacuum venting in which the oxygen is introduced into the
cavity to replace the air and to react with the liquid metal, and therefore creates a vacuum (Bar-
Meirl995b). Squeeze casting is a different approach in which the surface tension is increased
to reduce the possible mixing processes (smaller Re number as well). The gases in the shotsleeve and cavity are made mostly of air and therefore the term "air" is used hereafter. These
three "solutions" are cumbersome and create a far more expensive process. In this chapter, a
qualitative discussion on when these solutions should be used and when they are not needed is
presented.
Obviously, the best ventilation is achieved when a relatively large vent area is designed.
However, to minimize the secondary machining (such as trimming), to ensure freezing withinthe venting system, and to ensure breakage outside the cast mold, vents have to be very narrow.
A typical size of vent thicknesses range from l-2[mm]. These conflicting requirements on thevent area suggest an optimum area. As usual the "common" approach is described the errors
are presented and the reformed model is described.
9.2 The "common" models
9.2.1 Early (etc.) model
The first model dealing with the extraction of air from the cavity was done by Sachs. In this
model, Sachs (Sachsl952) developed a model for the gas flow from a die cavity based on thefollowing assumptions: 1) the gas undergoes an isentropic process in the die cavity, 2) a quasi
steady state exists, 3) the only resistance to the gas flow is at the entrance of the vent, 4)
a "maximum mass flow rate is present", and 5) the liquid metal has no surface tension, thus
the metal pressure is equal to the gas pressure. Sachs also differentiated between two cases:
choked flow and un-choked flow (but this differentiation did not come into play in his model).Assumption 3 requires that for choked flow the pressure ratio be about two between the cavityand vent exit.
Almost the same model was repeat by several researchers 1 . All these models, with the
exception of Veinik (Veinikl966), neglect the friction in the venting system. The vent designin a commercial system includes at least an exit, several ducts, and several abrupt expan-
sions/contractions in which the resistance coefficient (^^ see (Shapirol953, page 163)) canbe evaluated to be larger than 3 and a typical value of is about 7 or more. In this case,
the pressure ratio for the choking condition is at least 3 and the pressure ratio reaches this
value only after about 2/3 of the piston stroke is elapsed. It can be shown that when the flowis choked the pressure in the cavity does not remain constant as assumed in the models but
increases exponentially.
Apparently, no literature surry was required/available/needed at that time.
copyright ©, 2000, by Dr. Bar-MeirWhat have your membership dues
done for you today? plagiarism?

Section 9.2. The "common" models
9.2.2 Miller's model
Miller and his student, in the early 90's, constucted a model to account for the frinction in the
venting system. They based their model on the following assumptions:
1. No heat transfer
2. Isothermal flow (constant temperature) in the entrance to vent (according to the authorsin the presentation)
3. Fanno flow in the rest vent
4. Air/gas obeys the ideal gas model
Miller and his student described the calculation procedures for the two case as choked andunchoked conditions. The calculations for the choked case are standard and can be found in
any book about Fanno flow but with an interesting twist. The conditions in the mold and the
sleeve are calculated according the ambient condition (see the smart quote of this Chapter) 2 .The calculations about unchoked case are very interesting and will be discussed here in a little
more details. The calculations procedure for the unchoked as the following:
• Assume M,„ number (entrance Mach number to the vent) lower than M,„ for chokedcondition
• Calculate the corresponding star (choked conditions) the pressure ratio, and thetemperature ratio for the assume Mj„ number
• Calculate the difference between the calculated and the actual
• Use the difference to calculate the double stars (theoretical exit) conditions basedon the ambient conditions.
• Calculated the conditions in the die based on the double star conditions.
Now the mass flow out is determined by mass conservation.
Of course, these calculations are erroneous. In choked flow, the conditions are determined
only and only by up-steam and never by the down steam 3 . The calculations for unchokedflow are mathematical wrong. The assumption made in the first step never was checked. And
mathematically speaking, it is equivalent to just guessing solution. These errors are only fraction
of the other other in that model which include among other the following: one) assumption of
constant temperature in the die is wrong, two) poor assumption of the isothermal flow, three)
poor measurements etc. On top of that was is the criterion for required vent area.
2 This model results in negative temperature in the shot sleeve in typical range.
3 How otherwise, can it be? It is like assuming negative temperature in the die cavity during the injection.Is it realistic?
What have your membership dues
done for you today? plagiarise?copyright ©, 2000, by Dr. Bar-Meir

Chapter 9. Venting System Design
9.3 General Discussion
When a noncompressible liquid such as water is pushed, the same amount propelled by the
plunger will flow out of the system. However, air is a compressible substance and thus the
above statement cannot be applied. The flow rate out depends on the resistance to the flow
plus the piston velocity (piston area as well). There could be three situations 1) the flow rate
out is less than the volume pushed by the piston, 2) the flow rate out is more than the volume
pushed by the piston, or 3) the flow rate out is equal to the volume pushed by the piston. Thelast case is called the critical design, and it is associated with the critical area.
Air flows in the venting system can reach very large velocities up to about 350 [m/sec]. Theair cannot exceed this velocity without going through a specially configured conduit (convergingdiverging conduit). This phenomena is known by the name of "choked flow". This physicalphenomenon is the key to understanding the venting design process. In air venting, the venting
system has to be designed so that air velocity does not reach the speed of sound: in other
words, the flow is not choked. In vacuum venting, the air velocity reaches the speed of sound
almost instantaneously, and the design should be such that it ensures that the air pressure does
not exceed the atmospheric pressure.
Prior models for predicting the optimum vent area did not consider the resistance in the
venting system (pressure ratio of less than 2). The vent design in a commercial system includes
at least an exit, several ducts, and several abrupt expansions/contractions in which the resis-tance coefficient, is of the order of 3-7 or more. Thus, the pressure ratio creating choked
flow is at least 3. One of the differences between vacuum venting and atmospheric venting
occurs during the start-up time. For vacuum venting, a choking condition is established almost
instantaneously (it depends on the air volume in the venting duct), while in the atmospheric
case the volume of the air has to be reduced to more than half (depending on the pressureratio) before the choking condition develops - - and this can happen only when more than
2/3 or more of the piston stroke is elapsed. Moreover, the flow is not necessarily choked inatmospheric venting. Once the flow is choked, there is no difference in calculating the flowbetween these two cases. It turns out that the mathematics in both cases are similar, and
therefore both cases are presented in the present chapter.
The role of the chemical reactions was shown to be insignificant. The difference in the gas
solubility (mostly hydrogen) in liquid and solid can be shown to be insignificant (ASM1987).For example, the maximum hydrogen release during solidification of a kilogram of aluminum
is about 7cm 3 at atmospheric temperature and pressure. This is less than 3% of the volume
needed to be displaced, and can be neglected. Some of the oxygen is depleted during the filling
time (Bar-Meirl995b). The last two effects tend to cancel each other out, and the net effectis minimal.
The numerical simulations produce unrealistic results and there is no other quantitative
tools for finding the vent locations (the last place(s) to be filled) and this issue is still an openquestion today. There are, however, qualitative explanations and reasonable guesses that can
push the accuracy of the last place (the liquid metal reaches) estimate to be within the last10%-30% of the filling process. This information increases the significance of the understanding
of what is the required vent area. Since most of the air has to be vented during the initial
stages of the filling process, in which the vent locations do not play a role.
Air venting is the cheapest method of operation, and it should be used unless acceptable
copyright ©, 2000, by Dr. Bar-MeirWhat have your membership dues
done for you today? plagiarism?

Section 9.4. The Analysis
results cannot be obtained using it. Acceptable results are difficult to obtain 1) when the
resistance to the air flow in the mold is more significant than the resistance in the venting
system, and 2) when the mixing processes are augmented by the specific mold geometry. Inthese cases, the extraction of the air prior to the filling can reduce the air porosity which require
the use of other techniques.
An additional objective is to provide a tool to "combine" the actual vent area with the
resistance (in the venting system) to the air flow; thus, eliminating the need for calculations
of the gas flow in the vent in order to minimize the numerical calculations. Hu et al. (Hu
et al.1992) and others have shown that the air pressure is practically uniform in the system.Hence, this analysis can also provide the average air pressure that should be used in numericalsimulations.
9.4 The Analysis
The model is presented here with a minimal of mathematical details. However, emphasis is
given to all the physical understanding of the phenomena. The interested reader can find more
detailed discussions in several other sources (Bar-Meirl995a). As before, the integral approachis employed. All the assumptions which are used in this model are stated so that they can
be examined and discussed at the conclusion of the present chapter. Here is a list of the
assumptions which are used in developing this model:
1. The main resistance to the air flow is assumed to be in the venting system.
2. The air flow in the cylinder is assumed one-dimensional.
3. The air in the cylinder undergoes an isentropic process.
4. The air obeys the ideal gas model, P = pRT.
5. The geometry of the venting system does not change during the filling process (i.e., thegap between the plates does not increase during the filling process).
6. The plunger moves at a constant velocity during the filling process, and it is determined
by the pQ 2 diagram calculations.
7. The volume of the venting system is negligible compared to the cylinder volume.
8. The venting system can be represented by one long, straight conduit.
9. The resistance to the liquid metal flow, does not change during the filling process
(due to the change in the Re, or Mach numbers).
10. The flow in the venting system is an adiabatic flow (Fanno flow).
11. The resistance to the flow, is not affected by the change in the vent area.
With the above assumptions, the following model as shown in Figure 9.2 is proposed. A
plunger pushes the liquid metal, and both of them (now called as the piston) propel the airthrough a long, straight conduit.
What have your membership dues
done for you today? plagiarise?copyright ©, 2000, by Dr. Bar-Meir

Chapter 9. Venting System Design
Figure 9.2: A simplified model for the venting system
The mass balance of the air in the cylinder yields
dm
dt+ m out = 0. (9.1)
This equation (9.1) is the only equation that needed to be solved. To solve it, the physical prop-erties of the air need to be related to the geometry and the process. According to assumption
4, the air mass can be expressed as
PV
(9.2)m =
RT
The volume of the cylinder under assumption 6 can be written as
V(t)= 1
t
v(o) \- t maXi
Thus, the first term in equation (9.1) is represented by
dm_ d (PV(0)(ldt dt RT
(9.3)
(9.4)
The filling process occurs within a very short period time [milliseconds], and thereforethe heat transfer is insignificant 3. This kind of flow is referred to as Fanno flow 4 . Theinstantaneous flow rate has to be expressed in terms of the resistance to the flow, the
pressure ratio, and the characteristics of Fanno flow (Shapirol953). Knowledge of Fanno flow
is required for expressing the second term in equation (9.1).The mass flow rate can be written as
(0)AM„M in (t) fP o (0)M„ Po(t)
k + 1
RT o (0)f[M in (t)}
where
f[M in (t)} = l + ^-l(M in (t)) 2-(*+!)
2(fe-l)
(9.5)
(9.6)
4 Fanno flow has been studied extensively, and numerous books describing this flow can be found. Neverthe-less, a brief summary on Fanno flow is provided in Appendix D.
copyright ©, 2000, by Dr. Bar-MeirWhat have your membership dues
done for you today? plagiarism?

Section 9.5. Results and Discussion
The Mach number at the entrance to the conduit, Mi n (t), is calculated by Fanno flow charac-
teristics for the venting system resistance, ^J L , and the pressure ratio. M max is the maximumvalue of Mi n (t). In vacuum venting, the entrance Mach number, Mi n (t), is constant and equalto M max .
Substituting equations (9.4) and (9.5) into equation (9.1), and rearranging, yields:
w = ~ rr, m = i. («)
The solution to equation (9.7) can be obtained by numerical integration for P . The residualmass fraction in the cavity as a function of time is then determined using the "ideal gas"
assumption. It is important to point out the significance of the tmaa.. This parameter representsthe ratio between the filling time and the evacuation time. t c is the time which would be required
to evacuate the cylinder for a constant mass flow rate at the maximum Mach number when
the gas temperature and pressure remain at their initial values, under the condition that the
flow is choked, (The pressure difference between the mold cavity and the outside end of the
conduit is large enough to create a choked flow.) and expressed by
t = nm mAM mnx Pn
Critical condition occurs when t c = t max . In vacuum venting, the volume pushed by the
piston is equal to the flow rate, and ensures that the pressure in the cavity does not increase
(above the atmospheric pressure). In air venting, the critical condition ensures that the flowis not choked. For this reason, the critical area A c is defined as the area that makes the time
ratio t max /t c equal to one. This can be done by looking at equation (9.8), in which the valueof t c can be varied until it is equal to t max and so the critical area is
A c = m(0) , (9.9)D o(0)^/-RTo(O)
Substituting equation (9.2) into equation (9.9), and using the fact that the sound velocity canbe expressed as c = y/kRT, yields:
A c = ™ (9.10)ct m ax M max
where c is the speed of sound at the initial conditions inside the cylinder (ambient conditions).
The t max should be expressed by Eckert/Bar-Meir equation.
9.5 Results and Discussion
The results of a numerical evaluation of the equations in the proceeding section are presented
in Figure 9.3, which exhibits the final pressure when 90% of the stroke has elapsed as a functionrWhat have your membership dues
done for you today? plagiarise?copyright ©, 2000, by Dr. Bar-Meir

Chapter 9. Venting System Design
Parameters influencing the process are the area ratio, and the friction parameter,
From other detailed calculations (Bar-Meirl995a) it was found that the influence of the
parameter on the pressure development in the cylinder is quite small. The influence is
small on the residual air mass in the cylinder, but larger on the Mach number, M ex n. The
effects of the area ratio, are studied here since it is the dominant parameter.
Note that t c in air venting is slightly different from that in vacuum venting (Bar-Meir,Eckert and Goldsteinl996) by a factor of f(M max ). This factor has significance for small
and small when the Mach number is large, as was shown in other detailed calculations
(Bar-Meirl995a). The definition chosen here is based on the fact that for a small Mach number
the factor f{M max ) can be ignored. In the majority of the cases M max is small.
For values of the area ratio greater than 1.2, > 1.2, the pressure increases the volume
flow rate of the air until a quasi steady-state is reached. In air venting, this quasi steady-state
is achieved when the volumetric air flow rate out is equal to the volume pushed by the piston.
The pressure and the mass flow rate are maintained constant after this state is reached. The
pressure in this quasi steady-state is a function of For small values of there is no
steady-state stage. When is greater than one the pressure is concave upwards, and when
is less than one the pressure is concave downwards. These results are in direct contrast to
previous molds by Sachs (Sachsl952), Draper (Draperl967), Veinik (Veinikl962) and Lindsey
and Wallace (Lindsey and Wallacel972), where models assumed that the pressure and massflow rate remain constant and are attained instantaneously for air venting.
Figure 9.3: The pressure ratios for air and vacuum venting at 90% of the piston stroke
To refer to the stroke completion (100% of the stroke) is meaningless since 1) no gas mass
is left in the cylinder, thus no pressure can be measured, and 2) the vent can be blocked
partially or totally at the end of the stroke. Thus, the "completion" (end of the process) ofthe filling process is described when 90% of the stroke is elapsed. Figure 9.3 presents the final
pressure ratio as a function for ^± = 5. The final pressure (really the pressure ratio)depends strongly on as described in Figure 9.3. The pressure in the die cavity increases
by about 85% of its initial value when = 1 for air venting. The pressure remains almost
constant after reaches the value of 1.2. This implies that the vent area is sufficiently large
when = 1.2 for air venting and when = 1 for vacuum venting. Similar results can be
observed when the residual mass fraction is plotted.
This discussion and these results are perfectly correct in a case where all the assumptions
are satisfied. However, the real world is different and the assumptions have to examined andsome of them are:
1. Assumption 1 is not a restriction to the model, but rather guide in the design. The
engineer has to ensure that the resistance in the mold to air flow (and metal flow) has tobe as small as possible. This guide dictates that engineer designs the path for air (and
the liquid metal) as as short as possible.
2. Assumptions 3, 4, and 10 are very realistic assumptions. For example, the error in using
assumption 4 is less than 0.5%.
copyright ©, 2000, by Dr. Bar-MeirWhat have your membership dues
done for you today? plagiarism?

Section 9.5. Results and Discussion
3. This model is an indication when assumption 5 is good. In the initial stages (of thefilling process) the pressure is very small and in this case the pressure (force) to open theplates is small, and therefore the gap is almost zero. As the filling process progresses,
the pressure increases, and therefore the gap is increased. A significant gap requires very
significant pressure which occurs only at the final stages of the filling process and only
when the area ratio is small, < 1. Thus, this assumption is very reasonable.
4. Assumption 6 is associated with assumption 9, but is more sensitive. The change in the
resistance (a change in assumption in 9 creates consequently a change in the plungervelocity. The plunger reaches the constant velocity very fast, however, this velocity
decrease during the duration of the filling process. The change again depends on the
resistance in the mold. This can be used as a guide by the engineer and enhances the
importance of creating a path with a minimum resistance to the flow.
5. Another guide for the venting system design (in vacuum venting) is assumption 7. Theengineer has to reduce the vent volume so that less gas has to be evacuated. This
restriction has to be design carefully keeping in mind that the resistance also has to be
minimized (some what opposite restriction). In air venting, when this assumption is notvalid, a different model describes the situation. However, not fulfilling the assumption can
improve the casting because larger portion of the liquid metal which undergoes mixingwith the air is exhausted to outside the mold.
6. Assumption 8 is one of the bad assumptions in this model. In many cases there is more
than one vent, and the entrance Mach number for different vents could be a different
value. Thus, the suggested method of conversion is not valid, and therefore the value
of the critical area is not exact. A better, more complicated model is required. This
assumption cannot be used as a guide for the design since as better venting can be
achieved (and thus enhancing the quality) without ensuring the same Mach number.
7. Assumption 9 is a partially appropriate assumption. The resistance in venting system is
a function of Re and Mach numbers. Yet, here the resistance, is calculated based
on the assumption that the Mach number is a constant and equal to M max . The error
due to this assumption is large in the initial stages where Re and Mach numbers are
small. As the filling progress progresses, this error is reduced. In vacuum venting the
Mach number reaches the maximum instantly and therefore this assumption is exact. The
entrance Mach number is very small (the flow is even not choke flow) in air venting whenthe area ratio, » 1 is very large and therefore the assumption is poor. However,
regardless the accuracy of the model, the design achieves its aim and the trends of this
model are not affected by this error. Moreover, this model can be improved by taking
into consideration the change of the resistance.
8. The change of the vent area does affect the resistance. However, a detailed calculation
can show that as long as the vent area is above half of the typical cross section, the error
is minimal. If the vent area turns out to be below half of the typical vent cross section a
improvement is needed.
What have your membership dues
done for you today? plagiarise?copyright ©, 2000, by Dr. Bar-Meir

Chapter 9. Venting System Design
9.6 Summary
This analysis (even with the errors) indicates there is a critical vent area below which theventilation is poor and above which the resistance to air flow is minimal. This critical area
depends on the geometry and the filling time. The critical area also provides a mean to
"combine" the actual vent area with the vent resistance for numerical simulations of the cavity
filling, taking into account the compressibility of the gas flow. Importance of the design alsowas shown.
9.7 Questions
Under construction
copyright ©, 2000, by Dr. Bar-MeirWhat have your membership dues
done for you today? plagiarism?

CHAPTER 10
Clamping Force Calculations
Under construction
119

Chapter 10. Clamping Force Calculations
¦ L^. /~\ innn i. r\ d t, « ¦ What have your membership duescopyright ©, 2000, by Dr. Bar-Meir , , ' , _ . . . K , 120
done for you today? plagiarism?

Part III
MORE INFO: Appendixes
121


APPENDIX A
What The Establishment's Scientists
Say
What a Chutzpah? to say samething like that!
anonymous
In this section exhibits the establishment "experts" reaction the position that the "common"
pQ 2 diagram is improper. Their comments are responses to the author's paper: "The math-
ematical theory of the pQ 2 diagram" (similar to Chapter 7) 1 . The paper was submitted toJournal of Manufacturing Science and Engineering.
This part is for the Associate Technical Editor Dr. R. E. Smelser.
I am sure that you are proud of the referees that you have chosen and that you do
not have any objection whatsoever with publishing this information. Please send a
copy of this appendix to the referees. I will be glad to hear from them.
This concludes comments to the Editor.
I believe that you, the reader should judge if the mathematical theory of the pQ 2 diagram
is correct or whether the "experts" position is reasonable. For the reader unfamiliar with the
journal review process, the associate editor sent the paper to "readers" (referees) which are
anonymous to the authors. They comment on the paper and according to these experts the
paper acceptance is determined. I have chosen the unusual step to publish their comments
because I believe that other motivations are involved in their responses. Coupled with the
response to the publication of a summary of this paper in the Die Casting Engineer, bring me
to think that the best way to remove the information blockage is to open it to the public.
1 The exact paper can be obtain free of charge from Minnesota Suppercomputing Institute,http://www2.msi.umn.edu/publications.html report number 99/40 "The mathematical theory of the pQ 2 dia-gram" or by writing to the Supercomputing Institute, University of Minnesota, 1200 Washington Avenue South,
Minneapolis, MN 55415-1227
123

Chapter A. What The Establishment's Scientists Say
Here, the referees can react to this rebuttal and stay anonymous via correspondence with
the associated editor. If the referee/s choose to respond to the rebuttal, their comments willappear in the future additions. I will help them as much as I can to show their opinions. I am
sure that they are proud of their criticism and are standing behind it 100%. Furthermore, I am
absolutely positively sure that they are so proud of their criticism they glad that it appears in
publication such as this book.
A.l Summary of Referee positions
The critics attack the article in three different ways. All the referees try to deny publication
based on grammar!! The first referee didn't show any English mistakes (though he alleged that
he did). The second referee had some hand written notes on the preprint (two different hand
writing?) but it is not the grammar but the content of the article (the fact that the "common"
pQ 2 diagram is wrong) is the problem.
Here is an original segment from the submitted paper:
The design process is considered an art for the 8— billion— dollar die casting industry. The
pQ 2 diagram is the most common calculation, if any that all, are used by most die
casting engineers. The importance of this diagram can be demonstrated by the fact
that tens of millions of dollars have been invested by NADCA, NSF, and other major
institutes here and abroad in pQ 2 diagram research.
In order to correct "grammar", the referee change to:
The pQ 2 diagram is the most common calculation used by die casting engineers to de-
termine the relationship between the die casting machine and gating design parameters,
and the resulting metal flow rate.
It seems, the referee would not like some facts to be written/known.Summary of the referees positions:
Referee 1 Well, the paper was published before (NADCA die casting engineer) and the errors
in the "common" pQ 2 are only in extreme cases. Furthermore, it actually supports the"common" model.
Referee 2 Very angrily!! How dare the authors say that the "common" model is wrong. When
in fact, according to him, it is very useful.
Referee 3 The bizzarro approach! Changed the meaning of what the authors wrote (see the
"ovaled boxed" comment for example). This produced a new type logic which is almost
absurd. Namely, the discharge coefficient, C D , is constant for a runner or can only vary
with time. The third possibility, which is the topic of the paper, the fact that C D cannotbe assigned a runner system but have to calculated for every set of runner and die casting
machine can not exist possibility, and therefore the whole paper is irrelevant.
Genick Bar-Meir's answer:
copyright ©, 2000, by Dr. Bar-Meir

Section A.2. Referee 1 (from hand written notes)
Let me say what a smart man once said before:
I don't need 2000 scientists to tell me that I am
wrong. What I need is one scientist to show what
is wrong in my theory.
Please read my rebuttal to the points the referees made. The referees version are kept as close
as possible to the original. I put some corrections in a square bracket [] to clarify the refereespoint.
Referee comments appear in roman font like this sentence,
and rebuttals appear in a courier font as this sentence.
A. 2 Referee 1 (from hand written notes)
1. Some awkward grammar - See highlighted portions
Where?
2. Similarity of the submitted manuscript to the attached Die Casting Engineer Trade
journal article (May/ June 1998) is Striking.
The article in Die Casting Engineer is a summary of the present
article. It is mentioned there that it is a summary of the present
article. There is nothing secret about it. This article points out
that the ' 'common'' model is totally wrong. This is of central
importance to die casting engineers. The publication of this
information cannot be delayed until the review process is finished.
3. It is not clear to the reader why the "constant pressure" and "constant power"
situations were specifically chosen to demonstrate the author's point. Which
situation is most like that found [likely found] in a die casting machine? Does the"constant pressure" correspond closely to older style machines when intensifyer
[intensifier] bottle pressure was applied to the injection system unthrottled? Doesthe "constant power" situations assume a newer machines, such as Buher Sc, that
generates the pressure required to achieve a desired gate velocity? Some explanation
of the logic of selecting these two situations would be helpful in the manuscript.
As was stated in the article, these situations were chosen because
they are building blocks but more importantly to demonstrate that the
"common" model is totally wrong! If it is wrong for two basic cases
it should be absolutely wrong in any combinations of the two cases.
Nevertheless, an additional explanation is given in Chapter 7.
What have your membership dues
done for you today? plagiarise?copyright ©, 2000, by Dr. Bar-Meir

Chapter A. What The Establishment's Scientists Say
4. The author's approach is useful? Gives perspective to a commonly used process
engineering method (pQ 2 ) in die casting. Some of the runner lengths chosen (1
meter) might be consider exceptional in die casting - yet the author uses this to
show how much in error an "average" value for C D can be. The author might alsonote that the North American Die Casting Association and many practitioners use
a ^43/^2 ratio of « .65 as a design target for gating. The author" analysis reinforcesthis value as a good target, and that straying far from it may results in poor design
part filling problems (Fig. 5)
The reviewer refers to several points which are important to address.
All the four sizes show large errors (we do not need to take 1 [m] to
demonstrate that). The one size, the referee referred to as
exceptional (1 meter) , is not the actual length but the represented
length (read the article again) . Poor design can be represented by a
large length. This situation can be found throughout the die casting
industry due to the "common' ' model which does not consider runner
design. My office is full with runner designs with represent 1 meter
length such as one which got NADCA's design award 2 .
In regards to the area ratio, please compare with the other referee
who claim A3/A2 =0.8-0.95. I am not sure which of you reallyrepresent NADCA's position (I didn't find any of NADCA's publication
in regards to this point). I do not agree with both referees. This
value has to be calculated and cannot be speculated as the referees
asserted. Please find an explanation to this point in the paper or in
even better in Chapter 7 .
A. 3 Referee 2
There are several major concerns I have about this paper. The [most] major one [ofthese] is that [it] is unclear what the paper is attempting to accomplish. Is the papertrying to suggest a new way of designing the rigging for a die casting, or is it trying to
add an improvement to the conventional pQ 2 solution, or is it trying to somehow suggest
a 'mathematical basis for the pQ 2 diagram' ?
The paper shows that 1) the conventional pQ 2 solution'' is totally
wrong, 2) the mathematical analytical solution for the pQ 2 provides an
excellent tool for studying the effect of various parameters.
The other major concern is the poor organization of the ideas which the authors [are]trying to present. For instance, it is unclear how specific results presented in the results
section where obtained ([for instance] how were the results in Figures 5 and 6calculated?) .
I do not understand how the organization of the paper relates to the fact
that the referee does not understand how Fig 5 and 6 were calculated. The
2 to the best of my understanding
copyright ©, 2000, by Dr. Bar-Meir

Section A.3. Referee 2
organization of the paper does not have anything do with his understanding
the concepts presented. In regard to the understanding of how Figure 5
and 6 were obtained, the referee should referred to an elementary fluid
mechanics text book and combined it with the explanation presented in the
paper .
Several specific comments are written on the manuscript itself; most of these were areaswhere the reviewer was unclear on what the authors meant or areas where further
discussion was necessary. One issue that is particularly irksome is the authors tendency
in sections 1 and 2 to wonder [wander] off with "editorials" and other unsupportedcomments which have no place in a technical article.
Please show me even one unsupported comment ! !
Other comments/concerns include-
• what does the title have to do with the paper? The paper does not define what a
pQ2 diagram is and the results don't really tie in with the use of such diagrams.
The paper presents the exact analytical solution for the pQ 2
diagram. The results tie in very well with the correct pQ 2 diagram.Unfortunately, the ' 'common' ' model is incorrect and so the resultscannot be tied in with it .
• p. 4 The relationship Q oc \[P is a result of the application of Bernoulli's equationsystem like that shown in Fig 1. What is the rational or basis behind equation 1;
e.g. Q oc (1 - P) n with n =1, 1/2, and 1/4?
Here I must thank the referee for his comment! If the referee had
serious problem understanding this point, I probably should have
considered adding a discussion about this point, such as in Chapter 7.
• p. 5 The relationship between equation 1(a) to 1(c) and a die casting machine as"poor" , "common" , and "excellent" performance is not clear and needs to be
developed, or at least defined.
see previous comment
• It is well known that C D for a die casting machine and die is not a constant. In fact
it is common practice to experimentally determine C D for use on dies with 'similar'gating layouts in the future. But because most dies have numerous gates branching
off of numerous runners, to determine all of the friction factors as a function of
Reynolds number would be quite difficult and virtually untractable for design
purposes. Generally die casting engineers find conventional pQ2 approach works
quite well for design purposes.
This '' several points' comment give me the opportunity to discusses
the following points:
What have your membership dues
done for you today? plagiarise?copyright ©, 2000, by Dr. Bar-Meir

Chapter A. What The Establishment's Scientists Say
~k I would kindly ask the referee, to please provide the names ofany companies whom ''experimentally determine C D .'' Perhaps they
do it down under (Australia) where the ' 'regular'' physics laws
do not apply (please, forgive me about being the cynical about
this point. I cannot react to this any other way.)- Please,
show me a company that uses the ' 'common'' pQ 2 diagram and itworks .
~k Due to the computer revolution, today it is possible to do the
calculations of the C D for a specific design with a specific flow
rate (die casting machine). In fact, this is exactly what this
paper all about. Moreover, today there is a program that already
does these kind of calculations, called DiePerfect ™.
~k Here the referee introduce a new idea of the ''family'' — the
improved constant C D . In essence, the idea of ''family'' is
improve constant C D in which one assigned value to a specific
group of runners. Since this idea violate the basic physics laws
and the produces the opposite to realty trends it must be
abandoned. Actually, the idea of ''family'' is rather bizarre,
because a change in the design can lead to a significant change
in the value of C D . Furthermore, the ''family'' concept can leadto a poor design (read about this in the section ' 'poor design
effects'' of this book). How one can decided which design is
part of what ''family''? Even if there were no mistakes, the
author's method (calculating the C D ) is of course cheaper and
faster than the referee's suggestion about ''family'' of runner
design. In summary, this idea a very bad idea.
~k What is C D =constant? The referee refers to the case where C D isconstant for specific runner design but which is not the case in
reality. The C D does not depend only on the runner, but on the
combination of the runner system with the die casting machine via
the Re number. Thus, a specific runner design cannot have C D
''assigned'' to it. The Cp has to be calculated for any
combination runner system with die casting machine.
~k I would like to find any case where the ''common'' pQ 2 diagramdoes work. Please read the proofs in Chapter 7 showing why itcannot work.
• Discussion and results A great deal of discussion focuses on the regions where
^3/^2 0.1; yet in typical die casting dies ^43/^2 0.8 to 0.95.
Please read the comments to the previous referee
In conclusion, it's just a plain sloppy piece of work
I hope that referee does not mind that I will use it as the chapter
quote .
copyright ©, 2000, by Dr. Bar-MeirWhat have your membership dues
done for you today? plagiarism?

Section A.4. Referee 3
(the Authors even have one of the references to their own publications sited incorrectly!).
Perhaps, the referee should learn that magazines change names and, that
the name appears in the reference is the magazine name at the time of
writing the paper.
A. 4 Referee 3
The following comments are not arranged in any particular order.
General: The text has a number of errors in grammar, usage and spelling that need to be
addressed before publication.
p 6 I s * paragraph - The firsts sentence says that the flow rate is a function oftemperature, yet the rest of the paragraph says that it isn't.
The rest of the paragraph say the flow rate is a weak function of the
temperature and that it explains why. I hope that everyone agrees with me
that it is common to state a common assumption and explain why in that
particular case it is not important. I wish that more people would do
just that. First, it would eliminate many mistakes that are synonymous
with research in die casting, because it forces the smart ' ' researchers
to check the major assumptions they make. Second, it makes clear to the
reader why the assumption was made.
p 6 - after Eq 2 - Should indicate immediately that the subscript [s] refer to the sections inFigure 1.
I will consider this, Yet, I am not sure this is a good idea.
p 6 - after equation 2 - There is a major assumption made here that should not pass
without some comment [s] 3 "Assuming steady state " - This assumption goes to the heartof this approach to the filling calculation and establishes the bounds of its applicability.
The authors should discuss this point.
Well, I totally disagree with the referee on this point. The major
question in die casting is how to ensure the right range of filling time
and gate velocity. This paper's main concern is how to calculate the C D
and determine if the C D be ' 'assigned' ' to a specific runner. The unsteady
state is only a side effect and has very limited importance due to AESS.
Of course the flow is not continuous/steady state and is affected by many
parameters such as the piston weight, etc, all of which are related to the
transition point and not to the pQ 2 diagram per se. The unsteady state
exists only in the initial and final stages of the injection. As a
general rule, having a well designed pQ 2 diagram will produce a
significant improvement in the process design. It should be noted that a
full paper discussing the unsteady state is being prepared for publication
at the present time.
3 ls the referee looking for one or several explanations?
What have your membership dues
done for you today? plagiarise?copyright ©, 2000, by Dr. Bar-Meir

Chapter A. What The Establishment's Scientists Say
In general the organization of the paper is somewhat weak - the introduction especially
does not very well set the technical context for the pQ2 method and show how the
present work fits into it.
The present work does not fit into past work! It shows that the past
work is wrong, and builds the mathematical theory behind the pQ 2 diagram.
The last paragraph of the intro is confused [confusing]. The idea introduced in the lastsentence on page 2 is that the CD should vary somehow during the calculation, and
subsequently variation with Reynolds number is discussed, but the intervening material
about geometry effects is inconsistent with a discussion of things that can vary during the
calculation. The last two sentences do not fit together well either - "the assumption of
constant CD is not valid" - okay, but is that what you are going to talk about, or are you
going to talk about "particularly the effects of the gate area" ?
Firstly, Cp should not vary during the calculations it is a constant for a
specific set of runner system and die casting machine. Secondly, once any
parameter is changed, such as gate area, C D has to be recalculated. Now
the referee's statement Cp should vary, isn't right and therefore some of
the following discussion is wrong.
Now about the fitting question. What do referee means by ' 'fit
together?'' Do the paper has to be composed in a rhyming verse? Anyhow,
geometrical effects are part of Reynolds number (review fluid mechanics) .
Hence, the effects of the gate area shows that C D varies as well and has tobe recalculated. So what is inconsistent? How do these sentences not fit
together?
On p 8, after Eq 10 - I think that it would be a good idea to indicate immediately that
these equations are plotted in Figure 3, rather than waiting to the next section before
referring to Fig 3.
Also, making the Oz-axis on this graph logarithmic would help greatly in showing the
differences in the three pump characteristics.
Mentioning the figure could be good idea but I don't agree with you about
the log scale, I do not see any benefits.
On p. 10 after Eq 11 - The solution of Eq 11 requires full information on the die casting
machine - According to this model, the machine characterized by Pmax, Qmax and the
exponent in Eq 1. The wording of this sentence, however, might be indicating that there
is some information to be had on the machine other that these three parameters. I do not
think that that is what the authors intend, but this is confusing.
This is exactly what the authors intended. The model does not confined
to a specific exponent or function, but rather gives limiting cases.
Every die casting machine can vary between the two extreme functions, as
discussed in the paper. Hence, more information is needed for each
individual die casting machine.
p 12 - I tend to disagree with the premises of the discussion following Eq 12. I think that
Qmax depends more strongly on the machine size than does Pmax. In general, P max is
the intensification pressure that one wants to achieve during solidification, and this
copyright ©, 2000, by Dr. Bar-MeirWhat have your membership dues
done for you today? plagiarism?

Section A.4. Referee 3
should not change much with the machine size, whereas the clamping force, the product
of this pressure and platten are, goes up. On the other hand, when one has larger area to
make larger casting, one wants to increase the volumetric flow rate of metal so that flow
rate of metal so that fill times will not go up with the machine size. Commonly, the shot
sleeve is larger, while the maximum piston velocity does not change much.
Here the referee is confusing so many different concepts that it will
take a while to explain it properly. Please find here a attempt to
explain it briefly. The intensification pressure has nothing to do with
the pQ 2 diagram. The pQ 2 does not have much to do with the
solidification process. It is designed not to have much with the
solidification. The intensification pressure is much larg er than Pmax • I
give up! ! It would take a long discussion to teach you the fundamentals
of the pQ 2 diagram and the die casting process. You confuse so many
things that it impossible to unravel it all for you in a short paragraph.
Please read Chapter 7 or even better read the whole book.
Also, following Eq 13, the authors should indicate what they mean by "middle range" of
the Oz numbers. It is not clear from Fig 3 how close one needs to get to Oz=0 for the
three curves to converge again.
The mathematical equations are given in the paper. They are very simple
that you can use hand calculator to find how much close you need to go to
Oz = for your choice of error. A discussion on such issue is below the
level from an academic paper.
Besides being illustrative of the results, part of the value of an example calculation comes
from it making possible duplication of the results elsewhere. In order to support this, the
authors need to include the relationships that used for CD in these calculations.
The literature is full of such information. If the referee opens any
basic fluid mechanics text book then he can find information about it.
The discussion on p 14 of Fig 5 needs a little more consideration. There is a maximum in
this curve, but the author's criterion of being on the "right hand branch" is said to be
shorter fill time, which is not a criterion for choosing a location on this curve at all. The
fill time is monotone decreasing with increasing A3 at constant A2, since the flow is the
product of Vmax and A3. According to this criterion, no calculation is needed - the
preferred configuration is no gate whatsoever. Clearly, choosing an operating point
requires introduction of other criteria, including those that the authors mention in the
intro. And the end of the page 14 discussion that the smaller filling time from using a
large gate (or a smaller runner!!??) will lead to a smaller machine just does not follow atall. The machine size is determined by the part size and the required intensification
pressure, not by any of this.
Once again the referee is confusing many issues; let me interpret again
what is the pQ 2 diagram is all about. The pQ 2 diagram is for having an
operational point at the right gate velocity and the right filling time.
For any given A-i , there are two possible solutions on the right hand side
What have your membership dues
done for you today? plagiarise?copyright ©, 2000, by Dr. Bar-Meir

Chapter A. What The Establishment's Scientists Say
and one on the left hand side with the same gate velocity. However, the
right hand side has smaller filling time.
And again, the referee confusing another issue. Like in many engineering
situations, we have here a situation in which more than one criterion is
needed. The clamping force is one of the criteria that determines what
machine should be chosen. The other parameter is the pQ 2 diagram.
It seems that they authors have obscured some elementary results by doing theircalculations. 4
Tfor example, the last sentence of the middle paragraph on p 15 illustrates that as^CD reaches its limiting value of 1, the discharge velocity reaches its maximum. This
yi s not something we should be publishing in 1998. ^
There is no mention of the alleged fact of ' ' Cq reaches its limiting value
of 1.'' There is no discussion in the whole article about ''Cg reaching
its maximum (C D =1) ' ' . Perhaps the referee was mistakenly commenting ondifferent articles (NADCA's book or an other die casting book) which hehas confused with this article.
Regarding the concluding paragraph on p 15:
1. The use of the word "constant" is not consistent throughout this paper. Do they
mean constant across geometry or constant across Reynolds number, or both.
To the readers: The referee means across geometry as different
geometry and across Reynolds number as different Re number 5 . I reallydo not understand the difference between the two cases. Aren't
actually these cases the same? A change in geometry leads to a change
in Reynolds number number. Anyhow, the referee did not consider a
completely different possibility. Constant Cp means that C D is
assigned to a specific runner system, or like the "common' ' model inwhich all the runners in the world have the same value.
2. Assuming that they mean constant across geometry, then obviously, using a fixed
value for all runner/gate systems will sometimes lead to large errors. They did notneed to do a lot calculation to determine this.
And yet this method is the most used method in the industry (some even
will say the exclusive method) .
3. Conversely, if they mean constant across Reynolds number, i.e. CD can vary
through the run as the velocity varies, then they have not made their case very well.
Since they have assumed steady state and the P3 does not enter into the
4 lf it is so elementary how can it be obscured.I have broken-out this paragraph for purposes of illustration.
5 if the interpretation is not correct I would like to learn what it really mean.
copyright ©, 2000, by Dr. Bar-Meir

Section A.4. Referee 3
calculation, then the only reason that mention for the velocity to vary during the
fill would be because Kf varies as a function of the fill fraction. They have not
developed this argument sufficiently.
Let me stress again the main point of the article. C D varies for
different runners and/or die casting machines. It is postulated that
the velocity does not vary during run. A discussion about P3 is an
entirely different issue related to the good venting design for which
P3 remains constant .
4. If the examples given in the paper do not represent the characteristics of a typical
die casting machine, why to present them at all? Why are the "more detailed
calculations" not presented, instead of the trivial results that are shown?
These examples demonstrate that the ' 'common'' method is erroneous
and that the ' 'authors''' method should be adopted or other methods
based on scientific principles. I believe that this is a very goodreason.
What have your membership dues
done for you today? plagiarise?copyright ©, 2000, by Dr. Bar-Meir

Chapter A. What The Establishment's Scientists Say
¦ U4. innn u r\ d iv/i ¦ What have your membership dues _copyright ©, 2000, by Dr. Bar-Meir , , 134
done for you today? plagiarism?

APPENDIX B
My Relationship with Die CastingEstablishment
I cannot believe the situation that I am in. The hostility I am receiving from the
establishment is unbelievable, as individual who has spent the last 12 years in research to
improve the die casting. At first I was expecting to receive a welcome to the club. Later when
my illusions disappeared, I realized that it revolves around money along with avoiding
embarrassment to the establishment due to exposing of the truths and the errors the
establishment has sponsored. I believe that the establishment does not want people to know
that they had invested in research which produces erroneous models and continues to do so,
even though they know these research works/models are scientifically rubbish. They don'twant people to know about their misuse of money.
When I started my research, I naturally called what was then SDCE. My calls were never
returned. A short time later SDCE developed into what is now called NADCA. I had hoped
that this new creation would prove better. Approximately two years ago I wrote a letter to
Steve Udvardy, director of research and education for NADCA ( a letter I never submitted).Now I have decided that it is time to send the letter and to make it open to the public. I have
a long correspondence with Paul Bralower, former director of communication for NADCA,
which describes my battle to publish important information. An open letter to Mr. Baran,
Director of Marketing for NADCA, is also attached. Please read these letters. They reveal a
lot of information about many aspects of NADCA's operations. I have submitted five (5)
articles to this conference (20th in Cleveland) and only one was accepted (only 20%
acceptance compared to ~ 70% to any body else). Read about it here. During my battle to
"insert" science in die casting, many curious things have taken place and I wonder: are they
coincidental? Read about these and please let me know what you think.
135

Chapter B. My Relationship with Die Casting Establishment
Open Letter to Mr. Udvardy
Steve Udvardy NADCA,
9701 West Higgins Road, Suite 880
Rosemont, IL 60018-4721
January 26, 1998
Subject: Questionable ethics
Dear Mr. Udvardy:
I am writing to express my concerns about possible improprieties in the way that
NADCA awards research grants. As a NADCA member, I believe that these possible
improprieties could result in making the die casting industry less competitive than the
plastics and other related industries. If you want to enhance the competitiveness of the
die casting industry, you ought to support die casting industry ethics and answer the
questions that are raised herein.
Many of the research awards raise serious questions and concerns about the ethics of the
process and cast very serious shadows on the integrity those involved in the process. In
the following paragraphs I will spell out some of the things I have found. I suggest to you
and all those concerned about the die casting industry that you/they should help toclarify these questions, and eliminate other problems if they exist in order to increase the
die casting industry's profits and competitiveness with other industries. I also wonder
why NADCA demonstrates no desire to participate in the important achievements I havemade.
On September 26, 1996, I informed NADCA that Garber's model on the critical slow
plunger velocity is unfounded, and, therefore so, is all the other research based on
Garber's model (done by Dr. Brevick from Ohio State University). To my great surprise
I learned from the March/April 1997 issue of Die Casting Engineer that NADCA hasonce again awarded Dr. Brevick with a grant to continue his research in this area. Also, a
year after you stated that a report on the results from Brevick's could be obtained from
NADCA, no one that I know of has been able to find or obtain this report. I and many
others have tried to get this report, but in vain. It leaves me wondering whether someone
does not want others to know about this research. I will pay $50 to the first person who
will furnish me with this report. I also learned (in NADCA's December 22, 1997
publication) that once more NADCA awarded Dr. Brevick with another grant to do
research on this same topic for another budget year (1998). Are Dr. Brevick's resultsreally that impressive? Has he changed his model? What is the current model? Whyhave we not heard about it?
I also learned in the same issue of Die Casting Engineer that Dr. Brevick and his
colleagues have been awarded another grant on top of the others to do research on the
topic entitled "Development and Evaluation of the Sensor System." In the
September/October 1997 issue, we learned that Mr. Gary Pribyl, chairman of theNADCA Process Technology Task Group, is part of the research team. This Mr. Pribyl is
the chairman of the very committee which funded the research. Of course, I am sure, this
could not be. I just would like to hear your explanation. Is it legitimate/ethical to have aman on the committee awarding the chairman a grant?
Working on the same research project with this Mr. Pribyl was Dr. Brevick who also
copyright ©, 2000, by Dr. Bar-MeirWhat have your membership dues
done for you today? plagiarism?

received a grant mentioned above. Is there a connection between the fact that Gary
Pribyl cooperated with Dr. B. Brevick on the sensor project and you deciding to renew
Dr. Brevick's grant on the critical slow plunger velocity project? I would like to learn
what the reasoning for continuing to fund Dr. Brevick after you had learned that his
research was problematic.
Additionally, I learned that Mr. Steve Udvardy was given a large amount of money to
study distance communications. I am sure that Mr. Udvardy can enhance NADCA's
ability in distance learning and that this is why he was awarded this grant. I am also sure
that Mr. Udvardy has all the credentials needed for such research. One can only wonder
why his presentation was not added to the NADCA proceedings. One may also wonder
why there is a need to do such research when so much research has already been done in
this area by the world's foremost educational experts. Maybe it is because distance
communication works differently for NADCA. Is there a connection between Mr. Steve
Udvardy being awarded this grant and his holding a position as NADCA's research
director? I would like to learn the reasons you vouchsafe this money to Mr. Udvardy! I
also would like to know if Mr. Udvardy's duties as director of education include
knowledge and research in this area. If so, why is there a need to pay Mr. Udvardy
additional monies to do the work that he was hired for in the first place?
We were informed by Mr. Walkington on the behalf of NADCA in the Nov-Dec 1996 issue
that around March or April 1997, we would have the software on the critical slow plunger
velocity. Is there a connection between this software's apparent delayed appearance and
the fact that the research in Ohio has produced totally incorrect and off-base results? I
am sure that there are reasons preventing NADCA from completing and publishing this
software; I would just like to know what they are. I am also sure that the date this article
came out (Nov/Dec 1996) was only coincidentally immediately after I sent you my paperand proposal on the shot sleeve (September 1996). What do you think?
Likewise, I learned that Mr. Walkington, one of the governors of NADCA, also received a
grant. Is there a connection between this grant being awarded to Mr. Walkington and his
position? What about the connection between his receiving the grant and his former
position as the director of NADCA research? I am sure that grant was awarded based on
merit only. However, I have serious concerns about his research. I am sure that these
concerns are unfounded, but I would like to know what Mr. Walkington's credentials arein this area of research.
The three most important areas in die casting are the critical slow plunger velocity, the
pQ 2 diagram, and the runner system design. The research sponsored by NADCA on the
critical slow plunger velocity is absolutely unfounded because it violates the basic physics
laws. The implementation of the pQ 2 diagram is also absolutely unsound because again,
it violates the basic physics laws. One of the absurdities of the previous model is the idea
that plunger diameter has to decrease in order to increase the gate velocity. This
conclusion (of the previous model) violates several physics laws. As a direct consequence,
the design of the runner system (as published in NADCA literature) is, at best,extremely wasteful.
As you also know, NADCA, NSF, the Department of Energy, and others sponsoring
research in these areas exceed the tens of millions, and yet produce erroneous results. I
am the one who discovered the correct procedure in both areas. It has been my
What have your membership dues
done for you today? plagiarise?copyright ©, 2000, by Dr. Bar-Meir

Chapter B. My Relationship with Die Casting Establishment
continuous attempt to make NADCA part of these achievements. Yet, you still have not
responded to my repeated requests for a grant. Is there a reason that it has taken you \\years to give me a negative answer? Is there a connection between any of the above
information and how long it has taken you?
Please see the impressive partial-list of the things that I have achieved. I am the one who
found Garber's model to be totally and absolutely wrong. I am also the one responsible
for finding the pQ 2 diagram implementation to be wrong. I am the one who is
responsible for finding the correct pQ 2 diagram implementation. I am the one who
developed the critical area concept. I am the one who developed the economical runner
design concept. In my years of research in the area of die casting I have not come across
any research that was sponsored by NADCA which was correct and/or which produceduseful results!! Is there any correlation between the fact that all the important discoveries
(that I am aware of) have been discovered not in-but outside of NADCA? I would like tohear about anything in my area of expertise supported by NADCA which is useful and
correct? Is there a connection between the foregoing issues and the fact that so many of
the die casting engineers I have met do not believe in science?
More recently, I have learned that your secretary /assistant, Tricia Margel, has now beenawarded one of your grants and is doing research on pollution. I am sure the grant was
given based on qualification and merit only. I would like to know what Ms. MargeFs
credentials in the pollution research area are? Has she done any research on pollution
before? If she has done research in that area, where was it published? Why wasn't her
research work published? If it was published, where can I obtain a copy of the research?
Is this topic part of Ms. MargeFs duties at her job? If so, isn't this a double payment?
Or perhaps, was this an extra separated payment? Where can I obtain the financial
report on how the money was spent?
Together we must promote die casting knowledge. I am doing my utmost to increase the
competitiveness of the die casting industry with our arch rivals: the plastics industry, the
composite material industry, and other industries. I am calling on everyone to join me to
advance the knowledge of the die casting process.
Thank you for your consideration.
Sincerely,
Genick Bar-Meir, Ph.D.
cc: NADCA Board of Governors
NADCA members
Anyone who care about die casting industry
copyright ©, 2000, by Dr. Bar-MeirWhat have your membership dues
done for you today? plagiarism?

Correspondence with Paul Bralower
Paul Bralower is the former director of communications at NADCA. I have tried to publish
articles about critical show shot sleeve and the pQ 2 diagram through NADCA magazine.
Here is an example of my battle to publish the article regarding pQ 2 . You judge whether
NADCA has been enthusiastic about publishing this kind of information. Even after Mr.
Bralower said that he would publish it I had to continue my struggle.
He agreed to publish the article but • • •
At first I sent a letter to Mr. Bralower (Aug 21, 1997):Paul M. Bralower
NADCA, Editor
9701 West Higgins Road, Suite 880
Rosemont, IL 60018-4721
Dear Mr. Bralower:
Please find enclosed two (2) copies of the paper "The mathematical theory of the pQ 2diagram" submitted by myself for your review. This paper is intended to be considered
for publication in Die Casting Engineer.
For your convenience I include a disk DOS format with Microsoft WORD for window
format (pq2.wid) of the paper, postscript/pict files of the figures (figures 1 and 2). Ifthere is any thing that I can do to help please do not hesitate let me know.
Thank you for your interest in our work.
Respectfully submitted,Dr. Genick Bar-Meir
cc: Larry Winkler
a short die casting list
, Documents,end: , '
Disk
He did not responded to this letter, so I sent him an additional one on December 6, 1997.
Paul M. Bralower
NADCA, Editor
9701 West Higgins Road, Suite 880
Rosemont, IL 60018-4721Dear Mr. Bralower:
I have not received your reply to my certified mail to you dated August 20, 1997 in which
I enclosed the paper "The mathematical theory of the pQ 2 diagram" authored by myself
for your consideration (a cc was also sent to Larry Winkler from Hartzell). Pleaseconsider publishing my paper in the earliest possible issue. I believe that this paper is of
extreme importance to the die casting field.
I understand that you have been very busy with the last exhibition and congress.
However, I think that this paper deserves a prompt hearing.
I do not agree with your statement in your December 6, 1996 letter to me stating that
" This paper is highly technical-too technical without a less-technical background
- What have your membership dues . . . „„„„ , ,-. D ¦139 , , copyright ©, 2000, by Dr. Bar-Meir
done for you today? plagiarise?

Chapter B. My Relationship with Die Casting Establishment
explanation for our general readers ¦ ¦ -. I do not believe that discounting your readers is
helpful. I have met some of your readers and have found them to be very intelligent, and
furthermore they really care about the die casting industry. I believe that they can judge
for themselves. Nevertheless, I have yielded to your demand and have eliminated many of
the mathematical derivations from this paper to satisfy your desire to have a " simple"
presentation. This paper, however, still contains the essentials to be understood clearly.
Please note that I will withdraw the paper if I do not receive a reply stating your
intentions by January 1, 1998, in writing. I do believe this paper will change the way pQ 2
diagram calculations are made. The pQ 2 diagram, as you know, is the central part of the
calculations and design thus the paper itself is of same importance.
I hope that you really do see the importance of advancing knowledge in the die casting
industry, and, hope that you will cooperate with those who have made the major progressin this area.
Thank you for your consideration.
Sincerely,Dr. Genick Bar-Meir
cc: Boxter, McClimtic, Scott, Wilson, Holland, Behler, Dupre, and some other NADCAmembers
ps: You probably know by now that Garber's model is totally and absolutely wrong
including all the other investigations that where based on it, even if they were
sponsored by NADCA. (All the researchers agreed with me in the last congress)
Well that letter got him going and he managed to get me a letter in which he claim that he
sent me his revisions. Well, read about it in my next letter dated January 7, 1998.
Paul M. Bralower,
NADCA, Editor
9701 West Higgins Road, Suite 880
Rosemont, IL 60018-4721
Dear Mr. Bralower:
Thank you for your fax dated December 29, 1997 in which you alleged that you sent me
your revisions to my paper "The mathematical theory of the pQ 2 diagram." I never
receive any such thing!! All the parties that got this information and myself find this
paper to of extreme importance.
I did not revise my paper according to your comments on this paper, again, since I did
not receive any. I decided to revised the paper since I did not received any reply from you
for more than 4 months. I revised according to your comments on my previous paper on
the critical slow plunger velocity. As I stated in my letter dated December 6, 1997, 1 sent
you the revised version as I send to all the cc list. I re-sent you the same version on
December 29, 1997. Please note that this is the last time I will send you the same paper
since I believe that you will claim again that you do not receive any of my submittal. In
case that you claim again that you did not receive the paper you can get a copy from
anyone who is on the cc list. Please be aware that I changed the title of the paper
(December, 6, 1997 version) to be "How to calculate the pQ 2 diagram correctly".
copyright ©, 2000, by Dr. Bar-Meir

I would appreciate if you respond to my e-Mail by January 14, 1998. Please consider this
paper withdrawn if I will not hear from you by the mentioned date in writing (email is
fine) whether the paper is accepted.
I hope that you really do see the importance of advancing knowledge in the die casting
industry, and, hope that you will cooperate with those who have made the major progressin this area.
Sincerely,Dr. Genick Bar-Meir
ps: You surely know by now that Garber's model is totally and absolutely wrong
including all the other investigations that where based on it
He responded to this letter and changed his attitude ¦ ¦ ¦ I thought.
January 9, 1998.
Dear Mr. Bar-Meir:
Thank you for your recent article submission and this follow-up e-mail. I am now in
possession of your article "How to calculate the pQ2 diagram correctly." It is the version
dated Jan. 2, 1998. I have read it and am prepared to recommend it for publication in
Die Casting Engineer. I did not receive any earlier submissions of this article, I was
confusing it with the earlier article that I returned to you. My apologies. However I am
very pleased at the way you have approached this article. It appears to provide valuable
information in an objective manner, which is all we have ever asked for. As is my policy
for highly technical material, I am requesting technical personnel on the NADCA staff to
review the paper as well. I certainly think this paper has a much better chance of
approval, and as I said, I will recommend it. I will let you know of our decision in 2-3
weeks. Please do not withdraw it-give us a little more time to review it! I would like to
publish it and I think technical reviewer will agree this time.
Sincerely,Paul Bralower
Well I waited for a while and then I sent Mr. Bralower a letter dated Feb 2, 1998.
Dear Mr. Bralower,
Apparently, you do not have the time to look over my paper as you promise. Even a
negative reply will demonstrate that you have some courtesy. But apparently the paper is
not important as your experts told you and I am only a small bothering cockroach.
Please see this paper withdrawn!!!!
I am sorry that we do not agree that an open discussion on technical issues should be
done in your magazine. You or your technical experts do not have to agree with my
research. I believe that you have to let your readers to judge. I am sure that there is no
other reasons to your decision. I am absolutely sure that you do not take into your
consideration the fact that NADCA will have to stop teaching SEVERAL COURSES
which are wrong according to this research.
Thank you for your precious time!!Dr. Bar-Meir
What have your membership dues
done for you today? plagiarise?copyright ©, 2000, by Dr. Bar-Meir

Chapter B. My Relationship with Die Casting Establishment
Please note that this letter and the rest of the correspondence with you in this matter
will be circulated in the die casting industry. I am sure that you stand by your decision
and you would like other to see this correspondence even if they are NADCA members.
Here is the letter I received in return a letter from Paul Bralower Feb 5, 1998.
Dear Mr. Bar-Meir:
I'll have you know that you have inconvenienced me and others on our staff today with
your untoward, unnecessary correspondence. If you had a working telephone or fax this
e-mail would not be necessary. As it is I must reply to your letter and take it to someone
else's office and have them e-mail it to you right away.
I tried to telephone you last week on Thurs. 1/29 with the news that we have agreed topublish your article, "How to Calculate the pQ 2 diagram correctly." I wanted to ask you
to send the entire paper, with graphics and equations, on a disk. Because of the current
status of our e-mail system, I would advise you not to e-mail it. Send it on any of the
following: Syquest, Omega ZIP or Omega JAZ. Use Microsoft Office 97, Word 6.0 orWord Perfect 6.0.
The problem is I couldn't reach you by phone. I tried sending you a fax several times
Thurs. and last Friday. There was no response. We tried a couple of different numbers
that we had for you. Having no response, I took the fax and mailed it to you as a letter
on Monday 2/2. I sent Priority 2-day Mail to your attention at Innovative Filters, 110716th Ave. S.E., Minneapolis, Minn, 55414. You should have received it today at latest if
this address is correct for you, which it should be since it was on your manuscript.
Now, while I'm bending over backwards to inform you of your acceptance, you have the
nerve to withdraw the paper and threaten to spread negative gossip about me in the
industry! I know you couldn't have known I was trying to contact you, but I must inform
you that I can't extend any further courtesies to you. As your paper has been accepted, I
expect that you will cancel your withdrawl and send me the paper on disk immediately
for publication. If not, please do not submit any further articles.
My response to Paul M. Bralower.
Feb 9, 1998
Dear Mr. Bralower:
Thank you for accepting the paper "How to calculate the pQ 2 diagram correctly". I
strongly believe that this paper will enhance the understanding of your readers on this
central topic. Therefore, it will help them to make wiser decisions in this area, and thus
increase their productivity. I would be happy to see the paper published in Die Casting
Engineer.
As you know I am zealous for the die casting industry. I am doing my utmost to promote
the knowledge and profitability of the die casting industry. I do not apologize for doing
so. The history of our correspondence makes it look as if you refuse to publish important
information about the critical slow plunger velocity. The history shows that you lost this
paper when I first sent it to you in August, and also lost it when I resubmitted it in early
December. This, and the fact that I had not heard from you by February 1, 1998, and
other information, prompted me to send the email I sent. I am sure that if you were in
my shoes you would have done the same. My purpose was not to insults anyone. My only
copyright ©, 2000, by Dr. Bar-MeirWhat have your membership dues
done for you today? plagiarism?

aim is to promote the die casting industry to the best of my ability. I believe that those
who do not agree with promoting knowledge in die casting should not be involved in die
casting. I strongly believe that the editor of NADCA magazine (Die Casting Engineer)should be interested in articles to promote knowledge. So, if you find that my article is a
contribution to this knowledge, the article should be published.
I do not take personal insult and I will be glad to allow you to publish this paper in Die
Casting Engineer. I believe that the magazine is an appropriate place for this article. To
achieve this publication, I will help you in any way I can. The paper was written using
BTeX, and the graphics are in postscript files. Shortly, I will send you a disc containingall the files. I will also convert the file to Word 6.0. I am afraid that conversion will
require retyping of all the equations. As you know, WORD produces low quality setup
and requires some time. Would you prefer to have the graphic files to be in TIFF format?
or another format? I have enhanced the calculations resolution and please be advised
that I have changed slightly the graphics and text.
Thank you for your assistance.
Sincerely,Dr. Genick Bar-Meir
Is the battle over?
Well, I had thought in that stage that the paper would finally be published as the editor had
promised. Please continue to read to see how the saga continues.
4/24/98
Dear Paul Bralower:
To my great surprise you did not publish my article as you promised. You also did not
answer my previous letter. I am sure that you have a good reasons for not doing so. I
just would like to know what it is. Again, would you be publishing the article in the next
issue? any other issue? published at all? In case that you intend to publish the article,
can I receive a preprint so I can proof-read the article prior to the publication?
Thank you for your consideration and assistance!!Genick
Then I got a surprise: the person dealing with me was changed. Why? (maybe you, the
reader, can guess what the reason is). I cannot imagine if the letter was an offer to buy me
out. I just wonder why he was concerned about me not submitting proposals (or this matter
of submitting for publication). He always returned a prompt response to my proposals, yah
sure. Could he possibly have suddenly found my research to be so important. Please read his
letter, and you can decide for yourself.
Here is Mr. Steve Udvardy response on Fri, 24 Apr 1998
Genick,
I have left voice mail for you. I wish to speak with you about what appears to be
non-submittal of your proposal I instructed you to forward to CMC for the 1999 call.
I can and should also respond to the questions you are posinjg to Paul.
I can be reached by phone at 219.288.7552.
What have your membership dues
done for you today? plagiarise?copyright ©, 2000, by Dr. Bar-Meir

Chapter B. My Relationship with Die Casting Establishment
Thank you,
Steve Udvardy
Since the deadline for that proposal had passed long before, I wondered if there was any point
in submitting any proposal. Or perhaps there were exceptions to be made in my case? No, it
couldn't be; I am sure that he was following the exact procedure. So, I then sent Mr.
Udvardy the following letter.
April 28, 1998
Dear Mr. Udvardy:
Thank you very much for your prompt response on the behalf of Paul Bralower.
As you know, I am trying to publish the article on the pQ 2 diagram. I am sure that you
are aware that this issue is central to die casting engineers. A better design and a
significant reduction of cost would result from implementation of the proper pQ 2
diagram calculations.
As a person who has dedicated the last 12 years of his life to improve the die casting
industry, and as one who has tied his life to the success of the die casting industry, I
strongly believe that this article should be published. And what better place to publish it
than "Die Casting Engineer"?
I have pleaded with everyone to help me publish this article. I hope that you will agree
with me that this article should be published. If you would like, I can explain further
why I think that this article is important.
I am very glad that there are companies who are adopting this technology. I just wish
that the whole industry would do the same.
Again, thank you for your kind letter.Genick
ps: I will be in my office Tuesday between 9-11 am central time (612) 378-2940
I am sure that Mr. Udvardy did not receive the comments of/from the referees (see AppendixA). And if he did, I am sure that they did not do have any effect on him whatsoever. Why
should it have any effect on him? Anyhow, I just think that he was very busy with other things
so he did not have enough time to respond to my letter. So I had to send him another letter.
5/15/98
Dear Mr. Udvardy:
I am astonished that you do not find time to answer my letter dated Sunday, April, 26
1998 (please see below copy of that letter). I am writing you to let you that there is aserious danger in continue to teach the commonly used pQ 2 diagram. As you probably
know (if you do not know, please check out IFI's web site www.dieperfect.com), thecommonly used pQ 2 diagram as it appears in NADCA's books violates the first and the
second laws of thermodynamics, besides numerous other common sense things. If
NADCA teaches this material, NADCA could be liable for very large sums of money to
the students who have taken these courses. As a NADCA member, I strongly recommend
that these classes be suspended until the instructors learn the correct procedures. I, as a
copyright ©, 2000, by Dr. Bar-MeirWhat have your membership dues
done for you today? plagiarism?

NADCA member, will not like to see NADCA knowingly teaching the wrong material
and moreover being sued for doing so.
I feel that it is strange that NADCA did not publish the information about the critical
slow plunger velocity and the pQ 2 diagram and how to do them correctly. I am sure that
NADCA members will benefit from such knowledge. I also find it beyond bizarre that
NADCA does not want to cooperate with those who made the most progress in the
understanding die casting process. But if NADCA teaching the wrong models might ends
up being suicidal and I would like to change that if I can.
Thank you for your attention, time, and understanding!
Sincerely, Dr. Genick Bar-Meir
ps: Here is my previous letter.
Now I got a response. What a different tone. Note the formality (Dr Bar-Meir as oppose to
Genick).
May 19, 1998
Dear Dr Bar-Meir,
Yes, I am here. I was on vacation and tried to contact you by phone before I left for
vacation. During business travel, I was sorry to not be able to call during the time period
you indicated.
As Paul may have mentioned, we have approved and will be publishing your article on
calculating PQ2. The best fit for this is an upcoming issue dedicated to process control.
Please rest assured that it will show up in this appropriate issue of DCE magazine.
Since there has been communications from you to Paul and myself and some of the issues
are subsequently presented to our Executive Vice President, Dan Twarog, kindly direct
all future communications to him. This will assist in keeping him tied in the loop and
assist in getting responses back to you. His e-mail address is [email protected].
Thank you,
Steve Udvardy
Why does Mr. Udvardy not want to communicate with me and want me to write to Executive
Vice President? Why did they change the title of the article and omit the word "correctly". I
also wonder about the location in the end of the magazine.
I have submitted other proposals to NADCA, but really never received a reply. Maybe it isn't
expected to be replied to? Or perhaps it just got/was lost?
Open letter to Leo Baran
In this section an open letter to Leo Baran is presented. Mr. Baran gave a presentation in
Minneapolis on May 12, 1999, on "Future Trends and Current Projects" to "sell" NADCA to
its members. At the conclusion of his presentation, I asked him why if the situation is so rosy
as he presented, that so many companies are going bankrupt and sold. I proceeded to ask him
why NADCA is teaching so many erroneous models. He gave me Mr. Steve Udvardy's
What have your membership dues
done for you today? plagiarise?copyright ©, 2000, by Dr. Bar-Meir

Chapter B. My Relationship with Die Casting Establishment
business card and told me that he has no knowledge of this and that since he cannot judge it,
he cannot discuss it. Was he prepared for my questions or was this merely a spontaneousreaction?
Dear Mr. Baran,
Do you carry Steve Udvardy's business card all the time? Why? Why do you not think it
important to discuss why so many die casting companies go bankrupt and are sold? Is it
not important for us to discuss why there are so many financial problems in the die
casting industry? Don't you want to make die casting companies more profitable? And if
someone tells you that the research sponsored by NADCA is rubbish, aren't you going to
check it? Discuss it with others in NADCA? Don't you care whether NADCA teaches
wrong things? Or is it that you just don't give a damn?
I am sure that it is important for you. You claimed that it is important for you in the
presentation. So, perhaps you care to write an explanation in the next NADCA
magazine. I would love to read it.
Sincerely,
Genick Bar-Meir
Is it all coincidental?
I had convinced Larry Winkler in mid 1997 (when he was still working for Hartzell), to ask
Mr. Udvardy why NADCA continued support for the wrong models (teaching the erroneous
Garber's model and fueling massive grants to Ohio State University). He went to NADCAand talked to Mr. Udvardy about this. After he came back, he explained that they told him
that I didn't approach NADCA in the right way. (what is that?) His enthusiasm thenevaporated, and he continues to say that, because NADCA likes evolution and not revolution,
they cannot support any of my revolutionary ideas. He suggested that I needed to learn to
behave before NADCA would ever cooperate with me. I was surprised and shaken. "What
happened, Larry?" I asked him. But I really didn't get any type of real response. Later (end
of 1997) I learned he had received NADCA's design award. You, the reader, can conclude
what happened; I am just supplying you with the facts.
Several manufacturers of die casting machines, Buler, HPM, Prince, and UBE presented their
products in Minneapolis in April 1999. When I asked them why they do not adapt the new
technologies, with the exception of the Buler, the response was complete silence. And just
Buler said that they were interested; however, they never later called. Perhaps, they lost my
phone number. A representative from one of the other companies even told me something on
the order of "Yeah, we know that the Garber and Brevick models are totally wrong, but we do
not care; just go away-you are bothering us!".
I have news for you guys: the new knowledge is here to stay and if you want to make
the die casting industry prosper, you should adopt the new technologies. You should
make the die casting industry prosper so that you will prosper as well; please do not look at
the short terms as important.
The next issue of the Die Casting Engineer (May/Jun 1999 issue) was dedicated to machineproducts. Whether this was coincidental, you be the judge.
I submitted a proposal to NADCA (November 5, 1996) about Garber/Brevick work (to which
copyright ©, 2000, by Dr. Bar-MeirWhat have your membership dues
done for you today? plagiarism?

I never received a reply). Two things have happened since: I made the proposal(in the
proposal I demonstrate that Brevick's work from Ohio is wrong) 1) publishing of the article by
Bill Walkington in NADCA magazine about the "wonderful research" in Ohio State University
and the software to come. 2)a "scientific" article by EKK. During that time EKK also
advertised how good their software was for shot sleeve calculations. Have you seen any EKK
advertisements on the great success of shot sleeve calculations lately?
Here is another interesting coincidence, After 1996, I sent a proposal to NADCA, the cover
page of DCE showing the beta version of software for calculating the critical slow plunger
velocity. Yet, no software has ever been published. Why? Is it accidental that the author of
the article in the same issue was Bill Walkington.
And after all this commotion I was surprised to learn in the (May/June 1999) issue of DCEmagazine that one of the Brevick group had received a prize (see picture below if I get
NADCA permission). I am sure that Brevick's group has made so much progress in the last
year that this is why the award was given. I just want to learn what these accomplishments
are. put the picture of Bre
For a long time NADCA described the class on the pQ 2 diagram as a "A close mathematical Udva,dl ""' d p " ceguydescription." After I sent the paper and told them about how the pQ 2 diagram is erroneous,
they change the description. Well it is good, yet they have to say that in the past material
was wrong and now they are teaching something else, or are they?
I have submitted five (5) papers to the conference (20 th in Cleveland) and four (4) have beenrejected on the grounds well, you can read the letter yourself:Here is the letter from Mr. Robb.
17 Feb 1999
The International Technical Council (ITC) met on January 20th to review all submittedabstracts. It was at that time that they downselected the abstracts to form the core of
each of the 12 sessions. The Call for Papers for the 1999 Congress and Exposition
produced 140 possible abstracts from which to choose from, of this number aproximately
90 abstracts were selected to be reviewed as final papers. I did recieve all 5 abstracts and
distribute them to the appropriate Congress Chairmen. The one abstract listed in your
acceptance letter is in fact the one for which we would like to review the final paper. The
Congress Chairmen will be reviewing the final papers and we will be corresponding with
all authors as to any changes revisions which are felt to be appropriate.
The Congress Chairmen are industry experts and it is there sole discretion as to which
papers are solicited based on abstract topic and fit to a particular session.
It is unfortunate that we cannot accept all abstracts or papers which are submitted.
Entering an abstract does not constitue an automatic acceptance of the abstract / or finalpaper.
Thank you for your inquiry, and we look forward to reviewing your final paper.
Regards,Dennis J. Robb
NADCA
I must have submitted the worst kind of papers otherwise. How can you explain that only
20% of my papers (1 out of 5) accepted. Note that the other researchers' ratio of acceptanceon their papers is 65%, which means that other papers are three times better than mine.
What have your membership dues
done for you today? plagiarise?copyright ©, 2000, by Dr. Bar-Meir

Chapter B. My Relationship with Die Casting Establishment
Please find here the abstracts and decide if you'd like to hear such topics or not. Guess which
the topic NADCA chose, in what session and on what day (third day).
A Nobel Tangential Runner Design
The tangential gate element is commonly used in runner designs. A novel approach to this
runner design has been developed to achieve better control over the needed performance. The
new approach is based on scientific principles in which the interrelationship between the metal
properties and the geometrical parameters is described.
Vacuum Tank Design Requirements
Gas/air porosity constitutes a large part of the total porosity. To reduce the porosity due to
the gas/air entrainment, vacuum can be applied to remove the residual air in the die. In somecases the application of vacuum results in a high quality casting while in other cases the
results are not satisfactory. One of the keys to the success is the design of the vacuum system,
especially the vacuum tank. The present study deals with what are the design requirements
on the vacuum system. Design criteria are presented to achieve an effective vacuum system.
How Cutting Edge technologies can improve your Process Design
approach
A proper design of the die casting process can reduce the lead time significantly. In this paper
a discussion on how to achieve a better casting and a shorter lead time utilizing these cutting
edge technologies is presented. A particular emphasis is given on the use of the simplified
calculations approach.
On the effect of runner design on the reduction of air entrainment:
Two Chamber Analysis
Reduction of air entrapment reduces the product rejection rate and always is a major concern
by die casting engineers. The effects of runner design on the air entrapment have been
disregarded in the past. In present study, effects of the runner design characteristics are
studied. Guidelines are presented on how to improve the runner design so that less air/gas areentrapped.
Experimental study of flow into die cavity: Geometry and Pressureeffects
The flow pattern in the mold during the initial part of the injection is one of the parameters
which determines the success of the casting. This issue has been studied experimentally.
Several surprising conclusions can be drawn from the experiments. These results and
conclusions are presented and can be used by the design engineers in their daily practice to
achieve better casting.
copyright ©, 2000, by Dr. Bar-MeirWhat have your membership dues
done for you today? plagiarism?

Afterward
At the 1997 NADCA conference I had a long conversation with Mr. Warner Baxter. He told
me that I had ruffled a lot of feathers in NADCA. He suggested that if I wanted to get real
results, I should be politically active. He told me how bad the situation had been in the past
and how much NADCA had improved. But here is something I cannot understand: isn't there
anyone who cares about the die casting industry and who wants it to flourish? If you do care,
please join me. I actually have found some individuals who do care and are supporting my
efforts to increase scientific knowledge in die casting. Presently, however, they are a minority.
I hope that as Linux is liberating the world from Microsoft, so too we can liberate and bring
prosperity to the die casting industry.
After better than a year since my first (and unsent) letter to Steve Udvardy, I feel that there
are things that I would like to add to the above letter. After my correspondence with Paul
Bralower, I had to continue to press them to publish the article about the pQ 2 . This process
is also described in the preceding section. You, the reader, must be the judge of what is really
happening. Additionally, open questions/discussion topics to the whole die casting communityare added.
What happened to the Brevick's research? Is there still no report? And does this type ofresearch continue to be funded?
Can anyone explain to me how NADCA operates?
Is NADCA, the organization, more important than the die casting industry?
What have your membership dues
done for you today? plagiarise?copyright ©, 2000, by Dr. Bar-Meir

Chapter B. My Relationship with Die Casting Establishment
¦ L^. /~\ innn i. r\ d t, « ¦ What have your membership dues , ,.-copyright ©, 2000, by Dr. Bar-Meir , , ' , _ . . . K , 150
done for you today? plagiarism?

APPENDIX C
Density change effects
In this appendix we will derive the boundary condition for phase change with a significant
density change. Traditionally in die casting the density change is assumed to be insignificant
in die casting. The author is not aware of any model in die casting that take this phenomenon
into account. In materials like steel and water the density change isn't large enough or it does
not play furthermore important role. While in die casting the density change play a significant
role because a large difference in values for example aluminum is over 10%. Furthermore, the
creation of shrinkage porosity is a direct consequence of the density change.
A constant control volume 1 is constructed as shown in figure C.l. Solid phase is on the rightside and liquid phase is on the left side. After a small time increment the moved into the the
dashed line at a distance dx. The energy conservation of the control volume reads
The equations (C.l) and (C.2) do not have any restrictions of the liquid movement which has
to be solved separately. Multiply equation (C.l) by a constant hi results in
1 A discussion on the mathematical aspects are left out. If explanation on this point will be asked by readersI will added it.t(C.l)
Analogy the mass conservation for the control volume is
(C.2)
(C3)
151

Chapter C. Density change effects
boundry at t=0
solid
A,
dx
liquid
B,
boundry-after some
time
Figure C.l: The control volume of the phase change
Subtraction equation (C.3) from equation (C.l) yields
d - I p(h - hi) dV = -j A p(h - h l)vi dA + jf kf n dA (C.4)
The first term on the right hand side composed from two contributions: one) from the liquid
side and two) from solid side. At the solid side the contribution is vanished because
p(h — hi)vi is zero due to Vi is identically zero (no movement of the solid, it is a good,ut expiation or question assumption). In the liquid phase the term h — hi is zero (why? ) thus the whole term is
vanished we can write the identity
p(h - h t )vi dA =
where v% is the velocity at the interface.
..ybe the derivation, are too The f i rst term of equation (C.4 ) can be expressed in the term of the c.v. 2 aslong, shorten them?
solid liquid=0
d_dl / p{h - h, Jvi)dV =
p s A 2 (h s - h ( ) - p s Ai{h s - hi) + (¦ ¦ ¦ {hi - hi))dt
, dx= (Ps(h s - hi))— = p s (h s - hi)v n
(C.5)
(C.6)
please note some dimensions will canceled each other out and not enter into equationsssss
copyright ©, 2000, by Dr. Bar-MeirWhat have your membership dues
done for you today? plagiarism?

liquid side contribution is zero since h — hi = and the solid contribution appears only in
transitional layer due to transformation liquid to solid. The second term on right hand side of
equation (C.4) is simply
.dT JA dT dTk—dA = k s —-ki— C.7
A an on an
Thus, equation (C.4) is transformed into
dT dT
p s {h s - hi)v n = k s - h— (C.8)an on
It is noteworthy that the front propagation is about lOpreviously was calculated. Equation
(C.7) holds as long as the transition into solid is abrupt (sharp transition).
Meta For the case of where the transition to solid occurs over temperature range we have
create three zones. Mathematically, it is convenient to describe the the mushy zone
boundaries by two boundary conditions.
End
Meta The creation of voids is results of density changes which change the heat transfer
mechanism from conduction to radiation. The location of the void depends on the
crystallization and surface tension effect, etc. The possibility of the "liquid channels"
and the flow of semi-solid and even solid compensate for this void.
End
Klein's paper
Meta Yet, one has to take into consideration the pressure effect The liquidation temperature
and the latent heat are affected somewhat by the pressure. At pressure between the
atmospheric to typical intensification pressure the temperature and latent heat are
effected very mildly. However, for pressure near vacuum the latent heat and the
temperature are effected more noticeably. 3
End
The velocity of the liquid metal due to the phase change can be related to the front
propagation utilizing the equation (C.2). The left hand side can be shown to be (p s — pi)v n .The right hand side is reduced into only liquid flow and easily can be shown to be pivi.
(p s - pi) v n + pm = o
05-1) = ^ (C9)
where p is the density ratio, p s /pi-
3 I have used Clapyron's equation to estimate the change in temperature to be over 10 degrees (actually about40°[C]). However, I am not sure of this calculations and I had not enough time to check it in the literature. Ifyou have any knowledge and want to save me a search in the library, please drop me a line.
What have your membership dues
done for you today? plagiarise?copyright ©, 2000, by Dr. Bar-Meir

Chapter C. Density change effects
¦ L^. /~\ innn i. r\ d t, « ¦ What have your membership duescopyright ©, 2000, by Dr. Bar-Meir , , ' , _ . . . K , 154
done for you today? plagiarism?

APPENDIX D
Fanno Flow
The flow of air trough the venting system is a flow of compressible substance. There are three
ideal models that can potentionaly discribe the situation.
• The flow of the air/gas is adiabtic i.e. no heat transer is negligible and can be ignored.This is the case where process is very fast and heat transer mechanisms are considerably
slower (see more discusion about dimensionless number in Chapter ??). This kind of isknown as Fanno flow.
• another possiblity is there is an heat transer and the simplist possible case is when this
heat transfer is a constant. The heat transfer is significant in case where there ischemical reactions sometime refered to as combusion. This flow is named on Lard
Reyleigh.
• A case between the two previous case is the isothermal case. The flow is has heat
transfer but is low enogh to keep the temperature constant. This is the case when a gas
flows for a long distance (in order of kilometers). In such cases, the gas temperatue is
equal to sorronding temperature. If the sounding are in uniform temperature (that is
simplist case which we like) is call isothermal case. Mathematicaly, it is the simplistcase 1 .
In die casting, the air/gas flows from the cavity to sourding in very rapid manner. Thissituation is very close the first model we discribed before. Hence, we can assume that for
many of the cases the flow is resinably adiabtic 2 . Therefore, we introduce the Fanno flow andagain in a simplist form.
x l prefere to teach this material first in my casses. The real simplist case is the isontropic flow for which thepressure is constat in const conduct area.
2 in poor design the metal drops flow with the air and solidfied. The heat is relead to the air and the airtemperature is increased. This analysis is much more complicated and depented on the flow. Presently, there
is no model to account for it and to find the error in the assumption of idiabic flow.
155

Chapter D. Fanno Flow
D.l Introdcion
gadd a figure with an element
volume very thin
V///////////////////////////////////////////////////////////A
Figure D.l: Control volume of the gas flow in constant cross section
Consider a gas flows through a conduit with a friction (see Figure D.l. The massconservation for the control volume is
P\V\ = P2V2 (D.l)
The energy conservion (under the consriction of ideabtic flow) reads
To, = T +Vi 2 m v 2 2
= T 2 +2C p o 2C p o
The force acting on the gas is the friction and the momentum conservation reads
-AdP -T w dA = riidV
(D.2)
(D.3)
For simplfy the presentation/footnotenot nessarly for the presentation can be close to circularwe assume the conduit to be a circular therefore,
dA w m-dP + t w = —dV (DA)
Note that is equal to AD. Utilizing the definiation of the firction factor , /„t^ 2 and weobtain the following
l/2pV 2
-dP - pdx(l/2pV 2 ) = ^dV (D.5)
Utilizing the definition of the sound speed one can obtain the following
Converting the exprestion for (dP/P) and for *dV/V in term of the Mach nubmer yeilds
Afdx (1 - M 2 ) dM 2
D fcM 4 (l + ^±M 2(D.7)
copyright ©, 2000, by Dr. Bar-MeirWhat have your membership dues
done for you today? plagiarism?156

Section D.1. Introdcion
Intergating last equation yeild
Dj x
11- M 2 fc + 1 ^M 2
The results of this equation are ploted in Figure ??
Figure D.2: Fanno flow as a function of ^J ±
n __ What have your membership dues . . . , ,-. D ¦157 , , copyright ©, 2000, by Dr. Bar-Meir
done for you today? plagiarise?

Chapter D. Fanno Flow
¦ L^. /~\ innn i. r\ d t, « ¦ What have your membership dues , _„copyright ©, 2000, by Dr. Bar-Meir , , ' , _ . . . K , 158
done for you today? plagiarism?

APPENDIX E
Reference
159

Chapter E. Reference
¦ u» innn u n d m ¦ What have your membership duescopyright ©, 2000, by Dr. Bar-Meir , , 160
done for you today? plagiarism?

BIBLIOGRAPHY
ASM1987. Metals Handbook , volume 13. ASM, Metals Park, Ohio.
Backer, G. and Sant, F.1997. Using Finite Element Simulation for the Development of Shot
Sleeve Velocity Profiles . In NADCA 19 th Congress and exposition, Minneapolis,Minnesota, paper T97-014.
Bar-Meir, G. 1995a. On gas/air porosity in pressure die casting . PhD thesis, University ofMinnesota.
Bar-Meir, G. 1995b. Analysis of mass transfer processes in the pore free technique. Journal
of Engineering Materials and Technology , 117:215 - 219.
Bar-Meir, G., Eckert, E., and Goldstein, R. J. 1996. Pressure die casting: A model of
vacuum pumping. Journal of Engineering for Industry , 118:001 - 007.
Bar-Meir, G., Eckert, E. R. G., and Goldstein, R. J. 1997. Air venting in pressure die
casting. Journal of Fluids Engineering , 119:473 - 476.
Bar-Meir, G. and Winkler, L.1994. Accurate pQ 2 Calculations . Die Casting Engineer ,No. 6:26 - 30. November - December.
Belanger, J. M.1828. Essai sur la solution numerique de quelques problemes, mouvement
permanent des eaux courantes. Paris, France.
Bochvar, A., A., Notkin, E., M., Spektorova, S. I., and Sadchikova, N.1946. The Study of
Casting Systems by Means of Models. Izvest. Akad. Nauk U.S.S.R. (Bulletin of the
Academy of Sciences of U.S.S.R) , pages 875-882.
Branch, H. L.1958. Hydraulic Design of Stilling Basins and Bucket Energy Dissipatiors .
U.S. Bureau of Reclamation, Engineering Monograph 25, Denver, Colorado.
Brevick, J. R., Armentrout, D. J., and Chu, Y. -L.1994. Minimization of entrained gas
porosity in aluminum horizontal cold chamber die castings . Transactions of
NAMRI/SME , 12:41-46.
161

BIBLIOGRAPHY
Cocks, D. L.1986. DCRF Recommended Procedures: Metal Flow Predictor System.
American Die Casting Institute, Inc., Des Plaines, Illinois.
Cocks, D. L and Wall, A. J. 1983. Technology transfer in the united kingdom: Progress
and prospects. In Transactions 12 th International SDCE, Minneapolis, Minnesota, paperG-T83-074.
Davey, K. and Bounds, S.1997. Modeling the pressure die casting process using boundary
and finite element methods. Journal of material Processing Technology, 63:696-700.
Davis, A. J. 1975. Effects of the relationship between molten metal flow in feed systems and
hydraulic fluid flow in die casting machines. In Transactions 8 th International SDCE, St.Louis, paper G-T75-124.
Draper, A. B.1967. Effect of vent and gate areas on the porosity of die casting.
Transactions of American Foundrymen's Society , 75:727-734.
Eckert, E.1989. Similarity analysis applied to the Die Casting Process . Journal of
Engineering Materials and Technology , 111:393-398. No. 4 Oct.
El-Mehalawi, M., Liu, J., and Miller, R. A. 1997. A cost estimating model for die cast
products. In NADCA 19 th Congress and exposition, Minneapolis, Minnesota, paperT97-044.
Fairbanksl959. Hydraulic HandBook. Mores and Co., Kansas city, Kansas.
Fondse, H., Jeijdens, H., and Ooms, G.1983. On the influence of the exit conditions on the
entrainment rate in the development region of a free, round, turbulent jet. Applied
Scientific Research, pages 355-375.
Garber, L. W.1982. Theoretical analysis and experimental observation of air entrapment
during cold chamber filling. Die Casting Engineer , 26 No. 3:33.
Hansen, Arthur, G.1967. Fluid Mechanics. John Wiley and Sons, Inc., New York, New York.
Henderson, F. M.1966. Open Channel Flow. Macmillan Publishing Co., New York, NewYork.
Horacio, A. G. and Miller, R. A. 1997. Die casting die deflections: computer simulation of
causes and effects. In NADCA 19 th Congress and exposition, Minneapolis, Minnesota,paper T97-023.
Hu, H. and Argyropoulos, S. A. 1996. Mathematical modeling of solidification and melting:
a review . Modeling Simulation Mater. Sci. Eng. , 4:371-396.
Hu, J., Ramalingam, S., Meyerson, G., Eckert, E., and Goldstein, R. J. 1992. Experiment
and computer modeling of the flows in pressure die casting casings. In ASME/CIEDesign, San Francisco, California.
Kami, Y.1991. Selection of process variables for die casting . PhD thesis, Ohio State
University.
Kim, C. M. and Sant, F. J. 1995. An application of 3-D solidification analysis to large
complex castings. In 2 nd Pacific rim international conference on modeling of castingand solidification, Singapore.
copyright ©, 2000, by Dr. Bar-MeirWhat have your membership dues
done for you today? plagiarism?

BIBLIOGRAPHY
Lindsey, D. and Wallace, J. F.1972. Effect of vent size and design, lubrication practice,
metal degassing, die texturing and filling of shot sleeve on die casting soundness. In
Transactions 7 th SDCE International Die Casting Congress, Chicago, paper 10372.
Madsen, P. and Svendsenl983. Turbulent bores and hydraulic jumps. Journal of FluidMechanics, 129:1-25.
Maier, R. D.1974. Influence of liquid metal jet character on heat transfer during die
casting. PhD thesis, Case Western Reserve University. Engineering, metallurgy.
Minaie, B., Stelson, K., and Voller, V. R.1991. Analysis and flow patterns and solidification
phenomena in die casting processes . J. Eng. Mech. Technology. A5ME , 113:296-302.
Nguyen, T. and Carrig, J. 1986. Water Analogue Studies of Gravity Tilt Casting Copper
Alloy components. AFS Trans , pages 519-528.
Osborne, M. A., Mobley, C. E., Miller, R. A., and Kallien, L. H.1993. Modeling of die
casting processes using magmasoft. In NADCA 17 th Congress and exposition,Cleveland, Ohio, paper T93-032.
Pao, R. H. F.1961. Fluid Mechanics. John Wiley and Sons, Inc., New York, New York.
Rajaratnam, N.1965. The hydraulic jump as a wall jet. Journal of Hydraulic Div. ASCE,
pages 107-131. 91 (HY5).
Sachs, B.1952. An analytical study of the die casting process. PhD thesis, Columbia
University.
Shapiro, A. H.1953. The Dynamics and thermodynamics of Compressible Fluid Flow ,
volume I. John Wiley and Sons, New York.
Stuhrke, W. F. and Wallace, J. F.1966. Gating of die castings. Transactions of American
Foundrymen's Society , 73:569-597.
Swaminathan, C. R. and Voller, V. R.1993. On the Enthalpy Method. Int J. Num. Meth.
Heat Fluid Flow , 3:233-244.
Thome, M. and Brevick, J. R.1995. Optimal slow shot velocity profiles for cold chamber
die casting. In NADCA Congress and exposition, Indianapolis, Indiana, paper T95-024.
Veinik, A. 1.1962. Theory of special casting method . ASME, New York.
Veinik, A. 1.1966. Thermodynamic factors in metal injection: effect of friction on gas
content and quality. In Transactions 4 th SDCE International Die Casting Exposition &Congress, Cleveland, Ohio, paper 103.
Viswanathan, S., Brinkman, C, Porter, W. D., and Purgert, R. M.1997. Production of
A357 motor mount bracket by the metal compression forming process. In NADCA 19 thCongress and exposition, Minneapolis, Minnesota, paper T97-121.
Wygnanski, I. and Champan, F. H.1973. The origin of puffs and slugs and the flow in a
turbulent slug. J. Fluid Mechanics , pages 281-335.
What have your membership dues
done for you today? plagiarise?copyright ©, 2000, by Dr. Bar-Meir