Embed Size (px)
Citation preview

Chris Wagner, P.E.FHWA Resource CenterAtlanta, [email protected]
Fundamental to economic growth and quality of lifePavement design is critical for long lasting and economical pavements
0
500,000
1,000,000
1,500,000
2,000,000
2,500,000
3,000,000
3,500,000
0
2000
4000
6000
8000
10000
12000
14000
16000
1920 1930 1940 1950 1960 1970 1980 1990 2000 2010 2020
Billi
on D
olla
rs
GDP (Billions, $)VMT (Million Miles)
Million M
iles Traveled
World War II
Roman RoadsTelford PavementsMacadam PavementsGerman AutobahnUS Interstate SystemChina’s highway expansionAASHTO Road TestMechanistic Empirical Design◦ IlliSlab◦ Asphalt ME procedures◦ DARWin -ME
http://training.ce.washington.edu/wsdot/

Roman Roads◦ 312 B.C.
Source: www.asphaltwa.com
McAdam Pavements
John McAdam1756 - 1836
“Regardless of the thickness of the structure many of the roads in Great Britain deteriorated rapidly when the subgrade was saturated.”
Installation of Lean Concrete Base material

0
5000
10000
15000
20000
25000
30000
35000
40000
45000
50000
1988
1989
1990
1991
1992
1993
1994
1995
1996
1997
1998
1999
2000
2001
2002
2003
2004
2005
2006
2007
2008
2009
2010
2011
High
way
Mile
sUS Interstate:46,876 Miles
Grand Island, Nebraska
• 1956 ◦ President Eisenhower
• Funded by Gas Taxes ◦ ~ $38 Billion / Yr
• Responsible for NHS◦ Interstate◦ US Routes◦ 46,876 miles

Road Test one – MD 1950◦ Concrete PavementWASHO Road Test, Idaho 1953-54◦ Flexible Pavements
“Grand-daddy” of major road tests◦ 1956-1960◦ Studied both pavements
and bridges◦ $27 million (1956 $)Long lasting effects in pavement engineeringCornerstone of pavement design
Ottawa, IL on future I-80 alignment“Representative” soil and climateCooperation of host stateFlexible and rigid pavements and bridges
Statistically based experimental design to isolate variablesFlexible pavements◦ Surface, base, and subbase
thickness◦ 100 to 160 ft long◦ 468 total sectionsRigid pavements◦ Reinforcing, slab
and base thickness◦ 120 to 240 ft long (all doweled joints)◦ 368 total sections

To determine relationships between axle loads and pavement performanceTo determine effects of axle and vehicle loads on bridgesTo conduct special studies (base types, paved shoulders, fatigue, tire pressures, etc)To provide a record of the type and extent of effort/materials to maintain sectionsTo develop test instrumentation, test procedures, graphs, charts, and formula helpful to highway design and evaluation
1956 to 1958Highly controlledSpecifications based on prevailing SHA practices
Concrete Paving
Asphalt Paving
Trucks driven by U.S. Army Transportation Corps
◦ Initially 6 day schedule (18 hours, 40 minutes)
◦ Later changed to 7 day (19 hours, 5 minutes)
◦ Three rotating driving schedules (7.5 hours per driver each day)
“Take all the time you want as long as you are off the road when the trucks are back in service”—to field staff inspecting pavement conditions

Flexible Pavements◦ Profile◦ Roughness◦ Cracking◦ Patching◦ Rut Depth
Rigid Pavements◦ Profile◦ Cracking◦ Patching ◦ Spalling◦ Joint/Crack Faulting
Profilometer
Benkelman Beam
GM Skid Trailer
Introduced as way of measuring pavement performance and defining “failure”Correlations developed to estimate panel rating serviceability based on observed distress, e.g. for flexible pavements:
5.0
4.0
3.0
2.0
1.0
0.0
Very Good
Good
Fair
Poor
Very Poor
FF PCRDSVPSI +−−+−= 01.0)(38.1)1(log91.103.5 2
Serviceability-performance conceptPavement design modelsLoad equivalency factorsRecognition of variability in construction and need for statistical samplingDemonstration of statistically based experimental designs and statistically based modelingDevelopment and implementation of new performance monitoring equipmentFramework for pavement and asset management
One subgrade typeOne environmentOnly 2 years of service◦ Limited truck traffic◦ Limited environmental effectsOne HMA mixOne PCC mix1950s materials & paving technology
These factors limit the “inference space,” not the validity of the results
A-6 / A-7-6 (Clay)Poor Drainage
(AASHO, 1961)
“It was recognized that other models… could lead to correlation with subjective ratings just as good or perhaps even better than the correlation obtained with [the AASHO] model. ”—1962 AC Pavement Conference

“This is my third road test and if I don’t get it right this time they’ll fire me”—Having also served at Hybla Valley and WASHO Road Tests
“Well over half of the [rigid pavement] sections under traffic exhibited very little change in condition during the two years of traffic testing”—1962 St. Louis Proceedings
“…we aim to explore models for long time pavement performance that will bring in some of the physical parameters that are considered basic to the explanation of pavement performance.”—1962 AC Pavement Conference
“The Asphalt Institute is fully aware of the significant contributions which have been made and, just as important, which will be made by this Project to the highway engineer.”—1962 St. Louis Proceedings
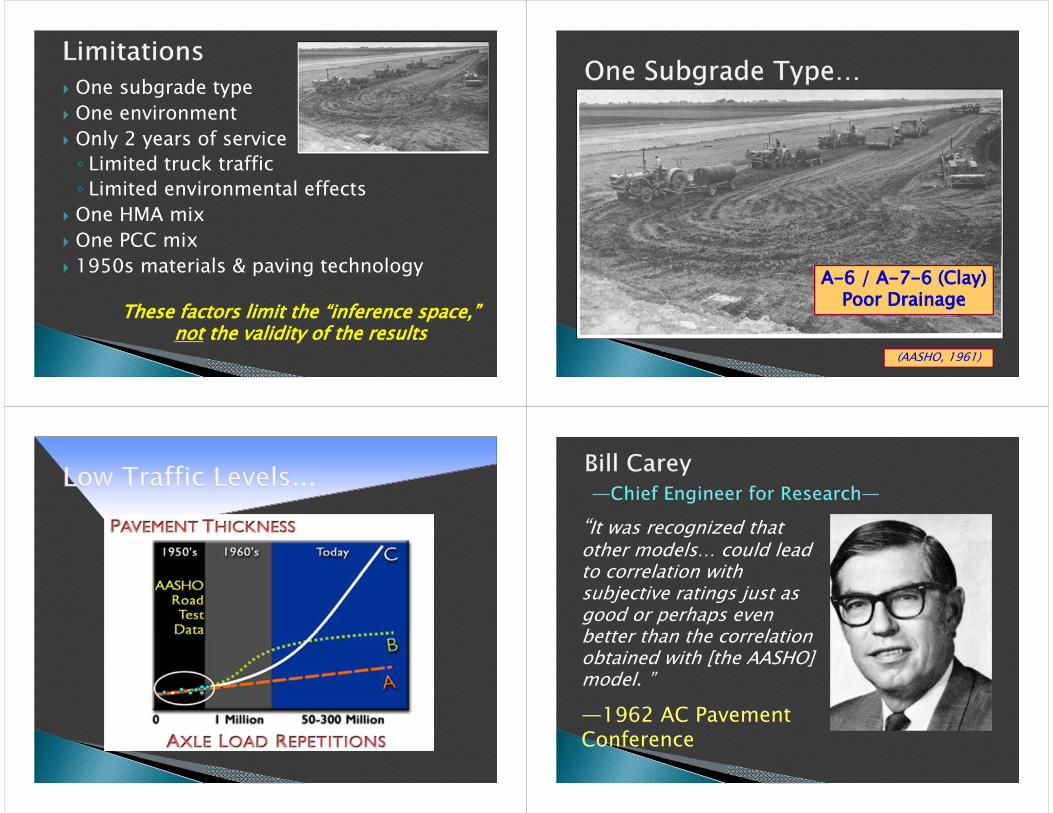
1993 Version(AASHTO, 1993)
Mr. Fred Finn
• Fundamental Materials Inputs• Traffic Loadings• Climatic Considerations• Calibrated to research grade
pavement sections
Available December
2010
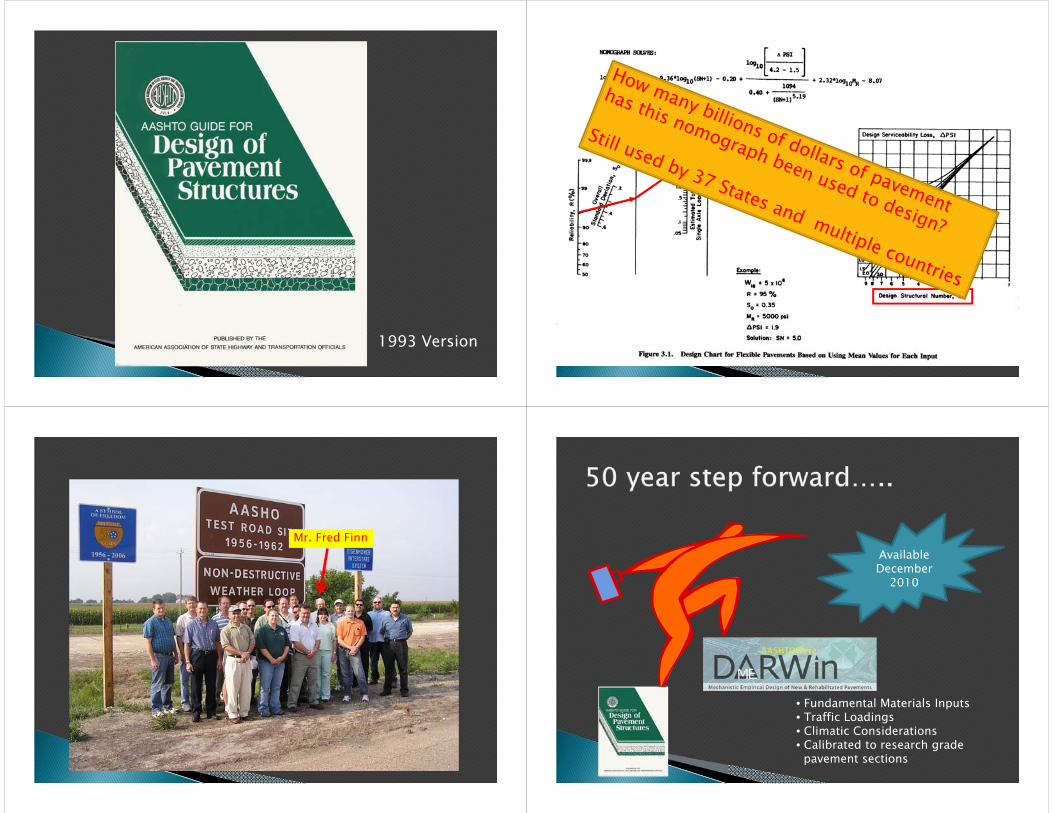
Climate Inputs
EICM
Material Properties
Transfer Functions
Predicted Performance Mechanistic Analysis
Traffic
For rigid pavementsISLAB2000⎯Finite Element Model (FEM) program
For flexible pavementsJULEA⎯Linear elastic layered analysis program
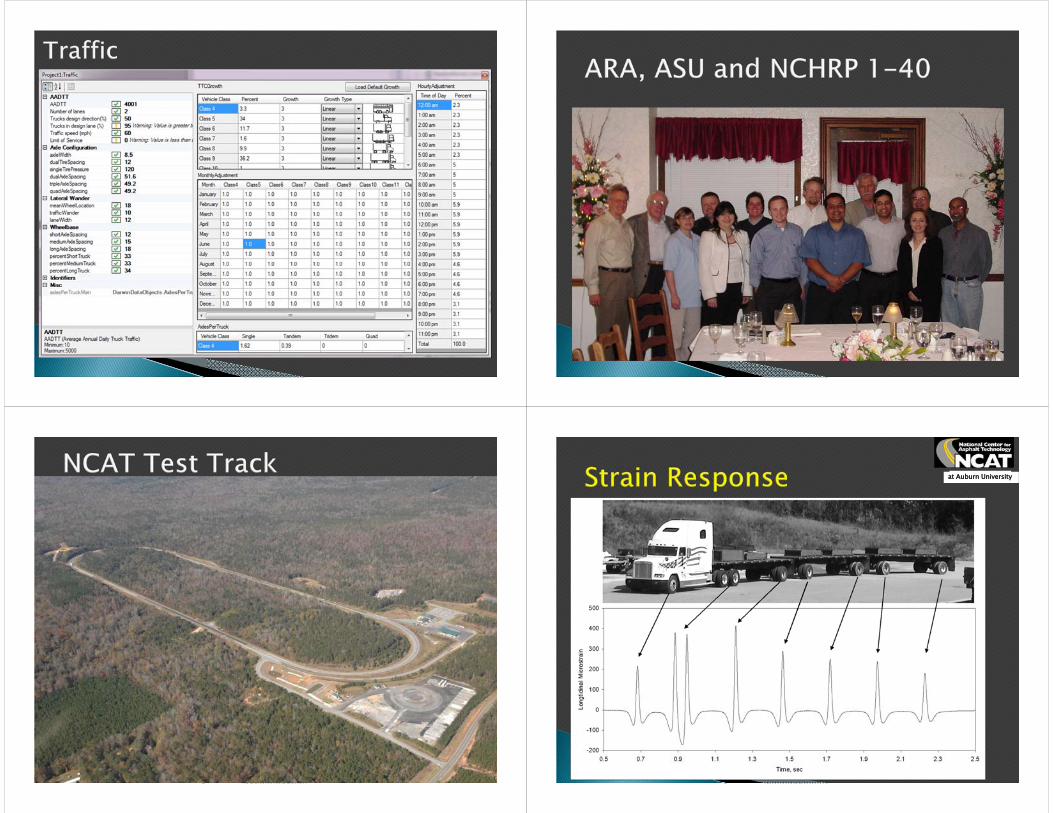
at Auburn University
at Auburn University
0.0
2.0
4.0
6.0
8.0
10.0
12.0
14.0
11/9
/200
612
/9/2
006
1/8/
2007
2/7/
2007
3/9/
2007
4/8/
2007
5/8/
2007
6/7/
2007
7/7/
2007
8/6/
2007
9/5/
2007
10/5
/200
711
/4/2
007
12/4
/200
71/
3/20
082/
2/20
083/
3/20
084/
2/20
085/
2/20
086/
1/20
087/
1/20
087/
31/2
008
Date
Rut
Dep
th, m
m
0.E+
00
1.E+
06
2.E+
06
3.E+
06
4.E+
06
5.E+
06
6.E+
06
7.E+
06
8.E+
06
ESALs
S11MEPDG
at Auburn University
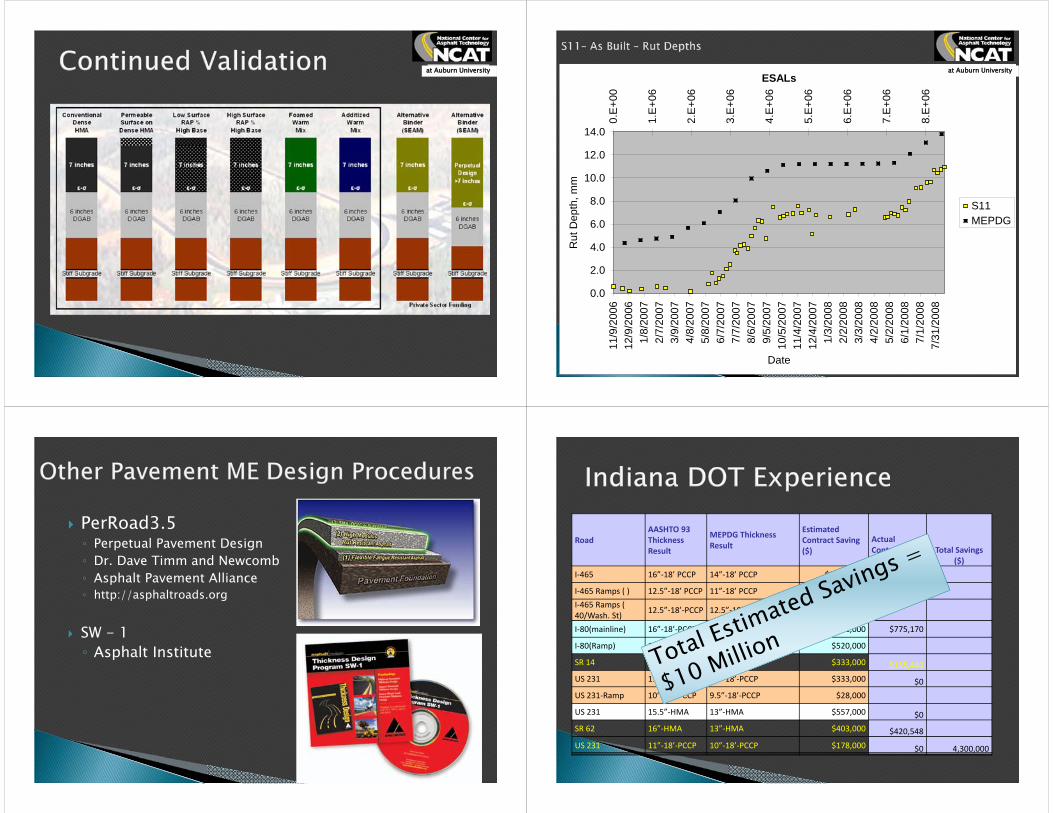
PerRoad3.5◦ Perpetual Pavement Design◦ Dr. Dave Timm and Newcomb ◦ Asphalt Pavement Alliance◦ http://asphaltroads.org
SW - 1◦ Asphalt Institute
PerRoad3.5◦ Perpetual Pavement Design◦ Dr. Dave Timm and Newcomb ◦ Asphalt Pavement Alliance◦ http://asphaltroads.org
SW - 1◦ Asphalt Institute
RoadAASHTO 93 Thickness Result
MEPDG Thickness Result
Estimated Contract Saving ($)
Actual Contract Saving ($)
Total Savings ($)
I‐465 16”‐18’ PCCP 14”‐18’ PCCP $1,475,000
I‐465 Ramps ( ) 12.5”‐18’ PCCP 11”‐18’ PCCP $112,000 $1,000,000I‐465 Ramps ( 40/Wash. St) 12.5”‐18’‐PCCP 12.5”‐18’PCCP $0
I‐80(mainline) 16”‐18’‐PCCP 14”‐18’‐PCCP $361,000 $775,170
I‐80(Ramp) 12”‐18’‐PCCP 10.5”‐18’‐PCCP $520,000
SR 14 15”‐HMA 13.5”‐HMA $333,000 $155,440US 231 11”‐18‐PCCP 10”‐18’‐PCCP $333,000 $0US 231‐Ramp 10”‐18’‐PCCP 9.5”‐18’‐PCCP $28,000
US 231 15.5”‐HMA 13”‐HMA $557,000 $0SR 62 16”‐HMA 13”‐HMA $403,000 $420,548US 231 11”‐18’‐PCCP 10”‐18’‐PCCP $178,000 $0 4,300,000

Pavement design is not perfect…..BUT;
Were moving toward a more fundamental and structured platform for continuous improvement.