Embed Size (px)
Citation preview
Developing Safety Plans
Adam LarsenSafety Engineer
Federal Highway AdministrationTribal Transportation Program
Adam LarsenTTP Safety Engineer & Tribal CoordinatorFederal Highway Administration360-619-7751, [email protected]
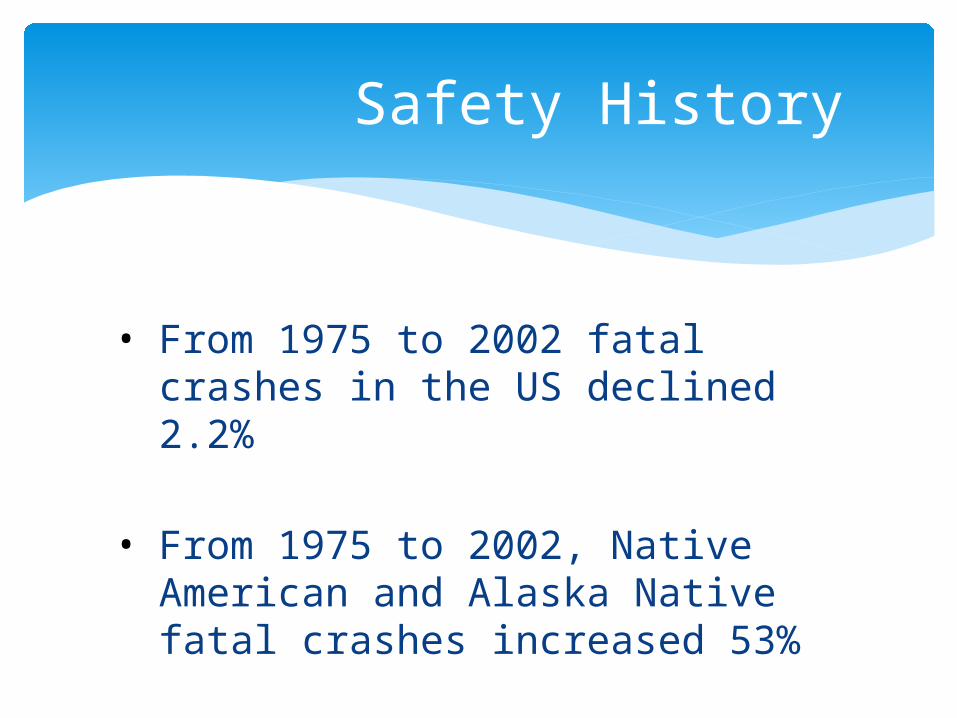
• From 1975 to 2002 fatal crashes in the US declined 2.2%
• From 1975 to 2002, Native American and Alaska Native fatal crashes increased 53%
Safety History
Safety History
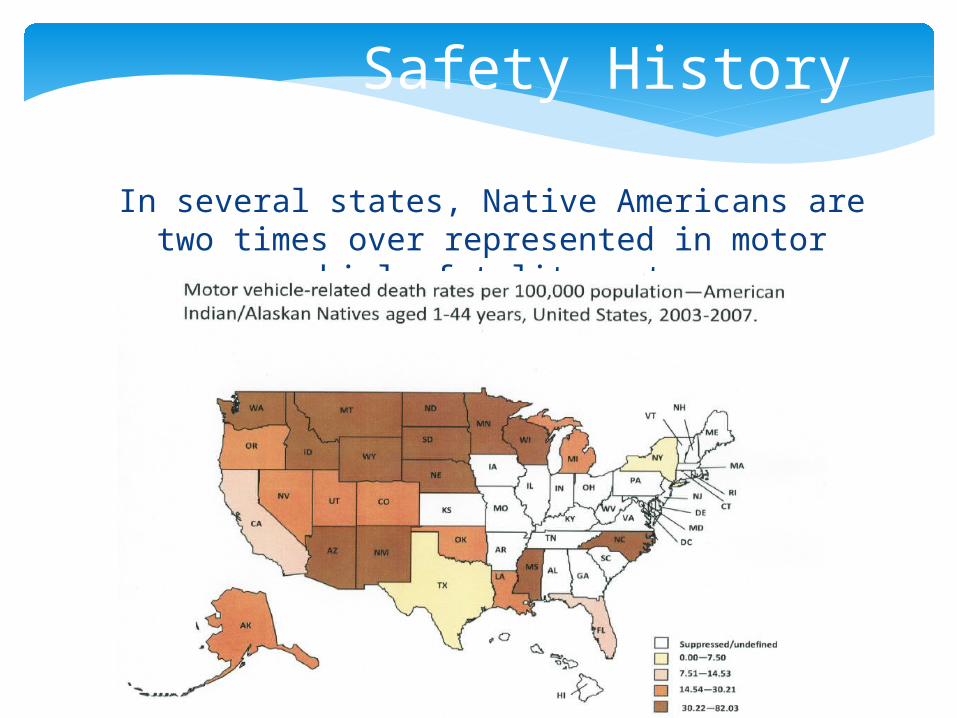
In several states, Native Americans are two times over represented in motor vehicle
fatality rates
Safety History
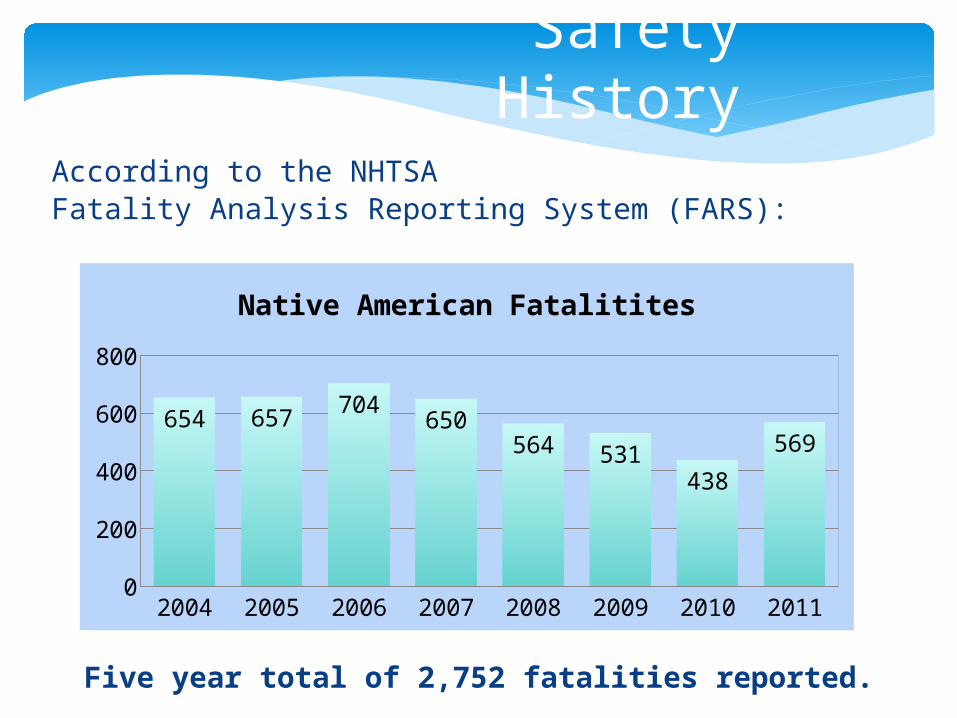
According to the NHTSA Fatality Analysis Reporting System (FARS):
Five year total of 2,752 fatalities reported.
2004 2005 2006 2007 2008 2009 2010 20110
100200300400500600700800
654 657704
650564 531
438
569
Native American Fatalitites
Safety History
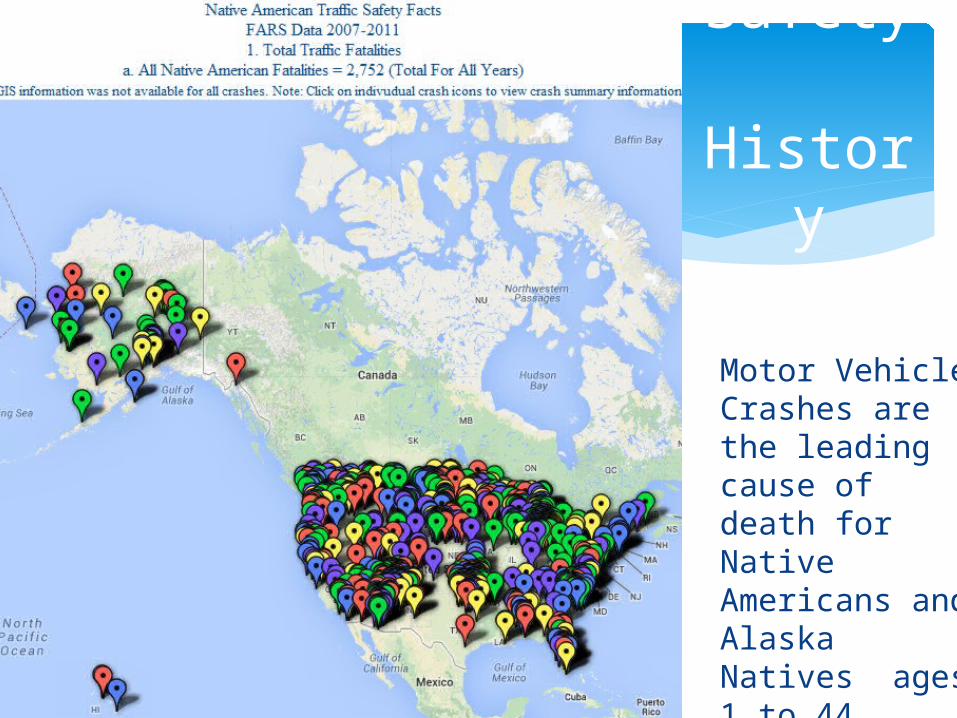
Motor Vehicle Crashes are the leading cause of death for Native Americans and Alaska Natives ages 1 to 44.
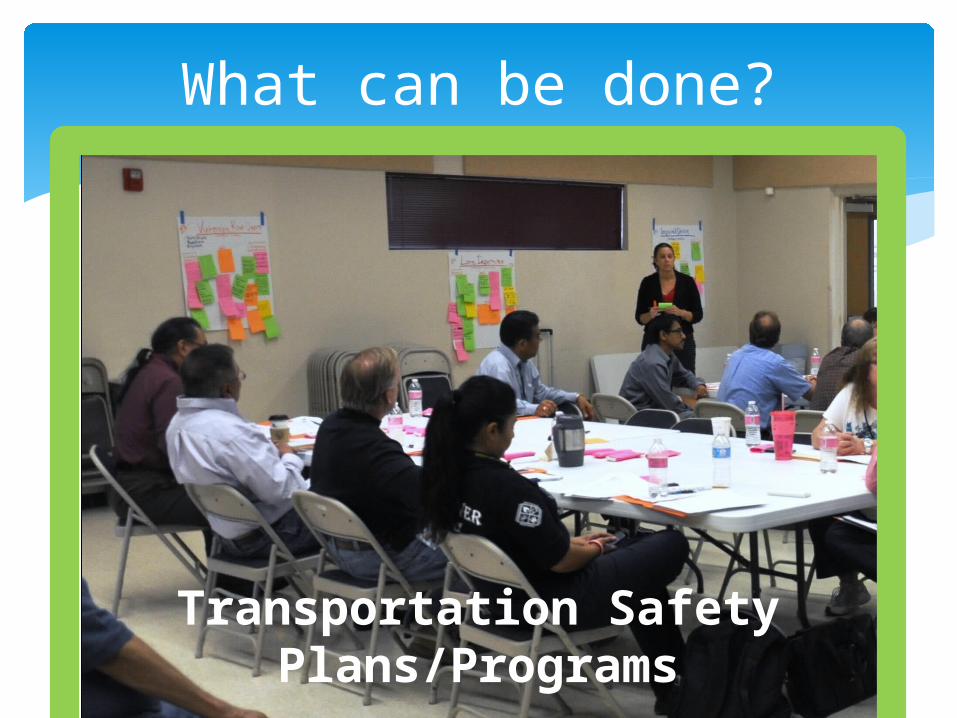
Transportation Safety Plans/Programs
What can be done?
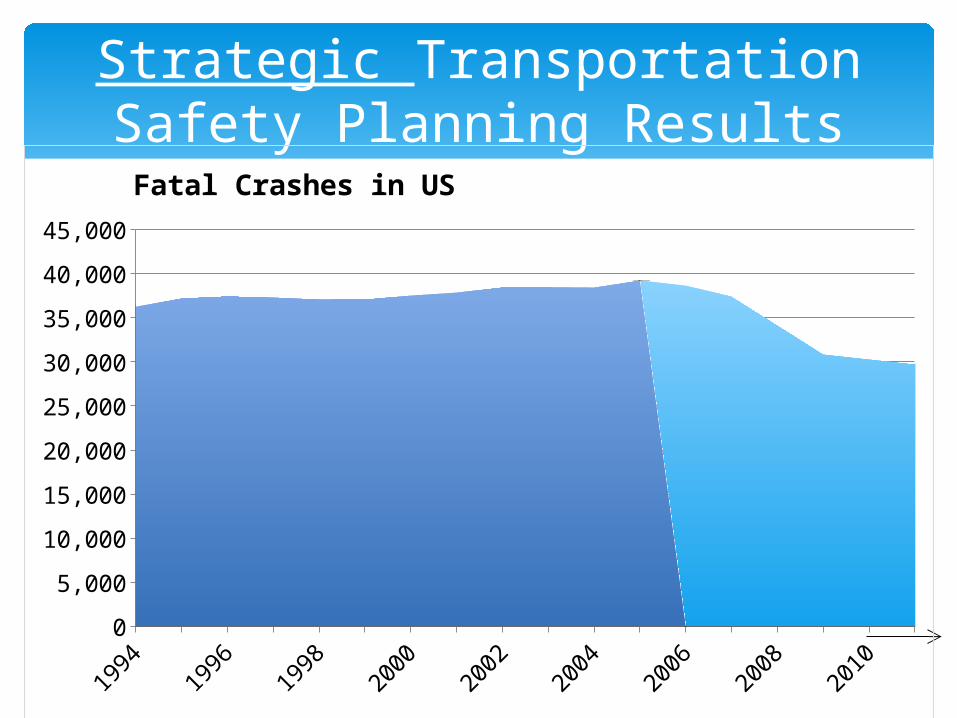
Strategic Transportation Safety Planning Results
StateSHSP
Required
1994
1995
1996
1997
1998
1999
2000
2001
2002
2003
2004
2005
2006
2007
2008
2009
2010
2011
0
5,000
10,000
15,000
20,000
25,000
30,000
35,000
40,000
45,000
Fatal Crashes in US
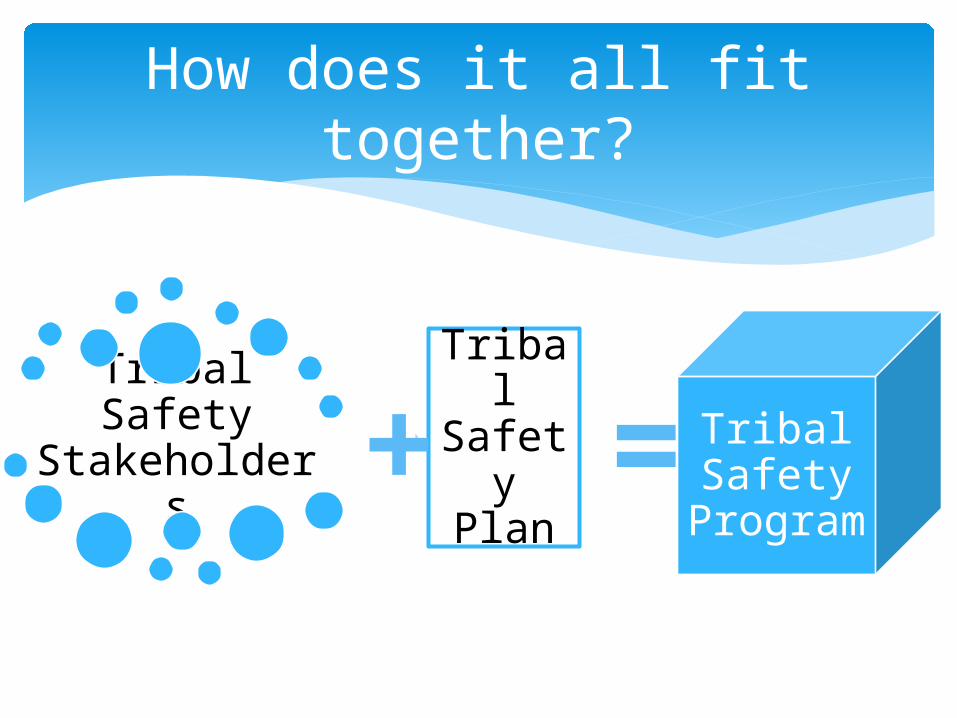
How does it all fit together?
Tribal Safety Stakeholders
Tribal Safety Plan
Tribal Safety
Program+ =
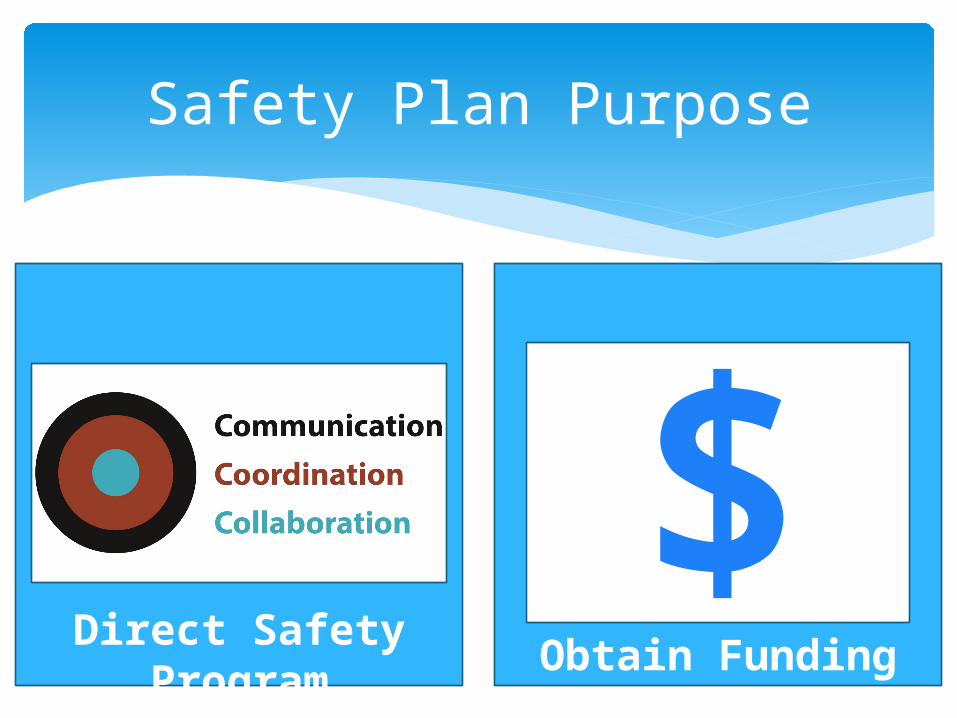
Obtain FundingDirect Safety
Program
Safety Plan Purpose
$
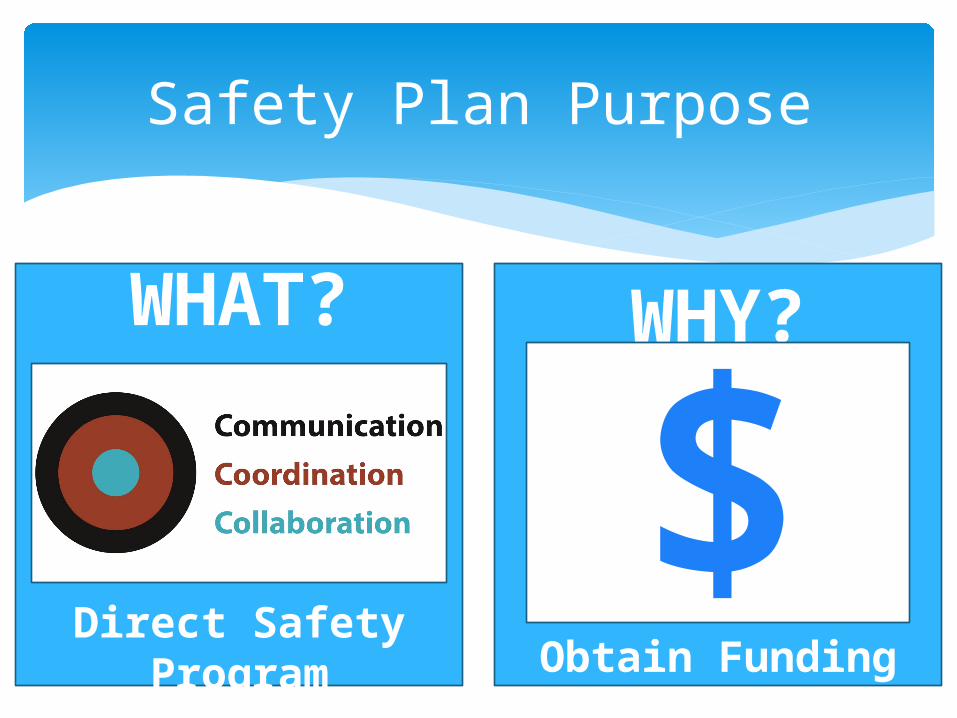
WHY?
Obtain Funding
WHAT?
Direct Safety Program
Safety Plan Purpose
$
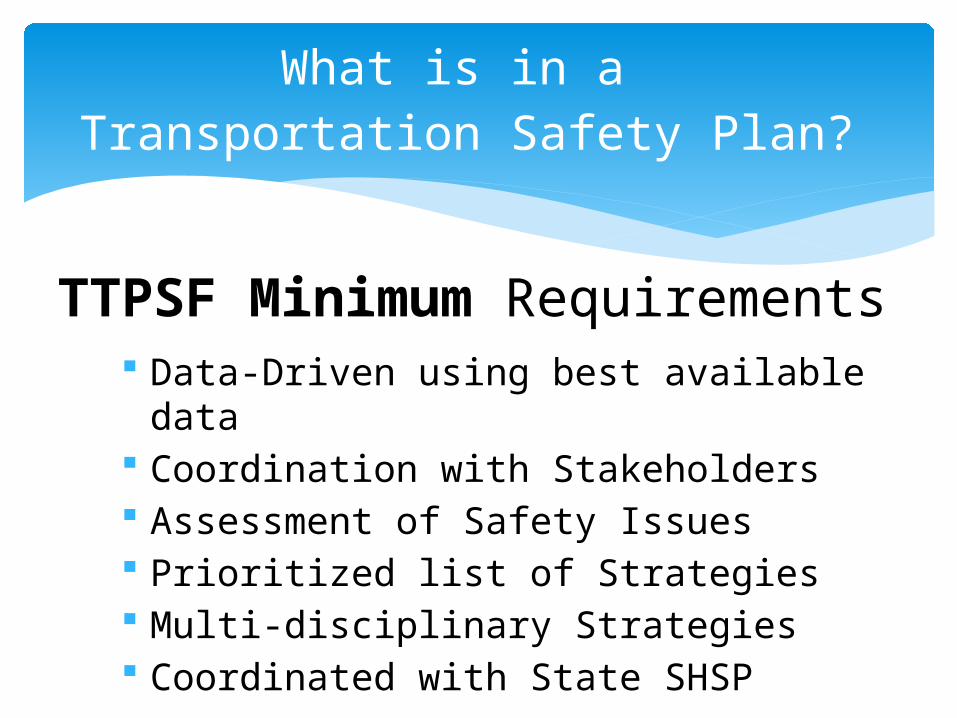
TTPSF Minimum Requirements Data-Driven using best available data Coordination with Stakeholders Assessment of Safety Issues Prioritized list of Strategies Multi-disciplinary Strategies Coordinated with State SHSP
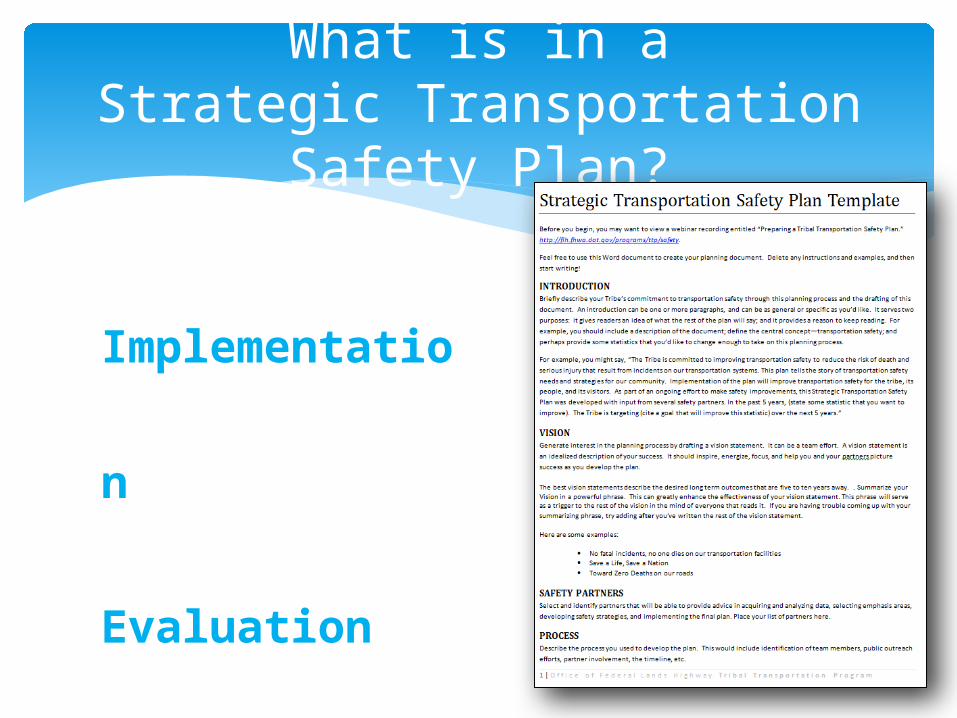
What is in a Transportation Safety Plan?
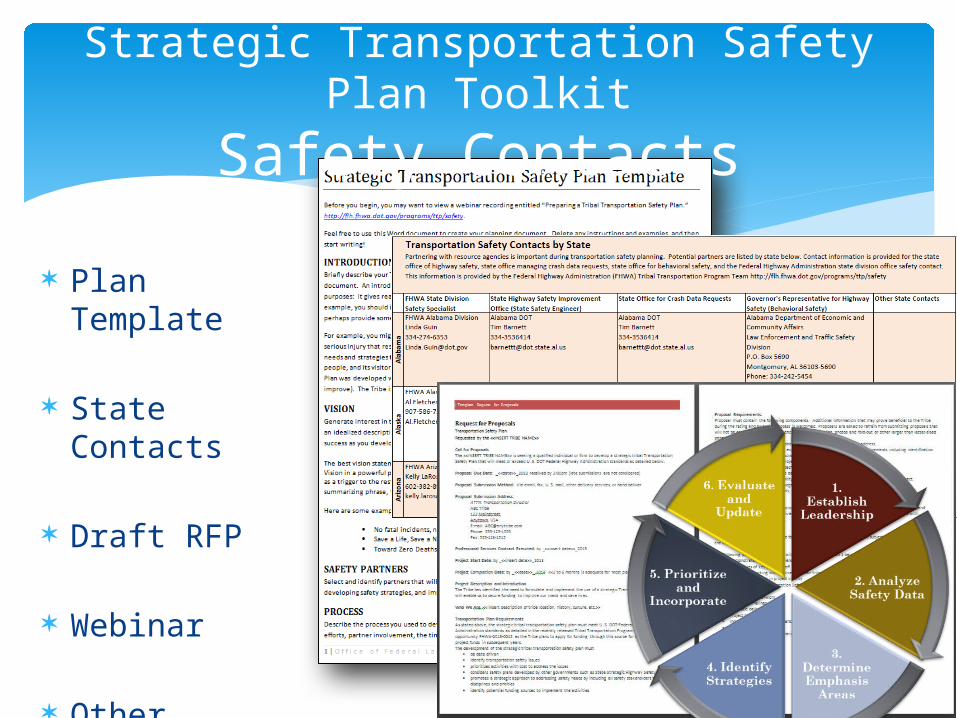
Plan Template
State Contacts
Draft RFP
Webinar
Other Resources
Strategic Transportation Safety Plan Toolkit
Safety Contacts
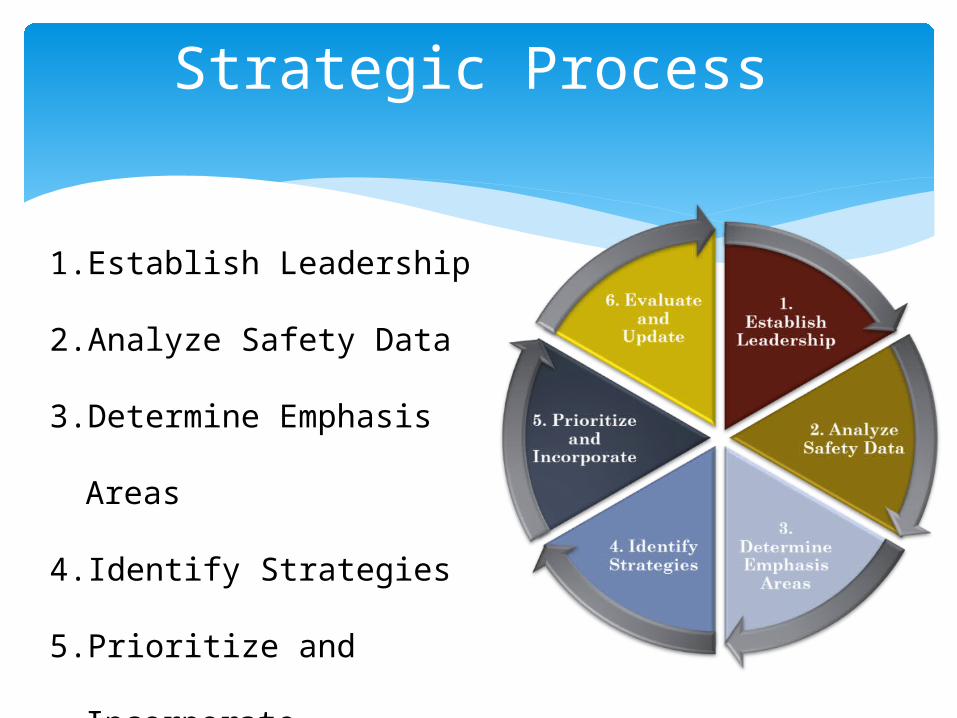
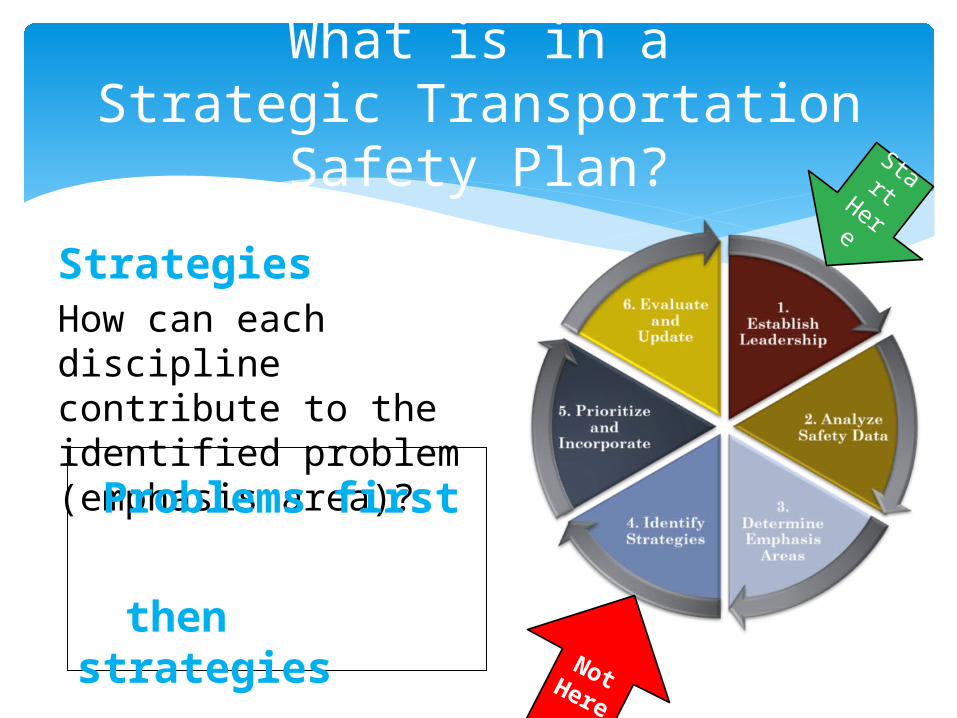
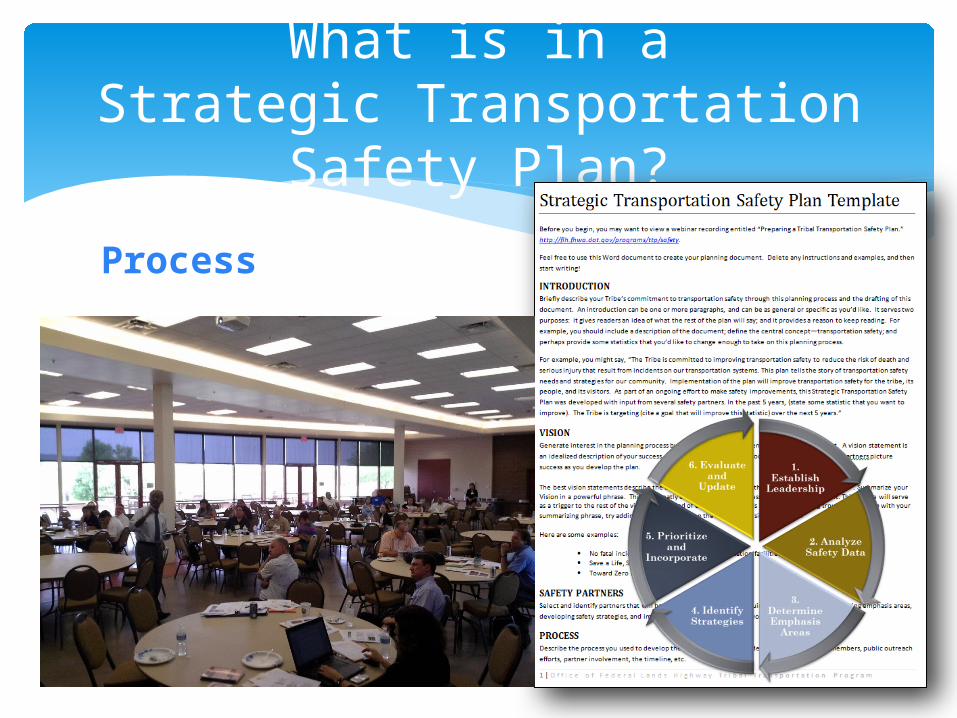
Strategic Process
1. Establish Leadership
2. Analyze Safety Data
3. Determine Emphasis Areas
4. Identify Strategies
5. Prioritize and Incorporate
6. Evaluate and Update
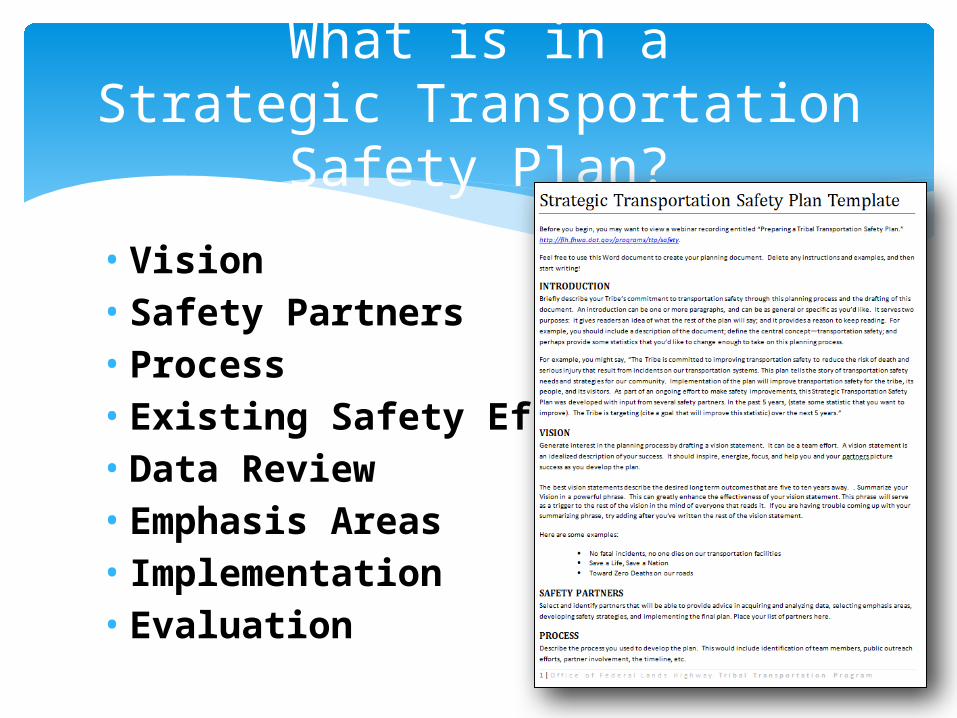
• Vision• Safety Partners• Process• Existing Safety Efforts• Data Review• Emphasis Areas• Implementation• Evaluation
What is in aStrategic Transportation Safety
Plan?

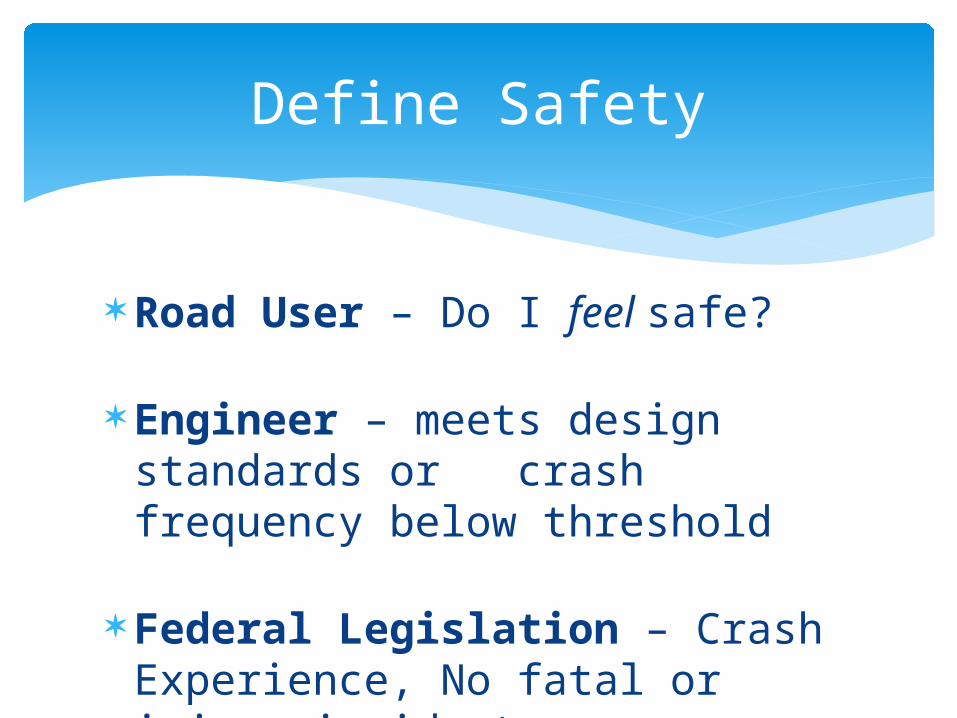
Road User – Do I feel safe?
Engineer – meets design standards or crash frequency below threshold
Federal Legislation – Crash Experience, No fatal or injury incidents
Define Safety
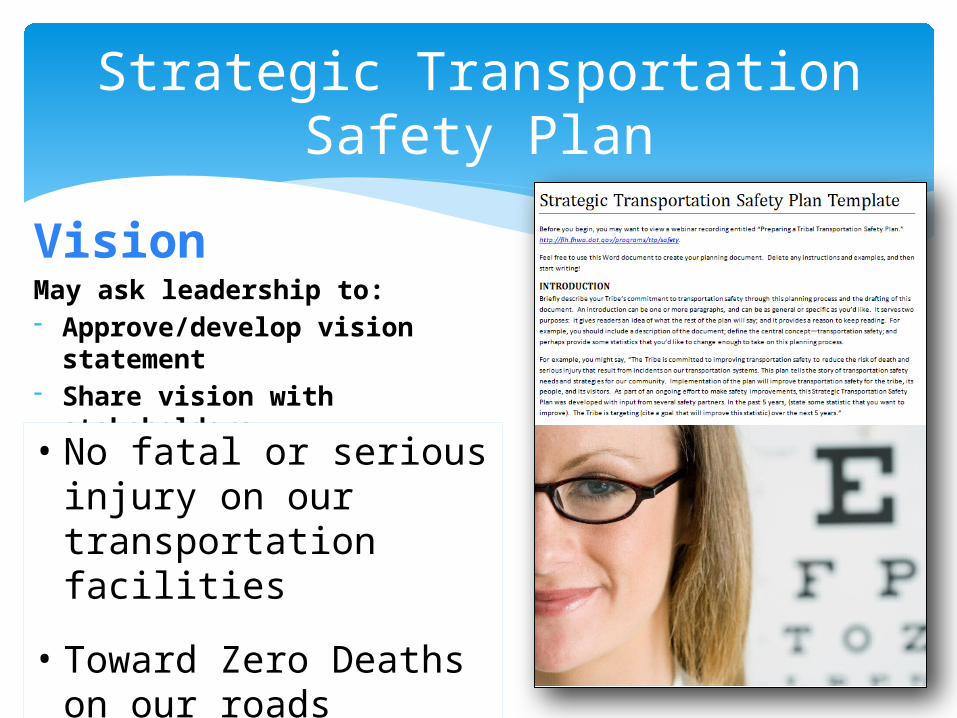
VisionMay ask leadership to:- Approve/develop vision statement- Share vision with stakeholders
Strategic Transportation Safety Plan
• No fatal or serious injury on our transportation facilities
• Toward Zero Deaths on our roads
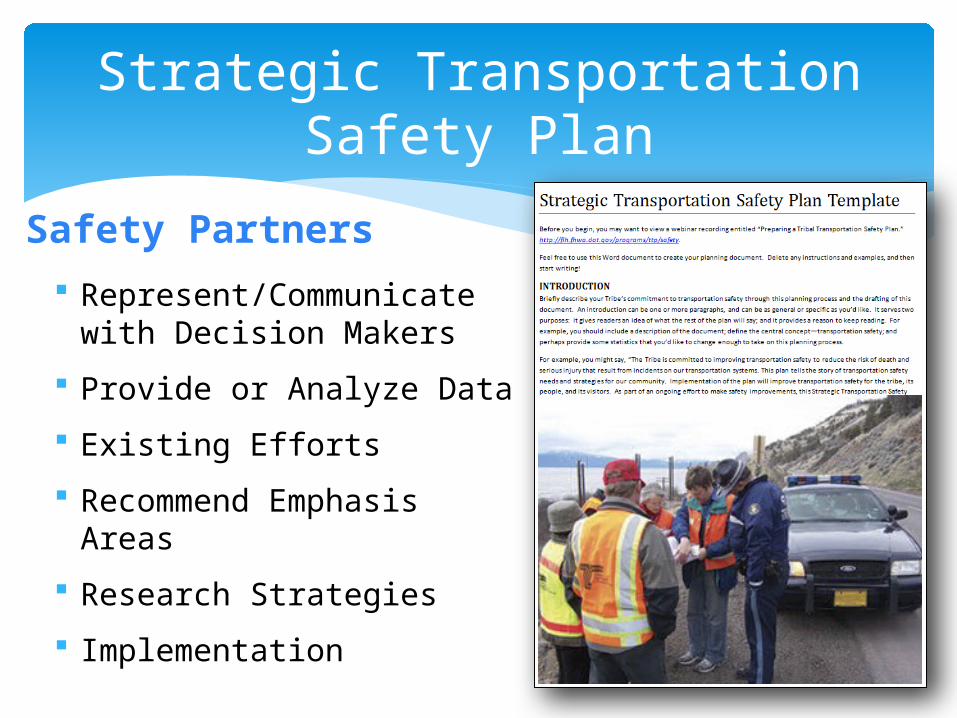
Safety Partners
Represent/Communicate with Decision Makers
Provide or Analyze Data
Existing Efforts
Recommend Emphasis Areas
Research Strategies
Implementation
Strategic Transportation Safety Plan
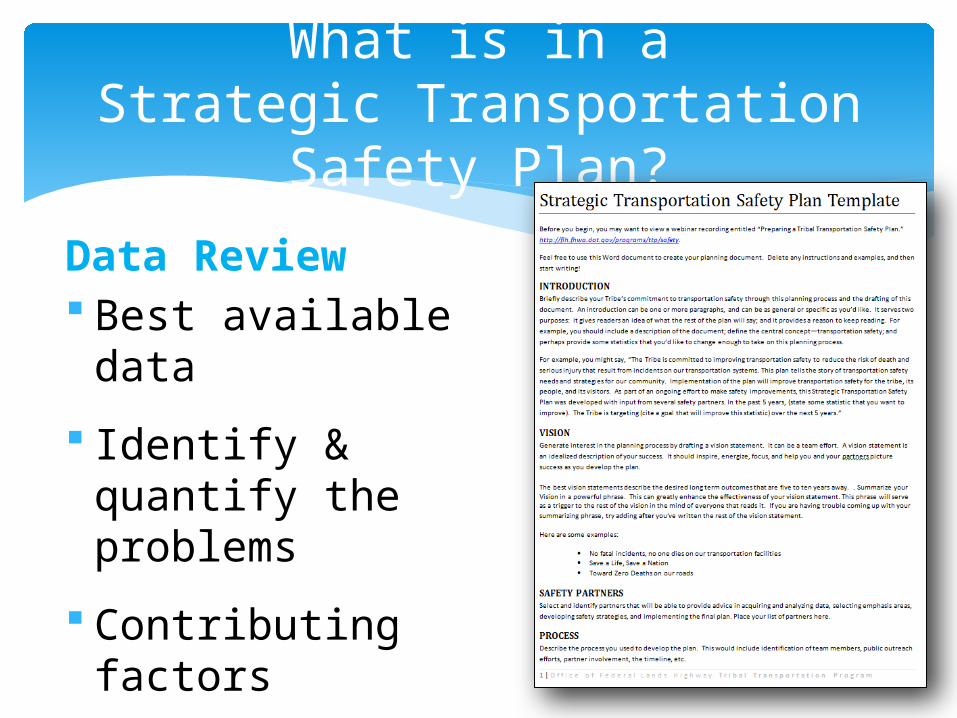
Data Review Best available data
Identify & quantify the problems
Contributing factors
May identify locations
What is in aStrategic Transportation Safety
Plan?
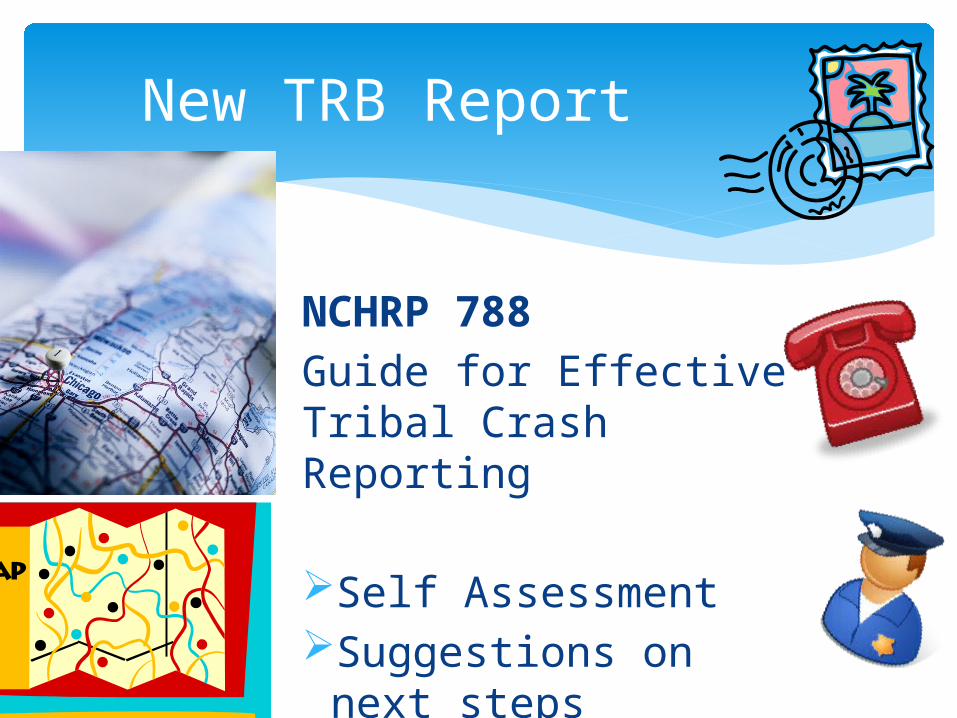
New TRB Report
NCHRP 788 Guide for Effective Tribal Crash Reporting
Self AssessmentSuggestions on next
steps
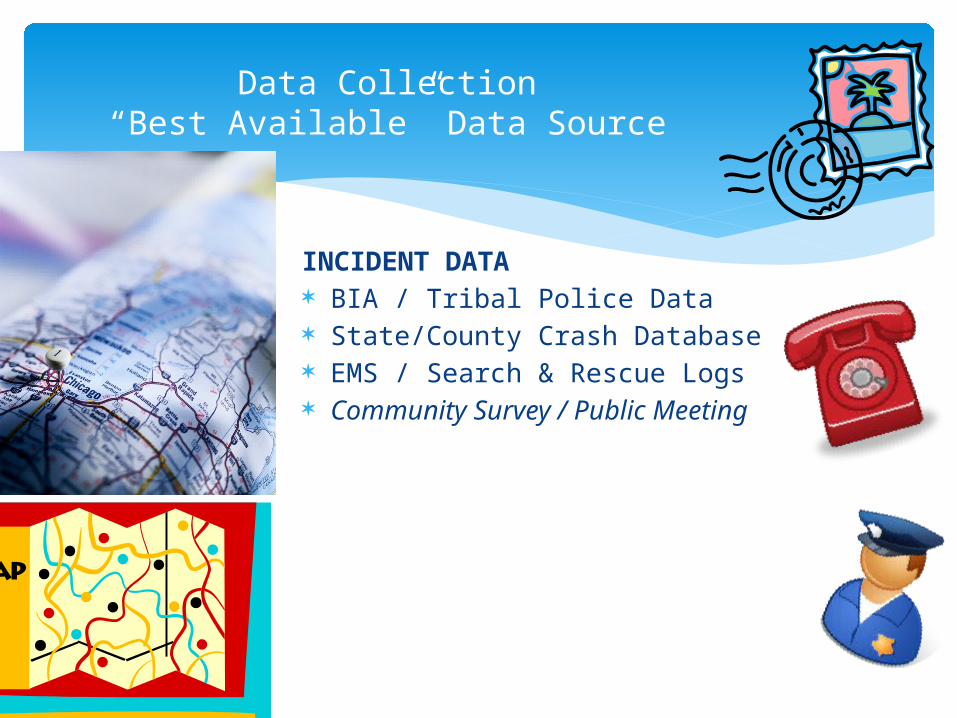
Data Collection“Best Available” Data Source
INCIDENT DATA BIA / Tribal Police Data State/County Crash Database EMS / Search & Rescue Logs Community Survey / Public
Meeting
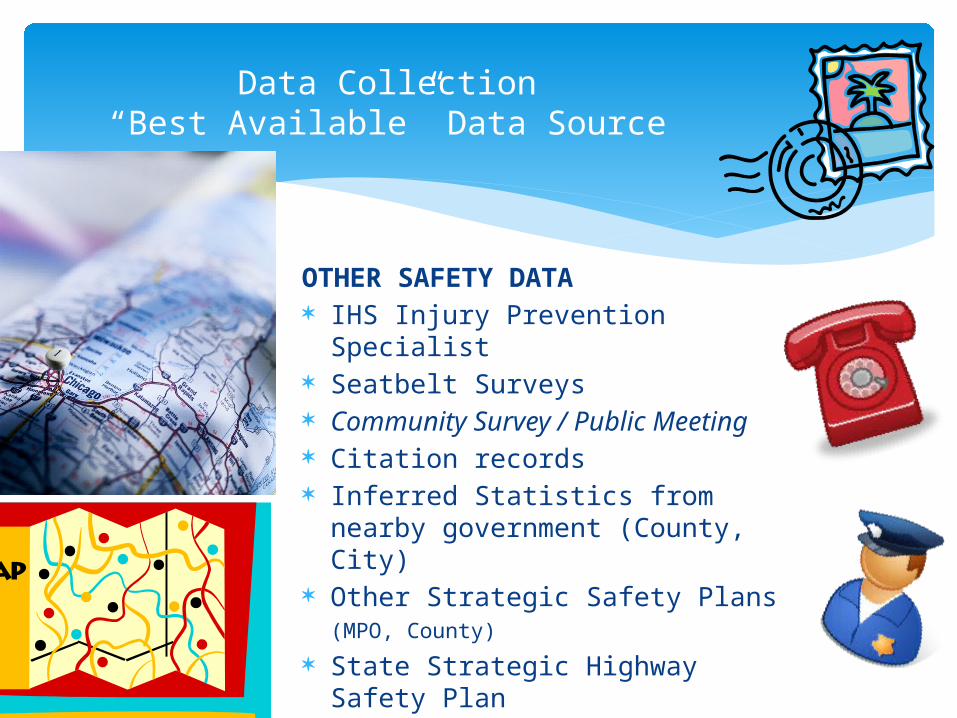
Data Collection“Best Available” Data Source
OTHER SAFETY DATA IHS Injury Prevention Specialist Seatbelt Surveys Community Survey / Public
Meeting Citation records Inferred Statistics from nearby
government (County, City) Other Strategic Safety Plans (MPO,
County) State Strategic Highway Safety
Plan
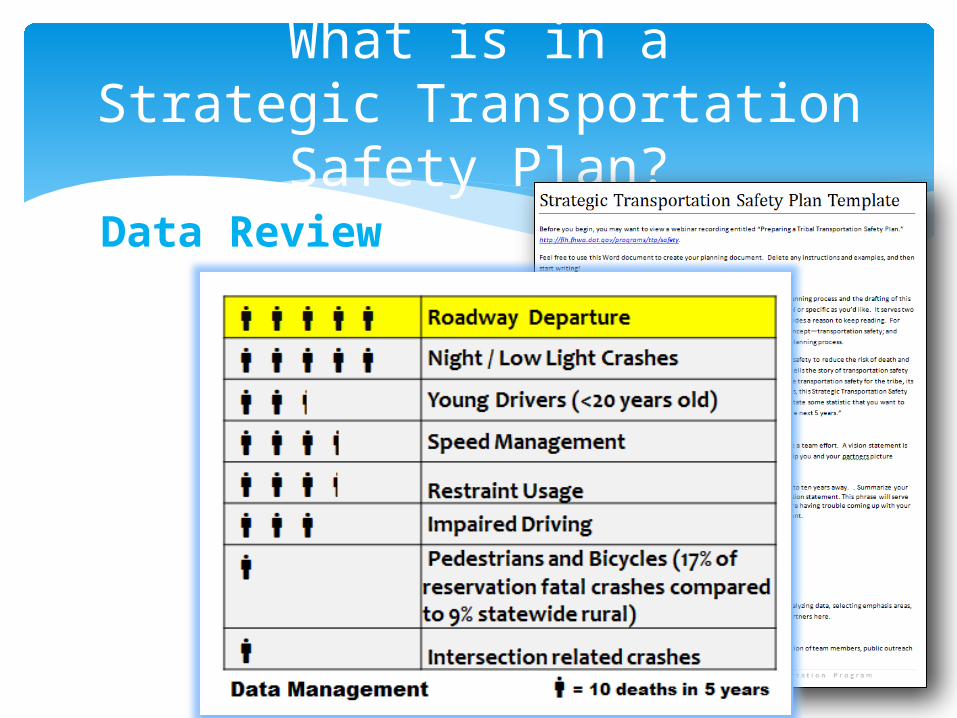
Data Review
What is in aStrategic Transportation Safety
Plan?
What is in aStrategic Transportation Safety
Plan?Emphasis AreasVision and Data should lead to the issues to be addressed
What is in aStrategic Transportation Safety
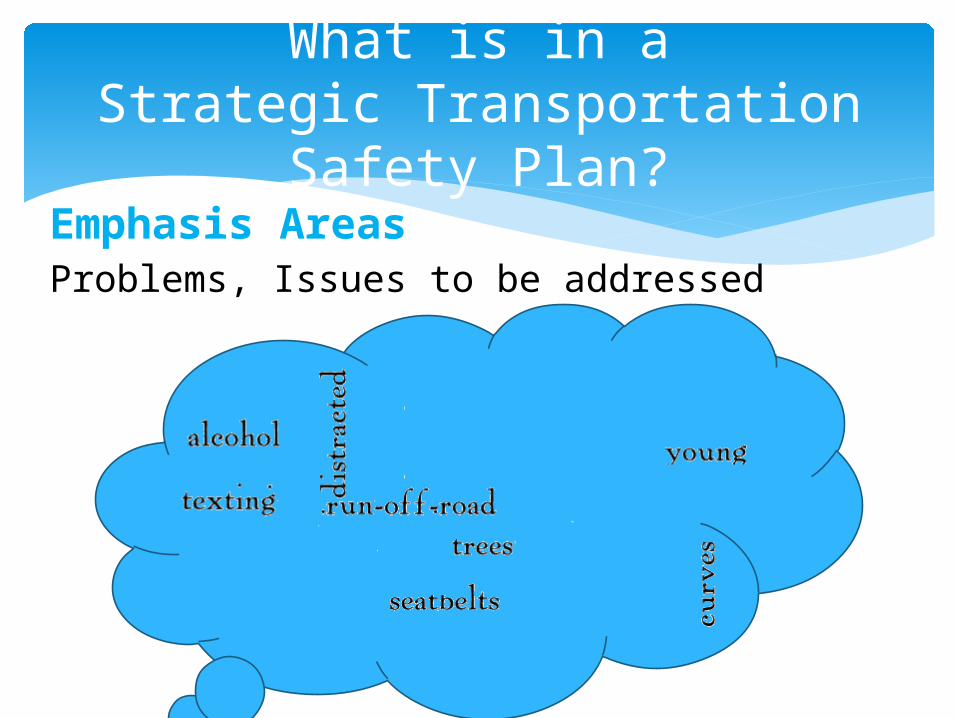
Plan?Emphasis AreasProblems, Issues to be addressed
What is in aStrategic Transportation Safety
Plan?
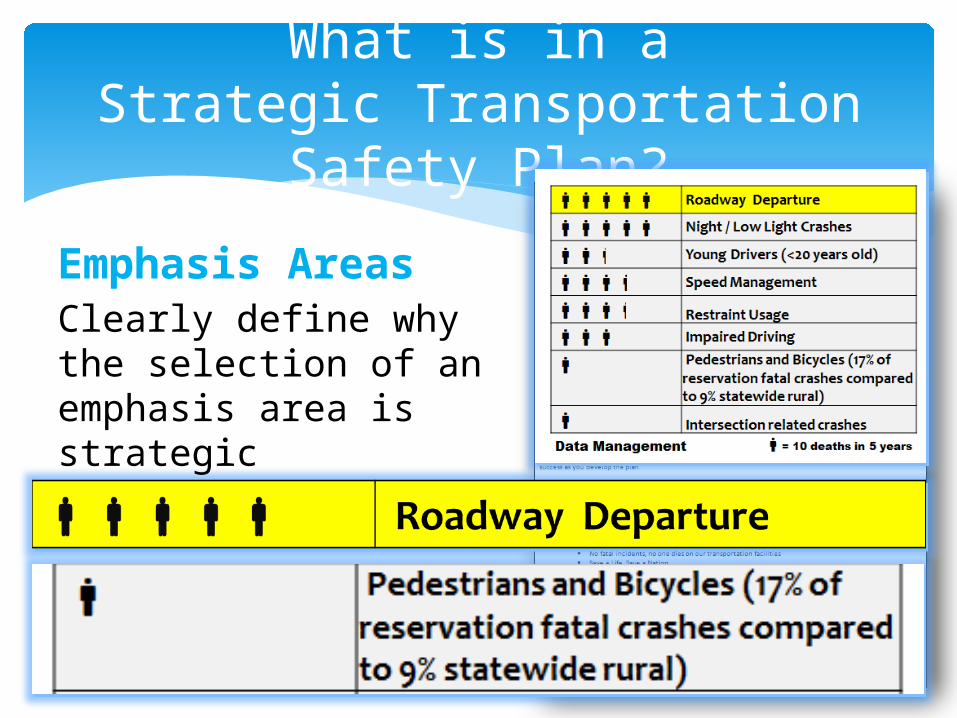
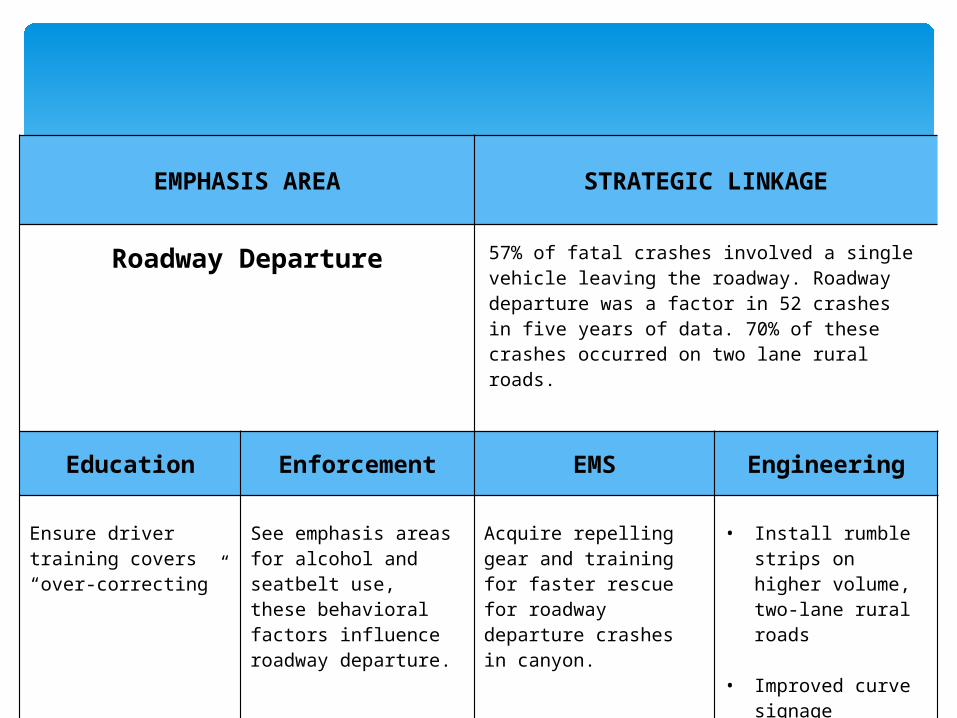
Emphasis AreasClearly define why the selection of an emphasis area is strategic
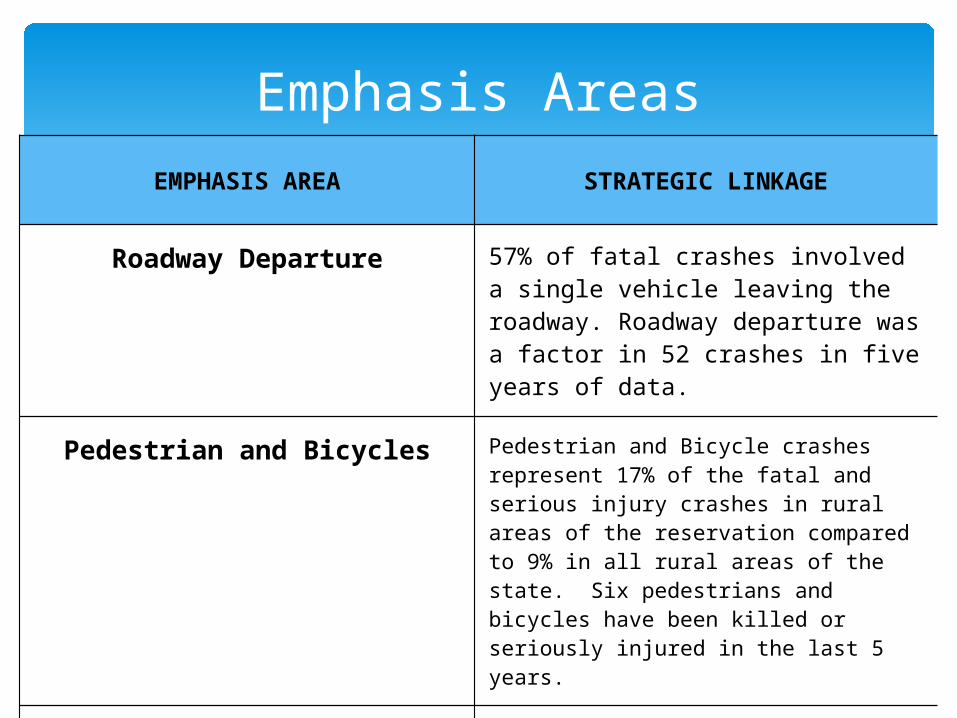
EMPHASIS AREA STRATEGIC LINKAGE
Roadway Departure 57% of fatal crashes involved a single vehicle leaving the roadway. Roadway departure was a factor in 52 crashes in five years of data.
Pedestrian and Bicycles Pedestrian and Bicycle crashes represent 17% of the fatal and serious injury crashes in rural areas of the reservation compared to 9% in all rural areas of the state. Six pedestrians and bicycles have been killed or seriously injured in the last 5 years.
Speed Management Speed is listed as a contributing factor in 52% of fatal and serious injury crashes. Tribal police issued 1374 citations for speeding in 2013.
Emphasis Areas
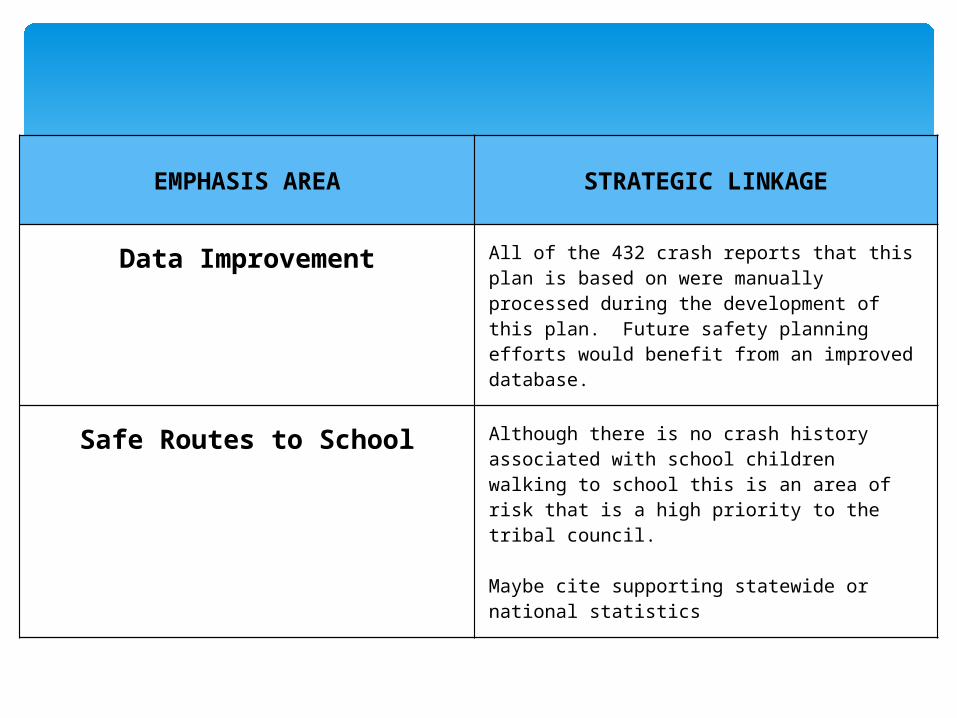
EMPHASIS AREA STRATEGIC LINKAGE
Data Improvement All of the 432 crash reports that this plan is based on were manually processed during the development of this plan. Future safety planning efforts would benefit from an improved database.
Safe Routes to School Although there is no crash history associated with school children walking to school this is an area of risk that is a high priority to the tribal council.
Maybe cite supporting statewide or national statistics
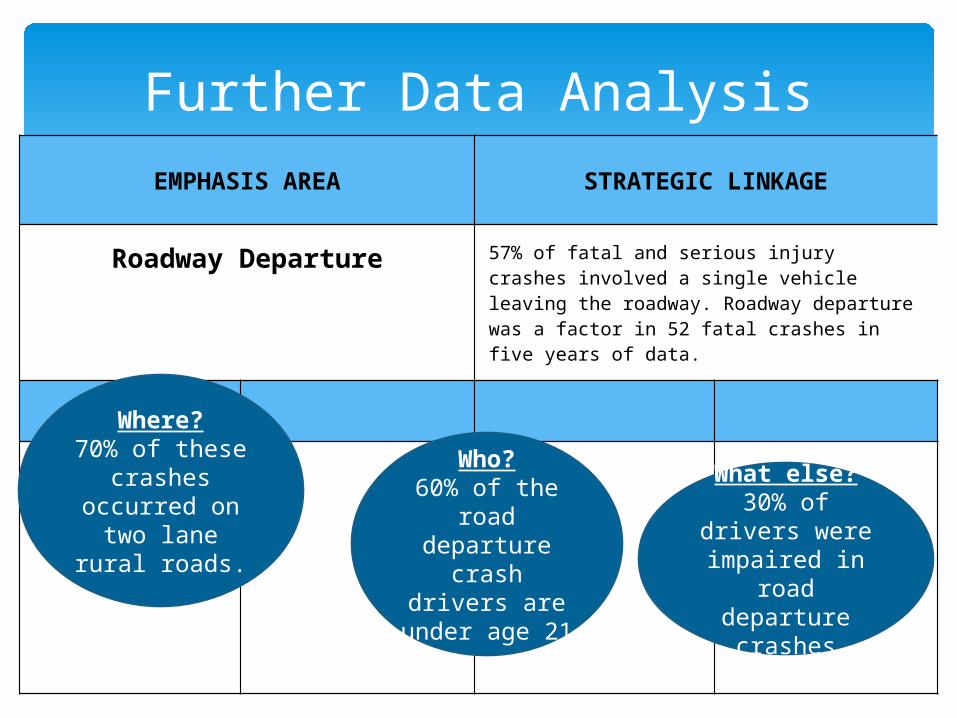
EMPHASIS AREA STRATEGIC LINKAGE
Roadway Departure 57% of fatal and serious injury crashes involved a single vehicle leaving the roadway. Roadway departure was a factor in 52 fatal crashes in five years of data.
Further Data Analysis
Where?70% of these
crashes occurred on two lane rural roads.
What else?30% of drivers
were impaired in road departure
crashes
Who?60% of the road departure crash
drivers are under age 21
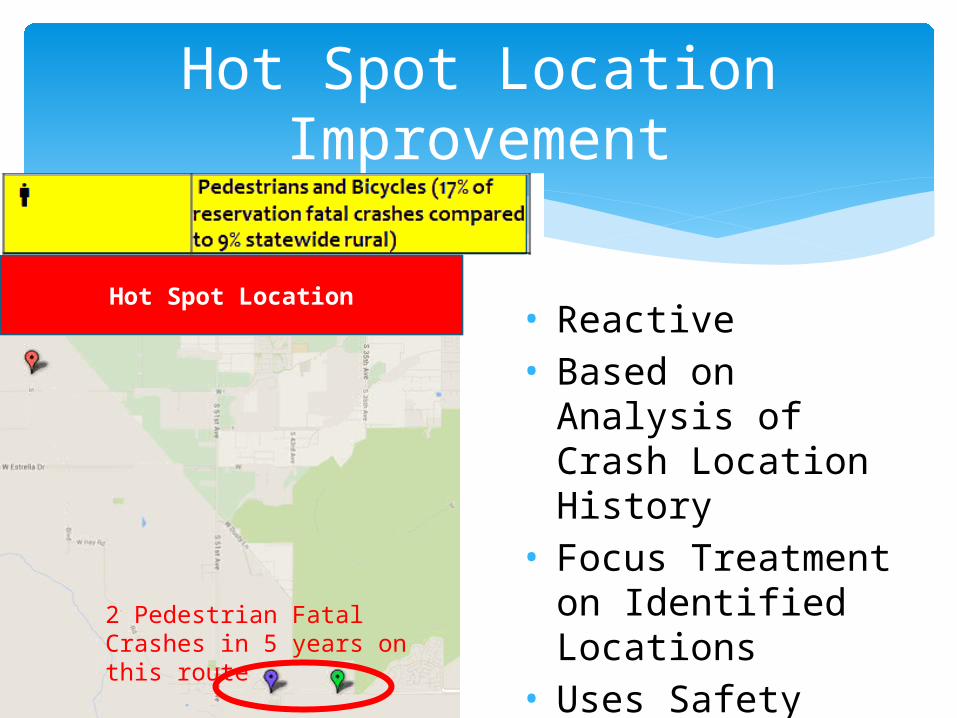
Hot Spot Location Improvement
Hot Spot Location• Reactive• Based on Analysis of
Crash Location History• Focus Treatment on
Identified Locations• Uses Safety
Countermeasures for Identified Crash Types
2 Pedestrian Fatal Crashes in 5 years on this route
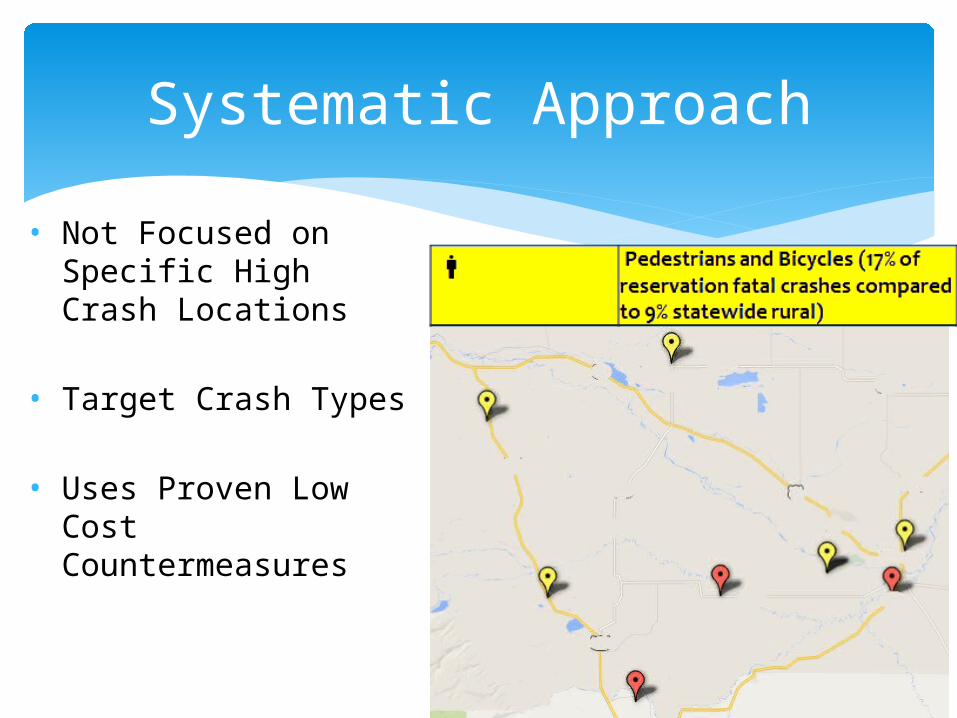
• Not Focused on Specific High Crash Locations
• Target Crash Types
• Uses Proven Low Cost Countermeasures
Systematic Approach
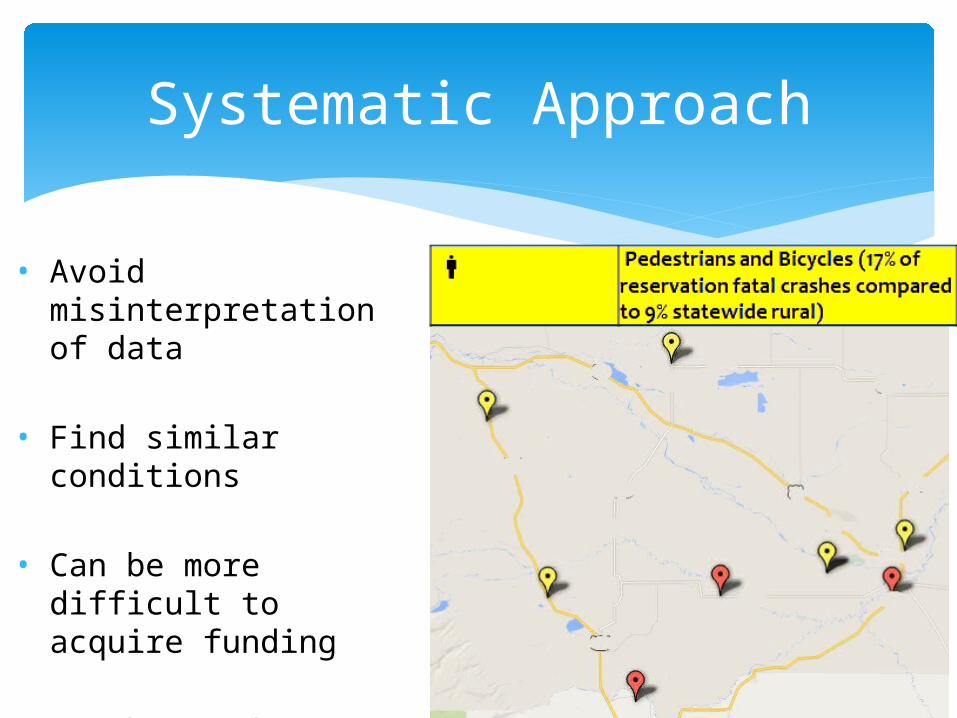
• Avoid misinterpretation of data
• Find similar conditions
• Can be more difficult to acquire funding
• Can be used to infer crash experience
Systematic Approach
What is in aStrategic Transportation Safety
Plan?
StrategiesHow can each discipline contribute to the identified problem (emphasis area)?
Not Here
Start Here
Problems first
then strategies
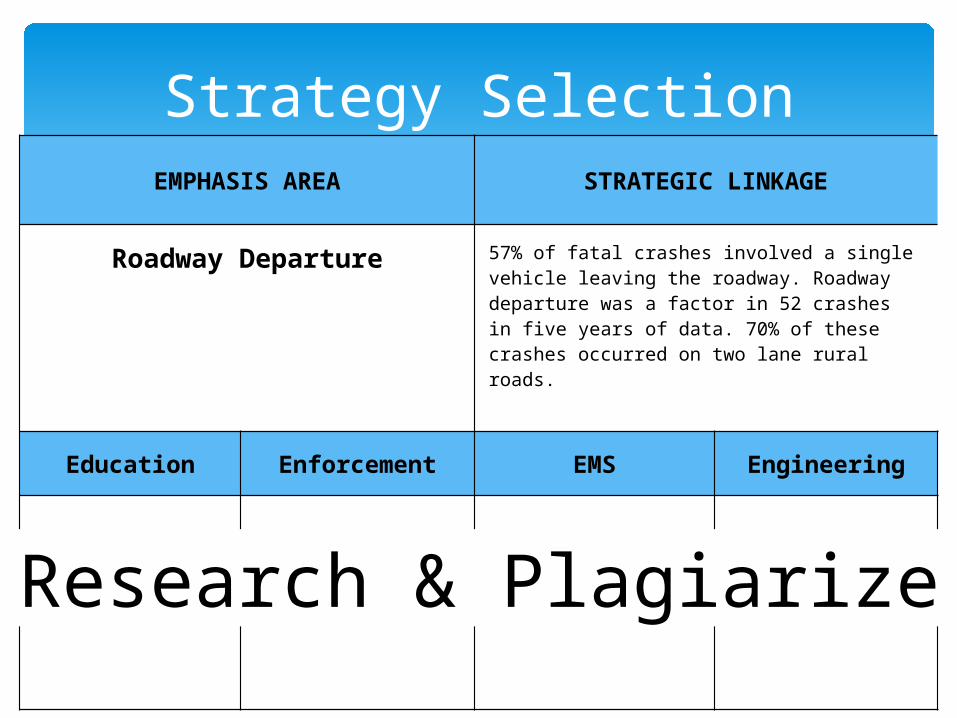
EMPHASIS AREA STRATEGIC LINKAGE
Roadway Departure 57% of fatal crashes involved a single vehicle leaving the roadway. Roadway departure was a factor in 52 crashes in five years of data. 70% of these crashes occurred on two lane rural roads.
Education Enforcement EMS Engineering
Research & Plagiarize
Strategy Selection
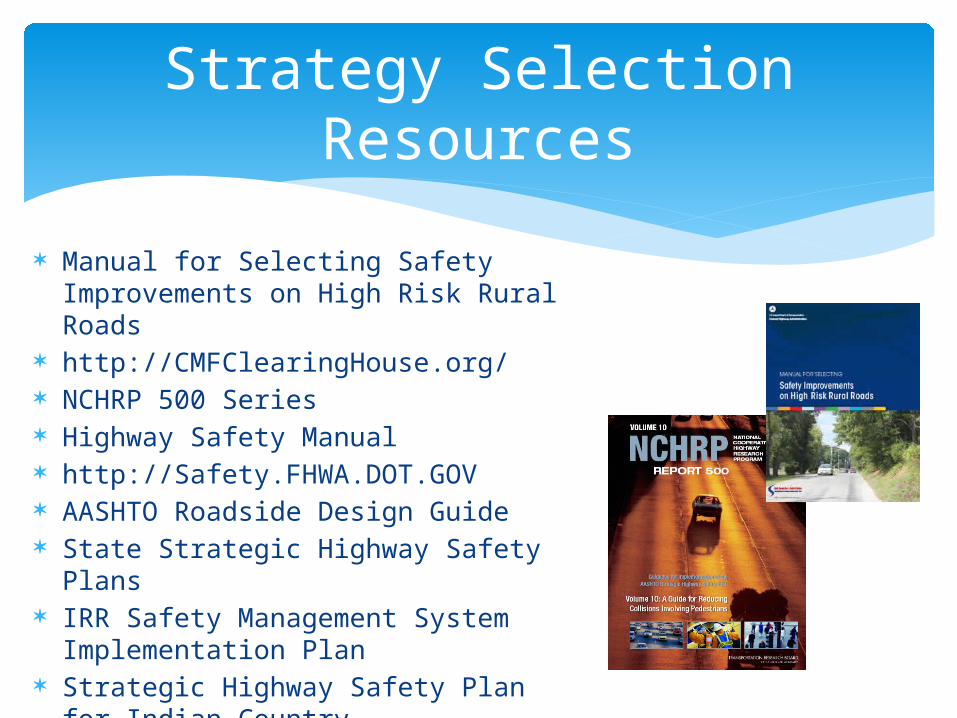
Strategy Selection Resources
Manual for Selecting Safety Improvements on High Risk Rural Roads
http://CMFClearingHouse.org/ NCHRP 500 Series Highway Safety Manual http://Safety.FHWA.DOT.GOV AASHTO Roadside Design Guide State Strategic Highway Safety Plans IRR Safety Management System
Implementation Plan Strategic Highway Safety Plan for
Indian Country
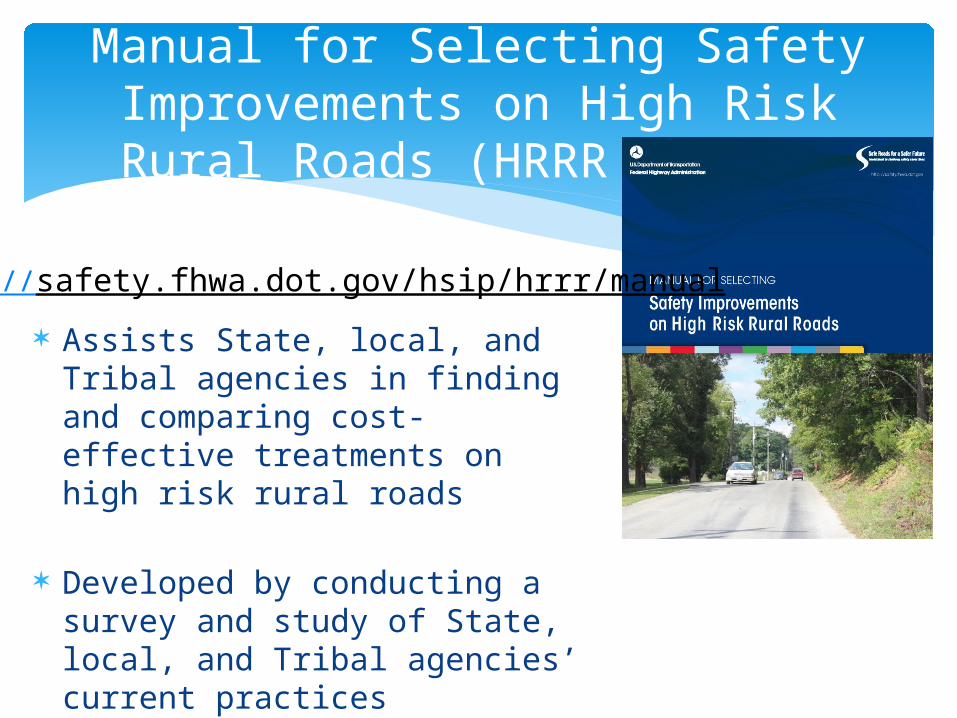
Manual for Selecting Safety Improvements on High Risk Rural
Roads (HRRR Manual)
Assists State, local, and Tribal agencies in finding and comparing cost-effective treatments on high risk rural roads
Developed by conducting a survey and study of State, local, and Tribal agencies’ current practices 45
http://safety.fhwa.dot.gov/hsip/hrrr/manual
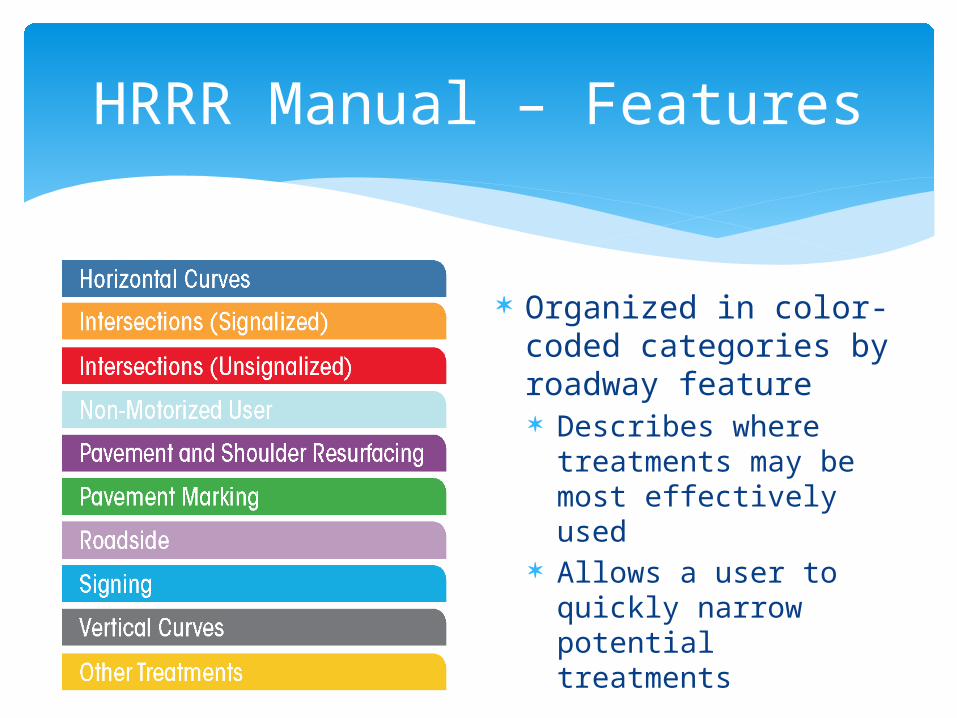
HRRR Manual – Features
46
Organized in color-coded categories by roadway feature Describes where
treatments may be most effectively used
Allows a user to quickly narrow potential treatments
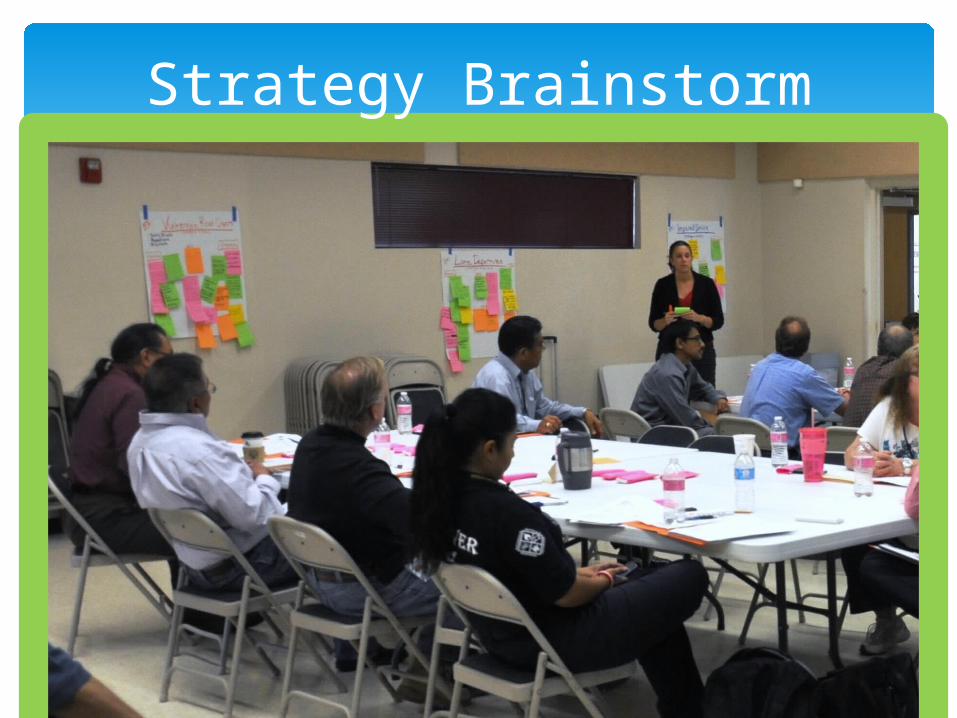
Strategy Brainstorm
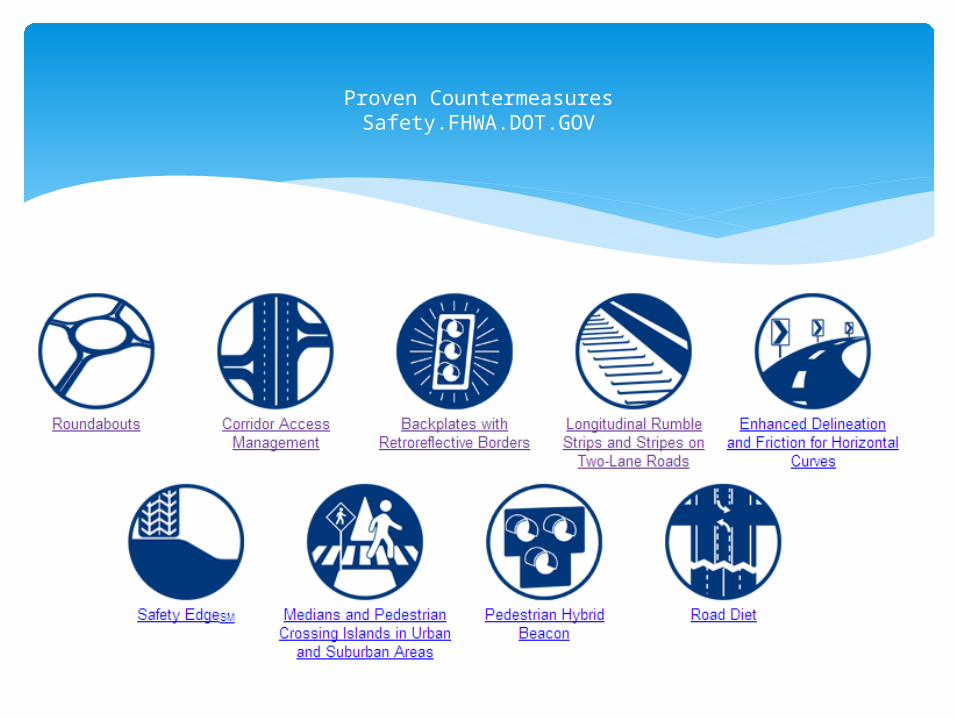
Proven CountermeasuresSafety.FHWA.DOT.GOV
EMPHASIS AREA STRATEGIC LINKAGE
Roadway Departure 57% of fatal crashes involved a single vehicle leaving the roadway. Roadway departure was a factor in 52 crashes in five years of data. 70% of these crashes occurred on two lane rural roads.
Education Enforcement EMS Engineering
Ensure driver training covers “over-correcting”
See emphasis areas for alcohol and seatbelt use, these behavioral factors influence roadway departure.
Acquire repelling gear and training for faster rescue for roadway departure crashes in canyon.
• Install rumble strips on higher volume, two-lane rural roads
• Improved curve signage
• Policy to include safety edge when paving
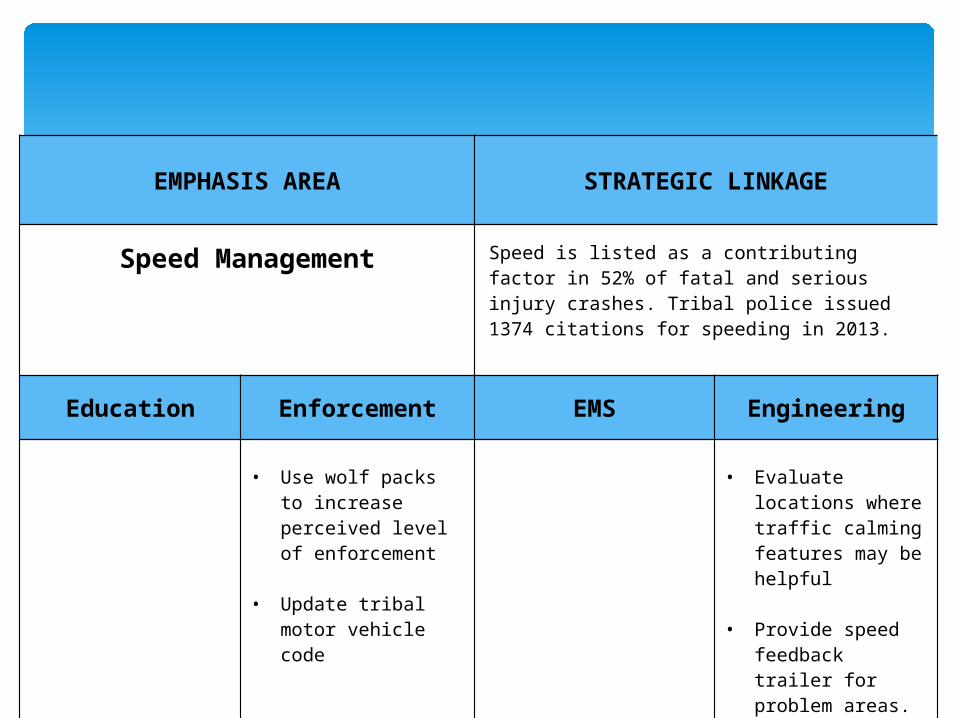
EMPHASIS AREA STRATEGIC LINKAGE
Speed Management Speed is listed as a contributing factor in 52% of fatal and serious injury crashes. Tribal police issued 1374 citations for speeding in 2013.
Education Enforcement EMS Engineering
• Use wolf packs to increase perceived level of enforcement
• Update tribal motor vehicle code
• Evaluate locations where traffic calming features may be helpful
• Provide speed feedback trailer for problem areas.
Process
What is in aStrategic Transportation Safety
Plan?
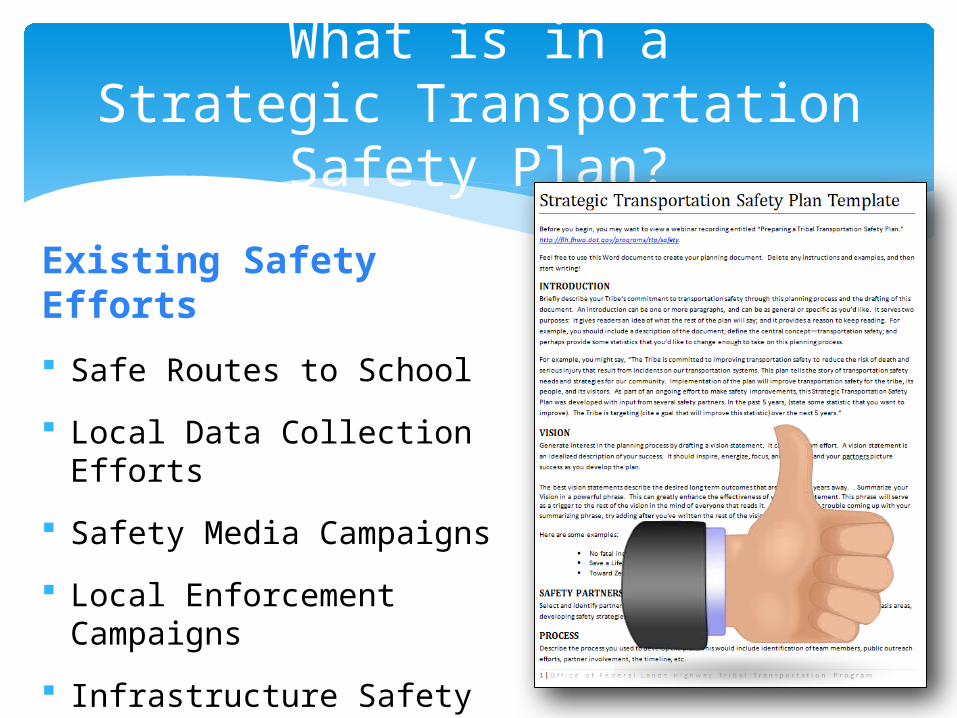
Existing Safety Efforts
Safe Routes to School
Local Data Collection Efforts
Safety Media Campaigns
Local Enforcement Campaigns
Infrastructure Safety Improvements
Helmet Campaign
What is in aStrategic Transportation Safety
Plan?
Implementation
Evaluation
What is in aStrategic Transportation Safety
Plan?
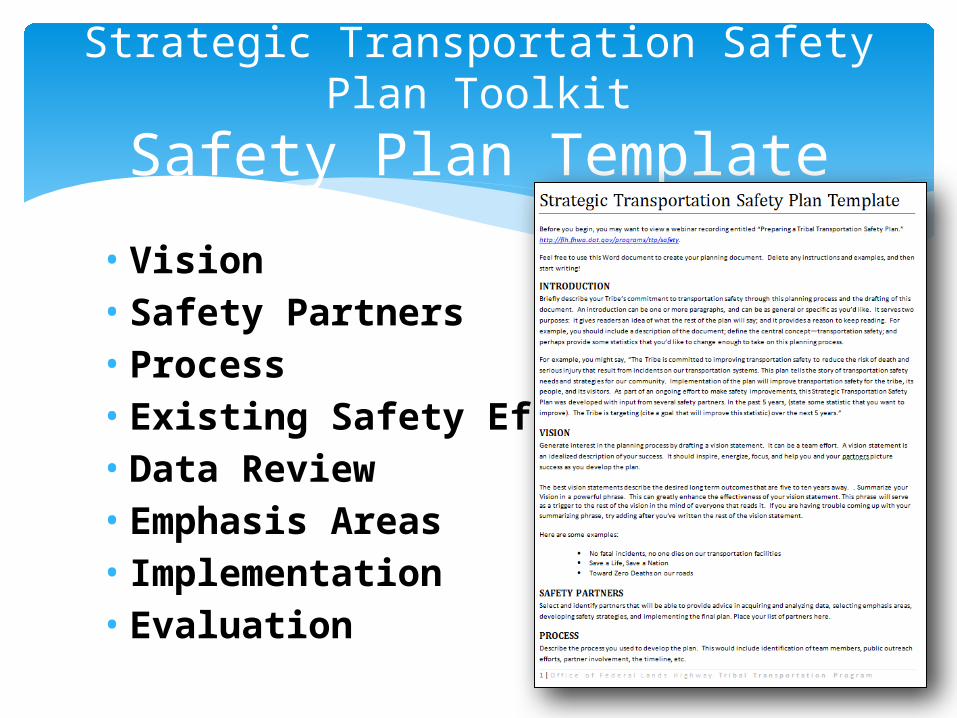
• Vision• Safety Partners• Process• Existing Safety Efforts• Data Review• Emphasis Areas• Implementation• Evaluation
Strategic Transportation Safety Plan Toolkit
Safety Plan Template
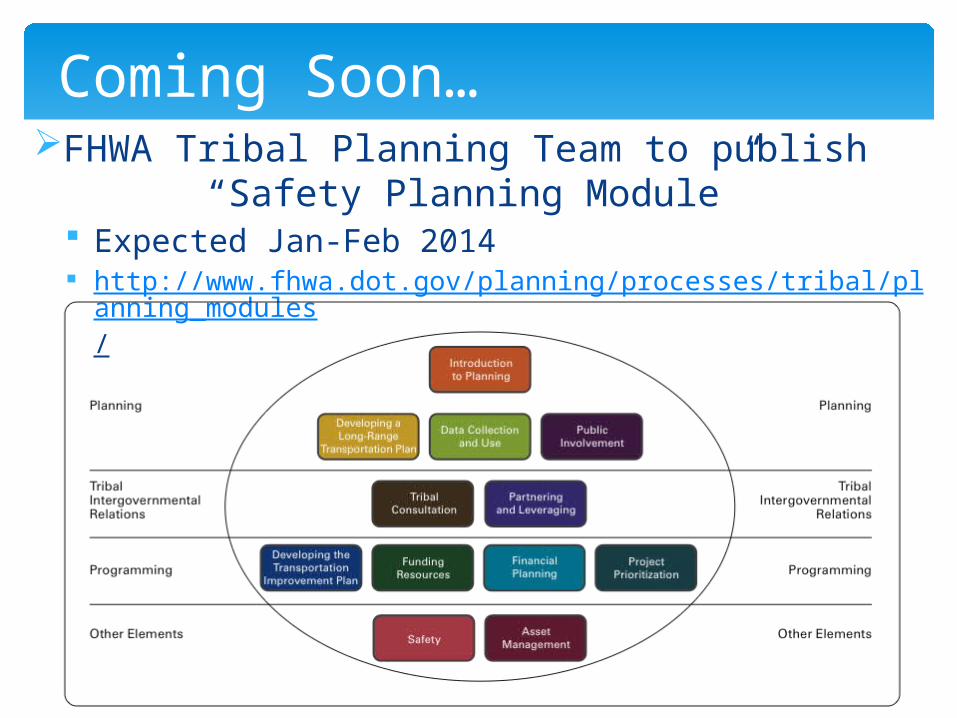
FHWA Tribal Planning Team to publish “Safety Planning Module”
Expected Jan-Feb 2014 http://www.fhwa.dot.gov/planning/processes/tribal/planning_m
odules/
Coming Soon…
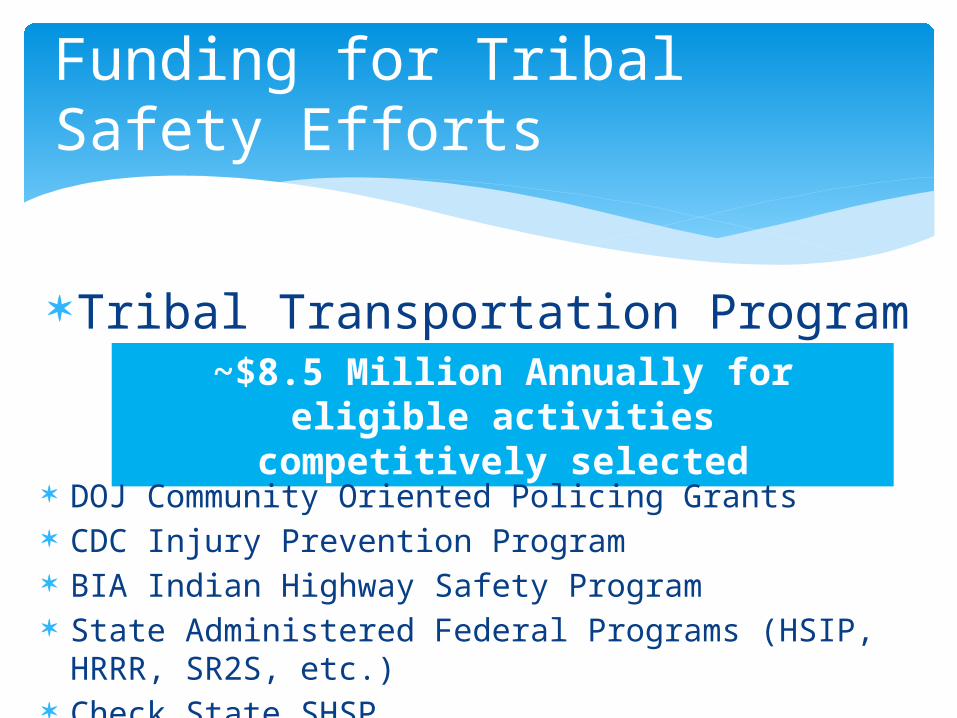
Tribal Transportation Program Safety Fund
Funding for Tribal Safety Efforts
~$8.5 Million Annually for eligible activitiescompetitively selected
DOJ Community Oriented Policing Grants CDC Injury Prevention Program BIA Indian Highway Safety Program State Administered Federal Programs (HSIP, HRRR,
SR2S, etc.) Check State SHSP

FY14 TTPSF Award Announcement Expected Dec 2014
FY15 TTPSF Call for Projects Expected Jan 2015
Coming Soon…
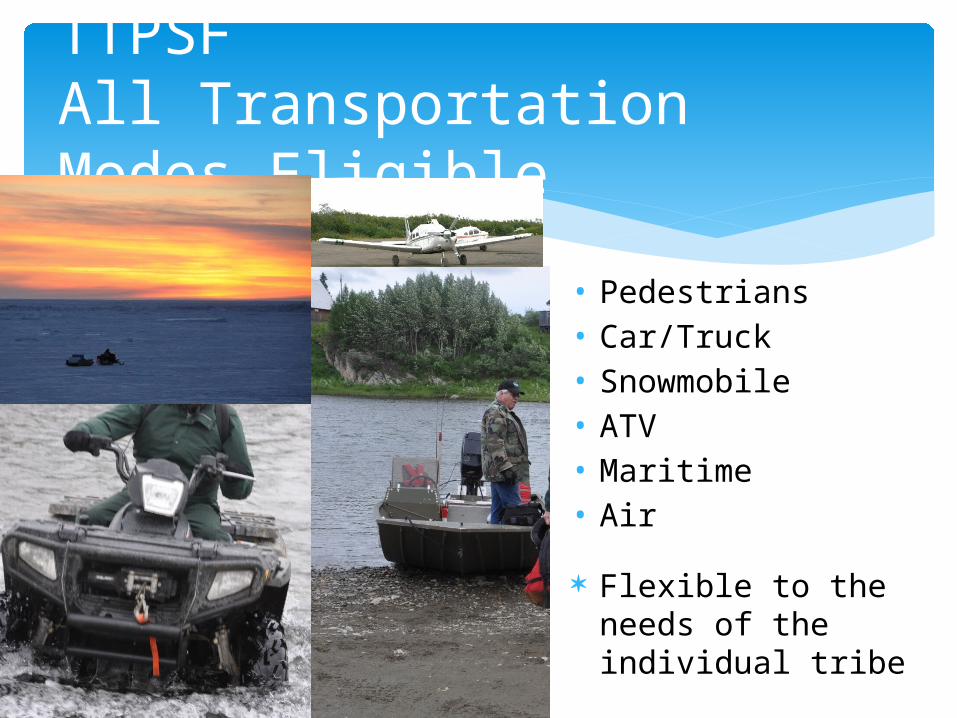
• Pedestrians• Car/Truck• Snowmobile• ATV• Maritime• Air
Flexible to the needs of the individual tribe
TTPSFAll Transportation Modes Eligible
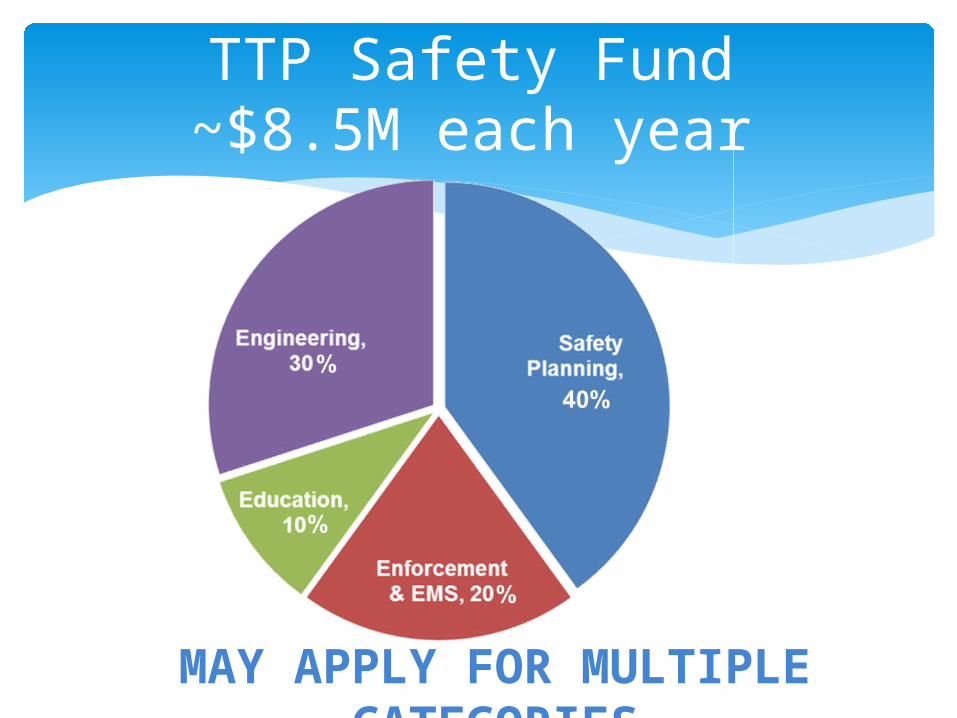
TTP Safety Fund~$8.5M each year
MAY APPLY FOR MULTIPLE CATEGORIES
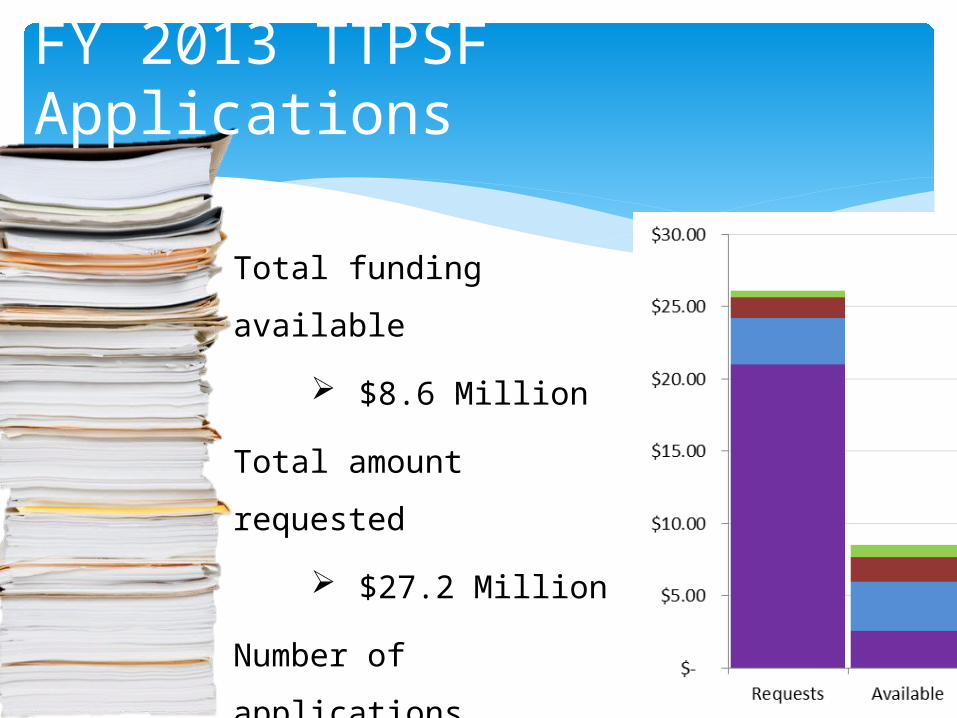
Total funding available
$8.6 Million
Total amount requested
$27.2 Million
Number of applications
239
FY 2013 TTPSF Applications
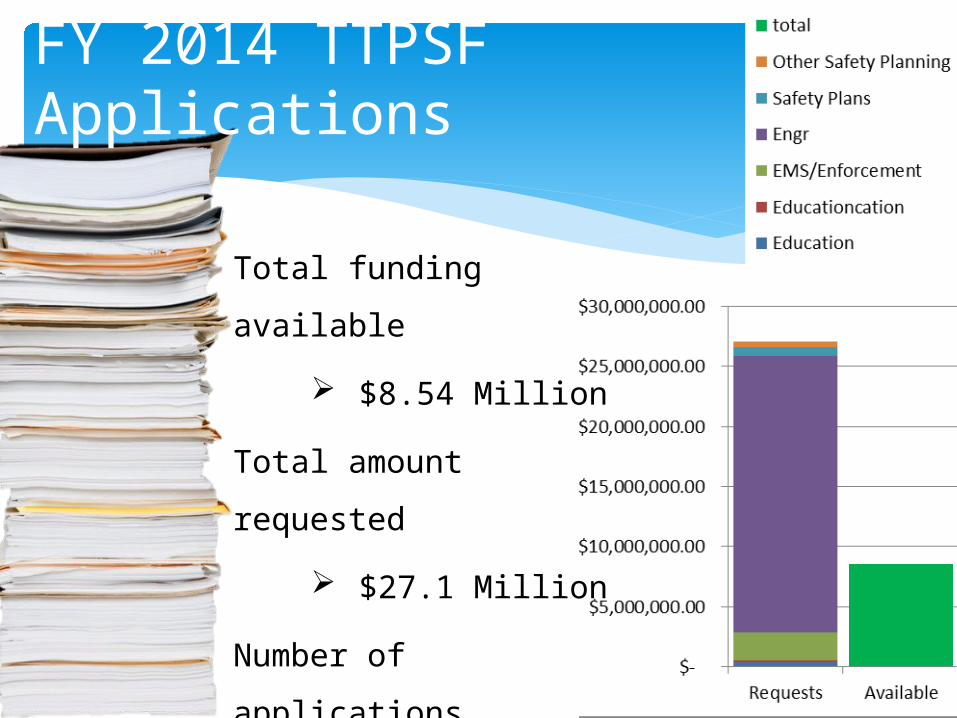
Total funding available
$8.54 Million
Total amount requested
$27.1 Million
Number of applications
126
94
recommended
FY 2014 TTPSF Applications
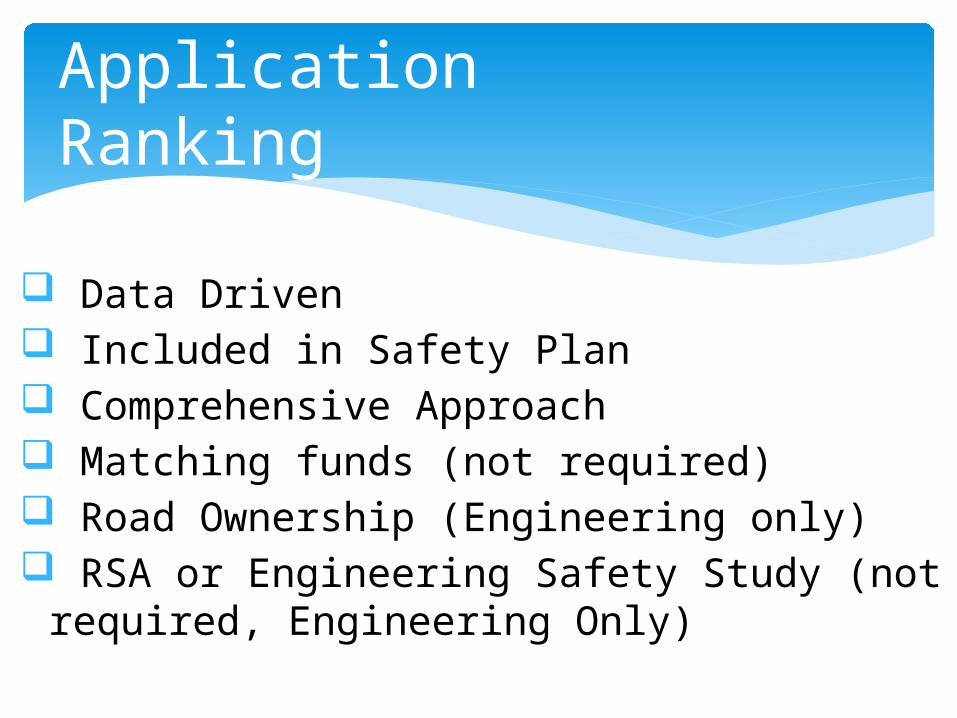
Data Driven Included in Safety Plan Comprehensive Approach Matching funds (not required) Road Ownership (Engineering only) RSA or Engineering Safety Study (not
required, Engineering Only)
TTPSF Application Ranking Criterion
Questions?
Adam LarsenTTP Safety Engineer(360) [email protected]
http://flh.fhwa.dot.gov/programs/ttp/safety/