Embed Size (px)
Citation preview
International Journal of Thermal Sciences 46 (2007) 519–530www.elsevier.com/locate/ijts
Fundamental data on the gas–liquid two-phase flow in minichannels ✩
Hideo Ide a,∗, Akira Kariyasaki b, Tohru Fukano c
a Department of Mechanical Engineering, Faculty of Eng., Kagoshima University, 1-21-40 Koorimoto, Kagoshima 890-0065, Japanb Department of Chemical Engineering, Faculty of Eng., Fukuoka University, 8-19-1 Nanakuma, Johnann-ku, Fukuoka 814-0180, Japan
c Faculty of Engineering, Kurume Institute of Technology, 2228-66, Kamitumachi, Kurume 830-0052, Japan
Received 10 September 2005; accepted 23 July 2006
Available online 8 September 2006
Abstract
We report on the results of investigations into the characteristics of an air–water isothermal two-phase flow in minichannels, that is, in capillarytubes with inner diameters of 1 mm, 2.4 mm, and 4.9 mm, also in capillary rectangular channels with an aspect ratio of 1 to 9. The directions offlow were vertical upward, horizontal and vertical downward. Based on the authors 15 years of fundamental research into the gas–liquid two-phaseflows in circular tubes and rectangular channels, we summarized the characteristics of the flow phenomena in a minichannel with special attentionon the flow patterns, the time varying holdup and the pressure loss. The effects of the tube diameters and aspect ratios of the channels on theseflow parameters and the flow patterns were investigated. Also the correlations of the holdup and the frictional pressure drop were proposed.© 2006 Elsevier Masson SAS. All rights reserved.
Keywords: Minichannel; Gas–liquid flow; Flow patterns; Void fraction; Pressure drop; Liquid film; Correlation; Capillary
1. Introduction
As heat exchangers have become smaller the information onthe flow mechanism of a gas–liquid two-phase mixture flow-ing concurrently in a narrow channel is needed to improve theperformance of compact heat exchangers. Fundamental infor-mation such as flow pattern, void fraction and pressure loss areall important parameters in designing a heat exchanger. Muchinteresting data on such flow parameters has been clarified incapillary circular tubes [1–6] and in narrow rectangular chan-nels [7–13].
We have investigated into the isothermal air–water two-phase flow in minichannels over a wide range of flow conditionsin both phases from a fluid dynamic point of view in orderto clarify the fundamental points of one component two-phaseflow in a mini tube.
✩ A preliminary version of this paper was presented at ICMMO5: Third In-ternational Conference on Microchannels and Minichannels, held at Universityof Toronto, June 13–15, 2005, organized by S.G. Kandlikar and M. Kawaji,CD-ROM Proceedings, ISBN: 0-7918-3758-0, ASME, New York.
* Corresponding author. Tel.: +81 99 285 8270; fax: +81 99 285 8270.E-mail address: [email protected] (H. Ide).
1290-0729/$ – see front matter © 2006 Elsevier Masson SAS. All rights reserved.doi:10.1016/j.ijthermalsci.2006.07.012
We are now experimenting to clarify the flow phenomena ina microchannel with a smaller passage size than a minichannel.Therefore, it is important that we summarize the flow phenom-ena in a minichannel at this stage.
In this paper we will introduce the experimental data whichhas been obtained by using the constant electric current method,for obtaining the time fluctuating holdup: CECM developedby Fukano [14]. We will discuss the characteristic phenomenawhich are commonly seen in the two-phase flow in a minichan-nel. The dimension of the circular and the rectangular channelare as follow; The inner diameters of the circular tube used were1 mm, 2.4 mm, and 4.9 mm. As a reference we used data ob-tained in a previous experiment to compare larger scale tubes,9 mm tube and 26 mm for horizontal flow. In the case of therectangular channel the cross sectional dimension were 1 mm× 1 mm, 2 mm × 1 mm, 5 mm × 1 mm and 9.9 mm × 1.1 mm.The directions of flow were vertical upward, vertical downwardand horizontal. We investigated the flow patterns, the void frac-tion and the frictional pressure drop, that is, the effects of thetube diameters of circular tubes and the aspect ratios of rectan-gular channels on the two-phase flow phenomena.
For a flat channel of 9.9 mm × 1.1 mm, the effects of theflow orientations, vertical and horizontal flows, were also inves-

520 H. Ide et al. / International Journal of Thermal Sciences 46 (2007) 519–530
Nomenclature
A long side length of cross section of rectangularchannel . . . . . . . . . . . . . . . . . . . . . . . . . . . . . . . . mm, m
B short side length of cross section of rectangularchannel . . . . . . . . . . . . . . . . . . . . . . . . . . . . . . . . mm, m
C constant in Eq. (4)Cs constant in Eq. (3)D pipe inner diameter . . . . . . . . . . . . . . . . . . . . . mm, mDe equivalent diameter defined by Sadatomi et al. [29],
≡ 2(A + B)/π . . . . . . . . . . . . . . . . . . . . . . . . . mm, mDh hydraulic equivalent diameter,
≡ 2AB/(A + B) . . . . . . . . . . . . . . . . . . . . . . . mm, mg acceleration of gravity . . . . . . . . . . . . . . . . . . . m s−2
j volumetric flux . . . . . . . . . . . . . . . . . . . . . . . . . . m s−1
jT total volumetric flux . . . . . . . . . . . . . . . . . . . . . m s−1
LG mean length of a gas bubble . . . . . . . . . . . mm or mLC length along tube axis . . . . . . . . . . . . . . . . . mm or mLL mean length of a liquid slug . . . . . . . . . . . mm or mLs distance between two electrodes for CECM . . mm�Pe expansion loss . . . . . . . . . . . . . . . . . . . . . . . . . . . . . . Pa�Pf frictional pressure drop . . . . . . . . . . . . . . . . . . . . . . Par Radius of curvature of return bend . . . . . . . . . . . . mTs aspect ratio of cross section of rectangular channel,
≡ A/B
tBm mean base film thickness . . . . . . . . . . . . . . . . . . . mm
tSm mean liquid film thickness around bubble . . . . mmuR bubble velocity in a stagnant liquid in a pipe m s−1
us bubble velocity . . . . . . . . . . . . . . . . . . . . . . . . . . m s−1
Greek symbols
α void fractionαB void ratio just upstream of the tail of the bubbleβ ratio of the gas to the mixture volume ratesγ ratio of the gas to the slug unit length
≡ LG/(LG + LL)
η holdupΦL two phase multiplier for frictional pressure dropΦLCH,ΦL estimated by the Chisholm correlationλ friction factorμ dynamic viscosity . . . . . . . . . . . . . . . . . . . . . . . . . Pa sν kinematic viscosity . . . . . . . . . . . . . . . . . . . . . m2 s−1
ρ density . . . . . . . . . . . . . . . . . . . . . . . . . . . . . . . . kg m−3
σ surface tension of the liquid . . . . . . . . . . . . . . N m−1
τ time lag . . . . . . . . . . . . . . . . . . . . . . . . . . . . . . . ms or sχ Martinelli parameter
Subscripts
T two-phase mixtureG gas phaseL liquid
tigated. In the horizontal flow, the two ways of setting a channel,the transverse and the longitudinal, were tested and we exam-ined how the differences of transverse and longitudinal settingsexerted an influence on flow.
It is noticed that the data discussed here was all obtainedfor air and water flow and the effects on the properties of bothphases should be investigated in the future.
2. Experiment
The dimensions of the test section of the circular channelsare summarized in Fig. 1. Those for the rectangular duct areshown in Figs. 2 and 3 with the dimension in Table 1. Air isinjected from 3 small holes with 0.3 mm or 0.5 mm diameterwhich are made at intervals of 120 degree on the circumferenceof the main tube at the air–water mixer, into the liquid flowingin the straight main tube.
Static pressure and pressure difference were measured bypressure transducers. All the data of holdup, i.e., void frac-tion were measured by the constant electric current method(CECM). CECM is fundamentally a conductance method. Themethods characteristics are a constant current power source isused for supplying electric power and two types of electrodesare flush mounted in series in the test section. One is used forsupplying electric power and the other for measuring the infor-mation about holdup or film thickness. The main advantages ofCECM are as follows:
Fig. 1. Dimensions of the test section for the circular channel.
(1) the output from the sensor electrode is independent of thelocation of the gas phase
(2) the sensitivity for detecting the change in the holdup ishigher, in the case of the thinner film thickness, and
(3) the interaction between the electrodes is negligible.
The basic idea, the calibration, and the examples on the ap-plication of CECM are described in Ref. [14]. In this paper,two pairs of sensor electrodes are set at two axially different lo-cations to measure the velocities of the bubbles. The outputs ofthe static pressure, the pressure difference and the holdup are si-multaneously sampled at the frequency of 2 KHz or 5 KHz andrecorded with a computer. The flow conditions tested in this pa-

H. Ide et al. / International Journal of Thermal Sciences 46 (2007) 519–530 521
Fig. 2. Experimental setup for rectangular flat channel.
Fig. 3. Orientation of test section.
Table 1Dimension of test section and probes
A × B Ts Dh De L Le �c �p t �t LD Ls
1.0 × 1.0 1.0 1.0 1.27 1042 797 315 6.6 0.3 1.0 350 1302.0 × 1.0 2.0 1.33 1.91 1254 1089 397 6.6 0.3 1.0 460 1305.0 × 1.0 5.0 1.67 3.82 1543 1333 516 6.6 0.3 1.0 580 3059.9 × 1.1 9.0 1.98 7.0 1890 1780 751 7.0 0.3 1.3 698 450
t : Thickness of brass plate (for anode and cathode probes) of a wall conductanceprobe.�t:Distance between brass plates in a wall conductance probe.
per are as follows: pressure = 0.15–0.24 MPa, temperature =291–297 K, superficial gas velocities, jG = 0.1–30.0 m s−1, su-perficial liquid velocities, jL = 0.03–2.3 m s−1.
3. Experimental results
The distinctive marks on the capillary tube flow are sum-marized by the following fundamental two points (1) the flowpattern is axisymmetric and (2) the velocity of large gas bubblesrelative to a liquid slug is quite low.
3.1. Flow pattern in circular minichannel
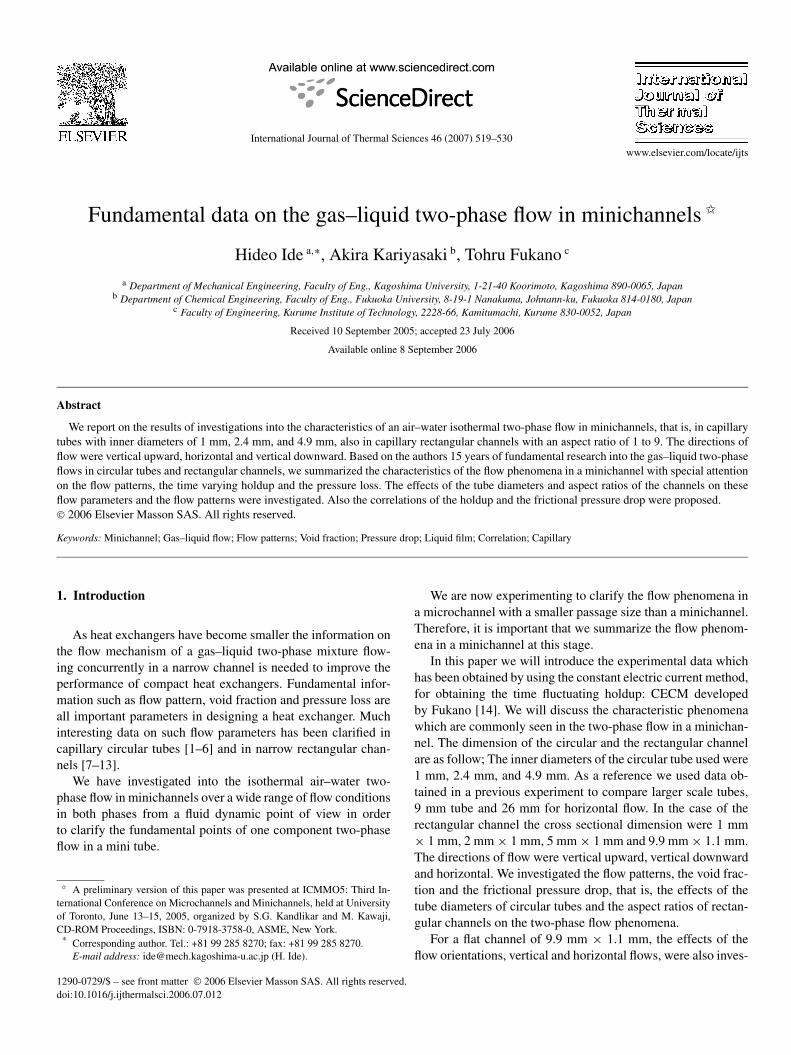
Fig. 4 shows the typical vertical upward and downward flowsand horizontal flow pattern in 2.4 mm inner diameter (I.D.)tubes, as well as those in 1 mm, 9 mm, and 26 mm I.D. hor-izontal tubes examining the competing effects of gravitationaland surface tension forces.
The characteristics of the flow pattern shown in these photosare summarized as follows:
(a) A separated flow is not really seen in the capillary tubes,which shows that the difference in the flow pattern causedby the difference in the flow direction is small in capillarytubes.
(b) Fig. 4(k) shows a part of a very long air bubble from a hori-zontal slug flow in the 26 mm I.D. tube, in which we can seethat water flows on the bottom side and air on the top sideon the slug. The flow pattern in the 9 mm I.D. horizontalpipe with approximately equal flow conditions in the caseof Fig. 4(k) is shown in Fig. 4( j). Film thickness at the bot-tom is much larger than that at the top also in this case. Onthe other hand, the flow patterns in the 1 mm and 2.4 mmI.D. horizontal pipes are intermittent with comparativelyshort and axisymmetric bubbles, as shown respectively inFigs. 4(l) and 4(i). We believe these facts signify that thecritical tube size at which the surface tension force sur-passes the gravitational force is around 5 mm as Bretherton[23] has also described.
(c) As the pipe size decreases the circumferential distributionof the film thickness becomes more uniform, causing ax-isymmetric flow patterns.
(d) The smaller the pipe size, the thinner the water film arounda large air bubble.
(e) Small bubbles in a liquid slug and liquid film are rarelyobserved in a capillary tube.
3.2. Relation between photographs of the flow and the holdupsignals in a rectangular flat minichannel
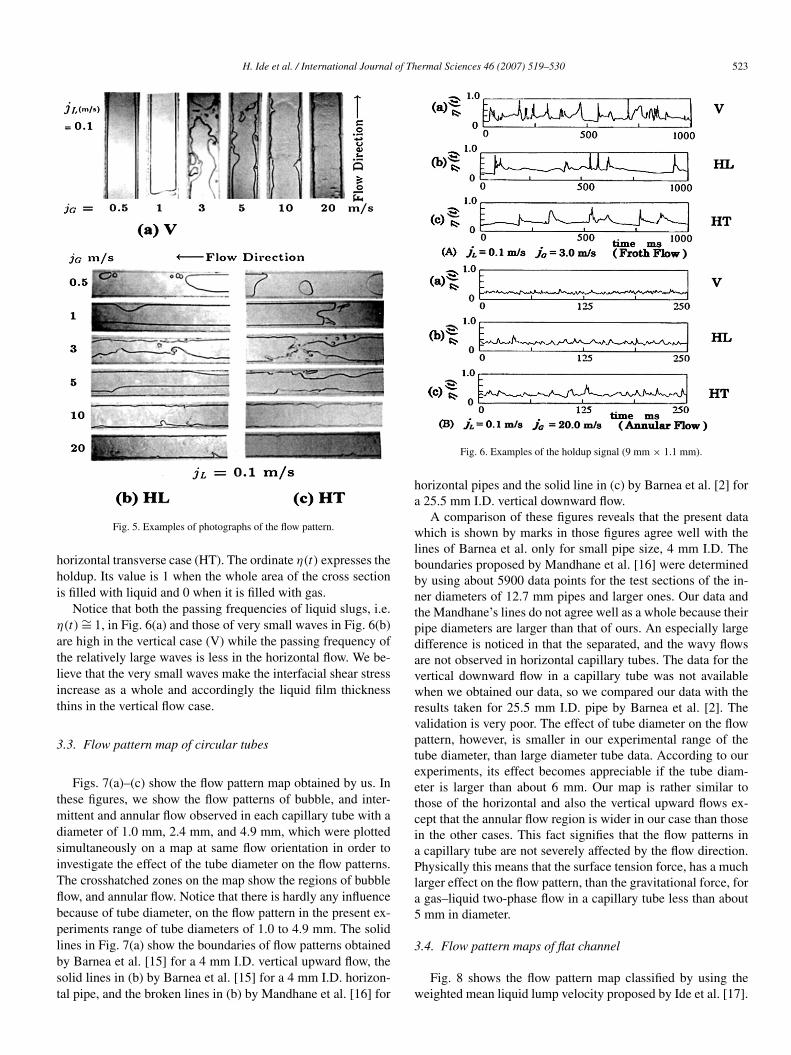
Fig. 5 shows photographs of the flow in the flat minichan-nel with a dimension of 9.9 mm × 1.1 mm where superficialgas velocity jG = 0.5–20 m s−1 and superficial liquid velocityjL = 0.1 m s−1. Fig. 5(a) shows the vertical flow, (b) and (c)show horizontal flow in the longitudinal (HL) transverse (HT)settings, respectively, the flow patterns in each photograph inFig. 5(a)–(c) can be classified as the slug flow for jG = 0.5 and1 m s−1, the froth flow for jG = 3 and 5 m s−1, and the annularflow. In this paper, we refer to this as the annular flow if the sur-rounding whole wall of the flat channel is covered with liquidfilm at a higher gas velocity even in a flat channel.
The flow configurations features in the channel with a largeaspect ratio are described as follows. In the transition regionbetween the slug and the froth flow, i.e., jG � 1–3 m s−1 inFig. 5(a), gas slugs, the noses of which are much flatter than thebullet-like noses observed in a circular tube, rise swinging rightand left and the liquid film and large liquid lumps near the wallare entrained in the stream of the gas core.
522 H. Ide et al. / International Journal of Thermal Sciences 46 (2007) 519–530
Fig. 4. Typical example of flow pattern.
When jG � 3 m s−1, the flow is considerably different fromwhat we call the Taylor bubble type slug flow and the froth flowin a circular tube. The gas slugs have such complicated shapesthat we cannot distinguish noses from tails even in the slug flow.That is, the gas penetrates the large liquid lumps in a complexmanner as seen in the figures, which is a feature special to anarrow flat channel.
When jG � 10 m s−1, the gas stream penetrates the liquidslugs, i.e., they are large liquid lumps. Then the flow patternchanges into an annular flow. Disturbance waves and ripplewaves can be clearly observed. We observe in Fig. 5(b) that
the difference between the liquid film thickness in the top andbottom sides of the channel becomes smaller in cases involv-ing larger values of jG and that the flow becomes similar to therelatively symmetrical case of vertical flow, (a) V , and the hor-izontal flow, (c) HT which was photographed from the top ofthe flat channel.
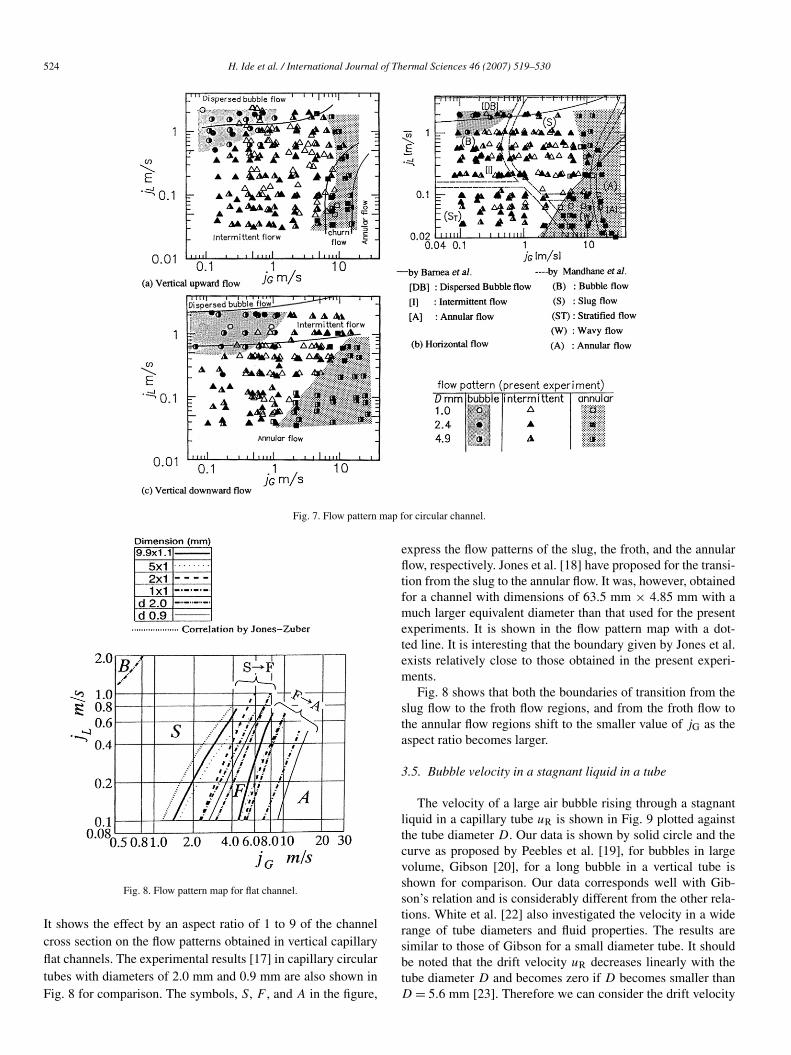
Fig. 6 shows an example of the time fluctuating output sig-nals from the holdup probes for the 9.9 mm × 1.1 mm channel.(a) of Fig. 6 shows those for the froth flow case and (b) for theannular flow case. (a)–(c) in each figure show respectively thevertical case (V), the horizontal longitudinal case (HL), and the
H. Ide et al. / International Journal of Thermal Sciences 46 (2007) 519–530 523
Fig. 5. Examples of photographs of the flow pattern.
horizontal transverse case (HT). The ordinate η(t) expresses theholdup. Its value is 1 when the whole area of the cross sectionis filled with liquid and 0 when it is filled with gas.
Notice that both the passing frequencies of liquid slugs, i.e.η(t) ∼= 1, in Fig. 6(a) and those of very small waves in Fig. 6(b)are high in the vertical case (V) while the passing frequency ofthe relatively large waves is less in the horizontal flow. We be-lieve that the very small waves make the interfacial shear stressincrease as a whole and accordingly the liquid film thicknessthins in the vertical flow case.
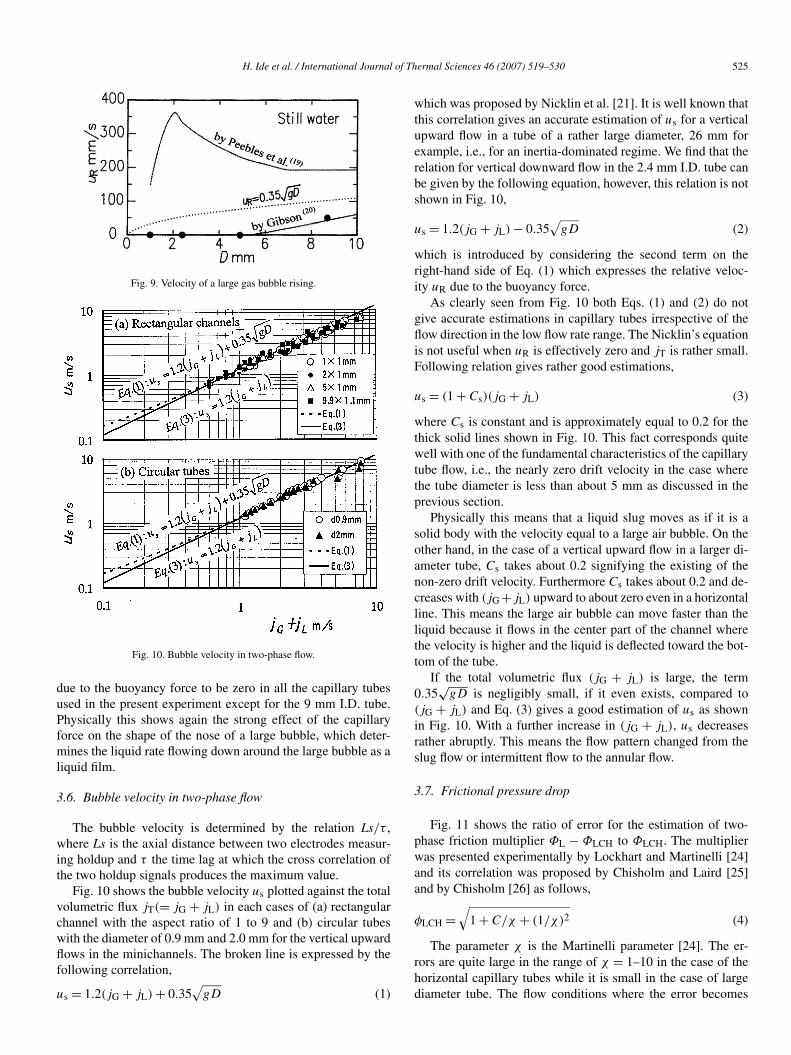
3.3. Flow pattern map of circular tubes
Figs. 7(a)–(c) show the flow pattern map obtained by us. Inthese figures, we show the flow patterns of bubble, and inter-mittent and annular flow observed in each capillary tube with adiameter of 1.0 mm, 2.4 mm, and 4.9 mm, which were plottedsimultaneously on a map at same flow orientation in order toinvestigate the effect of the tube diameter on the flow patterns.The crosshatched zones on the map show the regions of bubbleflow, and annular flow. Notice that there is hardly any influencebecause of tube diameter, on the flow pattern in the present ex-periments range of tube diameters of 1.0 to 4.9 mm. The solidlines in Fig. 7(a) show the boundaries of flow patterns obtainedby Barnea et al. [15] for a 4 mm I.D. vertical upward flow, thesolid lines in (b) by Barnea et al. [15] for a 4 mm I.D. horizon-tal pipe, and the broken lines in (b) by Mandhane et al. [16] for
Fig. 6. Examples of the holdup signal (9 mm × 1.1 mm).
horizontal pipes and the solid line in (c) by Barnea et al. [2] fora 25.5 mm I.D. vertical downward flow.
A comparison of these figures reveals that the present datawhich is shown by marks in those figures agree well with thelines of Barnea et al. only for small pipe size, 4 mm I.D. Theboundaries proposed by Mandhane et al. [16] were determinedby using about 5900 data points for the test sections of the in-ner diameters of 12.7 mm pipes and larger ones. Our data andthe Mandhane’s lines do not agree well as a whole because theirpipe diameters are larger than that of ours. An especially largedifference is noticed in that the separated, and the wavy flowsare not observed in horizontal capillary tubes. The data for thevertical downward flow in a capillary tube was not availablewhen we obtained our data, so we compared our data with theresults taken for 25.5 mm I.D. pipe by Barnea et al. [2]. Thevalidation is very poor. The effect of tube diameter on the flowpattern, however, is smaller in our experimental range of thetube diameter, than large diameter tube data. According to ourexperiments, its effect becomes appreciable if the tube diam-eter is larger than about 6 mm. Our map is rather similar tothose of the horizontal and also the vertical upward flows ex-cept that the annular flow region is wider in our case than thosein the other cases. This fact signifies that the flow patterns ina capillary tube are not severely affected by the flow direction.Physically this means that the surface tension force, has a muchlarger effect on the flow pattern, than the gravitational force, fora gas–liquid two-phase flow in a capillary tube less than about5 mm in diameter.
3.4. Flow pattern maps of flat channel
Fig. 8 shows the flow pattern map classified by using theweighted mean liquid lump velocity proposed by Ide et al. [17].
524 H. Ide et al. / International Journal of Thermal Sciences 46 (2007) 519–530
Fig. 7. Flow pattern map for circular channel.
Fig. 8. Flow pattern map for flat channel.
It shows the effect by an aspect ratio of 1 to 9 of the channelcross section on the flow patterns obtained in vertical capillaryflat channels. The experimental results [17] in capillary circulartubes with diameters of 2.0 mm and 0.9 mm are also shown inFig. 8 for comparison. The symbols, S, F , and A in the figure,
express the flow patterns of the slug, the froth, and the annularflow, respectively. Jones et al. [18] have proposed for the transi-tion from the slug to the annular flow. It was, however, obtainedfor a channel with dimensions of 63.5 mm × 4.85 mm with amuch larger equivalent diameter than that used for the presentexperiments. It is shown in the flow pattern map with a dot-ted line. It is interesting that the boundary given by Jones et al.exists relatively close to those obtained in the present experi-ments.
Fig. 8 shows that both the boundaries of transition from theslug flow to the froth flow regions, and from the froth flow tothe annular flow regions shift to the smaller value of jG as theaspect ratio becomes larger.
3.5. Bubble velocity in a stagnant liquid in a tube
The velocity of a large air bubble rising through a stagnantliquid in a capillary tube uR is shown in Fig. 9 plotted againstthe tube diameter D. Our data is shown by solid circle and thecurve as proposed by Peebles et al. [19], for bubbles in largevolume, Gibson [20], for a long bubble in a vertical tube isshown for comparison. Our data corresponds well with Gib-son’s relation and is considerably different from the other rela-tions. White et al. [22] also investigated the velocity in a widerange of tube diameters and fluid properties. The results aresimilar to those of Gibson for a small diameter tube. It shouldbe noted that the drift velocity uR decreases linearly with thetube diameter D and becomes zero if D becomes smaller thanD = 5.6 mm [23]. Therefore we can consider the drift velocity
H. Ide et al. / International Journal of Thermal Sciences 46 (2007) 519–530 525
Fig. 9. Velocity of a large gas bubble rising.
Fig. 10. Bubble velocity in two-phase flow.
due to the buoyancy force to be zero in all the capillary tubesused in the present experiment except for the 9 mm I.D. tube.Physically this shows again the strong effect of the capillaryforce on the shape of the nose of a large bubble, which deter-mines the liquid rate flowing down around the large bubble as aliquid film.
3.6. Bubble velocity in two-phase flow
The bubble velocity is determined by the relation Ls/τ ,where Ls is the axial distance between two electrodes measur-ing holdup and τ the time lag at which the cross correlation ofthe two holdup signals produces the maximum value.
Fig. 10 shows the bubble velocity us plotted against the totalvolumetric flux jT(= jG + jL) in each cases of (a) rectangularchannel with the aspect ratio of 1 to 9 and (b) circular tubeswith the diameter of 0.9 mm and 2.0 mm for the vertical upwardflows in the minichannels. The broken line is expressed by thefollowing correlation,
us = 1.2(jG + jL) + 0.35√
gD (1)
which was proposed by Nicklin et al. [21]. It is well known thatthis correlation gives an accurate estimation of us for a verticalupward flow in a tube of a rather large diameter, 26 mm forexample, i.e., for an inertia-dominated regime. We find that therelation for vertical downward flow in the 2.4 mm I.D. tube canbe given by the following equation, however, this relation is notshown in Fig. 10,
us = 1.2(jG + jL) − 0.35√
gD (2)
which is introduced by considering the second term on theright-hand side of Eq. (1) which expresses the relative veloc-ity uR due to the buoyancy force.
As clearly seen from Fig. 10 both Eqs. (1) and (2) do notgive accurate estimations in capillary tubes irrespective of theflow direction in the low flow rate range. The Nicklin’s equationis not useful when uR is effectively zero and jT is rather small.Following relation gives rather good estimations,
us = (1 + Cs)(jG + jL) (3)
where Cs is constant and is approximately equal to 0.2 for thethick solid lines shown in Fig. 10. This fact corresponds quitewell with one of the fundamental characteristics of the capillarytube flow, i.e., the nearly zero drift velocity in the case wherethe tube diameter is less than about 5 mm as discussed in theprevious section.
Physically this means that a liquid slug moves as if it is asolid body with the velocity equal to a large air bubble. On theother hand, in the case of a vertical upward flow in a larger di-ameter tube, Cs takes about 0.2 signifying the existing of thenon-zero drift velocity. Furthermore Cs takes about 0.2 and de-creases with (jG +jL) upward to about zero even in a horizontalline. This means the large air bubble can move faster than theliquid because it flows in the center part of the channel wherethe velocity is higher and the liquid is deflected toward the bot-tom of the tube.
If the total volumetric flux (jG + jL) is large, the term0.35
√gD is negligibly small, if it even exists, compared to
(jG + jL) and Eq. (3) gives a good estimation of us as shownin Fig. 10. With a further increase in (jG + jL), us decreasesrather abruptly. This means the flow pattern changed from theslug flow or intermittent flow to the annular flow.
3.7. Frictional pressure drop
Fig. 11 shows the ratio of error for the estimation of two-phase friction multiplier ΦL − ΦLCH to ΦLCH. The multiplierwas presented experimentally by Lockhart and Martinelli [24]and its correlation was proposed by Chisholm and Laird [25]and by Chisholm [26] as follows,
φLCH =√
1 + C/χ + (1/χ)2 (4)
The parameter χ is the Martinelli parameter [24]. The er-rors are quite large in the range of χ = 1–10 in the case of thehorizontal capillary tubes while it is small in the case of largediameter tube. The flow conditions where the error becomes

526 H. Ide et al. / International Journal of Thermal Sciences 46 (2007) 519–530
Fig. 11. Error of the estimation of two-phase multiplier.
large roughly correspond to those of the intermittent flow re-gion. Under these condition of flow ΦL is expressed as follows(Fukano et al. [4]);
φ2L = k
ρT
ρL
(υT
υL
)(jG + jL
jL
)n+1
Ren−mL (5)
Where the suffix ‘L’ means the liquid single flow, ‘T’ the two-phase flow, and we assumed the pressure loss occurs in theliquid slug only. This means that the static pressure is uniformin a large gas bubble. If we recognize that small bubbles rarelyexist in a liquid slug as discussed in the previous section, we canadequately assume that the liquid flow in a liquid slug is similarto that of a single liquid flow. And accordingly if we considerboth the single and the two-phase liquid flows are laminar, forexample, then n = m = −1 in Eq. (5).
φ2L
∼= 1 (6)
On the contrary experimental values of Φ2L were found to
be much larger than one in the flow conditions satisfying theassumption [4] that the both flows are laminar. This discrepancysuggests that there is some mechanism to cause pressure lossother than wall friction.
We propose the mechanism of large increase in the pressureloss in the intermittent region as shown in Fig. 11 as follows. Tosave time we consider the following simple process. As shownin Fig. 12(a) a large gas bubble starts moving up from the closedbottom of a vertical mini tube, and comes out of the top end ofthe tube as shown in Fig. 12(c) through a example shown inFig. 12(b). What happened in this short and simple process? Itis clear that the liquid column above the large gas bubble inFig. 12(a) flows down to the bottom of the tube, which signi-fies that the liquid column loses potential energy during thisprocess due to the relative velocity between the large gas bub-ble and liquid column which is equivalent to a liquid slug. Thelost potential energy at first transferred to kinetic energy of aliquid film flowing down around the large bubble and dissipat-ing in the wake of the large bubble by mixing the liquid in thewake with the liquid rushing into there with high kinetic energy.
Even in a horizontal flow a non-zero relative velocity usuallyexists in a mini tube because the large bubbles flow in the center,i.e., the higher velocity region in the cross section of the tube.
Fig. 12. Example of a large gas bubble ascending in a liquid column.
Fig. 13. Flow model.
And accordingly similar energy mixing loss is caused in thewake of the large bubble. This is the reason, that the energyloss, in the gas–liquid two-phase flow, is larger than a singlephase flow especially in the intermittent flow region.
We then introduced the following plug flow model to explainthe energy loss as shown in Fig. 13. That is, we consider thatthe pressure loss is caused mostly by two mechanisms; one isthe ordinary friction loss, �Pf. The other one is caused by theso-called sudden expansion of liquid flow, from a liquid filmsurrounding a long air bubble, to a liquid slug following thelong air bubble. Then,
PT = �Pf + �Pe (7)
Based on our experimental results we assume that (1) the voidfraction in the liquid slug is zero, and (2) the liquid film is dis-tributed uniformly around the circumference of the air bubble.Under these assumptions �Pf and �Pe are given by Eqs. (8)and (9), respectively [4]. �Pe is strongly affected by the voidfraction in the cross section of a large gas bubble as follows.
�Pf = λL
D
ρT(jG + jL)2LL
(LG + LL)(8)
�Pe = ρLw2L
2(LG + LL)(9)
w = (jG + jL) − [jL − (jG + jL)(1 − γ )](10)
γ (1 − αB)

H. Ide et al. / International Journal of Thermal Sciences 46 (2007) 519–530 527
Fig. 14. Distribution of the flow pattern and pressure gradient along pipe axisthrough a bend.
γ = LG/(LG + LL) (11)
The calculated values of the ratio of �Pe to �Pf show that�Pe becomes much larger than �Pf in some flow conditions,especially when the number of air bubbles, or equivalently, thatof the sudden expansion included in a unit length is large, whichmeans it is one of the important factors to control the magnitudeof �Pe. The pressure loss �Pe is inevitable also in a verticalflow.
The importance of �Pe in a horizontal line is corroboratedby the following experimental results. Figs. 14(a)–(d) show thechange of flow patterns caused during two-phase mixture pass-ing through a return bend placed in a horizontal plane [5]. Inthe case of Fig. 14(b) the flow pattern changes drastically froma short air-bubble-chain flow to a fully developed plug flow.As shown in the figure above, the pressure gradient drasticallychanged in accordance with the drastic change of flow pattern.The vertical short bars attached to the data of jG = 2.2 m s−1,
for example, show the standard deviation of the time varyingpressure which are not caused by accidental errors but causedby the fluctuating nature of two-phase flow.
Based on this flow model we propose a correlation of fric-tional pressure loss. It will be discussed in the next section.
3.8. Correlation of frictional pressure drop
The values of C in Eq. (4) were experimentally investigatedby Wambsganss et al. [9], Kawaji et al. [10] and Mishima etal. [27] for rectangular channels. Kawaji et al. pointed out thatthe depth of a channel or the clearance and jL affect the valueof C. Wambsganss et al. showed that C increases from 5 to 20with increasing jL. According to the examination of the presentexperimental results of jL there is a tendency for C to approach21 with increase in both jL and χ , and to approach 5 when jLand χ are small. We noticed that the effect of jL on ΦL is largeas is also seen in the results obtained by Wambsganss et al. andKawaji et al.
Furthermore we examined the applicability of the Lockhart–Martinelli (L-M) correlation to the two-phase flow in minichan-nels and we concluded that the original L-M correlation isnot useful in predicting two-phase frictional pressure drop inminichannels. Accordingly, we examined the applicability ofthe revised L-M correlations also, which have been proposedby Mishima et al. [27], Wambsganss et al. [9] and Friedel et al.[28]. As a result we found that satisfactory correlations have notbeen obtained in any of our cases because the effects of massvelocity of liquid, i.e. jL are not fully taken into account in theircorrelations.
In our research, the value of C in Eq. (4) is obtained follow-ing the method proposed by Wambsganss et al. as follows:
C = 0.15Re0.61L (12)
Even if Eq. (12) is used a fundamental improvement is notobtained. These discussions lead to the conclusion that we needa different type of correlation.
3.9. Correlations by the produced authors
In order to predict the two-phase pressure drop in horizon-tal capillary circular tubes we produced Eq. (13) based on theflow model discussed in Fig. 13. In introducing Eq. (13), wediscriminated on the flow patterns of the intermittent flow (slugand froth flows) from annular flow in a capillary tube by thesimple method shown as follows.
First of all we characterized the laminar flow (V ) or the tur-bulent flow (T ) of a two-phase intermittent flow in a capillarycircular tube by using the liquid Reynolds numbers in watersingle-phase flow and two-phase flow, where jL and (jG + jL)
are taken as the characteristic velocities, respectively. For ex-ample, when a water single phase flow is laminar (V ) and atwo-phase flow is turbulent (T ), the flow is referred to as V T .Then, the critical Reynolds number from laminar flow to turbu-lent flow is taken as 2400.
For the V T region in a capillary circular tube,
φL = 0.0837{(jG + jL)/jL
}0.425Re3/8
L (13)

528 H. Ide et al. / International Journal of Thermal Sciences 46 (2007) 519–530
Fig. 15. Comparison of experimental results of φL with the calculation ofEq. (15).
In the same way a correlation for vertical capillary flat chan-nels with the aspect ratio TS of 1 to 9 is expressed as follows.
For the V V region in a capillary rectangular channel,
φL = 0.2485T −0.355S
{jL/
√gDh
}−0.233Re3/8
L (14)
For the V T region in a capillary rectangular channel,
φL = 0.0848T −0.145S
{(jG + jL)/jL
}0.425Re3/8
L (15)
where ReL is the same liquid Reynolds number as defined pre-viously.
In the experimental results obtained in a flat channel with theaspect ratio of 9, Eq. (15) only was used, since there was littledata included in the V V region.
Fig. 15 shows the comparison of our experimental resultsφL exp of the two-phase frictional pressure drop obtained in achannel of 9.9 mm × 1.1 mm with the calculated values φLcalby Eq. (15). We have validated that the two-phase frictionalpressure drop in horizontal and vertical capillary rectangularchannels can be estimated by Eq. (15) with sufficient accuracy.
Fig. 16. Liquid film thickness.
3.10. Film thickness
Fig. 16 shows the film thickness around long gas bubblesaveraged over their full lengths in the horizontal tube. The basefilm thickness in annular flow is also plotted against the air su-perficial velocity, with the liquid superficial velocity, and thetube diameter being the parameters. In addition the film thick-ness in a 9 mm I.D. tube determined by assuming the circum-ferential distribution of film thickness is uniform, although thisassumption is not as described before, is also plotted for com-parison. The error in measuring film thickness was 6%–2% in1 mm I.D. pipe, 19%–9% in 2.4 mm I.D. pipe, 24%–6% in4.9 mm I.D. pipe and 17%–8% in 9 mm I.D. pipe. As clearlyshown in Fig. 16 the film thickness decreases by decreasingthe tube diameter, because, the pressure difference between theoutside and the inside of the air bubble becomes larger, i.e.the bubble becomes more rigid, as the tube diameter becomessmaller due to the surface tension force, and accordingly it be-comes more difficult for liquid to pass by the long bubble. Forthe same reason, the film thickness decreases, with the decreasein superficial air velocity jG, in the case of the capillary tube,i.e., D = 1, 2.4 and 4.9 mm. On the other hand, in the exampleof the rather large diameter, 9 mm I.D., tube the film thick-ness increases with decreasing jG. The lower the air velocity,the larger the difference in film thickness. We also noticed thatthe film thickness around the long bubble in intermittent flow,i.e., slug and froth flow, can be easily correlated to the base filmthickness, in annular flow, as the air flow rate increases.
3.11. Mean holdup
Figs. 17(a)–(d) show the change in the mean holdup ηmeanplotted against jG in which the effects of the aspect ratio ofthe test section on ηmean are clarified. The data is plotted forfive different values of jL, ranging from 0.1 m s−1 to 0.7 m s−1.Each of the five lines on each figure corresponds to the meanholdup of the respective liquid flow condition, which is calcu-lated with the following equation previously proposed by us fora vertical capillary channel.
ηmean CAL = 1 − [1 + 1.86 × 10³Eo0.75Fr0.95
× Re−1.03Ca0.17(jL/jG)]−1 (16)

H. Ide et al. / International Journal of Thermal Sciences 46 (2007) 519–530 529
Fig. 17. Time averaged mean holdup.
where Eo is the Eötvös number {≡ (ρL − ρG)gD2e /σL} us-
ing the characteristic length, De defined by Sadatomi et al.[29]. Fr is the Froude number {≡ (jG + jL)/
√gDe, Re the
Reynolds number(≡ GDe/μm), and Ca the Capillary number{≡ μm(jG + jL)/σL}. The parameter G used in Re is the to-tal mass velocity, G = GG + GL = ρGjG + ρLjL and σL is thesurface tension of the liquid and μm the two-phase viscosity. Inthis paper, the two-phase viscosity is expressed by the follow-ing correlation, Eqs. (17).
For the channels of Eo � 0.3,
μm = 0.57μL[β/(1 − β)
]−0.15 = 0.57μL(jG/jL)−0.15 (17.1)
For the channels of Eo < 0.3 (for a channel of 1.0 mm ×1.0 mm), the following equation produces a better accuracy.
μm = 0.45μL(jG/jL
)−0.15{(jG + jL)/
√gDe
}0.13 (17.2)
where β{≡ jG/(jG + jL)} is the ratio of the gas to the mixturevolume flow rates.
From Fig. 17 we can see the effect of jL on the mean holdupand we point out that when the aspect ratio becomes large,ηmean in the region of large jG tends to decrease with increas-ing of jG and in contrast to it, ηmean in the small aspect ratio, inparticular, in the channel of 1.0 mm × 1.0 mm does not changemuch over the relatively wide range of jG and ηmean is large inthe region of froth flow and annular flow.
The reason that ηmean increases in a small aspect ratio is con-sidered to be that the liquid is held at the corners of the cross
section of the channel by the effects of surface tension and vis-cosity. This effect seems to lead to an increase in the velocityof the gas flow in the central portion of the channel and to raiseslip ratio in a capillary channel.
4. Conclusions
We experimentally examined the characteristics of an air–water isothermal two-phase flow in capillary tubes with theinner diameter of 1 mm, 2.4 mm, 4.9 mm as well as in cap-illary rectangular channels with the aspect ratio of 1 to 9 whileusing the data in 9 mm and 26 mm circular tubes as the compar-ison with the ducts with a large cross section. The directions offlow were vertical upward, horizontal and vertical downward.We also proposed correlations of the holdup and the frictionalpressure drop. The results are summarized as follows:
(A) Common to the both minichannels:(1) Capillary force becomes important in the case that the
equivalent diameter is less than 5 mm.(2) Flow pattern does not change much according to the
flow direction.(B) For the circular tube:
(3) Separated flow was not observed in any flow condi-tions tested in the present experiments.
(4) Even in the horizontal flow the flow pattern becomesaxisymmetrical, and the water film thickness is cir-cumferentially uniform.
(5) Small bubbles usually do not exist in liquid slugs andliquid films.
(6) Drift velocity is approximately zero independentof the flow direction. And the bubble velocity ap-proaches to the total volumetric flux jT as jT becomessmall.
(7) The frictional multiplier becomes very large com-pared to the predictions by the Chisholm’s correlationin the intermittent flow. In that case the pressure losscaused at the tail of long bubble due to the suddenexpansion of flow field of liquid flow becomes impor-tant.
(C) For the mini flat channel:(8) The effects of the aspect ratio on the flow pattern map,
the mean holdup and the two-phase frictional pressuredrop were made clear in vertical channels.
(9) The differences between the vertical and the horizon-tal channel cause noticeable differences in the mea-sured parameters in the annular flow region where jG
is larger than about 10 m s−1. That is, the mean holdupis smaller in the vertical channel than in the horizontalchannel. On the other hand, the two-phase frictionalpressure drop and the passing frequency of the liquidlumps are larger in the vertical channel than in the hor-izontal channel.
(10) In the horizontal channel, the effects of the differencein the channel setting, longitudinal or transverse, aresmall on the measured parameters.

530 H. Ide et al. / International Journal of Thermal Sciences 46 (2007) 519–530
(11) We proposed the correlations for the mean holdupand for the two-phase frictional pressure drop. Thepredictions obtained from these correlations have suf-ficient accuracy for both the vertical and the horizontalcases.
References
[1] M. Suo, P. Griffith, Two-phase flow in capillary tubes, ASME J. BasicEng. (1964) 576–582.
[2] D. Barnea, O. Shoham, Y. Taitel, Flow pattern transition for vertical down-ward two phase flow, Chem. Eng. Sci. 37 (5) (1982) 741–744.
[3] C.A. Damianides, J.W. Westwater, Two-phase flow patterns in a compactheat exchanger and in small tubes, in: Proceedings of the Second UK Na-tional Conf. On Heat Transfer, Glasgow, 14–16 September, MechanicalEngineering Publications, London, 1988, pp. 1257–1268.
[4] T. Fukano, A. Kariyasaki, M. Kagawa, Flow patterns and pressure drop inisothermal gas–liquid concurrent flow in a horizontal capillary tube, Trans.JSME B 56 (528) (1990) 2318–2326.
[5] A. Kariyasaki, T. Fukano, A. Ousaka, M. Kagawa, Characteristics of time-varying void fraction in isothermal air–water concurrent flow in a horizon-tal capillary tube, Trans. JSME B 57 (544) (1991) 4036–4043.
[6] K. Mishima, T. Hibiki, Effect of inner diameter on some characteristics ofair–water two-phase flows in capillary tubes, Trans. JSME Ser. B 61 (589)(1995) 3197–3204.
[7] L. Troniewski, R. Ulbrich, Two-phase gas–liquid flow in rectangular chan-nels, Chem. Eng. Sci. 39 (1984) 751–765.
[8] B. Lowry, M. Kawaji, Adiabatic vertical two-phase flow in narrow flowchannels, AIChE Symp. Ser. 84 (263) (1988) 133–139.
[9] M.W. Wambsganss, J.A. Jendrzejczyk, D.M. France, N.T. Obot, Frictionalpressure gradients in two-phase flow in a small horizontal rectangularchannel, Int. J. Exp. Thermal Fluid Sci. 5 (1) (1992) 40–56.
[10] M. Ali, M. Sadatomi, M. Kawaji, Adiabatic two-phase flow in narrowchannels between two flat plates, Can. J. Chem. Eng. 71 (5) (1993) 657–666.
[11] T. Wilmarth, M. Ishii, Two-phase flow regimes in narrow rectangular ver-tical and horizontal channels, Int. J. Heat Mass Transfer 37 (12) (1994)1749–1758.
[12] K.A. Triplett, S.M. Ghiaasiaan, S.I. Abdel-Khalik, A. LeMouel, B.N. Mc-Cord, Gas–liquid two-phase flow in micro channels. Part II: Void fractionand pressure drop, Int. J. Multiphase Flow 25 (1999) 395–410.
[13] J.L. Xu, P. Cheng, T.S. Zhao, Gas–liquid two-phase flow regimes in rec-tangular channels with mini/micro gaps, Int. J. Multiphase Flow 25 (1999)411–432.
[14] T. Fukano, Measurement of time varying thickness of liquid film flowingwith high speed gas flow by a constant electric current method (CECM),Nuclear Eng. Design 184 (1998) 363–377.
[15] D. Barnea, Y. Luninski, Y. Yaitel, Flow in small diameter pipes, Can. J.Chem. Eng. 61 (1983) 617–620.
[16] J.M. Mandhane, G.A. Gregory, K. Aziz, A flow pattern map for gas–liquidflow in horizontal pipes, Int. J. Multiphase Flow 1 (1974) 537–553.
[17] H. Ide, H. Matsumura, T. Fukano, Velocity characteristics of liquid lumpsand its relation to flow patterns in gas–liquid two-phase flow in verticalcapillary tubes, in: Gas Liquid Flow, Book No. G00975, in: FE, vol. 19,1995, pp. 1–8.
[18] O.C. Jones, N. Zuber, Two-Phase Momentum, Heat and Mass Transfer inChemical, Process, and Energy Engineering System, vol. 1, McGraw-Hill,NY, 1979, pp. 345–355.
[19] F.N. Peebles, H.J. Garber, Studies on the motion of gas bubbles in liquid,Chem. Eng. Prog. 49 (2) (1953) 79–88.
[20] A.H. Gibson, On the motion of long air-bubbles in a vertical tube, Phil.Mag. 26 (156) (1913) 952–965.
[21] D.J. Nicklin, J.O. Wilke, J.F. Davidson, Two-phase flow in vertical tubes,Trans. Inst. Chem. Eng. 40 (1) (1962) 61–68.
[22] E.T. White, R.H. Beardmore, The velocity of single cylindrical air bubblesthrough liquids contained in vertical tubes, Chem. Eng. Sci. 17 (1962)351–361.
[23] F.P. Bretherton, The motion of long bubbles in tubes, J. Fluid Mech. 10(1961) 166–188.
[24] R.W. Lockhart, R.C. Martinelli, Proposed correlation of data for isother-mal two-phase, two-component flow in pipes, Chem. Eng. Prog. 45 (1949)39–48.
[25] D. Chisholm, A.D.K. Laird, Two-phase flow in rough tubes, Trans.ASME 80 (2) (1958) 276–286.
[26] D. Chisholm, A theoretical basis for the Lockhart–Martinelli correlationfor two-phase flow, Int. J. Heat Mass Transfer 10 (1967) 1767–1778.
[27] K. Mishima, T. Hibiki, H. Nishihara, Some characteristics of gas–liquidflows in narrow rectangular ducts, Int. J. Multiphase Flow 19 (1993) 115–124.
[28] L. Friedel, Improved friction pressure drop correlation for horizontal andvertical two-phase pipe flow, in: European Two-Phase Flow Group Meet-ing, Ispra, Italy, Paper E2, 1979.
[29] M. Sadatomi, Y. Sato, S. Saruwatari, Two-phase flow in vertical noncircu-lar channels, Int. J. Multiphase Flow 8 (6) (1982) 641–655.


![Informational Holdup and Performance Persistence …faculty.haas.berkeley.edu/vissing/rfs_hlvj.pdf[12:00 29/7/2013 RFS-hht046.tex] Page: 1 1–51 Informational Holdup and Performance](https://img.pdfslide.us/doc/110x75/5e97e46e3fd609406356b3b9/informational-holdup-and-performance-persistence-1200-2972013-rfs-hht046tex.jpg)