Embed Size (px)
Citation preview
F FUUNNDDAAMMEENNTTAALL SSTTUUDDYY OOFF TTWWOO S
KTH Industrial Engineering
and Management
SEELLLLEECCTTEEDD TTRROOPPIICCAALL BBIIOOMMAASSSS FFOORR EENNEERRGGYY:: ccooccoonnuutt aanndd ccaasshheeww nnuutt sshheellllss
ALBERTO JÚLIO TSAMBA
Doctoral Thesis inEnergy and Furnace Technology
Stockholm, Sweden 2008

Âjx Åâáà vtÜx tuÉâà à{x ãÉÜÄw Éy ÉâÜ v{|ÄwÜxÇ tÇw zÜtÇwv{|ÄwÜxÇ? t ãÉÜÄw ãx Åtç ÇxäxÜ áxxAÊ
Bertrand Arthur William Russell, British author, social activist, mathematician, & philosopher (1872 - 1970)
ii
FUNDAMENTAL STUDY OF TWO SELLECTED TROPICAL BIOMASSES FOR ENERGY: coconut and cashew nut shells Abstract Cashew nut and coconut shells are two potential renewable and environmentally friendly energy sources that are commonly found as agro-industrial wastes in tropical countries. Despite this fact, they are not yet widely studied as such. Given this lack of specific technical and reliable data, technologies for their conversion into energy cannot be designed with confidence as it happens with other commonly studied biomass feedstock. Thus, the need to generate these data guided this research in order to provide technical information for the designing of appropriate thermochemical conversion technologies for energy generation, particularly, in remote areas, where electricity grid is neither a feasible nor an affordable solution. Among thermochemical processes, pyrolysis plays a key role as it is found in both combustion and gasification at their earlier stages. In both technologies, pyrolysis products are generated and later submitted to further transformations according to the process in use. Hence, pyrolysis was selected for thermal characterisation of cashew nut and coconut shells. The main characteristics envisaged are i) pyrolysis profiles; ii) global, semi-global and individual kinetics; iii) pyrolysis global and individual yields; iv) modelled pyrolysis yields at high heating rates; and, v)char combustion kinetics and reactivity. The main technique used for experimental data generation is thermogravimetry and FTIR spectroscopy. Data experimentally generated from TG and TG-FTIR experiments were processed through different methods and codes, such as the Coats and Redfern model-fitting method, the model-free methods of Ozawa-Flynn-Wall, Friedman and ASTM E698, for semi-global and global kinetics; DAEM and FG-Biomass were used for pyrolysis individual kinetics and yields determination. Proximate and ultimate analyses were performed as well. The study revealed peculiar characteristics compared to the commonly known lignocellulosic biomass. The volatiles content was above 66%w/w; hemicelluloses DTG peak did not overlap with the cellulose peak; the global pyrolysis activation energies were around 200 and 120 kJ/mol for coconut and cashew nut shells, respectively. Hemicelluloses and cellulose showed varying activation energies as 130-216 and 155-208 kJ/mol, respectively. Char combustion showed two steps with activation energies of 135 and 121 kJ/mol (cashew nut shells); 105 and 190kJ/mol (coconut shells). Individual yields and kinetics were determined for 17 compounds, including tars. These data are of key importance for modelling and the consequent data generation for the designing of appropriate thermochemical energy for these biomasses. Key words: Cashew nut shells, coconut shells, biomass, thermogravimetry, pyrolysis, kinetics, combustion, renewable energy
iii
Extended Summary (in Portuguese)
iv
Resumo A casca de castanha de cajú (CNS) e a carcaça de coco (CcNS) são duas potenciais fontes renováveis de energia ambientalmente benignas que ocorrem normalmente como desperdício da agro-indústria em países tropicais na América Latina, África e Ásia. Apesar desse facto, continuam sendo pouco estudadas nesta condição. De facto, enquanto a carcaça de coco é mais reconhecida como matéria-prima para a produção de carvão activado, a casca de castanha de cajú é vulgarmente conhecida sobretudo como precursora de cnsl. Tanto o cnsl1 como o carvão activado possuem um grande valor comercial. Como consequência directa desta lacuna, as tecnologias para a conversão térmica destes dois tipos de biomassa em energia não podem ser projectadas com precisão, como acontece com outros tipos de biomassa comumente estudados. Sendo Moçambique um destes países nos quais estes desperdícios de biomassa abundam e onde ainda não se conhece uma utilização prática eficiente, este estudo foi projectado na perspectiva de fornecer dados técnicos aplicáveis ao desenho e projecto de tecnologias apropriadas para a conversão térmica destes materiais em energia através de sistemas isolados, particularmente nas zonas remotas do país, para onde a extensão rede eléctrica seria económica e finaceiramente inviável. Processos de conversão termoquímica constituem as técnicas mais importantes usadas na geração de energia a partir de biomassa sólida. Com efeito, a pirólise, a gaseificação e a combustão são os processos térmicos mais importantes que têm merecido mais atenção na I&D na comunidade de investigadores sobre tecnologias de geração de energia a partir da biomassa sólida. De entre estes três processos, a pirólise é a que desempenha papel mais importante e determinante na conversão térmica de biomassa dado que ocorre na fase inicial de cada um dos restantes dois processos. De facto, qualquer decomposição térmica de combustíveis sólidos começa por pirólise, desenvolvendo uma degradação induzida por aquecimento. Os produtos desta fase são materiais voláteis (gasosos), alcatrão-de-hulha ou piche (líquido) e carvão (resíduo sólido). Estes produtos são subsequentemente submetidos a transformações de acordo com a tecnologia de conversão térmica aplicada. O desempenho da pirólise determina o curso e os rendimentos dos processos subsequentes. Neste estudo, dado o papel da pirólise nos processos de conversão térmica da biomassa sublinhado acima, ela foi eleita como o processo através do qual a caracterização térmica é feita. Esta cartacterização visa produzir informação técnica específica como i)perfis da pirólise; ii) cinética global, semi-global e individual dos produtos da pirólise; iii)rendimentos globais e individuais da pirólise; iv)simulação de rendimentos da pirólise a ritmos de aquecimentos mais elevados que os experimentais; e, v)reactividade e cinética de combustão do carvão produzido na pirólise. A principal técnica utilizada para a obtenção de dados experimentais é a termogravimetria e a espectroscopia infra-vermelha com transformadas de Fourier (FTIR). O processamento dos dados obtidos experimentalmente foi realizado recorrendo a diferentes métodos. Os perfis da pirólise foram determinados através dos termogramas e termogramas diferenciais obtidos a partir dos dados experimentais. A cinética química da pirólise de biomassa é referida como obedecendo um mecanismo de reacções químicas paralelas e independentes. Para a biomassa em especial, supondo uma decomposição semi-global, as reacções químicas paralelas são originadas pela desintegração térmica independente dos seus principais componentes,
1 Cashew nut shell liquid
v
nomeadamente as hemiceluloses, a celulose e a lignina. Deste modo, para a determinação dos parâmetros cinéticos da pirólise semi-global foi usado o Método de Coats e Redfern asssumindo, em primeira análise, reacções de primeira ordem e, em seguida, aplicando-se o método de modelo-ajustado para a determinação da ordem mais aproximada aos dados experimentais. Para a pirólise global foi aplicado o mecanismo de reacções de etapa única. O método de modelo ajustado e o independente-de-modelo (com destaque para os métodos isoconversionais de Ozawa-Flynn-Wall e de Friedman) são os meios usados para a determinação dos parâmetros cinéticos correspondentes. Estas duas técnicas foram também aplicadas para a determinação dos parâmetros cinéticos da combustão do carvão. A avaliação da reactividade do carvão foi feita com recurso a um método simples baseado no conceito de temperatura crítica. Os resultados denunciaram mais particularidades do que semelhanças em relação à biomassa comumente estudada. Contrariamente às curvas sobrepostas que ocorrem ordinariamente na pirólise de biomassa para a decomposição das hemiceluloses e da celulose, este estudo revelou um comportamento peculiar que consiste na evolução de dois picos distintos para estes dois componentes lenhosos. Estes picos ocorrem a temperaturas relativamente mais baixas que na biomassa comum. Adicionalmente, o conteúdo de voláteis em ambos os materiais em estudo (CNS e CcNS) é superior, em média, ao normalmente encontrado na biomassa. A determinação da cinética de pirólise semi-global revelou que as energias de activação de decomposição térmica das hemiceluloses e da celulose são ligeiramente superiores aos valores médios mínimos das outras biomassas mas, ainda assim, dentra gama geralmente indicada para materiais de natureza similar. Para as hemiceluloses, a energia de activação variou entre 130 e 216kJ/mol. Para a celulose, o mesmo parâmetro variou entre 155 e 208 kJ/mol. O factor de frequência para a decomposição térmica das hemiceluloses e da celulose variou entre 7,8x1008 e 6,25x10¹⁶ s-1 e entre 1,2x10¹⁰ e 1,31x10¹⁴ s-1, respectivamente. As energias de activação e factores de frequências mais elevadas foram encontradas na pirólise de CNS. As energias de activação médias na cinética química da pirólise global foram 195,73±8,29 e 122,34±18,48 kJ/mol para CcNS e CNS, respectivamente. Os factores de frequência nas mesmas condições foram 3,16x10¹⁴ e 1,66x10⁸ s-1, para CcNS e CNS, respectivamente. Os produtos da pirólise foram agregados em voláteis (que incluem todos os componentes gasosos e o alcatrão-da-hulha, propenso à volatilização) e carvão. Dezassete espécies (incluindo o alcatrão da hulha, determinado por diferença) foram identificadas através de um sistema combinado TG-FTIR2 como produtos individuais que evoluem da pirólise. Em média, os rendimentos3 da CcNS foram de 77,30% em matéria volátil e o resto foi carvão. Os rendimentos de CNS foram 83,02% em voláteis. Os rendimentos em carvão tendem a diminuir com o aumento do ritmo de aquecimento, favorecendo o rendimento em voláteis. Os rendimentos em alcatrão da hulha foram 32,08 e 36,96% na CcNS e CNS, respectivamente. Com o agravamento do ritmo de aquecimento, os rendimentos em alcatrão-da-hulha tendem a aumentar à custa da diminuição dos rendimentos em voláteis.
2 Analisador termogravimétrico (TG) e espectrómetro Transformada de Fourier de infra‐vermelhos (FTIR) 3 Os rendimentos são definidos na base‐seca‐livre‐de‐cinzas
vi
Os principais componentes da fracção gasosa da pirólise de CNS foram os óxidos de carbono, o metano, o acetaldeído e o ácido acético, totalizando 23,81% da massa total dos produtos da pirólise. Na de CcNS, destacaram-se os óxidos de carbono, o formaldeído, o ácido fórmico, o acetaldeído, o metanol, o fenol e a acetona totalizando 30,46% da massa na mesma base. Assumindo reacções químicas de primeira ordem e o modelo de energias activadas distribuídas (DAEM), foram determinados os parâmetros individuais de cinética química de cada uma das espécies voláteis que evoluem de um determinado precursor. CcNS e CNS apresentaram o mesmo número de precursores (32), ainda que não sejam necessariamente todos iguais. As espécies que evoluem de mais do que dois precursores são CO (3;4), CO2 (4;4), H2O (4;3) e NH3 (3;0) em CNS e CcNS, respectivamente. A acetona, o metanol, o cianeto de hidrogénio, o ácido fórmico e o isociânico foram as espécies que evoluíram de apenas um precursor na pirólise de CNS, enquanto sòmente o sulfureto de carbonil é que proveio de um único precursor na termólise de CcNS. Os parâmetros de cinética química derivados para cada um destes produtos da pirólise, em função dos respectivos precursores, constituem dados de entrada necessários e suficientes para a previsão dos rendimentos da pirólise, com qualquer programa de temperaturas, usando qualquer modelo de simulação computacional. Neste estudo, a modelação foi realizada usando um modelo de simulação baseado na DAEM conhecido como FG-Biomass, que foi derivado do FG-DVC (grupo funcional, volatilização de ligação cruzada)4. A cinética da combustão do carvão tanto da pirólise de CcNS como da de CNS foi determinada com recurso a diferentes métodos. Em geral, a curva de velocidade da reacção de combustão do carvão revelou dois picos diferentes, o que denota a existência de uma combustão em dois estágios igualmente diferentes. Na combustão do carvão de CNS, a primeira etapa foi responsável pela perda de 90 a 98% da massa total perdida na combustão. As constantes cinéticas nesta etapa foram Eact,1=135,14 kJ/mol e A1=6,17x1006s-1, tendo a segunda etapa registado Eact,2=121,20kJ/mol e A2=2,54x1005s-1. Ambas as reacções ajustaram-se melhor ao modelo autocatalítico, apresentando Kcat,1=0,3265 (n1=1) e Kcat,2=1,3785 (ordem n2=1,8194) na primeira e segunda etapas, respectivamente. A combustão de CcNS apresentou Eact,1=105,00 kJ/mol para A1=5,09x1006s-1 e Eact,2=190,52 kJ/mol para A2=3,67x10¹²s-1. Apenas a primeira etapa é que manifestou autocatálise (Kcat,1=-4,000). A primeira e a segunda reacções apresentaram ordens com a magnitude n1=0,592 e n2=1,249, respectivamente. Os carvões obtidos tanto da pirólise de CcNS como da de CNS manifestaram, em geral, alta reactividade química para a combustão, quando comparados com os carvões de casca de azeitonas, de resíduos de uvas e de madeira de pinho, cujos dados estão disponíveis na literatura. Este estudo contribuiu para a produção de dados termotécnicos que a comunidade científica passa a ter à sua disposição para diferentes fins como a modelação da pirólise e a projecção ou escolha de tecnologias de conversão energética apropriadas a este tipo especial de biomassa, visando a geração de energia. Este foi, aliás, o compromisso principal assumido para o desenvolvimento desta investigação. Estes resultados, à medida que foram sendo produzidos, foram sendo postos à disposição da comunidade científica através de diferentes meios, tais
4 Functional group, devolatilization‐cross‐linking

vii
como conferências internacionais e jornais científicos internacionalmente reconhecidos, o que contribuiu grandemente para o seu apuramento. Palavras-chave:
Casca de castanha-de-cajú, carcaça de coco, biomassa, termogravimetria, pirólise, cinética química, combustão, energia renovável
viii
Acknowledgements My profound and special acknowledgements to:
The Swedish Agency for International Development Cooperation (SIDA) for providing the financial support to the present research through the Efficient and Environmentally Friendly Gasification of Biomass for Electricity Generation Project at the Universidade Eduardo Mondlane, in Mozambique;
The Faculty of Engineering at the Universidade Eduardo Mondlane (Mozambique) for its full commitment with this research work and with my postgraduate studies; for solicitously exempting me from my ordinary day‐to‐day duties during substantial time intervals, as well as for
providing all the supportive logistics, guidance, planning and working environment, which contributed to achieve the envisaged immediate goals and have influenced confidently the research work both inside and outside the country;
The Department of Materials Science and Engineering at the Royal Institute of Technology (Sweden), through the Division of Energy and Furnace Technology for selflessly providing the necessary resources, assistance, guidance, and atmosphere for my research.
Without any of these three entities commitment and loyalty to this research, my enthusiasm would not have sufficed the highly demanding requirements to achieve good results in the field of renewable energy research.
KTH - Industrial Engineeering and Management

ix
Professor Wlodzimierz Blasiak and Dr. Weihong Yang have been tremendously supportive in all aspects, from academic issues to logistics as well as to the simply humanistic oriented concerns and demands. Their personal commitment with the achievements of this research surpassed their merely administrative and academic assigned obligations. Dr. Carlos Lucas is acknowledged for his unparalleled concern with my work and his encouragement to overcome the barriers and difficulties that have been arising along the work. To these three recognised scientists in energy technology, I am and will be deeply grateful forever. To the Head of the Department of Materials Science and Engineering, Professor Pär Jonsson, my recognition for his outstanding guidance through all the administrative labyrinths. His informality and openness helped softening the always complex and unavoidable defence procedures. Far away from home, friendly working atmosphere was provided to me at the Department of Materials Science and Engineering by my colleagues, friends and MSE staff. Magnus, Artur, Patrik and Anna; Kaisa, Pawel and Senthoor were unquestionably superb as colleagues and friends. Jan Bång, Ulf, Christina have just been fabulously and exceptionally supportive. I express my great thanks to them. These thanks are extensive to those who had contributed to welcome myself at KTH as Rasmus, Reza and Simon and, with no exception, to all the MSE personnel. I would like to thank the Mozambican Embassy in Stockholm and the respective personnel for their distinguishable help to my stay in Sweden which made me feel privileged. The Mozambican community in Sweden was simply marvellous. My special friends and colleagues in Mozambique, Maida Khan for the fruitful discussions we had, and Américo Muchanga for everything. I publicly declare my particular veneration to my family in Mozambique, in the pure African meaning of the term family, for the never‐ending support throughout my studies.

x
Unquestionably, this list will never be comprehensive since many people have contributed, in different ways, direct and indirectly, to my achievements. This is an inevitable risk that I cannot pretend to ignore. Hence, I declare my apologies to all that may feel ignored in these acknowledgements. I would like to reassure that everyone is well kept in my memory forever and ever. Finally, an ardent and endless kiss to my beloved Odette and to my little son Kyan, for everything. To these two, I declare my deepest apologies for being away from them for all this long and interminable time.
Stockholm, September, 30th, 2008
The author,

xi
FUNDAMENTAL STUDY OF TWO SELLECTED TROPICAL BIOMASSES FOR ENERGY: coconut and cashew nut shells
Table of Contents
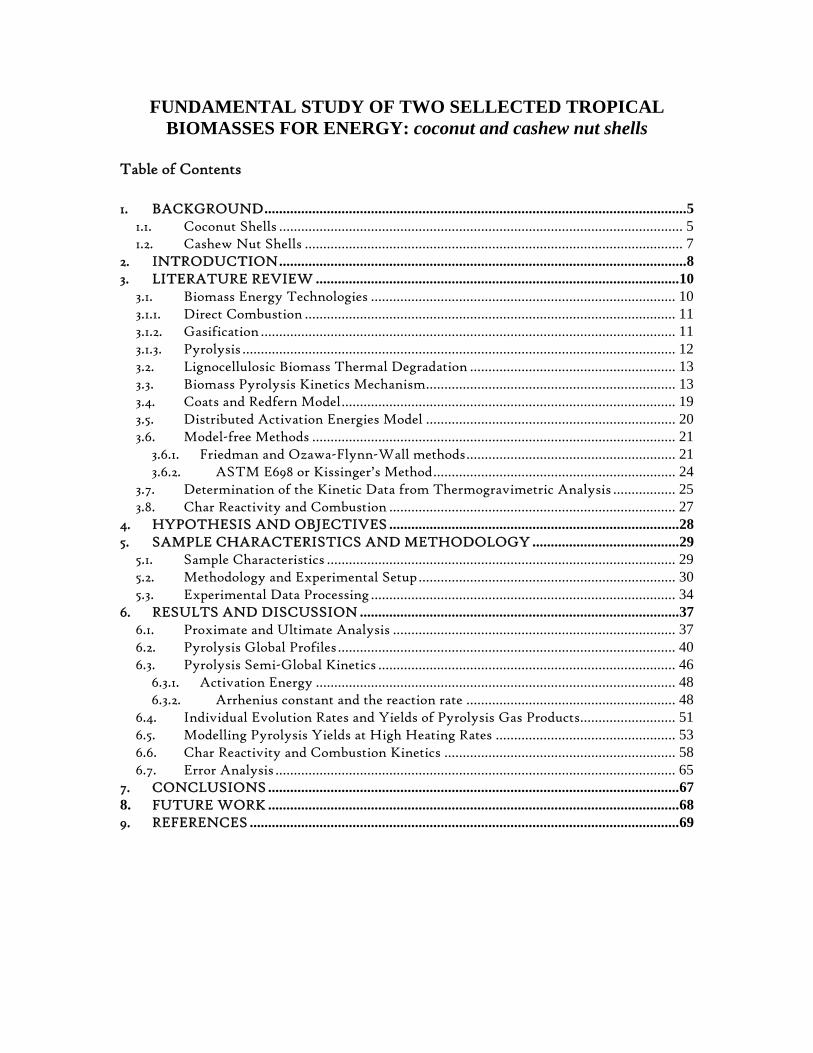
1. BACKGROUND...................................................................................................................5
1.1. Coconut Shells .............................................................................................................. 5 1.2. Cashew Nut Shells ....................................................................................................... 7
2. INTRODUCTION...............................................................................................................8 3. LITERATURE REVIEW ...................................................................................................10
3.1. Biomass Energy Technologies ................................................................................... 10 3.1.1. Direct Combustion ..................................................................................................... 11 3.1.2. Gasification ................................................................................................................. 11 3.1.3. Pyrolysis ...................................................................................................................... 12 3.2. Lignocellulosic Biomass Thermal Degradation ........................................................ 13 3.3. Biomass Pyrolysis Kinetics Mechanism.................................................................... 13 3.4. Coats and Redfern Model........................................................................................... 19 3.5. Distributed Activation Energies Model .................................................................... 20 3.6. Model-free Methods ................................................................................................... 21
3.6.1. Friedman and Ozawa-Flynn-Wall methods......................................................... 21 3.6.2. ASTM E698 or Kissinger’s Method.................................................................. 24
3.7. Determination of the Kinetic Data from Thermogravimetric Analysis ................. 25 3.8. Char Reactivity and Combustion .............................................................................. 27
4. HYPOTHESIS AND OBJECTIVES ...............................................................................28 5. SAMPLE CHARACTERISTICS AND METHODOLOGY ........................................29
5.1. Sample Characteristics ............................................................................................... 29 5.2. Methodology and Experimental Setup ...................................................................... 30 5.3. Experimental Data Processing ................................................................................... 34
6. RESULTS AND DISCUSSION .......................................................................................37 6.1. Proximate and Ultimate Analysis ............................................................................. 37 6.2. Pyrolysis Global Profiles ............................................................................................ 40 6.3. Pyrolysis Semi-Global Kinetics ................................................................................. 46
6.3.1. Activation Energy .................................................................................................. 48 6.3.2. Arrhenius constant and the reaction rate ......................................................... 48
6.4. Individual Evolution Rates and Yields of Pyrolysis Gas Products.......................... 51 6.5. Modelling Pyrolysis Yields at High Heating Rates ................................................. 53 6.6. Char Reactivity and Combustion Kinetics ............................................................... 58 6.7. Error Analysis ............................................................................................................. 65
7. CONCLUSIONS ................................................................................................................67 8. FUTURE WORK ................................................................................................................68 9. REFERENCES .....................................................................................................................69
2
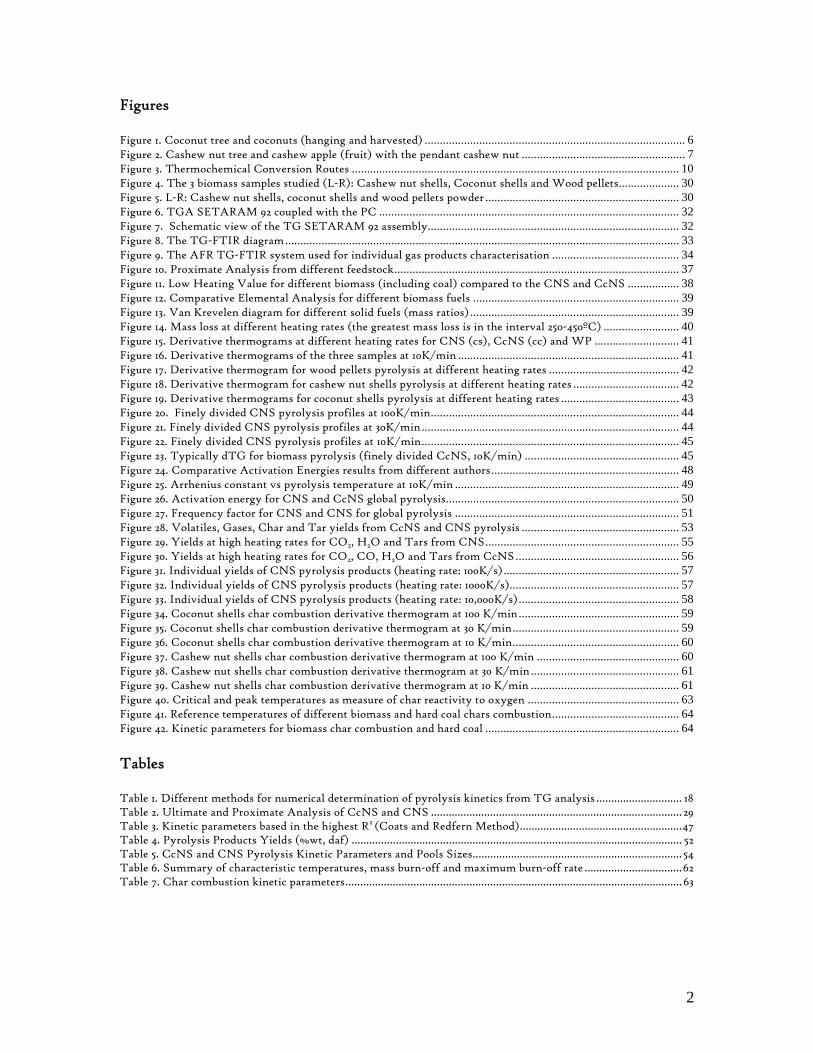
Figures
Figure 1. Coconut tree and coconuts (hanging and harvested) ...................................................................................... 6 Figure 2. Cashew nut tree and cashew apple (fruit) with the pendant cashew nut ...................................................... 7 Figure 3. Thermochemical Conversion Routes ............................................................................................................ 10 Figure 4. The 3 biomass samples studied (L-R): Cashew nut shells, Coconut shells and Wood pellets.................... 30 Figure 5. L-R: Cashew nut shells, coconut shells and wood pellets powder ................................................................ 30 Figure 6. TGA SETARAM 92 coupled with the PC ................................................................................................... 32 Figure 7. Schematic view of the TG SETARAM 92 assembly................................................................................... 32 Figure 8. The TG-FTIR diagram .................................................................................................................................. 33 Figure 9. The AFR TG-FTIR system used for individual gas products characterisation .......................................... 34 Figure 10. Proximate Analysis from different feedstock.............................................................................................. 37 Figure 11. Low Heating Value for different biomass (including coal) compared to the CNS and CcNS ................. 38 Figure 12. Comparative Elemental Analysis for different biomass fuels .................................................................... 39 Figure 13. Van Krevelen diagram for different solid fuels (mass ratios) ..................................................................... 39 Figure 14. Mass loss at different heating rates (the greatest mass loss is in the interval 250-450ºC) ......................... 40 Figure 15. Derivative thermograms at different heating rates for CNS (cs), CcNS (cc) and WP ............................ 41 Figure 16. Derivative thermograms of the three samples at 10K/min ......................................................................... 41 Figure 17. Derivative thermogram for wood pellets pyrolysis at different heating rates ........................................... 42 Figure 18. Derivative thermogram for cashew nut shells pyrolysis at different heating rates ................................... 42 Figure 19. Derivative thermograms for coconut shells pyrolysis at different heating rates ....................................... 43 Figure 20. Finely divided CNS pyrolysis profiles at 100K/min.................................................................................. 44 Figure 21. Finely divided CNS pyrolysis profiles at 30K/min ..................................................................................... 44 Figure 22. Finely divided CNS pyrolysis profiles at 10K/min..................................................................................... 45 Figure 23. Typically dTG for biomass pyrolysis (finely divided CcNS, 10K/min) ................................................... 45 Figure 24. Comparative Activation Energies results from different authors.............................................................. 48 Figure 25. Arrhenius constant vs pyrolysis temperature at 10K/min .......................................................................... 49 Figure 26. Activation energy for CNS and CcNS global pyrolysis............................................................................. 50 Figure 27. Frequency factor for CNS and CNS for global pyrolysis .......................................................................... 51 Figure 28. Volatiles, Gases, Char and Tar yields from CcNS and CNS pyrolysis .................................................... 53 Figure 29. Yields at high heating rates for CO2, H2O and Tars from CNS................................................................ 55 Figure 30. Yields at high heating rates for CO2, CO, H2O and Tars from CcNS ...................................................... 56 Figure 31. Individual yields of CNS pyrolysis products (heating rate: 100K/s).......................................................... 57 Figure 32. Individual yields of CNS pyrolysis products (heating rate: 1000K/s)........................................................ 57 Figure 33. Individual yields of CNS pyrolysis products (heating rate: 10,000K/s)..................................................... 58 Figure 34. Coconut shells char combustion derivative thermogram at 100 K/min ..................................................... 59 Figure 35. Coconut shells char combustion derivative thermogram at 30 K/min....................................................... 59 Figure 36. Coconut shells char combustion derivative thermogram at 10 K/min....................................................... 60 Figure 37. Cashew nut shells char combustion derivative thermogram at 100 K/min ............................................... 60 Figure 38. Cashew nut shells char combustion derivative thermogram at 30 K/min ................................................. 61 Figure 39. Cashew nut shells char combustion derivative thermogram at 10 K/min ................................................. 61 Figure 40. Critical and peak temperatures as measure of char reactivity to oxygen .................................................. 63 Figure 41. Reference temperatures of different biomass and hard coal chars combustion.......................................... 64 Figure 42. Kinetic parameters for biomass char combustion and hard coal ................................................................ 64
Tables
Table 1. Different methods for numerical determination of pyrolysis kinetics from TG analysis ............................. 18 Table 2. Ultimate and Proximate Analysis of CcNS and CNS .....................................................................................29 Table 3. Kinetic parameters based in the highest R2 (Coats and Redfern Method).......................................................47 Table 4. Pyrolysis Products Yields (%wt, daf) ................................................................................................................ 52 Table 5. CcNS and CNS Pyrolysis Kinetic Parameters and Pools Sizes....................................................................... 54 Table 6. Summary of characteristic temperatures, mass burn-off and maximum burn-off rate .................................62 Table 7. Char combustion kinetic parameters.................................................................................................................. 63
3
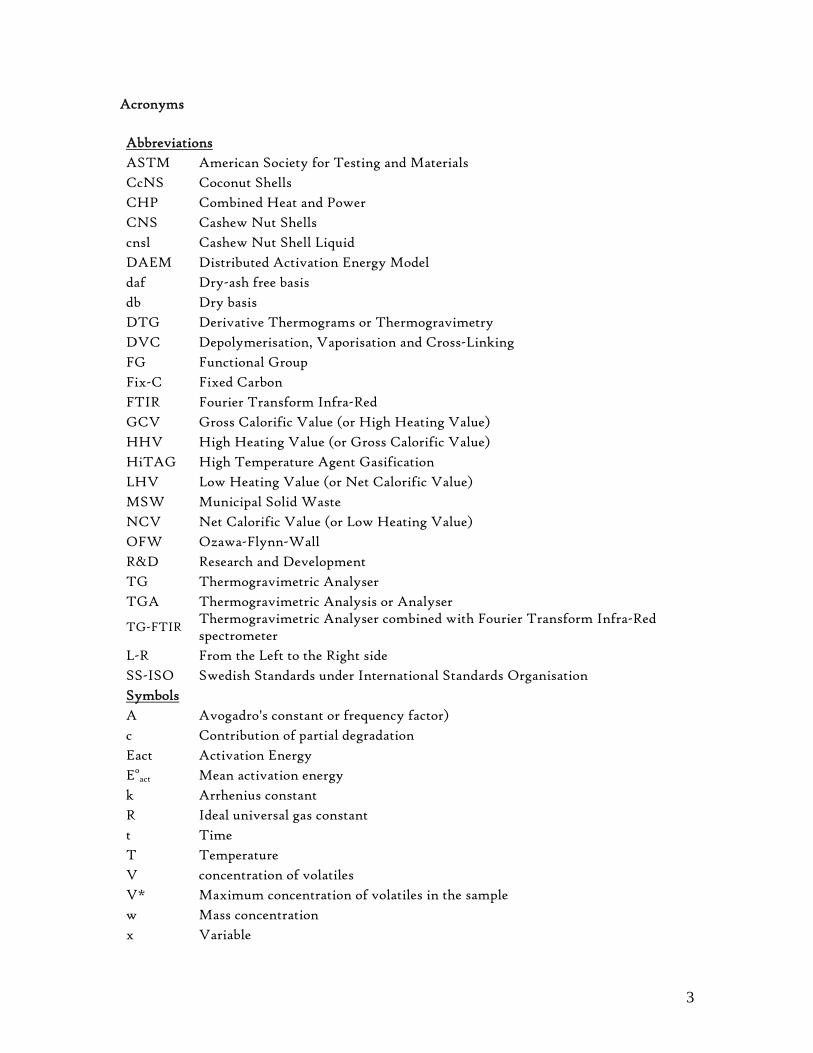
Acronyms
Abbreviations ASTM American Society for Testing and Materials CcNS Coconut Shells CHP Combined Heat and Power CNS Cashew Nut Shells cnsl Cashew Nut Shell Liquid DAEM Distributed Activation Energy Model daf Dry-ash free basis db Dry basis DTG Derivative Thermograms or Thermogravimetry DVC Depolymerisation, Vaporisation and Cross-Linking FG Functional Group Fix-C Fixed Carbon FTIR Fourier Transform Infra-Red GCV Gross Calorific Value (or High Heating Value) HHV High Heating Value (or Gross Calorific Value) HiTAG High Temperature Agent Gasification LHV Low Heating Value (or Net Calorific Value) MSW Municipal Solid Waste NCV Net Calorific Value (or Low Heating Value) OFW Ozawa-Flynn-Wall R&D Research and Development TG Thermogravimetric Analyser TGA Thermogravimetric Analysis or Analyser
TG-FTIR Thermogravimetric Analyser combined with Fourier Transform Infra-Red spectrometer
L-R From the Left to the Right side SS-ISO Swedish Standards under International Standards Organisation Symbols A Avogadro's constant or frequency factor) c Contribution of partial degradation Eact Activation Energy E0
act Mean activation energy k Arrhenius constant R Ideal universal gas constant t Time T Temperature V concentration of volatiles V* Maximum concentration of volatiles in the sample w Mass concentration x Variable
4
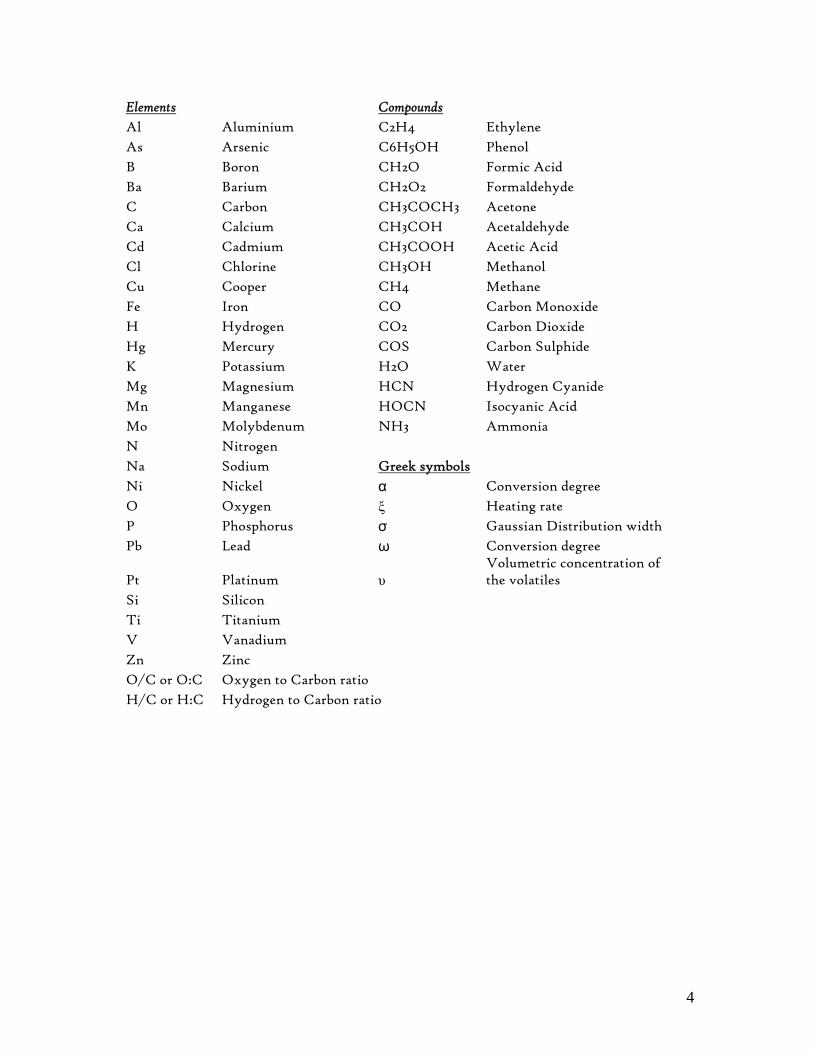
Elements Compounds Al Aluminium C2H4 Ethylene As Arsenic C6H5OH Phenol B Boron CH2O Formic Acid Ba Barium CH2O2 Formaldehyde C Carbon CH3COCH3 Acetone Ca Calcium CH3COH Acetaldehyde Cd Cadmium CH3COOH Acetic Acid Cl Chlorine CH3OH Methanol Cu Cooper CH4 Methane Fe Iron CO Carbon Monoxide H Hydrogen CO2 Carbon Dioxide Hg Mercury COS Carbon Sulphide K Potassium H2O Water Mg Magnesium HCN Hydrogen Cyanide Mn Manganese HOCN Isocyanic Acid Mo Molybdenum NH3 Ammonia N Nitrogen Na Sodium Greek symbols Ni Nickel α Conversion degree O Oxygen ξ Heating rate P Phosphorus σ Gaussian Distribution width Pb Lead ω Conversion degree
Pt Platinum υ Volumetric concentration of the volatiles
Si Silicon Ti Titanium V Vanadium Zn Zinc O/C or O:C Oxygen to Carbon ratio H/C or H:C Hydrogen to Carbon ratio
5
1. BACKGROUND Mozambique is reach in renewable energy sources such as biomass, hydro, solar and wind resources. However, these resources are inefficiently and poorly explored, in general. Among these resources, biomass appears to be well distributed countrywide in different forms such as forest and agricultural or crop residues. In addition, the country posses a great potential for energy oriented crops, such as oil seeds, sugar cane, sorghum, etc. The Faculty of Engineering at the Eduardo Mondlane University has been studying different biomass energy technologies as well as biomass resources potential in Mozambique with the aim of promoting sustainable and reliable energy technologies throughout the country, using locally available resources. Two of the most abundant renewable energy sources found in Mozambique are coconut shells (CcNS) and cashew nut shells (CNS). Both are residual biomass materials that are so far not used efficiently for any purpose.
1.1. Coconut Shells Coconut and cashew nut shells are found in tropical countries where coconut and cashew nut trees are grown for other purposes than energy commodity. Coconut tree, scientifically known as Cocos nucifera L., which belongs to Palmae family[1], is a source of edible as well as multipurpose product known as coconut. The tree is originally from Southeast Asia. From there, it spread to South America, Africa and Asia. Coconut tree grows preferably in tropical and rainforest climate, especially along the coastline zones where it enjoys the sun irradiation as well as water (high humidity). There are many varieties of coconut trees, all of them with tall graceful light grey trunks; that can be as higher as 30 metres; topped by a crown light fluffy leaves, about 4.5-5.5 meters long and with yellow greenish colour. Mozambique, is one of the countries in Southern Africa where coconut trees are grown, predominantly along its vast coastline in immense palm fields in Inhambane (South), Quelimane, Pebane, Angoche, Nacala and Mocímboa da Praia (North) as well as in the main Islands, i.e., Arquipélago das Quirimbas, Ilha de Moçambique and Ilha do Ibo. They can also be found in small palm fields in household farms almost all over the country coastline. However, the actual top world coconut producers are not in Africa. They are, in fact, Asian countries such as Philippines, Indonesia, Sri-Lanka and India. The first three are the main world exporters of coconut products.
6
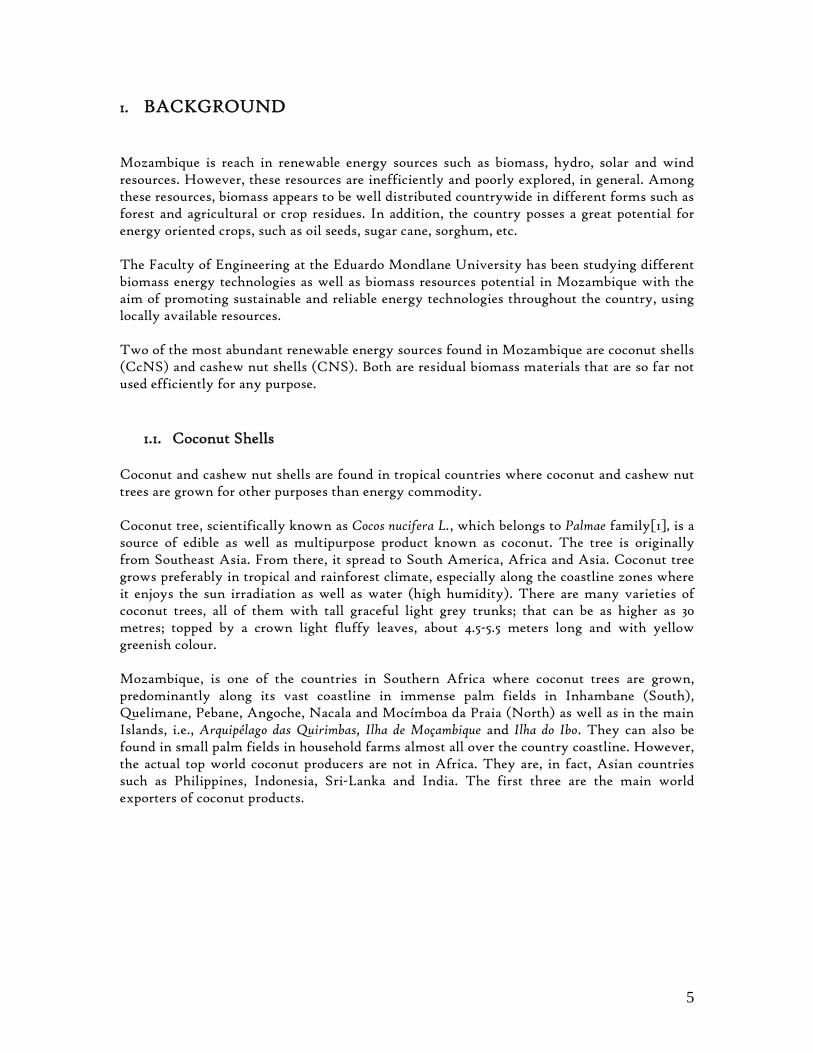
Figure 1. Coconut tree and coconuts (hanging and harvested)
Coconut is a rough sphere covered by a fibber-spongy husk and a very hard and relatively thin shell that holds a white fatty beneath with a void centre filled with a transparent and colourless coconut juice. A coconut tree can produce up to 50 coconuts in an 11-12 month-cycle, in bunches of up to 10-12 coconuts each. Coconut shells are by-products from copra processing industry, as well as from the household consumption of coconut edible component. When coconuts are harvested, they are, first, subjected to a pre-cleaning process consisting of removal of the husks and breaking of the still shelled coconut in two hemispheres. Then, they are left to dry, either in an open atmosphere (leading to a poor copra quality) or in a temperature-controlled oven (resulting in a higher copra quality). When the white beneath gets dry, it detaches by itself from the hard shell and becomes an isolated component. Thereafter, the shell becomes residual and, therefore, it is dropped from the processing cycle. Instead, the shells are known to be valuable raw materials for the production of activated carbon, a vital material that provides high surface area (1000m2/g)[2] for adsorption/absorption of different gases, liquids, emulsions and fine suspensions in a variety of processes. The detached white and edible component is sold or supplied to the processing plants as raw material for many products such as cooking oil, soaps creams, etc. One particular fact about coconut products is that they are all-season crop. It is, coconuts are available any time all along the year contrasting with seasonal products which are only found during a specific season within a year. The last characteristic is valid, for instance, for cashew nut tree products, among others.
7
1.2. Cashew Nut Shells
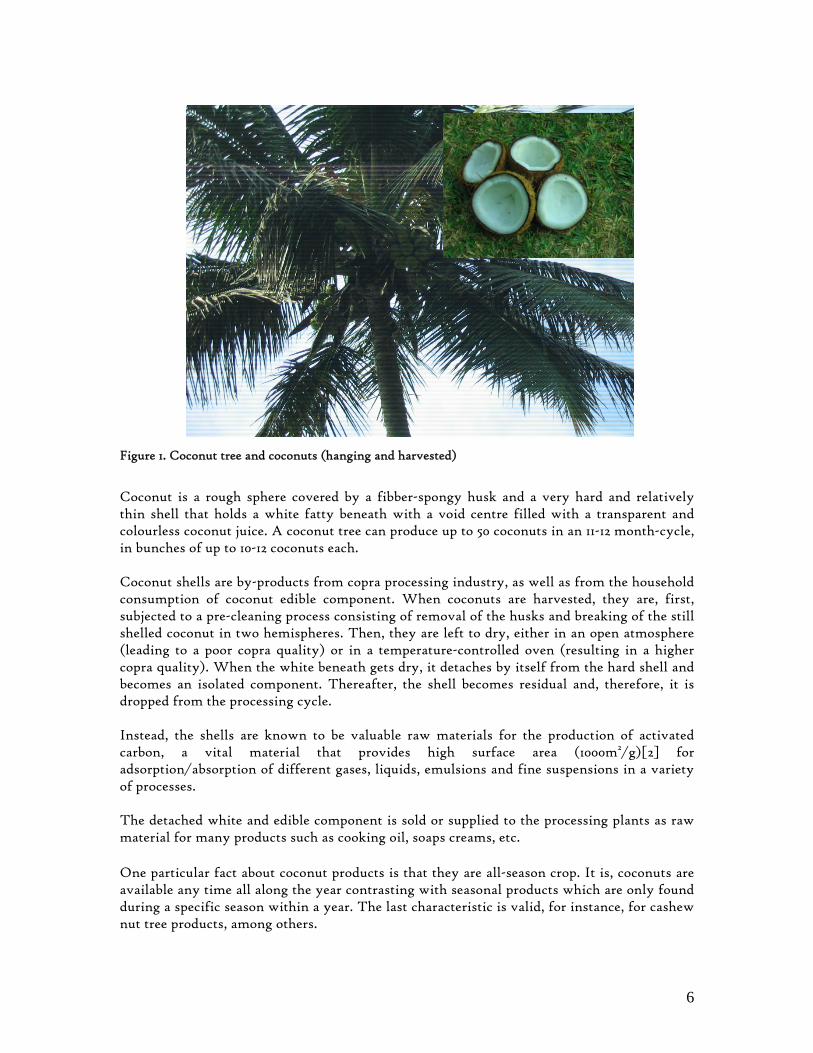
Cashew nut tree or just cashew tree is a wild plant species found mainly in tropical countries, in Latin America, Africa and Asia. This tree enjoys, unlike the coconut trees, dry sand soils and sun-drenched environment. In general, it has a thick and tortuous trunk plenty of branches. Cashew nut tree, or Anacardium occidentale L., from Anacardiaceae family[3,4], is a botanical species native from Peru and Brazil and was taken by Portuguese traders to India during the 16th century. Presently, A. occidentale L. can also be found in countries as Sri Lanka, The Philippines, Indonesia, China, Thailand, India, Malaysia (Asia), Haiti, Panama, Guatemala, Mexico, Venezuela, Trinidad and Tobago, (Latin America), Guinea-Bissau, Guinea-Conakry, Cote d’Ivoire, Nigeria, Mozambique, Tanzania and Kenya (Africa) [5]. While cashew nut or kernels are appreciated as edible material and enjoyed in different ways as snacks or as condiment in different delicacies, the shells are, in most cases, just dumped as waste. However, they are known worldwide as important precursors of cashew nut shell liquid (cnsl) which is an essential precursor of chemicals for rubber, plastic and paints industry, among others [5] or just as renewable source of chemicals such as cardols and cardanols. In fact, it is referred as containing four major components such as 3-pentadecenyl phenol (cardanol), 5-pentadecenyl resorcinol (cardol), 6-pentadecenyl salicylic acid (anacardic acid) and 2-methyl-5-pentadecenyl resorcinol (2-methyl cardol)[6]. Additionally, cnsl, a reddish brown viscous fluid, is a valuable bio-oil whose calorific value is equivalent to that of petroleum fuels. Its calorific value is as high as 40MJ/kg, with low ash level (app. 0.01%). Therefore, it has a great potential as renewable fuel [5]. Apart from this oil, the cashew nut shell itself is an important biomass fuel. It can be considered in different stages, according to the phase in which it is to be used, if as raw shell, before extraction of cnsl, or as CNS cake, after the de-oiling process. Das et al[7] reported volatile matter content of 69.3 and 58.00% w/w, in raw and de-oiled CNS, respectively.
Figure 2. Cashew nut tree and cashew apple (fruit) with the pendant cashew nut
8
In Mozambique, cashew nuts are in the list of the main exported products. Indeed, in the recent past, the country was one of the main cashew nuts producers and exporters in the world. Presently, due to the decline of the cashew-nut processing industry in the country, Mozambique is the Africa’s fourth major producer of cashew nut. Other main producers are Tanzania, Guinea-Bissau, Guinea-Conakry and Cote d’Ivoire as the first, second, third and fifth main producers in the continent, respectively. World premier producer of cashew-nut is India (approx. 400 kton produced in 2001/2002, representing approximately one-third of world production) [8]. 2. INTRODUCTION Biomass is the general term used to label all materials derived from photosynthetic plants or from animal wastes. Sources of biomass include naturally grown forests, energy plantations, herbaceous plants or grasses, by-products from different industries as agricultural, food, wood processing, manures, and paper industries or as municipal solid waste (MSW). The main elements present in biomass are carbon (C), hydrogen (H), oxygen (O) and nitrogen (N). From this composition and taking in account that C and H content is higher than O and N content, the material is mainly combustible and therefore, a potential source of energy. Other elements found in biomass composition are nitrogen, sulphur as well as microelements normally found as ash-constituents. Lignocellulosic biomass is a mixture of mainly three polymeric components, namely cellulose, hemicelluloses and lignin, apart from minor content in extractives. The fraction of each component varies according to the different intrinsic factors, such as the type of biomass, the specific growing conditions, the soil, etc. Cellulose as well as hemicelluloses content is 40-50% and 20-40%, respectively[9]. Presently, the world energy demand is met mainly through the use of fossil fuels, covering around 80% of the 400EJ energy usage per year. Around 10-15% of this amount is provided through the use of biomass [10], while up to 10% is supplied from other renewable energy sources. This renewable fraction has been increasing in the last decades. Indeed, renewable sources of energy have been gaining key role in meeting the world energy demand as environmental as well as sustainable development concerns are becoming a common sense worldwide. Wood biomass as well as other forms of biomass, including energy plantations, agricultural and crop wastes, and MSW are some of the renewable resources that generate sustainable energy and meet environmental concerns vis-à-vis air pollution and enhanced greenhouse effect. In reality, biomass is CO2-neutral fuel and it has less sulphur compared to fossil fuels. Given this framework, research and development (R&D) on renewable source of energy, in general, and on biomass, particularly, assumes an imperative role in sustainable development. Biomass resources are numerous and differ widely according to many factors. These factors include but are not limited to, type, species, climate and/or region of occurrence, technology used for its pre-treatment. Biomass R&D in the last decades had experienced a grand development and achieved indispensable results which contributed to improve biomass energy technologies regarding both performance and efficiency. However, a list of unique and lesser branded biomass had been left behind. This is the case of typically tropical biomass wastes such as cashew nut shells (from Annacardium occidentale spp) and coconut shells (from Cocos nucifera spp). In fact, these two kinds of biomass wastes, are not commonly used as

9
such. Instead, they are renowned as cashew nut shell liquid (cnsl) and activated carbon precursors, respectively. Attesting this fact, Yaman review [11] gives a comprehensive list of the biomass research status of the art and in about two hundreds studies on biomass, none is on CNS or CcNS. Limited researchers, however, have dedicated their efforts to study, at some extent, these feedstocks. This is the case of Raveendran et al [12], Hoque and Battacharaya [13] as well as Rakesh and Stewart [14]. Raveendran et al[12] study gives the proximate and ultimate analysis of coconut shells. However, their results cannot be generalized for all similar samples everywhere in the world, as discussed somewhere in this work, unless proven otherwise. Hoque and Battacharaya[13] have studied the gasification of coconut shells in a fluidized bed and spouted bed reactor. Their main focus is the difference between the yields and behaviour of gasified coconut shell in a fluidized bed reactor versus spouted bed reactor. Rakesh and Stewart[14] discuss the kinetics of coconut shells pyrolysis at 100K/min. However, their experimental conditions (testing and sampling conditions) were totally different from the ones used in the present work, which makes the results different. Apart from the last study, these studies provide very general and limited information. As both CNS and CcNS are abundant in tropical regions in Latina America, Africa and Asia, this lack on technical characteristics can hamper the use of these renewable and widely available energy sources or mislead its use through unsuitable technologies by assuming similarities with other well known biomasses, unless verified evidence confirms commonalities with ordinary biomasses. Thermogravimetric analysis (TGA) already plays an important role in solid fuels and other research fields. It is a fitting technique for kinetics determination of thermal degradation of solid materials. Thermograms and derivative thermograms from TGA give the mass loss or the mass loss rate as a function of time and temperature. In an isothermal mode, only the time changes, whereas in a dynamic mode, both the time and temperature change simultaneously and proportionally based in the heating rate that is being applied. Different studies have been conducted to study the kinetics of pyrolysis under different assumptions for a large variety of materials[15,16]. Among these studies, the most important for this review is the pyrolysis kinetics of biomass as energy source. In fact, pyrolysis is present in all thermochemical conversion of biomass into useful energy, playing an important role as the step that precedes both gasification and combustion processes. The way this step is performed does determine the reactivity of the resulting char[17]. Therefore, combustion and gasification performance are dependent upon the reactivity of the reacting char. Char conversion, especially in gasification, as noted by Cetin et al[18], is the slowest step and, consequently, the rate-limiting stage in the overall process. On the other hand, char reactivity is determined by different factors in which the nature of virgin biomass and the reactions taking part during pyrolysis are of utmost importance. In pyrolysis, the reactions that occur are determined by a set of parameters that include the heating rate, the residence time, the final temperature and, concomitantly, the intrinsic chemical kinetics of such transformation. Thermal decomposition kinetics of solid lignocellulosic materials is a very complex chemical process involving a great number of chemical reactions both in parallel and in series
10
(competitive and side-to-side) mechanism[19]. By providing appropriate information on thermal characteristics (pyrolysis kinetics, char combustion kinetics, elemental and proximate analyses) the selection of the most appropriate technology as well as the respective design can be performed through modelling the appropriate working temperatures, efficiency and the size of the reactor for a given set of pre-defined input or output conditions. 3. LITERATURE REVIEW
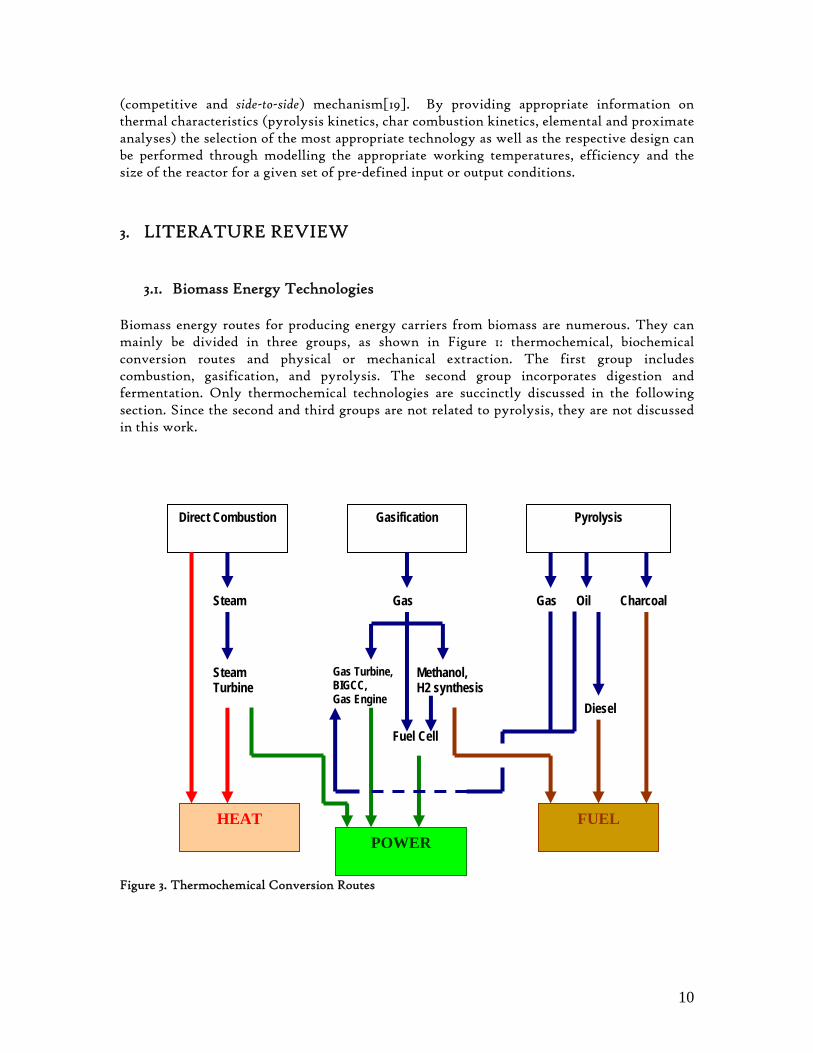
3.1. Biomass Energy Technologies Biomass energy routes for producing energy carriers from biomass are numerous. They can mainly be divided in three groups, as shown in Figure 1: thermochemical, biochemical conversion routes and physical or mechanical extraction. The first group includes combustion, gasification, and pyrolysis. The second group incorporates digestion and fermentation. Only thermochemical technologies are succinctly discussed in the following section. Since the second and third groups are not related to pyrolysis, they are not discussed in this work.
Figure 3. Thermochemical Conversion Routes
Direct Combustion Gasification Pyrolysis
HEAT POWER
FUEL
Steam
Steam Turbine
Gas
Gas Turbine, BIGCC, Gas Engine
Methanol, H2 synthesis
Fuel Cell
Gas Oil
Diesel
Charcoal
11
3.1.1. Direct Combustion This conversion process generates heat through combustion of a fuel from which chemical energy is converted into heat. Combustion involves the burning of a fuel using pure oxygen, air or any other gas mixture containing oxygen. Such chemical reaction is exothermic, meaning that it generates heat. The heat is hence the main product from combustion and is provided in the form of hot gases at temperatures that can reach 1000ºC[9], depending upon the furnace design and combustion parameters. From combustion, heat, process steam, and power can be generated, according to the technology applied. Combustion technology is widely available in the market with global efficiencies (biomass to energy) from 20 to 40% [9]. The global efficiency can be increased by applying the so-called cogeneration technology that allows simultaneous generation of heat and power (CHP). Combustion direct product (heat) has to be used immediately since it cannot be stored. Combustion plants range from micro-scale (for domestic heating) up to large-scale industrial plants (100-3,000MW)[9]. As it regards to biomass combustion, it is the classic technology for household energy, especially for cooking. The use of wood and other solid biomass in open fires or small stoves or furnaces at household level is a widespread traditional phenomenon, normally not well documented [14] but with a great contribution to energy consumption. This phenomenon is inefficient (common efficiencies go up to 10% only) and is a significant source of emissions of combustion gases. However, technology development allows, today, efficiencies as 70-90% through the use of advanced automatic domestic heaters with catalytic gas cleaning and standardized fuels (such as wood pellets) [14]. Combustion technologies capacity include domestic capacity (5-50 Wth) for household heat; low industrial heat generation capacity (1-5MWth); CHP (0.1-1MWel) with efficiencies of 60 to 90%; stand alone power systems (1-10MWel) with efficiencies above 80% or 20 to hundreds MWel with efficiencies between 20 and 40%, and co-combustion systems typically within the capacity of 5 to 20MWel or higher (multimode power plants) with efficiencies from 30% [14]. Combustion is the less restrictive thermochemical process regarding the characteristics of feedstock to be converted. However, for feedstock with moisture superior to 50%, pre-drying is advisable to avoid lower efficiencies[9].
3.1.2. Gasification Combustible gas can be produced from biomass by means of gasification. In this technology, partial oxidation converts lignocellulosic components into light hydrocarbons, carbon monoxide, and hydrogen at high temperatures, ordinarily in the range of 800-900ºC[9]. The oxidizing agent can be oxygen, air, carbon dioxide, or steam. The process undergoes a number of steps in a sequence that is determined by the technology (gasifier) applied. These steps include drying, pyrolysis (thermal decomposition), partial oxidation, or gasification of the pyrolysis products such as the pyrolytic gases, tars, and char. The process of char gasification takes place through an interactive series of gas-solid reaction which generates gases that, in turn, interact in gas-gas reactions to generate carbon dioxide and hydrogen (water-gas shift reaction). When the oxidizing agent is air, the main products are carbon monoxide, carbon dioxide, hydrogen, methane, nitrogen, and tars. The fuel gas produced has low heating value of around 4-6MJ/Nm3[9], and it can be burnt directly or used as a fuel for gas engines and turbines.
12
Pure oxygen can also be used for partial oxidation. In this case, the main products remain the same as in the case of air, except nitrogen which is almost inexistent in the pyrolysis product stream. The use of pure oxygen improves the heating value which rises to 10-12 MJ/Nm3. Another option is the use of steam as oxidizing agent. In this case, the heating value becomes even hire (15-20 MJ/Nm3) [20]. The syngas produced in this case is qualitatively similar to the one produced from pure oxygen. A unique gasification technology termed HiTAG (high temperature agent gasification) allows high hydrogen and less tars yields in the syngas, therefore improving the calorific value of the syngas and allowing high reduction of tars. This is achieved by preheating the oxidizing agent to temperatures above 1000ºC[21]. The main advantage of gasification is efficiency augmentation and the production of energy carrier that can be stored or transported, can be used in internal combustion engines or used to synthesize chemicals. The main drawback in gasification is related to the presence of tars in the syngas, which is corrosive and makes the fuel gas inappropriate for use in internal combustion engines. However, nowadays, cleaning systems have been in constant development. Diversified gasification technologies are available in the market[9,10].
3.1.3. Pyrolysis As relatively high temperatures, after the drying process, thermal decomposition of biomass takes place in the absence of air or oxygen. In such case, the biomass lignocellulosic components decompose as the temperature raises producing three streams, namely pyrolytic gases, tar (liquid) and char (solid carbonaceous residue). The proportions of these three products depend upon the type of pyrolysis which is determined by the residence time and temperature. High temperature and long residence time enhances the conversion of biomass into gaseous products. Short residence time tends to favour the tars yields. According to Bridgwater [20] at moderate temperatures and short residence time, the main produces are tars, char, and gases in the proportion of 6.25:1:1 respectively. This is the ordinary pyrolysis process undertaken aiming at producing tar, known as bio-oil or bio-crude. Some of the constraints for using bio-oil are related to its high corrosivity and poor thermal stability. Pyrolysis at low temperature and very long residence time, yields the same products in a different proportion as 30:35:35 for tars, char and gases, respectively, favouring carbonisation process. When high temperature and long residence time is applied, the proportion goes up to 1:2:17, clearly favouring the conversion into gaseous products. As previously stated, pyrolysis is present both in combustion and gasification at earlier stages and it is determinant for the chemical conversion reactions that follow it. As a stand alone conversion technology, it is mainly used either for char or for bio-oil production. When bio-oil is the main goal, the process entails the features such as very high temperature, finely ground biomass feedstock, carefully controlled reaction (approx. 500ºC) and vapour phase (400-450ºC) temperatures, short residence time (typically less than two seconds) followed by a fast cooling (condensation) of the vapours into bio-oil. Additional information on thermochemical conversion technologies is available in different studies [9, 10,11,20,22]. Other technologies such as biochemical conversion and mechanical extraction can be found in the literature[9].
13
3.2. Lignocellulosic Biomass Thermal Degradation
Lignocellulosic biomass main polymeric components are hemicelluloses, cellulose and lignin. When biomass is submitted to a thermal degradation at low heating rates, below 100K/min, it decomposes following clear sequential stages of moisture is evolution, extractives decomposition and then hemicelluloses, cellulose and lignin degradation. While hemicelluloses and cellulose decompose in a somewhat narrow temperature interval, lignin is referred as decomposing slowly and throughout a wide temperature interval[23]. Hence, biomass behaviour during this degradation process is found to be determined by its three main components referred above, which has been corroborated through different experimental works, with emphasis on those made through thermogravimetry analysis. These experimental studies also confirmed the non-existence of any interaction among these primary components[24,25]. In an laborious research work Yang et al[25] analysed the influence of these primary components of lignocellulosic biomass over its pyrolysis profiles, using pure hemicellulose and cellulose as well as different mixtures of hemicelluloses and cellulose, hemicelluloses and lignin, cellulose and lignin as well as hemicelluloses, cellulose and lignin. From this study, the degradation of hemicelluloses and cellulose were found to occur mainly at temperature intervals as 220-315 and 315-400ºC, respectively. Lignin decomposition was found to predominate above 400ºC. Other authors refer 200-400ºC as the range in which hemicelluloses and cellulose decompose, and 150-750ºc, for lignin decomposition.
3.3. Biomass Pyrolysis Kinetics Mechanism Kinetic study of biomass pyrolysis is of utmost relevance for the design of thermochemical reactors, given its importance in these energy conversion technologies discussed in the previous section. For the degradation kinetics of cellulose, the most widely studied lignocellulosic component in biomass pyrolysis, there are diversified multi-step reaction models suggested by different researchers. These models are derived from the original mechanism known as Kilzer-Broido mechanism[26] (equation i), in which cellulose decomposes into anhydrocellulose and tar. The anhydrocellulose is then decomposed into gas and char[27]. This mechanism has been reformulated to what is referred as Bradbury model[26] by adding a concept of active cellulose (equation ii), different from the fresh sample cellulose and regarded as the precursor of volatiles and char. Kilzer-Broido mechanism:
)(%35%65
2
31
itar
chargasluloseanhydrocelcellulose
k
kk
⎪⎩
⎪⎨⎧
⎯→⎯
+⎯→⎯⎯→⎯
14
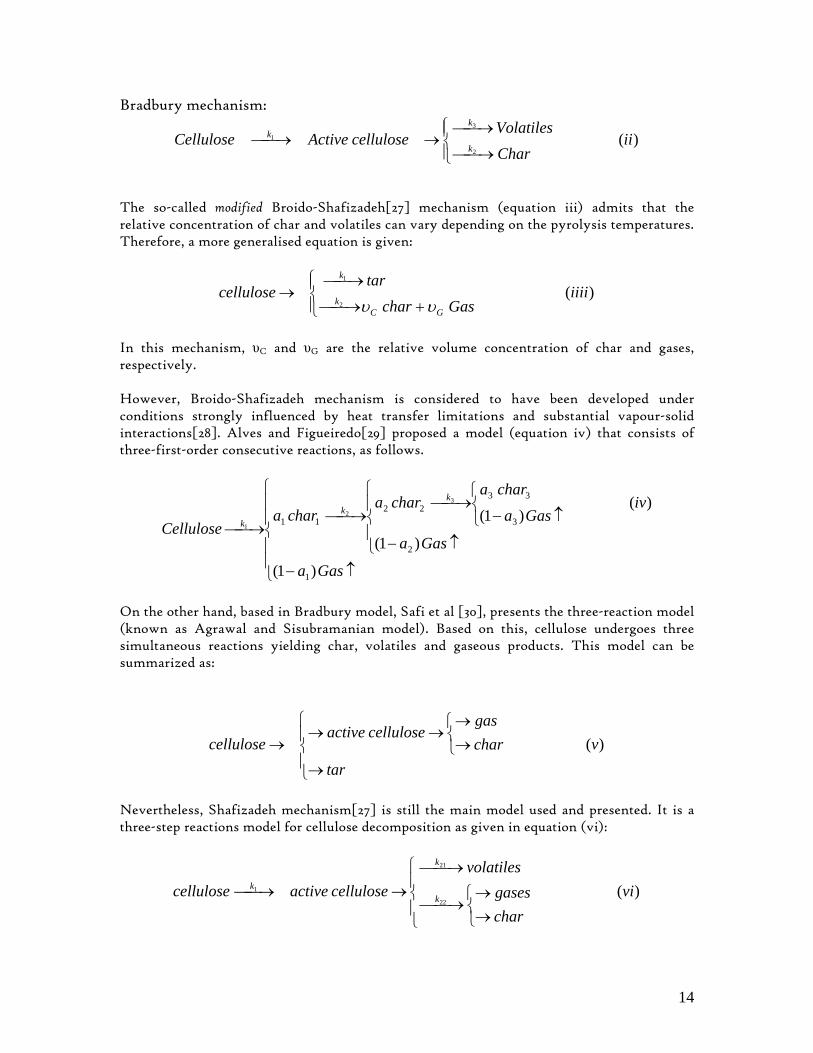
Bradbury mechanism:
)(2
3
1 iiCharVolatiles
celluloseActiveCellulosek
kk
⎪⎩
⎪⎨⎧
⎯→⎯
⎯→⎯→⎯→⎯
The so-called modified Broido-Shafizadeh[27] mechanism (equation iii) admits that the relative concentration of char and volatiles can vary depending on the pyrolysis temperatures. Therefore, a more generalised equation is given:
)(2
1
iiiiGaschar
tarcellulose
GCk
k
⎪⎩
⎪⎨⎧
+⎯→⎯
⎯→⎯→
υυ
In this mechanism, υC and υG are the relative volume concentration of char and gases, respectively. However, Broido-Shafizadeh mechanism is considered to have been developed under conditions strongly influenced by heat transfer limitations and substantial vapour-solid interactions[28]. Alves and Figueiredo[29] proposed a model (equation iv) that consists of three-first-order consecutive reactions, as follows.
⎪⎪
⎩
⎪⎪
⎨
⎧
↑−
⎪⎩
⎪⎨
⎧
↑−⎩⎨⎧
↑−⎯→⎯
⎯→⎯⎯→⎯
Gasa
Gasa
ivGasa
charachara
charaCellulose
kk
k
)1(
)1(
)()1(
1
2
3
3322
11
3
2
1
On the other hand, based in Bradbury model, Safi et al [30], presents the three-reaction model (known as Agrawal and Sisubramanian model). Based on this, cellulose undergoes three simultaneous reactions yielding char, volatiles and gaseous products. This model can be summarized as:
)(vtar
chargas
celluloseactivecellulose
⎪⎩
⎪⎨
⎧
→⎩⎨⎧→→
→→→
Nevertheless, Shafizadeh mechanism[27] is still the main model used and presented. It is a three-step reactions model for cellulose decomposition as given in equation (vi):
)(22
21
1 vichargases
volatilescelluloseactivecellulose k
k
k
⎪⎩
⎪⎨
⎧
⎩⎨⎧→→
⎯→⎯
⎯→⎯→⎯→⎯
15
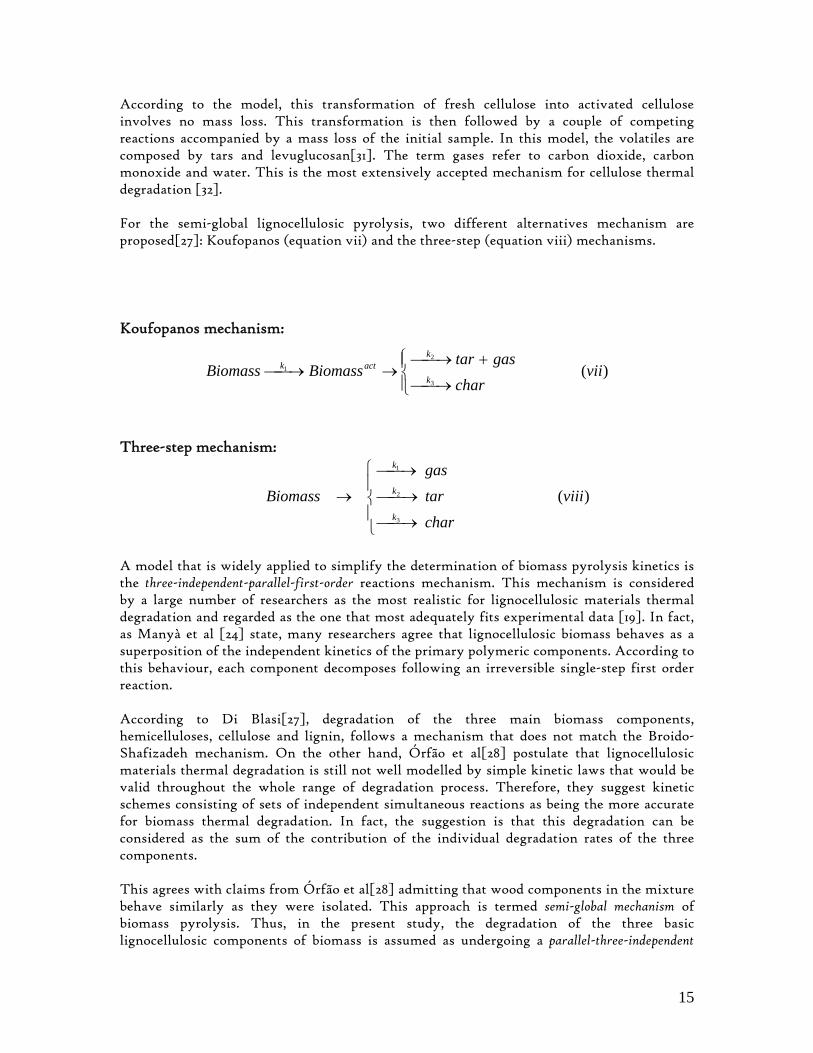
According to the model, this transformation of fresh cellulose into activated cellulose involves no mass loss. This transformation is then followed by a couple of competing reactions accompanied by a mass loss of the initial sample. In this model, the volatiles are composed by tars and levuglucosan[31]. The term gases refer to carbon dioxide, carbon monoxide and water. This is the most extensively accepted mechanism for cellulose thermal degradation [32]. For the semi-global lignocellulosic pyrolysis, two different alternatives mechanism are proposed[27]: Koufopanos (equation vii) and the three-step (equation viii) mechanisms.
Koufopanos mechanism:
)(3
2
1 viichar
gastarBiomassBiomass
k
kactk
⎪⎩
⎪⎨⎧
⎯→⎯
+⎯→⎯→⎯→⎯
Three-step mechanism:
)(3
2
1
viiichartargas
Biomassk
k
k
⎪⎩
⎪⎨
⎧
⎯→⎯
⎯→⎯
⎯→⎯
→
A model that is widely applied to simplify the determination of biomass pyrolysis kinetics is the three-independent-parallel-first-order reactions mechanism. This mechanism is considered by a large number of researchers as the most realistic for lignocellulosic materials thermal degradation and regarded as the one that most adequately fits experimental data [19]. In fact, as Manyà et al [24] state, many researchers agree that lignocellulosic biomass behaves as a superposition of the independent kinetics of the primary polymeric components. According to this behaviour, each component decomposes following an irreversible single-step first order reaction. According to Di Blasi[27], degradation of the three main biomass components, hemicelluloses, cellulose and lignin, follows a mechanism that does not match the Broido-Shafizadeh mechanism. On the other hand, Órfão et al[28] postulate that lignocellulosic materials thermal degradation is still not well modelled by simple kinetic laws that would be valid throughout the whole range of degradation process. Therefore, they suggest kinetic schemes consisting of sets of independent simultaneous reactions as being the more accurate for biomass thermal degradation. In fact, the suggestion is that this degradation can be considered as the sum of the contribution of the individual degradation rates of the three components. This agrees with claims from Órfão et al[28] admitting that wood components in the mixture behave similarly as they were isolated. This approach is termed semi-global mechanism of biomass pyrolysis. Thus, in the present study, the degradation of the three basic lignocellulosic components of biomass is assumed as undergoing a parallel-three-independent
16
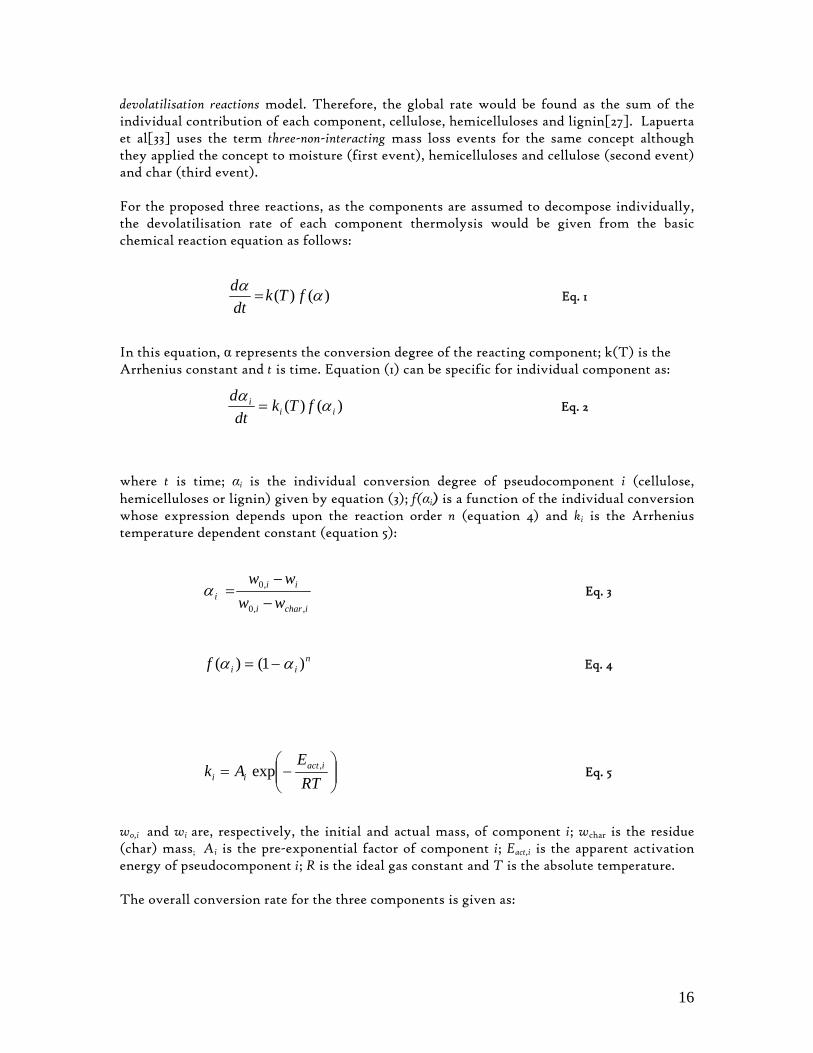
devolatilisation reactions model. Therefore, the global rate would be found as the sum of the individual contribution of each component, cellulose, hemicelluloses and lignin[27]. Lapuerta et al[33] uses the term three-non-interacting mass loss events for the same concept although they applied the concept to moisture (first event), hemicelluloses and cellulose (second event) and char (third event). For the proposed three reactions, as the components are assumed to decompose individually, the devolatilisation rate of each component thermolysis would be given from the basic chemical reaction equation as follows:
)()( αα fTkdtd
= Eq. 1
In this equation, α represents the conversion degree of the reacting component; k(T) is the Arrhenius constant and t is time. Equation (1) can be specific for individual component as:
)()( iii fTk
dtd αα
= Eq. 2
where t is time; αi is the individual conversion degree of pseudocomponent i (cellulose, hemicelluloses or lignin) given by equation (3); f(αi) is a function of the individual conversion whose expression depends upon the reaction order n (equation 4) and ki is the Arrhenius temperature dependent constant (equation 5):
ichari
iii ww
ww
,,0
,0
−−
=α Eq. 3
n
iif )1()( αα −= Eq. 4
⎟⎟⎠
⎞⎜⎜⎝
⎛−=
RTE
Ak iactii
,exp Eq. 5
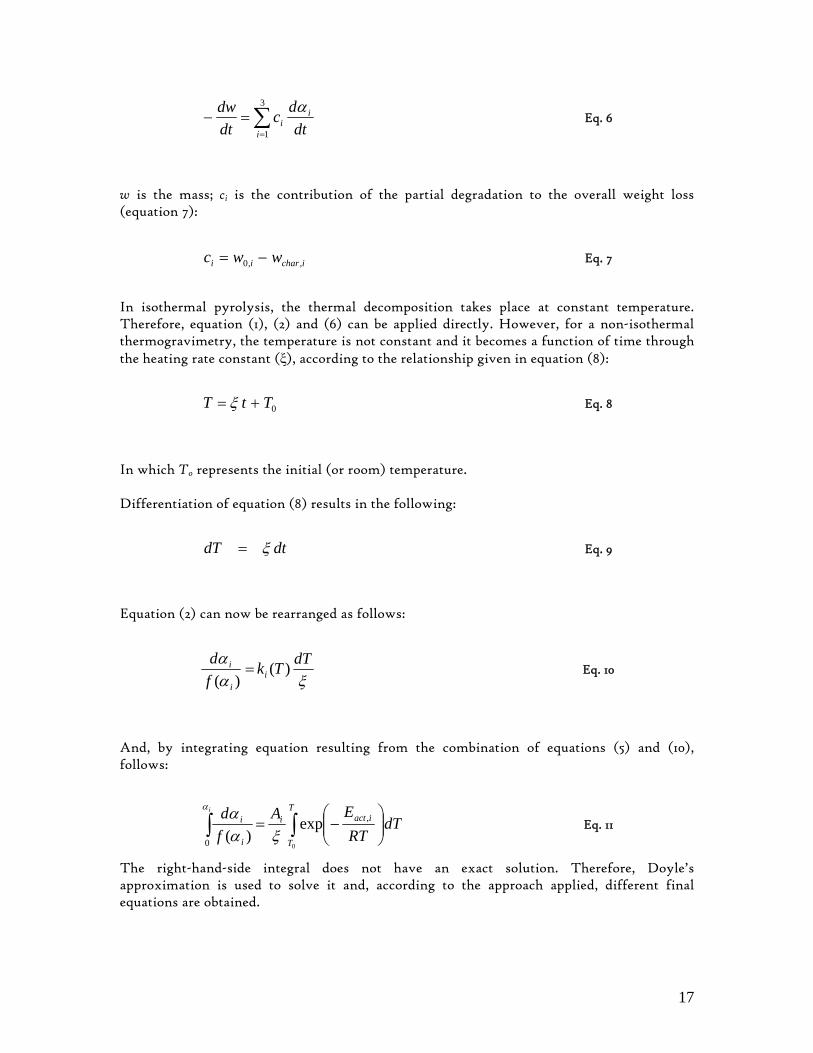
w0,i and wi are, respectively, the initial and actual mass, of component i; wchar is the residue (char) mass; Ai is the pre-exponential factor of component i; Eact,i is the apparent activation energy of pseudocomponent i; R is the ideal gas constant and T is the absolute temperature. The overall conversion rate for the three components is given as:
17
dtdc
dtdw i
iiα∑
=
=−3
1 Eq. 6
w is the mass; ci is the contribution of the partial degradation to the overall weight loss (equation 7):
icharii wwc ,,0 −= Eq. 7
In isothermal pyrolysis, the thermal decomposition takes place at constant temperature. Therefore, equation (1), (2) and (6) can be applied directly. However, for a non-isothermal thermogravimetry, the temperature is not constant and it becomes a function of time through the heating rate constant (ξ), according to the relationship given in equation (8):
0TtT += ξ Eq. 8
In which T0 represents the initial (or room) temperature. Differentiation of equation (8) results in the following:
dtdT ξ= Eq. 9
Equation (2) can now be rearranged as follows:
ξαα dTTk
fd
ii
i )()(= Eq. 10
And, by integrating equation resulting from the combination of equations (5) and (10), follows:
dTRT
EAfd T
T
iacti
i
ii
∫∫ ⎟⎟⎠
⎞⎜⎜⎝
⎛−=
0
,
0
exp)( ξα
αα
Eq. 11
The right-hand-side integral does not have an exact solution. Therefore, Doyle’s approximation is used to solve it and, according to the approach applied, different final equations are obtained.
18
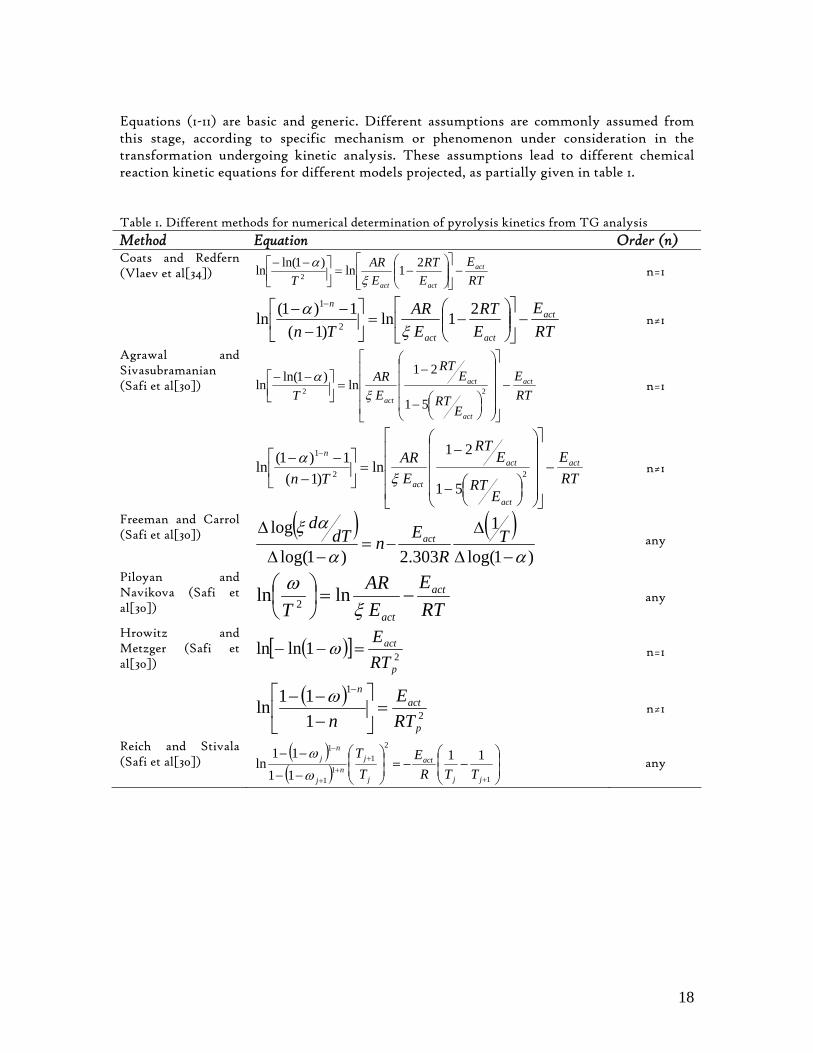
Equations (1-11) are basic and generic. Different assumptions are commonly assumed from this stage, according to specific mechanism or phenomenon under consideration in the transformation undergoing kinetic analysis. These assumptions lead to different chemical reaction kinetic equations for different models projected, as partially given in table 1. Table 1. Different methods for numerical determination of pyrolysis kinetics from TG analysis Method Equation Order (n)
RTE
ERT
EAR
Tact
actact
−⎥⎥⎦
⎤
⎢⎢⎣
⎡⎟⎟⎠
⎞⎜⎜⎝
⎛−=⎥⎦
⎤⎢⎣⎡ −− 21ln)1ln(ln 2 ξ
α n=1 Coats and Redfern (Vlaev et al[34])
RTE
ERT
EAR
Tnact
actact
n
−⎥⎦
⎤⎢⎣
⎡⎟⎟⎠
⎞⎜⎜⎝
⎛−=⎥
⎦
⎤⎢⎣
⎡−
−− − 21ln)1(
1)1(ln 2
1
ξα
n≠1
RTE
ERT
ERT
EAR
Tact
act
act
act
−
⎥⎥⎥⎥
⎦
⎤
⎢⎢⎢⎢
⎣
⎡
⎟⎟⎟⎟
⎠
⎞
⎜⎜⎜⎜
⎝
⎛
⎟⎠⎞⎜
⎝⎛−
−=⎥⎦
⎤⎢⎣⎡ −−
22
51
21ln)1ln(ln
ξα
n=1
Agrawal and Sivasubramanian (Safi et al[30])
RTE
ERT
ERT
EAR
Tnact
act
act
act
n
−
⎥⎥⎥⎥
⎦
⎤
⎢⎢⎢⎢
⎣
⎡
⎟⎟⎟⎟
⎠
⎞
⎜⎜⎜⎜
⎝
⎛
⎟⎠⎞⎜
⎝⎛−
−=⎥
⎦
⎤⎢⎣
⎡−
−− −
22
1
51
21ln
)1(1)1(ln
ξα n≠1
Freeman and Carrol (Safi et al[30]) ( ) ( )
)1log(
1
303.2)1log(
log
αα
αξ
−Δ
Δ−=
−Δ
Δ TR
EndTd
act any
Piloyan and Navikova (Safi et al[30]) RT
EEAR
Tact
act
−=⎟⎠⎞
⎜⎝⎛
ξω lnln 2 any
( )[ ] 21lnlnp
act
RTE
=−− ω n=1 Hrowitz and Metzger (Safi et al[30])
( )2
1
111ln
p
actn
RTE
n=⎥
⎦
⎤⎢⎣
⎡−−− −ω
n≠1
Reich and Stivala (Safi et al[30])
( )( ) ⎟
⎟⎠
⎞⎜⎜⎝
⎛−−=⎟
⎟⎠
⎞⎜⎜⎝
⎛
−−
−−
+
++
+
−
1
2
11
1
111
1111
lnjj
act
j
jn
j
nj
TTRE
TT
ωω any
19
It is important to mention that other models do exist[31], as for example, the following methods of:
• Gyulai and Greenhow; • Doyle; • Zsako; • Ingraham and Marrier; • Vachuska and Voboril; • Gaur and Reed; • Van Krevelen; • Kissinger.
Any of these techniques can be regarded as appropriate under specific circumstances and for specific materials. However, as the number of models is broader, this review does not intend to be comprehensive or include all the existing models but solely to highlight the most used approaches. Therefore, only the models selected for use will be discussed in this review as introduction to the data evaluation and discussion of results in the framework of this work. The methods discussed here are those considered as either the most appropriate or the most reliable for biomass pyrolysis data analysis. Based on previous works[26,34-36] the Coats and Redfern model is the most appropriate for the determination of lignocellulosic biomass thermal degradation kinetics through direct plotting of thermogravimetric experimental results.
3.4. Coats and Redfern Model The Coats and Redfern method[26], is based on the combination of equations (5) and (10) giving the following:
dTRTEA
fd act ⎟
⎠⎞
⎜⎝⎛−= exp
)( ξαα
Eq. 12
Integrating this equation from the initial temperature (T0)α=0, corresponding to a degree conversion of zero, to the peak temperature (Tmax), at which the reaction rate is the maximum, the following function is generated:
∫∫ ⎟⎠⎞
⎜⎝⎛−==
max
00
exp)(
)(T
act dTRTEA
fdF
ξααα
α
Eq. 13
After due simplifications to the above equation, known as asymptotic approximation, the integration gives the following expression:
20
TRE
ERA
TF act
act
−=⎥⎦⎤
⎢⎣⎡
ξα ln)(ln 2 Eq. 14
This equation results in the relationship given in Table 1 for n=1 and n≠1 (Coats and Redfern method) and can also be linearised by plotting the left-hand side of the equation against (1/T). The slope of such curve is proportional to the activation energy. Therefore, provided that the temperature is given, the frequency factor can easily be computed.
3.5. Distributed Activation Energies Model
When parallel reaction model is assumed, one of the most applied methods to compute the activation energy is the distributed activation energies model (DAEM). This model assumes the distribution of reactivity resulting from the reaction complexity as represented with enough reliability by a series of independent, parallel reactions, each of them with its own activation energy and frequency factor. However, it is commonly accepted as a good approximation to assume a frequency factor one for all the reactions[37]. Therefore, the model relies in continuous distributed activation energies. The final simplified equation is then given as:
dEEDdtTkt
)()(exp0 0∫ ∫∞
⎥⎦
⎤⎢⎣
⎡−=α Eq. 15
In which the function D(E) represents the distribution activation energies according to the equation below:
∫∞
=0
1)( dEED Eq. 16
The distribution of such activation energies can follow different forms such as Gaussian, Weibull and Gamma distribution [38]. The most popular is the Gauss distribution, which suggests the following D(E) function:
( )
πσ
σ
2
2exp
)(2
20
⎥⎥⎦
⎤
⎢⎢⎣
⎡ −−
=
actact
act
EE
ED Eq. 17
In this equation, σ is the distribution parameter or width of the distribution function.
21
Using DAEM for Individual Devolatilisation Kinetics In the approach used in this study, it is implicitly assumed that the reaction rates to be determined follow first-order kinetics, which is a reasonable starting assumption for biomass. Furthermore, a Gaussian distribution of activation energies is assumed, with the mean value E0
act and the width of the distribution function σ. For a single reaction i, equation (1) can be rewritten as:
( )iiii VVk
dtdV
−= * Eq. 18
where Vi is the amount of volatile matter evolved, Vi
* is the maximum potential volatile-matter content (evolving when t→∞), t is time, and ki is the reaction-rate constant, defined as shown in equation (5). Integrating over time and over all reactions with different activation energies, and assuming the Arrhenius kinetics for ki and a Gaussian distribution of activation energies, the following expression is derived:
( )act
t
t
actactact dEEEdttRT
EAV
VV∫ ∫∞
⎥⎥⎦
⎤
⎢⎢⎣
⎡ −−⎟⎟
⎠
⎞⎜⎜⎝
⎛−−=
−
02
20
*
*
02)(
expexp2
1σπσ
Eq. 19
This derivation is discussed in details by Anthony et al[39].
3.6. Model-free Methods Model-free methods to determine the kinetic parameters for thermal decomposition of biomass are becoming more recommendable. Indeed, model-fitting methods, based in a single heating rate data, are highly uncertain and the respective data cannot be compared with data obtained in isothermal experiments. In contrast, model-free methods provide effective activation energy and they have the advantage of allowing the determination of the activation energy as well as the frequency factor without the need of anticipating the reaction mechanism. The most popular isoconversional analytical methods are the Ozawa-Flynn-Wall (OFW) and the Friedman analyses, that have been in use since the 1960’s[40]. While in the Friedman method the logarithm of the conversion rate is plotted against the inverse of temperature, OFW method relates the logarithm of the heating rate to the inverse of temperature.
3.6.1. Friedman and Ozawa-Flynn-Wall methods These are the two key isoconversional methods that have been in use among the scientific community, to compute thermo-kinetic parameters from experimental data. The application of an isoconversional method to the full extent of the reaction is only compatible with a single step reaction mechanism, as given in equation (1). From this equation, it is concluded

22
that the Arrhenius constant is a function of temperature, k(T), while the mechanism of the reaction is just a function of the conversion degree, f(α)[41-45]. From the generalised form of equation (2), follows:
)()(),( ααα fTkTdtd
= Eq. 20
As the heating rate is constant, after separating the variables, equation (20) turns into:
)(*)( αξ
α fTkdTd
= Eq. 21
Equation (21) is derived directly from equation (12) by simple rearrangements. From this relationship, by applying natural logarithm the equation given below is valid:
[ ] ⎟⎠⎞
⎜⎝⎛≡−+⎟⎟
⎠
⎞⎜⎜⎝
⎛=⎟
⎠⎞
⎜⎝⎛
dtd
RTEfA
dTd act αα
ξα ln)(lnlnln Eq. 22
Directly from this equation, Ozawa as well as Flynn and Wall suggested the function through which the activation energy can be calculated as a function of the heating rate and the inverse of temperature:
TREf
dTdA act 1)(lnln −
⎥⎥⎥
⎦
⎤
⎢⎢⎢
⎣
⎡
=
α
αα
ξ Eq. 23
Doyle’s approximation [46], helps obtaining the final equation, from equation (13) through the following approach, in which x=-(Eact/RT):
)()exp()exp()( xpR
AEdxx
xx
xR
AEFx
act
ξξα =⎥
⎦
⎤⎢⎣
⎡+−= ∫
∞−
Eq. 24
The term p(x) represents the expression inside the square brackets. The function p(x) is defined under Doyle’s approximation as:
23
[ ][ ] 6020,502.13305.5)(ln
457.0315.2)(log−>>−+−≈
+−≈xforxxp
orxxp Eq. 25
Combining equations (24) with equation (25), one obtains:
RE
RAE
F
orR
ER
AEF
actact
actact
502.13515.5ln)(lnln
457.0315.2log)(loglog
−−+≈
−−+−≈
αξ
αξ Eq. 26
Therefore, the slope in a plot of logξ vs 1/T or lnξ vs 1/T, is either (-0.457Eact/R) or (-1.052Eact/R), respectively. On the other side, the Friedman method, which is based in equation (2), relates the logarithm of the reaction rate to the inverse temperature at a given constant conversion degree and heating rate, as follows:
)(exp,
ξξα
αξ
αα fRTEA
dtd act ⎟
⎠⎞
⎜⎝⎛−=⎟
⎠⎞
⎜⎝⎛
Eq. 27
And,
[ ] [ ]αξ
ξααξ
ξξ
αααα
,,
1)(*ln)(*lnlnTR
EfARTEfA
dtd actact −=⎟
⎠⎞
⎜⎝⎛−=⎟
⎠⎞
⎜⎝⎛
Eq. 28
From this equation, the first right-side member is constant, at a given heating rate and conversion degree. Thus, the correspondent plot gives straight lines with a slope that is directly proportional to the activation energy and, therefore, it can be derived from there. In both OFW and Friedman analyses, as it is implicit that the reaction follows a single step mechanism, the respective activation energies are expected to be similar. That means that it should not change considerably with the conversion degree. In other words, the lines should have the same slope or just be parallel. A great change in the magnitude of these values with the change of the conversion degree (α) indicates the occurrence of a multi-step reaction(s) that definitely do not fit the single step reaction mechanism and, therefore, cannot be analysed solely by the equation (1) [47]. The last is the case when the activation energy does change with the conversion degree as well as temperature. In such circumstances, a series of single step reactions is to be considered as taking place as the reaction degree improves[48]. Provided that the experimental data are reliable, the dependence of the activation energy on
24
the conversional degree indicates a multi-step reaction. However, if the frequency factor does depend upon the reaction conversional degree, then the applicable methods are the classical ones that are unable to describe a multiple reaction chemical process[49]. Discussion on isoconversional methods as well as their respective interpretation can be found somewhere else as [40,48,50,51]. Another model-free approach is the Kissinger’s Method, which differs from the previous methods by demanding the reaction mechanism for the determination of the frequency factor[52].
3.6.2. ASTM E698 or Kissinger’s Method One of the non-isothermal methods for the determination of kinetic is based in Kissinger’s equation. The determination of activation energy is made through the measurement of the temperature at rate peak is achieved (Tmax). Commonly, in a typical sequence of experiments, thermal-decomposition rates are measured at different heating rates. This method is between the model-free and model fitting methods. In fact, it does not demand the reaction mechanism for the determination of activation energy. However, for the determination of the frequency factor, it assumes first order reaction mechanism[35]. For this method the following relation is valid:
0max
=⎥⎦
⎤⎢⎣
⎡⎟⎠⎞
⎜⎝⎛
=TTdtd
dtd α
Eq. 29
Approximations from this method give the following equation:
MRTE
Tact +−=⎟⎟
⎠
⎞⎜⎜⎝
⎛
max2
max
ln ξ Eq. 30
In which M is a constant, according to the equation:
0lnactE
ARM = Eq. 31
Plotting of ln(ξ/T max
2) versus (1/T) results in a straight line whose slope is (-Eact/R), as well. For the determination of the frequency factor, the equation bellow is used:
2maxmaxmax TR
ERTE
TA actact ξξ
== Eq. 32
25
Although discussed here, this model is not used for data processing in this work as, given its hybridism, it is not as reliable as the model free isoconversional methods.
3.7. Determination of the Kinetic Data from Thermogravimetric Analysis While isothermal techniques are useful to determine kinetic parameters, their implementation is time consuming and, in some circumstances, the sample amount involved can be huge and difficult to handle. In contrast, non-isothermal techniques provide faster means to obtaining such kinetic information trough a very limited number of runs. Indeed, techniques like thermogravimetry offer a number of advantages, if compared with common laboratorial procedures that otherwise would have to be applied in order to get the same kind of experimental data. Apart from the limited number of runs required, the main advantages of using thermogravimetry are the sample size, the test run-time and the ability to control the both the heating rate and temperature evolution. In fact, the mass sample required is, in general, at a level of milligrams. The number of runs is dependent upon the type of information intended. For kinetic data generation, for instance, three runs at different heating rates is the minimum number to determine the kinetic parameters with acceptable level of error. The temperature can be easily controlled following a predefined temperature program, whenever the initial temperature is not below the ambient temperature. Given these advantages, it is not surprising to find that thermogravimetry is nowadays widely applied for the determination of kinetic data for a wide range of solid-gas reactions or processes[19, 20, 27-33,37,52 -56]. However, experimental determination of kinetic parameters poses a number of challenges. These challenges are related to the selection of the methodology to be applied or the list of methods to be considered, as well as the experimental procedures to be taken, in order to minimise the error and optimise the results. As a matter of fact, a strong statement from Burhnam[50] says “…single heat rate methods work poorly and should not be used or published”. In this line, for instance, isoconversional methods are the convenient techniques for kinetic parameters assessment as they are based in data from different runs taken at different heating rates. Thermogravimetric data analysis Experimental determination of kinetic parameters has been a challenging task for many researchers, since, apart from the complexity of the chemical reactions, the so-called kinetic triplet is composed by three interdependent factors. In fact, while the reaction mechanism plays a key role for the determination of the kinetic triplet, the temperature and the degree of conversion has a great influence on the magnitude of the frequency factor as well as of the activation energy. However, both the frequency factor and activation energy are also dependent upon the reaction mechanism. When the kinetics follows equation (1), various methods can be applied to determine the kinetic parameters. Among these methods, Coats and Redfern (including DAEM), Kissinger as well as model-free methods are some of the most popular. Coats and Redfern method, contrary to Kissinger’s method, can be satisfactorily used for any reaction order or mechanism, including nucleation and nuclei growth.
26
The model-free methods are usually termed as the simplest ways to determine the kinetic parameters from experimental data[26]. As already discussed in previous sections, they are based mainly in the OFW and the Friedman analyses. The main drawback in using these analyses is that they do not apply when multi-step, catalyzed or nucleation mechanisms take place in the transformation process. Indeed, the model free method introduces a preconception in the values of A and Eact when the reaction has a distribution of activation energies, as it is unable to distinguish between the effect of the distribution and the effect of the magnitude of the mean activation energy. Hence, it gives an erroneous value for the mean value of E (E0
act), which is usually lower than the "true" value [54]. While the value of E0
act is accurately determined even for wide distributions, the value of A usually requires a slight adjustment (typically within a factor of two) [54]. The width of the assumed Gaussian distribution, σ, can then be determined from the width of the peak representing the rate of species evolution (or weight loss). In the Tmax method, some difficulties arise when peaks are not well resolved. In such cases, substantial shifts in Tmax can occur. However, the same problem arises when using the Friedman method, unless deconvolution of the peaks is attempted [55]. Another limitation is associated with the presence of small, multiple maxima superimposed on a broader peak, i.e., when the assumption of first-order kinetics is not fully supported. In this case, again, the applicability of both the Tmax and Friedman methods is reduced. The exact value of Tmax may also be difficult to determine for large, broad peaks. It is important to notice that experimentally determined kinetic triplet does not necessarily fit the theoretical physical meaning. In fact, activation energy would be expected to be the energy barrier that the activated complex should achieve and overcome for the reaction to occur; the frequency factor should be related to the vibrational frequency while reaction order should define the reaction mechanism. However, experimental results on kinetics do not necessarily these physical meanings. The main reason for determining the kinetic triplet for a given process is to use it for practical purposes like describing the experimental data and predicting the process yields at temperature programs that differ from the experimental program[48]. Input Data Generation for Modelling. The determination of individual pools, pools sizes, kinetics and pools is an important step towards the generation of reliable and appropriate input data for modelling pyrolysis at different heating rates. A pool represents a specific pyrolysis product precursor from which each pyrolysis product is generated. Once A, E0
act, and σ values are determined, the sizes of precursor pools for individual species are determined by adjusting the simulated peak heights so that they best fit the TG-FTIR data. These data altogether are used as input information into a model that allows the simulation of pyrolysis at any desired heating rate, following a single step or multi-step temperature program. From the data, it is assumed that each peak in the derivative thermogram represents a specific precursor for the compound being released. Therefore, for the evolution of each precursor pool (identified through its individual peak), A, E0
act, σ and the pool size, i.e., the concentrations of the precursor species, is determined. In general, each volatile species (light
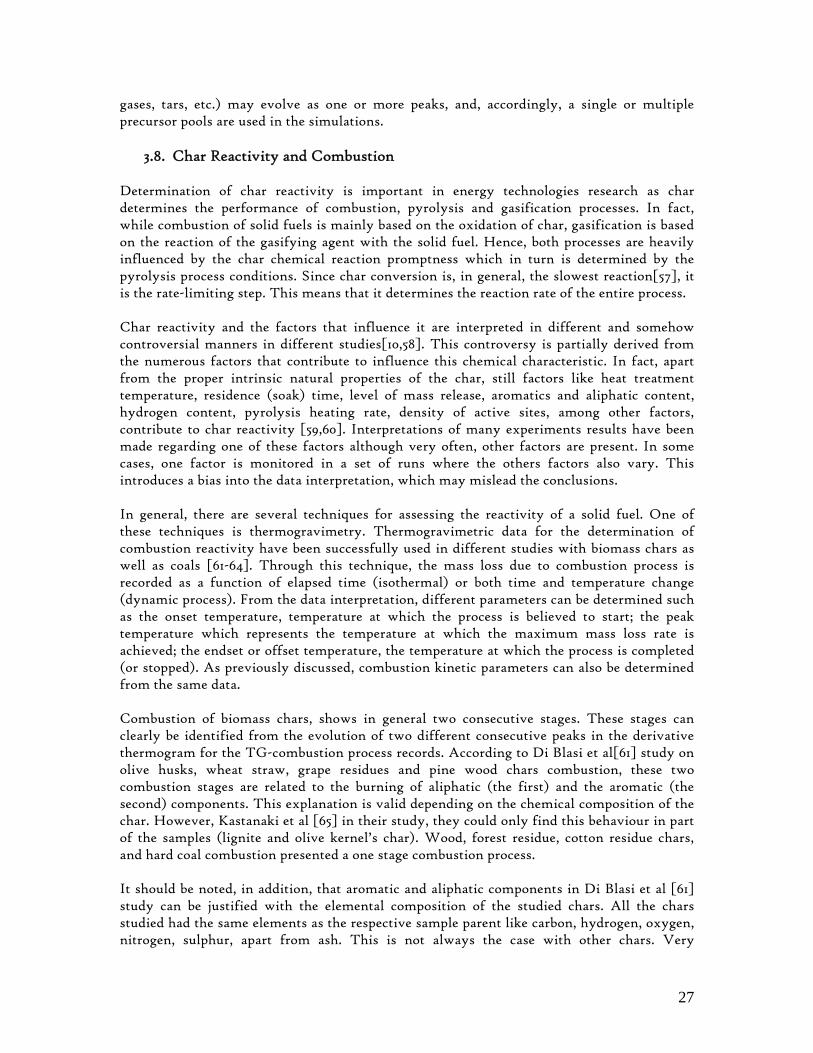
27
gases, tars, etc.) may evolve as one or more peaks, and, accordingly, a single or multiple precursor pools are used in the simulations.
3.8. Char Reactivity and Combustion Determination of char reactivity is important in energy technologies research as char determines the performance of combustion, pyrolysis and gasification processes. In fact, while combustion of solid fuels is mainly based on the oxidation of char, gasification is based on the reaction of the gasifying agent with the solid fuel. Hence, both processes are heavily influenced by the char chemical reaction promptness which in turn is determined by the pyrolysis process conditions. Since char conversion is, in general, the slowest reaction[57], it is the rate-limiting step. This means that it determines the reaction rate of the entire process. Char reactivity and the factors that influence it are interpreted in different and somehow controversial manners in different studies[10,58]. This controversy is partially derived from the numerous factors that contribute to influence this chemical characteristic. In fact, apart from the proper intrinsic natural properties of the char, still factors like heat treatment temperature, residence (soak) time, level of mass release, aromatics and aliphatic content, hydrogen content, pyrolysis heating rate, density of active sites, among other factors, contribute to char reactivity [59,60]. Interpretations of many experiments results have been made regarding one of these factors although very often, other factors are present. In some cases, one factor is monitored in a set of runs where the others factors also vary. This introduces a bias into the data interpretation, which may mislead the conclusions. In general, there are several techniques for assessing the reactivity of a solid fuel. One of these techniques is thermogravimetry. Thermogravimetric data for the determination of combustion reactivity have been successfully used in different studies with biomass chars as well as coals [61-64]. Through this technique, the mass loss due to combustion process is recorded as a function of elapsed time (isothermal) or both time and temperature change (dynamic process). From the data interpretation, different parameters can be determined such as the onset temperature, temperature at which the process is believed to start; the peak temperature which represents the temperature at which the maximum mass loss rate is achieved; the endset or offset temperature, the temperature at which the process is completed (or stopped). As previously discussed, combustion kinetic parameters can also be determined from the same data. Combustion of biomass chars, shows in general two consecutive stages. These stages can clearly be identified from the evolution of two different consecutive peaks in the derivative thermogram for the TG-combustion process records. According to Di Blasi et al[61] study on olive husks, wheat straw, grape residues and pine wood chars combustion, these two combustion stages are related to the burning of aliphatic (the first) and the aromatic (the second) components. This explanation is valid depending on the chemical composition of the char. However, Kastanaki et al [65] in their study, they could only find this behaviour in part of the samples (lignite and olive kernel’s char). Wood, forest residue, cotton residue chars, and hard coal combustion presented a one stage combustion process. It should be noted, in addition, that aromatic and aliphatic components in Di Blasi et al [61] study can be justified with the elemental composition of the studied chars. All the chars studied had the same elements as the respective sample parent like carbon, hydrogen, oxygen, nitrogen, sulphur, apart from ash. This is not always the case with other chars. Very
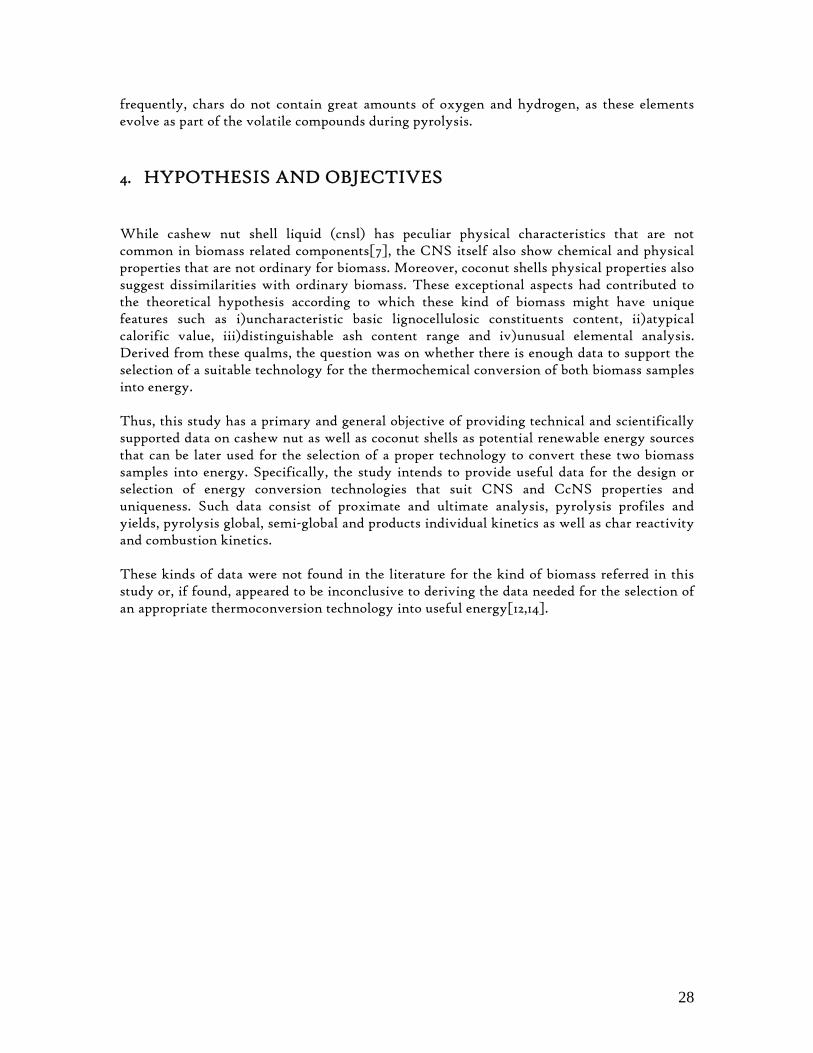
28
frequently, chars do not contain great amounts of oxygen and hydrogen, as these elements evolve as part of the volatile compounds during pyrolysis. 4. HYPOTHESIS AND OBJECTIVES While cashew nut shell liquid (cnsl) has peculiar physical characteristics that are not common in biomass related components[7], the CNS itself also show chemical and physical properties that are not ordinary for biomass. Moreover, coconut shells physical properties also suggest dissimilarities with ordinary biomass. These exceptional aspects had contributed to the theoretical hypothesis according to which these kind of biomass might have unique features such as i)uncharacteristic basic lignocellulosic constituents content, ii)atypical calorific value, iii)distinguishable ash content range and iv)unusual elemental analysis. Derived from these qualms, the question was on whether there is enough data to support the selection of a suitable technology for the thermochemical conversion of both biomass samples into energy. Thus, this study has a primary and general objective of providing technical and scientifically supported data on cashew nut as well as coconut shells as potential renewable energy sources that can be later used for the selection of a proper technology to convert these two biomass samples into energy. Specifically, the study intends to provide useful data for the design or selection of energy conversion technologies that suit CNS and CcNS properties and uniqueness. Such data consist of proximate and ultimate analysis, pyrolysis profiles and yields, pyrolysis global, semi-global and products individual kinetics as well as char reactivity and combustion kinetics. These kinds of data were not found in the literature for the kind of biomass referred in this study or, if found, appeared to be inconclusive to deriving the data needed for the selection of an appropriate thermoconversion technology into useful energy[12,14].
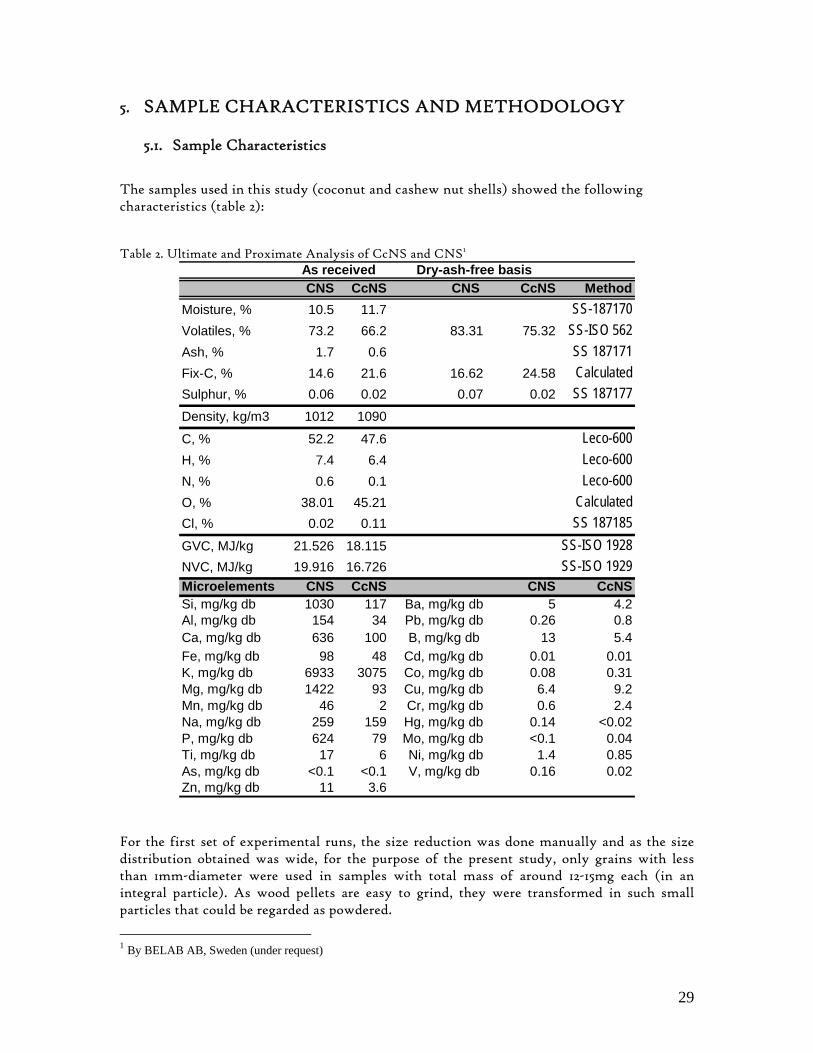
29
5. SAMPLE CHARACTERISTICS AND METHODOLOGY
5.1. Sample Characteristics The samples used in this study (coconut and cashew nut shells) showed the following characteristics (table 2):
Table 2. Ultimate and Proximate Analysis of CcNS and CNS1
CNS CcNS CNS CcNS MethodMoisture, % 10.5 11.7 SS-187170Volatiles, % 73.2 66.2 83.31 75.32 SS-ISO 562Ash, % 1.7 0.6 SS 187171Fix-C, % 14.6 21.6 16.62 24.58 CalculatedSulphur, % 0.06 0.02 0.07 0.02 SS 187177Density, kg/m3 1012 1090
C, % 52.2 47.6 Leco-600H, % 7.4 6.4 Leco-600N, % 0.6 0.1 Leco-600O, % 38.01 45.21 CalculatedCl, % 0.02 0.11 SS 187185GVC, MJ/kg 21.526 18.115 SS-ISO 1928NVC, MJ/kg 19.916 16.726 SS-ISO 1929Microelements CNS CcNS CNS CcNSSi, mg/kg db 1030 117 Ba, mg/kg db 5 4.2Al, mg/kg db 154 34 Pb, mg/kg db 0.26 0.8Ca, mg/kg db 636 100 B, mg/kg db 13 5.4Fe, mg/kg db 98 48 Cd, mg/kg db 0.01 0.01K, mg/kg db 6933 3075 Co, mg/kg db 0.08 0.31Mg, mg/kg db 1422 93 Cu, mg/kg db 6.4 9.2Mn, mg/kg db 46 2 Cr, mg/kg db 0.6 2.4Na, mg/kg db 259 159 Hg, mg/kg db 0.14 <0.02P, mg/kg db 624 79 Mo, mg/kg db <0.1 0.04Ti, mg/kg db 17 6 Ni, mg/kg db 1.4 0.85As, mg/kg db <0.1 <0.1 V, mg/kg db 0.16 0.02Zn, mg/kg db 11 3.6
Dry-ash-free basisAs received
For the first set of experimental runs, the size reduction was done manually and as the size distribution obtained was wide, for the purpose of the present study, only grains with less than 1mm-diameter were used in samples with total mass of around 12-15mg each (in an integral particle). As wood pellets are easy to grind, they were transformed in such small particles that could be regarded as powdered.
1 By BELAB AB, Sweden (under request)
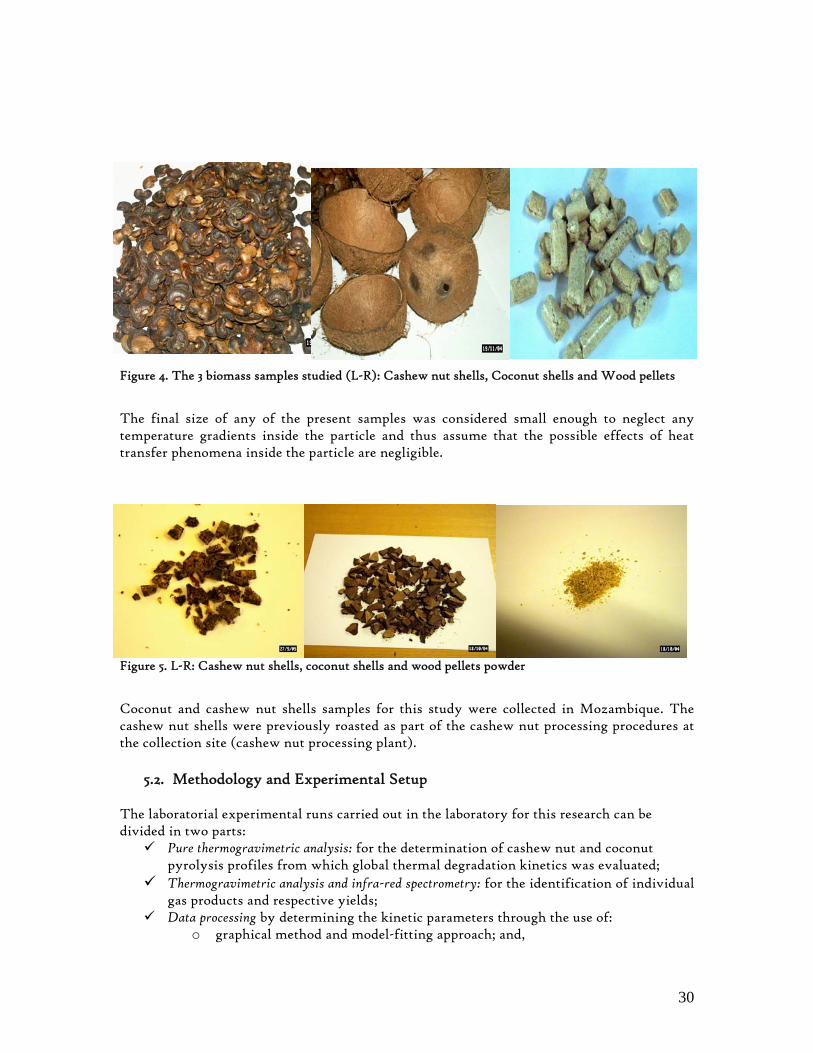
30
Figure 4. The 3 biomass samples studied (L-R): Cashew nut shells, Coconut shells and Wood pellets
The final size of any of the present samples was considered small enough to neglect any temperature gradients inside the particle and thus assume that the possible effects of heat transfer phenomena inside the particle are negligible.
Figure 5. L-R: Cashew nut shells, coconut shells and wood pellets powder
Coconut and cashew nut shells samples for this study were collected in Mozambique. The cashew nut shells were previously roasted as part of the cashew nut processing procedures at the collection site (cashew nut processing plant).
5.2. Methodology and Experimental Setup The laboratorial experimental runs carried out in the laboratory for this research can be divided in two parts:
Pure thermogravimetric analysis: for the determination of cashew nut and coconut pyrolysis profiles from which global thermal degradation kinetics was evaluated;
Thermogravimetric analysis and infra-red spectrometry: for the identification of individual gas products and respective yields;
Data processing by determining the kinetic parameters through the use of: o graphical method and model-fitting approach; and,
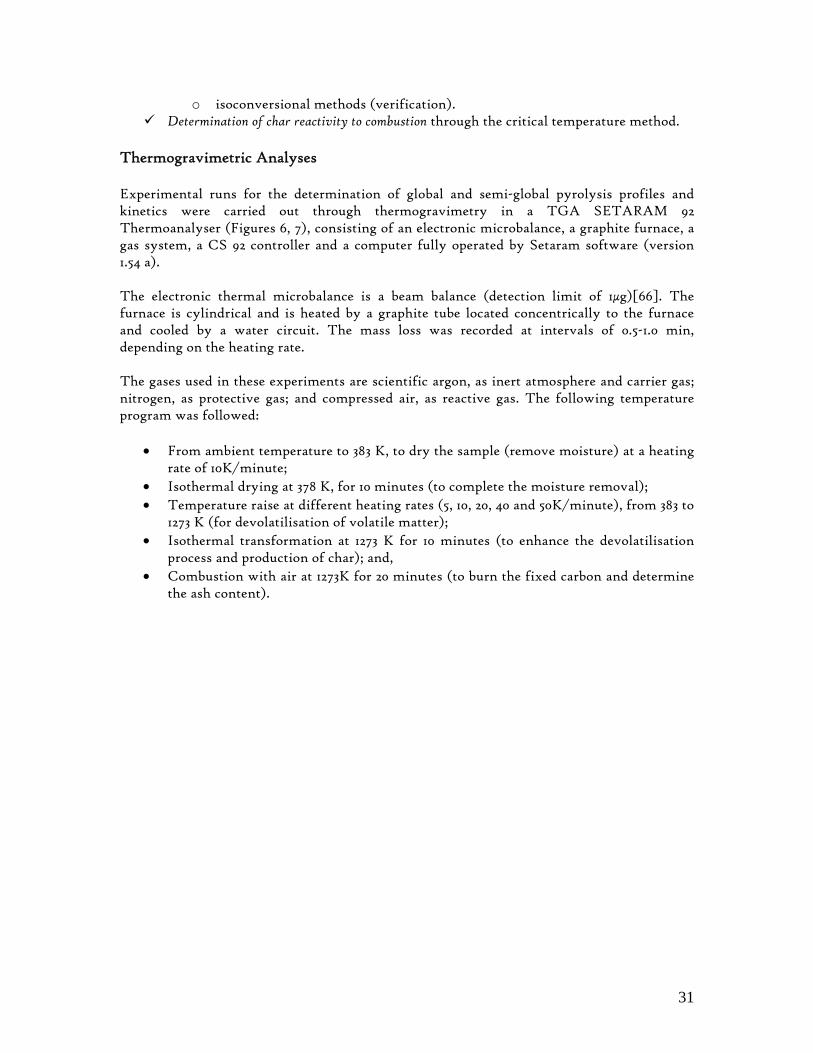
31
o isoconversional methods (verification). Determination of char reactivity to combustion through the critical temperature method.
Thermogravimetric Analyses Experimental runs for the determination of global and semi-global pyrolysis profiles and kinetics were carried out through thermogravimetry in a TGA SETARAM 92 Thermoanalyser (Figures 6, 7), consisting of an electronic microbalance, a graphite furnace, a gas system, a CS 92 controller and a computer fully operated by Setaram software (version 1.54 a). The electronic thermal microbalance is a beam balance (detection limit of 1μg)[66]. The furnace is cylindrical and is heated by a graphite tube located concentrically to the furnace and cooled by a water circuit. The mass loss was recorded at intervals of 0.5-1.0 min, depending on the heating rate. The gases used in these experiments are scientific argon, as inert atmosphere and carrier gas; nitrogen, as protective gas; and compressed air, as reactive gas. The following temperature program was followed:
• From ambient temperature to 383 K, to dry the sample (remove moisture) at a heating rate of 10K/minute;
• Isothermal drying at 378 K, for 10 minutes (to complete the moisture removal); • Temperature raise at different heating rates (5, 10, 20, 40 and 50K/minute), from 383 to
1273 K (for devolatilisation of volatile matter); • Isothermal transformation at 1273 K for 10 minutes (to enhance the devolatilisation
process and production of char); and, • Combustion with air at 1273K for 20 minutes (to burn the fixed carbon and determine
the ash content).
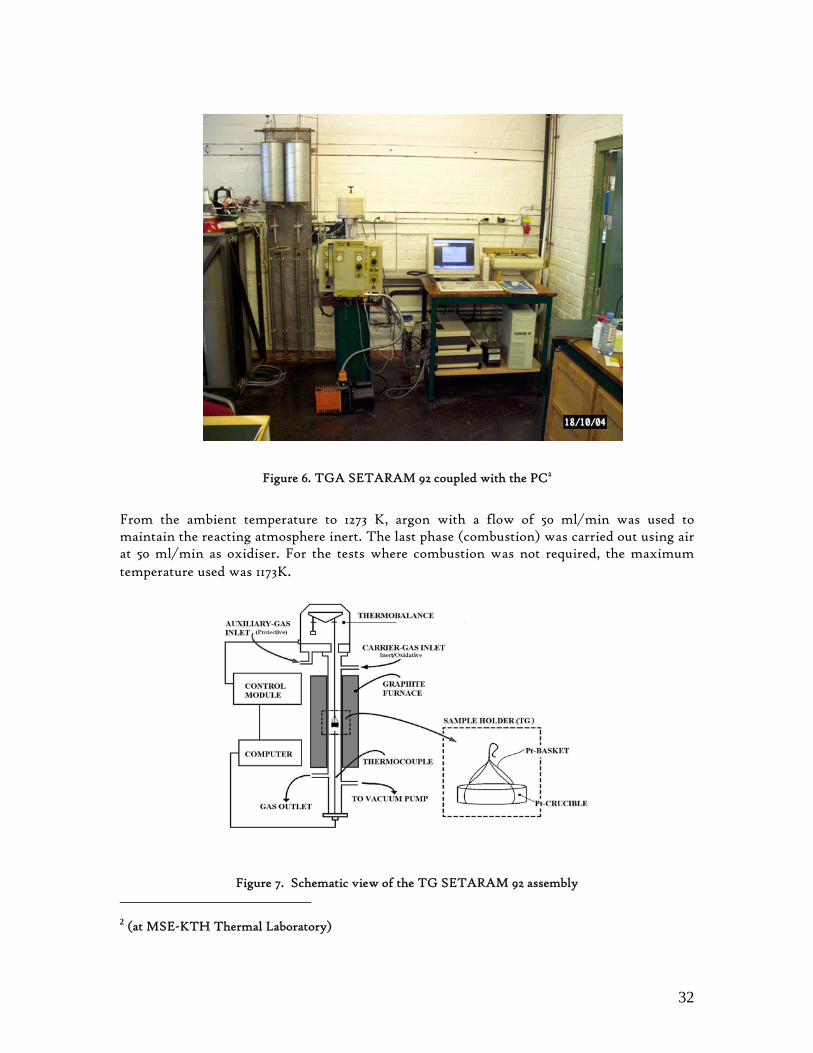
32
Figure 6. TGA SETARAM 92 coupled with the PC2
From the ambient temperature to 1273 K, argon with a flow of 50 ml/min was used to maintain the reacting atmosphere inert. The last phase (combustion) was carried out using air at 50 ml/min as oxidiser. For the tests where combustion was not required, the maximum temperature used was 1173K.
Figure 7. Schematic view of the TG SETARAM 92 assembly
2 (at MSE-KTH Thermal Laboratory)
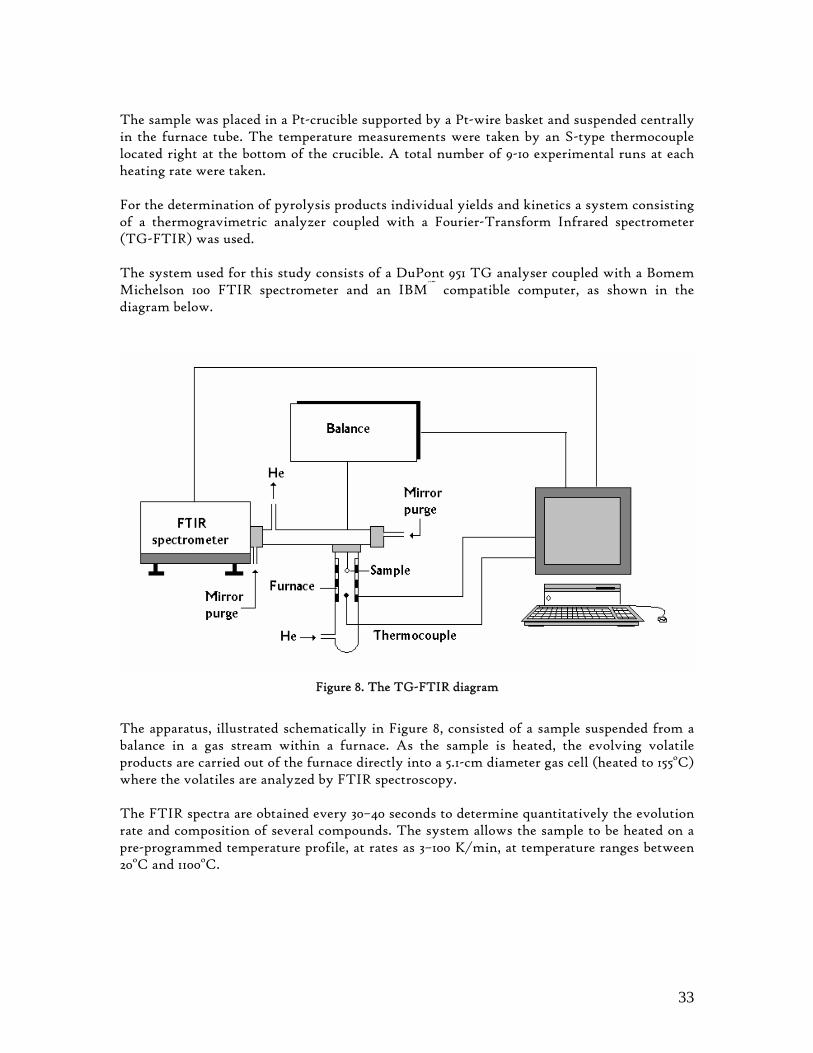
33
The sample was placed in a Pt-crucible supported by a Pt-wire basket and suspended centrally in the furnace tube. The temperature measurements were taken by an S-type thermocouple located right at the bottom of the crucible. A total number of 9-10 experimental runs at each heating rate were taken. For the determination of pyrolysis products individual yields and kinetics a system consisting of a thermogravimetric analyzer coupled with a Fourier-Transform Infrared spectrometer (TG-FTIR) was used. The system used for this study consists of a DuPont 951 TG analyser coupled with a Bomem Michelson 100 FTIR spectrometer and an IBM™ compatible computer, as shown in the diagram below.
Figure 8. The TG-FTIR diagram
The apparatus, illustrated schematically in Figure 8, consisted of a sample suspended from a balance in a gas stream within a furnace. As the sample is heated, the evolving volatile products are carried out of the furnace directly into a 5.1-cm diameter gas cell (heated to 155oC) where the volatiles are analyzed by FTIR spectroscopy. The FTIR spectra are obtained every 30–40 seconds to determine quantitatively the evolution rate and composition of several compounds. The system allows the sample to be heated on a pre-programmed temperature profile, at rates as 3–100 K/min, at temperature ranges between 20oC and 1100oC.
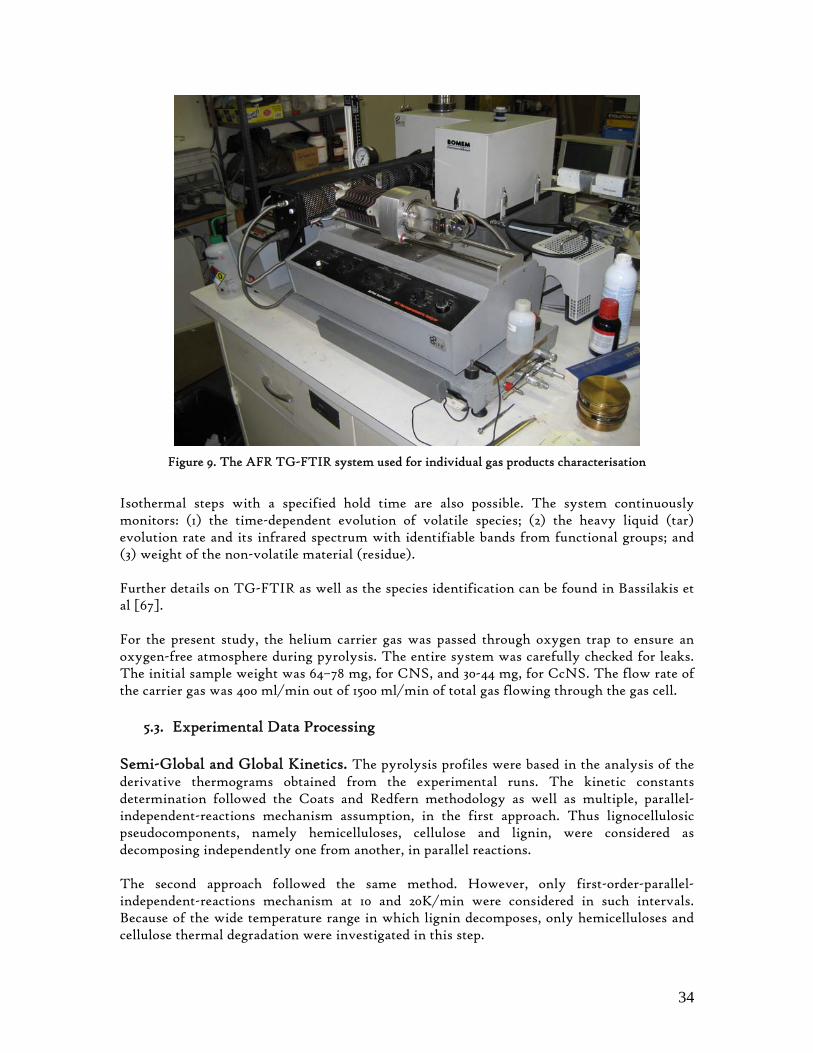
34
Figure 9. The AFR TG-FTIR system used for individual gas products characterisation
Isothermal steps with a specified hold time are also possible. The system continuously monitors: (1) the time-dependent evolution of volatile species; (2) the heavy liquid (tar) evolution rate and its infrared spectrum with identifiable bands from functional groups; and (3) weight of the non-volatile material (residue). Further details on TG-FTIR as well as the species identification can be found in Bassilakis et al [67]. For the present study, the helium carrier gas was passed through oxygen trap to ensure an oxygen-free atmosphere during pyrolysis. The entire system was carefully checked for leaks. The initial sample weight was 64–78 mg, for CNS, and 30-44 mg, for CcNS. The flow rate of the carrier gas was 400 ml/min out of 1500 ml/min of total gas flowing through the gas cell.
5.3. Experimental Data Processing Semi-Global and Global Kinetics. The pyrolysis profiles were based in the analysis of the derivative thermograms obtained from the experimental runs. The kinetic constants determination followed the Coats and Redfern methodology as well as multiple, parallel-independent-reactions mechanism assumption, in the first approach. Thus lignocellulosic pseudocomponents, namely hemicelluloses, cellulose and lignin, were considered as decomposing independently one from another, in parallel reactions. The second approach followed the same method. However, only first-order-parallel-independent-reactions mechanism at 10 and 20K/min were considered in such intervals. Because of the wide temperature range in which lignin decomposes, only hemicelluloses and cellulose thermal degradation were investigated in this step.
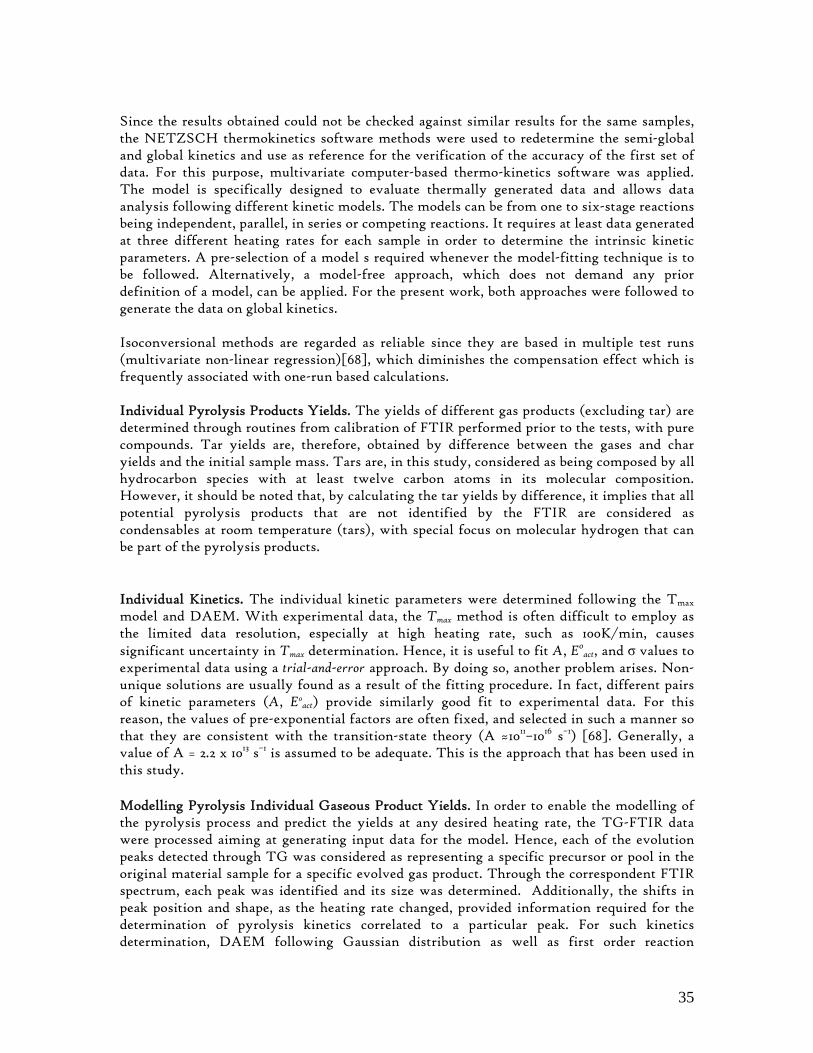
35
Since the results obtained could not be checked against similar results for the same samples, the NETZSCH thermokinetics software methods were used to redetermine the semi-global and global kinetics and use as reference for the verification of the accuracy of the first set of data. For this purpose, multivariate computer-based thermo-kinetics software was applied. The model is specifically designed to evaluate thermally generated data and allows data analysis following different kinetic models. The models can be from one to six-stage reactions being independent, parallel, in series or competing reactions. It requires at least data generated at three different heating rates for each sample in order to determine the intrinsic kinetic parameters. A pre-selection of a model s required whenever the model-fitting technique is to be followed. Alternatively, a model-free approach, which does not demand any prior definition of a model, can be applied. For the present work, both approaches were followed to generate the data on global kinetics. Isoconversional methods are regarded as reliable since they are based in multiple test runs (multivariate non-linear regression)[68], which diminishes the compensation effect which is frequently associated with one-run based calculations. Individual Pyrolysis Products Yields. The yields of different gas products (excluding tar) are determined through routines from calibration of FTIR performed prior to the tests, with pure compounds. Tar yields are, therefore, obtained by difference between the gases and char yields and the initial sample mass. Tars are, in this study, considered as being composed by all hydrocarbon species with at least twelve carbon atoms in its molecular composition. However, it should be noted that, by calculating the tar yields by difference, it implies that all potential pyrolysis products that are not identified by the FTIR are considered as condensables at room temperature (tars), with special focus on molecular hydrogen that can be part of the pyrolysis products.
Individual Kinetics. The individual kinetic parameters were determined following the Tmax model and DAEM. With experimental data, the Tmax method is often difficult to employ as the limited data resolution, especially at high heating rate, such as 100K/min, causes significant uncertainty in Tmax determination. Hence, it is useful to fit A, E0
act, and σ values to experimental data using a trial-and-error approach. By doing so, another problem arises. Non-unique solutions are usually found as a result of the fitting procedure. In fact, different pairs of kinetic parameters (A, E0
act) provide similarly good fit to experimental data. For this reason, the values of pre-exponential factors are often fixed, and selected in such a manner so that they are consistent with the transition-state theory (A ≈1011–1016 s–1) [68]. Generally, a value of A = 2.2 x 10¹³ s–1 is assumed to be adequate. This is the approach that has been used in this study. Modelling Pyrolysis Individual Gaseous Product Yields. In order to enable the modelling of the pyrolysis process and predict the yields at any desired heating rate, the TG-FTIR data were processed aiming at generating input data for the model. Hence, each of the evolution peaks detected through TG was considered as representing a specific precursor or pool in the original material sample for a specific evolved gas product. Through the correspondent FTIR spectrum, each peak was identified and its size was determined. Additionally, the shifts in peak position and shape, as the heating rate changed, provided information required for the determination of pyrolysis kinetics correlated to a particular peak. For such kinetics determination, DAEM following Gaussian distribution as well as first order reaction
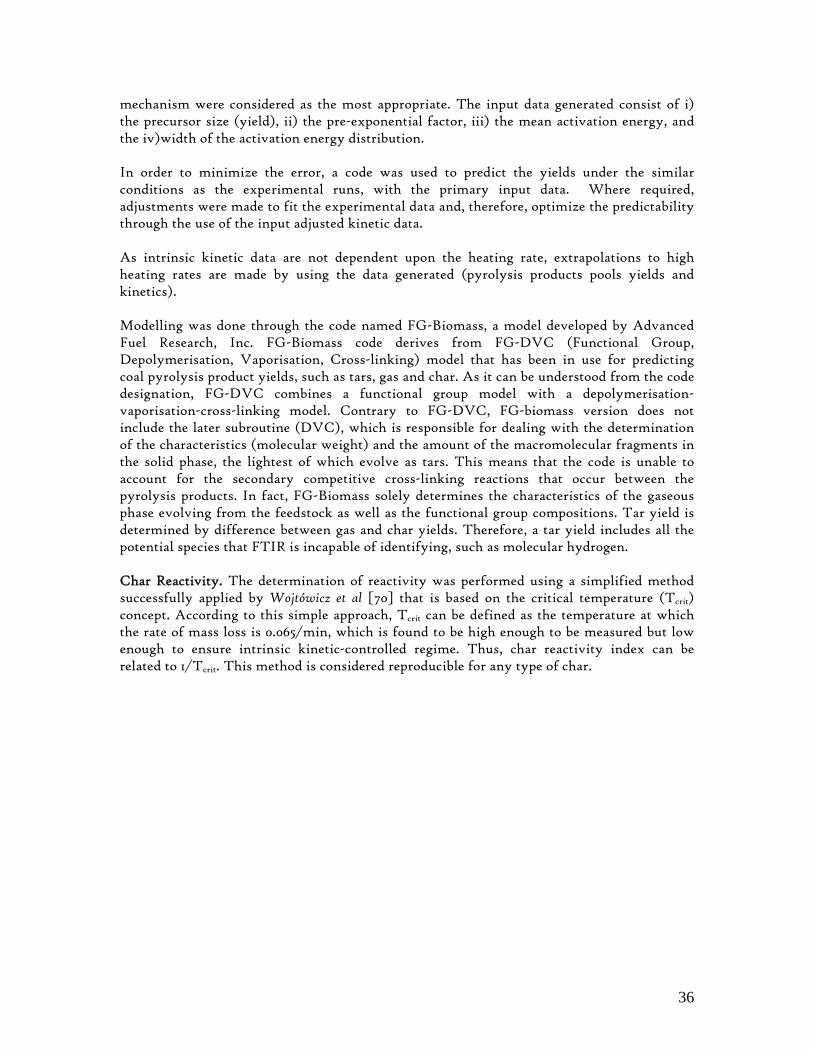
36
mechanism were considered as the most appropriate. The input data generated consist of i) the precursor size (yield), ii) the pre-exponential factor, iii) the mean activation energy, and the iv)width of the activation energy distribution. In order to minimize the error, a code was used to predict the yields under the similar conditions as the experimental runs, with the primary input data. Where required, adjustments were made to fit the experimental data and, therefore, optimize the predictability through the use of the input adjusted kinetic data. As intrinsic kinetic data are not dependent upon the heating rate, extrapolations to high heating rates are made by using the data generated (pyrolysis products pools yields and kinetics). Modelling was done through the code named FG-Biomass, a model developed by Advanced Fuel Research, Inc. FG-Biomass code derives from FG-DVC (Functional Group, Depolymerisation, Vaporisation, Cross-linking) model that has been in use for predicting coal pyrolysis product yields, such as tars, gas and char. As it can be understood from the code designation, FG-DVC combines a functional group model with a depolymerisation-vaporisation-cross-linking model. Contrary to FG-DVC, FG-biomass version does not include the later subroutine (DVC), which is responsible for dealing with the determination of the characteristics (molecular weight) and the amount of the macromolecular fragments in the solid phase, the lightest of which evolve as tars. This means that the code is unable to account for the secondary competitive cross-linking reactions that occur between the pyrolysis products. In fact, FG-Biomass solely determines the characteristics of the gaseous phase evolving from the feedstock as well as the functional group compositions. Tar yield is determined by difference between gas and char yields. Therefore, a tar yield includes all the potential species that FTIR is incapable of identifying, such as molecular hydrogen. Char Reactivity. The determination of reactivity was performed using a simplified method successfully applied by Wojtówicz et al [70] that is based on the critical temperature (Tcrit) concept. According to this simple approach, Tcrit can be defined as the temperature at which the rate of mass loss is 0.065/min, which is found to be high enough to be measured but low enough to ensure intrinsic kinetic-controlled regime. Thus, char reactivity index can be related to 1/Tcrit. This method is considered reproducible for any type of char.
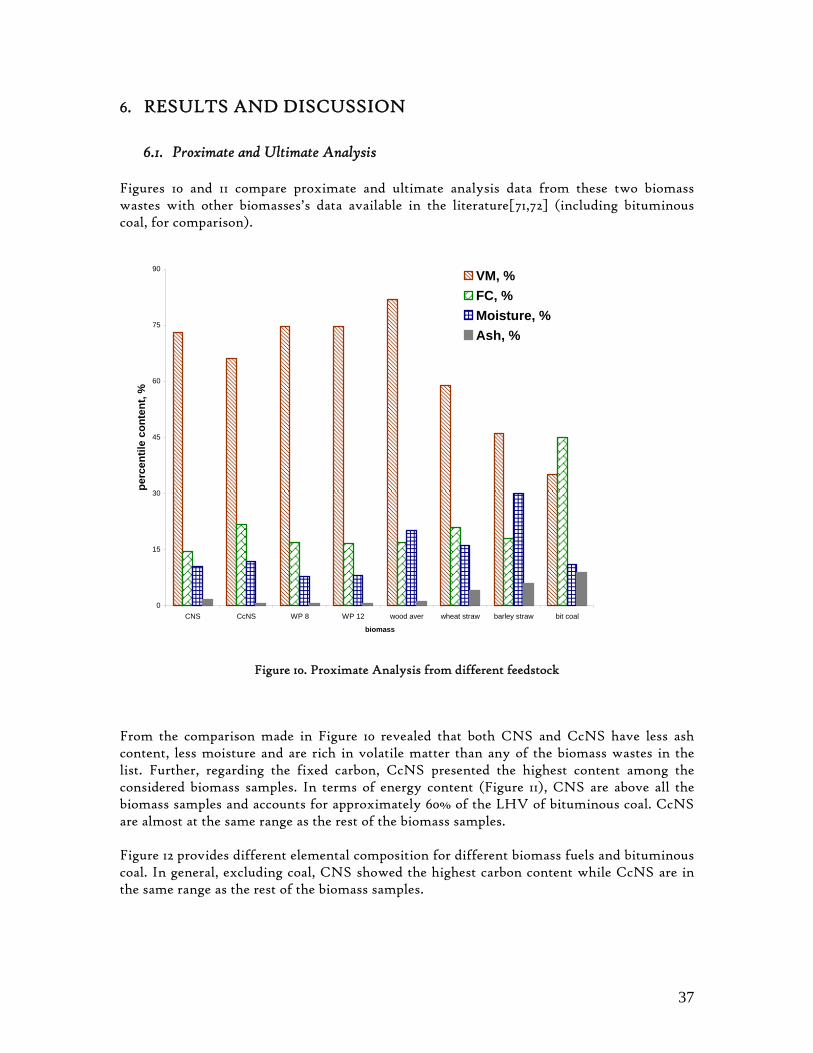
37
6. RESULTS AND DISCUSSION
6.1. Proximate and Ultimate Analysis Figures 10 and 11 compare proximate and ultimate analysis data from these two biomass wastes with other biomasses’s data available in the literature[71,72] (including bituminous coal, for comparison).
0
15
30
45
60
75
90
CNS CcNS WP 8 WP 12 wood aver wheat straw barley straw bit coal
biomass
perc
entil
e co
nten
t, %
VM, %FC, %Moisture, %Ash, %
Figure 10. Proximate Analysis from different feedstock
From the comparison made in Figure 10 revealed that both CNS and CcNS have less ash content, less moisture and are rich in volatile matter than any of the biomass wastes in the list. Further, regarding the fixed carbon, CcNS presented the highest content among the considered biomass samples. In terms of energy content (Figure 11), CNS are above all the biomass samples and accounts for approximately 60% of the LHV of bituminous coal. CcNS are almost at the same range as the rest of the biomass samples. Figure 12 provides different elemental composition for different biomass fuels and bituminous coal. In general, excluding coal, CNS showed the highest carbon content while CcNS are in the same range as the rest of the biomass samples.

38
0
7
14
21
28
35
CNS CcNS WP 8 WP 12 wood aver wheat straw barley straw bit coal
LHV,
MJ/
kg
Figure 11. Low Heating Value for different biomass (including coal) compared to the CNS and CcNS
The same parity is found for hydrogen and nitrogen contents, except rice husks and groundnut shells which present high nitrogen content. Groundnut shells are, however, the poorest in oxygen among the biomass solid fuels. One parameter that is definitely related to the energy content of a solid fuel is the ratio between oxygen and carbon in a given fuel. High content in oxygen determines low energy content. Thus, the higher the ratio O/C the lower the energy content will be. The so-called van Krevelen diagram (Figure 13) gives the relation between O/C and H/C for different solid fuels. From the diagram, it can be seen that high proportion of oxygen and hydrogen reduces the energy content of a given solid fuel. Following this conclusion, anthracite and coals are the richest solid fuels shown in the graphic. Regarding the biomass samples from the present study, it can be seen both are within the range as well as the other biomasses found in other studies. It is important to note, however, that ultimate analysis of CcNS by Raveendran[12] differs somehow from the results of the present study and the ratios fall outside the “biomass region” in the van Krevelen diagram. This also happened with the rice straw from two different studies [12, 72]. However, all of them are within the range for biomass fuels.
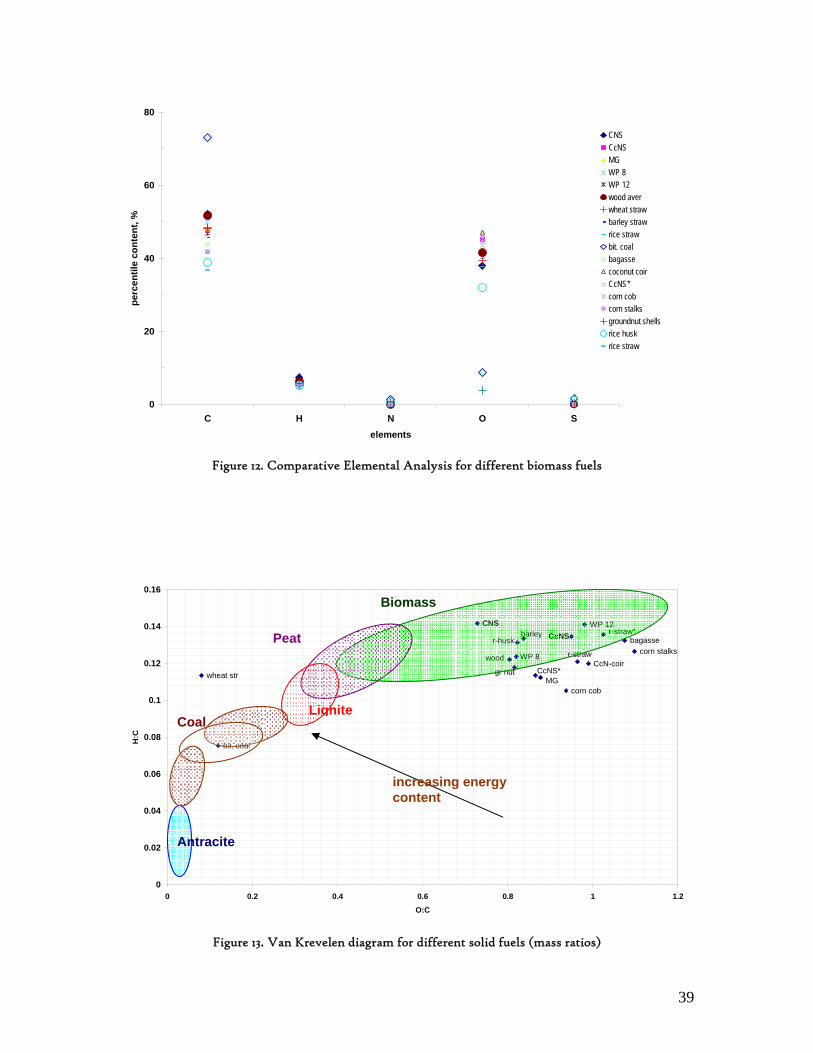
39
0
20
40
60
80
C H N O Selements
perc
entil
e co
nten
t, %
CNSCcNSMGWP 8WP 12wood averwheat strawbarley strawrice strawbit. coalbagassecoconut coirCcNS*corn cobcorn stalksgroundnut shellsrice huskrice straw
Figure 12. Comparative Elemental Analysis for different biomass fuels
r-straw*
corn stalksbagasse
r-strawCcN-coir
corn cobMG
CcNS*
CNSCcNS
wood WP 8
WP 12
bit. coal
wheat str gr nut
barleyr-husk
0
0.02
0.04
0.06
0.08
0.1
0.12
0.14
0.16
0 0.2 0.4 0.6 0.8 1 1.2
O:C
H:C
Figure 13. Van Krevelen diagram for different solid fuels (mass ratios)
increasing energy content
Antracite
Coal Lignite
Peat
Biomass
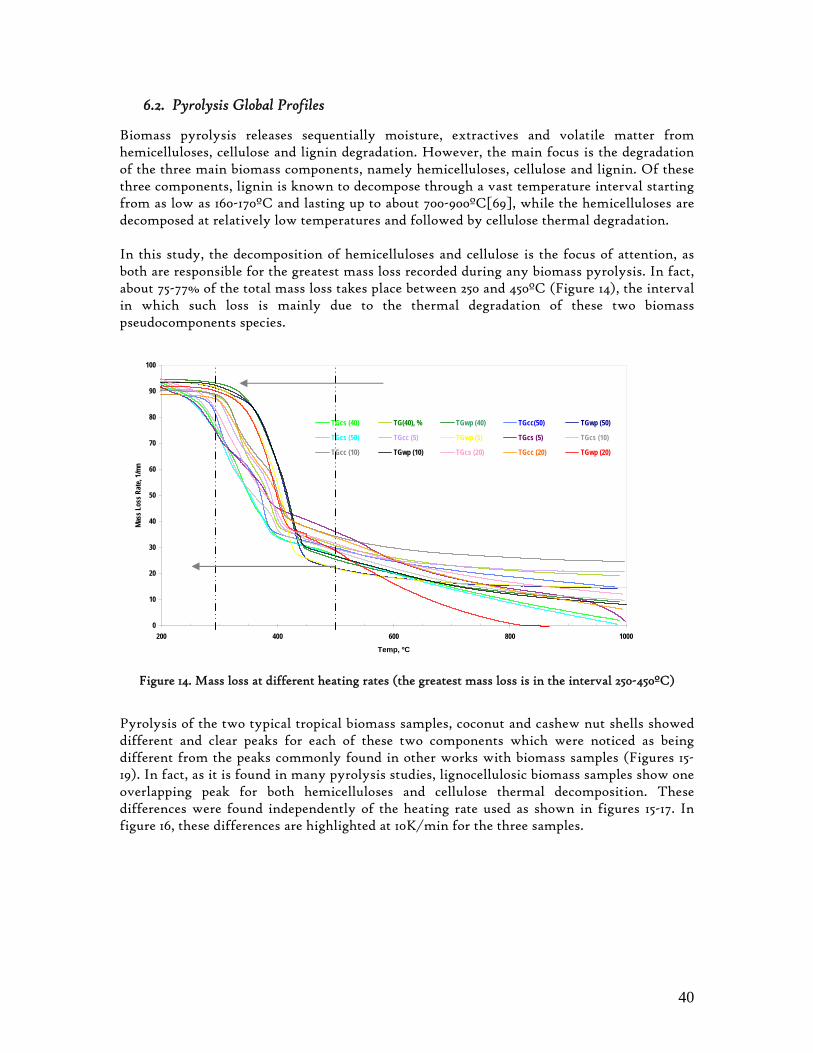
40
6.2. Pyrolysis Global Profiles
Biomass pyrolysis releases sequentially moisture, extractives and volatile matter from hemicelluloses, cellulose and lignin degradation. However, the main focus is the degradation of the three main biomass components, namely hemicelluloses, cellulose and lignin. Of these three components, lignin is known to decompose through a vast temperature interval starting from as low as 160-170ºC and lasting up to about 700-900ºC[69], while the hemicelluloses are decomposed at relatively low temperatures and followed by cellulose thermal degradation. In this study, the decomposition of hemicelluloses and cellulose is the focus of attention, as both are responsible for the greatest mass loss recorded during any biomass pyrolysis. In fact, about 75-77% of the total mass loss takes place between 250 and 450ºC (Figure 14), the interval in which such loss is mainly due to the thermal degradation of these two biomass pseudocomponents species.
0
10
20
30
40
50
60
70
80
90
100
200 400 600 800 1000
Temp, ºC
Mass
Los
s Rat
e, 1/m
n
TGcs (40) TG(40), % TGwp (40) TGcc(50) TGwp (50)
TGcs (50) TGcc (5) TGwp (5) TGcs (5) TGcs (10)
TGcc (10) TGwp (10) TGcs (20) TGcc (20) TGwp (20)
Figure 14. Mass loss at different heating rates (the greatest mass loss is in the interval 250-450ºC)
Pyrolysis of the two typical tropical biomass samples, coconut and cashew nut shells showed different and clear peaks for each of these two components which were noticed as being different from the peaks commonly found in other works with biomass samples (Figures 15-19). In fact, as it is found in many pyrolysis studies, lignocellulosic biomass samples show one overlapping peak for both hemicelluloses and cellulose thermal decomposition. These differences were found independently of the heating rate used as shown in figures 15-17. In figure 16, these differences are highlighted at 10K/min for the three samples.
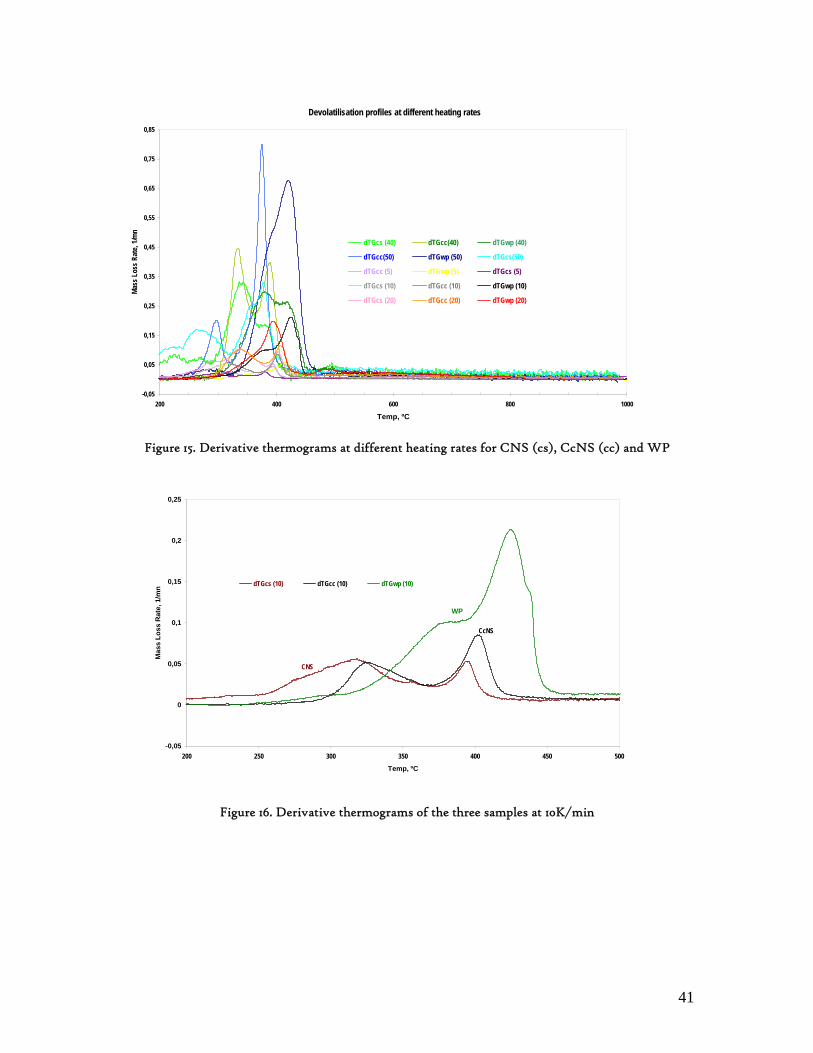
41
Devolatilisation profiles at different heating rates
-0,05
0,05
0,15
0,25
0,35
0,45
0,55
0,65
0,75
0,85
200 400 600 800 1000
Temp, ºC
Mass
Los
s Rat
e, 1/m
n
dTGcs (40) dTGcc(40) dTGwp (40)
dTGcc(50) dTGwp (50) dTGcs(50)
dTGcc (5) dTGwp (5) dTGcs (5)
dTGcs (10) dTGcc (10) dTGwp (10)
dTGcs (20) dTGcc (20) dTGwp (20)
Figure 15. Derivative thermograms at different heating rates for CNS (cs), CcNS (cc) and WP
Figure 16. Derivative thermograms of the three samples at 10K/min
WP
CNS
CcNS
-0,05
0
0,05
0,1
0,15
0,2
0,25
200 250 300 350 400 450 500Temp, ºC
Mas
s Lo
ss R
ate,
1/m
n dTGcs (10) dTGcc (10) dTGwp (10)
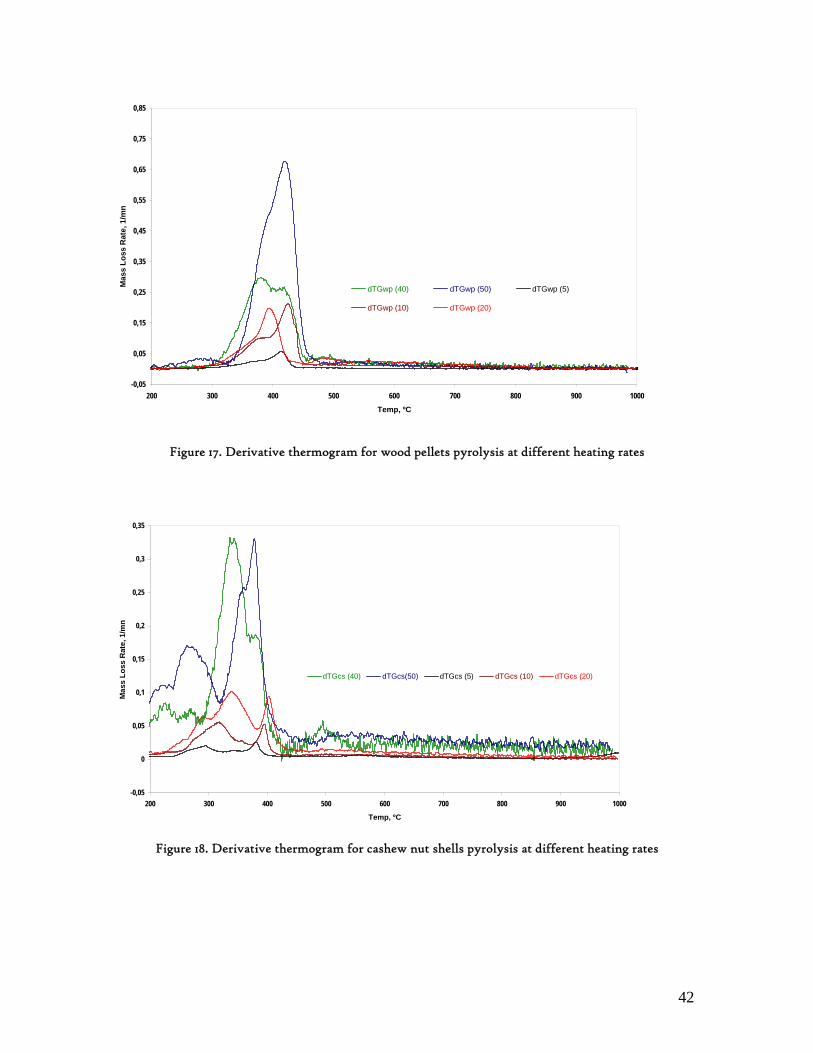
42
Figure 17. Derivative thermogram for wood pellets pyrolysis at different heating rates
Figure 18. Derivative thermogram for cashew nut shells pyrolysis at different heating rates
-0,05
0,05
0,15
0,25
0,35
0,45
0,55
0,65
0,75
0,85
200 300 400 500 600 700 800 900 1000Temp, ºC
Mas
s Lo
ss R
ate,
1/m
n
dTGwp (40) dTGwp (50) dTGwp (5)
dTGwp (10) dTGwp (20)
-0,05
0
0,05
0,1
0,15
0,2
0,25
0,3
0,35
200 300 400 500 600 700 800 900 1000
Temp, ºC
Mas
s Lo
ss R
ate,
1/m
n
dTGcs (40) dTGcs(50) dTGcs (5) dTGcs (10) dTGcs (20)
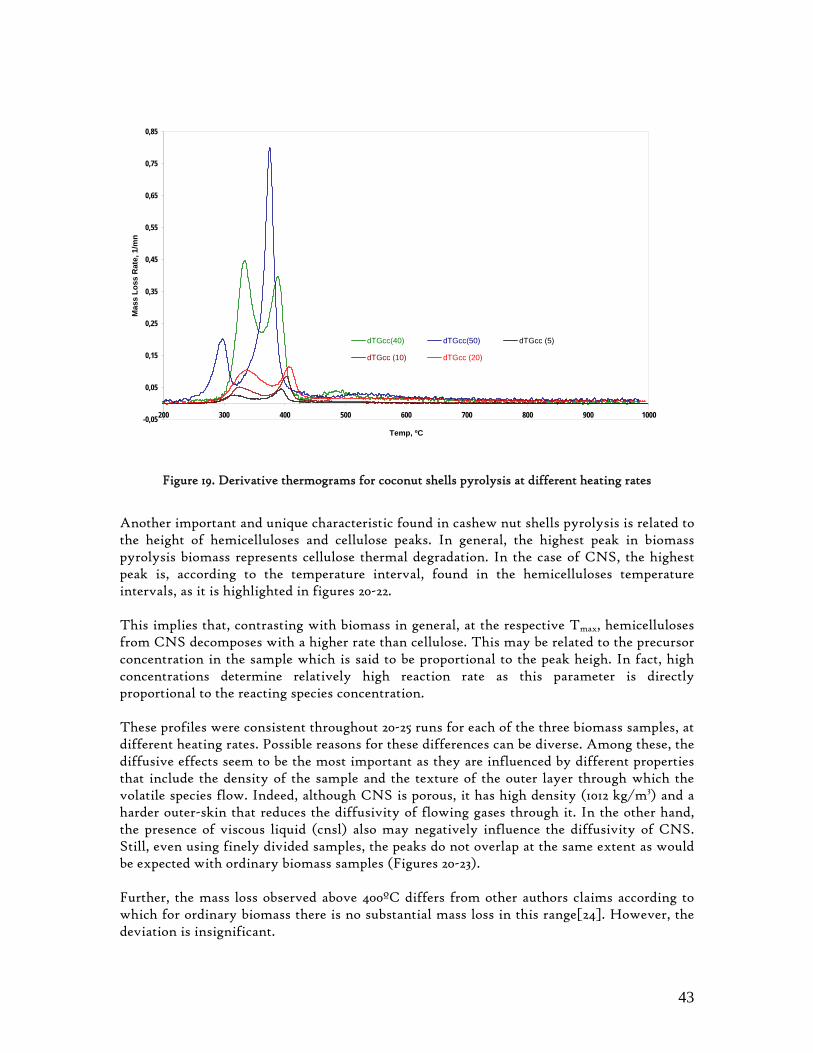
43
Figure 19. Derivative thermograms for coconut shells pyrolysis at different heating rates
Another important and unique characteristic found in cashew nut shells pyrolysis is related to the height of hemicelluloses and cellulose peaks. In general, the highest peak in biomass pyrolysis biomass represents cellulose thermal degradation. In the case of CNS, the highest peak is, according to the temperature interval, found in the hemicelluloses temperature intervals, as it is highlighted in figures 20-22. This implies that, contrasting with biomass in general, at the respective Tmax, hemicelluloses from CNS decomposes with a higher rate than cellulose. This may be related to the precursor concentration in the sample which is said to be proportional to the peak heigh. In fact, high concentrations determine relatively high reaction rate as this parameter is directly proportional to the reacting species concentration. These profiles were consistent throughout 20-25 runs for each of the three biomass samples, at different heating rates. Possible reasons for these differences can be diverse. Among these, the diffusive effects seem to be the most important as they are influenced by different properties that include the density of the sample and the texture of the outer layer through which the volatile species flow. Indeed, although CNS is porous, it has high density (1012 kg/m3) and a harder outer-skin that reduces the diffusivity of flowing gases through it. In the other hand, the presence of viscous liquid (cnsl) also may negatively influence the diffusivity of CNS. Still, even using finely divided samples, the peaks do not overlap at the same extent as would be expected with ordinary biomass samples (Figures 20-23). Further, the mass loss observed above 400ºC differs from other authors claims according to which for ordinary biomass there is no substantial mass loss in this range[24]. However, the deviation is insignificant.
-0,05
0,05
0,15
0,25
0,35
0,45
0,55
0,65
0,75
0,85
200 300 400 500 600 700 800 900 1000
Temp, ºC
Mas
s Lo
ss R
ate,
1/m
n
dTGcc(40) dTGcc(50) dTGcc (5)
dTGcc (10) dTGcc (20)
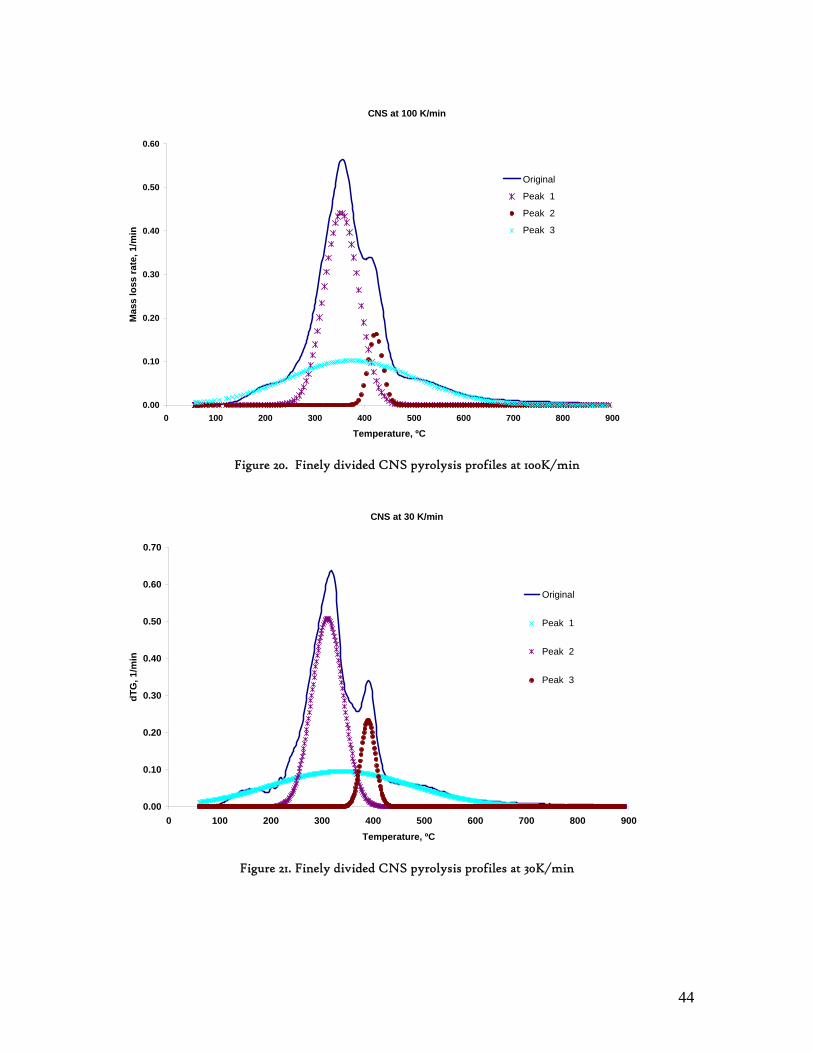
44
CNS at 100 K/min
0.00
0.10
0.20
0.30
0.40
0.50
0.60
0 100 200 300 400 500 600 700 800 900
Temperature, ºC
Mas
s lo
ss ra
te, 1
/min
Original
Peak 1
Peak 2
Peak 3
Figure 20. Finely divided CNS pyrolysis profiles at 100K/min
CNS at 30 K/min
0.00
0.10
0.20
0.30
0.40
0.50
0.60
0.70
0 100 200 300 400 500 600 700 800 900Temperature, ºC
dTG
, 1/m
in
Original
Peak 1
Peak 2
Peak 3
Figure 21. Finely divided CNS pyrolysis profiles at 30K/min
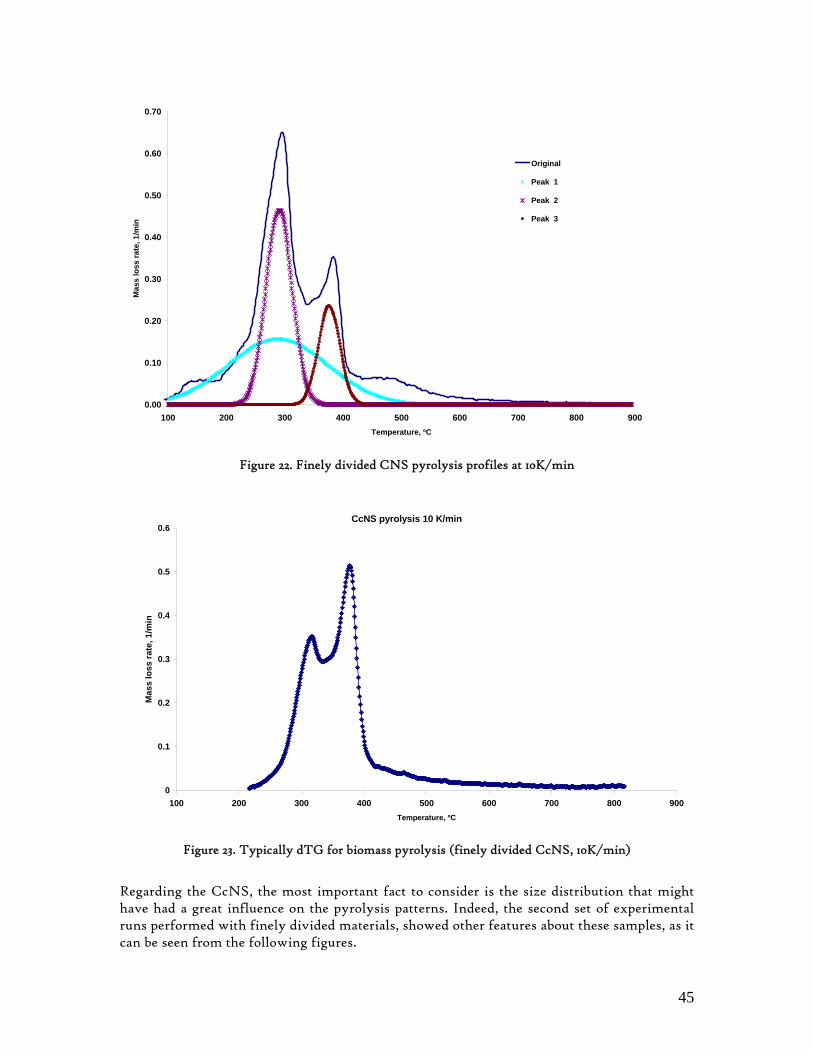
45
0.00
0.10
0.20
0.30
0.40
0.50
0.60
0.70
100 200 300 400 500 600 700 800 900Temperature, ºC
Mas
s lo
ss ra
te, 1
/min
Original
Peak 1
Peak 2
Peak 3
Figure 22. Finely divided CNS pyrolysis profiles at 10K/min
CcNS pyrolysis 10 K/min
0
0.1
0.2
0.3
0.4
0.5
0.6
100 200 300 400 500 600 700 800 900Temperature, ºC
Mas
s lo
ss ra
te, 1
/min
Figure 23. Typically dTG for biomass pyrolysis (finely divided CcNS, 10K/min)
Regarding the CcNS, the most important fact to consider is the size distribution that might have had a great influence on the pyrolysis patterns. Indeed, the second set of experimental runs performed with finely divided materials, showed other features about these samples, as it can be seen from the following figures.
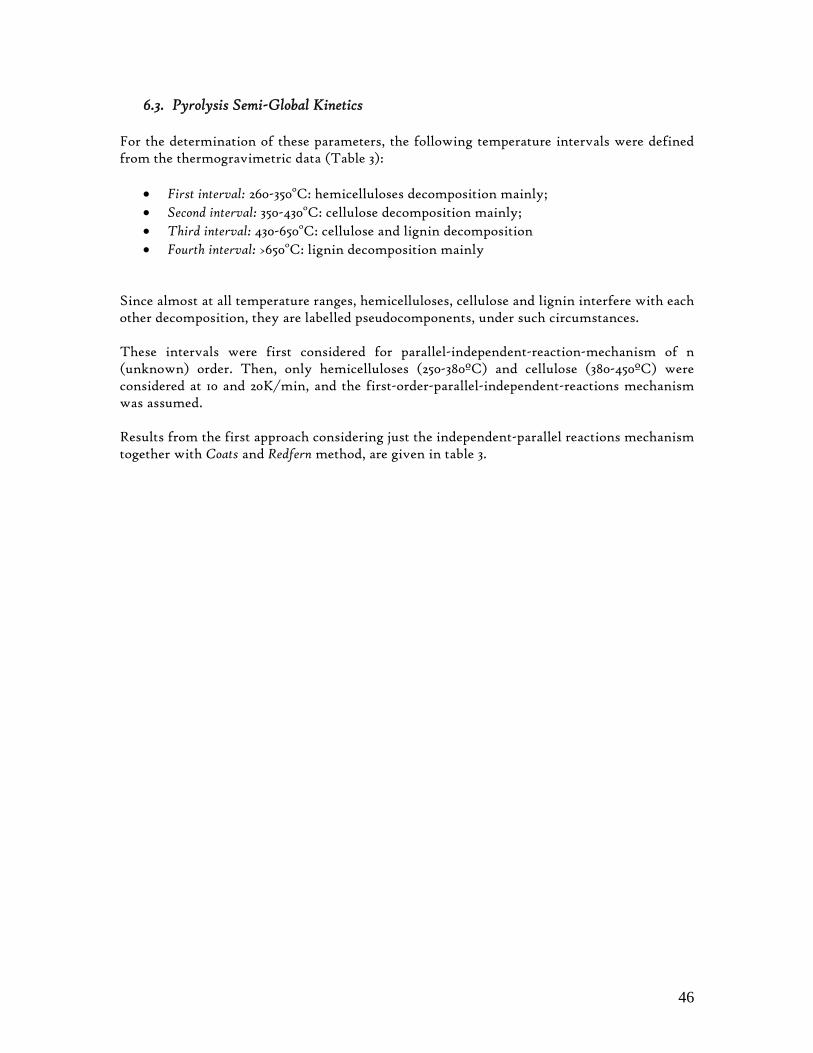
46
6.3. Pyrolysis Semi-Global Kinetics For the determination of these parameters, the following temperature intervals were defined from the thermogravimetric data (Table 3):
• First interval: 260-350oC: hemicelluloses decomposition mainly; • Second interval: 350-430oC: cellulose decomposition mainly; • Third interval: 430-650oC: cellulose and lignin decomposition • Fourth interval: >650oC: lignin decomposition mainly
Since almost at all temperature ranges, hemicelluloses, cellulose and lignin interfere with each other decomposition, they are labelled pseudocomponents, under such circumstances. These intervals were first considered for parallel-independent-reaction-mechanism of n (unknown) order. Then, only hemicelluloses (250-380ºC) and cellulose (380-450ºC) were considered at 10 and 20K/min, and the first-order-parallel-independent-reactions mechanism was assumed. Results from the first approach considering just the independent-parallel reactions mechanism together with Coats and Redfern method, are given in table 3.
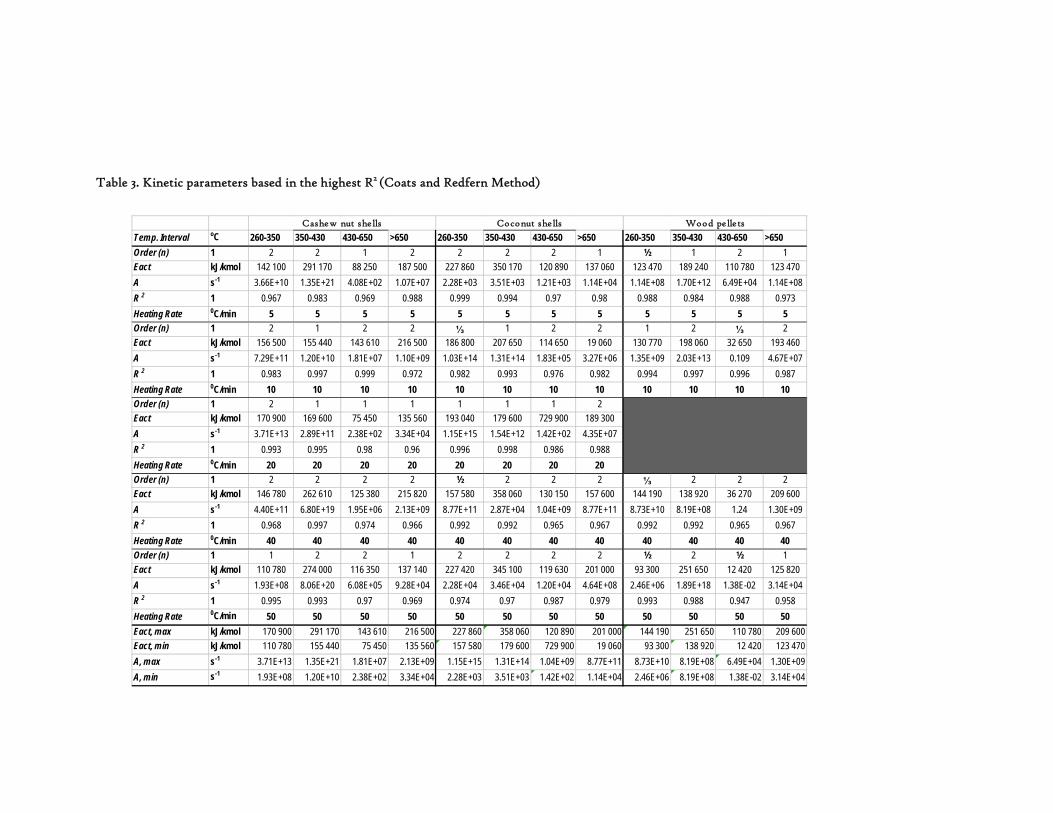
Table 3. Kinetic parameters based in the highest R2 (Coats and Redfern Method)
Temp. Interval oC 260-350 350-430 430-650 >650 260-350 350-430 430-650 >650 260-350 350-430 430-650 >650Order (n) 1 2 2 1 2 2 2 2 1 ½ 1 2 1Eact kJ/kmol 142 100 291 170 88 250 187 500 227 860 350 170 120 890 137 060 123 470 189 240 110 780 123 470A s-1 3.66E+10 1.35E+21 4.08E+02 1.07E+07 2.28E+03 3.51E+03 1.21E+03 1.14E+04 1.14E+08 1.70E+12 6.49E+04 1.14E+08R 2 1 0.967 0.983 0.969 0.988 0.999 0.994 0.97 0.98 0.988 0.984 0.988 0.973Heating Rate 0C/min 5 5 5 5 5 5 5 5 5 5 5 5Order (n) 1 2 1 2 2 ⅓ 1 2 2 1 2 ⅓ 2Eact kJ/kmol 156 500 155 440 143 610 216 500 186 800 207 650 114 650 19 060 130 770 198 060 32 650 193 460A s-1 7.29E+11 1.20E+10 1.81E+07 1.10E+09 1.03E+14 1.31E+14 1.83E+05 3.27E+06 1.35E+09 2.03E+13 0.109 4.67E+07R 2 1 0.983 0.997 0.999 0.972 0.982 0.993 0.976 0.982 0.994 0.997 0.996 0.987Heating Rate 0C/min 10 10 10 10 10 10 10 10 10 10 10 10Order (n) 1 2 1 1 1 1 1 1 2Eact kJ/kmol 170 900 169 600 75 450 135 560 193 040 179 600 729 900 189 300A s-1 3.71E+13 2.89E+11 2.38E+02 3.34E+04 1.15E+15 1.54E+12 1.42E+02 4.35E+07R 2 1 0.993 0.995 0.98 0.96 0.996 0.998 0.986 0.988Heating Rate 0C/min 20 20 20 20 20 20 20 20Order (n) 1 2 2 2 2 ½ 2 2 2 ⅓ 2 2 2Eact kJ/kmol 146 780 262 610 125 380 215 820 157 580 358 060 130 150 157 600 144 190 138 920 36 270 209 600A s-1 4.40E+11 6.80E+19 1.95E+06 2.13E+09 8.77E+11 2.87E+04 1.04E+09 8.77E+11 8.73E+10 8.19E+08 1.24 1.30E+09R 2 1 0.968 0.997 0.974 0.966 0.992 0.992 0.965 0.967 0.992 0.992 0.965 0.967Heating Rate 0C/min 40 40 40 40 40 40 40 40 40 40 40 40Order (n) 1 1 2 2 1 2 2 2 2 ½ 2 ½ 1Eact kJ/kmol 110 780 274 000 116 350 137 140 227 420 345 100 119 630 201 000 93 300 251 650 12 420 125 820A s-1 1.93E+08 8.06E+20 6.08E+05 9.28E+04 2.28E+04 3.46E+04 1.20E+04 4.64E+08 2.46E+06 1.89E+18 1.38E-02 3.14E+04R 2 1 0.995 0.993 0.97 0.969 0.974 0.97 0.987 0.979 0.993 0.988 0.947 0.958Heating Rate 0C/min 50 50 50 50 50 50 50 50 50 50 50 50Eact, max kJ/kmol 170 900 291 170 143 610 216 500 227 860 358 060 120 890 201 000 144 190 251 650 110 780 209 600Eact, min kJ/kmol 110 780 155 440 75 450 135 560 157 580 179 600 729 900 19 060 93 300 138 920 12 420 123 470A, max s-1 3.71E+13 1.35E+21 1.81E+07 2.13E+09 1.15E+15 1.31E+14 1.04E+09 8.77E+11 8.73E+10 8.19E+08 6.49E+04 1.30E+09A, min s-1 1.93E+08 1.20E+10 2.38E+02 3.34E+04 2.28E+03 3.51E+03 1.42E+02 1.14E+04 2.46E+06 8.19E+08 1.38E-02 3.14E+04
Coconut shells Wood pelletsCashew nut shells
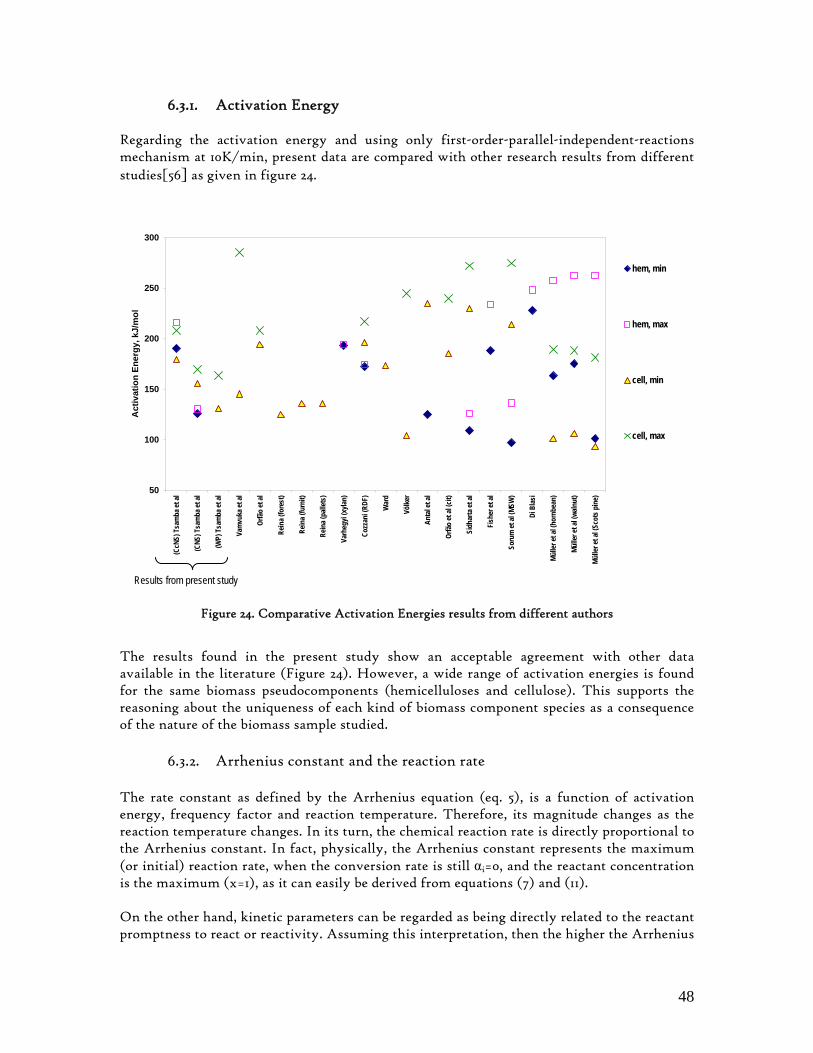
48
6.3.1. Activation Energy Regarding the activation energy and using only first-order-parallel-independent-reactions mechanism at 10K/min, present data are compared with other research results from different studies[56] as given in figure 24.
50
100
150
200
250
300
(CcN
S) T
sam
ba et
al
(CNS
) Tsa
mba
et al
(WP)
Tsa
mba
et al
Vam
vuka
et al
Orfã
o et
al
Rein
a (fo
rest
)
Rein
a (fu
rnit)
Rein
a (pa
llets
)
Varh
egyi
(xyla
n)
Cozz
ani (
RDF)
War
d
Völke
r
Anta
l et a
l
Orfã
o et
al (c
it)
Sidh
arta
et al
Fish
er et
al
Soru
m et
al (M
SW)
Di B
lasi
Mülle
r et a
l (ho
rnbe
an)
Mülle
r et a
l (wa
lnut
)
Mülle
r et a
l (Sc
ots p
ine)
Act
ivat
ion
Ener
gy, k
J/m
ol
hem, min
hem, max
cell, min
cell, max
Figure 24. Comparative Activation Energies results from different authors
The results found in the present study show an acceptable agreement with other data available in the literature (Figure 24). However, a wide range of activation energies is found for the same biomass pseudocomponents (hemicelluloses and cellulose). This supports the reasoning about the uniqueness of each kind of biomass component species as a consequence of the nature of the biomass sample studied.
6.3.2. Arrhenius constant and the reaction rate The rate constant as defined by the Arrhenius equation (eq. 5), is a function of activation energy, frequency factor and reaction temperature. Therefore, its magnitude changes as the reaction temperature changes. In its turn, the chemical reaction rate is directly proportional to the Arrhenius constant. In fact, physically, the Arrhenius constant represents the maximum (or initial) reaction rate, when the conversion rate is still αi=0, and the reactant concentration is the maximum (x=1), as it can easily be derived from equations (7) and (11). On the other hand, kinetic parameters can be regarded as being directly related to the reactant promptness to react or reactivity. Assuming this interpretation, then the higher the Arrhenius
Results from present study
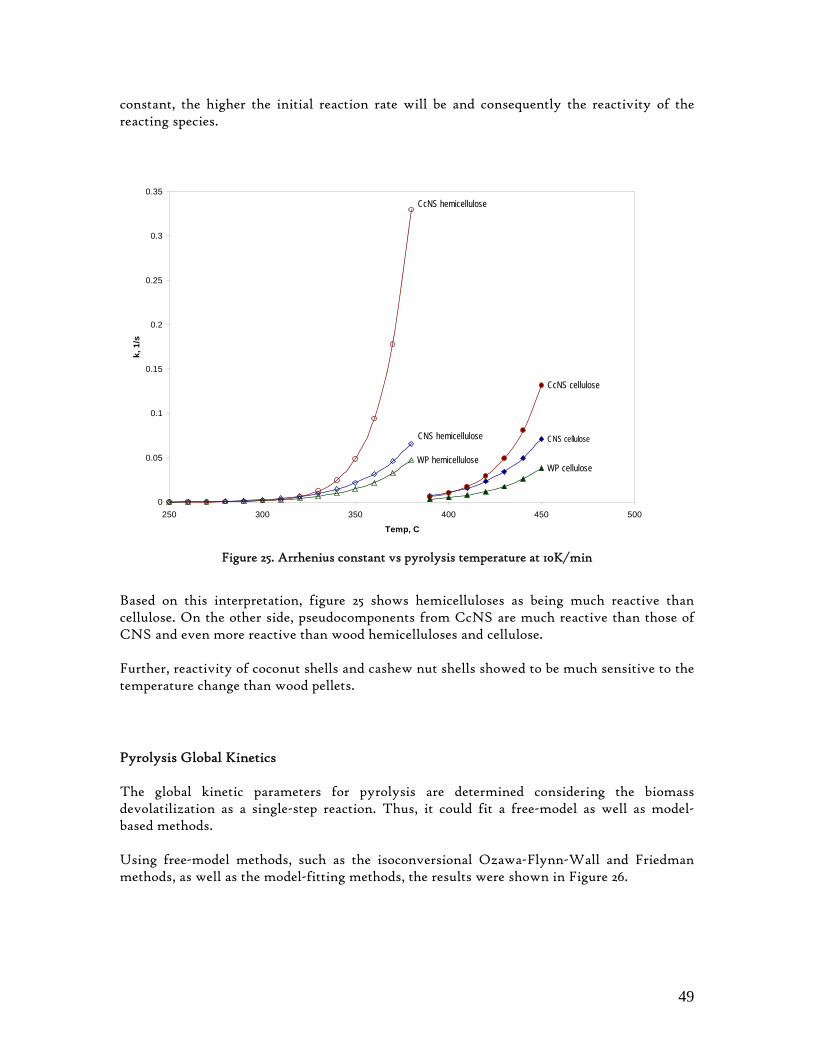
49
constant, the higher the initial reaction rate will be and consequently the reactivity of the reacting species.
CNS hemicellulose
CcNS hemicellulose
WP hemicellulose
CNS cellulose
CcNS cellulose
WP cellulose
0
0.05
0.1
0.15
0.2
0.25
0.3
0.35
250 300 350 400 450 500
Temp, C
k, 1
/s
Figure 25. Arrhenius constant vs pyrolysis temperature at 10K/min
Based on this interpretation, figure 25 shows hemicelluloses as being much reactive than cellulose. On the other side, pseudocomponents from CcNS are much reactive than those of CNS and even more reactive than wood hemicelluloses and cellulose. Further, reactivity of coconut shells and cashew nut shells showed to be much sensitive to the temperature change than wood pellets. Pyrolysis Global Kinetics The global kinetic parameters for pyrolysis are determined considering the biomass devolatilization as a single-step reaction. Thus, it could fit a free-model as well as model-based methods. Using free-model methods, such as the isoconversional Ozawa-Flynn-Wall and Friedman methods, as well as the model-fitting methods, the results were shown in Figure 26.
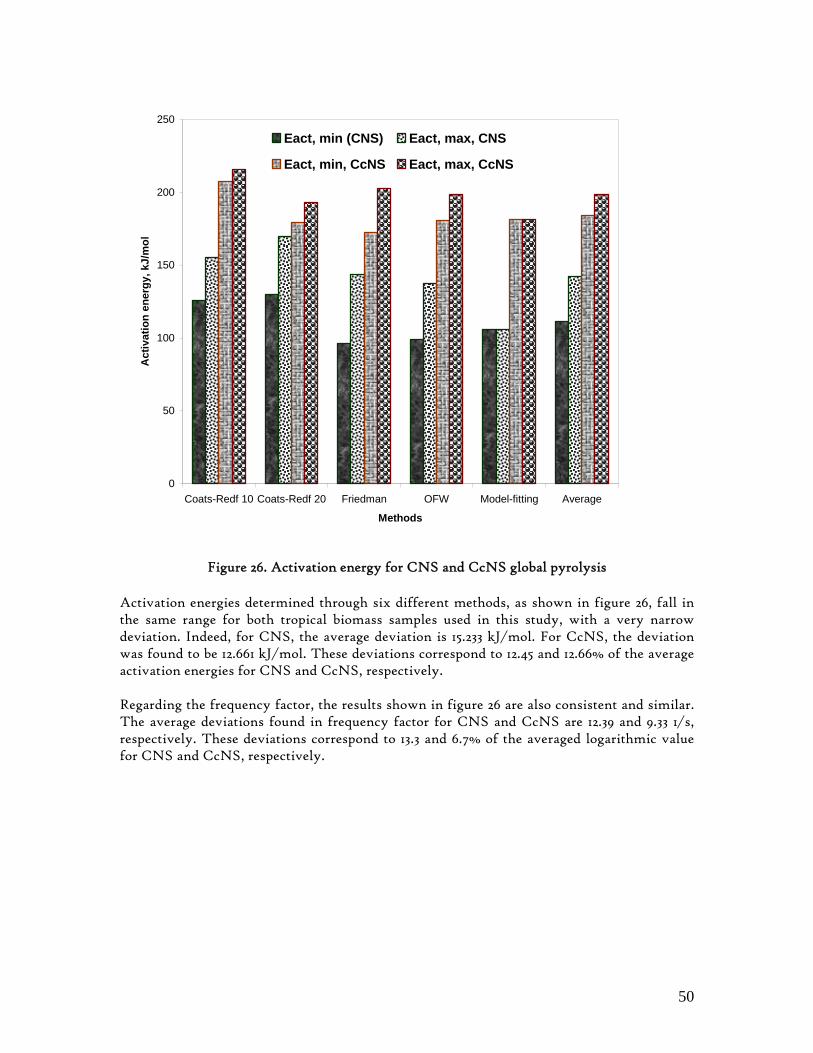
50
0
50
100
150
200
250
Coats-Redf 10 Coats-Redf 20 Friedman OFW Model-fitting Average
Methods
Act
ivat
ion
ener
gy, k
J/m
olEact, min (CNS) Eact, max, CNS
Eact, min, CcNS Eact, max, CcNS
Figure 26. Activation energy for CNS and CcNS global pyrolysis
Activation energies determined through six different methods, as shown in figure 26, fall in the same range for both tropical biomass samples used in this study, with a very narrow deviation. Indeed, for CNS, the average deviation is 15.233 kJ/mol. For CcNS, the deviation was found to be 12.661 kJ/mol. These deviations correspond to 12.45 and 12.66% of the average activation energies for CNS and CcNS, respectively. Regarding the frequency factor, the results shown in figure 26 are also consistent and similar. The average deviations found in frequency factor for CNS and CcNS are 12.39 and 9.33 1/s, respectively. These deviations correspond to 13.3 and 6.7% of the averaged logarithmic value for CNS and CcNS, respectively.
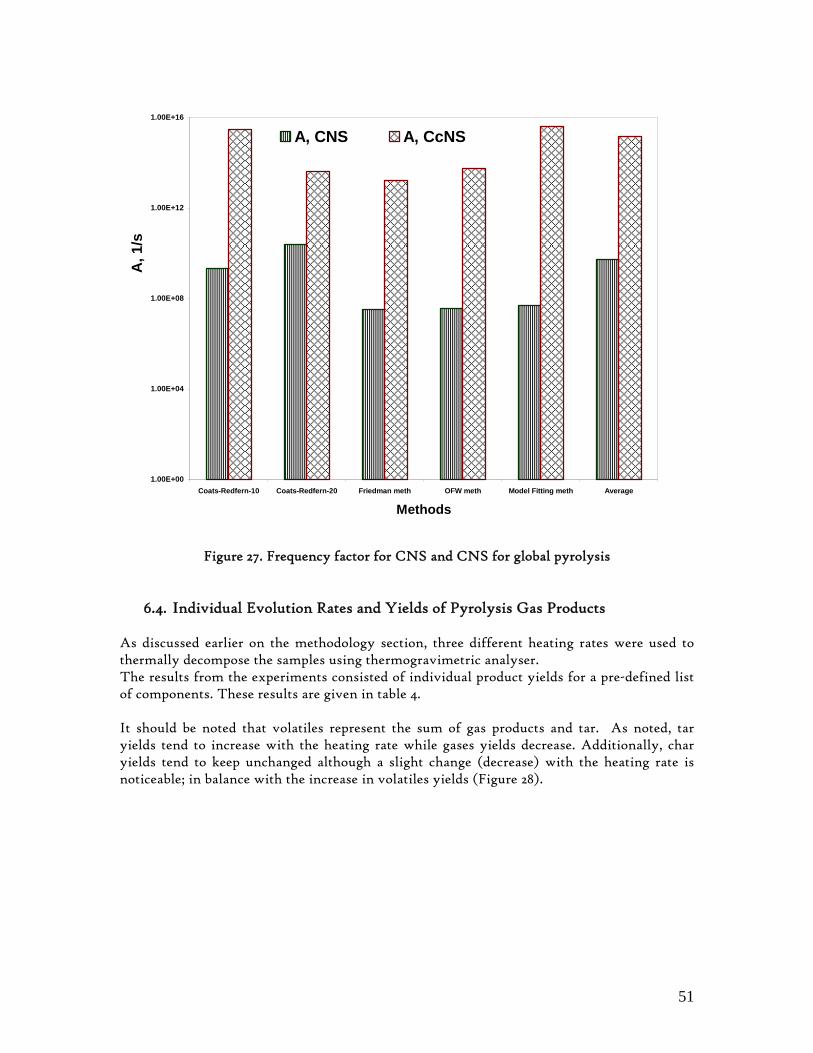
51
1.00E+00
1.00E+04
1.00E+08
1.00E+12
1.00E+16
Coats-Redfern-10 Coats-Redfern-20 Friedman meth OFW meth Model Fitting meth Average
Methods
A, 1
/sA, CNS A, CcNS
Figure 27. Frequency factor for CNS and CNS for global pyrolysis
6.4. Individual Evolution Rates and Yields of Pyrolysis Gas Products As discussed earlier on the methodology section, three different heating rates were used to thermally decompose the samples using thermogravimetric analyser. The results from the experiments consisted of individual product yields for a pre-defined list of components. These results are given in table 4. It should be noted that volatiles represent the sum of gas products and tar. As noted, tar yields tend to increase with the heating rate while gases yields decrease. Additionally, char yields tend to keep unchanged although a slight change (decrease) with the heating rate is noticeable; in balance with the increase in volatiles yields (Figure 28).
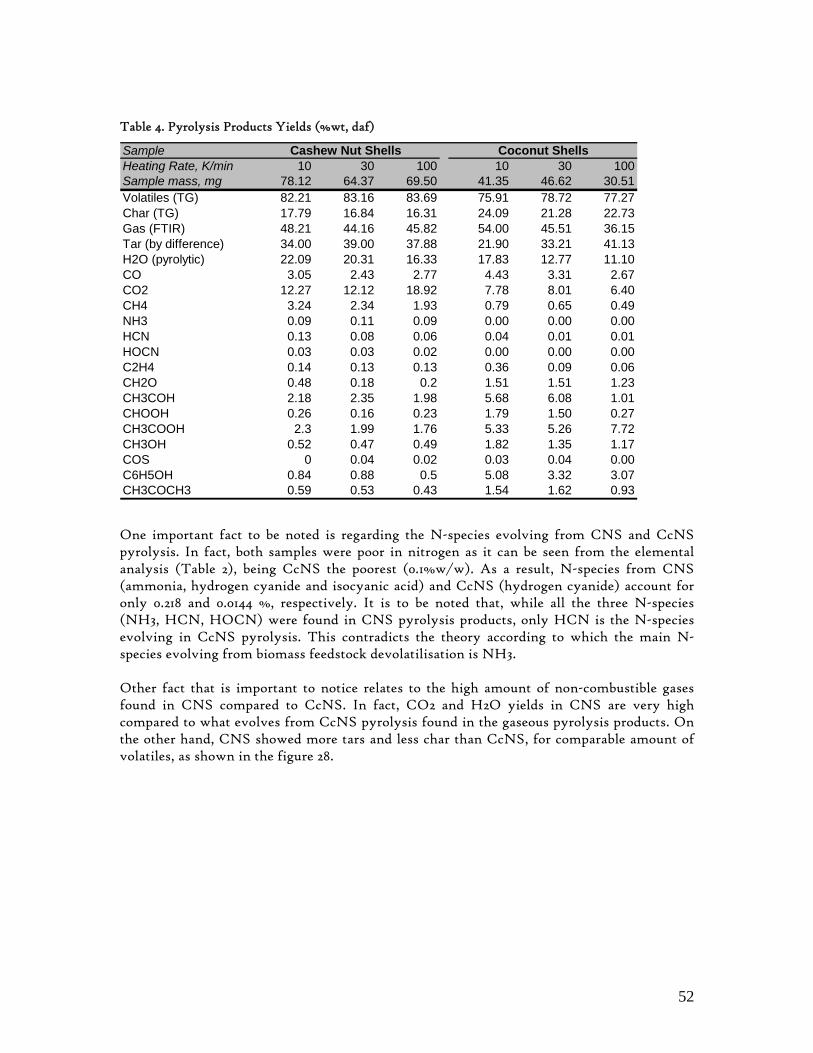
52
Table 4. Pyrolysis Products Yields (%wt, daf)
SampleHeating Rate, K/min 10 30 100 10 30 100Sample mass, mg 78.12 64.37 69.50 41.35 46.62 30.51Volatiles (TG) 82.21 83.16 83.69 75.91 78.72 77.27Char (TG) 17.79 16.84 16.31 24.09 21.28 22.73Gas (FTIR) 48.21 44.16 45.82 54.00 45.51 36.15Tar (by difference) 34.00 39.00 37.88 21.90 33.21 41.13H2O (pyrolytic) 22.09 20.31 16.33 17.83 12.77 11.10CO 3.05 2.43 2.77 4.43 3.31 2.67CO2 12.27 12.12 18.92 7.78 8.01 6.40CH4 3.24 2.34 1.93 0.79 0.65 0.49NH3 0.09 0.11 0.09 0.00 0.00 0.00HCN 0.13 0.08 0.06 0.04 0.01 0.01HOCN 0.03 0.03 0.02 0.00 0.00 0.00C2H4 0.14 0.13 0.13 0.36 0.09 0.06CH2O 0.48 0.18 0.2 1.51 1.51 1.23CH3COH 2.18 2.35 1.98 5.68 6.08 1.01CHOOH 0.26 0.16 0.23 1.79 1.50 0.27CH3COOH 2.3 1.99 1.76 5.33 5.26 7.72CH3OH 0.52 0.47 0.49 1.82 1.35 1.17COS 0 0.04 0.02 0.03 0.04 0.00C6H5OH 0.84 0.88 0.5 5.08 3.32 3.07CH3COCH3 0.59 0.53 0.43 1.54 1.62 0.93
Cashew Nut Shells Coconut Shells
One important fact to be noted is regarding the N-species evolving from CNS and CcNS pyrolysis. In fact, both samples were poor in nitrogen as it can be seen from the elemental analysis (Table 2), being CcNS the poorest (0.1%w/w). As a result, N-species from CNS (ammonia, hydrogen cyanide and isocyanic acid) and CcNS (hydrogen cyanide) account for only 0.218 and 0.0144 %, respectively. It is to be noted that, while all the three N-species (NH3, HCN, HOCN) were found in CNS pyrolysis products, only HCN is the N-species evolving in CcNS pyrolysis. This contradicts the theory according to which the main N-species evolving from biomass feedstock devolatilisation is NH3. Other fact that is important to notice relates to the high amount of non-combustible gases found in CNS compared to CcNS. In fact, CO2 and H2O yields in CNS are very high compared to what evolves from CcNS pyrolysis found in the gaseous pyrolysis products. On the other hand, CNS showed more tars and less char than CcNS, for comparable amount of volatiles, as shown in the figure 28.
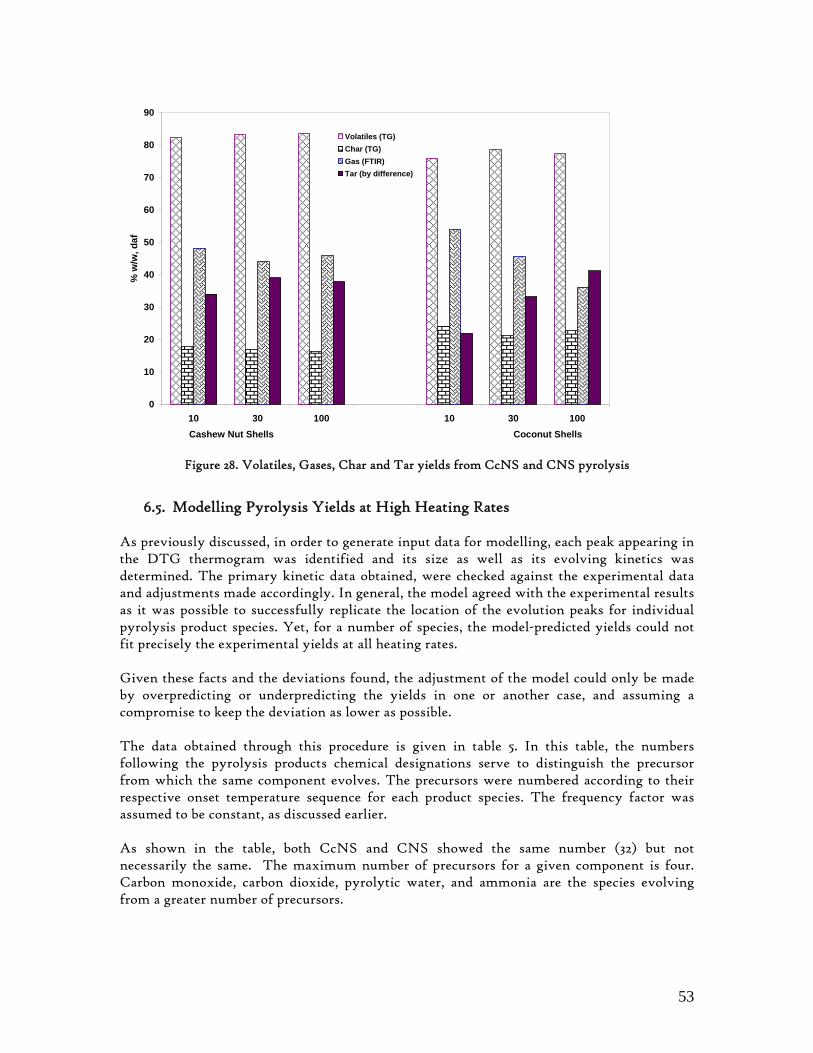
53
0
10
20
30
40
50
60
70
80
90
10 30 100 10 30 100Cashew Nut Shells Coconut Shells
% w
/w, d
afVolatiles (TG)Char (TG)Gas (FTIR)Tar (by difference)
Figure 28. Volatiles, Gases, Char and Tar yields from CcNS and CNS pyrolysis
6.5. Modelling Pyrolysis Yields at High Heating Rates
As previously discussed, in order to generate input data for modelling, each peak appearing in the DTG thermogram was identified and its size as well as its evolving kinetics was determined. The primary kinetic data obtained, were checked against the experimental data and adjustments made accordingly. In general, the model agreed with the experimental results as it was possible to successfully replicate the location of the evolution peaks for individual pyrolysis product species. Yet, for a number of species, the model-predicted yields could not fit precisely the experimental yields at all heating rates. Given these facts and the deviations found, the adjustment of the model could only be made by overpredicting or underpredicting the yields in one or another case, and assuming a compromise to keep the deviation as lower as possible.
The data obtained through this procedure is given in table 5. In this table, the numbers following the pyrolysis products chemical designations serve to distinguish the precursor from which the same component evolves. The precursors were numbered according to their respective onset temperature sequence for each product species. The frequency factor was assumed to be constant, as discussed earlier. As shown in the table, both CcNS and CNS showed the same number (32) but not necessarily the same. The maximum number of precursors for a given component is four. Carbon monoxide, carbon dioxide, pyrolytic water, and ammonia are the species evolving from a greater number of precursors.
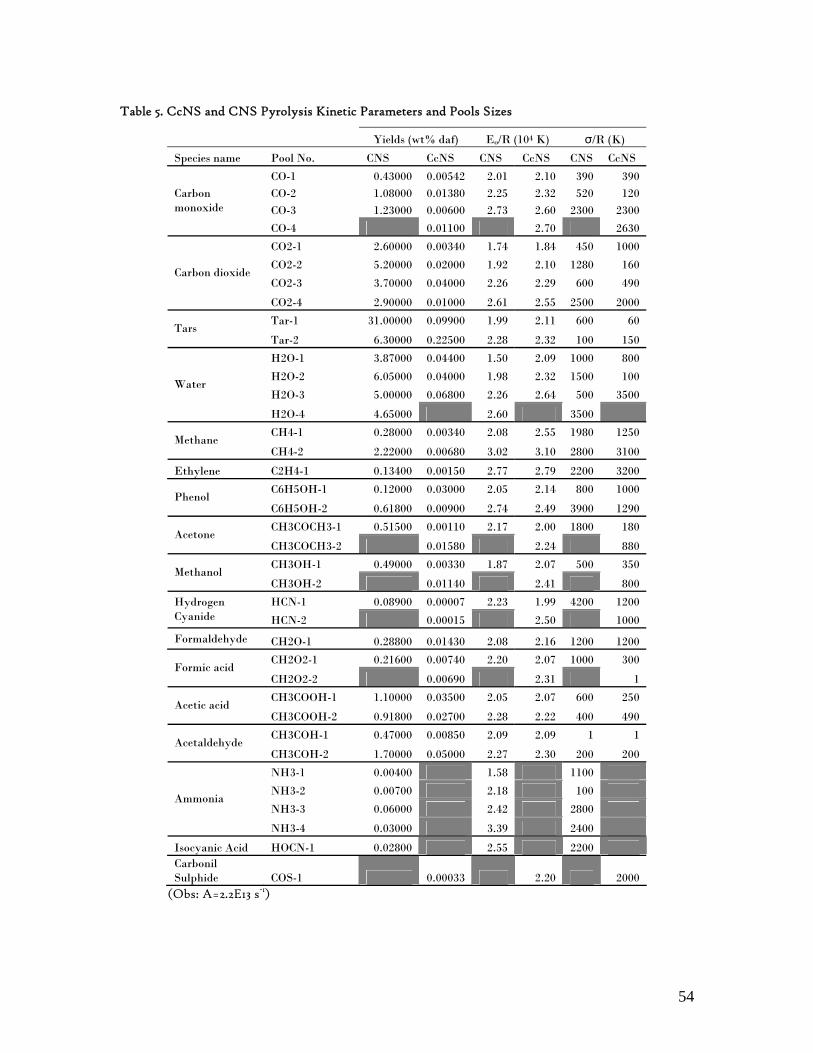
54
Table 5. CcNS and CNS Pyrolysis Kinetic Parameters and Pools Sizes
Yields (wt% daf) Eo/R (104 K) σ/R (K)
Species name Pool No. CNS CcNS CNS CcNS CNS CcNS
CO-1 0.43000 0.00542 2.01 2.10 390 390 CO-2 1.08000 0.01380 2.25 2.32 520 120 CO-3 1.23000 0.00600 2.73 2.60 2300 2300
Carbon monoxide
CO-4 0.01100 2.70 2630
CO2-1 2.60000 0.00340 1.74 1.84 450 1000
CO2-2 5.20000 0.02000 1.92 2.10 1280 160
CO2-3 3.70000 0.04000 2.26 2.29 600 490 Carbon dioxide
CO2-4 2.90000 0.01000 2.61 2.55 2500 2000
Tar-1 31.00000 0.09900 1.99 2.11 600 60 Tars
Tar-2 6.30000 0.22500 2.28 2.32 100 150
H2O-1 3.87000 0.04400 1.50 2.09 1000 800
H2O-2 6.05000 0.04000 1.98 2.32 1500 100
H2O-3 5.00000 0.06800 2.26 2.64 500 3500 Water
H2O-4 4.65000 2.60 3500
CH4-1 0.28000 0.00340 2.08 2.55 1980 1250 Methane
CH4-2 2.22000 0.00680 3.02 3.10 2800 3100
Ethylene C2H4-1 0.13400 0.00150 2.77 2.79 2200 3200
C6H5OH-1 0.12000 0.03000 2.05 2.14 800 1000 Phenol
C6H5OH-2 0.61800 0.00900 2.74 2.49 3900 1290
CH3COCH3-1 0.51500 0.00110 2.17 2.00 1800 180 Acetone
CH3COCH3-2 0.01580 2.24 880
CH3OH-1 0.49000 0.00330 1.87 2.07 500 350 Methanol
CH3OH-2 0.01140 2.41 800
HCN-1 0.08900 0.00007 2.23 1.99 4200 1200 Hydrogen Cyanide HCN-2 0.00015 2.50 1000
Formaldehyde CH2O-1 0.28800 0.01430 2.08 2.16 1200 1200
CH2O2-1 0.21600 0.00740 2.20 2.07 1000 300 Formic acid
CH2O2-2 0.00690 2.31 1
CH3COOH-1 1.10000 0.03500 2.05 2.07 600 250 Acetic acid
CH3COOH-2 0.91800 0.02700 2.28 2.22 400 490
CH3COH-1 0.47000 0.00850 2.09 2.09 1 1 Acetaldehyde
CH3COH-2 1.70000 0.05000 2.27 2.30 200 200
NH3-1 0.00400 1.58 1100
NH3-2 0.00700 2.18 100
NH3-3 0.06000 2.42 2800 Ammonia
NH3-4 0.03000 3.39 2400
Isocyanic Acid HOCN-1 0.02800 2.55 2200 Carbonil Sulphide COS-1 0.00033 2.20 2000
(Obs: A=2.2E13 s-1)
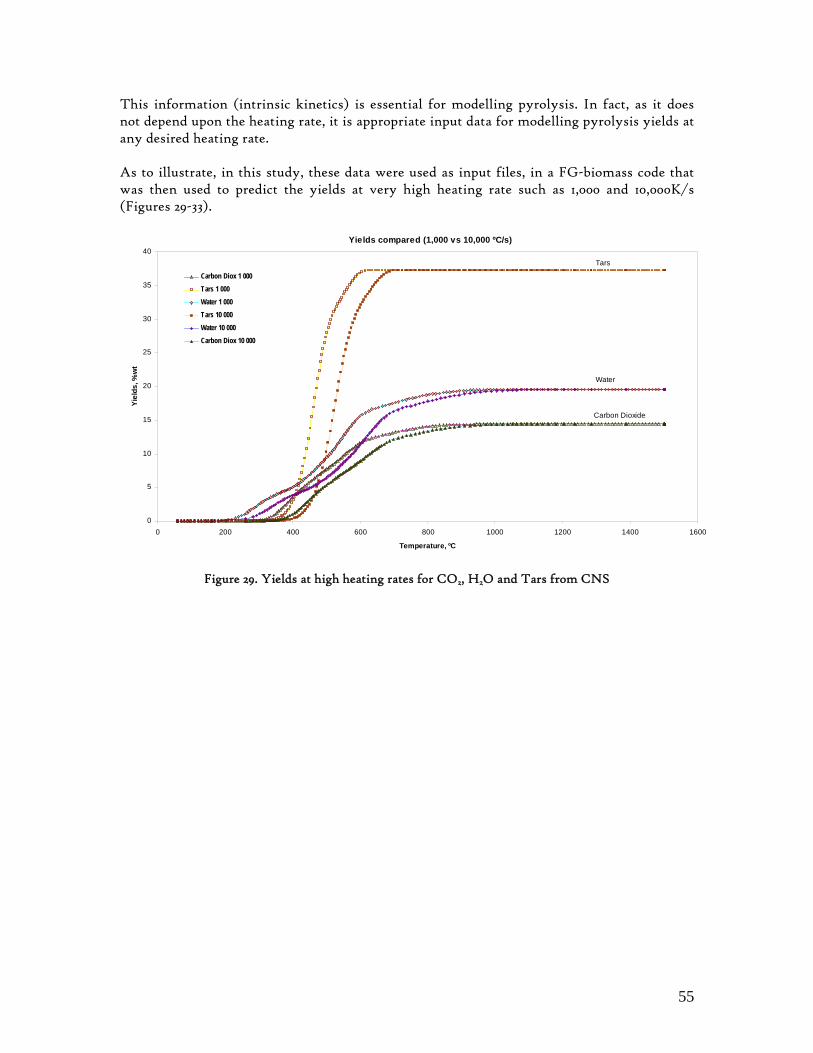
55
This information (intrinsic kinetics) is essential for modelling pyrolysis. In fact, as it does not depend upon the heating rate, it is appropriate input data for modelling pyrolysis yields at any desired heating rate. As to illustrate, in this study, these data were used as input files, in a FG-biomass code that was then used to predict the yields at very high heating rate such as 1,000 and 10,000K/s (Figures 29-33).
Yields compared (1,000 vs 10,000 ºC/s)
Carbon Dioxide
Tars
Water
0
5
10
15
20
25
30
35
40
0 200 400 600 800 1000 1200 1400 1600
Temperature, ºC
Yiel
ds, %
wt
Carbon Diox 1 000Tars 1 000Water 1 000Tars 10 000Water 10 000Carbon Diox 10 000
Figure 29. Yields at high heating rates for CO2, H2O and Tars from CNS
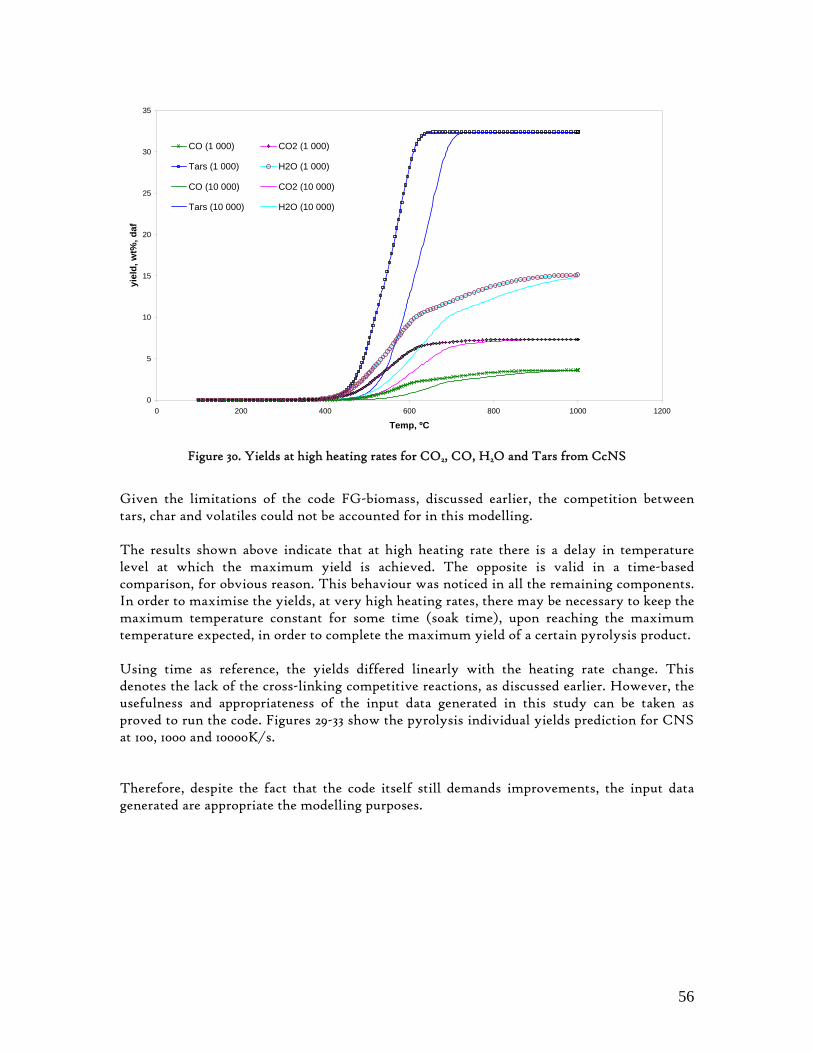
56
0
5
10
15
20
25
30
35
0 200 400 600 800 1000 1200
Temp, ºC
yiel
d, w
t%, d
afCO (1 000) CO2 (1 000)
Tars (1 000) H2O (1 000)
CO (10 000) CO2 (10 000)
Tars (10 000) H2O (10 000)
Figure 30. Yields at high heating rates for CO2, CO, H2O and Tars from CcNS
Given the limitations of the code FG-biomass, discussed earlier, the competition between tars, char and volatiles could not be accounted for in this modelling. The results shown above indicate that at high heating rate there is a delay in temperature level at which the maximum yield is achieved. The opposite is valid in a time-based comparison, for obvious reason. This behaviour was noticed in all the remaining components. In order to maximise the yields, at very high heating rates, there may be necessary to keep the maximum temperature constant for some time (soak time), upon reaching the maximum temperature expected, in order to complete the maximum yield of a certain pyrolysis product. Using time as reference, the yields differed linearly with the heating rate change. This denotes the lack of the cross-linking competitive reactions, as discussed earlier. However, the usefulness and appropriateness of the input data generated in this study can be taken as proved to run the code. Figures 29-33 show the pyrolysis individual yields prediction for CNS at 100, 1000 and 10000K/s. Therefore, despite the fact that the code itself still demands improvements, the input data generated are appropriate the modelling purposes.
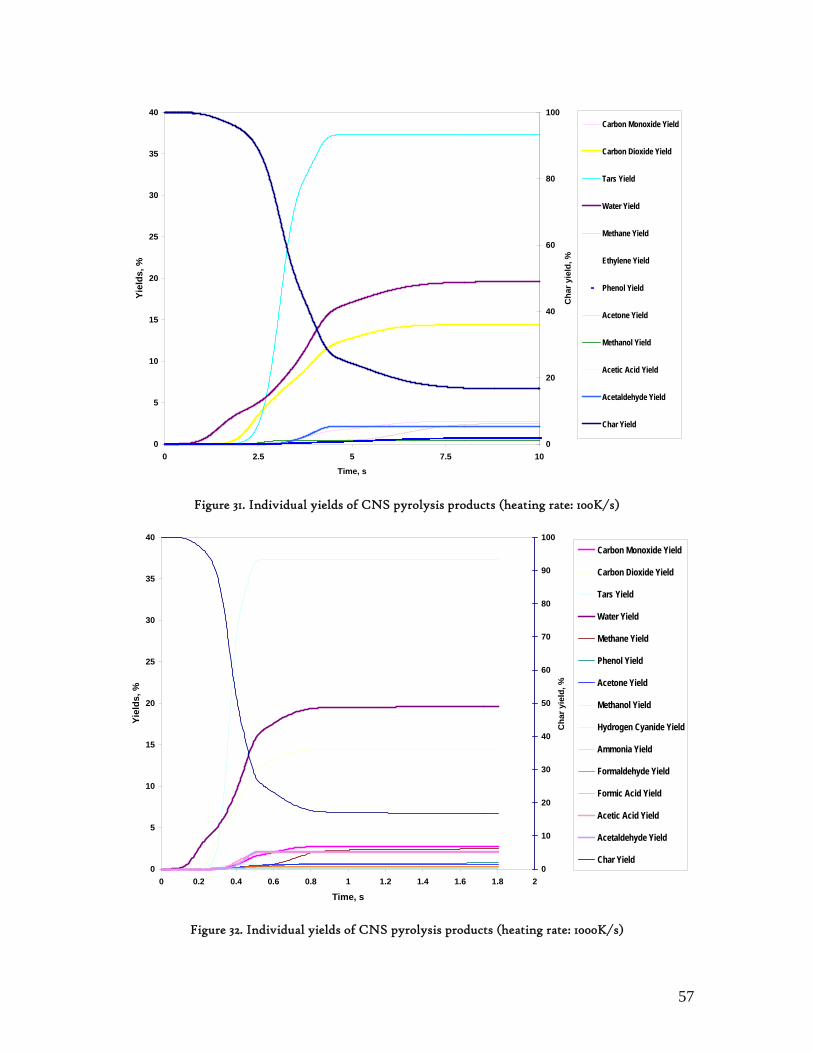
57
0
5
10
15
20
25
30
35
40
0 2.5 5 7.5 10
Time, s
Yiel
ds, %
0
20
40
60
80
100
Cha
r yie
ld, %
Carbon Monoxide Yield
Carbon Dioxide Yield
Tars Yield
Water Yield
Methane Yield
Ethylene Yield
Phenol Yield
Acetone Yield
Methanol Yield
Acetic Acid Yield
Acetaldehyde Yield
Char Yield
Figure 31. Individual yields of CNS pyrolysis products (heating rate: 100K/s)
0
5
10
15
20
25
30
35
40
0 0.2 0.4 0.6 0.8 1 1.2 1.4 1.6 1.8 2
Time, s
Yiel
ds, %
0
10
20
30
40
50
60
70
80
90
100
Cha
r yie
ld, %
Carbon Monoxide Yield
Carbon Dioxide Yield
Tars Yield
Water Yield
Methane Yield
Phenol Yield
Acetone Yield
Methanol Yield
Hydrogen Cyanide Yield
Ammonia Yield
Formaldehyde Yield
Formic Acid Yield
Acetic Acid Yield
Acetaldehyde Yield
Char Yield
Figure 32. Individual yields of CNS pyrolysis products (heating rate: 1000K/s)
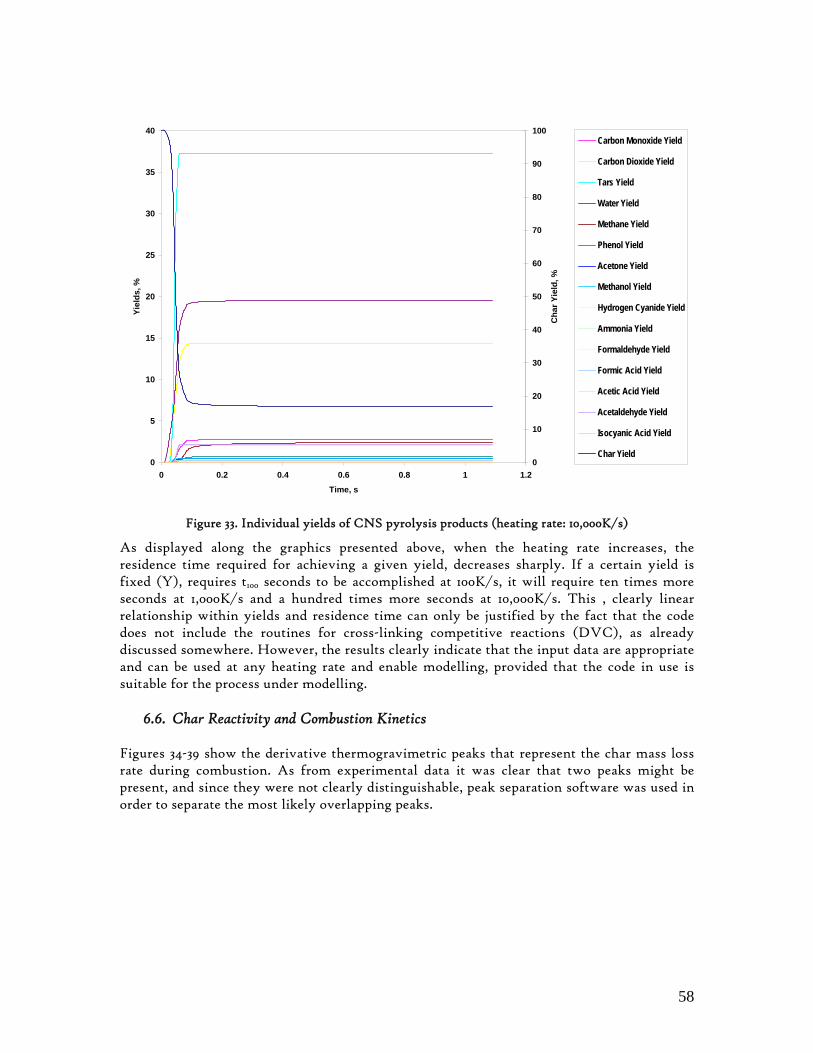
58
0
5
10
15
20
25
30
35
40
0 0.2 0.4 0.6 0.8 1 1.2
Time, s
Yiel
ds, %
0
10
20
30
40
50
60
70
80
90
100
Cha
r Yie
ld, %
Carbon Monoxide Yield
Carbon Dioxide Yield
Tars Yield
Water Yield
Methane Yield
Phenol Yield
Acetone Yield
Methanol Yield
Hydrogen Cyanide Yield
Ammonia Yield
Formaldehyde Yield
Formic Acid Yield
Acetic Acid Yield
Acetaldehyde Yield
Isocyanic Acid Yield
Char Yield
Figure 33. Individual yields of CNS pyrolysis products (heating rate: 10,000K/s)
As displayed along the graphics presented above, when the heating rate increases, the residence time required for achieving a given yield, decreases sharply. If a certain yield is fixed (Y), requires t100 seconds to be accomplished at 100K/s, it will require ten times more seconds at 1,000K/s and a hundred times more seconds at 10,000K/s. This , clearly linear relationship within yields and residence time can only be justified by the fact that the code does not include the routines for cross-linking competitive reactions (DVC), as already discussed somewhere. However, the results clearly indicate that the input data are appropriate and can be used at any heating rate and enable modelling, provided that the code in use is suitable for the process under modelling.
6.6. Char Reactivity and Combustion Kinetics Figures 34-39 show the derivative thermogravimetric peaks that represent the char mass loss rate during combustion. As from experimental data it was clear that two peaks might be present, and since they were not clearly distinguishable, peak separation software was used in order to separate the most likely overlapping peaks.
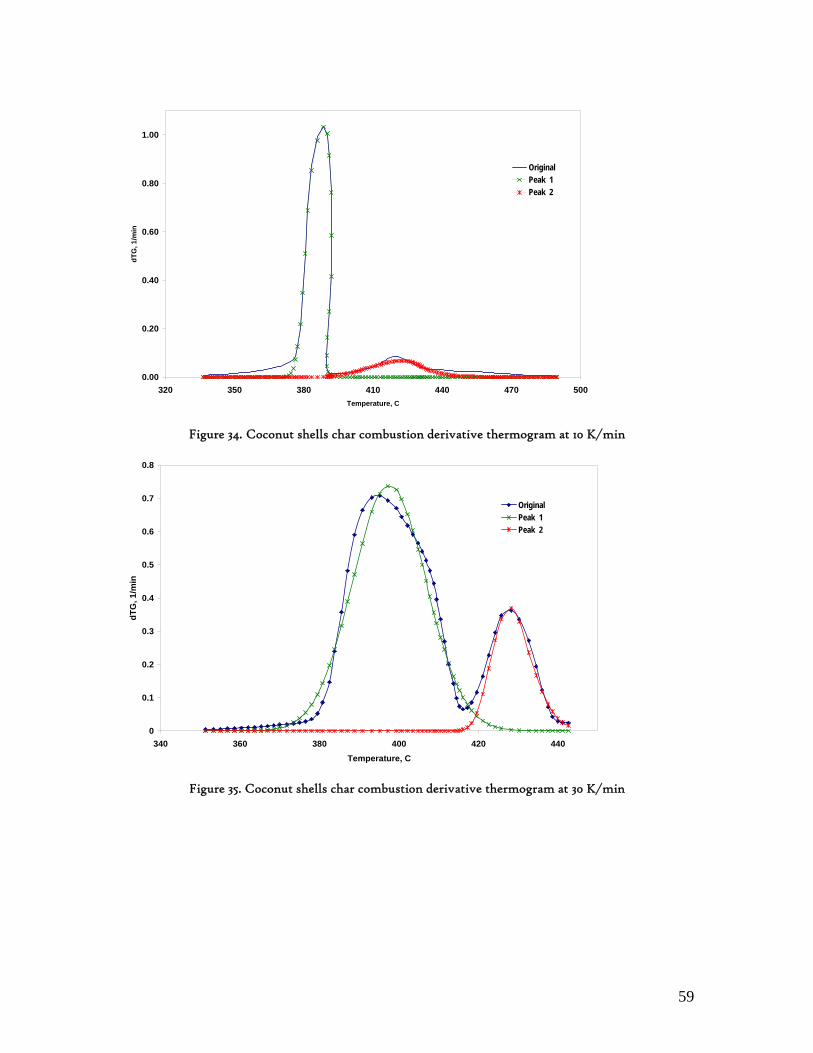
59
0.00
0.20
0.40
0.60
0.80
1.00
320 350 380 410 440 470 500Temperature, C
dTG
, 1/m
in
OriginalPeak 1Peak 2
Figure 34. Coconut shells char combustion derivative thermogram at 10 K/min
0
0.1
0.2
0.3
0.4
0.5
0.6
0.7
0.8
340 360 380 400 420 440Temperature, C
dTG
, 1/m
in
OriginalPeak 1Peak 2
Figure 35. Coconut shells char combustion derivative thermogram at 30 K/min
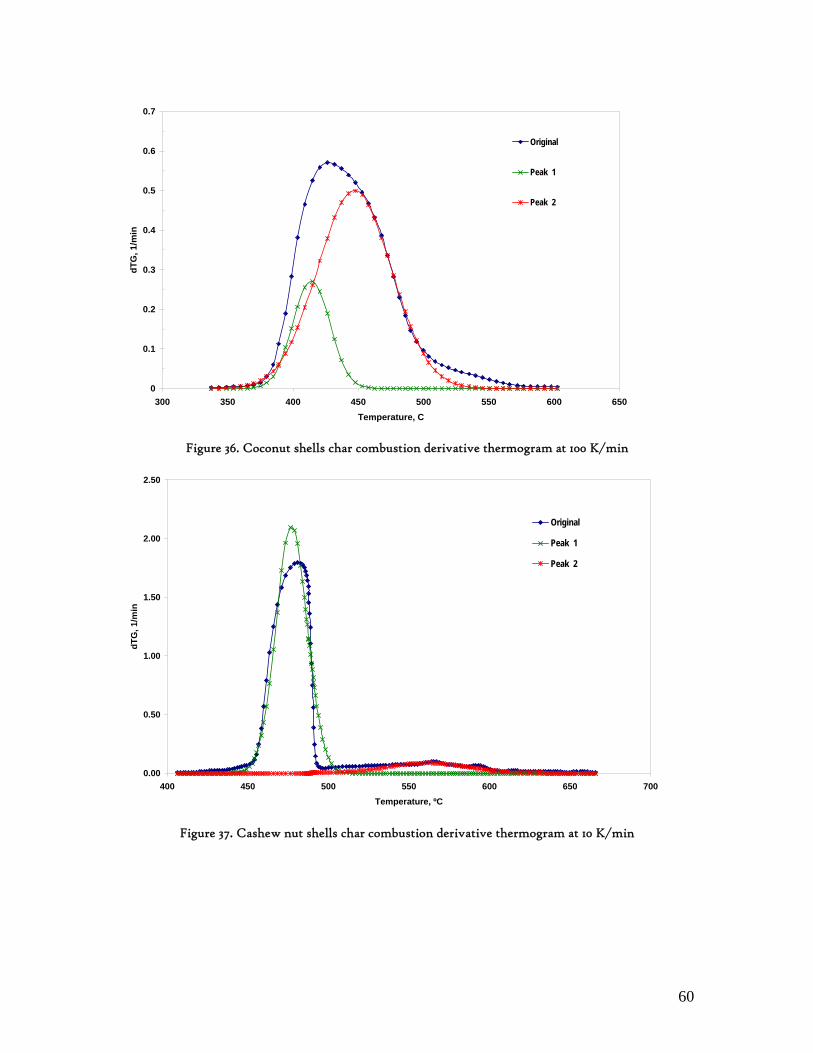
60
0
0.1
0.2
0.3
0.4
0.5
0.6
0.7
300 350 400 450 500 550 600 650Temperature, C
dTG
, 1/m
inOriginal
Peak 1
Peak 2
Figure 36. Coconut shells char combustion derivative thermogram at 100 K/min
0.00
0.50
1.00
1.50
2.00
2.50
400 450 500 550 600 650 700Temperature, ºC
dTG
, 1/m
in
Original
Peak 1
Peak 2
Figure 37. Cashew nut shells char combustion derivative thermogram at 10 K/min
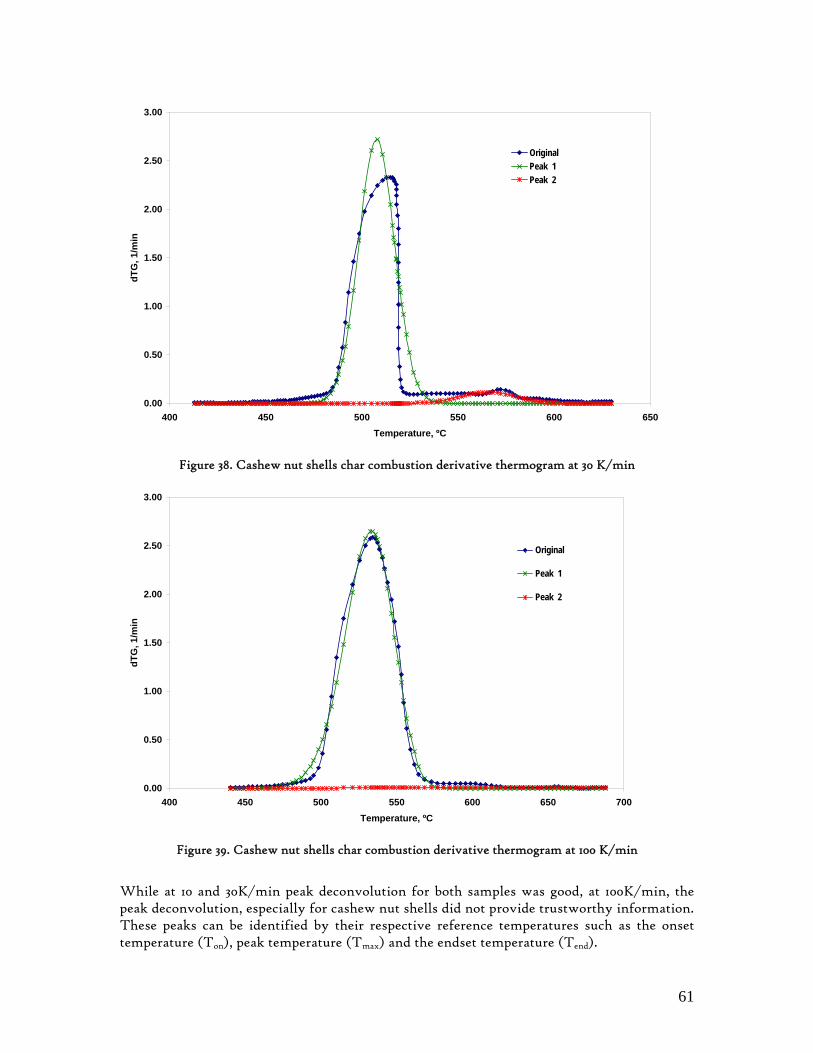
61
0.00
0.50
1.00
1.50
2.00
2.50
3.00
400 450 500 550 600 650Temperature, ºC
dTG
, 1/m
in
OriginalPeak 1Peak 2
Figure 38. Cashew nut shells char combustion derivative thermogram at 30 K/min
0.00
0.50
1.00
1.50
2.00
2.50
3.00
400 450 500 550 600 650 700Temperature, ºC
dTG
, 1/m
in
Original
Peak 1
Peak 2
Figure 39. Cashew nut shells char combustion derivative thermogram at 100 K/min
While at 10 and 30K/min peak deconvolution for both samples was good, at 100K/min, the peak deconvolution, especially for cashew nut shells did not provide trustworthy information. These peaks can be identified by their respective reference temperatures such as the onset temperature (Ton), peak temperature (Tmax) and the endset temperature (Tend).
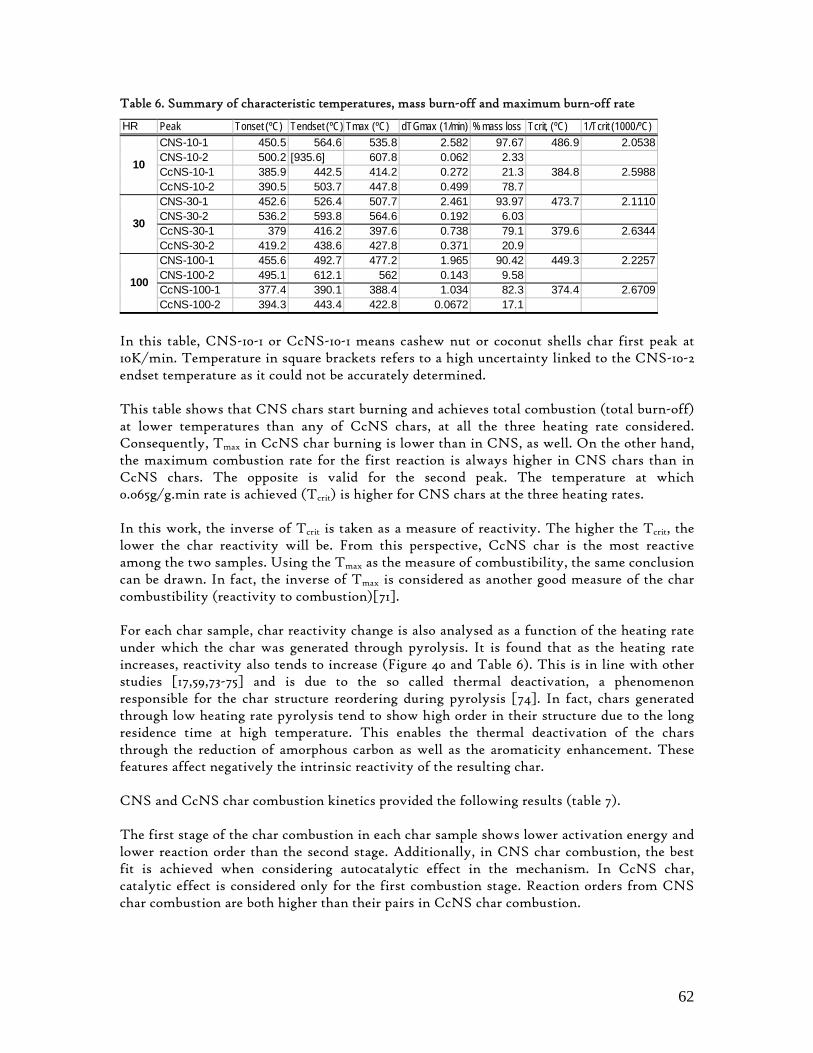
62
Table 6. Summary of characteristic temperatures, mass burn-off and maximum burn-off rate
HR Peak Tonset (ºC) Tendset (ºC) Tmax (ºC) dTGmax (1/min) %mass loss Tcrit, (ºC) 1/Tcrit (1000/ºC)CNS-10-1 450.5 564.6 535.8 2.582 97.67 486.9 2.0538CNS-10-2 500.2 [935.6] 607.8 0.062 2.33CcNS-10-1 385.9 442.5 414.2 0.272 21.3 384.8 2.5988CcNS-10-2 390.5 503.7 447.8 0.499 78.7CNS-30-1 452.6 526.4 507.7 2.461 93.97 473.7 2.1110CNS-30-2 536.2 593.8 564.6 0.192 6.03CcNS-30-1 379 416.2 397.6 0.738 79.1 379.6 2.6344CcNS-30-2 419.2 438.6 427.8 0.371 20.9CNS-100-1 455.6 492.7 477.2 1.965 90.42 449.3 2.2257CNS-100-2 495.1 612.1 562 0.143 9.58CcNS-100-1 377.4 390.1 388.4 1.034 82.3 374.4 2.6709CcNS-100-2 394.3 443.4 422.8 0.0672 17.1
10
30
100
In this table, CNS-10-1 or CcNS-10-1 means cashew nut or coconut shells char first peak at 10K/min. Temperature in square brackets refers to a high uncertainty linked to the CNS-10-2 endset temperature as it could not be accurately determined. This table shows that CNS chars start burning and achieves total combustion (total burn-off) at lower temperatures than any of CcNS chars, at all the three heating rate considered. Consequently, Tmax in CcNS char burning is lower than in CNS, as well. On the other hand, the maximum combustion rate for the first reaction is always higher in CNS chars than in CcNS chars. The opposite is valid for the second peak. The temperature at which 0.065g/g.min rate is achieved (Tcrit) is higher for CNS chars at the three heating rates. In this work, the inverse of Tcrit is taken as a measure of reactivity. The higher the Tcrit, the lower the char reactivity will be. From this perspective, CcNS char is the most reactive among the two samples. Using the Tmax as the measure of combustibility, the same conclusion can be drawn. In fact, the inverse of Tmax is considered as another good measure of the char combustibility (reactivity to combustion)[71]. For each char sample, char reactivity change is also analysed as a function of the heating rate under which the char was generated through pyrolysis. It is found that as the heating rate increases, reactivity also tends to increase (Figure 40 and Table 6). This is in line with other studies [17,59,73-75] and is due to the so called thermal deactivation, a phenomenon responsible for the char structure reordering during pyrolysis [74]. In fact, chars generated through low heating rate pyrolysis tend to show high order in their structure due to the long residence time at high temperature. This enables the thermal deactivation of the chars through the reduction of amorphous carbon as well as the aromaticity enhancement. These features affect negatively the intrinsic reactivity of the resulting char. CNS and CcNS char combustion kinetics provided the following results (table 7). The first stage of the char combustion in each char sample shows lower activation energy and lower reaction order than the second stage. Additionally, in CNS char combustion, the best fit is achieved when considering autocatalytic effect in the mechanism. In CcNS char, catalytic effect is considered only for the first combustion stage. Reaction orders from CNS char combustion are both higher than their pairs in CcNS char combustion.
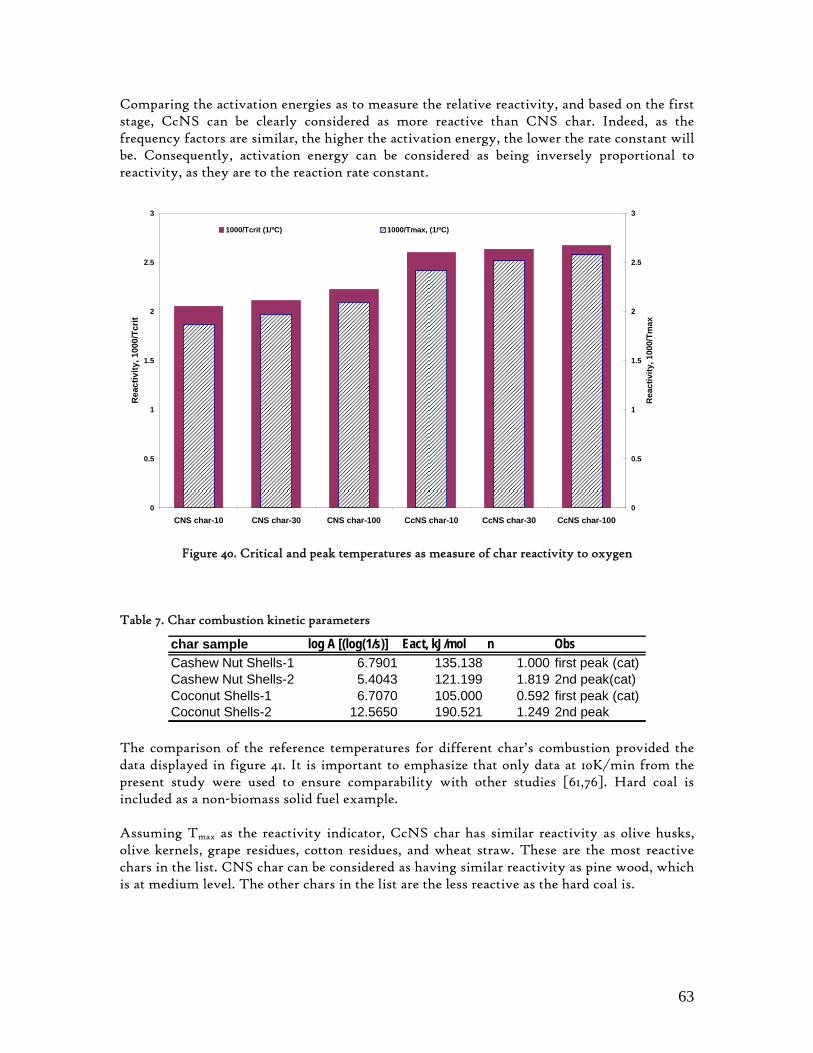
63
Comparing the activation energies as to measure the relative reactivity, and based on the first stage, CcNS can be clearly considered as more reactive than CNS char. Indeed, as the frequency factors are similar, the higher the activation energy, the lower the rate constant will be. Consequently, activation energy can be considered as being inversely proportional to reactivity, as they are to the reaction rate constant.
0
0.5
1
1.5
2
2.5
3
CNS char-10 CNS char-30 CNS char-100 CcNS char-10 CcNS char-30 CcNS char-100
Rea
ctiv
ity, 1
000/
Tcrit
0
0.5
1
1.5
2
2.5
3
Rea
ctiv
ity, 1
000/
Tmax
1000/Tcrit (1/ºC) 1000/Tmax, (1/ºC)
Figure 40. Critical and peak temperatures as measure of char reactivity to oxygen
Table 7. Char combustion kinetic parameters
char sample log A [(log(1/s)] Eact, kJ/mol n ObsCashew Nut Shells-1 6.7901 135.138 1.000 first peak (cat)Cashew Nut Shells-2 5.4043 121.199 1.819 2nd peak(cat)Coconut Shells-1 6.7070 105.000 0.592 first peak (cat)Coconut Shells-2 12.5650 190.521 1.249 2nd peak
The comparison of the reference temperatures for different char’s combustion provided the data displayed in figure 41. It is important to emphasize that only data at 10K/min from the present study were used to ensure comparability with other studies [61,76]. Hard coal is included as a non-biomass solid fuel example. Assuming Tmax as the reactivity indicator, CcNS char has similar reactivity as olive husks, olive kernels, grape residues, cotton residues, and wheat straw. These are the most reactive chars in the list. CNS char can be considered as having similar reactivity as pine wood, which is at medium level. The other chars in the list are the less reactive as the hard coal is.
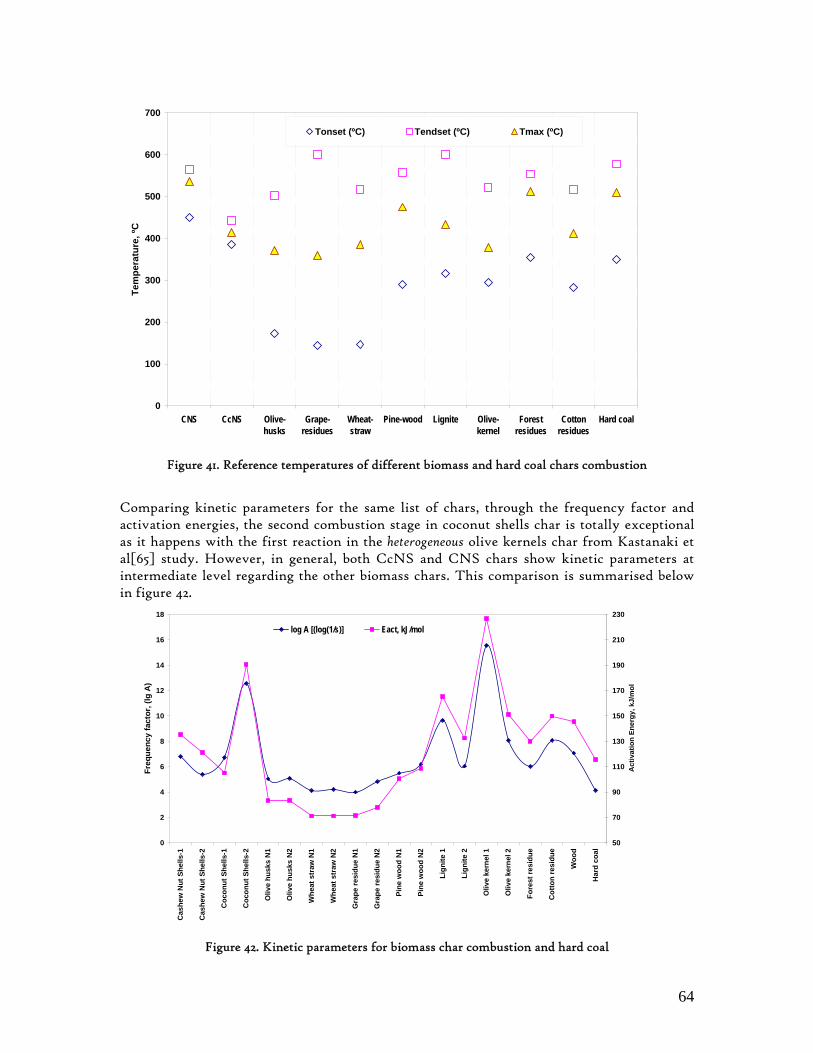
64
0
100
200
300
400
500
600
700
CNS CcNS Olive-husks
Grape-residues
Wheat-straw
Pine-wood Lignite Olive-kernel
Forestresidues
Cottonresidues
Hard coal
Tem
pera
ture
, ºC
Tonset (ºC) Tendset (ºC) Tmax (ºC)
Figure 41. Reference temperatures of different biomass and hard coal chars combustion
Comparing kinetic parameters for the same list of chars, through the frequency factor and activation energies, the second combustion stage in coconut shells char is totally exceptional as it happens with the first reaction in the heterogeneous olive kernels char from Kastanaki et al[65] study. However, in general, both CcNS and CNS chars show kinetic parameters at intermediate level regarding the other biomass chars. This comparison is summarised below in figure 42.
0
2
4
6
8
10
12
14
16
18
Cas
hew
Nut
She
lls-1
Cas
hew
Nut
She
lls-2
Coc
onut
She
lls-1
Coc
onut
She
lls-2
Oliv
e hu
sks
N1
Oliv
e hu
sks
N2
Whe
at s
traw
N1
Whe
at s
traw
N2
Gra
pe re
sidu
e N
1
Gra
pe re
sidu
e N
2
Pine
woo
d N
1
Pine
woo
d N
2
Lign
ite 1
Lign
ite 2
Oliv
e ke
rnel
1
Oliv
e ke
rnel
2
Fore
st re
sidu
e
Cot
ton
resi
due
Woo
d
Har
d co
al
Freq
uenc
y fa
ctor
, (lg
A)
50
70
90
110
130
150
170
190
210
230
Act
ivat
ion
Ener
gy, k
J/m
ollog A [(log(1/s)] Eact, kJ/mol
Figure 42. Kinetic parameters for biomass char combustion and hard coal
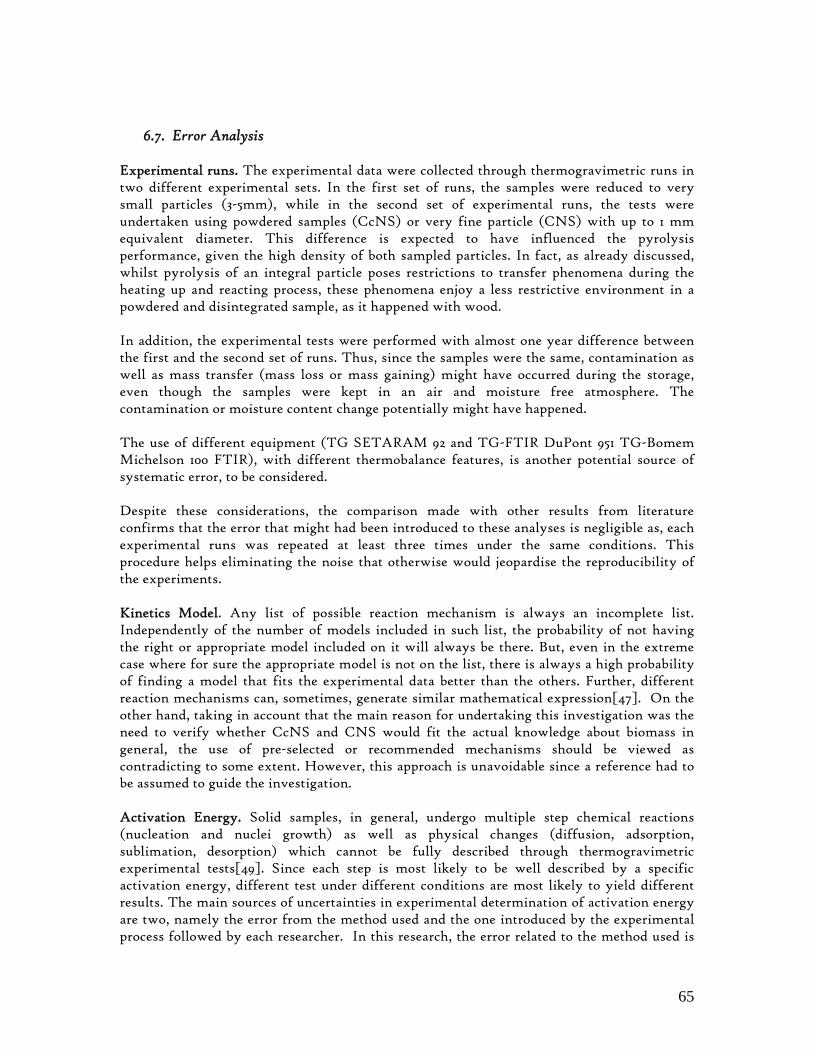
65
6.7. Error Analysis Experimental runs. The experimental data were collected through thermogravimetric runs in two different experimental sets. In the first set of runs, the samples were reduced to very small particles (3-5mm), while in the second set of experimental runs, the tests were undertaken using powdered samples (CcNS) or very fine particle (CNS) with up to 1 mm equivalent diameter. This difference is expected to have influenced the pyrolysis performance, given the high density of both sampled particles. In fact, as already discussed, whilst pyrolysis of an integral particle poses restrictions to transfer phenomena during the heating up and reacting process, these phenomena enjoy a less restrictive environment in a powdered and disintegrated sample, as it happened with wood. In addition, the experimental tests were performed with almost one year difference between the first and the second set of runs. Thus, since the samples were the same, contamination as well as mass transfer (mass loss or mass gaining) might have occurred during the storage, even though the samples were kept in an air and moisture free atmosphere. The contamination or moisture content change potentially might have happened. The use of different equipment (TG SETARAM 92 and TG-FTIR DuPont 951 TG-Bomem Michelson 100 FTIR), with different thermobalance features, is another potential source of systematic error, to be considered. Despite these considerations, the comparison made with other results from literature confirms that the error that might had been introduced to these analyses is negligible as, each experimental runs was repeated at least three times under the same conditions. This procedure helps eliminating the noise that otherwise would jeopardise the reproducibility of the experiments. Kinetics Model. Any list of possible reaction mechanism is always an incomplete list. Independently of the number of models included in such list, the probability of not having the right or appropriate model included on it will always be there. But, even in the extreme case where for sure the appropriate model is not on the list, there is always a high probability of finding a model that fits the experimental data better than the others. Further, different reaction mechanisms can, sometimes, generate similar mathematical expression[47]. On the other hand, taking in account that the main reason for undertaking this investigation was the need to verify whether CcNS and CNS would fit the actual knowledge about biomass in general, the use of pre-selected or recommended mechanisms should be viewed as contradicting to some extent. However, this approach is unavoidable since a reference had to be assumed to guide the investigation. Activation Energy. Solid samples, in general, undergo multiple step chemical reactions (nucleation and nuclei growth) as well as physical changes (diffusion, adsorption, sublimation, desorption) which cannot be fully described through thermogravimetric experimental tests[49]. Since each step is most likely to be well described by a specific activation energy, different test under different conditions are most likely to yield different results. The main sources of uncertainties in experimental determination of activation energy are two, namely the error from the method used and the one introduced by the experimental process followed by each researcher. In this research, the error related to the method used is
66
believed to have bean addressed through the use of both single-heating rate approach (model fitting) and the multiple heating rate (model-free) methods. Rate Constant Determination. All the integral methods used to determine the kinetic parameters have been developed assuming total independence of the frequency factor regarding the reaction temperature. Yet, a number of researchers have already suggested that the frequency factor depends upon the reaction temperature, according to the equation A=A0T
m, in which A0 is constant and [-1.5≤m≤2.5][77]. Additionally, it is recognised that model-fitting technique, especially when a single heating rate is applied, leads to the so-called compensation effect. This is caused by its vulnerability to the compensation effect, a phenomenon derived from the compensating intercorrelation between the frequency factor and the activation energy, allowing different combination of these two parameters to fit the experimental data in the same manner. This brings an error in the selection of the appropriate mechanism[47]. On the other hand, in the determination of activation energy through experimental thermal analysis, apart from the method used to analyse the data, sample characteristics (mass, size), experimental conditions (temperature, pressure) may influence the final results[49]. Tars yields. The use of FTIR implied that all species with zero-dipolar momentum that potentially could be generated from CcNS and CNS pyrolysis were not recognised as such. Hence, they were included in the condensables (tars) yields. This is valid especially for hydrogen. However, since the yields were determined in a mass base (not molar) and given the fact that hydrogen is a light molecule, the deviation that may affect the results is totally insignificant. Additionally, due to the so-called compensation effect, it is important to note that an infinite number of kinetic pairs (A and Eact) exist to fit pretty well the experimental data, as both are interdependent. Still, the selection of a number for A in a wide interval such as the one referred in the transition theory, poses a challenge that will always depend on the experience from other experimental works. These difficulties are, however, always present in kinetics determination from experimental data and are almost unavoidable. But, given the fact that they introduce a systematic error, and then the results are still acceptable. Comparing results form different studies, especially when they are in the field of biomass, is always problematic. The differences encountered are commonly from different sources such those that cannot be handled by the research as the nature in which the biomass was grown, its characteristic composition, variety as well as storage prior to the analysis. Additionally, the difference in instrumentation, equipment and tools used as well as environmental conditions may influence the results in such a way that, even for the same researcher, reproducibility can be challenging.
67
7. CONCLUSIONS This study is focused on thermal characterisation of both coconut and cashew nut shells, as two potential renewable sources of energy in tropical countries. A contribute to reduce the lack of such data in the literature was the main focus. In this regard, auxiliary sound data for engineering design or selection of appropriate energy conversion technologies had been generated with success, in a great extent. Indeed, the study successfully generated the following data:
Ultimate and Proximate Analysis: showing high content of volatiles, low content of ash, nitrogen and sulphur (except CNS that showed a relatively high content of N);
Global pyrolysis profiles, showing unique behaviour in hemicelluloses and cellulose devolatilisation rates distribution when compared to the known species, such has wood;
Pyrolysis Global and Semi-global kinetic parameters, showing tolerable differences with other biomasses, high reactivity of coconut shells and moderate reactivity of cashew nut shells;
o Pyrolysis Global Kinetic parameters: Coconut shells: A=3.16x10¹⁴s-1; Eact=195.73±8.29 kJ/mol Cashew nut shells: A=1.66x10⁸s-1; Eact=122.34±18.48 kJ/mol
o Pyrolysis Semi-Global kinetic parameters: Hemicelluloses: A=7.18x10⁸-6.25x10¹⁶ s-1; Eact=130-216 kJ/mol Cellulose: A=1.20x10¹⁰-1.31x10¹⁴ s-1; Eact=155-208 kJ/mol
Individual Pyrolysis Yields and Pool Sizes, an information of utmost importance in engineering design through modelling;
o 32 different products precursors Char reactivity and Combustion Kinetics, showing acceptable reactivity for both
CcNS and CNS chars to oxygen, when compared with some known biomass samples; o CNS char combustion:
First step: A=6.17x10⁶s-1; Eact=135.14 kJ/mol; n=1 Second step: A=2.5x10⁵s-1; Eact=121.20 kJ/mol; n=1.8
o CcNS char combustion: First step: A=5.09x10⁶s-1; Eact=105 kJ/mol; n=0.6 Second step: A=3.67x10¹²s-1; Eact=190.52 kJ/mol; n=1.25
These data are of key importance in the selection of appropriate technology, which means making the right and experimentally supported decision about the following aspects:
i. type of thermochemical conversion technology; ii. type of reactor (bed type; feeding current course and regime); and,
iii. size of the reactor to meet certain energy demand. For the decision on these aspects, mathematical/computer simulation is of key importance. In fact, it allows translating pure laboratorial results into the most probable (indicative) results in a real life system. Consequently, although the kinetic triplets experimentally determined in this study for different chemical reactions may be deficient in physical meaning, as discussed previously, their contribution for kinetics as well as yields predictions, fundamental
68
procedures for technology design or selection, is absolute. In fact, the kinetic triplet provides important and useful data needed for reproducing the original kinetics data (back calculation) and for the prediction of the process at different conditions than those experimentally tested. 8. FUTURE WORK The next phase in this work will consist of three steps:
i)technology design or selection for energy generation using these two biomasses; ii)feasibility study for the energy technology selected; and, iii)pilot-plant installation on site, somewhere in Mozambique.
Further research is to be undertaken to ensure better user of these two resources as well as a sound and marketable approach for adding value to these crop residues, under local, national, regional and global perspective. This may include economic evaluation of different scenarios such as production of energy in parallel with activated carbon, from coconut shells or with cnsl (bio-oil or chemicals precursor) from cashew nut shells.
69
9. REFERENCES 1. United States Department of Agriculture, Integrated Taxonomy Information System
(www.itis.usda.gov), Nov. 2005 2. Su, W., Zhou, L., and Zhou, Y.; Preparation of Microporous Activated Carbon from Raw Coconut
Shell by Two-step Procedure; Chinese J. Chem. Eng. 14-2 (2006) 266-269 3. PLANTAMED-Brazil (www.plantamed.com.br/ESP/Cocos_nucifera.htm), Nov 2005 4. Tropical Plant Database. Rain Tree Nutrition (www.rain-tree.com), Nov 2205 5. Dos Santos, L. and Magalhães, G.C.; Bio-oil from Cashew Nut Shell from Annacardium occidentale
as Starting Material for Organic Synthesis: A Novel Route to Lasiodoplodin from Cardols. J.Braz.Chemic. Society, 10-1 (1999) 13-20
6. Bhunia, H.P., Nando, G.B., Chaki, T.K., Basak, A., Lenka, S. and Nayak, P.L.; Synthesis and characterization of polymers from cashew nut shell liquid (cnsl), a renewable resource II. Synthesis of polyurethanes; European polymer J. 35 (1999) 1381-1391
7. Das, P., and Ganesh, A.; Bio-oil from Cashew Nut Shell- a near fuel. Biomass & Energy, 25 (2003) 113-117
8. The Courier ACP-EU, (Report) No. 196, January-February, 2003 9. McKendry, P.; Energy production from biomass (part 2): conversion technologies; Bioresource
Technology, 83 (2002) 47-54 10. Faaij, A.; Modern Biomass Conversion Technologies; Mitigation and Adaptation Strategies for
Global Change 11 (2006) 343-375 11. Yaman, S.; Pyrolysis of biomass to produce fuels and chemical feedstocks; Energy Manag. &
Conversion 45 (2004) 651-671 12. Raveendran, K., Ganesh, A., and Khilar, L.C.; Influence of mineral matter on biomass pyrolysis
characteristics. Fuel 74 (1995) 1812-1822 13. Hoque, M.M. and Battacharya, S.C.; Fuel characteristics of gasified coconut shell in a fluidized and a
spouted bed reactor; Energy 26 (2001) 101-110 14. Rakesh, B.C.K. and Stewart, D.F.; An investigation of kinetics of coconut shell pyrolysis; Resources
and Conservation 12 (1986) 137-139 15. Choudbury, D., Borah, R.C., Goswamee, R.L., Sharmah, H.P. and Rao, P.G.; Non-isothermal
thermogravimetric pyrolysis kinetics of waste petroleum refinery sludge by isoconversional approach; J. Therm. Anal. Calorimetry, 89 (2007) 3, 965-970
16. Mamleev, V.; Bourbigot, S.; Le Bras, M.; Duquesne, S. and Šesták, J.; Modelling of Non-isothermal kinetics in Thermogravimetry; Phys. Chem. Chem. Phys., 2 (2000) 4708-4716
17. Zanzi, R., Sjöström, K. and Björnbom, E.; Rapid pyrolysis of wood with application to gasification; Advances in Thermoch. Biomass Conversion, Interlaken, Switzerland, 11-15 May 1992, Vol. 2, pp. 977-985 Edited by Bridgwater, AV
18. Cetin, E., Moghtaderi, B., Gupta, R. and Wall, T.F.; Influence of Pyrolysis Conditions on the Structure and Gasification Reactivity of Biomass Chars. Fuel, 83 (2004) 2139-2150
19. Vamvuka, D., Karakas, E., Kastanaki, E. and Grammelis, P.; Pyrolysis Characteristics and Kinetics of Biomass Residuals mixtures with Lignite. Fuel, 82 (2003) 1949-1960
20. Bridgwater, A.V.; Renewable fuels and chemicals by thermal processing of biomass; Chem. Eng. Journal, 91 (2003) 87-102
21. Yang, W., Ponzio, A., Lucas, C. and Blasiak, W.; Performance analysis of a fixed-bed biomass gasifier using high-temperature air; Fuel Proc. Tech, 87 (2006) 235-245
22. Bain, R.L., Overend, R.P. and Craig, K.R.; Biomass Fired Power Generation; Fuel Proc. Tech., 54 (1998) 1-16
23. Manyà, J.J., Velo, E. and Puigjaner, L.; Kinetics of biomass pyrolysis: a reformulated three-parallel-reactions model; Ind. Eng. Chem. Res. 42 (2003) 434-441
24. Biagini, E., Barontini, F. and Tognotti, L.; Devolatilization of biomass components studied by TG-FTIR technique; Ind. Eng. Chem. Res. 45 (2006) 4486-4493
25. Yang, H., Yan, R., Chen, H., Zheng, C., Lee, D.H. and Liang, D.T.; In-depth investigation of biomass pyrolysis on three major components: hemicellulose, cellulose and lignin; Energy & Fuels 20 (2006) 388-393
70
26. Capart, R., Khezami, L. and Burnham, A.K.; Assessment of Various Kinetic Models for the Pyrolysis of a Microgranular Cellulose. Thermochimica Acta 417 (2004) 79-89
27. Di Blasi, C.; Comparison of Semi-Global Mechanism for Primary Pyrolysis of Lignocellulosic Fuels. J. Analytical and Applied Pyrolysis 47 (1998) 43-64
28. Órfão, J.J.M., Antunes, F.JA. and Figueiredo, J.L.; Pyrolysis Kinetics of Lignocellulosic Materials-three independent reactions model. Fuel 78 (1999) 349-358
29. Alves, S.S. and Figueiredo, J.L.; Kinetics of Cellulose Pyrolysis Modelled by Three Consecutive First-Order Reactions. J. Analytical and Applied Pyrolysis. 17 (1989) 37-46
30. Safi, M.J., Mishra, I.M. and Prasad, B.; Global Kinetics of Pine Needles in Air. Thermochimca Acta, 412 (2004) 155-162
31. Siddhartha, G. and Reed, T.B.; 1998; THERMAL DATA FOR NATURAL AND SYNTHETIC FUELS; Marcel Dekker, Inc., ISBN 0-8247-0070-8
32. Banyasz, J.L., Li, S., Lyons-Hart, J. and Shafer, K.H.; Gas Evolution and the Mechanisms of Cellulose Pyrolysis. Fuel (2001) 1757-1763
33. Lapuerta, M., Hernández, J.J. and Rodríguez, J.; Kinetics of Devolatilization of Forestry Wastes from Thermogravimetric Analysis. Bioamss & Bioenergy, 27 (2004) 385-391
34. Vlaev, L.T., Markoska, I.G. and Lyubchev, L.A.; Non-isothermal kinetics of pyrolysis of rice husk. Thermochimica Acta 406 (2003) 1-7
35. Saha, B. and Ghoshal, A.K.; Model-free kinetics of waste PE sample. Thermochimica Acta 451 (2006) 27-33
36. Saha, B., Maiti, A.K. and Ghoshal, A.K.; Model-free method for isothermal and non-isothermal decomposition kinetics analysis of PET sample. Thermochimica Acta 444 (2006) 46-52
37. De Jong, W., Pirone, A. and Wójtowicz, M.A.; Pyrolysis of Miscanthus Giganteus and wood pellets: TG-FTIR analysis and reaction kinetics; Fuel, 82( 2003) 1139-1147
38. Burnham, A.K. and Braun, R.L.; Global Kinetic Analysis of Complex Materials; Energy & Fuels, 13-1 (1999) 1-22
39. Anthony, D.B., Howard, J.B., Hottel, H.C. and Meissner, H.P.; 15th Symposium (Int) on Combustion. The Combustion Institute, Pittsburg, 1975, pp. 1303-1317
40. Burnham, A.K. and Dinh, L.N.; A comparison of isoconversional and model-fitting approaches to kinetic parameter estimation and application predictions; J. Thermal Analysis and Calorimetry, 89-2 (2007) 479-490
41. Alonso, M.V., Oliet, M., García, J., Rodríguez, F. and Echeverría. J.; Gelation and isoconversional kinetic analysis of lignin-phenol-formaldehyde resol resins cure; Chem. Eng. Journal, 122 (2006) 159-166
42. Friedman, H.L.; Kinetics of thermal degradation of char-forming plastics from thermogravimetry. Application to a phenolic plastic; Journal of Polym. Science. Part C, 6 (1963) 183-195
43. Mamleev. V., Bourbigot, S., Le Bras, M. and Lefebver, J.; Three model-free methods for calculation of activation energy in TG; J. Thermal Anal. Calorimetry, 78 (2004) 1009-10027
44. Ozawa, T.; Applicability of Friedman Method; J. Thermal Analysis, 31 (1986) 547-551 45. Šimon, P.; Isoconversional Methods: fundamentals, meaning and application; J. Therm. Anal.
Calorimetry, 76 (2004) 123-132 46. Flynn, J.H.; The Isoconversional Method for Determination of Energy of Activation at Constant
Heating Rates: corrections for the Doyle approximation; J. Thermal Analysis, 27 (1983) 95-102 47. Hong, J., Guo, G. and Zhang, K.; Kinetics and mechanism of non-isothermal dehydration of nickel
acetate tetrahydrate in air; J. Anal. Applied Pyrolysis, 77-2 (2006) 111-115 48. Vyazovkin, S.; Model-free kinetics: staying free of multiplying entities without necessity; J. Thermal
Analysis and Calorimetry; 83-1 (2006) 45-51 49. Vyazovkin, S.; Two types of uncertainty in the values of activation energy; J. Thermal Analysis and
Calorimetry, 64 (2001) 829-835 50. Burnham, A.K.; Computational aspects of kinetic analysis. Part D: ICTAC kinetics project, multi-
thermal; Thermochimica Acta 355 (2000) 165-170 51. Padhi, S.K.; Solid-state of thermal release of pyridine and morphological study of Ni(ampy)2(NO3)2;
Thermochimica Acta 448 (2006) 1-6 52. Saha, B. and Ghoshal, A.K.; Thermal Degradadtion of poly(ethylene terephtalate)from waste soft
drinks bottles; Chem. Eng. J., 111 (2005) 39-43
71
53. Holstein, A., Bassilakis, R., Wójtowicz, M.A. and Serio, M.A.; Kinetics of methane and tar evolution during coal pyrolysis. Proc. Comb. Inst., 30-2 (2005) 2177-2185
54. Braun, R.L. and Burnham, A.K.; Analysis of chemical reaction kinetics using a distribution of activation energies and simpler models. Energy & Fuels, 1 (1987) 153-161
55. Teng, H., Serio, M.A., Wójtowicz, M.A., Bassilakis, R. and Solomon, P.R.; Reprocessing of used tires into activated carbon and other products. Ind. Eng. Chem. Research., 34 (1995) 3102-3111
56. Tsamba, A.J., Weihong, Y. and Blasiak, W.; Pyrolysis characteristics and global kinetics of coconut and cashew nut shells; Fuel Proc. Tech., 2006, 87-6, 523-530
57. Bridgwater, A.V.; The technical and economic feasibility of biomass gasification for power generation; Fuel, 74-5 (1995)631-653
58. Chitsora, C.T., Mühlen, H.J., van Heek, K.H. and Jüntgen, H.; The influence of pyrolysis conditions on the reactivity of char in H2O; Fuel Proc. Tech. 15 (1987) 17-29
59. Cozzani, V.; Reactivity in oxygen and carbon dioxide of char formed in the pyrolysis of refuse-derived fuel; Ind. Eng. Chem. Res., 39 (2000) 864-872
60. Gale, T.K., Bartholomew, C.H. and Fletcher, T.H.; Effects of pyrolysis heating rate on intrinsic reactivities of coal chars; Energy & Fuels 10 (1996) 766-775
61. Di Blasi, C.; Buonanno, F. and Branca, C.; Reactivities of some biomass chars in air; Carbon 37(1999) 1227-38
62. Várhegyi, G., Szabó, P., Jakab, E. and Till, F.; Mathematical modelling of char reactivity in Ar-O2 mixtures; Energy & Fuels 10-6 (1996) 1208-14
63. Russel, N.V., Beeley, T.J., Man, C.K., Gibbins, J.R. and Williamson, J.; Development of TG measurements of intrinsic char combustion reactivity for industrial and research purposes. Fuel Proc. Tech., 57-2 (1998) 113-130
64. Ciuryla, V.T., Weimer, R.F., Bivans, D.A. and Motika, S.A.; Ambient-pressure thermogravimetric characterization of 4 different coals and their chars; Fuel 58 (1979) 748-754
65. Kastanaki, E. and Vamvuka, D.; A comparative reactivity and kinetic study on the combustion of coal-biomass char blends; Fuel, 85 (2006) 1186-1193
66. Tilliander, U.; 2005. Synthesis of Nano Sized Cu and Cu-W Alloy by Hydrogen Reduction. Licenciate Thesis. KTH. Stockholm. ISRN KTH/MSE—05/33—SE+THMETU/AVH
67. Bassilakis, R., Carangelo, R.M. and Wójtowicz, M.A.; TG-FTIR analysis of biomass pyrolysis; Fuel, 80 (2001) 1765-1786
68. Opfermann, J.; Kinetic analysis using multivariate non-linear regression; J. Thermal Anal. Cal. 60 (2000) 641-658
69. Benson, S.W.; THERMOCHEMICAL KINETICS. 1968. John Willey & Sons. 70. Wójtowicz, M., Bassilakis, R. and Serio, M.A.; Char-oxidation reactivity at early and late stages of
burn off; Proc. of 24th Biennal Conf. on Carbon; South Carolina; vol.I (July 11-16, 1999), pp 230-231.
71. McKendry, P.; Energy production from biomass (part 1): conversion technologies; Bioresource Technology, 83 (2002) 37-46
72. McKendry, P.; Energy production from biomass (part 3): conversion technologies; Bioresource Technology, 83 (2002) 55-63
73. Sentorum, Ç. and Küçükbayrak, S.; Effect of matter on the burning profile of lignites; Thermochimica Acta 285 (1996) 35-46
74. Lu, L., Kong, C., Sahajwalla, V. and Harris, D.; Char structural during pyrolysis and combustion and its influence on char reactivity; Fuel 81 (2002) 1215-1225
75. Rybak, W.; Reactivity of heat-treated coals; Fuel Proc. Tech. 19 (1988) 107-122 76. Baitalow, F., Schmidt, H.G. and Wold. G.; Formal kinetic analysis of process in the solid state;
Thermochimica Acta 337 (1999) 111-120 77. Cai, J. and Liu, R.; Dependence of the frequency factor on the temperature: a new integral method of
nonisothermal kinetic analysis; J. Math. Chem. 43-2 (2008); DOI: 10.1007/s10910-006-9125-5