Embed Size (px)
Citation preview
FUND UPDATEYOUR INVESTMENT PERFORMANCE
January 2019
Market Outlook Fund Performance Contents Individual Funds Group Funds
MARKET OUTLOOK 2 KOTAK GUARANTEED GROWTH FUND(ULIF-013-27/06/03-GRTGWTFND-107) 27
FUND PERFORMANCE OF ULIP FUNDS 7 KOTAK GUARANTEED BALANCED FUND(ULIF-010-27/06/03-GRTBALFND-107) 28
PRODUCT - FUND MATRIX 10 PENSION CLASSIC OPPORTUNITIES FUND(ULIF-042-07/01/10-PNCLAOPFND-107) 29
CLASSIC OPPORTUNITIES FUND(ULIF-033-16/12/09-CLAOPPFND-107) 12 KOTAK PENSION OPPORTUNITIES FUND
(ULIF-032-17/07/09-PNOPPFND-107) 30
FRONTLINE EQUITY FUND(ULIF-034-17/12/09-FRLEQUFND-107) 13 PENSION FRONTLINE EQUITY FUND
(ULIF-044-11/01/10-PNFRLEQFND-107) 31
DYNAMIC FLOOR FUND II(ULIF-035-17/12/09-DYFLRFND2-107) 14 PENSION GUARANTEE FUND
(ULIF-038-21/12/09-PNGRTFND-107) 32
BALANCED FUND(ULIF-037-21/12/09-BALKFND-107) 15 KOTAK PENSION GROWTH FUND
(ULIF-030-07/01/09-PNGWTFND-107) 33
KOTAK OPPORTUNITIES FUND(ULIF-029-02/10/08-OPPFND-107) 16 KOTAK PENSION FLOOR FUND
(ULIF-031-13/07/09-PNFLRFND-107) 34
KOTAK AGGRESSIVE GROWTH FUND(ULIF-018-13/09/04-AGRGWTFND-107) 17 PENSION FLOOR FUND II
(ULIF-043-08/01/10-PNFLRKFND2-107) 35
GUARANTEE FUND(ULIF-048-05/02/10-GRTFND-107) 18 KOTAK PENSION BALANCED FUND
(ULIF-011-27/06/03-PNBALFND-107 ) 36
MONEY MARKET FUND(ULIF-041-05/01/10-MNMKKFND-107) 19 PENSION BALANCED FUND II
(ULIF-046-24/01/10-PNBALFND2-107) 37
KOTAK DYNAMIC GROWTH FUND(ULIF-012-27/06/03-DYGWTFND-107) 20 KOTAK PENSION BOND FUND
(ULIF-017-15/04/04-PNBNDFND-107) 38
DYNAMIC FLOOR FUND(ULIF-028-14/11/06-DYFLRFND-107) 21 KOTAK PENSION GILT FUND
(ULIF-008-27/06/03-PNGLTFND-107) 39
KOTAK DYNAMIC BALANCED FUND(ULIF-009-27/06/03-DYBALFND-107) 22 KOTAK PENSION FLOATING RATE FUND
(ULIF-022-07/12/04-PNFLTRFND-107) 40
KOTAK DYNAMIC BOND FUND(ULIF-015-15/04/04-DYBNDFND-107) 23 PENSION MONEY MARKET FUND II
(ULIF-039-28/12/09-PNMNMKFND-107) 41
KOTAK DYNAMIC GILT FUND(ULIF-006-27/06/03-DYGLTFND-107) 24 KOTAK ADVANTAGE MULTIPLIER FUND II
(ULIF-026-21/04/06-ADVMULFND2-107) 42
KOTAK DYNAMIC FLOATING RATE FUND(ULIF-020-07/12/04-DYFLTRFND-107) 25 DISCONTINUED POLICY FUND
(ULIF-050-23/03/11-DISPOLFND-107) 43
PEAK GUARANTEE FUND I(ULIF-049-14/02/10-PKGRTFND1-107) 26
INDIVIDUAL FUNDS
Click on the Fund Name for details
GROUP FUNDS
Click on the Fund Name for details
KOTAK GROUP DYNAMIC FLOOR FUND(ULGF-015-07/01/10-DYFLRFND-107) 45 KOTAK GROUP SECURE CAPITAL FUND
(ULGF-016-12/04/11-SECCAPFND-107) 51
KOTAK GROUP BALANCED FUND(ULGF-003-27/06/03-BALFND-107) 46 KOTAK GROUP SHORT TERM BOND FUND
(ULGF-018-18/12/13-SHTRMBND-107) 52
KOTAK GROUP BOND FUND(ULGF-004-15/04/04-BNDFND-107) 47 ANNEXURE 53
KOTAK GROUP GILT FUND(ULGF-002-27/06/03-GLTFND-107) 48 DISCLAIMER 59
KOTAK GROUP FLOATING RATE FUND(ULGF-005-07/12/04-FLTRFND-107) 49
KOTAK GROUP MONEY MARKET FUND(ULGF-001-27/06/03-MNMKFND-107) 50
INDIVIDUAL FUNDS
Click on the Fund Name for details
GROUP FUNDS
Click on the Fund Name for details
KOTAK GROUP DYNAMIC FLOOR FUND(ULGF-015-07/01/10-DYFLRFND-107) 45 KOTAK GROUP SECURE CAPITAL FUND
(ULGF-016-12/04/11-SECCAPFND-107) 51
KOTAK GROUP BALANCED FUND(ULGF-003-27/06/03-BALFND-107) 46 KOTAK GROUP SHORT TERM BOND FUND
(ULGF-018-18/12/13-SHTRMBND-107) 52
KOTAK GROUP BOND FUND(ULGF-004-15/04/04-BNDFND-107) 47 KOTAK GROUP PRUDENT FUND
(ULGF-019-04/07/17-KGPFFND-107) 53
KOTAK GROUP GILT FUND(ULGF-002-27/06/03-GLTFND-107) 48 ANNEXURE 54
KOTAK GROUP FLOATING RATE FUND(ULGF-005-07/12/04-FLTRFND-107) 49 DISCLAIMER 60
KOTAK GROUP MONEY MARKET FUND(ULGF-001-27/06/03-MNMKFND-107) 50
MONTHLY UPDATE JANUARY 2019 | (based on last business day) 01AS ON 31st DECEMBER 2018
CONTENTS

Market Outlook Fund Performance Contents Individual Funds Group Funds
MONTHLY UPDATE JANUARY 2019 | (based on last business day) 02
MARKET OUTLOOK
AS ON 31st DECEMBER 2018
Month Gone By – Markets
Market Indicators (period ended December 31,2018)
Indian equities stayed flat in December (Nifty -0.1%) after November’s recovery. However, broader market performed well as Nifty Mid-cap 50 and Small cap 50 indicies outperformed Nifty by 3.3% and 5.0% respectively. Locally, sentiment was initially impacted by a bout of nervousness around state election results and the resignation of RBI Governor Dr. Urjit Patel, but subsequently recovered as macro variables continued their favorable trend. Global sentiment for equities was volatile in December as fears of a recession crept up amid intensified US-China trade tensions and a fourth rate hike by the Federal Reserve.
10 year benchmark yield fell by 24 bps in Decemeber to 7.37%. Bond yields have eased by 65bps in last three months in response to positive surprises on inflation.The sell-off in Brent crude oil prices continued in December (down 8.4%), post a 32% drop in last two months. Brent crude ended the year at USD53.8/bbl. INR lost -0.3% in December and ended the month at 69.8/USD, this comes after a 6.3% rally in November.
Flows
Indices
Performance1
month1 yr
5yr
(CAGR)
Equity
Sensex -0.3% 5.9% 11.2%
Nifty -0.1% 3.2% 11.5%
Nifty Midcap 50 3.2% -11.0% 16.4%
Nifty SmallCap
504.9% -33.0% 11.7%
Bond Market
Crisil
Composite
Bond Index
1.6% 5.9% 9.2%
Commodities
Gold(USD/oz) 5.1% -1.6% 1.3%
Indices
PerformanceDec-18 Nov-18
1 month
Change
Bond Market
10 yr Gsec 7.4% 7.6% -0.2%
Currency
USD/INR 69.8 69.6 -0.3%
Commodities
Brent
Crude(USD/bbl)53.8 58.7 -8.4%
Net Flows
(USD Bn)Dec-18 Nov-18 CY 18
FII (Equity) 0.4 0.9 -4.4
FII (Debt) 0.7 0.9 -6.9
DII (Equity) 0.0 0.1 15.9
Net FII Flows (USD b) Net DII Flows (USD b) Net FII Debt (USD b)
29.3
7.8
- 4.4
-13.0
14.1 15.9
26.222.9
-6.9
CY
06
CY
07
CY
08
CY
09
CY
10
CY
11
CY
12
CY
13
CY
14
CY
15
CY
16
CY
17
YT
D C
Y1
8
-12.2
Market Outlook Fund Performance Contents Individual Funds Group Funds
MONTHLY UPDATE JANUARY 2019 | (based on last business day) 03
MARKET OUTLOOK
AS ON 31st DECEMBER 2018
Economy
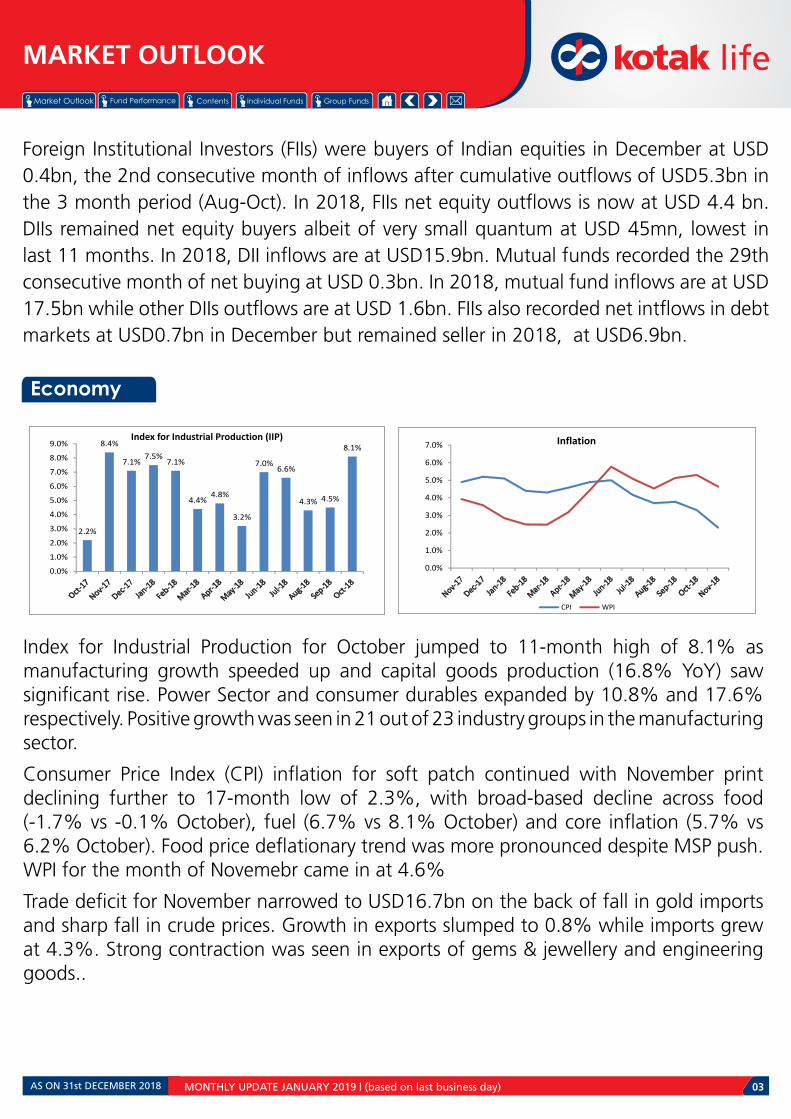
Index for Industrial Production for October jumped to 11-month high of 8.1% as manufacturing growth speeded up and capital goods production (16.8% YoY) saw significant rise. Power Sector and consumer durables expanded by 10.8% and 17.6% respectively. Positive growth was seen in 21 out of 23 industry groups in the manufacturing sector.
Consumer Price Index (CPI) inflation for soft patch continued with November print declining further to 17-month low of 2.3%, with broad-based decline across food (-1.7% vs -0.1% October), fuel (6.7% vs 8.1% October) and core inflation (5.7% vs 6.2% October). Food price deflationary trend was more pronounced despite MSP push. WPI for the month of Novemebr came in at 4.6%
Trade deficit for November narrowed to USD16.7bn on the back of fall in gold imports and sharp fall in crude prices. Growth in exports slumped to 0.8% while imports grew at 4.3%. Strong contraction was seen in exports of gems & jewellery and engineering goods..
Index for Industrial Production (IIP)
2.2%
8.4%
7.1%7.5%
7.1%
4.4%4.8%
3.2%
7.0%6.6%
4.3% 4.5%
8.1%
0.0%
1.0%
2.0%
3.0%
4.0%
5.0%
6.0%
7.0%
8.0%
9.0% Inflation
CPI WPI
0.0%
1.0%
2.0%
3.0%
4.0%
5.0%
6.0%
7.0%
Foreign Institutional Investors (FIIs) were buyers of Indian equities in December at USD 0.4bn, the 2nd consecutive month of inflows after cumulative outflows of USD5.3bn in the 3 month period (Aug-Oct). In 2018, FIIs net equity outflows is now at USD 4.4 bn. DIIs remained net equity buyers albeit of very small quantum at USD 45mn, lowest in last 11 months. In 2018, DII inflows are at USD15.9bn. Mutual funds recorded the 29th consecutive month of net buying at USD 0.3bn. In 2018, mutual fund inflows are at USD 17.5bn while other DIIs outflows are at USD 1.6bn. FIIs also recorded net intflows in debt markets at USD0.7bn in December but remained seller in 2018, at USD6.9bn.

Market Outlook Fund Performance Contents Individual Funds Group Funds
MONTHLY UPDATE JANUARY 2019 | (based on last business day) 04
MARKET OUTLOOK
AS ON 31st DECEMBER 2018
Deal activity was muted in December with 7 deals totalling USD 89mn
Events impacting markets
• RBI Governor’s Resignation- On December10,2018, the RBI Governor Mr.Urjit Patel decided to step down,with immediate effect,with a short note citing personal reasons.The resignation of the RBI Governor did come as a surprise considering that there has been no similar instance in the recent past of a RBI Governor resigning. While the resignation took the market by surprise, leading to concerns over the independence of RBI as an institution,the quick announcement of the appointment of the new Governor has helped allay the fears of the market participants.The government has since appointed Mr.Shaktikanta Das-a seasoned Ministry of Finance bureaucrat-as the new RBI governor. There is an expectation that this appointment would likely result in better policy co-ordination and lead to more engagement with stakeholders.
• State elections- Assembly poll results were announced for 5 states with Congress emerging victorious, albeit of narrow margins, in 3 BJP incumbent states (MP, Rajasthan, Chhattisgarh) while Telangana went to TRS and Mizoram to MNF. Discussions on farmer crisis gathered pace as LS elections drew closer with Cong hinting at a nationwide farm loan waiver.
• PSB recap- : Government sought parliamentary approval for PSU bank recapitalization for additional Rs. 410bn in order pull some lenders out of PCA ambit. Capital solvency is expected to fund shortfall from market and should ensure banks to remain solvent.
• GST Council meet- The GST meet concluded with 6 items being removed from 28% tax bracket, while 28 items continue to remain in the slab. Automobile parts, consumer electricals, cement goods remained in the highest bracket
Equities can react in the coming months based on following events
• Overthelastcoupleofmonths,severalmacrovariableshaveundergonearesetinIndia. These include lower crude oil prices and hence the currency trend, appointment of the new RBI Governor, lower than expected inflation trajectory and G-Sec yields dropping from the peak. Corporate asset quality stress also appears to have peaked out and there are visible signs of large ticket asset resolutions under the Bankruptcy Code. All of this bodes well for India.
• OngoingTradeWartusslebetweentheUnitedStaesandChinacanhaverepurcussionsfor the Global trade and markets. Both the sides seem to be unrelenting in their stance as of now, However since the US has a massive Trade deficit with China, it has found more absolute value of goods on which they have applied tariffs. If the issue escalates more, Global Gdp growth will also be impacted negatively
Equity Market Outlook

Market Outlook Fund Performance Contents Individual Funds Group Funds
MONTHLY UPDATE JANUARY 2019 | (based on last business day) 05
MARKET OUTLOOK
AS ON 31st DECEMBER 2018
Source: NSE
Nifty P/B Peak Min Average
3.4
6.4
2.3
3.7
2
4
6
De
c-0
3
De
c-0
4
De
c-0
5
De
c-0
6
De
c-0
7
De
c-0
8
De
c-0
9
De
c-1
0
De
c-1
1
De
c-1
2
De
c-1
3
De
c-1
4
De
c-1
5
De
c-1
6
De
c-1
7
De
c-1
8
• GeopoliticaltensionsandlingeringrisksoflargesupplydisruptionsledbyUSsanctionson Iran adds upward risk bias to oil. However, the US also wants lower Oil prices and it remains to be seen if countries like Saudi Arabia can pump more oil to keep oil prices in check
• Corporate earnings growth trajectory would be key factor to determine the path ofdomestic markets. Markets are now looking forward to the Q2 reportcard from the companies. Given the deteriorating macro, earnings delivery will go a long way in sustaining multiples
• Forearningsrecovery,arecoveryinoverallcapitalformationcyclewouldbeakeyfactorapart from growth in consumption. While the key driver for capex in the economy would continue to be public spend, the private capex cycle should also benefit from three years of low average lending rates, better corporate profitability, easier availability of credit from the banking system, higher equity raising from a buoyant market, more FDI into manufacturing and infrastructure and a renewed focus on housing. Public capex growth is likely to remain healthy with a focus on roads, rural development and affordable housing.
• Apartfromthefactorsmentionedabove,thepaceofresolutionofNPLs(NonPerformingLoans) and the repair of the balance sheets of corporate private sector banks and state owned banks would play a role in the revival of private sector investments in India. In this regard, the plan to infuse Rs 2.11trn of capital into Public sector banks through a mix of recapitalization bonds, capital infusion as planned in the budget and fresh raise from the market, stands in good stead. Over time as the resolution of big ticket NPLs gather pace, the cycle of low capital and low growth could be broken, resulting in a pick-up in credit growth.A busy election calendar, prospects of a higher fiscal deficit and the likelihood of a meaningful rise in equity supply are some of the known headwinds even as household balance sheets rebalancing toward equities is unabated. • KeysourcesofvolatilityanddownsideforEMequitiesarelikelytobetheUSFedraisingrates accompanied by a more hawkish forecast for the policy rate trajectory over CY18 and CY19 and the Trump Administrations’ protectionist measures and concerns of a trade war.

Market Outlook Fund Performance Contents Individual Funds Group Funds
MONTHLY UPDATE JANUARY 2019 | (based on last business day) 06
MARKET OUTLOOK
AS ON 31st DECEMBER 2018
Source: Bloomberg
10-Year India G-Sec Yield (%)
5.3%
7.0%7.4%
7.9%
4.0%
5.0%
6.0%
7.0%
8.0%
9.0%
10.0%
De
c-0
8
De
c-0
9
De
c-1
0
De
c-1
1
De
c-1
2
De
c-1
3
De
c-1
4
De
c-1
5
De
c-1
6
De
c-1
7
Debt market was in a bullish mode during the month due to steep fall in US 10 year Gilt yields. Brent crude also fell ~8% during the month. INR was notably stable amid dollar strength.
Fall in crude oil prices was due to concerns about near term global growth outlook. US 10 year Gilts also rallied as market expectations of rate hikes in 2019 and 2020 reduced and probability of recession increased among market participants.
US Fed raised benchmark rates by 25 bps. The dot plot reveals only two hikes in 2019, down from three earlier. The long run neutral rate also dropped from 3.0% to 2.75%, indicating a mildly dovish hike. US FOMC downgrades inflation forecast for 2019 and 2020 by 10 bps each to 2.0%. GDP growth forecast for 2019 is downgraded by 20 bps to 2.3%, while for 2020 is raised to 2.0% from 1.8%.
In its last MPC meeting on 05 Dec, RBI kept policy rates on hold in line with consensus expectations and maintained its monetary policy stance of “calibrated tightening”. RBI increased OMO purchases in December by INR 100 bn to INR 500 bn. RBI also announced OMO of INR 500 bn for Jan 2019. This helped market to be in positive mode.
RBI is expected to be dovish in the upcoming policy as global growth concerns emerge coupled with lower than expected CPI data. Low crude oil and other commodity prices would help keep inflation under check going forward. The 10yr benchmark G-sec could trade in a range of 7.10-7.50% in the near term.
Debt Market Outlook
Market Outlook Fund Performance Contents Individual Funds Group Funds
MONTHLY UPDATE JANUARY 2019 | (based on last business day) 07
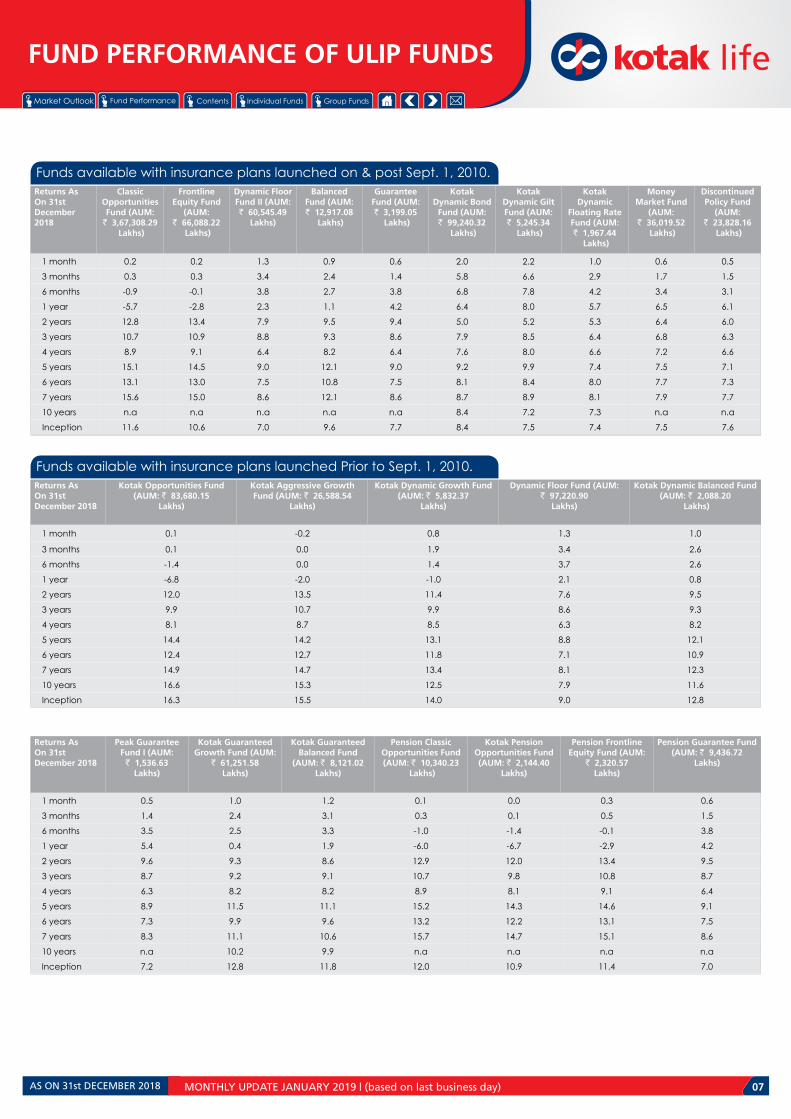
Funds available with insurance plans launched on & post Sept. 1, 2010.Returns AsOn 31st December 2018
Classic Opportunities Fund (AUM:
` 3,67,308.29 Lakhs)
Frontline Equity Fund
(AUM: ` 66,088.22
Lakhs)
Dynamic Floor Fund II (AUM: ` 60,545.49
Lakhs)
Balanced Fund (AUM: ` 12,917.08
Lakhs)
Guarantee Fund (AUM: ` 3,199.05
Lakhs)
Kotak Dynamic Bond
Fund (AUM: ` 99,240.32
Lakhs)
Kotak Dynamic Gilt Fund (AUM: ` 5,245.34
Lakhs)
Kotak Dynamic
Floating Rate Fund (AUM: ` 1,967.44
Lakhs)
Money Market Fund
(AUM: ` 36,019.52
Lakhs)
Discontinued Policy Fund
(AUM: ` 23,828.16
Lakhs)
1 month 0.2 0.2 1.3 0.9 0.6 2.0 2.2 1.0 0.6 0.5
3 months 0.3 0.3 3.4 2.4 1.4 5.8 6.6 2.9 1.7 1.5
6 months -0.9 -0.1 3.8 2.7 3.8 6.8 7.8 4.2 3.4 3.1
1 year -5.7 -2.8 2.3 1.1 4.2 6.4 8.0 5.7 6.5 6.1
2 years 12.8 13.4 7.9 9.5 9.4 5.0 5.2 5.3 6.4 6.0
3 years 10.7 10.9 8.8 9.3 8.6 7.9 8.5 6.4 6.8 6.3
4 years 8.9 9.1 6.4 8.2 6.4 7.6 8.0 6.6 7.2 6.6
5 years 15.1 14.5 9.0 12.1 9.0 9.2 9.9 7.4 7.5 7.1
6 years 13.1 13.0 7.5 10.8 7.5 8.1 8.4 8.0 7.7 7.3
7 years 15.6 15.0 8.6 12.1 8.6 8.7 8.9 8.1 7.9 7.7
10 years n.a n.a n.a n.a n.a 8.4 7.2 7.3 n.a n.a
Inception 11.6 10.6 7.0 9.6 7.7 8.4 7.5 7.4 7.5 7.6
Funds available with insurance plans launched Prior to Sept. 1, 2010.Returns AsOn 31st December 2018
Kotak Opportunities Fund (AUM: ` 83,680.15
Lakhs)
Kotak Aggressive Growth Fund (AUM: ` 26,588.54
Lakhs)
Kotak Dynamic Growth Fund (AUM: ` 5,832.37
Lakhs)
Dynamic Floor Fund (AUM: ` 97,220.90
Lakhs)
Kotak Dynamic Balanced Fund (AUM: ` 2,088.20
Lakhs)
1 month 0.1 -0.2 0.8 1.3 1.0
3 months 0.1 0.0 1.9 3.4 2.6
6 months -1.4 0.0 1.4 3.7 2.6
1 year -6.8 -2.0 -1.0 2.1 0.8
2 years 12.0 13.5 11.4 7.6 9.5
3 years 9.9 10.7 9.9 8.6 9.3
4 years 8.1 8.7 8.5 6.3 8.2
5 years 14.4 14.2 13.1 8.8 12.1
6 years 12.4 12.7 11.8 7.1 10.9
7 years 14.9 14.7 13.4 8.1 12.3
10 years 16.6 15.3 12.5 7.9 11.6
Inception 16.3 15.5 14.0 9.0 12.8
Returns AsOn 31st December 2018
Peak Guarantee Fund I (AUM: ` 1,536.63
Lakhs)
Kotak Guaranteed Growth Fund (AUM:
` 61,251.58Lakhs)
Kotak Guaranteed Balanced Fund
(AUM: ` 8,121.02Lakhs)
Pension Classic Opportunities Fund (AUM: ` 10,340.23
Lakhs)
Kotak Pension Opportunities Fund (AUM: ` 2,144.40
Lakhs)
Pension Frontline Equity Fund (AUM:
` 2,320.57Lakhs)
Pension Guarantee Fund (AUM: ` 9,436.72
Lakhs)
1 month 0.5 1.0 1.2 0.1 0.0 0.3 0.6
3 months 1.4 2.4 3.1 0.3 0.1 0.5 1.5
6 months 3.5 2.5 3.3 -1.0 -1.4 -0.1 3.8
1 year 5.4 0.4 1.9 -6.0 -6.7 -2.9 4.2
2 years 9.6 9.3 8.6 12.9 12.0 13.4 9.5
3 years 8.7 9.2 9.1 10.7 9.8 10.8 8.7
4 years 6.3 8.2 8.2 8.9 8.1 9.1 6.4
5 years 8.9 11.5 11.1 15.2 14.3 14.6 9.1
6 years 7.3 9.9 9.6 13.2 12.2 13.1 7.5
7 years 8.3 11.1 10.6 15.7 14.7 15.1 8.6
10 years n.a 10.2 9.9 n.a n.a n.a n.a
Inception 7.2 12.8 11.8 12.0 10.9 11.4 7.0
FUND PERFORMANCE OF ULIP FUNDS
AS ON 31st DECEMBER 2018

Market Outlook Fund Performance Contents Individual Funds Group Funds
MONTHLY UPDATE JANUARY 2019 | (based on last business day) 08
FUND PERFORMANCE OF ULIP FUNDS
Funds available with insurance plans launched Prior to Sept. 1, 2010.Returns AsOn 31st December 2018
Kotak Pension Growth Fund
(AUM: ` 1,848.64
Lakhs)
Kotak Pension Floor Fund
(AUM: ` 3,786.08
Lakhs)
Pension Floor Fund II (AUM:
` 5,797.16Lakhs)
Kotak Pension Balanced Fund
(AUM: ` 9,854.47
Lakhs)
Pension Balanced Fund
II (AUM: ` 359.85
Lakhs)
Kotak Pension Bond Fund
(AUM: ` 4,977.80
Lakhs)
Kotak Pension Gilt Fund (AUM:
` 674.98Lakhs)
Kotak Pension Floating Rate Fund (AUM:
` 230.99Lakhs)
Pension Money Market Fund II
(AUM: ` 934.00Lakhs)
1 month 1.0 1.2 1.3 1.2 0.8 2.1 2.1 1.0 0.6
3 months 2.7 3.3 3.4 3.1 2.1 5.8 6.6 3.0 1.7
6 months 2.8 3.5 3.8 3.3 2.4 6.8 7.8 4.3 3.4
1 year 1.1 2.0 2.4 1.4 0.8 6.4 8.0 5.9 6.5
2 years 9.3 7.6 8.1 8.3 9.6 4.9 5.3 5.4 6.4
3 years 9.2 8.6 8.9 8.9 9.4 7.9 8.5 6.4 6.8
4 years 8.1 6.3 6.5 8.1 8.3 7.6 8.1 6.7 7.2
5 years 11.4 8.8 9.1 11.0 12.1 9.2 9.9 7.5 7.5
6 years 9.8 7.3 7.5 9.5 10.8 8.1 8.5 8.0 7.6
7 years 11.0 8.3 8.6 10.5 12.2 8.7 8.9 8.1 7.9
10 years n.a n.a n.a 9.7 n.a 8.4 7.2 7.4 n.a
Inception 10.7 6.6 7.0 11.8 9.5 8.4 7.6 7.4 7.5
AS ON 31st DECEMBER 2018

Market Outlook Fund Performance Contents Individual Funds Group Funds
MONTHLY UPDATE JANUARY 2019 | (based on last business day) 09
FUND PERFORMANCE OF ULIP FUNDS
KOTAK PRIVILEDEGE ASSURANCE PLANSReturns AsOn 31st December 2018
Kotak Advantage Multiplier Fund II (AUM: ` 0.41
Lakhs)
1 month 0.5
3 months 2.5
6 months 3.6
1 year 3.6
2 years 2.6
3 years 3.0
4 years 3.5
5 years 4.2
6 years 4.2
7 years 4.9
10 years 5.0
Inception 4.8
Returns less than or equal to a year are absolute. Returns greater than a year are compounded annualised.
Sr No. Fund Manager Equity Debt Balanced
1 Rohit Agarwal 7 NA 19
2 KunalShah NA 15 26
NO. OF FUNDS MANAGED BY FUND MANAGER
Mr. Rohit Agarwal has over 10 years of experience in capital markets, looks at the Unit Linked Equity funds at Kotak Life Insurance . Before joining Kotak in 2011, Mr. Agarwal was associated with JP Morgan for about 6 years. Rohit is a Bachelor of Commerce (2001) and has done PGDBM, Symbiosis Pune (2005).
Mr. Rohit Agarwal– Equity Fund Manager
Mr. Kunal Shah has overall experience of over a decade and has been associated with the Kotak Life Insurance since May 2008. His key responsibilities include management of fixed income portfolios in Unit Linked and managing alternative investments for the company. Kunal is a Bachelor of Commerce (2001) , MBA (Finance), Sinhgad Institute, Pune (2004) and CFA (CFA Institute, USA)
Mr. Kunal Shah CFA – Debt Fund Manager
Returns AsOn 31st December 2018
Kotak Group Dynamic Floor Fund (AUM:
` 374.53 Lakhs)
Kotak Group Balanced Fund
(AUM: ` 79,011.84Lakhs)
Kotak Group Bond Fund (AUM:
` 1,30,703.08Lakhs)
Kotak Group Gilt Fund (AUM:
` 5,176.86Lakhs)
Kotak Group Floating Rate Fund (AUM:
` 11,828.27 Lakhs)
Kotak Group Money Market Fund
(AUM: ` 363.96Lakhs)
Kotak Group Secure Capital
(AUM: ` 30,186.64 Lakhs)
Kotak Group Prudent Fund
(AUM: ` 1,759.71 Lakhs)
1 month 1.4 0.9 2.1 2.2 1.0 0.5 2.0 1.8
3 months 3.9 2.6 5.9 6.7 3.1 1.3 5.8 5.3
6 months 4.4 2.9 7.0 8.0 4.6 2.6 6.8 6.3
1 year 3.5 1.7 6.9 8.3 6.4 5.1 6.8 n.a
2 years 7.4 10.2 5.5 5.5 5.9 4.9 5.5 n.a
3 years 8.5 9.8 8.4 8.7 6.9 4.7 8.2 n.a
4 years 6.4 8.8 8.1 8.3 7.2 5.6 7.9 n.a
5 years 9.0 12.7 9.7 10.1 7.9 6.2 9.5 n.a
6 years 7.5 11.4 8.6 8.7 8.5 n.a 8.4 n.a
7 years 8.5 12.7 9.2 9.2 8.6 n.a 9.0 n.a
10 years n.a 11.9 9.1 7.4 7.8 n.a n.a n.a
Inception 6.9 13.0 8.9 7.8 7.8 6.5 9.0 6.8
KOTAK FIXED MATURITY PLANSReturns AsOn 31st December 2018
Kotak Group Short Term Bond Fund (AUM: ` 9,161.05
Lakhs)
1 month 1.1
3 months 3.2
6 months 4.5
1 year 6.2
2 years 5.9
3 years 7.0
4 years n.a
5 years n.a
6 years n.a
7 years n.a
10 years n.a
Inception 6.9
KOTAK GROUP PLANS
AS ON 31st DECEMBER 2018

Market Outlook Fund Performance Contents Individual Funds Group Funds
MONTHLY UPDATE JANUARY 2019 | (based on last business day) 10
Kotak WealthInsurance
Kotak AceInvestment
Kotak SingleInvest
Advantage
Kotak HeadstartChild Assure
KotakPlatinum
Kotak InvestMaxima
Fund
s
Classic Opportunities Fund ü ü ü ü ü ü
Frontline Equity Fund ü ü ü ü ü ü
Balanced Fund ü ü r ü ü ü
Dynamic Bond Fund ü ü ü ü ü ü
Dynamic Floating Rate Fund ü ü r ü ü r
Money Market Fund ü ü ü ü ü ü
Dynamic Gilt Fund ü ü ü ü ü r
Discontinued Policy Fund ü ü ü ü ü ü
*currently active plans
PRODUCT - FUND MATRIX*
AS ON 31st DECEMBER 2018

Market Outlook Fund Performance Contents Individual Funds Group Funds
MONTHLY UPDATE JANUARY 2019 | (based on last business day) 11
INDIVIDUAL FUNDS
CLASSIC OPPORTUNITIESFUND
DYNAMIC FLOOR FUND II
BALANCED FUND
KOTAK OPPORTUNITIES FUND
KOTAK AGGRESSIVE GROWTH FUND
GUARANTEEFUND
MONEY MARKET FUND
DYNAMIC FLOOR FUND
KOTAK DYNAMIC BALANCED FUND
KOTAK DYNAMIC BOND FUND
KOTAK DYNAMIC FLOATING RATE FUND
PEAK GUARANTEEFUND I
KOTAK GAURANTEEDGROWTH FUND
KOTAK DYNAMICGROWTH FUND
KOTAK GAURANTEEDBALANCED FUND
PENSION CLASSICOPPORTUNITIES FUND
KOTAK PENSIONOPPORTUNITIES FUND
PENSION FRONTLINEEQUITY FUND
PENSION GUARANTEEFUND
KOTAK PENSIONGROWTH FUND
KOTAK PENSIONFLOOR FUND
PENSION FLOORFUND II
KOTAK PENSIONBALANCED FUND
KOTAK PENSION BOND FUND
KOTAK PENSIONGILT FUND
KOTAK PENSIONFLOATING RATE FUND
PENSION MONEYMARKET FUND II
KOTAK ADVANTAGEMULTIPLIER FUND II
DISCONTINUEDPOLICY FUND
FRONTLINE EQUITY FUND
KOTAK DYNAMIC GILT FUND
PENSION BALANCEDFUND II
AS ON 31st DECEMBER 2018

Market Outlook Fund Performance Contents Individual Funds Group Funds
Holdings % to Fund
EQUITY 94.99
Reliance Industries Ltd 6.27
Infosys Ltd 5.35
HDFC Bank Ltd 5.32
SBI ETF Nifty Bank 4.98
Larsen And Toubro Ltd 4.31
KotakBankingETF-DividendPayoutOption 3.98
Tata Consultancy Services Ltd 3.79
ICICI Bank Ltd 3.72
Axis Bank Ltd 3.03
I T C Ltd 2.81
Hindustan Unilever Ltd 2.77
Britannia Industries Ltd 2.38
Mahindra & Mahindra Ltd 2.32
Maruti Suzuki India Ltd 2.13
Aurobindo Pharma Ltd 2.08
Housing Development Finance Corp. Ltd 2.04
Tech Mahindra Ltd 1.79
State Bank of India 1.77
Bajaj Finance Ltd 1.64
Hindalco Industries Ltd 1.59
Others 30.92
Corporate Debt 0.01
7.40% HDFC Bank FD NSE - 17.08.2019 0.004
7.40% HDFC Bank FD NSE - 01.08.2019 0.003
7.40% HDFC Bank FD BSE - 01.08.2019 0.002
MMI 4.98
NCA 0.02
Investment ObjectiveAims to maximize opportunity for you through long-term capital growth, by holding a significant portion in a diversified and flexible mix of large / medium sized company equities
Debt Ratings Profile (%)Portfolio
AUM (in Lakhs)
Sector Allocation as per NIC 2008 % to Fund**
**NIC 2008 - Industrial sector as defined under National Industrial Classification 2008.
MONTHLY UPDATE JANUARY 2019 | (based on last business day) 12
Classic Opportunities
Fund (%)
Benchmark (%)
1 month 0.2 0.6
3 months 0.3 0.5
6 months -0.9 1.0
1 year -5.7 -0.5
2 years 12.8 15.1
3 years 10.7 11.3
4 years 8.9 7.9
5 years 15.1 13.0
6 years 13.1 11.5
7 years 15.6 14.1
10 years n.a n.a
Inception 11.6 9.1
Past performance is not necessarily indicative of future performance
Approved (%) Actual (%)
Equity 75 - 100 95
Gsec / Debt
00 - 25 0
MMI /Others
00 - 25 5
Date of Inception
AUM (in Lakhs)
NAV
Fund Manager
Benchmark Details
Modified Duration
Asset Allocation
Performance Meter
16th December 2009
3,67,308.29
26.9799
Equity : Rohit AgarwalDebt : KunalShah
Equity - 100% (BSE 200)
Debt & MoneyMarket Instruments : -
INDIVIDUAL FUNDCLASSIC OPPORTUNITIES FUND(ULIF-033-16/12/09-CLAOPPFND-107)
3,48,916
18,316 76
Equity Debt NCA
99.83
0.17
TREPS & MutualFund Investments2
Fixed Deposit
14.08
2.74
2.81
2.84
3.70
4.37
5.48
6.80
7.27
10.93
38.97
Others
Warehousing andsupport activities for
transportation
Mfg of tobacco products
Mfg of electricalequipment
Mfg of pharmaceuticals,medicinal chemical &
botanical products
Civil engineering
Mfg of chemicals andchemical products
Mfg of motor vehicles,trailers and semi-trailers
Mfg of coke and refinedpetroleum products
Computer programming,consultancy and related
activities
Financial and insuranceactivities
AS ON 31st DECEMBER 2018

Market Outlook Fund Performance Contents Individual Funds Group Funds
Holdings % to Fund
EQUITY 95.56
Reliance Industries Ltd 6.49
Infosys Ltd 6.25
ICICI Bank Ltd 5.82
HDFC Bank Ltd 5.01
I T C Ltd 4.52
KotakBankingETF-DividendPayoutOption 3.97
Larsen And Toubro Ltd 3.79
Mahindra & Mahindra Ltd 3.47
Axis Bank Ltd 3.42
Reliance ETF Bank Bees 3.37
Hindustan Unilever Ltd 2.95
IndusInd Bank Ltd 2.79
Tech Mahindra Ltd 2.79
Britannia Industries Ltd 2.11
State Bank of India 2.10
SBI ETF Nifty Bank 2.00
Maruti Suzuki India Ltd 1.76
Asian Paints Ltd 1.71
Bata India Ltd 1.68
Aurobindo Pharma Ltd 1.66
Others 27.89
Corporate Debt 0.01
7.40% HDFC Bank FD NSE - 01.08.2019 0.003
7.40% HDFC Bank FD NSE - 17.08.2019 0.003
7.40% HDFC Bank FD BSE - 01.08.2019 0.002
MMI 4.43
Investment ObjectiveAims for a high level of capital growth for you, by holding a significant portion in large sized company equities
Debt Ratings Profile (%)Portfolio
AUM (in Lakhs)
Sector Allocation as per NIC 2008 % to Fund**
**NIC 2008 - Industrial sector as defined under National Industrial Classification 2008.
MONTHLY UPDATE JANUARY 2019 | (based on last business day) 13
FrontlineEquity Fund
(%)
Benchmark (%)
1 month 0.2 0.4
3 months 0.3 0.2
6 months -0.1 1.6
1 year -2.8 1.2
2 years 13.4 15.4
3 years 10.9 11.3
4 years 9.1 7.5
5 years 14.5 12.0
6 years 13.0 11.0
7 years 15.0 13.5
10 years n.a n.a
Inception 10.6 8.7
Past performance is not necessarily indicative of future performance
Approved (%) Actual (%)
Equity 60 - 100 96
Gsec / Debt
00 - 40 0
MMI /Others
00 - 40 4
Date of Inception
AUM (in Lakhs)
NAV
Fund Manager
Benchmark Details
Modified Duration
Asset Allocation
Performance Meter
17th December 2009
66,088.22
24.8670
Equity : Rohit AgarwalDebt : KunalShah
Equity - 100% (BSE 100)
Debt & MoneyMarket Instruments : -
INDIVIDUAL FUNDFRONTLINE EQUITY FUND(ULIF-034-17/12/09-FRLEQUFND-107)
63,153
2,936 -0
Equity Debt NCA
99.81
0.19
TREPS & MutualFund Investments2
Fixed Deposit
14.07
2.35
2.78
3.12
3.79
4.52
6.30
6.49
7.10
11.30
38.18
Others
Mfg of rubber andplastics products
Mfg of pharmaceuticals,medicinal chemical &
botanical products
Mfg of food products
Civil engineering
Mfg of tobacco products
Mfg of chemicals andchemical products
Mfg of coke and refinedpetroleum products
Mfg of motor vehicles,trailers and semi-trailers
Computer programming,consultancy and related
activities
Financial and insuranceactivities
AS ON 31st DECEMBER 2018
Market Outlook Fund Performance Contents Individual Funds Group Funds
Holdings % to Fund
EQUITY 37.42
Infosys Ltd 2.58
Reliance Industries Ltd 2.51
ICICI Bank Ltd 2.23
HDFC Bank Ltd 2.08
KotakBankingETF-DividendPayoutOption 1.78
I T C Ltd 1.73
Reliance ETF Bank Bees 1.61
Larsen And Toubro Ltd 1.44
Mahindra & Mahindra Ltd 1.38
Hindustan Unilever Ltd 1.17
Axis Bank Ltd 1.16
IndusInd Bank Ltd 1.10
Tech Mahindra Ltd 1.07
Britannia Industries Ltd 0.87
State Bank of India 0.81
Maruti Suzuki India Ltd 0.69
Mahindra & Mahindra Financial Services Ltd 0.69
Asian Paints Ltd 0.68
SBI ETF Nifty Bank 0.68
HCL Technologies Ltd 0.68
Others 10.47
G-Sec 29.35
7.72% GOI - 26.10.2055 3.19
8.13% GOI - 22.06.2045 2.94
7.06% GOI - 10.10.2046 2.65
8.70% REC - 28.09.2028 2.43
8.54% REC - 15.11.2028 2.02
8.58% GJ SDL - 31.10.2028 1.89
8.18% NABARD - 26.12.2028 1.58
1.44% INFLATION INDEX GS 2023 1.27
8.37% MP SDL - 05.12.2028 1.07
8.15% TN SDL -09.05.2028 1.03
Others 9.26
Corporate Debt 28.60
7.4805%KotakMahindraPrimeLtd-11.06.2020 3.44
9.05% HDFC - 20.11.2023 1.68
8.56% REC - 29.11.2028 1.62
9.05% HDFC - 16.10.2028 1.36
8.3750% EXIM- 24.07.2025 1.22
Mahindra and Mahindra Financial Services Ltd Floater - 13.07
1.03
7.85% PFC - 03.04.2028 0.88
L&T Finance Ltd NSE Mibor +2% - 05.08.2019 0.87
7.62% EXIM- 01.09.2026 0.84
8.65% PFC - 28.12.2024 0.75
Others 14.92
MMI 3.05
NCA 1.58
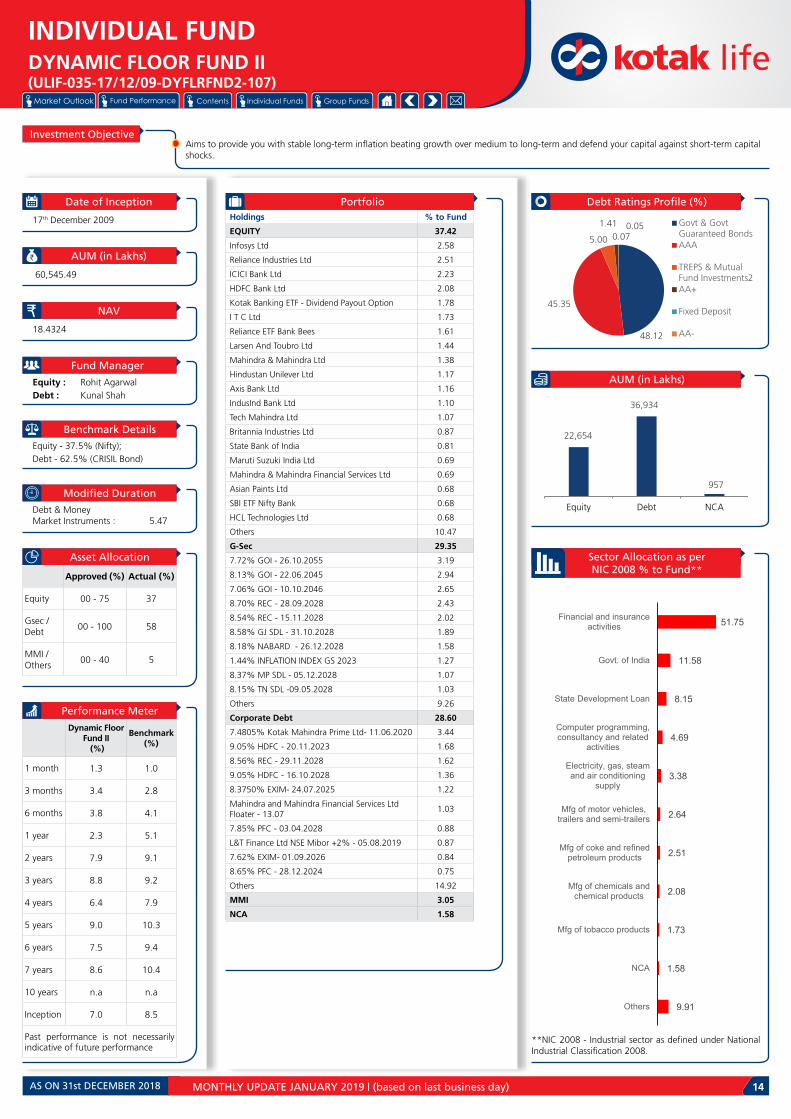
Investment ObjectiveAims to provide you with stable long-term inflation beating growth over medium to long-term and defend your capital against short-term capital shocks.
Debt Ratings Profile (%)Portfolio
AUM (in Lakhs)
Sector Allocation as per NIC 2008 % to Fund**
**NIC 2008 - Industrial sector as defined under National Industrial Classification 2008.
MONTHLY UPDATE JANUARY 2019 | (based on last business day) 14
Dynamic Floor Fund II
(%)
Benchmark (%)
1 month 1.3 1.0
3 months 3.4 2.8
6 months 3.8 4.1
1 year 2.3 5.1
2 years 7.9 9.1
3 years 8.8 9.2
4 years 6.4 7.9
5 years 9.0 10.3
6 years 7.5 9.4
7 years 8.6 10.4
10 years n.a n.a
Inception 7.0 8.5
Past performance is not necessarily indicative of future performance
Approved (%) Actual (%)
Equity 00 - 75 37
Gsec / Debt
00 - 100 58
MMI /Others
00 - 40 5
Date of Inception
AUM (in Lakhs)
NAV
Fund Manager
Benchmark Details
Modified Duration
Asset Allocation
Performance Meter
17th December 2009
60,545.49
18.4324
Equity : Rohit AgarwalDebt : KunalShah
Equity - 37.5% (Nifty);Debt - 62.5% (CRISIL Bond)
Debt & MoneyMarket Instruments : 5.47
INDIVIDUAL FUNDDYNAMIC FLOOR FUND II(ULIF-035-17/12/09-DYFLRFND2-107)
22,654
36,934
957
Equity Debt NCA
48.12
45.35
5.00
1.410.07
0.05 Govt & GovtGuaranteed BondsAAA
TREPS & MutualFund Investments2AA+
Fixed Deposit
AA-
9.91
1.58
1.73
2.08
2.51
2.64
3.38
4.69
8.15
11.58
51.75
Others
NCA
Mfg of tobacco products
Mfg of chemicals andchemical products
Mfg of coke and refinedpetroleum products
Mfg of motor vehicles,trailers and semi-trailers
Electricity, gas, steamand air conditioning
supply
Computer programming,consultancy and related
activities
State Development Loan
Govt. of India
Financial and insuranceactivities
AS ON 31st DECEMBER 2018

Market Outlook Fund Performance Contents Individual Funds Group Funds
Holdings % to Fund
EQUITY 52.67
Infosys Ltd 3.68
Reliance Industries Ltd 3.57
ICICI Bank Ltd 3.25
HDFC Bank Ltd 3.17
I T C Ltd 2.62
KotakBankingETF-DividendPayoutOption 2.22
Mahindra & Mahindra Ltd 2.02
Larsen And Toubro Ltd 1.91
Axis Bank Ltd 1.81
Tech Mahindra Ltd 1.69
Hindustan Unilever Ltd 1.64
IndusInd Bank Ltd 1.61
State Bank of India 1.25
Britannia Industries Ltd 1.14
SBI ETF Nifty Bank 1.09
Reliance ETF Bank Bees 1.03
Bata India Ltd 0.98
HCL Technologies Ltd 0.96
Maruti Suzuki India Ltd 0.96
Asian Paints Ltd 0.93
Others 15.12
G-Sec 20.77
7.72% GOI - 26.10.2055 2.11
8.13% GOI - 22.06.2045 2.00
8.15% GOI FCI Bonds - 16.10.22 1.98
7.06% GOI - 10.10.2046 1.78
8.70% REC - 28.09.2028 1.60
8.54% REC - 15.11.2028 1.42
8.58% GJ SDL - 31.10.2028 1.25
8.18% NABARD - 26.12.2028 1.08
8.37% MP SDL - 05.12.2028 0.73
8.15% TN SDL -09.05.2028 0.71
Others 6.11
Corporate Debt 19.31
7.4805%KotakMahindraPrimeLtd-11.06.2020 3.18
8.56% REC - 29.11.2028 1.10
11.08% HDFC - 13.04.2027 Set Down 13.04.20 - 7.78%
0.80
9.05% HDFC - 16.10.2028 0.79
9.05% HDFC - 20.11.2023 0.79
8.3750% EXIM- 24.07.2025 0.77
Mahindra and Mahindra Financial Services Ltd Floater - 13.07
0.77
7.85% PFC - 03.04.2028 0.60
7.62% EXIM- 01.09.2026 0.59
L&T Finance Ltd NSE Mibor +2% - 05.08.2019 0.58
Others 9.34
MMI 6.12
NCA 1.13
Investment ObjectiveAims for moderate growth for you by holding a diversified mix of equities and fixed interest instruments.
Debt Ratings Profile (%)Portfolio
AUM (in Lakhs)
Sector Allocation as per NIC 2008 % to Fund**
**NIC 2008 - Industrial sector as defined under National Industrial Classification 2008.
MONTHLY UPDATE JANUARY 2019 | (based on last business day) 15
BalancedFund(%)
Benchmark (%)
1 month 0.9 0.9
3 months 2.4 2.1
6 months 2.7 3.3
1 year 1.1 3.3
2 years 9.5 11.4
3 years 9.3 10.1
4 years 8.2 7.9
5 years 12.1 11.1
6 years 10.8 10.2
7 years 12.1 11.7
10 years n.a n.a
Inception 9.6 8.7
Past performance is not necessarily indicative of future performance
Approved (%) Actual (%)
Equity 30 - 60 53
Gsec / Debt
20 - 70 40
MMI /Others
00 - 40 7
Date of Inception
AUM (in Lakhs)
NAV
Fund Manager
Benchmark Details
Modified Duration
Asset Allocation
Performance Meter
21th December 2009
12,917.08
22.8938
Equity : Rohit AgarwalDebt : KunalShah
Equity - 60% (BSE 100);Debt - 40% (CRISIL Bond)
Debt & MoneyMarket Instruments : 4.85
INDIVIDUAL FUNDBALANCED FUND(ULIF-037-21/12/09-BALKFND-107)
6,803 5,967
147
Equity Debt NCA
44.9540.78
13.24
1.030.001
Govt & GovtGuaranteed Bonds
AAA
TREPS & MutualFund Investments2
AA+
Fixed Deposit
13.45
1.91
1.97
2.62
3.44
3.57
3.87
5.43
6.83
8.99
47.90
Others
Civil engineering
Electricity, gas, steamand air conditioning
supply
Mfg of tobacco products
Mfg of chemicals andchemical products
Mfg of coke and refinedpetroleum products
Mfg of motor vehicles,trailers and semi-trailers
State Development Loan
Computer programming,consultancy and related
activities
Govt. of India
Financial and insuranceactivities
AS ON 31st DECEMBER 2018
Market Outlook Fund Performance Contents Individual Funds Group Funds
Holdings % to Fund
EQUITY 96.29
Reliance Industries Ltd 6.37
Infosys Ltd 5.41
HDFC Bank Ltd 5.37
SBI ETF Nifty Bank 5.02
Larsen And Toubro Ltd 4.33
KotakBankingETF-DividendPayoutOption 4.01
Tata Consultancy Services Ltd 3.75
ICICI Bank Ltd 3.72
Axis Bank Ltd 3.08
Hindustan Unilever Ltd 2.80
I T C Ltd 2.79
Britannia Industries Ltd 2.40
Mahindra & Mahindra Ltd 2.32
Maruti Suzuki India Ltd 2.18
Aurobindo Pharma Ltd 2.16
Housing Development Finance Corp. Ltd 2.07
Tech Mahindra Ltd 1.85
State Bank of India 1.79
Hindalco Industries Ltd 1.64
Asian Paints Ltd 1.60
Others 31.63
Corporate Debt 0.15
7.40% HDFC Bank FD NSE - 17.08.2019 0.06
7.40% HDFC Bank FD NSE - 01.08.2019 0.06
7.40% HDFC Bank FD BSE - 01.08.2019 0.03
MMI 1.75
NCA 1.82
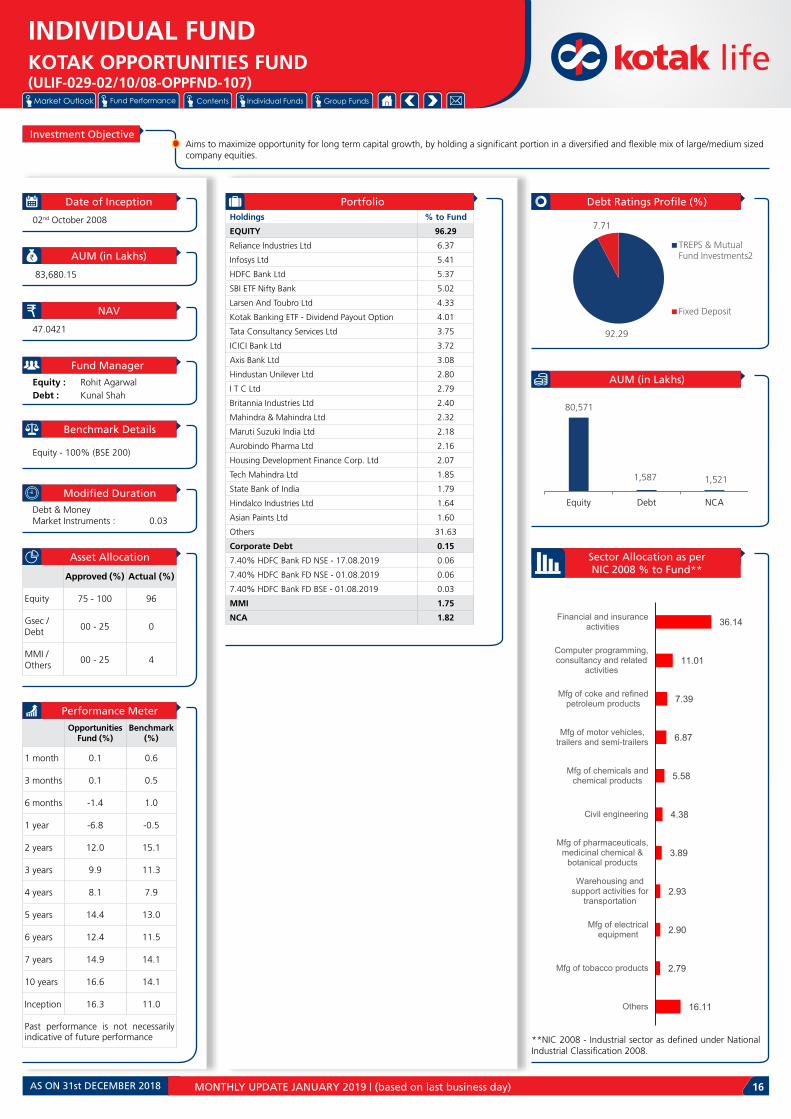
Investment ObjectiveAims to maximize opportunity for long term capital growth, by holding a significant portion in a diversified and flexible mix of large/medium sized company equities.
Debt Ratings Profile (%)Portfolio
AUM (in Lakhs)
Sector Allocation as per NIC 2008 % to Fund**
**NIC 2008 - Industrial sector as defined under National Industrial Classification 2008.
MONTHLY UPDATE JANUARY 2019 | (based on last business day) 16
OpportunitiesFund (%)
Benchmark (%)
1 month 0.1 0.6
3 months 0.1 0.5
6 months -1.4 1.0
1 year -6.8 -0.5
2 years 12.0 15.1
3 years 9.9 11.3
4 years 8.1 7.9
5 years 14.4 13.0
6 years 12.4 11.5
7 years 14.9 14.1
10 years 16.6 14.1
Inception 16.3 11.0
Past performance is not necessarily indicative of future performance
Approved (%) Actual (%)
Equity 75 - 100 96
Gsec / Debt
00 - 25 0
MMI /Others
00 - 25 4
Date of Inception
AUM (in Lakhs)
NAV
Fund Manager
Benchmark Details
Modified Duration
Asset Allocation
Performance Meter
02nd October 2008
83,680.15
47.0421
Equity : Rohit AgarwalDebt : KunalShah
Equity - 100% (BSE 200)
Debt & MoneyMarket Instruments : 0.03
INDIVIDUAL FUNDKOTAK OPPORTUNITIES FUND(ULIF-029-02/10/08-OPPFND-107)
80,571
1,587 1,521
Equity Debt NCA
92.29
7.71
TREPS & MutualFund Investments2
Fixed Deposit
16.11
2.79
2.90
2.93
3.89
4.38
5.58
6.87
7.39
11.01
36.14
Others
Mfg of tobacco products
Mfg of electricalequipment
Warehousing andsupport activities for
transportation
Mfg of pharmaceuticals,medicinal chemical &
botanical products
Civil engineering
Mfg of chemicals andchemical products
Mfg of motor vehicles,trailers and semi-trailers
Mfg of coke and refinedpetroleum products
Computer programming,consultancy and related
activities
Financial and insuranceactivities
AS ON 31st DECEMBER 2018
Market Outlook Fund Performance Contents Individual Funds Group Funds
Holdings % to Fund
EQUITY 95.97
Infosys Ltd 7.00
Reliance Industries Ltd 6.38
HDFC Bank Ltd 5.60
ICICI Bank Ltd 4.85
I T C Ltd 4.55
KotakBankingETF-DividendPayoutOption 4.34
Larsen And Toubro Ltd 4.25
Reliance ETF Bank Bees 4.05
Mahindra & Mahindra Ltd 3.60
Hindustan Unilever Ltd 3.34
Axis Bank Ltd 2.96
IndusInd Bank Ltd 2.94
Britannia Industries Ltd 2.71
Tech Mahindra Ltd 2.68
Asian Paints Ltd 2.14
State Bank of India 2.11
Maruti Suzuki India Ltd 2.06
Aurobindo Pharma Ltd 1.86
HCL Technologies Ltd 1.68
Bata India Ltd 1.68
Others 25.20
Corporate Debt 0.38
7.40% HDFC Bank FD NSE - 01.08.2019 0.16
7.40% HDFC Bank FD NSE - 17.08.2019 0.15
7.40% HDFC Bank FD BSE - 01.08.2019 0.07
MMI 3.63
NCA 0.02
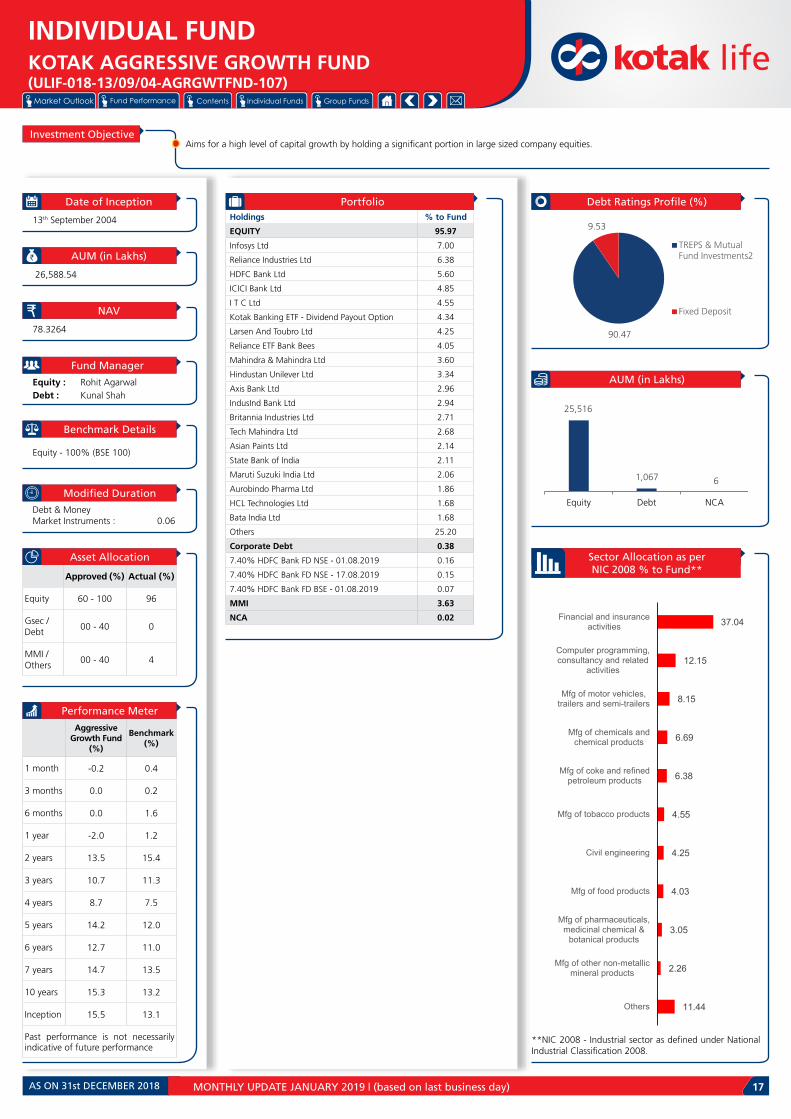
Investment ObjectiveAims for a high level of capital growth by holding a significant portion in large sized company equities.
Debt Ratings Profile (%)Portfolio
AUM (in Lakhs)
Sector Allocation as per NIC 2008 % to Fund**
**NIC 2008 - Industrial sector as defined under National Industrial Classification 2008.
MONTHLY UPDATE JANUARY 2019 | (based on last business day) 17
AggressiveGrowth Fund
(%)
Benchmark (%)
1 month -0.2 0.4
3 months 0.0 0.2
6 months 0.0 1.6
1 year -2.0 1.2
2 years 13.5 15.4
3 years 10.7 11.3
4 years 8.7 7.5
5 years 14.2 12.0
6 years 12.7 11.0
7 years 14.7 13.5
10 years 15.3 13.2
Inception 15.5 13.1
Past performance is not necessarily indicative of future performance
Approved (%) Actual (%)
Equity 60 - 100 96
Gsec / Debt
00 - 40 0
MMI /Others
00 - 40 4
Date of Inception
AUM (in Lakhs)
NAV
Fund Manager
Benchmark Details
Modified Duration
Asset Allocation
Performance Meter
13th September 2004
26,588.54
78.3264
Equity : Rohit AgarwalDebt : KunalShah
Equity - 100% (BSE 100)
Debt & MoneyMarket Instruments : 0.06
INDIVIDUAL FUNDKOTAK AGGRESSIVE GROWTH FUND(ULIF-018-13/09/04-AGRGWTFND-107)
25,516
1,067 6
Equity Debt NCA
90.47
9.53
TREPS & MutualFund Investments2
Fixed Deposit
11.44
2.26
3.05
4.03
4.25
4.55
6.38
6.69
8.15
12.15
37.04
Others
Mfg of other non-metallicmineral products
Mfg of pharmaceuticals,medicinal chemical &
botanical products
Mfg of food products
Civil engineering
Mfg of tobacco products
Mfg of coke and refinedpetroleum products
Mfg of chemicals andchemical products
Mfg of motor vehicles,trailers and semi-trailers
Computer programming,consultancy and related
activities
Financial and insuranceactivities
AS ON 31st DECEMBER 2018

Market Outlook Fund Performance Contents Individual Funds Group Funds
Holdings % to Fund
EQUITY 42.96
Reliance Industries Ltd 3.84
HDFC Bank Ltd 3.12
I T C Ltd 2.54
Infosys Ltd 2.51
Housing Development Finance Corp. Ltd 2.22
Larsen And Toubro Ltd 2.03
Tata Consultancy Services Ltd 2.01
Hindustan Unilever Ltd 1.64
ICICI Bank Ltd 1.59
Maruti Suzuki India Ltd 1.36
Mahindra & Mahindra Ltd 1.00
Sun Pharmaceuticals Ltd 0.91
Asian Paints Ltd 0.78
Oil & Natural Gas Corporation Ltd 0.77
State Bank of India 0.76
Axis Bank Ltd 0.75
UltraTech Cement Ltd 0.73
Hero Honda Motors Ltd 0.72
National Thermal Power Corporation Ltd 0.67
Power Grid Corporation of India Ltd 0.61
Others 12.40
G-Sec 22.54
7.72% GOI - 26.10.2055 2.33
8.13% GOI - 22.06.2045 2.12
8.70% REC - 28.09.2028 1.93
7.06% GOI - 10.10.2046 1.87
8.58% GJ SDL - 31.10.2028 1.36
8.54% REC - 15.11.2028 1.27
1.44% INFLATION INDEX GS 2023 1.10
8.18% NABARD - 26.12.2028 0.93
8.15% GOI FCI Bonds - 16.10.22 0.80
8.01% RJ SPL SDL - 23.06.2020 0.79
Others 8.04
Corporate Debt 23.99
7.4805%KotakMahindraPrimeLtd-11.06.2020 3.67
9.05% HDFC - 16.10.2028 3.21
9.05% HDFC - 20.11.2023 3.18
8.13% PGC - 25.04.2020 1.56
8.56% REC - 29.11.2028 1.27
7.85% PFC - 03.04.2028 0.91
L&T Finance Ltd NSE Mibor +2% - 05.08.2019 0.78
8.65% PFC - 28.12.2024 0.63
9.85% HDFC Bank 2019 - 17.03.2024 CALL 17.03.2019
0.63
Mahindra and Mahindra Financial Services Ltd Floater - 13.07
0.62
Others 7.53
MMI 9.80
NCA 0.71
Investment ObjectiveAims to provide stable, long-term inflation beating growth over medium to long-term and defend capital against short-term capital shocks
Debt Ratings Profile (%)Portfolio
AUM (in Lakhs)
Sector Allocation as per NIC 2008 % to Fund**
**NIC 2008 - Industrial sector as defined under National Industrial Classification 2008.
MONTHLY UPDATE JANUARY 2019 | (based on last business day) 18
GuaranteeFund (%)
Benchmark (%)
1 month 0.6 1.0
3 months 1.4 2.8
6 months 3.8 4.1
1 year 4.2 5.1
2 years 9.4 9.1
3 years 8.6 9.2
4 years 6.4 7.9
5 years 9.0 10.3
6 years 7.5 9.4
7 years 8.6 10.4
10 years n.a n.a
Inception 7.7 8.9
Past performance is not necessarily indicative of future performance
Approved (%) Actual (%)
Equity 00 - 75 43
Gsec / Debt
00 - 100 47
MMI /Others
00 - 100 11
Date of Inception
AUM (in Lakhs)
NAV
Fund Manager
Benchmark Details
Modified Duration
Asset Allocation
Performance Meter
05th February 2010
3,199.05
19.3140
Equity : Rohit AgarwalDebt : KunalShah
Equity - 37.5% (Nifty);Debt - 62.5% (CRISIL Bond)
Debt & MoneyMarket Instruments : 4.52
INDIVIDUAL FUNDGUARANTEE FUND(ULIF-048-05/02/10-GRTFND-107)
1,374
1,802
23
Equity Debt NCA
42.43
41.11
14.98
1.32 0.16Govt & GovtGuaranteed Bonds
AAA
TREPS & MutualFund Investments2
AA+
Fixed Deposit
10.81
2.14
2.54
2.73
3.19
3.65
4.70
5.89
6.76
10.82
46.77
Others
Mfg of basic metals
Mfg of tobacco products
Mfg of motor vehicles,trailers and semi-trailers
Mfg of chemicals andchemical products
Electricity, gas, steamand air conditioning
supply
Mfg of coke and refinedpetroleum products
Computer programming,consultancy and related
activities
State Development Loan
Govt. of India
Financial and insuranceactivities
AS ON 31st DECEMBER 2018

Market Outlook Fund Performance Contents Individual Funds Group Funds
Holdings % to Fund
MMI 99.99
NCA 0.01
Investment ObjectiveAims to protect your capital and not have downside risks
Debt Ratings Profile (%)Portfolio
AUM (in Lakhs)
Sector Allocation as per NIC 2008 % to Fund**
**NIC 2008 - Industrial sector as defined under National Industrial Classification 2008.
MONTHLY UPDATE JANUARY 2019 | (based on last business day) 19
Money Market Fund
(%)
Benchmark (%)
1 month 0.6 0.6
3 months 1.7 1.9
6 months 3.4 3.8
1 year 6.5 7.6
2 years 6.4 7.1
3 years 6.8 7.2
4 years 7.2 7.5
5 years 7.5 7.8
6 years 7.7 8.0
7 years 7.9 8.1
10 years n.a n.a
Inception 7.5 7.8
Past performance is not necessarily indicative of future performance
Approved (%) Actual (%)
MMI /Others
100 100
Date of Inception
AUM (in Lakhs)
NAV
Fund Manager
Benchmark Details
Modified Duration
Asset Allocation
Performance Meter
05th January 2010
36,019.52
19.1569
Debt : KunalShah
Equity - 0% (NA);Debt - 100% (CRISIL Liquid)
Debt & MoneyMarket Instruments : 0.55
INDIVIDUAL FUNDMONEY MARKET FUND(ULIF-041-05/01/10-MNMKKFND-107)
36,015
4.19
Debt NCA
50.41
46.73
2.86Govt & GovtGuaranteed Bonds
A1+
TREPS & MutualFund Investments2
0.01
7.82
41.76
50.41
NCA
Mfg of coke andrefined petroleum
products
Financial andinsurance activities
Govt. of India
AS ON 31st DECEMBER 2018

Market Outlook Fund Performance Contents Individual Funds Group Funds
Investment ObjectiveAims for a high level of capital growth by holding a significant portion in large sized company equities.
Debt Ratings Profile (%)
AUM (in Lakhs)
Sector Allocation as per NIC 2008 % to Fund**
**NIC 2008 - Industrial sector as defined under National Industrial Classification 2008.
MONTHLY UPDATE JANUARY 2019 | (based on last business day) 20
KotakDynamic Growth
Fund (%)
Benchmark (%)
1 month 0.8 0.6
3 months 1.9 1.1
6 months 1.4 2.5
1 year -1.0 2.2
2 years 11.4 13.4
3 years 9.9 10.7
4 years 8.5 7.7
5 years 13.1 11.6
6 years 11.8 10.6
7 years 13.4 12.7
10 years 12.5 12.0
Inception 14.0 13.1
Past performance is not necessarily indicative of future performance
Approved (%) Actual (%)
Equity 40 - 80 75
Gsec / Debt
20 - 60 21
MMI /Others
00 - 40 4
Date of Inception
AUM (in Lakhs)
NAV
Fund Manager
Benchmark Details
Modified Duration
Asset Allocation
Performance Meter
27th June 2003
5,832.37
76.7154
Equity : Rohit AgarwalDebt : KunalShah
Equity - 80% (BSE 100);Debt - 20% (CRISIL Bond)
Debt & MoneyMarket Instruments : 6.55
Holdings % to Fund
EQUITY 75.06
Reliance Industries Ltd 5.19
Infosys Ltd 5.14
ICICI Bank Ltd 4.45
HDFC Bank Ltd 4.26
I T C Ltd 3.51
KotakBankingETF-DividendPayoutOption 3.42
Larsen And Toubro Ltd 3.00
Reliance ETF Bank Bees 2.93
Mahindra & Mahindra Ltd 2.81
Axis Bank Ltd 2.28
IndusInd Bank Ltd 2.23
Hindustan Unilever Ltd 2.19
Tech Mahindra Ltd 2.16
Britannia Industries Ltd 1.81
State Bank of India 1.56
Mahindra & Mahindra Financial Services Ltd 1.42
HCL Technologies Ltd 1.40
Asian Paints Ltd 1.35
Bata India Ltd 1.34
Aurobindo Pharma Ltd 1.23
Others 21.37
G-Sec 18.19
8.30% GOI - 31.12.2042 3.32
8.13% GOI - 22.06.2045 3.27
8.17% GOI - 01.12.2044 3.12
8.97% GOI - 05.12.2030 1.72
7.72% GOI - 26.10.2055 0.88
6.65% Fertilizer Co GOI - 29.01.23 0.83
8.30% GOI - 02.07.2040 0.74
8.70% REC - 28.09.2028 0.71
8.42% TN SDL - 25.08.2020 0.70
8.15% GOI FCI Bonds - 16.10.22 0.68
Others 2.23
Corporate Debt 2.66
9.36% IDFC Bank - 21.08.24 0.86
9.85% HDFC Bank 2019 - 17.03.2024 CALL 17.03.2019
0.52
8.80% PGC - 29.09.2020 0.43
9.02% REC - 19.11.2022 0.35
9.75% REC - 11.11.2021. 0.18
7.40% HDFC Bank FD NSE - 01.08.2019 0.13
7.40% HDFC Bank FD NSE - 17.08.2019 0.13
7.40% HDFC Bank FD BSE - 01.08.2019 0.06
MMI 3.77
NCA 0.32
Portfolio
INDIVIDUAL FUNDKOTAK DYNAMIC GROWTH FUND(ULIF-012-27/06/03-DYGWTFND-107)
4,378
1,436
19
Equity Debt NCA
73.87
15.32
6.003.50
1.30Govt & GovtGuaranteed Bonds
TREPS & MutualFund Investments2
AAA
AA+
Fixed Deposit
15.28
2.10
2.58
3.00
3.51
4.85
5.11
5.19
9.44
15.52
33.43
Others
Mfg of pharmaceuticals,medicinal chemical &
botanical products
Mfg of food products
Civil engineering
Mfg of tobacco products
Mfg of chemicals andchemical products
Mfg of motor vehicles,trailers and semi-trailers
Mfg of coke and refinedpetroleum products
Computer programming,consultancy and related
activities
Govt. of India
Financial and insuranceactivities
AS ON 31st DECEMBER 2018

Market Outlook Fund Performance Contents Individual Funds Group Funds
Investment ObjectiveAims to provide you with stable long-term inflation beating growth over medium to long-term and defend your capital against short-term capital shocks.
Debt Ratings Profile (%)
AUM (in Lakhs)
Sector Allocation as per NIC 2008 % to Fund**
**NIC 2008 - Industrial sector as defined under National Industrial Classification 2008.
MONTHLY UPDATE JANUARY 2019 | (based on last business day) 21
DynamicFloor
Fund (%)
Benchmark (%)
1 month 1.3 1.0
3 months 3.4 2.8
6 months 3.7 4.1
1 year 2.1 5.1
2 years 7.6 9.1
3 years 8.6 9.2
4 years 6.3 7.9
5 years 8.8 10.3
6 years 7.1 9.4
7 years 8.1 10.4
10 years 7.9 10.2
Inception 9.0 8.6
Past performance is not necessarily indicative of future performance
Approved (%) Actual (%)
Equity 00 - 75 38
Gsec / Debt
00 - 100 59
MMI /Others
00 - 40 3
Date of Inception
AUM (in Lakhs)
NAV
Fund Manager
Benchmark Details
Modified Duration
Asset Allocation
Performance Meter
14th November 2006
97,220.90
28.4558
Equity : Rohit AgarwalDebt : KunalShah
Equity - 37.5% (Nifty);Debt - 62.5% (CRISIL Bond)
Debt & MoneyMarket Instruments : 5.60
Holdings % to Fund
EQUITY 38.19
Infosys Ltd 2.60
Reliance Industries Ltd 2.56
ICICI Bank Ltd 2.25
HDFC Bank Ltd 2.14
KotakBankingETF-DividendPayoutOption 1.74
I T C Ltd 1.74
Reliance ETF Bank Bees 1.65
Larsen And Toubro Ltd 1.48
Mahindra & Mahindra Ltd 1.40
Hindustan Unilever Ltd 1.14
Axis Bank Ltd 1.14
IndusInd Bank Ltd 1.11
Tech Mahindra Ltd 1.08
Britannia Industries Ltd 0.89
State Bank of India 0.77
Maruti Suzuki India Ltd 0.71
Asian Paints Ltd 0.70
Mahindra & Mahindra Financial Services Ltd 0.70
SBI ETF Nifty Bank 0.69
HCL Technologies Ltd 0.69
Others 11.01
G-Sec 29.92
7.72% GOI - 26.10.2055 3.24
8.13% GOI - 22.06.2045 2.97
7.06% GOI - 10.10.2046 2.68
8.70% REC - 28.09.2028 2.47
8.54% REC - 15.11.2028 2.02
8.58% GJ SDL - 31.10.2028 1.91
8.18% NABARD - 26.12.2028 1.58
1.44% INFLATION INDEX GS 2023 1.21
8.37% MP SDL - 05.12.2028 1.08
8.15% TN SDL -09.05.2028 1.04
Others 9.72
Corporate Debt 29.11
7.4805%KotakMahindraPrimeLtd-11.06.2020 3.52
8.56% REC - 29.11.2028 1.61
9.05% HDFC - 16.10.2028 1.37
9.05% HDFC - 20.11.2023 1.25
8.3750% EXIM- 24.07.2025 1.25
Mahindra and Mahindra Financial Services Ltd Floater - 13.07
1.03
L&T Finance Ltd NSE Mibor +2% - 05.08.2019 0.93
7.85% PFC - 03.04.2028 0.90
7.62% EXIM- 01.09.2026 0.86
8.65% PFC - 28.12.2024 0.76
Others 15.62
MMI 1.16
NCA 1.61
Portfolio
INDIVIDUAL FUNDDYNAMIC FLOOR FUND(ULIF-028-14/11/06-DYFLRFND-107)
37,132
58,522
1,567
Equity Debt NCA
49.70
46.44
1.93
1.690.12
0.12 Govt & GovtGuaranteed BondsAAA
TREPS & MutualFund Investments2AA+
AA-
Fixed Deposit
10.28
1.61
1.74
2.47
2.56
2.68
3.47
4.74
8.51
11.73
50.22
Others
NCA
Mfg of tobacco products
Mfg of chemicals andchemical products
Mfg of coke and refinedpetroleum products
Mfg of motor vehicles,trailers and semi-trailers
Electricity, gas, steamand air conditioning
supply
Computer programming,consultancy and related
activities
State Development Loan
Govt. of India
Financial and insuranceactivities
AS ON 31st DECEMBER 2018
Market Outlook Fund Performance Contents Individual Funds Group Funds
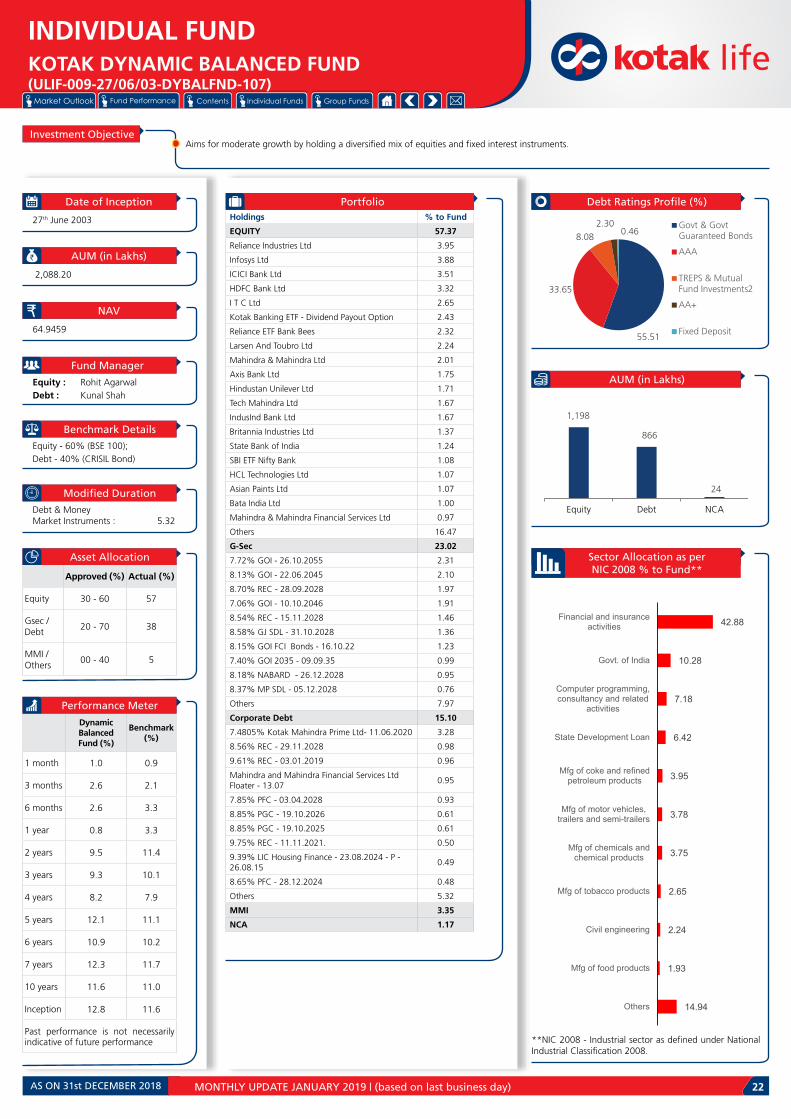
Investment ObjectiveAims for moderate growth by holding a diversified mix of equities and fixed interest instruments.
Debt Ratings Profile (%)
AUM (in Lakhs)
Sector Allocation as per NIC 2008 % to Fund**
**NIC 2008 - Industrial sector as defined under National Industrial Classification 2008.
MONTHLY UPDATE JANUARY 2019 | (based on last business day) 22
DynamicBalancedFund (%)
Benchmark (%)
1 month 1.0 0.9
3 months 2.6 2.1
6 months 2.6 3.3
1 year 0.8 3.3
2 years 9.5 11.4
3 years 9.3 10.1
4 years 8.2 7.9
5 years 12.1 11.1
6 years 10.9 10.2
7 years 12.3 11.7
10 years 11.6 11.0
Inception 12.8 11.6
Past performance is not necessarily indicative of future performance
Approved (%) Actual (%)
Equity 30 - 60 57
Gsec / Debt
20 - 70 38
MMI /Others
00 - 40 5
Date of Inception
AUM (in Lakhs)
NAV
Fund Manager
Benchmark Details
Modified Duration
Asset Allocation
Performance Meter
27th June 2003
2,088.20
64.9459
Equity : Rohit AgarwalDebt : KunalShah
Equity - 60% (BSE 100);Debt - 40% (CRISIL Bond)
Debt & MoneyMarket Instruments : 5.32
Holdings % to Fund
EQUITY 57.37
Reliance Industries Ltd 3.95
Infosys Ltd 3.88
ICICI Bank Ltd 3.51
HDFC Bank Ltd 3.32
I T C Ltd 2.65
KotakBankingETF-DividendPayoutOption 2.43
Reliance ETF Bank Bees 2.32
Larsen And Toubro Ltd 2.24
Mahindra & Mahindra Ltd 2.01
Axis Bank Ltd 1.75
Hindustan Unilever Ltd 1.71
Tech Mahindra Ltd 1.67
IndusInd Bank Ltd 1.67
Britannia Industries Ltd 1.37
State Bank of India 1.24
SBI ETF Nifty Bank 1.08
HCL Technologies Ltd 1.07
Asian Paints Ltd 1.07
Bata India Ltd 1.00
Mahindra & Mahindra Financial Services Ltd 0.97
Others 16.47
G-Sec 23.02
7.72% GOI - 26.10.2055 2.31
8.13% GOI - 22.06.2045 2.10
8.70% REC - 28.09.2028 1.97
7.06% GOI - 10.10.2046 1.91
8.54% REC - 15.11.2028 1.46
8.58% GJ SDL - 31.10.2028 1.36
8.15% GOI FCI Bonds - 16.10.22 1.23
7.40% GOI 2035 - 09.09.35 0.99
8.18% NABARD - 26.12.2028 0.95
8.37% MP SDL - 05.12.2028 0.76
Others 7.97
Corporate Debt 15.10
7.4805%KotakMahindraPrimeLtd-11.06.2020 3.28
8.56% REC - 29.11.2028 0.98
9.61% REC - 03.01.2019 0.96
Mahindra and Mahindra Financial Services Ltd Floater - 13.07
0.95
7.85% PFC - 03.04.2028 0.93
8.85% PGC - 19.10.2026 0.61
8.85% PGC - 19.10.2025 0.61
9.75% REC - 11.11.2021. 0.50
9.39% LIC Housing Finance - 23.08.2024 - P - 26.08.15
0.49
8.65% PFC - 28.12.2024 0.48
Others 5.32
MMI 3.35
NCA 1.17
Portfolio
INDIVIDUAL FUNDKOTAK DYNAMIC BALANCED FUND(ULIF-009-27/06/03-DYBALFND-107)
1,198
866
24
Equity Debt NCA
55.51
33.65
8.082.30
0.46Govt & GovtGuaranteed Bonds
AAA
TREPS & MutualFund Investments2
AA+
Fixed Deposit
14.94
1.93
2.24
2.65
3.75
3.78
3.95
6.42
7.18
10.28
42.88
Others
Mfg of food products
Civil engineering
Mfg of tobacco products
Mfg of chemicals andchemical products
Mfg of motor vehicles,trailers and semi-trailers
Mfg of coke and refinedpetroleum products
State Development Loan
Computer programming,consultancy and related
activities
Govt. of India
Financial and insuranceactivities
AS ON 31st DECEMBER 2018

Market Outlook Fund Performance Contents Individual Funds Group Funds
Investment ObjectiveAims to preserve capital and minimize downside risk, with investment in debt and government instruments.
Debt Ratings Profile (%)
AUM (in Lakhs)
Sector Allocation as per NIC 2008 % to Fund**
**NIC 2008 - Industrial sector as defined under National Industrial Classification 2008.
MONTHLY UPDATE JANUARY 2019 | (based on last business day) 23
Dynamic BondFund(%)
Benchmark (%)
1 month 2.0 1.6
3 months 5.8 4.8
6 months 6.8 5.7
1 year 6.4 5.9
2 years 5.0 5.3
3 years 7.9 7.8
4 years 7.6 8.0
5 years 9.2 9.2
6 years 8.1 8.3
7 years 8.7 8.5
10 years 8.4 7.4
Inception 8.4 6.6
Past performance is not necessarily indicative of future performance
Approved (%) Actual (%)
Gsec 00 - 75 50
Debt 25 - 100 47
MMI /Others
00 - 40 3
Date of Inception
AUM (in Lakhs)
NAV
Fund Manager
Benchmark Details
Modified Duration
Asset Allocation
Performance Meter
15th April 2004
99,240.32
32.8064
Debt : KunalShah
Debt - 100% (CRISIL Bond)
Debt & MoneyMarket Instruments : 5.96
Holdings % to Fund
G-Sec 50.40
7.72% GOI - 26.10.2055 5.62
8.13% GOI - 22.06.2045 5.18
7.06% GOI - 10.10.2046 4.66
8.70% REC - 28.09.2028 4.28
8.54% REC - 15.11.2028 3.60
8.58% GJ SDL - 31.10.2028 3.35
8.18% NABARD - 26.12.2028 2.55
8.37% MP SDL - 05.12.2028 1.88
8.15% TN SDL -09.05.2028 1.83
8.22% NABARD - 13.12.2028 1.75
Others 15.69
Corporate Debt 46.54
7.4805%KotakMahindraPrimeLtd-11.06.2020 3.38
8.56% REC - 29.11.2028 2.82
9.05% HDFC - 16.10.2028 2.17
9.05% HDFC - 20.11.2023 2.15
8.3750% EXIM- 24.07.2025 1.88
Mahindra and Mahindra Financial Services Ltd Floater - 13.07
1.83
7.85% PFC - 03.04.2028 1.52
7.62% EXIM- 01.09.2026 1.49
L&T Finance Ltd NSE Mibor +2% - 05.08.2019 1.39
8.18% EXIM- 07.12.2025 1.37
Others 26.53
MMI 0.34
NCA 2.71
Portfolio
INDIVIDUAL FUNDDYNAMIC BOND FUND (ULIF-015-15/04/04-DYBNDFND-107)
96,550
2,690
Debt NCA
51.81
46.99
0.790.35
0.06Govt & GovtGuaranteed Bonds
AAA
AA+
TREPS & MutualFund Investments2
AA-
0.06
2.71
3.29
5.00
13.83
19.93
55.17
Mfg of basic metals
NCA
Wholesale trade, exceptof motor vehicles and
motorcycles
Electricity, gas, steamand air conditioning
supply
State Development Loan
Govt. of India
Financial and insuranceactivities
AS ON 31st DECEMBER 2018
Market Outlook Fund Performance Contents Individual Funds Group Funds
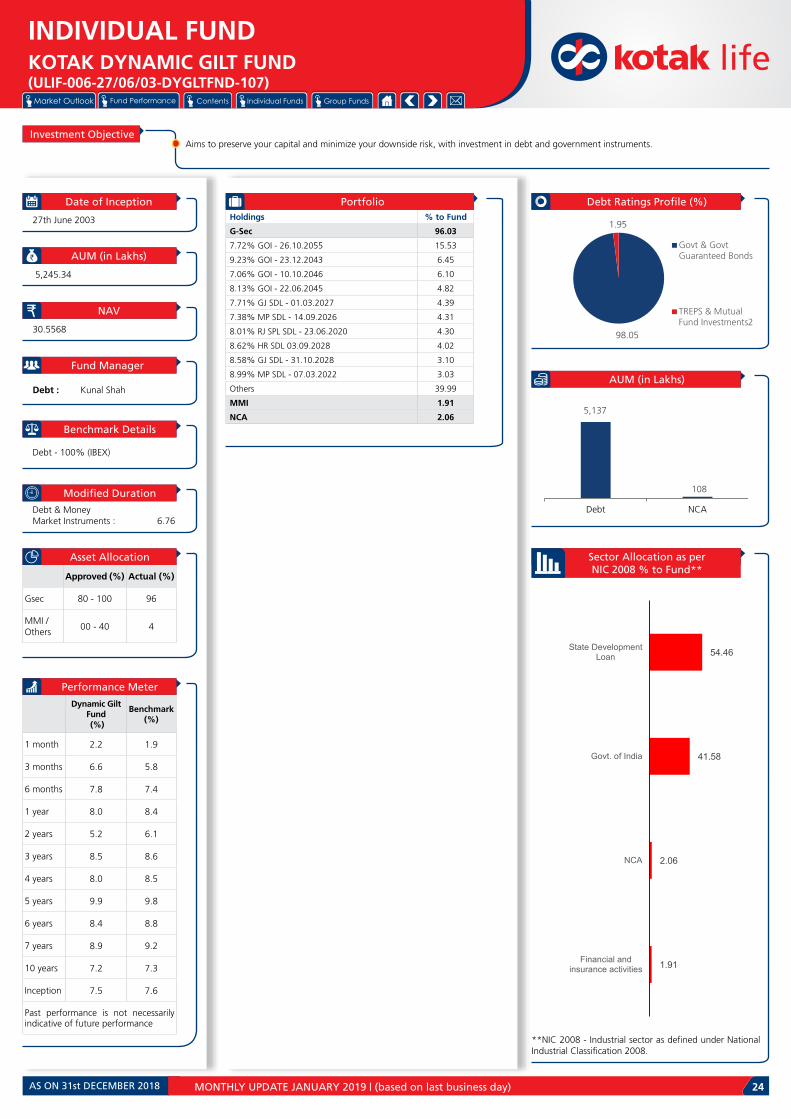
Investment ObjectiveAims to preserve your capital and minimize your downside risk, with investment in debt and government instruments.
Debt Ratings Profile (%)
AUM (in Lakhs)
Sector Allocation as per NIC 2008 % to Fund**
**NIC 2008 - Industrial sector as defined under National Industrial Classification 2008.
MONTHLY UPDATE JANUARY 2019 | (based on last business day) 24
Dynamic GiltFund (%)
Benchmark (%)
1 month 2.2 1.9
3 months 6.6 5.8
6 months 7.8 7.4
1 year 8.0 8.4
2 years 5.2 6.1
3 years 8.5 8.6
4 years 8.0 8.5
5 years 9.9 9.8
6 years 8.4 8.8
7 years 8.9 9.2
10 years 7.2 7.3
Inception 7.5 7.6
Past performance is not necessarily indicative of future performance
Approved (%) Actual (%)
Gsec 80 - 100 96
MMI /Others
00 - 40 4
Date of Inception
AUM (in Lakhs)
NAV
Fund Manager
Benchmark Details
Modified Duration
Asset Allocation
Performance Meter
27th June 2003
5,245.34
30.5568
Debt : KunalShah
Debt - 100% (IBEX)
Debt & MoneyMarket Instruments : 6.76
Holdings % to Fund
G-Sec 96.03
7.72% GOI - 26.10.2055 15.53
9.23% GOI - 23.12.2043 6.45
7.06% GOI - 10.10.2046 6.10
8.13% GOI - 22.06.2045 4.82
7.71% GJ SDL - 01.03.2027 4.39
7.38% MP SDL - 14.09.2026 4.31
8.01% RJ SPL SDL - 23.06.2020 4.30
8.62% HR SDL 03.09.2028 4.02
8.58% GJ SDL - 31.10.2028 3.10
8.99% MP SDL - 07.03.2022 3.03
Others 39.99
MMI 1.91
NCA 2.06
Portfolio
INDIVIDUAL FUNDKOTAK DYNAMIC GILT FUND(ULIF-006-27/06/03-DYGLTFND-107)
5,137
108
Debt NCA
98.05
1.95
Govt & GovtGuaranteed Bonds
TREPS & MutualFund Investments2
1.91
2.06
41.58
54.46
Financial andinsurance activities
NCA
Govt. of India
State DevelopmentLoan
AS ON 31st DECEMBER 2018

Market Outlook Fund Performance Contents Individual Funds Group Funds
Investment ObjectiveAims to preserve capital and minimize downside risk, with investment in debt and government instruments.
Debt Ratings Profile (%)
AUM (in Lakhs)
Sector Allocation as per NIC 2008 % to Fund**
**NIC 2008 - Industrial sector as defined under National Industrial Classification 2008.
MONTHLY UPDATE JANUARY 2019 | (based on last business day) 25
Dynamic Floating Rate
Fund (%)
Benchmark (%)
1 month 1.0 0.6
3 months 2.9 1.9
6 months 4.2 3.8
1 year 5.7 7.6
2 years 5.3 7.1
3 years 6.4 7.2
4 years 6.6 7.5
5 years 7.4 7.8
6 years 8.0 8.0
7 years 8.1 8.1
10 years 7.3 7.5
Inception 7.4 7.2
Past performance is not necessarily indicative of future performance
Approved (%) Actual (%)
Gsec 00 - 75 44
Debt 25 - 100 42
MMI /Others
00 - 40 14
Date of Inception
AUM (in Lakhs)
NAV
Fund Manager
Benchmark Details
Modified Duration
Asset Allocation
Performance Meter
07th December 2004
1,967.44
27.1439
Debt : KunalShah
Debt - 100% (CRISIL Liquid)
Debt & MoneyMarket Instruments : 1.98
Holdings % to Fund
G-Sec 44.45
9.37% MAH SDL - 04.12.2023 10.74
8.92% RJ SDL - 21.11.2022 4.64
9.25% HR SDL 09.10.2023 3.11
8.38% MAH SDL - 25.03.2020 2.91
8.28% TN SDL - 09.09.2019 2.36
8.51% PN SDL - 10.04.2023 2.33
8.23% GJ SDL - 07.10.2019 2.17
8.39% RJ SPL SDL - 15.03.2022 2.02
9.65% TN SDL - 12.03.2024 1.97
8.85% TN SDL - 17.10.2022 1.90
Others 10.31
Corporate Debt 41.92
FRB G - 21.12.2020 18.86
L&T Finance Ltd NSE Mibor +2% - 05.08.2019 8.89
Shriram Transport Finance Co Ltd Floater - 19.07.19
8.64
Mahindra and Mahindra Financial Services Ltd Floater - 13.07
5.53
MMI 12.14
NCA 1.49
Portfolio
INDIVIDUAL FUNDKOTAK DYNAMIC FLOATING RATE FUND(ULIF-020-07/12/04-DYFLTRFND-107)
1,938
29
Debt NCA
67.64
14.64
8.77
6.38 2.58Govt & GovtGuaranteed Bonds
AAA
AA+
A1+
TREPS & MutualFund Investments2
1.49
27.58
31.88
39.06
NCA
Govt. of India
Financial and insuranceactivities
State Development Loan
AS ON 31st DECEMBER 2018

Market Outlook Fund Performance Contents Individual Funds Group Funds
Investment ObjectiveAims for a high level of capital growth by holding a significant portion in large sized company equities.
Debt Ratings Profile (%)
AUM (in Lakhs)
Sector Allocation as per NIC 2008 % to Fund**
**NIC 2008 - Industrial sector as defined under National Industrial Classification 2008.
MONTHLY UPDATE JANUARY 2019 | (based on last business day) 26
PeakGuaranteeFund I (%)
Benchmark (%)
1 month 0.5 1.0
3 months 1.4 2.8
6 months 3.5 4.1
1 year 5.4 5.1
2 years 9.6 9.1
3 years 8.7 9.2
4 years 6.3 7.9
5 years 8.9 10.3
6 years 7.3 9.4
7 years 8.3 10.4
10 years n.a n.a
Inception 7.2 8.8
Past performance is not necessarily indicative of future performance
Approved (%) Actual (%)
Equity 00 - 100 15
Gsec / Debt
00 - 100 58
MMI /Others
00 - 100 27
Date of Inception
AUM (in Lakhs)
NAV
Fund Manager
Benchmark Details
Modified Duration
Asset Allocation
Performance Meter
14th February 2010
1,536.63
18.4851
Equity : Rohit Agarwal Debt : KunalShah
Equity - 37.5% (Nifty);Debt - 62.5% (CRISIL Bond)
Debt & MoneyMarket Instruments : 0.81
Holdings % to Fund
EQUITY 14.80
Reliance Industries Ltd 1.28
HDFC Bank Ltd 1.16
I T C Ltd 0.88
Infosys Ltd 0.85
Housing Development Finance Corp. Ltd 0.82
Larsen And Toubro Ltd 0.72
Tata Consultancy Services Ltd 0.68
ICICI Bank Ltd 0.59
Hindustan Unilever Ltd 0.58
Maruti Suzuki India Ltd 0.45
Mahindra & Mahindra Ltd 0.34
State Bank of India 0.28
Axis Bank Ltd 0.28
Asian Paints Ltd 0.28
Sun Pharmaceuticals Ltd 0.27
Hero Honda Motors Ltd 0.25
UltraTech Cement Ltd 0.24
Oil & Natural Gas Corporation Ltd 0.24
Bajaj Auto Ltd 0.22
National Thermal Power Corporation Ltd 0.21
Others 4.17
G-Sec 48.09
8.48% MAH SDL - 24.02.2020 36.23
8.14% MH SDL -23.09.2019 6.55
8.28% TN SDL - 09.09.2019 1.90
1.44% INFLATION INDEX GS 2023 1.36
8.20% GOI - 15.02.22 0.27
9.72% PN SDL - 28.08.2023 0.21
8.90%KASDL-19.12.2022 0.18
9.29% PN SDL - 09.10.2023 0.16
9.29% MP SDL - 16.01.2024 0.10
9.69% PN SDL - 12.02.2024 0.09
Others 1.05
Corporate Debt 9.64
9.7705% LIC Housing Finance - 26.02.19 - P - 26.03.15
3.91
8.70% PFC- 14.05.2020 1.31
8.80% REC - 06.10.2019 1.31
9.30% PGC - 28.06.2024 0.85
8.57% REC - 21.12.2024 0.66
8.70% PFC- 15.01.2020 0.65
9.85% HDFC Bank 2019 - 17.03.2024 CALL 17.03.2019
0.65
9.25% IDFC Bank - 13.09.19 0.13
7.40% HDFC Bank FD NSE - 17.08.2019 0.07
7.40% HDFC Bank FD NSE - 01.08.2019 0.07
Others 0.04
MMI 25.38
NCA 2.08
Portfolio
INDIVIDUAL FUNDPEAK GUARANTEE FUND I(ULIF-049-14/02/10-PKGRTFND1-107)
227
1,277
32
Equity Debt NCA
57.86
30.54
11.240.21 0.16
Govt & GovtGuaranteed Bonds
TREPS & MutualFund Investments2
AAA
Fixed Deposit
AA+
4.07
0.88
0.92
1.12
1.28
1.56
1.82
1.99
2.08
38.01
46.27
Others
Mfg of tobaccoproducts
Mfg of motor vehicles,trailers and semi-
trailers
Mfg of chemicals andchemical products
Electricity, gas, steamand air conditioning
supply
Mfg of coke andrefined petroleum
products
Govt. of India
Computerprogramming,
consultancy andrelated activities
NCA
Financial andinsurance activities
State DevelopmentLoan
AS ON 31st DECEMBER 2018
Market Outlook Fund Performance Contents Individual Funds Group Funds
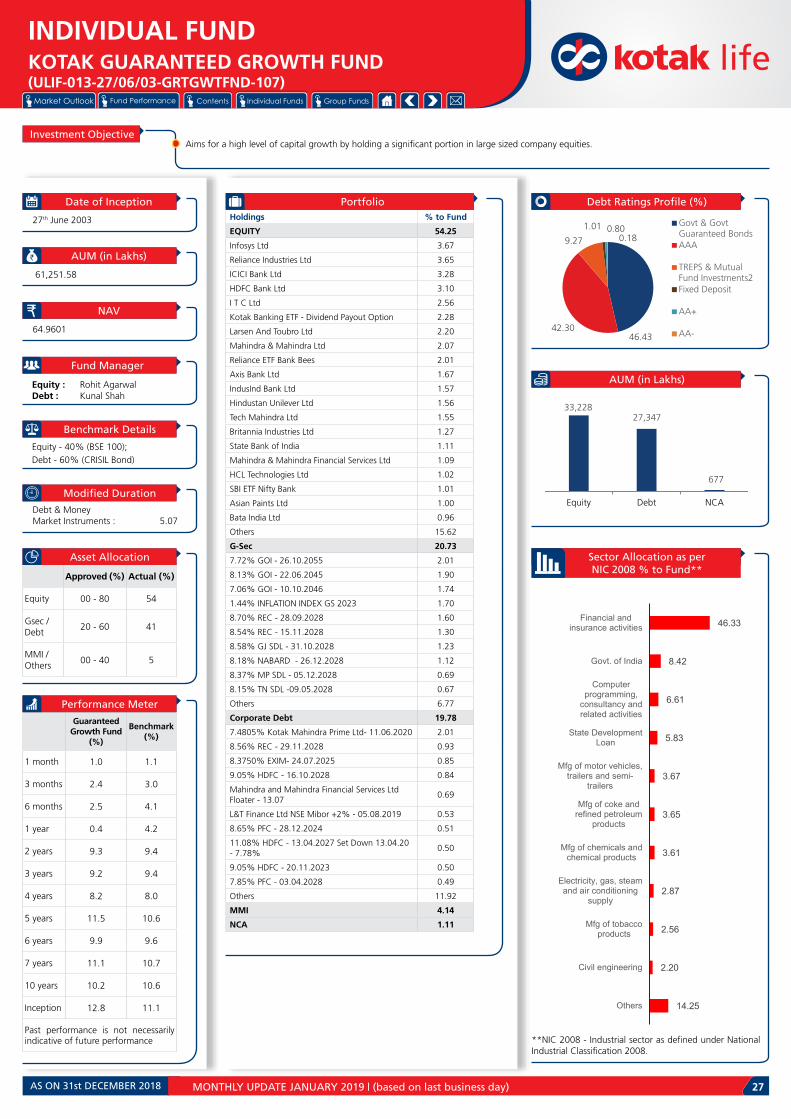
Investment ObjectiveAims for a high level of capital growth by holding a significant portion in large sized company equities.
Debt Ratings Profile (%)
AUM (in Lakhs)
Sector Allocation as per NIC 2008 % to Fund**
**NIC 2008 - Industrial sector as defined under National Industrial Classification 2008.
MONTHLY UPDATE JANUARY 2019 | (based on last business day) 27
GuaranteedGrowth Fund
(%)
Benchmark (%)
1 month 1.0 1.1
3 months 2.4 3.0
6 months 2.5 4.1
1 year 0.4 4.2
2 years 9.3 9.4
3 years 9.2 9.4
4 years 8.2 8.0
5 years 11.5 10.6
6 years 9.9 9.6
7 years 11.1 10.7
10 years 10.2 10.6
Inception 12.8 11.1
Past performance is not necessarily indicative of future performance
Approved (%) Actual (%)
Equity 00 - 80 54
Gsec / Debt
20 - 60 41
MMI /Others
00 - 40 5
Date of Inception
AUM (in Lakhs)
NAV
Fund Manager
Benchmark Details
Modified Duration
Asset Allocation
Performance Meter
27th June 2003
61,251.58
64.9601
Equity : Rohit Agarwal Debt : KunalShah
Equity - 40% (BSE 100);Debt - 60% (CRISIL Bond)
Debt & MoneyMarket Instruments : 5.07
Holdings % to Fund
EQUITY 54.25
Infosys Ltd 3.67
Reliance Industries Ltd 3.65
ICICI Bank Ltd 3.28
HDFC Bank Ltd 3.10
I T C Ltd 2.56
KotakBankingETF-DividendPayoutOption 2.28
Larsen And Toubro Ltd 2.20
Mahindra & Mahindra Ltd 2.07
Reliance ETF Bank Bees 2.01
Axis Bank Ltd 1.67
IndusInd Bank Ltd 1.57
Hindustan Unilever Ltd 1.56
Tech Mahindra Ltd 1.55
Britannia Industries Ltd 1.27
State Bank of India 1.11
Mahindra & Mahindra Financial Services Ltd 1.09
HCL Technologies Ltd 1.02
SBI ETF Nifty Bank 1.01
Asian Paints Ltd 1.00
Bata India Ltd 0.96
Others 15.62
G-Sec 20.73
7.72% GOI - 26.10.2055 2.01
8.13% GOI - 22.06.2045 1.90
7.06% GOI - 10.10.2046 1.74
1.44% INFLATION INDEX GS 2023 1.70
8.70% REC - 28.09.2028 1.60
8.54% REC - 15.11.2028 1.30
8.58% GJ SDL - 31.10.2028 1.23
8.18% NABARD - 26.12.2028 1.12
8.37% MP SDL - 05.12.2028 0.69
8.15% TN SDL -09.05.2028 0.67
Others 6.77
Corporate Debt 19.78
7.4805%KotakMahindraPrimeLtd-11.06.2020 2.01
8.56% REC - 29.11.2028 0.93
8.3750% EXIM- 24.07.2025 0.85
9.05% HDFC - 16.10.2028 0.84
Mahindra and Mahindra Financial Services Ltd Floater - 13.07
0.69
L&T Finance Ltd NSE Mibor +2% - 05.08.2019 0.53
8.65% PFC - 28.12.2024 0.51
11.08% HDFC - 13.04.2027 Set Down 13.04.20 - 7.78%
0.50
9.05% HDFC - 20.11.2023 0.50
7.85% PFC - 03.04.2028 0.49
Others 11.92
MMI 4.14
NCA 1.11
Portfolio
INDIVIDUAL FUNDKOTAK GUARANTEED GROWTH FUND(ULIF-013-27/06/03-GRTGWTFND-107)
33,228 27,347
677
Equity Debt NCA
46.4342.30
9.27
1.01 0.800.18
Govt & GovtGuaranteed BondsAAA
TREPS & MutualFund Investments2Fixed Deposit
AA+
AA-
14.25
2.20
2.56
2.87
3.61
3.65
3.67
5.83
6.61
8.42
46.33
Others
Civil engineering
Mfg of tobaccoproducts
Electricity, gas, steamand air conditioning
supply
Mfg of chemicals andchemical products
Mfg of coke andrefined petroleum
products
Mfg of motor vehicles,trailers and semi-
trailers
State DevelopmentLoan
Computerprogramming,
consultancy andrelated activities
Govt. of India
Financial andinsurance activities
AS ON 31st DECEMBER 2018

Market Outlook Fund Performance Contents Individual Funds Group Funds
Investment ObjectiveAims for moderate growth by holding a diversified mix of equities and fixed interest instruments.
Debt Ratings Profile (%)
AUM (in Lakhs)
Sector Allocation as per NIC 2008 % to Fund**
**NIC 2008 - Industrial sector as defined under National Industrial Classification 2008.
MONTHLY UPDATE JANUARY 2019 | (based on last business day) 28
GuaranteedBalanced Fund (%)
Benchmark (%)
1 month 1.2 1.3
3 months 3.1 3.5
6 months 3.3 4.5
1 year 1.9 4.6
2 years 8.6 8.4
3 years 9.1 9.0
4 years 8.2 8.0
5 years 11.1 10.3
6 years 9.6 9.3
7 years 10.6 10.2
10 years 9.9 9.9
Inception 11.8 10.0
Past performance is not necessarily indicative of future performance
Approved (%) Actual (%)
Equity 00 - 60 44
Gsec / Debt
20 - 70 52
MMI /Others
00 - 40 4
Date of Inception
AUM (in Lakhs)
NAV
Fund Manager
Benchmark Details
Modified Duration
Asset Allocation
Performance Meter
27th June 2003
8,121.02
56.2154
Equity : Rohit Agarwal Debt : KunalShah
Equity - 30% (BSE 100);Debt - 70% (CRISIL Bond)
Debt & MoneyMarket Instruments : 5.28
Holdings % to Fund
EQUITY 43.86
Infosys Ltd 3.01
Reliance Industries Ltd 2.99
ICICI Bank Ltd 2.59
HDFC Bank Ltd 2.49
I T C Ltd 2.02
Reliance ETF Bank Bees 1.91
KotakBankingETF-DividendPayoutOption 1.90
Larsen And Toubro Ltd 1.72
Mahindra & Mahindra Ltd 1.60
Axis Bank Ltd 1.37
Hindustan Unilever Ltd 1.32
IndusInd Bank Ltd 1.28
Tech Mahindra Ltd 1.24
Britannia Industries Ltd 1.04
State Bank of India 0.94
Maruti Suzuki India Ltd 0.84
Mahindra & Mahindra Financial Services Ltd 0.83
Asian Paints Ltd 0.83
SBI ETF Nifty Bank 0.80
HCL Technologies Ltd 0.79
Others 12.40
G-Sec 25.51
7.72% GOI - 26.10.2055 2.71
8.13% GOI - 22.06.2045 2.48
7.06% GOI - 10.10.2046 2.24
8.70% REC - 28.09.2028 2.03
8.54% REC - 15.11.2028 1.63
8.58% GJ SDL - 31.10.2028 1.60
1.44% INFLATION INDEX GS 2023 1.36
8.18% NABARD - 26.12.2028 1.35
8.37% MP SDL - 05.12.2028 0.90
8.15% TN SDL -09.05.2028 0.87
Others 8.34
Corporate Debt 26.14
7.4805%KotakMahindraPrimeLtd-11.06.2020 3.37
8.56% REC - 29.11.2028 1.38
11.08% HDFC - 13.04.2027 Set Down 13.04.20 - 7.78%
1.27
9.05% HDFC - 16.10.2028 1.26
9.05% HDFC - 20.11.2023 1.25
8.3750% EXIM- 24.07.2025 0.98
L&T Finance Ltd NSE Mibor +2% - 05.08.2019 0.92
Mahindra and Mahindra Financial Services Ltd Floater - 13.07
0.85
7.85% PFC - 03.04.2028 0.71
7.62% EXIM- 01.09.2026 0.71
Others 13.42
MMI 3.08
NCA 1.40
Portfolio
INDIVIDUAL FUNDKOTAK GUARANTEED BALANCED FUND(ULIF-010-27/06/03-GRTBALFND-107)
3,562
4,445
114
Equity Debt NCA
46.62
46.07
5.621.34
0.35Govt & GovtGuaranteed Bonds
AAA
TREPS & MutualFund Investments2
AA+
Fixed Deposit
12.38
1.72
2.02
2.91
2.99
3.10
3.13
5.47
7.19
10.11
48.99
Others
Civil engineering
Mfg of tobacco products
Mfg of chemicals andchemical products
Mfg of coke and refinedpetroleum products
Mfg of motor vehicles,trailers and semi-trailers
Wholesale trade, except ofmotor vehicles and
motorcycles
Computer programming,consultancy and related
activities
State Development Loan
Govt. of India
Financial and insuranceactivities
AS ON 31st DECEMBER 2018

Market Outlook Fund Performance Contents Individual Funds Group Funds
Investment ObjectiveAims to maximize opportunity for long term capital growth by holding significant portions in a diversified and flexible mix of large/medium sized stocks.
Debt Ratings Profile (%)
AUM (in Lakhs)
Sector Allocation as per NIC 2008 % to Fund**
**NIC 2008 - Industrial sector as defined under National Industrial Classification 2008.
MONTHLY UPDATE JANUARY 2019 | (based on last business day) 29
Pension Classic
Opportunities Fund (%)
Benchmark (%)
1 month 0.1 0.6
3 months 0.3 0.5
6 months -1.0 1.0
1 year -6.0 -0.5
2 years 12.9 15.1
3 years 10.7 11.3
4 years 8.9 7.9
5 years 15.2 13.0
6 years 13.2 11.5
7 years 15.7 14.1
10 years n.a n.a
Inception 12.0 8.6
Past performance is not necessarily indicative of future performance
Approved (%) Actual (%)
Equity 75 - 100 97
Gsec / Debt
00 - 25 0
MMI /Others
00 - 25 3
Date of Inception
AUM (in Lakhs)
NAV
Fund Manager
Benchmark Details
Modified Duration
Asset Allocation
Performance Meter
07th January 2010
10,340.23
27.7136
Equity : Rohit Agarwal Debt : KunalShah
Equity - 100% (BSE 200)
Debt & MoneyMarket Instruments : 0.01
Holdings % to Fund
EQUITY 96.82
Reliance Industries Ltd 6.45
Infosys Ltd 5.41
HDFC Bank Ltd 5.34
SBI ETF Nifty Bank 5.06
Larsen And Toubro Ltd 4.37
KotakBankingETF-DividendPayoutOption 4.12
Tata Consultancy Services Ltd 3.82
ICICI Bank Ltd 3.72
Axis Bank Ltd 3.12
I T C Ltd 2.86
Hindustan Unilever Ltd 2.78
Britannia Industries Ltd 2.43
Mahindra & Mahindra Ltd 2.32
Maruti Suzuki India Ltd 2.25
Aurobindo Pharma Ltd 2.18
Housing Development Finance Corp. Ltd 2.09
Tech Mahindra Ltd 1.83
State Bank of India 1.78
Bajaj Finance Ltd 1.65
Asian Paints Ltd 1.65
Others 31.59
Corporate Debt 0.04
7.40% HDFC Bank FD NSE - 17.08.2019 0.02
7.40% HDFC Bank FD NSE - 01.08.2019 0.02
7.40% HDFC Bank FD BSE - 01.08.2019 0.01
MMI 3.05
NCA 0.09
Portfolio
INDIVIDUAL FUNDPENSION CLASSIC OPPORTUNITIES FUND(ULIF-042-07/01/10-PNCLAOPFND-107)
10,012
319 10
Equity Debt NCA
98.74
1.26
TREPS & MutualFund Investments2
Fixed Deposit
14.48
2.80
2.86
2.87
3.87
4.42
5.60
6.98
7.46
11.05
37.60
Others
Warehousing andsupport activities for
transportation
Mfg of tobaccoproducts
Mfg of electricalequipment
Mfg ofpharmaceuticals,
medicinal chemical &botanical products
Civil engineering
Mfg of chemicals andchemical products
Mfg of motorvehicles, trailers and
semi-trailers
Mfg of coke andrefined petroleum
products
Computerprogramming,
consultancy andrelated activities
Financial andinsurance activities
AS ON 31st DECEMBER 2018

Market Outlook Fund Performance Contents Individual Funds Group Funds
Investment ObjectiveAims to maximize opportunity for long term capital growth by holding significant portions in a diversified and flexible mix of large/medium sized stocks
Debt Ratings Profile (%)
AUM (in Lakhs)
Sector Allocation as per NIC 2008 % to Fund**
**NIC 2008 - Industrial sector as defined under National Industrial Classification 2008.
MONTHLY UPDATE JANUARY 2019 | (based on last business day) 30
PensionOpportunities
Fund (%)
Benchmark (%)
1 month 0.05 0.6
3 months 0.1 0.5
6 months -1.4 1.0
1 year -6.7 -0.5
2 years 12.0 15.1
3 years 9.8 11.3
4 years 8.1 7.9
5 years 14.3 13.0
6 years 12.2 11.5
7 years 14.7 14.1
10 years n.a n.a
Inception 10.9 10.3
Past performance is not necessarily indicative of future performance
Approved (%) Actual (%)
Equity 75 - 100 94
Gsec / Debt
00 - 25 0
MMI /Others
00 - 25 6
Date of Inception
AUM (in Lakhs)
NAV
Fund Manager
Benchmark Details
Modified Duration
Asset Allocation
Performance Meter
17th July 2009
2,144.40
26.7289
Equity : Rohit Agarwal Debt : KunalShah
Equity - 100% (BSE 200)
Debt & MoneyMarket Instruments : 0.01
Holdings % to Fund
EQUITY 93.99
Reliance Industries Ltd 6.25
Infosys Ltd 5.30
HDFC Bank Ltd 5.22
SBI ETF Nifty Bank 4.91
Larsen And Toubro Ltd 4.25
KotakBankingETF-DividendPayoutOption 3.95
Tata Consultancy Services Ltd 3.75
ICICI Bank Ltd 3.22
Axis Bank Ltd 2.97
Hindustan Unilever Ltd 2.83
I T C Ltd 2.68
Britannia Industries Ltd 2.33
Mahindra & Mahindra Ltd 2.29
Aurobindo Pharma Ltd 2.10
Maruti Suzuki India Ltd 2.07
Housing Development Finance Corp. Ltd 2.01
Tech Mahindra Ltd 1.79
State Bank of India 1.75
Bajaj Finance Ltd 1.68
GAIL (India) Ltd 1.59
Others 31.05
Corporate Debt 0.06
7.40% HDFC Bank FD NSE - 01.08.2019 0.02
7.40% HDFC Bank FD NSE - 17.08.2019 0.02
7.40% HDFC Bank FD BSE - 01.08.2019 0.01
MMI 6.06
NCA -0.11
Portfolio
INDIVIDUAL FUNDKOTAK PENSION OPPORTUNITIES FUND(ULIF-032-17/07/09-PNOPPFND-107)
2,015
131 -2
Equity Debt NCA
99.01
0.99
TREPS & MutualFund Investments2
Fixed Deposit
14.05
2.68
2.82
2.91
3.83
4.30
5.48
6.57
7.22
10.83
39.30
Others
Mfg of tobacco products
Mfg of electricalequipment
Warehousing andsupport activities for
transportation
Mfg of pharmaceuticals,medicinal chemical &
botanical products
Civil engineering
Mfg of chemicals andchemical products
Mfg of motor vehicles,trailers and semi-trailers
Mfg of coke and refinedpetroleum products
Computer programming,consultancy and related
activities
Financial and insuranceactivities
AS ON 31st DECEMBER 2018

Market Outlook Fund Performance Contents Individual Funds Group Funds
Investment ObjectiveAims for a high level of capital growth by holding a significant portion in large sized company equities.
Debt Ratings Profile (%)
AUM (in Lakhs)
Sector Allocation as per NIC 2008 % to Fund**
**NIC 2008 - Industrial sector as defined under National Industrial Classification 2008.
MONTHLY UPDATE JANUARY 2019 | (based on last business day) 31
PensionFrontline
Equity Fund (%)
Benchmark (%)
1 month 0.3 0.4
3 months 0.5 0.2
6 months -0.1 1.6
1 year -2.9 1.2
2 years 13.4 15.4
3 years 10.8 11.3
4 years 9.1 7.5
5 years 14.6 12.0
6 years 13.1 11.0
7 years 15.1 13.5
10 years n.a n.a
Inception 11.4 8.3
Past performance is not necessarily indicative of future performance
Approved (%) Actual (%)
Equity 60 - 100 95
Gsec / Debt
00 - 40 0
MMI /Others
00 - 40 5
Date of Inception
AUM (in Lakhs)
NAV
Fund Manager
Benchmark Details
Modified Duration
Asset Allocation
Performance Meter
11th January 2010
2,320.57
26.3190
Equity : Rohit Agarwal Debt : KunalShah
Equity - 100% (BSE 100)
Debt & MoneyMarket Instruments : 0.01
Holdings % to Fund
EQUITY 95.15
Reliance Industries Ltd 6.60
Infosys Ltd 6.54
ICICI Bank Ltd 5.65
HDFC Bank Ltd 5.42
I T C Ltd 4.47
Reliance ETF Bank Bees 4.20
KotakBankingETF-DividendPayoutOption 3.96
Larsen And Toubro Ltd 3.80
Mahindra & Mahindra Ltd 3.52
Axis Bank Ltd 2.90
Hindustan Unilever Ltd 2.83
IndusInd Bank Ltd 2.74
Tech Mahindra Ltd 2.73
Asian Paints Ltd 1.79
HCL Technologies Ltd 1.78
Britannia Industries Ltd 1.75
Aurobindo Pharma Ltd 1.74
SBI ETF Nifty Bank 1.74
State Bank of India 1.73
Bata India Ltd 1.67
Others 27.60
Corporate Debt 0.04
7.40% HDFC Bank FD NSE - 17.08.2019 0.02
7.40% HDFC Bank FD NSE - 01.08.2019 0.02
7.40% HDFC Bank FD BSE - 01.08.2019 0.01
MMI 4.74
NCA 0.07
Portfolio
INDIVIDUAL FUNDPENSION FRONTLINE EQUITY FUND(ULIF-044-11/01/10-PNFRLEQFND-107)
2,208
111 2
Equity Debt NCA
99.17
0.83
TREPS & MutualFund Investments2
Fixed Deposit
13.64
2.52
2.73
2.85
3.80
4.47
6.37
6.43
6.60
11.99
38.61
Others
Mfg of rubber andplastics products
Mfg of food products
Mfg of pharmaceuticals,medicinal chemical &
botanical products
Civil engineering
Mfg of tobacco products
Mfg of chemicals andchemical products
Mfg of motor vehicles,trailers and semi-trailers
Mfg of coke and refinedpetroleum products
Computer programming,consultancy and related
activities
Financial and insuranceactivities
AS ON 31st DECEMBER 2018

Market Outlook Fund Performance Contents Individual Funds Group Funds
Investment ObjectiveAims to provide stable, long-term inflation beating growth over medium to long-term and defend capital against short-term capital shocks
Debt Ratings Profile (%)
AUM (in Lakhs)
Sector Allocation as per NIC 2008 % to Fund**
**NIC 2008 - Industrial sector as defined under National Industrial Classification 2008.
MONTHLY UPDATE JANUARY 2019 | (based on last business day) 32
PensionGuarantee Fund (%)
Benchmark (%)
1 month 0.6 1.0
3 months 1.5 2.8
6 months 3.8 4.1
1 year 4.2 5.1
2 years 9.5 9.1
3 years 8.7 9.2
4 years 6.4 7.9
5 years 9.1 10.3
6 years 7.5 9.4
7 years 8.6 10.4
10 years n.a n.a
Inception 7.0 8.6
Past performance is not necessarily indicative of future performance
Approved (%) Actual (%)
Equity 00 - 75 43
Gsec / Debt
00 - 100 50
MMI /Others
00 - 100 7
Date of Inception
AUM (in Lakhs)
NAV
Fund Manager
Benchmark Details
Modified Duration
Asset Allocation
Performance Meter
21st December 2009
9,436.72
18.4674
Equity : Rohit Agarwal Debt : KunalShah
Equity - 37.5% (Nifty);Debt - 62.5% (CRISIL Bond)
Debt & MoneyMarket Instruments : 4.87
Holdings % to Fund
EQUITY 43.22
Reliance Industries Ltd 3.86
HDFC Bank Ltd 3.14
I T C Ltd 2.55
Infosys Ltd 2.53
Housing Development Finance Corp. Ltd 2.23
Larsen And Toubro Ltd 2.04
Tata Consultancy Services Ltd 2.02
Hindustan Unilever Ltd 1.65
ICICI Bank Ltd 1.60
Maruti Suzuki India Ltd 1.36
Mahindra & Mahindra Ltd 1.01
Sun Pharmaceuticals Ltd 0.91
Asian Paints Ltd 0.79
Oil & Natural Gas Corporation Ltd 0.77
State Bank of India 0.76
Axis Bank Ltd 0.76
UltraTech Cement Ltd 0.74
Hero Honda Motors Ltd 0.73
National Thermal Power Corporation Ltd 0.67
Bajaj Auto Ltd 0.61
Others 12.48
G-Sec 24.68
7.72% GOI - 26.10.2055 2.35
8.13% GOI - 22.06.2045 2.14
7.06% GOI - 10.10.2046 1.88
8.70% REC - 28.09.2028 1.75
8.54% REC - 15.11.2028 1.40
8.58% GJ SDL - 31.10.2028 1.37
8.18% NABARD - 26.12.2028 1.16
9.37% MAH SDL - 04.12.2023 1.07
1.44% INFLATION INDEX GS 2023 1.04
8.15% GOI FCI Bonds - 16.10.22 0.81
Others 9.69
Corporate Debt 25.29
7.4805%KotakMahindraPrimeLtd-11.06.2020 3.42
9.05% HDFC - 16.10.2028 3.26
9.05% HDFC - 20.11.2023 3.23
8.13% PGC - 25.04.2020 2.12
8.56% REC - 29.11.2028 1.08
9.85% HDFC Bank 2019 - 17.03.2024 CALL 17.03.2019
0.74
Mahindra and Mahindra Financial Services Ltd Floater - 13.07
0.73
8.3750% EXIM- 24.07.2025 0.64
7.85% PFC - 03.04.2028 0.61
7.62% EXIM- 01.09.2026 0.61
Others 8.84
MMI 5.99
NCA 0.82
Portfolio
INDIVIDUAL FUNDPENSION GUARANTEE FUND(ULIF-038-21/12/09-PNGRTFND-107)
4,079
5,280
77
Equity Debt NCA
46.56
44.31
8.240.75
0.14Govt & GovtGuaranteed Bonds
AAA
TREPS & MutualFund Investments2
AA+
Fixed Deposit
10.99
2.15
2.55
2.75
3.21
4.65
4.72
5.93
8.33
10.86
43.86
Others
Mfg of basic metals
Mfg of tobaccoproducts
Mfg of motor vehicles,trailers and semi-
trailers
Mfg of chemicals andchemical products
Electricity, gas, steamand air conditioning
supply
Mfg of coke andrefined petroleum
products
Computerprogramming,
consultancy andrelated activities
State DevelopmentLoan
Govt. of India
Financial andinsurance activities
AS ON 31st DECEMBER 2018

Market Outlook Fund Performance Contents Individual Funds Group Funds
Investment ObjectiveAims for a high level of capital growth by holding a significant portion in large sized company equities.
Debt Ratings Profile (%)
AUM (in Lakhs)
Sector Allocation as per NIC 2008 % to Fund**
**NIC 2008 - Industrial sector as defined under National Industrial Classification 2008.
MONTHLY UPDATE JANUARY 2019 | (based on last business day) 33
PensionGrowth
Fund (%)
Benchmark (%)
1 month 1.0 1.1
3 months 2.7 3.0
6 months 2.8 4.1
1 year 1.1 4.2
2 years 9.3 9.4
3 years 9.2 9.4
4 years 8.1 8.0
5 years 11.4 10.6
6 years 9.8 9.6
7 years 11.0 10.7
10 years n.a n.a
Inception 10.7 10.7
Past performance is not necessarily indicative of future performance
Approved (%) Actual (%)
Equity 00 - 80 53
Gsec / Debt
20 - 60 39
MMI /Others
00 - 40 8
Date of Inception
AUM (in Lakhs)
NAV
Fund Manager
Benchmark Details
Modified Duration
Asset Allocation
Performance Meter
07th January 2009
1,848.64
27.5985
Equity : Rohit Agarwal Debt : KunalShah
Equity - 40% (BSE 100);Debt - 60% (CRISIL Bond)
Debt & MoneyMarket Instruments : 4.99
Holdings % to Fund
EQUITY 52.83
Reliance Industries Ltd 3.57
Infosys Ltd 3.53
ICICI Bank Ltd 3.16
HDFC Bank Ltd 2.61
I T C Ltd 2.43
KotakBankingETF-DividendPayoutOption 2.32
Reliance ETF Bank Bees 2.30
Larsen And Toubro Ltd 2.06
Mahindra & Mahindra Ltd 1.95
Hindustan Unilever Ltd 1.69
Axis Bank Ltd 1.64
IndusInd Bank Ltd 1.56
Tech Mahindra Ltd 1.52
Britannia Industries Ltd 1.24
State Bank of India 1.15
Maruti Suzuki India Ltd 0.98
SBI ETF Nifty Bank 0.97
Asian Paints Ltd 0.96
HCL Technologies Ltd 0.96
Mahindra & Mahindra Financial Services Ltd 0.95
Others 15.30
G-Sec 25.20
7.72% GOI - 26.10.2055 2.52
8.13% GOI - 22.06.2045 2.32
8.70% REC - 28.09.2028 2.23
8.15% GOI FCI Bonds - 16.10.22 2.21
7.06% GOI - 10.10.2046 2.09
8.54% REC - 15.11.2028 1.65
8.58% GJ SDL - 31.10.2028 1.51
8.18% NABARD - 26.12.2028 1.08
1.44% INFLATION INDEX GS 2023 0.91
8.37% MP SDL - 05.12.2028 0.84
Others 7.82
Corporate Debt 13.95
7.4805%KotakMahindraPrimeLtd-11.06.2020 3.18
8.56% REC - 29.11.2028 1.10
Mahindra and Mahindra Financial Services Ltd Floater - 13.07
1.07
7.85% PFC - 03.04.2028 1.05
10.08% IOT Utkal Energy Services Limited - 20.03.2026
0.58
9.39% LIC Housing Finance - 23.08.2024 - P - 26.08.15
0.55
8.65% PFC - 28.12.2024 0.55
8.57% REC - 21.12.2024 0.54
9.3434% Mahindra and Mahindra Financial Services Ltd- 17.03.
0.54
9.85% HDFC Bank 2019 - 17.03.2024 CALL 17.03.2019
0.54
Others 4.25
MMI 7.03
NCA 0.98
Portfolio
INDIVIDUAL FUNDKOTAK PENSION GROWTH FUND(ULIF-030-07/01/09-PNGWTFND-107)
977 854
18
Equity Debt NCA
54.56
29.85
15.230.37 Govt & Govt
Guaranteed Bonds
AAA
TREPS & MutualFund Investments2
Fixed Deposit
13.01
2.06
2.43
2.66
3.54
3.57
3.73
6.51
6.77
11.29
44.45
Others
Civil engineering
Mfg of tobaccoproducts
Wholesale trade,except of motor
vehicles andmotorcycles
Mfg of chemicals andchemical products
Mfg of coke andrefined petroleum
products
Mfg of motor vehicles,trailers and semi-
trailers
Computerprogramming,
consultancy andrelated activities
State DevelopmentLoan
Govt. of India
Financial andinsurance activities
AS ON 31st DECEMBER 2018

Market Outlook Fund Performance Contents Individual Funds Group Funds
Investment ObjectiveAims to provide stable, long-term inflation beating growth over medium to long-term and defend capital against short-term capital shocks.
Debt Ratings Profile (%)
AUM (in Lakhs)
Sector Allocation as per NIC 2008 % to Fund**
**NIC 2008 - Industrial sector as defined under National Industrial Classification 2008.
MONTHLY UPDATE JANUARY 2019 | (based on last business day) 34
Pension FloorFund (%)
Benchmark (%)
1 month 1.2 1.0
3 months 3.3 2.8
6 months 3.5 4.1
1 year 2.0 5.1
2 years 7.6 9.1
3 years 8.6 9.2
4 years 6.3 7.9
5 years 8.8 10.3
6 years 7.3 9.4
7 years 8.3 10.4
10 years n.a n.a
Inception 6.6 9.3
Past performance is not necessarily indicative of future performance
Approved (%) Actual (%)
Equity 00 - 75 38
Gsec / Debt
00 - 100 56
MMI /Others
00 - 40 6
Date of Inception
AUM (in Lakhs)
NAV
Fund Manager
Benchmark Details
Modified Duration
Asset Allocation
Performance Meter
13th July 2009
3,786.08
18.2691
Equity : Rohit Agarwal Debt : KunalShah
Equity - 37.5% (Nifty);Debt - 62.5% (CRISIL Bond)
Debt & MoneyMarket Instruments : 5.51
Holdings % to Fund
EQUITY 38.04
Reliance Industries Ltd 2.63
Infosys Ltd 2.62
ICICI Bank Ltd 2.26
HDFC Bank Ltd 2.16
I T C Ltd 1.76
Reliance ETF Bank Bees 1.71
KotakBankingETF-DividendPayoutOption 1.58
Larsen And Toubro Ltd 1.52
Mahindra & Mahindra Ltd 1.40
Axis Bank Ltd 1.15
Hindustan Unilever Ltd 1.11
IndusInd Bank Ltd 1.09
Tech Mahindra Ltd 1.08
Britannia Industries Ltd 0.91
State Bank of India 0.78
Mahindra & Mahindra Financial Services Ltd 0.74
Asian Paints Ltd 0.73
SBI ETF Nifty Bank 0.69
Aurobindo Pharma Ltd 0.69
HCL Technologies Ltd 0.69
Others 10.74
G-Sec 31.36
7.72% GOI - 26.10.2055 3.24
8.13% GOI - 22.06.2045 2.97
7.06% GOI - 10.10.2046 2.70
8.70% REC - 28.09.2028 2.45
8.54% REC - 15.11.2028 2.15
8.58% GJ SDL - 31.10.2028 1.91
1.44% INFLATION INDEX GS 2023 1.68
8.18% NABARD - 26.12.2028 1.58
8.37% MP SDL - 05.12.2028 1.08
8.22% NABARD - 13.12.2028 1.06
Others 10.55
Corporate Debt 25.06
7.4805%KotakMahindraPrimeLtd-11.06.2020 3.36
8.56% REC - 29.11.2028 1.88
8.3750% EXIM- 24.07.2025 1.32
Mahindra and Mahindra Financial Services Ltd Floater - 13.07
1.04
8.65% PFC - 28.12.2024 0.80
8.18% EXIM- 07.12.2025 0.78
7.85% PFC - 03.04.2028 0.77
7.62% EXIM- 01.09.2026 0.76
L&T Finance Ltd NSE Mibor +2% - 05.08.2019 0.66
9.39% LIC Housing Finance - 23.08.2024 - P - 26.08.15
0.54
Others 13.14
MMI 3.96
NCA 1.58
Portfolio
INDIVIDUAL FUNDKOTAK PENSION FLOOR FUND(ULIF-031-13/07/09-PNFLRFND-107)
1,440
2,286
60
Equity Debt NCA
9.80
1.58
1.76
2.51
2.57
2.63
3.31
4.77
8.60
12.36
50.11
Others
NCA
Mfg of tobacco products
Mfg of chemicals andchemical products
Mfg of motor vehicles,trailers and semi-trailers
Mfg of coke and refinedpetroleum products
Electricity, gas, steamand air conditioning
supply
Computer programming,consultancy and related
activities
State Development Loan
Govt. of India
Financial and insuranceactivities
AS ON 31st DECEMBER 2018
51.94
39.26
6.56
1.920.33
Govt & GovtGuaranteed Bonds
AAA
TREPS & MutualFund Investments2
AA+
Fixed Deposit

Market Outlook Fund Performance Contents Individual Funds Group Funds
Investment ObjectiveAims to provide stable, long-term inflation beating growth over medium to long-term and defend capital against short-term capital shocks.
Debt Ratings Profile (%)
AUM (in Lakhs)
Sector Allocation as per NIC 2008 % to Fund**
**NIC 2008 - Industrial sector as defined under National Industrial Classification 2008.
MONTHLY UPDATE JANUARY 2019 | (based on last business day) 35
Pension Floor Fund II (%)
Benchmark (%)
1 month 1.3 1.0
3 months 3.4 2.8
6 months 3.8 4.1
1 year 2.4 5.1
2 years 8.1 9.1
3 years 8.9 9.2
4 years 6.5 7.9
5 years 9.1 10.3
6 years 7.5 9.4
7 years 8.6 10.4
10 years n.a n.a
Inception 7.0 8.4
Past performance is not necessarily indicative of future performance
Approved (%) Actual (%)
Equity 00 - 75 38
Gsec / Debt
00 - 100 57
MMI /Others
00 - 40 5
Date of Inception
AUM (in Lakhs)
NAV
Fund Manager
Benchmark Details
Modified Duration
Asset Allocation
Performance Meter
08th January 2010
5,797.16
18.3923
Equity : Rohit Agarwal Debt : KunalShah
Equity - 37.5% (Nifty);Debt - 62.5% (CRISIL Bond)
Debt & MoneyMarket Instruments : 5.53
Holdings % to Fund
EQUITY 38.30
Infosys Ltd 2.63
Reliance Industries Ltd 2.61
ICICI Bank Ltd 2.31
HDFC Bank Ltd 2.10
KotakBankingETF-DividendPayoutOption 1.81
I T C Ltd 1.77
Larsen And Toubro Ltd 1.50
Reliance ETF Bank Bees 1.45
Mahindra & Mahindra Ltd 1.43
Hindustan Unilever Ltd 1.16
Axis Bank Ltd 1.16
IndusInd Bank Ltd 1.14
Tech Mahindra Ltd 1.09
Britannia Industries Ltd 0.91
Mahindra & Mahindra Financial Services Ltd 0.73
Maruti Suzuki India Ltd 0.72
SBI ETF Nifty Bank 0.71
Asian Paints Ltd 0.71
HCL Technologies Ltd 0.70
Aurobindo Pharma Ltd 0.68
Others 10.99
G-Sec 31.60
7.72% GOI - 26.10.2055 3.29
8.13% GOI - 22.06.2045 3.04
7.06% GOI - 10.10.2046 2.74
8.70% REC - 28.09.2028 2.49
8.58% GJ SDL - 31.10.2028 1.96
8.54% REC - 15.11.2028 1.93
1.44% INFLATION INDEX GS 2023 1.87
8.18% NABARD - 26.12.2028 1.55
8.37% MP SDL - 05.12.2028 1.07
8.15% TN SDL -09.05.2028 1.04
Others 10.62
Corporate Debt 25.10
7.4805%KotakMahindraPrimeLtd-11.06.2020 3.55
9.05% HDFC - 16.10.2028 1.77
8.56% REC - 29.11.2028 1.58
8.3750% EXIM- 24.07.2025 1.21
Mahindra and Mahindra Financial Services Ltd Floater - 13.07
1.02
7.85% PFC - 03.04.2028 1.00
L&T Finance Ltd NSE Mibor +2% - 05.08.2019 0.86
7.62% EXIM- 01.09.2026 0.83
8.65% PFC - 28.12.2024 0.70
9.85% HDFC Bank 2019 - 17.03.2024 CALL 17.03.2019
0.69
Others 11.89
MMI 3.45
NCA 1.55
Portfolio
INDIVIDUAL FUNDPENSION FLOOR FUND II(ULIF-043-08/01/10-PNFLRKFND2-107)
2,220
3,487
90
Equity Debt NCA
52.54
39.93
5.741.60
0.21Govt & GovtGuaranteed Bonds
AAA
TREPS & MutualFund Investments2
AA+
Fixed Deposit
9.98
1.55
1.77
2.46
2.51
2.61
2.74
4.79
9.08
12.76
49.74
Others
NCA
Mfg of tobacco products
Electricity, gas, steamand air conditioning
supply
Mfg of chemicals andchemical products
Mfg of coke and refinedpetroleum products
Mfg of motor vehicles,trailers and semi-trailers
Computer programming,consultancy and related
activities
State Development Loan
Govt. of India
Financial and insuranceactivities
AS ON 31st DECEMBER 2018

Market Outlook Fund Performance Contents Individual Funds Group Funds
Investment ObjectiveAims for moderate growth by holding a diversified mix of equities and fixed interest instruments.
Debt Ratings Profile (%)
AUM (in Lakhs)
Sector Allocation as per NIC 2008 % to Fund**
**NIC 2008 - Industrial sector as defined under National Industrial Classification 2008.
MONTHLY UPDATE JANUARY 2019 | (based on last business day) 36
Pension BalancedFund (%)
Benchmark (%)
1 month 1.2 1.3
3 months 3.1 3.5
6 months 3.3 4.5
1 year 1.4 4.6
2 years 8.3 8.4
3 years 8.9 9.0
4 years 8.1 8.0
5 years 11.0 10.3
6 years 9.5 9.3
7 years 10.5 10.2
10 years 9.7 9.9
Inception 11.8 10.0
Past performance is not necessarily indicative of future performance
Approved (%) Actual (%)
Equity 00 - 60 45
Gsec / Debt
20 - 70 49
MMI /Others
00 - 40 7
Date of Inception
AUM (in Lakhs)
NAV
Fund Manager
Benchmark Details
Modified Duration
Asset Allocation
Performance Meter
27th June 2003
9,854.47
56.8578
Equity : Rohit Agarwal Debt : KunalShah
Equity - 30% (BSE 100);Debt - 70% (CRISIL Bond)
Debt & MoneyMarket Instruments : 5.13
Holdings % to Fund
EQUITY 44.59
Infosys Ltd 3.14
Reliance Industries Ltd 2.92
ICICI Bank Ltd 2.58
HDFC Bank Ltd 2.48
I T C Ltd 2.18
Larsen And Toubro Ltd 1.87
KotakBankingETF-DividendPayoutOption 1.80
Reliance ETF Bank Bees 1.66
Axis Bank Ltd 1.60
Mahindra & Mahindra Ltd 1.39
Tech Mahindra Ltd 1.38
Hindustan Unilever Ltd 1.37
IndusInd Bank Ltd 1.35
State Bank of India 1.00
Britannia Industries Ltd 0.92
Asian Paints Ltd 0.85
SBI ETF Nifty Bank 0.84
Aurobindo Pharma Ltd 0.81
Bata India Ltd 0.81
Mahindra & Mahindra Financial Services Ltd 0.77
Others 12.86
G-Sec 26.08
7.72% GOI - 26.10.2055 2.56
1.44% INFLATION INDEX GS 2023 2.53
8.13% GOI - 22.06.2045 2.36
7.06% GOI - 10.10.2046 2.21
8.70% REC - 28.09.2028 1.88
8.54% REC - 15.11.2028 1.55
8.18% NABARD - 26.12.2028 1.11
8.58% GJ SDL - 31.10.2028 1.04
8.37% MP SDL - 05.12.2028 0.86
8.15% TN SDL -09.05.2028 0.80
Others 9.18
Corporate Debt 22.60
11.08% HDFC - 13.04.2027 Set Down 13.04.20 - 7.78%
1.04
8.3750% EXIM- 24.07.2025 0.91
8.56% REC - 29.11.2028 0.83
Mahindra and Mahindra Financial Services Ltd Floater - 13.07
0.80
8.65% PFC - 28.12.2024 0.72
10.08% IOT Utkal Energy Services Limited - 20.03.2022
0.59
7.62% EXIM- 01.09.2026 0.58
9.85% HDFC Bank 2019 - 17.03.2024 CALL 17.03.2019
0.51
L&T Finance Ltd NSE Mibor +2% - 05.08.2019 0.51
9.39% LIC Housing Finance - 23.08.2024 - P - 26.08.15
0.41
Others 15.69
MMI 4.31
NCA 2.42
Portfolio
INDIVIDUAL FUNDKOTAK PENSION BALANCED FUND(ULIF-011-27/06/03-PNBALFND-107)
4,394
5,222
238
Equity Debt NCA
49.21
40.88
8.14
1.000.57
0.19 Govt & GovtGuaranteed BondsAAA
TREPS & MutualFund Investments2Fixed Deposit
AA+
AA-
14.37
2.18
2.41
2.42
2.92
3.29
3.79
5.33
7.11
11.29
44.89
Others
Mfg of tobaccoproducts
Mfg of motor vehicles,trailers and semi-
trailers
NCA
Mfg of coke andrefined petroleum
products
Mfg of chemicals andchemical products
Electricity, gas, steamand air conditioning
supply
Computerprogramming,
consultancy andrelated activities
State DevelopmentLoan
Govt. of India
Financial andinsurance activities
AS ON 31st DECEMBER 2018

Market Outlook Fund Performance Contents Individual Funds Group Funds
Investment ObjectiveAims for moderate growth by holding a diversified mix of equities and fixed interest instruments.
Debt Ratings Profile (%)
AUM (in Lakhs)
Sector Allocation as per NIC 2008 % to Fund**
**NIC 2008 - Industrial sector as defined under National Industrial Classification 2008.
MONTHLY UPDATE JANUARY 2019 | (based on last business day) 37
PensionBalanced
Fund II (%)
Benchmark (%)
1 month 0.8 0.9
3 months 2.1 2.1
6 months 2.4 3.3
1 year 0.8 3.3
2 years 9.6 11.4
3 years 9.4 10.1
4 years 8.3 7.9
5 years 12.1 11.1
6 years 10.8 10.2
7 years 12.2 11.7
10 years n.a n.a
Inception 9.5 8.7
Past performance is not necessarily indicative of future performance
Approved (%) Actual (%)
Equity 30 - 60 54
Gsec / Debt
20 - 70 33
MMI /Others
00 - 40 13
Date of Inception
AUM (in Lakhs)
NAV
Fund Manager
Benchmark Details
Modified Duration
Asset Allocation
Performance Meter
24th January 2010
359.85
22.4521
Equity : Rohit Agarwal Debt : KunalShah
Equity - 60% (BSE 100);Debt - 40% (CRISIL Bond)
Debt & MoneyMarket Instruments : 4.32
Holdings % to Fund
EQUITY 54.07
Infosys Ltd 3.79
Reliance Industries Ltd 3.61
ICICI Bank Ltd 3.35
HDFC Bank Ltd 2.97
KotakBankingETF-DividendPayoutOption 2.38
I T C Ltd 2.36
Mahindra & Mahindra Ltd 2.09
Axis Bank Ltd 1.98
Larsen And Toubro Ltd 1.96
Reliance ETF Bank Bees 1.95
IndusInd Bank Ltd 1.67
Hindustan Unilever Ltd 1.64
Tech Mahindra Ltd 1.60
State Bank of India 1.24
Britannia Industries Ltd 1.21
HCL Technologies Ltd 1.05
SBI ETF Nifty Bank 1.03
Maruti Suzuki India Ltd 1.00
Bata India Ltd 0.97
Asian Paints Ltd 0.95
Others 15.29
G-Sec 21.81
8.56% NABARD - 14.11.2028 2.85
8.47% NABARD - 31.08.2033 2.83
7.72% GOI - 26.10.2055 2.35
8.13% GOI - 22.06.2045 2.11
7.06% GOI - 10.10.2046 1.91
8.15% GOI FCI Bonds - 16.10.22 1.42
8.58% GJ SDL - 31.10.2028 1.35
1.44% INFLATION INDEX GS 2023 0.87
8.37% MP SDL - 05.12.2028 0.77
8.15% TN SDL -09.05.2028 0.74
Others 4.61
Corporate Debt 10.98
9.36% IDFC Bank - 21.08.24 2.80
9.61% REC - 03.01.2019 2.78
7.4805%KotakMahindraPrimeLtd-11.06.2020 2.72
10.08% IOT Utkal Energy Services Limited - 20.03.2026
0.60
10.08% IOT Utkal Energy Services Limited - 20.03.2025
0.59
10.08% IOT Utkal Energy Services Limited - 20.03.2024
0.59
10.08% IOT Utkal Energy Services Limited - 20.03.2027
0.30
10.08% IOT Utkal Energy Services Limited - 20.03.2023
0.29
10.08% IOT Utkal Energy Services Limited - 20.03.2022
0.29
7.40% HDFC Bank FD NSE - 17.08.2019 0.01
Others 0.01
MMI 11.12
NCA 2.02
Portfolio
INDIVIDUAL FUNDPENSION BALANCED FUND II(ULIF-046-24/01/10-PNBALFND2-107)
195 158
7
Equity Debt NCA
49.6825.32
18.58
6.37 0.06Govt & GovtGuaranteed Bonds
TREPS & MutualFund Investments2
AAA
AA+
Fixed Deposit
13.96
2.02
2.36
2.79
3.45
3.61
3.90
6.40
6.95
9.74
44.84
Others
NCA
Mfg of tobaccoproducts
Wholesale trade,except of motor
vehicles andmotorcycles
Mfg of chemicals andchemical products
Mfg of coke andrefined petroleum
products
Mfg of motor vehicles,trailers and semi-
trailers
State DevelopmentLoan
Computerprogramming,
consultancy andrelated activities
Govt. of India
Financial andinsurance activities
AS ON 31st DECEMBER 2018

Market Outlook Fund Performance Contents Individual Funds Group Funds
Investment ObjectiveAims to preserve capital and minimize downside risk, with investment in debt and government instruments.
Debt Ratings Profile (%)
AUM (in Lakhs)
Sector Allocation as per NIC 2008 % to Fund**
**NIC 2008 - Industrial sector as defined under National Industrial Classification 2008.
MONTHLY UPDATE JANUARY 2019 | (based on last business day) 38
PensionBond Fund
(%)
Benchmark (%)
1 month 2.1 1.6
3 months 5.8 4.8
6 months 6.8 5.7
1 year 6.4 5.9
2 years 4.9 5.3
3 years 7.9 7.8
4 years 7.6 8.0
5 years 9.2 9.2
6 years 8.1 8.3
7 years 8.7 8.5
10 years 8.4 7.4
Inception 8.4 6.6
Past performance is not necessarily indicative of future performance
Approved (%) Actual (%)
Gsec 00 - 75 53
Debt 25 - 100 44
MMI /Others
00 - 40 3
Date of Inception
AUM (in Lakhs)
NAV
Fund Manager
Benchmark Details
Modified Duration
Asset Allocation
Performance Meter
15th April 2004
4,977.80
32.8931
Debt : KunalShah
Equity - 0% (NA);Debt - 100% (CRISIL Bond)
Debt & MoneyMarket Instruments : 6.05
Holdings % to Fund
G-Sec 53.13
7.72% GOI - 26.10.2055 6.00
8.13% GOI - 22.06.2045 5.46
8.70% REC - 28.09.2028 4.76
8.54% REC - 15.11.2028 3.68
8.58% GJ SDL - 31.10.2028 3.62
7.06% GOI - 10.10.2046 3.57
1.44% INFLATION INDEX GS 2023 3.25
8.18% NABARD - 26.12.2028 2.40
8.37% MP SDL - 05.12.2028 1.99
8.15% TN SDL -09.05.2028 1.90
Others 16.49
Corporate Debt 43.85
7.4805%KotakMahindraPrimeLtd-11.06.2020 3.74
8.56% REC - 29.11.2028 2.87
9.05% HDFC - 16.10.2028 2.06
Mahindra and Mahindra Financial Services Ltd Floater - 13.07
1.99
8.3750% EXIM- 24.07.2025 1.81
7.85% PFC - 03.04.2028 1.55
8.65% PFC - 28.12.2024 1.42
8.18% EXIM- 07.12.2025 1.39
7.62% EXIM- 01.09.2026 1.35
9.3434% Mahindra and Mahindra Financial Services Ltd- 17.03.
0.81
Others 24.88
MMI 0.50
NCA 2.52
Portfolio
INDIVIDUAL FUNDKOTAK PENSION BOND FUND(ULIF-017-15/04/04-PNBNDFND-107)
4,852
125
Debt NCA
54.50
44.17
0.81 0.52 Govt & GovtGuaranteed Bonds
AAA
AA+
TREPS & MutualFund Investments2
2.52
3.13
5.90
15.09
21.17
52.20
NCA
Wholesale trade, exceptof motor vehicles and
motorcycles
Electricity, gas, steamand air conditioning
supply
State Development Loan
Govt. of India
Financial and insuranceactivities
AS ON 31st DECEMBER 2018

Market Outlook Fund Performance Contents Individual Funds Group Funds
Investment ObjectiveAims to preserve your capital and minimize your downside risk, with investment in debt and government instruments.
Debt Ratings Profile (%)
AUM (in Lakhs)
Sector Allocation as per NIC 2008 % to Fund**
**NIC 2008 - Industrial sector as defined under National Industrial Classification 2008.
MONTHLY UPDATE JANUARY 2019 | (based on last business day) 39
PensionGilt Fund
(%)
Benchmark (%)
1 month 2.1 1.9
3 months 6.6 5.8
6 months 7.8 7.4
1 year 8.0 8.4
2 years 5.3 6.1
3 years 8.5 8.6
4 years 8.1 8.5
5 years 9.9 9.8
6 years 8.5 8.8
7 years 8.9 9.2
10 years 7.2 7.3
Inception 7.6 7.6
Past performance is not necessarily indicative of future performance
Approved (%) Actual (%)
Gsec 80 - 100 97
MMI /Others
00 - 40 3
Date of Inception
AUM (in Lakhs)
NAV
Fund Manager
Benchmark Details
Modified Duration
Asset Allocation
Performance Meter
27th June 2003
674.98
31.1592
Debt : KunalShah
Equity - 0% (NA);Debt - 100% (IBEX)
Debt & MoneyMarket Instruments : 6.57
Holdings % to Fund
G-Sec 96.95
7.72% GOI - 26.10.2055 14.42
7.06% GOI - 10.10.2046 6.62
9.23% GOI - 23.12.2043 6.35
8.13% GOI - 22.06.2045 5.11
8.01% RJ SPL SDL - 23.06.2020 5.04
7.71% GJ SDL - 01.03.2027 4.56
7.38% MP SDL - 14.09.2026 4.47
8.58% GJ SDL - 31.10.2028 3.46
8.99% MP SDL - 07.03.2022 3.44
9.11% MP SDL - 28.05.2024 3.10
Others 40.39
MMI 0.74
NCA 2.31
Portfolio
INDIVIDUAL FUNDKOTAK PENSION GILT FUND(ULIF-008-27/06/03-PNGLTFND-107)
659
16
Debt NCA
99.24
0.76
Govt & GovtGuaranteed Bonds
TREPS & MutualFund Investments2
0.74
2.31
41.96
54.99
Financial andinsurance activities
NCA
Govt. of India
State DevelopmentLoan
AS ON 31st DECEMBER 2018

Market Outlook Fund Performance Contents Individual Funds Group Funds
Investment ObjectiveAims to preserve capital and minimize downside risk, with investment in debt and government instruments.
Debt Ratings Profile (%)
AUM (in Lakhs)
Sector Allocation as per NIC 2008 % to Fund**
**NIC 2008 - Industrial sector as defined under National Industrial Classification 2008.
MONTHLY UPDATE JANUARY 2019 | (based on last business day) 40
PensionFloating Rate
Fund (%)
Benchmark (%)
1 month 1.0 0.6
3 months 3.0 1.9
6 months 4.3 3.8
1 year 5.9 7.6
2 years 5.4 7.1
3 years 6.4 7.2
4 years 6.7 7.5
5 years 7.5 7.8
6 years 8.0 8.0
7 years 8.1 8.1
10 years 7.4 7.5
Inception 7.4 7.2
Past performance is not necessarily indicative of future performance
Approved (%) Actual (%)
Gsec 00 - 75 43
Debt 25 - 100 43
MMI /Others
00 - 40 14
Date of Inception
AUM (in Lakhs)
NAV
Fund Manager
Benchmark Details
Modified Duration
Asset Allocation
Performance Meter
07th December 2004
230.99
27.3040
Debt : KunalShah
Equity - 0% (NA);Debt - 100% (CRISIL Liquid)
Debt & MoneyMarket Instruments : 2.01
Holdings % to Fund
G-Sec 42.62
9.37% MAH SDL - 04.12.2023 8.56
8.92% RJ SDL - 21.11.2022 5.39
8.38% MAH SDL - 25.03.2020 3.28
8.28% TN SDL - 09.09.2019 2.57
8.23% GJ SDL - 07.10.2019 2.39
8.85% TN SDL - 17.10.2022 2.38
9.65% TN SDL - 12.03.2024 2.22
8.51% PN SDL - 10.04.2023 2.19
8.39% RJ SPL SDL - 15.03.2022 2.02
8.30% Fertilizer Co GOI - 07.12.23 1.78
Others 9.84
Corporate Debt 43.29
FRB G - 21.12.2020 26.08
Shriram Transport Finance Co Ltd Floater - 19.07.19
8.65
Mahindra and Mahindra Financial Services Ltd Floater - 13.07
8.56
MMI 11.94
NCA 2.15
Portfolio
INDIVIDUAL FUNDKOTAK PENSION FLOATING RATE FUND(ULIF-022-07/12/04-PNFLTRFND-107)
226
5
Debt NCA
73.64
8.84
8.75
6.562.21 Govt & Govt
Guaranteed Bonds
AA+
AAA
A1+
TREPS & MutualFund Investments2
2.15
25.80
33.79
38.27
NCA
Financial and insuranceactivities
Govt. of India
State Development Loan
AS ON 31st DECEMBER 2018

Market Outlook Fund Performance Contents Individual Funds Group Funds
Investment ObjectiveAims to protect your capital and not have downside risks
Debt Ratings Profile (%)
AUM (in Lakhs)
Sector Allocation as per NIC 2008 % to Fund**
**NIC 2008 - Industrial sector as defined under National Industrial Classification 2008.
MONTHLY UPDATE JANUARY 2019 | (based on last business day) 41
PensionMoneyMarket
Fund II (%)
Benchmark (%)
1 month 0.6 0.6
3 months 1.7 1.9
6 months 3.4 3.8
1 year 6.5 7.6
2 years 6.4 7.1
3 years 6.8 7.2
4 years 7.2 7.5
5 years 7.5 7.8
6 years 7.6 8.0
7 years 7.9 8.1
10 years n.a n.a
Inception 7.5 7.8
Past performance is not necessarily indicative of future performance
Approved (%) Actual (%)
MMI /Others
100 100
Date of Inception
AUM (in Lakhs)
NAV
Fund Manager
Benchmark Details
Modified Duration
Asset Allocation
Performance Meter
28th December 2009
934.00
19.1940
Debt : KunalShah
Equity - 0% (NA);Debt - 100% (CRISIL Liquid)
Debt & MoneyMarket Instruments : 0.52
Holdings % to Fund
MMI 99.75
NCA 0.25
Portfolio
INDIVIDUAL FUNDPENSION MONEY MARKET FUND II(ULIF-039-28/12/09-PNMNMKFND-107)
932
2.37
Debt NCA
46.73
45.75
7.51Govt & GovtGuaranteed Bonds
A1+
TREPS & MutualFund Investments2
0.25
7.93
45.20
46.62
NCA
Mfg of coke and refinedpetroleum products
Financial and insuranceactivities
Govt. of India
AS ON 31st DECEMBER 2018

Market Outlook Fund Performance Contents Individual Funds Group Funds
Investment ObjectiveAims for a high level of capital growth by holding a significant portion in equities. May experience high levels of shorter term volatility (downside risk).
Debt Ratings Profile (%)
AUM (in Lakhs)
Sector Allocation as per NIC 2008 % to Fund**
**NIC 2008 - Industrial sector as defined under National Industrial Classification 2008.
MONTHLY UPDATE JANUARY 2019 | (based on last business day) 42
KotakAdvantageMultiplier Fund II (%)
Benchmark (%)
1 month 0.5 0.8
3 months 2.5 2.1
6 months 3.6 3.6
1 year 3.6 4.7
2 years 2.6 10.3
3 years 3.0 9.6
4 years 3.5 7.8
5 years 4.2 10.6
6 years 4.2 9.8
7 years 4.9 11.0
10 years 5.0 11.1
Inception 4.8 8.9
Past performance is not necessarily indicative of future performance
Approved (%) Actual (%)
Equity 00 - 100 -
Gsec / Debt
00 - 100 88
MMI /Others
00 - 40 12
Date of Inception
AUM (in Lakhs)
NAV
Fund Manager
Benchmark Details
Modified Duration
Asset Allocation
Performance Meter
21st April 2006
0.41
18.1686
Equity : Rohit Agarwal Debt : KunalShah
Equity - 50% (Nifty);Debt - 50% (CRISIL Bond)
Debt & MoneyMarket Instruments : 2.36
Holdings % to Fund
G-Sec 88.01
8.56% TN SDL - 22.06.2021 79.75
9.20% GOI - 30.09.2030 8.26
NCA 11.99
Portfolio
INDIVIDUAL FUNDKOTAK ADVANTAGE MULTIPLIER FUND II(ULIF-026-21/04/06-ADVMULFND2-107)
0.36
0.05
Debt NCA
100.00
Govt & GovtGuaranteed Bonds
8.26
11.99
79.75
Govt. of India
NCA
State DevelopmentLoan
AS ON 31st DECEMBER 2018

Market Outlook Fund Performance Contents Individual Funds Group Funds
Investment ObjectiveAims to provide secure returns to policies in the discontinued state, by investing in low- risk debt instruments.
Debt Ratings Profile (%)
AUM (in Lakhs)
Sector Allocation as per NIC 2008 % to Fund**
**NIC 2008 - Industrial sector as defined under National Industrial Classification 2008.
MONTHLY UPDATE JANUARY 2019 | (based on last business day) 43
DiscontinuedPolicy Fund
(%)
Benchmark (%)
1 month 0.5 0.6
3 months 1.5 1.9
6 months 3.1 3.8
1 year 6.1 7.6
2 years 6.0 7.1
3 years 6.3 7.2
4 years 6.6 7.5
5 years 7.1 7.8
6 years 7.3 8.0
7 years 7.7 8.1
10 years n.a n.a
Inception 7.6 8.1
Past performance is not necessarily indicative of future performance
Approved (%) Actual (%)
Gsec 60 - 100 79
MMI /Others
00 - 40 21
Date of Inception
AUM (in Lakhs)
NAV
Fund Manager
Benchmark Details
Modified Duration
Asset Allocation
Performance Meter
23rd March 2011
23,828.16
17.7009
Debt : KunalShah
Debt - 100% (CRISIL Liquid)
Debt & MoneyMarket Instruments : 0.24
Holdings % to Fund
G-Sec 78.51
364 Days T Bill - 03.01.2019 31.46
364 Days T Bill - 17.01.2019 21.34
364 Days T Bill - 18.10.2019 12.18
364 Days T Bill - 13.06.2019 8.95
364 Days T Bill - 10.10.2019 4.57
MMI 21.48
NCA 0.02
Portfolio
INDIVIDUAL FUNDDISCONTINUED POLICY FUND(ULIF-050-23/03/11-DISPOLFND-107)
23,824
4.38
Debt NCA
78.52
16.15
5.33Govt & GovtGuaranteed Bonds
A1+
TREPS & MutualFund Investments2
0.02
6.63
14.84
78.51
NCA
Mfg of coke andrefined petroleum
products
Financial andinsurance activities
Govt. of India
AS ON 31st DECEMBER 2018
Market Outlook Fund Performance Contents Individual Funds Group Funds
MONTHLY UPDATE JANUARY 2019 | (based on last business day) 44
GROUP FUNDS
KOTAK GROUPDYNAMIC FLOOR FUND
KOTAK GROUPBALANCED FUND
KOTAK GROUP BOND FUND
KOTAK GROUP GILT FUND
KOTAK GROUPFLOATING RATE FUND
KOTAK GROUP MONEY MARKET FUND
KOTAK GROUP SECURE CAPITAL FUND
KOTAK GROUP SHORT TERM BOND FUND
KOTAK GROUPPRUDENT FUND
AS ON 31st DECEMBER 2018

Market Outlook Fund Performance Contents Individual Funds Group Funds
MONTHLY UPDATE JANUARY 2019 | (based on last business day) 45
GROUP FUNDKOTAK GROUP DYNAMIC FLOOR FUND(ULGF-015-07/01/10-DYFLRFND-107)
AS ON 31st DECEMBER 2018
Investment ObjectiveAims to provide stable long term inflation beating growth over the medium to longer term and defend capital against short term capital shocks.Is likely to out-perform traditional balanced or equity funds during sideways or falling markets and shadow the rising equity markets.
Debt Ratings Profile (%)
AUM (in Lakhs)
Sector Allocation as per NIC 2008 % to Fund**
**NIC 2008 - Industrial sector as defined under National Industrial Classification 2008.
Kotak Group Dynamic Floor
Fund (%)
Benchmark (%)
1 month 1.4 1.10
3 months 3.9 3.2
6 months 4.4 4.5
1 year 3.5 5.3
2 years 7.4 8.3
3 years 8.5 8.9
4 years 6.4 7.9
5 years 9.0 10.1
6 years 7.5 9.2
7 years 8.5 10.0
10 years n.a n.a
Inception 6.9 8.3
Past performance is not necessarily indicative of future performance
Approved (%) Actual (%)
Equity 00 - 60 28
Gsec / Debt
00 - 100 62
MMI /Others
00 - 40 10
Date of Inception
AUM (in Lakhs)
NAV
Fund Manager
Benchmark Details
Modified Duration
Asset Allocation
Performance Meter
07th January 2010
374.53
29.4063
Equity: Rohit Agarwal Debt : KunalShah
Equity - 30% (Nifty)Debt - 70% (CRISIL Bond)
Debt & MoneyMarket Instruments : 5.49
Holdings % to Fund
EQUITY 28.49
Reliance Industries Ltd 1.89
Infosys Ltd 1.88
ICICI Bank Ltd 1.81
HDFC Bank Ltd 1.61
I T C Ltd 1.28
KotakBankingETF-DividendPayoutOption 1.21
Mahindra & Mahindra Ltd 1.09
Reliance ETF Bank Bees 1.07
Larsen And Toubro Ltd 1.07
Axis Bank Ltd 1.00
Hindustan Unilever Ltd 0.87
IndusInd Bank Ltd 0.86
Tech Mahindra Ltd 0.84
Britannia Industries Ltd 0.67
State Bank of India 0.64
SBI ETF Nifty Bank 0.54
HCL Technologies Ltd 0.53
Maruti Suzuki India Ltd 0.52
Bata India Ltd 0.51
Asian Paints Ltd 0.51
Others 8.09
G-Sec 38.36
7.72% GOI - 26.10.2055 3.59
8.13% GOI - 22.06.2045 3.34
9.20% GOI - 30.09.2030 3.01
7.06% GOI - 10.10.2046 3.00
8.70% REC - 28.09.2028 2.75
8.56% NABARD - 14.11.2028 2.73
8.15% GOI FCI Bonds - 16.10.22 2.73
8.47% NABARD - 31.08.2033 2.72
8.54% REC - 15.11.2028 2.72
8.58% GJ SDL - 31.10.2028 2.14
Others 9.64
Corporate Debt 23.61
9.30% PGC - 28.06.2023 3.47
8.85% PGC - 19.10.2021 3.39
8.90% PFC - 18.03.2028 2.73
8.63% REC - 25.08.2028 2.71
9.10% Shriram Transport Finance Co Ltd 12.07.2021
2.63
7.4805%KotakMahindraPrimeLtd-11.06.2020 2.61
7.85% PFC - 03.04.2028 2.58
7.62% EXIM- 01.09.2026 2.56
7.40% HDFC Bank FD NSE - 17.08.2019 0.38
7.40% HDFC Bank FD NSE - 01.08.2019 0.37
Others 0.18
MMI 6.67
NCA 2.87
Portfolio
107
257
11
Equity Debt NCA
7.23
1.28
1.84
1.89
2.04
2.87
3.51
7.19
8.76
18.67
44.72
Others
Mfg of tobacco products
Mfg of chemicals andchemical products
Mfg of coke and refinedpetroleum products
Mfg of motor vehicles,trailers and semi-trailers
NCA
Computer programming,consultancy and related
activities
Electricity, gas, steamand air conditioning
supply
State Development Loan
Govt. of India
Financial and insuranceactivities
55.88
29.23
9.723.83 1.34 Govt & Govt
Guaranteed Bonds
AAA
TREPS & MutualFund Investments2
AA+
Fixed Deposit
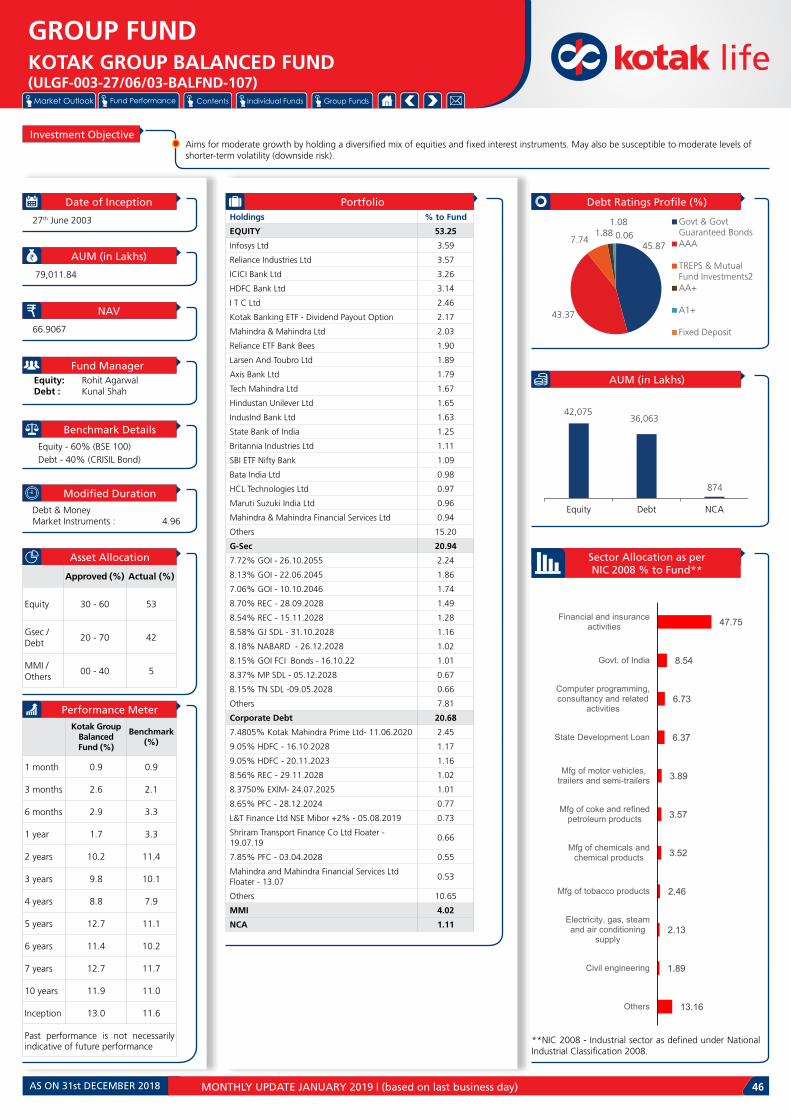
Market Outlook Fund Performance Contents Individual Funds Group Funds
MONTHLY UPDATE JANUARY 2019 | (based on last business day) 46
GROUP FUNDKOTAK GROUP BALANCED FUND(ULGF-003-27/06/03-BALFND-107)
AS ON 31st DECEMBER 2018
Investment ObjectiveAims for moderate growth by holding a diversified mix of equities and fixed interest instruments. May also be susceptible to moderate levels of shorter-term volatility (downside risk).
Debt Ratings Profile (%)
AUM (in Lakhs)
Sector Allocation as per NIC 2008 % to Fund**
**NIC 2008 - Industrial sector as defined under National Industrial Classification 2008.
Kotak Group Balanced Fund (%)
Benchmark (%)
1 month 0.9 0.9
3 months 2.6 2.1
6 months 2.9 3.3
1 year 1.7 3.3
2 years 10.2 11.4
3 years 9.8 10.1
4 years 8.8 7.9
5 years 12.7 11.1
6 years 11.4 10.2
7 years 12.7 11.7
10 years 11.9 11.0
Inception 13.0 11.6
Past performance is not necessarily indicative of future performance
Approved (%) Actual (%)
Equity 30 - 60 53
Gsec / Debt
20 - 70 42
MMI /Others
00 - 40 5
Date of Inception
AUM (in Lakhs)
NAV
Fund Manager
Benchmark Details
Modified Duration
Asset Allocation
Performance Meter
27th June 2003
79,011.84
66.9067
Equity: Rohit Agarwal Debt : KunalShah
Equity - 60% (BSE 100)Debt - 40% (CRISIL Bond)
Debt & MoneyMarket Instruments : 4.96
Holdings % to Fund
EQUITY 53.25
Infosys Ltd 3.59
Reliance Industries Ltd 3.57
ICICI Bank Ltd 3.26
HDFC Bank Ltd 3.14
I T C Ltd 2.46
KotakBankingETF-DividendPayoutOption 2.17
Mahindra & Mahindra Ltd 2.03
Reliance ETF Bank Bees 1.90
Larsen And Toubro Ltd 1.89
Axis Bank Ltd 1.79
Tech Mahindra Ltd 1.67
Hindustan Unilever Ltd 1.65
IndusInd Bank Ltd 1.63
State Bank of India 1.25
Britannia Industries Ltd 1.11
SBI ETF Nifty Bank 1.09
Bata India Ltd 0.98
HCL Technologies Ltd 0.97
Maruti Suzuki India Ltd 0.96
Mahindra & Mahindra Financial Services Ltd 0.94
Others 15.20
G-Sec 20.94
7.72% GOI - 26.10.2055 2.24
8.13% GOI - 22.06.2045 1.86
7.06% GOI - 10.10.2046 1.74
8.70% REC - 28.09.2028 1.49
8.54% REC - 15.11.2028 1.28
8.58% GJ SDL - 31.10.2028 1.16
8.18% NABARD - 26.12.2028 1.02
8.15% GOI FCI Bonds - 16.10.22 1.01
8.37% MP SDL - 05.12.2028 0.67
8.15% TN SDL -09.05.2028 0.66
Others 7.81
Corporate Debt 20.68
7.4805%KotakMahindraPrimeLtd-11.06.2020 2.45
9.05% HDFC - 16.10.2028 1.17
9.05% HDFC - 20.11.2023 1.16
8.56% REC - 29.11.2028 1.02
8.3750% EXIM- 24.07.2025 1.01
8.65% PFC - 28.12.2024 0.77
L&T Finance Ltd NSE Mibor +2% - 05.08.2019 0.73
Shriram Transport Finance Co Ltd Floater - 19.07.19
0.66
7.85% PFC - 03.04.2028 0.55
Mahindra and Mahindra Financial Services Ltd Floater - 13.07
0.53
Others 10.65
MMI 4.02
NCA 1.11
Portfolio
42,075 36,063
874
Equity Debt NCA
13.16
1.89
2.13
2.46
3.52
3.57
3.89
6.37
6.73
8.54
47.75
Others
Civil engineering
Electricity, gas, steamand air conditioning
supply
Mfg of tobacco products
Mfg of chemicals andchemical products
Mfg of coke and refinedpetroleum products
Mfg of motor vehicles,trailers and semi-trailers
State Development Loan
Computer programming,consultancy and related
activities
Govt. of India
Financial and insuranceactivities
45.87
43.37
7.741.88
1.080.06
Govt & GovtGuaranteed BondsAAA
TREPS & MutualFund Investments2AA+
A1+
Fixed Deposit

Market Outlook Fund Performance Contents Individual Funds Group Funds
MONTHLY UPDATE JANUARY 2019 | (based on last business day) 47
GROUP FUNDKOTAK GROUP BOND FUND(ULGF-004-15/04/04-BNDFND-107)
AS ON 31st DECEMBER 2018
Investment ObjectiveReturns will be in line with those of fixed interest instruments, and may provide little protection against unexpected inflation increases. Will pre-serve capital and minimize downside risk, with investment in debt and government instruments.
Debt Ratings Profile (%)
AUM (in Lakhs)
Sector Allocation as per NIC 2008 % to Fund**
**NIC 2008 - Industrial sector as defined under National Industrial Classification 2008.
Kotak Group Bond Fund
(%)
Benchmark (%)
1 month 2.1 1.6
3 months 5.9 4.8
6 months 7.0 5.7
1 year 6.9 5.9
2 years 5.5 5.3
3 years 8.4 7.8
4 years 8.1 8.0
5 years 9.7 9.2
6 years 8.6 8.3
7 years 9.2 8.5
10 years 9.1 7.4
Inception 8.9 6.6
Past performance is not necessarily indicative of future performance
Approved (%) Actual (%)
Gsec 00 - 75 49
Debt 25 - 100 48
MMI /Others
00 - 40 3
Date of Inception
AUM (in Lakhs)
NAV
Fund Manager
Benchmark Details
Modified Duration
Asset Allocation
Performance Meter
15th April 2004
1,30,703.08
35.2537
Debt : KunalShah
Equity - 0% (NA)Debt - 100% (CRISIL Bond)
Debt & MoneyMarket Instruments : 5.96
Holdings % to Fund
G-Sec 49.48
7.72% GOI - 26.10.2055 5.60
8.13% GOI - 22.06.2045 5.18
7.06% GOI - 10.10.2046 4.67
8.70% REC - 28.09.2028 4.33
8.54% REC - 15.11.2028 3.61
8.58% GJ SDL - 31.10.2028 3.35
8.18% NABARD - 26.12.2028 2.58
8.37% MP SDL - 05.12.2028 1.89
8.15% TN SDL -09.05.2028 1.84
8.22% NABARD - 13.12.2028 1.79
Others 14.67
Corporate Debt 47.67
7.4805%KotakMahindraPrimeLtd-11.06.2020 3.39
8.56% REC - 29.11.2028 2.85
9.05% HDFC - 20.11.2023 2.57
9.05% HDFC - 16.10.2028 2.36
8.3750% EXIM- 24.07.2025 2.13
Mahindra and Mahindra Financial Services Ltd Floater - 13.07
1.91
7.85% PFC - 03.04.2028 1.52
7.62% EXIM- 01.09.2026 1.49
L&T Finance Ltd NSE Mibor +2% - 05.08.2019 1.43
8.65% PFC - 28.12.2024 1.34
Others 26.68
MMI 0.11
NCA 2.74
Portfolio
1,27,116
3,587
Debt NCA
0.08
2.45
2.74
4.98
13.48
19.13
57.14
Mfg of basic metals
Wholesale trade, exceptof motor vehicles and
motorcycles
NCA
Electricity, gas, steamand air conditioning
supply
State DevelopmentLoan
Govt. of India
Financial and insuranceactivities
50.88
48.26
0.680.11
0.08Govt & GovtGuaranteed Bonds
AAA
AA+
TREPS & MutualFund Investments2
AA-

Market Outlook Fund Performance Contents Individual Funds Group Funds
MONTHLY UPDATE JANUARY 2019 | (based on last business day) 48
GROUP FUNDKOTAK GROUP GILT FUND(ULGF-002-27/06/03-GLTFND-107)
AS ON 31st DECEMBER 2018
Investment ObjectiveReturns will be in line with those of fixed interest instruments, and may provide little protection against unexpected inflation increases. Will pre-serve capital and minimize downside risk, with investment in debt and government instruments.
Debt Ratings Profile (%)
AUM (in Lakhs)
Sector Allocation as per NIC 2008 % to Fund**
**NIC 2008 - Industrial sector as defined under National Industrial Classification 2008.
Kotak Group Gilt Fund
(%)
Benchmark (%)
1 month 2.2 1.9
3 months 6.7 5.8
6 months 8.0 7.4
1 year 8.3 8.4
2 years 5.5 6.1
3 years 8.7 8.6
4 years 8.3 8.5
5 years 10.1 9.8
6 years 8.7 8.8
7 years 9.2 9.2
10 years 7.4 7.3
Inception 7.8 7.6
Past performance is not necessarily indicative of future performance
Approved (%) Actual (%)
Gsec 80 - 100 97
MMI /Others
00 - 20 3
Date of Inception
AUM (in Lakhs)
NAV
Fund Manager
Benchmark Details
Modified Duration
Asset Allocation
Performance Meter
27th June 2003
5,176.86
31.8699
Debt : KunalShah
Equity - 0% (NA)Debt - 100% (IBEX)
Debt & MoneyMarket Instruments : 6.89
Holdings % to Fund
G-Sec 96.90
7.72% GOI - 26.10.2055 15.83
9.23% GOI - 23.12.2043 6.40
7.06% GOI - 10.10.2046 6.19
8.13% GOI - 22.06.2045 4.93
8.62% HR SDL 03.09.2028 4.54
7.71% GJ SDL - 01.03.2027 4.43
7.38% MP SDL - 14.09.2026 4.35
8.01% RJ SPL SDL - 23.06.2020 4.23
8.34% PN SDL - 30.05.2028 3.90
8.18% HR Uday SDL 15.06.2023 3.90
Others 38.20
MMI 1.16
NCA 1.94
Portfolio
5,076
101
Debt NCA
1.16
1.94
41.89
55.01
Financial andinsurance activities
NCA
Govt. of India
State DevelopmentLoan
98.82
1.18
Govt & GovtGuaranteed Bonds
TREPS & MutualFund Investments2
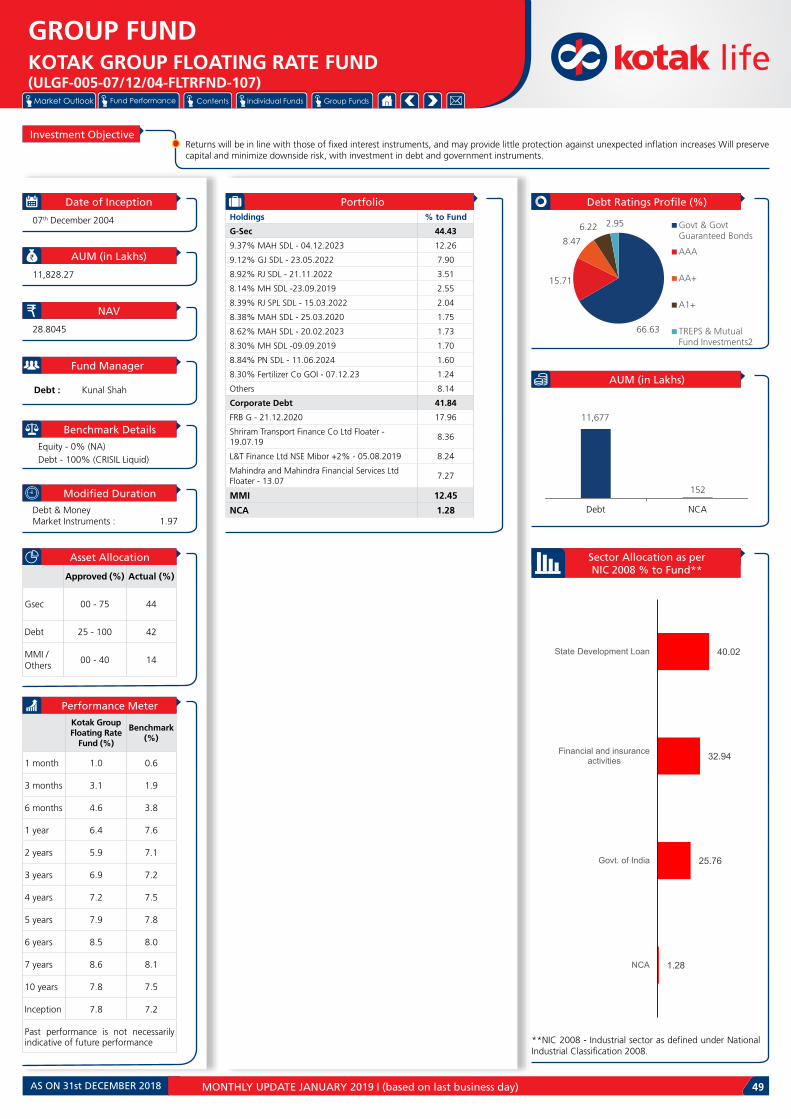
Market Outlook Fund Performance Contents Individual Funds Group Funds
MONTHLY UPDATE JANUARY 2019 | (based on last business day) 49
GROUP FUNDKOTAK GROUP FLOATING RATE FUND(ULGF-005-07/12/04-FLTRFND-107)
AS ON 31st DECEMBER 2018
Investment ObjectiveReturns will be in line with those of fixed interest instruments, and may provide little protection against unexpected inflation increases Will preserve capital and minimize downside risk, with investment in debt and government instruments.
Debt Ratings Profile (%)
AUM (in Lakhs)
Sector Allocation as per NIC 2008 % to Fund**
**NIC 2008 - Industrial sector as defined under National Industrial Classification 2008.
Kotak Group Floating Rate
Fund (%)
Benchmark (%)
1 month 1.0 0.6
3 months 3.1 1.9
6 months 4.6 3.8
1 year 6.4 7.6
2 years 5.9 7.1
3 years 6.9 7.2
4 years 7.2 7.5
5 years 7.9 7.8
6 years 8.5 8.0
7 years 8.6 8.1
10 years 7.8 7.5
Inception 7.8 7.2
Past performance is not necessarily indicative of future performance
Approved (%) Actual (%)
Gsec 00 - 75 44
Debt 25 - 100 42
MMI /Others
00 - 40 14
Date of Inception
AUM (in Lakhs)
NAV
Fund Manager
Benchmark Details
Modified Duration
Asset Allocation
Performance Meter
07th December 2004
11,828.27
28.8045
Debt : KunalShah
Equity - 0% (NA)Debt - 100% (CRISIL Liquid)
Debt & MoneyMarket Instruments : 1.97
Holdings % to Fund
G-Sec 44.43
9.37% MAH SDL - 04.12.2023 12.26
9.12% GJ SDL - 23.05.2022 7.90
8.92% RJ SDL - 21.11.2022 3.51
8.14% MH SDL -23.09.2019 2.55
8.39% RJ SPL SDL - 15.03.2022 2.04
8.38% MAH SDL - 25.03.2020 1.75
8.62% MAH SDL - 20.02.2023 1.73
8.30% MH SDL -09.09.2019 1.70
8.84% PN SDL - 11.06.2024 1.60
8.30% Fertilizer Co GOI - 07.12.23 1.24
Others 8.14
Corporate Debt 41.84
FRB G - 21.12.2020 17.96
Shriram Transport Finance Co Ltd Floater - 19.07.19
8.36
L&T Finance Ltd NSE Mibor +2% - 05.08.2019 8.24
Mahindra and Mahindra Financial Services Ltd Floater - 13.07
7.27
MMI 12.45
NCA 1.28
Portfolio
11,677
152
Debt NCA
1.28
25.76
32.94
40.02
NCA
Govt. of India
Financial and insuranceactivities
State Development Loan
66.63
15.71
8.47
6.22 2.95 Govt & GovtGuaranteed Bonds
AAA
AA+
A1+
TREPS & MutualFund Investments2

Market Outlook Fund Performance Contents Individual Funds Group Funds
MONTHLY UPDATE JANUARY 2019 | (based on last business day) 50
GROUP FUNDKOTAK GROUP MONEY MARKET FUND(ULGF-001-27/06/03-MNMKFND-107)
AS ON 31st DECEMBER 2018
Investment ObjectiveWill protect capital and not have downside risks.
Debt Ratings Profile (%)
AUM (in Lakhs)
Sector Allocation as per NIC 2008 % to Fund**
**NIC 2008 - Industrial sector as defined under National Industrial Classification 2008.
Kotak Group Money
Market Fund (%)
Benchmark (%)
1 month 0.5 0.6
3 months 1.3 1.9
6 months 2.6 3.8
1 year 5.1 7.6
2 years 4.9 7.1
3 years 4.7 7.2
4 years 5.6 7.5
5 years 6.2 7.8
6 years n.a n.a
7 years n.a n.a
10 years n.a n.a
Inception 6.5 8.1
Past performance is not necessarily indicative of future performance
Approved (%) Actual (%)
MMI /Others
100 100
Date of Inception
AUM (in Lakhs)
NAV
Fund Manager
Benchmark Details
Modified Duration
Asset Allocation
Performance Meter
12th August 2013
363.96
14.0288
Debt : KunalShah
Equity - 0% (NA)Debt - 100% (CRISIL Liquid)
Debt & MoneyMarket Instruments : 0.78
Holdings % to Fund
MMI 99.28
NCA 0.72
Portfolio
361
2.63
Debt NCA
0.72
8.24
91.03
NCA
Financial and insuranceactivities
Govt. of India
91.70
8.30
Govt & GovtGuaranteed Bonds
TREPS & MutualFund Investments2

Market Outlook Fund Performance Contents Individual Funds Group Funds
MONTHLY UPDATE JANUARY 2019 | (based on last business day) 51
GROUP FUNDKOTAK GROUP SECURE CAPITAL FUND(ULGF-016-12/04/11-SECCAPFND-107)
AS ON 31st DECEMBER 2018
Investment ObjectiveThe portfolio will consist of highly rated debt instruments including corporate debt and infrastructure debt assets as defined in the IRDA regula-tions, Government securities and short term investments.
Debt Ratings Profile (%)
AUM (in Lakhs)
Sector Allocation as per NIC 2008 % to Fund**
**NIC 2008 - Industrial sector as defined under National Industrial Classification 2008.
Kotak Group Secure Capital
Fund (%)
Benchmark (%)
1 month 2.0 1.6
3 months 5.8 4.8
6 months 6.8 5.7
1 year 6.8 5.9
2 years 5.5 5.3
3 years 8.2 7.8
4 years 7.9 8.0
5 years 9.5 9.2
6 years 8.4 8.3
7 years 9.0 8.5
10 years n.a n.a
Inception 9.0 8.3
Past performance is not necessarily indicative of future performance
Approved (%) Actual (%)
Gsec 00 - 75 51
Debt 25 - 100 45
MMI /Others
00 - 40 4
Date of Inception
AUM (in Lakhs)
NAV
Fund Manager
Benchmark Details
Modified Duration
Asset Allocation
Performance Meter
12th April 2011
30,186.64
19.4742
Debt : KunalShah
Debt - 100% (CRISIL Bond)
Debt & MoneyMarket Instruments : 5.75
Holdings % to Fund
G-Sec 51.01
7.72% GOI - 26.10.2055 5.46
8.13% GOI - 22.06.2045 5.14
7.06% GOI - 10.10.2046 4.60
8.70% REC - 28.09.2028 4.27
8.54% REC - 15.11.2028 3.57
8.58% GJ SDL - 31.10.2028 3.31
8.18% NABARD - 26.12.2028 2.51
8.37% MP SDL - 05.12.2028 1.87
8.15% TN SDL -09.05.2028 1.77
8.22% NABARD - 13.12.2028 1.73
Others 16.78
Corporate Debt 45.42
7.4805%KotakMahindraPrimeLtd-11.06.2020 3.24
8.56% REC - 29.11.2028 2.80
Mahindra and Mahindra Financial Services Ltd Floater - 13.07
1.83
9.05% HDFC - 16.10.2028 1.70
8.3750% EXIM- 24.07.2025 1.66
7.85% PFC - 03.04.2028 1.50
L&T Finance Ltd NSE Mibor +2% - 05.08.2019 1.41
11.08% HDFC - 13.04.2027 Set Down 13.04.20 - 7.78%
1.02
8.65% PFC - 28.12.2024 0.90
9.3434% Mahindra and Mahindra Financial Services Ltd- 17.03.
0.80
Others 28.55
MMI 0.76
NCA 2.81
Portfolio
29,339
848
Debt NCA
2.26
2.81
6.57
14.59
20.07
53.71
Wholesale trade, exceptof motor vehicles and
motorcycles
NCA
Electricity, gas, steamand air conditioning
supply
State Development Loan
Govt. of India
Financial and insuranceactivities
52.49
46.09
0.780.64
Govt & GovtGuaranteed Bonds
AAA
TREPS & MutualFund Investments2
AA+

Market Outlook Fund Performance Contents Individual Funds Group Funds
MONTHLY UPDATE JANUARY 2019 | (based on last business day) 52
GROUP FUNDKOTAK GROUP SHORT TERM BOND FUND(ULGF-018-18/12/13-SHTRMBND-107)
AS ON 31st DECEMBER 2018
Investment ObjectiveWill generate stable returns through investments in a suitable mix of debt and money market instruments.
Debt Ratings Profile (%)
AUM (in Lakhs)
Sector Allocation as per NIC 2008 % to Fund**
**NIC 2008 - Industrial sector as defined under National Industrial Classification 2008.
Kotak Group Short Term Bond Fund
(%)
Benchmark (%)
1 month 1.1 1.0
3 months 3.2 3.0
6 months 4.5 4.4
1 year 6.2 6.7
2 years 5.9 6.3
3 years 7.0 7.5
4 years n.a n.a
5 years n.a n.a
6 years n.a n.a
7 years n.a n.a
10 years n.a n.a
Inception 6.9 7.4
Past performance is not necessarily indicative of future performance
Approved (%) Actual (%)
Gsec 00 - 50 27
Debt 25 - 75 61
MMI /Others
10 - 75 13
Date of Inception
AUM (in Lakhs)
NAV
Fund Manager
Benchmark Details
Modified Duration
Asset Allocation
19th October 2015
9,161.05
12.3799
Debt : KunalShah
CRISIL Short Term Bond Fund Index
Debt & MoneyMarket Instruments : 2.02
Holdings % to Fund
G-Sec 26.79
8.15% RJ SPL SDL - 23.06.2021 5.51
8.65% RJ SDL - 03.10.2028 4.53
9.50% GJ SDL - 11.09.2023 2.32
8.09% GJ SDL - 25.05.2020 2.20
6.65% Fertilizer Co GOI - 29.01.23 1.59
9.69% PN SDL - 12.02.2024 1.17
8.90%KASDL-19.12.2022 1.13
9.17% PN SDL - 11.04.2022 1.13
8.09% TN SDL - 09.06.2020 1.10
9.25% RJ SDL - 09.10.2023 0.86
Others 5.25
Corporate Debt 60.70
8.95% Bajaj Finance Ltd - 10.04.2020 7.64
9.05% HDFC - 20.11.2023 5.55
9.30% PGC - 28.06.2020 5.53
8.60% LIC Housing Finance - 22.07.2020 5.45
08.48% Mahindra and Mahindra Financial Services Ltd- 26.06.2
5.41
8.80% REC - 17.11.2019 4.39
7.4805%KotakMahindraPrimeLtd-11.06.2020 3.21
8.55% IRFC - 15.01.2019 2.84
8.90% PGCIL - 25.02.2021 2.21
9.20% PFC - 07.07.2021 2.00
Others 16.47
MMI 9.66
NCA 2.85
Portfolio
8,900
261
Debt NCA
2.03
2.16
2.85
8.29
24.75
59.91
Govt. of India
Mfg of coke and refinedpetroleum products
NCA
Electricity, gas, steamand air conditioning
supply
State DevelopmentLoan
Financial and insuranceactivities
62.48
27.57
7.53 2.42 AAA
Govt & GovtGuaranteed Bonds
A1+
TREPS & MutualFund Investments2
Performance Meter

Market Outlook Fund Performance Contents Individual Funds Group Funds
MONTHLY UPDATE JANUARY 2019 | (based on last business day) 53
GROUP FUNDKOTAK GROUP PRUDENT FUND(ULGF-019-04/07/17-KGPFFND-107)
AS ON 31st DECEMBER 2018
Investment ObjectiveAims to provide enhanced long term returns by taking a moderate exposure to equity and equity related securities and active management of a fixed income portfolio.
Debt Ratings Profile (%)
AUM (in Lakhs)
Sector Allocation as per NIC 2008 % to Fund**
**NIC 2008 - Industrial sector as defined under National Industrial Classification 2008.
Kotak Group Prudent Fund
(%)
Benchmark (%)
1 month 1.8 1.4
3 months 5.3 3.9
6 months 6.3 4.9
1 year n.a n.a
2 years n.a n.a
3 years n.a n.a
4 years n.a n.a
5 years n.a n.a
6 years n.a n.a
7 years n.a n.a
10 years n.a n.a
Inception 6.8 5.2
Past performance is not necessarily indicative of future performance
Approved (%) Actual (%)
Equity 00 - 20 14
Gsec / Debt
40 - 100 66
MMI /Others
00 - 40 20
Date of Inception
AUM (in Lakhs)
NAV
Fund Manager
Benchmark Details
Modified Duration
Asset Allocation
1st June 2018
1,759.71
10.6776
Equity : Rohit AgarwalDebt : KunalShah
20% BSE 100 & 80% CRISIL Bond
Debt & MoneyMarket Instruments : 4.15
Holdings % to Fund
EQUITY 14.39
ICICI Bank Ltd 1.16
HDFC Bank Ltd 1.06
Reliance Industries Ltd 1.02
Infosys Ltd 0.97
KotakBankingETF-DividendPayoutOption 0.76
I T C Ltd 0.75
Axis Bank Ltd 0.70
Reliance ETF Bank Bees 0.69
IndusInd Bank Ltd 0.52
Larsen And Toubro Ltd 0.41
State Bank of India 0.41
Mahindra & Mahindra Ltd 0.39
Hindustan Unilever Ltd 0.37
Tech Mahindra Ltd 0.32
Tata Consultancy Services Ltd 0.30
SBI ETF Nifty Bank 0.30
Aurobindo Pharma Ltd 0.28
Maruti Suzuki India Ltd 0.28
Mahindra & Mahindra Financial Services Ltd 0.27
Bajaj Finance Ltd 0.21
Others 3.21
G-Sec 14.60
7.72% GOI - 26.10.2055 5.51
8.58% GJ SDL - 31.10.2028 2.94
8.70% REC - 28.09.2028 1.76
8.74% PN SDL - 14.12.2021 1.46
8.47% NABARD - 31.08.2033 1.16
8.20% NABARD - 16.03.2028 1.14
9.20% GOI - 30.09.2030 0.64
Corporate Debt 50.92
9.24% LIC Housing Finance - 30.09.2024 6.93
8.56% REC - 29.11.2028 5.79
9.05% HDFC - 20.11.2023 5.78
9.3434% Mahindra and Mahindra Financial Services Ltd- 17.03.
5.71
9.10% Shriram Transport Finance Co Ltd 12.07.2021
5.59
7.85% PFC - 03.04.2028 5.49
10.08% IOT Utkal Energy Services Limited - 20.03.2027
5.20
7.93% PGC - 20.05.2028 4.93
7.62% EXIM- 01.09.2026 4.36
8.55% IRFC - 03.02.2020 1.14
MMI 18.68
NCA 1.42
Portfolio
253
1,482
25
Equity Debt NCA
3.49
0.75
0.81
1.02
1.42
1.72
4.39
5.10
5.21
7.50
68.59
Others
Mfg of tobacco products
Mfg of motor vehicles,trailers and semi-trailers
Mfg of coke and refinedpetroleum products
NCA
Computer programming,consultancy and related
activities
State Development Loan
Electricity, gas, steamand air conditioning
supply
Wholesale trade, exceptof motor vehicles and
motorcycles
Govt. of India
Financial and insuranceactivities
53.83
20.59
18.94
6.64 AAA
TREPS & MutualFund Investments2
Govt & GovtGuaranteed Bonds
AA+
Performance Meter

Market Outlook Fund Performance Contents Individual Funds Group Funds
MONTHLY UPDATE JANUARY 2019 | (based on last business day) 54
The Break-up of Others is as given below
Equity Classic Opportunities Fund
Others 30.92IndusInd Bank Ltd 1.55Asian Paints Ltd 1.55GAIL (India) Ltd 1.47Petronet L N G Ltd 1.27Bata India Ltd 1.25Exide Industries Ltd 1.22Titan Industries Ltd 1.18Ashok Leyland Ltd 1.08Ratnakar Bank Ltd 1.07Havells India Ltd 1.06Mahindra & Mahindra Financial Services Ltd 1.05Torrent Pharmaceuticals Ltd 1.02Shree Cement Ltd 1.00Bharat Petroleum Corporation Ltd 1.00Reliance ETF Bank Bees 0.99The Ramco Cements Ltd 0.91Odisha Cement Ltd 0.79Container Corporation of India Ltd 0.74Future Retail Ltd 0.74Colgate Palmolive India Ltd 0.73Interglobe Aviation Ltd 0.71Tata Steel Ltd 0.69Bharat Forge Ltd 0.66ICICI Lombard General Insurance Company Ltd 0.64Motherson Sumi Systems Ltd 0.61Sun Pharmaceuticals Ltd 0.60AU Small Finance Bank Ltd 0.59Astral Poly Technik Ltd 0.58Whirlpool of India Ltd 0.56Eicher Motors Ltd 0.54HDFC Asset Management Co Ltd 0.53Brigade Enterprises Ltd 0.53Schaeffler India Ltd 0.52Indian Hotels Company Ltd 0.44S R F Ltd 0.30City Union Bank Ltd 0.28Somany Ceramics Ltd 0.25P I Industries Ltd 0.14P N C Infratech Ltd 0.056% Zee Entertainment Enterprises Ltd Pref Shares 0.01
Equity Dynamic Floor Fund II
Others 10.47Bata India Ltd 0.66Aurobindo Pharma Ltd 0.66The Ramco Cements Ltd 0.48Whirlpool of India Ltd 0.46Ratnakar Bank Ltd 0.45Sun Pharmaceuticals Ltd 0.44Interglobe Aviation Ltd 0.43Tata Power Company Ltd 0.42Supreme Industries Ltd 0.42Zee Entertainment Enterprises Ltd 0.41Apollo Tyres Ltd 0.41Bajaj Finance Ltd 0.38Petronet L N G Ltd 0.36Tata Consultancy Services Ltd 0.36Voltas Ltd 0.34Titan Industries Ltd 0.31Odisha Cement Ltd 0.31Bharat Forge Ltd 0.31Shree Cement Ltd 0.29Hindalco Industries Ltd 0.25Brigade Enterprises Ltd 0.25Ashok Leyland Ltd 0.25GlaxoSmithKlineConsumerHealthcareLtd 0.24AU Small Finance Bank Ltd 0.24Coromandel International Ltd 0.23Jindal Steel and Power Ltd 0.19Vedanta Ltd 0.19Aavas Financiers Ltd 0.18Astral Poly Technik Ltd 0.17Exide Industries Ltd 0.14Marico Ltd 0.12Somany Ceramics Ltd 0.09
Equity Frontline Equity Fund
Others 27.89Mahindra & Mahindra Financial Services Ltd 1.49HCL Technologies Ltd 1.36Exide Industries Ltd 1.31The Ramco Cements Ltd 1.22Sun Pharmaceuticals Ltd 1.11Interglobe Aviation Ltd 1.07Tata Power Company Ltd 1.06Ashok Leyland Ltd 1.04Zee Entertainment Enterprises Ltd 1.03Apollo Tyres Ltd 1.02Whirlpool of India Ltd 1.01S R F Ltd 1.00Bajaj Finance Ltd 0.99Ratnakar Bank Ltd 0.98Supreme Industries Ltd 0.95Voltas Ltd 0.94Tata Consultancy Services Ltd 0.90Titan Industries Ltd 0.83Petronet L N G Ltd 0.83Bharat Forge Ltd 0.83Shree Cement Ltd 0.72Odisha Cement Ltd 0.70AU Small Finance Bank Ltd 0.65Hindalco Industries Ltd 0.65Coromandel International Ltd 0.64Brigade Enterprises Ltd 0.55GlaxoSmithKlineConsumerHealthcareLtd 0.53Vedanta Ltd 0.50Marico Ltd 0.48Aavas Financiers Ltd 0.45Jindal Steel and Power Ltd 0.44Astral Poly Technik Ltd 0.39Somany Ceramics Ltd 0.216% Zee Entertainment Enterprises Ltd Pref Shares 0.01
Equity Balanced Fund
Others 15.12Mahindra & Mahindra Financial Services Ltd 0.93Aurobindo Pharma Ltd 0.91The Ramco Cements Ltd 0.70Sun Pharmaceuticals Ltd 0.65Bajaj Finance Ltd 0.64Tata Power Company Ltd 0.62Interglobe Aviation Ltd 0.60Apollo Tyres Ltd 0.59Zee Entertainment Enterprises Ltd 0.58Ratnakar Bank Ltd 0.58S R F Ltd 0.54Supreme Industries Ltd 0.52Titan Industries Ltd 0.51Tata Consultancy Services Ltd 0.49Bharat Forge Ltd 0.48Whirlpool of India Ltd 0.45Petronet L N G Ltd 0.44Marico Ltd 0.43Shree Cement Ltd 0.42Voltas Ltd 0.42Ashok Leyland Ltd 0.41Hindalco Industries Ltd 0.38Odisha Cement Ltd 0.38AU Small Finance Bank Ltd 0.36Coromandel International Ltd 0.33Vedanta Ltd 0.29GlaxoSmithKlineConsumerHealthcareLtd 0.26Aavas Financiers Ltd 0.25Jindal Steel and Power Ltd 0.23Brigade Enterprises Ltd 0.22Astral Poly Technik Ltd 0.21Exide Industries Ltd 0.20Somany Ceramics Ltd 0.10
ANNEXURE
AS ON 31st DECEMBER 2018

Market Outlook Fund Performance Contents Individual Funds Group Funds
MONTHLY UPDATE JANUARY 2019 | (based on last business day) 55
Equity Kotak Opportunities Fund
Others 31.63Bajaj Finance Ltd 1.60GAIL (India) Ltd 1.59IndusInd Bank Ltd 1.56Petronet L N G Ltd 1.34Bata India Ltd 1.26Exide Industries Ltd 1.23Titan Industries Ltd 1.19Torrent Pharmaceuticals Ltd 1.12Ratnakar Bank Ltd 1.11Havells India Ltd 1.10Reliance ETF Bank Bees 1.09Ashok Leyland Ltd 1.07Mahindra & Mahindra Financial Services Ltd 1.03Bharat Petroleum Corporation Ltd 1.02Shree Cement Ltd 1.01The Ramco Cements Ltd 0.89Odisha Cement Ltd 0.83Future Retail Ltd 0.77Container Corporation of India Ltd 0.76Colgate Palmolive India Ltd 0.74Interglobe Aviation Ltd 0.73Tata Steel Ltd 0.69Bharat Forge Ltd 0.68ICICI Lombard General Insurance Company Ltd 0.66Motherson Sumi Systems Ltd 0.63Sun Pharmaceuticals Ltd 0.62Astral Poly Technik Ltd 0.58Whirlpool of India Ltd 0.57Eicher Motors Ltd 0.56AU Small Finance Bank Ltd 0.55Schaeffler India Ltd 0.54Brigade Enterprises Ltd 0.49HDFC Asset Management Co Ltd 0.47Indian Hotels Company Ltd 0.44S R F Ltd 0.31Somany Ceramics Ltd 0.30City Union Bank Ltd 0.29P I Industries Ltd 0.14P N C Infratech Ltd 0.056% Zee Entertainment Enterprises Ltd Pref Shares 0.03
Equity Guarantee Fund
Others 12.40Bajaj Auto Ltd 0.61Dr Reddys Laboratories Ltd 0.60Eicher Motors Ltd 0.59Vedanta Ltd 0.59IndusInd Bank Ltd 0.56Hindalco Industries Ltd 0.55Bharti Airtel Ltd 0.55HCL Technologies Ltd 0.54J S W Steel Ltd 0.54Zee Entertainment Enterprises Ltd 0.51Cipla Ltd 0.50Tata Steel Ltd 0.46Titan Industries Ltd 0.46Tech Mahindra Ltd 0.46GAIL (India) Ltd 0.43Bajaj Finance Ltd 0.43Grasim Industries Ltd 0.41Adani Ports and Special Economic Zone Ltd 0.40Wipro Ltd 0.38Tata Motors Ltd 0.37UPL Ltd 0.35Indian Oil Corporation Ltd 0.35Bharat Petroleum Corporation Ltd 0.31Bharti Infratel Ltd 0.29Coal India Ltd 0.28Bajaj Finserv Ltd 0.27Yes Bank Ltd 0.23Hindustan Petroleum Corporation Ltd 0.20Indiabulls Housing Finance Ltd 0.19
Equity Kotak Aggressive Growth Fund
Others 25.20Mahindra & Mahindra Financial Services Ltd 1.64Ashok Leyland Ltd 1.46The Ramco Cements Ltd 1.36Tata Power Company Ltd 1.36SBI ETF Nifty Bank 1.28Ratnakar Bank Ltd 1.28S R F Ltd 1.22Sun Pharmaceuticals Ltd 1.19Zee Entertainment Enterprises Ltd 1.10Supreme Industries Ltd 1.07Apollo Tyres Ltd 1.06Bharat Forge Ltd 1.02Voltas Ltd 0.95Titan Industries Ltd 0.94Shree Cement Ltd 0.90Exide Industries Ltd 0.84Tata Consultancy Services Ltd 0.79Interglobe Aviation Ltd 0.75Bajaj Finance Ltd 0.73GlaxoSmithKlineConsumerHealthcareLtd 0.72Hindalco Industries Ltd 0.66Marico Ltd 0.60AU Small Finance Bank Ltd 0.55Vedanta Ltd 0.50Jindal Steel and Power Ltd 0.49Aavas Financiers Ltd 0.46Odisha Cement Ltd 0.256% Zee Entertainment Enterprises Ltd Pref Shares 0.04
Equity Kotak Dynamic Growth Fund
Others 21.37
Maruti Suzuki India Ltd 1.15
SBI ETF Nifty Bank 1.14
The Ramco Cements Ltd 0.95
Whirlpool of India Ltd 0.88
Sun Pharmaceuticals Ltd 0.87
Interglobe Aviation Ltd 0.86
Zee Entertainment Enterprises Ltd 0.84
Tata Power Company Ltd 0.84
S R F Ltd 0.83
Ratnakar Bank Ltd 0.83
Apollo Tyres Ltd 0.82
Supreme Industries Ltd 0.82
Bajaj Finance Ltd 0.76
Petronet L N G Ltd 0.74
Tata Consultancy Services Ltd 0.74
Voltas Ltd 0.68
Bharat Forge Ltd 0.64
Odisha Cement Ltd 0.62
Titan Industries Ltd 0.61
Brigade Enterprises Ltd 0.54
GlaxoSmithKlineConsumerHealthcareLtd 0.52
Ashok Leyland Ltd 0.51
Hindalco Industries Ltd 0.51
Coromandel International Ltd 0.48
Shree Cement Ltd 0.47
AU Small Finance Bank Ltd 0.45
Jindal Steel and Power Ltd 0.39
Vedanta Ltd 0.38
Aavas Financiers Ltd 0.36
Astral Poly Technik Ltd 0.35
Exide Industries Ltd 0.28
Marico Ltd 0.25
Somany Ceramics Ltd 0.19
6% Zee Entertainment Enterprises Ltd Pref Shares 0.03
The Break-up of Others is as given below
ANNEXURE
AS ON 31st DECEMBER 2018

Market Outlook Fund Performance Contents Individual Funds Group Funds
MONTHLY UPDATE JANUARY 2019 | (based on last business day) 56
The Break-up of Others is as given below
Equity Dynamic Floor Fund
Others 11.01Aurobindo Pharma Ltd 0.67Bata India Ltd 0.67The Ramco Cements Ltd 0.48Ratnakar Bank Ltd 0.46Interglobe Aviation Ltd 0.46Whirlpool of India Ltd 0.45Sun Pharmaceuticals Ltd 0.44Tata Power Company Ltd 0.42Zee Entertainment Enterprises Ltd 0.42Supreme Industries Ltd 0.42Apollo Tyres Ltd 0.41S R F Ltd 0.40Bajaj Finance Ltd 0.38Petronet L N G Ltd 0.37Tata Consultancy Services Ltd 0.37Voltas Ltd 0.34Odisha Cement Ltd 0.32Bharat Forge Ltd 0.32Titan Industries Ltd 0.31Shree Cement Ltd 0.30Brigade Enterprises Ltd 0.26Ashok Leyland Ltd 0.26Hindalco Industries Ltd 0.25GlaxoSmithKlineConsumerHealthcareLtd 0.25AU Small Finance Bank Ltd 0.24Coromandel International Ltd 0.23Jindal Steel and Power Ltd 0.20Vedanta Ltd 0.19Aavas Financiers Ltd 0.18Astral Poly Technik Ltd 0.17Exide Industries Ltd 0.14Marico Ltd 0.12Somany Ceramics Ltd 0.10
Equity Peak Guarantee Fund I
Others 4.17IndusInd Bank Ltd 0.21Power Grid Corporation of India Ltd 0.21Eicher Motors Ltd 0.20Vedanta Ltd 0.19Bharti Airtel Ltd 0.19Hindalco Industries Ltd 0.19HCL Technologies Ltd 0.18Dr Reddys Laboratories Ltd 0.18Zee Entertainment Enterprises Ltd 0.17J S W Steel Ltd 0.16Bajaj Finance Ltd 0.16Tata Steel Ltd 0.15Titan Industries Ltd 0.15Tech Mahindra Ltd 0.15Cipla Ltd 0.15GAIL (India) Ltd 0.15Grasim Industries Ltd 0.15Adani Ports and Special Economic Zone Ltd 0.14Wipro Ltd 0.13Tata Motors Ltd 0.13UPL Ltd 0.12Indian Oil Corporation Ltd 0.11Bharat Petroleum Corporation Ltd 0.10Bharti Infratel Ltd 0.10Bajaj Finserv Ltd 0.10Yes Bank Ltd 0.09Coal India Ltd 0.08Indiabulls Housing Finance Ltd 0.07Hindustan Petroleum Corporation Ltd 0.07
Equity Kotak Dynamic Balanced Fund
Others 16.47Aurobindo Pharma Ltd 0.93Maruti Suzuki India Ltd 0.89The Ramco Cements Ltd 0.73Interglobe Aviation Ltd 0.70Whirlpool of India Ltd 0.70Ratnakar Bank Ltd 0.69Sun Pharmaceuticals Ltd 0.67Tata Power Company Ltd 0.65Apollo Tyres Ltd 0.63S R F Ltd 0.63Zee Entertainment Enterprises Ltd 0.62Supreme Industries Ltd 0.62Bajaj Finance Ltd 0.59Tata Consultancy Services Ltd 0.56Petronet L N G Ltd 0.55Voltas Ltd 0.51Bharat Forge Ltd 0.49Titan Industries Ltd 0.47Odisha Cement Ltd 0.46Shree Cement Ltd 0.45Ashok Leyland Ltd 0.39Hindalco Industries Ltd 0.39AU Small Finance Bank Ltd 0.37Brigade Enterprises Ltd 0.37GlaxoSmithKlineConsumerHealthcareLtd 0.37Coromandel International Ltd 0.35Vedanta Ltd 0.30Jindal Steel and Power Ltd 0.29Aavas Financiers Ltd 0.27Astral Poly Technik Ltd 0.26Exide Industries Ltd 0.22Marico Ltd 0.19Somany Ceramics Ltd 0.146% Zee Entertainment Enterprises Ltd Pref Shares 0.02
Equity Kotak Guaranteed Growth Fund
Others 15.62Aurobindo Pharma Ltd 0.88Maruti Suzuki India Ltd 0.84The Ramco Cements Ltd 0.70Whirlpool of India Ltd 0.67Supreme Industries Ltd 0.64S R F Ltd 0.62Tata Power Company Ltd 0.61Apollo Tyres Ltd 0.61Ratnakar Bank Ltd 0.59Zee Entertainment Enterprises Ltd 0.58Voltas Ltd 0.58Bajaj Finance Ltd 0.56Sun Pharmaceuticals Ltd 0.53Bharat Forge Ltd 0.52Odisha Cement Ltd 0.51Interglobe Aviation Ltd 0.49Petronet L N G Ltd 0.49Brigade Enterprises Ltd 0.48GlaxoSmithKlineConsumerHealthcareLtd 0.46Titan Industries Ltd 0.44Shree Cement Ltd 0.43Coromandel International Ltd 0.42Tata Consultancy Services Ltd 0.37Hindalco Industries Ltd 0.36AU Small Finance Bank Ltd 0.34Jindal Steel and Power Ltd 0.30Vedanta Ltd 0.27Aavas Financiers Ltd 0.27Astral Poly Technik Ltd 0.25Ashok Leyland Ltd 0.24Exide Industries Ltd 0.20Marico Ltd 0.19Somany Ceramics Ltd 0.166% Zee Entertainment Enterprises Ltd Pref Shares 0.03
ANNEXURE
AS ON 31st DECEMBER 2018

Market Outlook Fund Performance Contents Individual Funds Group Funds
MONTHLY UPDATE JANUARY 2019 | (based on last business day) 57
The Break-up of Others is as given below
Equity Kotak Guaranteed Balanced Fund
Others 12.89Bata India Ltd 0.76Aurobindo Pharma Ltd 0.71The Ramco Cements Ltd 0.56Whirlpool of India Ltd 0.54Sun Pharmaceuticals Ltd 0.51Interglobe Aviation Ltd 0.49S R F Ltd 0.49Supreme Industries Ltd 0.48Zee Entertainment Enterprises Ltd 0.48Ratnakar Bank Ltd 0.46Bajaj Finance Ltd 0.44Petronet L N G Ltd 0.44Tata Consultancy Services Ltd 0.43Apollo Tyres Ltd 0.42Voltas Ltd 0.39Odisha Cement Ltd 0.37Bharat Forge Ltd 0.37Titan Industries Ltd 0.36Shree Cement Ltd 0.34Astral Poly Technik Ltd 0.30Brigade Enterprises Ltd 0.30Ashok Leyland Ltd 0.30GlaxoSmithKlineConsumerHealthcareLtd 0.29Hindalco Industries Ltd 0.29Coromandel International Ltd 0.28AU Small Finance Bank Ltd 0.24Tata Power Company Ltd 0.24Jindal Steel and Power Ltd 0.23Vedanta Ltd 0.22Aavas Financiers Ltd 0.21Exide Industries Ltd 0.16Marico Ltd 0.14Somany Ceramics Ltd 0.126% Zee Entertainment Enterprises Ltd Pref Shares 0.01
Equity Kotak Pension Opportunities Fund
Others 31.05
Hindalco Industries Ltd 1.57
Asian Paints Ltd 1.54
IndusInd Bank Ltd 1.53
Petronet L N G Ltd 1.32
Bata India Ltd 1.24
Exide Industries Ltd 1.21
Titan Industries Ltd 1.17
Ratnakar Bank Ltd 1.14
Torrent Pharmaceuticals Ltd 1.10
Shree Cement Ltd 1.04
Havells India Ltd 1.03
Reliance ETF Bank Bees 0.99
The Ramco Cements Ltd 0.98
Mahindra & Mahindra Financial Services Ltd 0.98
Bharat Petroleum Corporation Ltd 0.97
Ashok Leyland Ltd 0.97
Odisha Cement Ltd 0.84
Container Corporation of India Ltd 0.78
Future Retail Ltd 0.76
Colgate Palmolive India Ltd 0.74
Interglobe Aviation Ltd 0.69
Tata Steel Ltd 0.68
ICICI Lombard General Insurance Company Ltd 0.64
Motherson Sumi Systems Ltd 0.64
Sun Pharmaceuticals Ltd 0.63
Bharat Forge Ltd 0.60
Whirlpool of India Ltd 0.59
Brigade Enterprises Ltd 0.58
Eicher Motors Ltd 0.57
AU Small Finance Bank Ltd 0.54
Schaeffler India Ltd 0.53
Astral Poly Technik Ltd 0.51
HDFC Asset Management Co Ltd 0.51
Indian Hotels Company Ltd 0.43
City Union Bank Ltd 0.29
S R F Ltd 0.28
Somany Ceramics Ltd 0.28
P I Industries Ltd 0.09
P N C Infratech Ltd 0.05
6% Zee Entertainment Enterprises Ltd Pref Shares 0.02
Equity Pension Classic Opportunities Fund
Others 31.59Hindalco Industries Ltd 1.62IndusInd Bank Ltd 1.55GAIL (India) Ltd 1.53Petronet L N G Ltd 1.27Bata India Ltd 1.26Exide Industries Ltd 1.22Titan Industries Ltd 1.18Ashok Leyland Ltd 1.12Mahindra & Mahindra Financial Services Ltd 1.10Ratnakar Bank Ltd 1.09Havells India Ltd 1.08Torrent Pharmaceuticals Ltd 1.08Reliance ETF Bank Bees 1.04Bharat Petroleum Corporation Ltd 1.01Shree Cement Ltd 1.01The Ramco Cements Ltd 0.95Odisha Cement Ltd 0.81Future Retail Ltd 0.76Container Corporation of India Ltd 0.75Colgate Palmolive India Ltd 0.73Interglobe Aviation Ltd 0.73Tata Steel Ltd 0.69Bharat Forge Ltd 0.67ICICI Lombard General Insurance Company Ltd 0.63Motherson Sumi Systems Ltd 0.62Sun Pharmaceuticals Ltd 0.61Astral Poly Technik Ltd 0.61AU Small Finance Bank Ltd 0.60Whirlpool of India Ltd 0.57Brigade Enterprises Ltd 0.56Eicher Motors Ltd 0.55Schaeffler India Ltd 0.53HDFC Asset Management Co Ltd 0.51Indian Hotels Company Ltd 0.44S R F Ltd 0.30City Union Bank Ltd 0.29Somany Ceramics Ltd 0.27P I Industries Ltd 0.14P N C Infratech Ltd 0.056% Zee Entertainment Enterprises Ltd Pref Shares 0.05
Equity Pension Frontline Equity Fund
Others 27.60Mahindra & Mahindra Financial Services Ltd 1.49Maruti Suzuki India Ltd 1.46The Ramco Cements Ltd 1.22Ratnakar Bank Ltd 1.20Whirlpool of India Ltd 1.20Sun Pharmaceuticals Ltd 1.11Interglobe Aviation Ltd 1.08Zee Entertainment Enterprises Ltd 1.06Tata Power Company Ltd 1.06S R F Ltd 1.04Apollo Tyres Ltd 1.03Supreme Industries Ltd 1.03Tata Consultancy Services Ltd 0.95Bajaj Finance Ltd 0.95Petronet L N G Ltd 0.94Voltas Ltd 0.87Bharat Forge Ltd 0.80Odisha Cement Ltd 0.79Titan Industries Ltd 0.78Shree Cement Ltd 0.74Coromandel International Ltd 0.72Brigade Enterprises Ltd 0.70GlaxoSmithKlineConsumerHealthcareLtd 0.66Ashok Leyland Ltd 0.65Hindalco Industries Ltd 0.64AU Small Finance Bank Ltd 0.60Jindal Steel and Power Ltd 0.50Vedanta Ltd 0.49Aavas Financiers Ltd 0.46Astral Poly Technik Ltd 0.45Exide Industries Ltd 0.34Marico Ltd 0.32Somany Ceramics Ltd 0.246% Zee Entertainment Enterprises Ltd Pref Shares 0.04
ANNEXURE
AS ON 31st DECEMBER 2018

Market Outlook Fund Performance Contents Individual Funds Group Funds
MONTHLY UPDATE JANUARY 2019 | (based on last business day) 58
The Break-up of Others is as given below
Equity Pension Guarantee Fund
Others 12.48
Power Grid Corporation of India Ltd 0.61
Dr Reddys Laboratories Ltd 0.61
Eicher Motors Ltd 0.60
Vedanta Ltd 0.59
IndusInd Bank Ltd 0.56
Hindalco Industries Ltd 0.55
Bharti Airtel Ltd 0.55
HCL Technologies Ltd 0.54
J S W Steel Ltd 0.54
Zee Entertainment Enterprises Ltd 0.51
Cipla Ltd 0.51
Tata Steel Ltd 0.47
Titan Industries Ltd 0.46
Tech Mahindra Ltd 0.46
GAIL (India) Ltd 0.43
Bajaj Finance Ltd 0.43
Grasim Industries Ltd 0.41
Adani Ports and Special Economic Zone Ltd 0.41
Wipro Ltd 0.38
Tata Motors Ltd 0.37
UPL Ltd 0.35
Indian Oil Corporation Ltd 0.35
Bharat Petroleum Corporation Ltd 0.31
Bharti Infratel Ltd 0.29
Coal India Ltd 0.28
Bajaj Finserv Ltd 0.27
Yes Bank Ltd 0.23
Hindustan Petroleum Corporation Ltd 0.20
Indiabulls Housing Finance Ltd 0.20
Equity Kotak Pension Floor Fund
Others 10.74Bata India Ltd 0.68Maruti Suzuki India Ltd 0.58Ratnakar Bank Ltd 0.49The Ramco Cements Ltd 0.49Whirlpool of India Ltd 0.49Sun Pharmaceuticals Ltd 0.44S R F Ltd 0.43Supreme Industries Ltd 0.42Zee Entertainment Enterprises Ltd 0.40Petronet L N G Ltd 0.39Bajaj Finance Ltd 0.38Tata Consultancy Services Ltd 0.38Apollo Tyres Ltd 0.37Voltas Ltd 0.35Odisha Cement Ltd 0.33Bharat Forge Ltd 0.32Titan Industries Ltd 0.31Interglobe Aviation Ltd 0.31Brigade Enterprises Ltd 0.29Shree Cement Ltd 0.29GlaxoSmithKlineConsumerHealthcareLtd 0.26Ashok Leyland Ltd 0.26Hindalco Industries Ltd 0.26Coromandel International Ltd 0.25AU Small Finance Bank Ltd 0.24Tata Power Company Ltd 0.21Jindal Steel and Power Ltd 0.20Vedanta Ltd 0.20Aavas Financiers Ltd 0.19Astral Poly Technik Ltd 0.18Exide Industries Ltd 0.14Marico Ltd 0.12Somany Ceramics Ltd 0.11
Equity Kotak Pension Growth Fund
Others 15.92Bata India Ltd 0.94Aurobindo Pharma Ltd 0.93The Ramco Cements Ltd 0.68Ratnakar Bank Ltd 0.65Whirlpool of India Ltd 0.64Sun Pharmaceuticals Ltd 0.62Interglobe Aviation Ltd 0.61Tata Power Company Ltd 0.59Zee Entertainment Enterprises Ltd 0.58Apollo Tyres Ltd 0.58Supreme Industries Ltd 0.57S R F Ltd 0.56Bajaj Finance Ltd 0.54Petronet L N G Ltd 0.52Tata Consultancy Services Ltd 0.51Voltas Ltd 0.47Bharat Forge Ltd 0.44Titan Industries Ltd 0.43Odisha Cement Ltd 0.43Shree Cement Ltd 0.40Hindalco Industries Ltd 0.36Ashok Leyland Ltd 0.36Brigade Enterprises Ltd 0.35GlaxoSmithKlineConsumerHealthcareLtd 0.34AU Small Finance Bank Ltd 0.34Coromandel International Ltd 0.33Jindal Steel and Power Ltd 0.27Vedanta Ltd 0.27Astral Poly Technik Ltd 0.24Aavas Financiers Ltd 0.24Exide Industries Ltd 0.20Marico Ltd 0.17Somany Ceramics Ltd 0.136% Zee Entertainment Enterprises Ltd Pref Shares 0.02
Equity Pension Floor Fund II
Others 10.99Bata India Ltd 0.66The Ramco Cements Ltd 0.49Whirlpool of India Ltd 0.48Ratnakar Bank Ltd 0.47Interglobe Aviation Ltd 0.47Sun Pharmaceuticals Ltd 0.44State Bank of India 0.44Zee Entertainment Enterprises Ltd 0.43Tata Power Company Ltd 0.43Supreme Industries Ltd 0.42Apollo Tyres Ltd 0.42S R F Ltd 0.41Bajaj Finance Ltd 0.39Petronet L N G Ltd 0.38Tata Consultancy Services Ltd 0.37Voltas Ltd 0.35Bharat Forge Ltd 0.33Odisha Cement Ltd 0.32Titan Industries Ltd 0.31Shree Cement Ltd 0.30Brigade Enterprises Ltd 0.29Ashok Leyland Ltd 0.26GlaxoSmithKlineConsumerHealthcareLtd 0.26Hindalco Industries Ltd 0.25AU Small Finance Bank Ltd 0.25Coromandel International Ltd 0.24Jindal Steel and Power Ltd 0.20Vedanta Ltd 0.19Aavas Financiers Ltd 0.18Astral Poly Technik Ltd 0.18Exide Industries Ltd 0.14Marico Ltd 0.13Somany Ceramics Ltd 0.10
ANNEXURE
AS ON 31st DECEMBER 2018

Market Outlook Fund Performance Contents Individual Funds Group Funds
MONTHLY UPDATE JANUARY 2019 | (based on last business day) 59
The Break-up of Others is as given below
Equity Kotak Pension Balanced Fund
Others 12.86Maruti Suzuki India Ltd 0.73The Ramco Cements Ltd 0.72Whirlpool of India Ltd 0.69Supreme Industries Ltd 0.65S R F Ltd 0.61Zee Entertainment Enterprises Ltd 0.55Tata Power Company Ltd 0.53Brigade Enterprises Ltd 0.50GlaxoSmithKlineConsumerHealthcareLtd 0.50Odisha Cement Ltd 0.49Voltas Ltd 0.49HCL Technologies Ltd 0.49Sun Pharmaceuticals Ltd 0.47Coromandel International Ltd 0.46Petronet L N G Ltd 0.45Hindalco Industries Ltd 0.43Interglobe Aviation Ltd 0.40Shree Cement Ltd 0.40Apollo Tyres Ltd 0.35Tata Consultancy Services Ltd 0.33Titan Industries Ltd 0.30Vedanta Ltd 0.28Bajaj Finance Ltd 0.28Aavas Financiers Ltd 0.25Jindal Steel and Power Ltd 0.24Astral Poly Technik Ltd 0.24Ashok Leyland Ltd 0.23AU Small Finance Bank Ltd 0.20Marico Ltd 0.19Somany Ceramics Ltd 0.17Exide Industries Ltd 0.16Bharat Forge Ltd 0.076% Zee Entertainment Enterprises Ltd Pref Shares 0.02
Equity Kotak Group Dynamic Floor Fund
Others 8.09
Mahindra & Mahindra Financial Services Ltd 0.50
Aurobindo Pharma Ltd 0.50
The Ramco Cements Ltd 0.37
Sun Pharmaceuticals Ltd 0.34
Interglobe Aviation Ltd 0.34
Tata Power Company Ltd 0.33
Zee Entertainment Enterprises Ltd 0.32
Ratnakar Bank Ltd 0.32
Whirlpool of India Ltd 0.32
Apollo Tyres Ltd 0.32
S R F Ltd 0.29
Supreme Industries Ltd 0.29
Bajaj Finance Ltd 0.29
Tata Consultancy Services Ltd 0.26
Petronet L N G Ltd 0.26
Bharat Forge Ltd 0.25
Voltas Ltd 0.24
Titan Industries Ltd 0.24
Odisha Cement Ltd 0.21
Hindalco Industries Ltd 0.20
Ashok Leyland Ltd 0.19
AU Small Finance Bank Ltd 0.19
Shree Cement Ltd 0.18
GlaxoSmithKlineConsumerHealthcareLtd 0.18
Brigade Enterprises Ltd 0.17
Coromandel International Ltd 0.16
Vedanta Ltd 0.15
Jindal Steel and Power Ltd 0.14
Astral Poly Technik Ltd 0.13
Aavas Financiers Ltd 0.12
Exide Industries Ltd 0.11
Marico Ltd 0.09
Somany Ceramics Ltd 0.07
Equity Pension Balanced Fund II
Others 15.29Aurobindo Pharma Ltd 0.94Mahindra & Mahindra Financial Services Ltd 0.93The Ramco Cements Ltd 0.70Sun Pharmaceuticals Ltd 0.65Tata Power Company Ltd 0.63Ratnakar Bank Ltd 0.62Interglobe Aviation Ltd 0.62Zee Entertainment Enterprises Ltd 0.62Whirlpool of India Ltd 0.61Apollo Tyres Ltd 0.61Bajaj Finance Ltd 0.57S R F Ltd 0.54Supreme Industries Ltd 0.54Tata Consultancy Services Ltd 0.52Petronet L N G Ltd 0.49Titan Industries Ltd 0.45Bharat Forge Ltd 0.44Voltas Ltd 0.44Odisha Cement Ltd 0.40AU Small Finance Bank Ltd 0.40Hindalco Industries Ltd 0.38Ashok Leyland Ltd 0.37Brigade Enterprises Ltd 0.35Shree Cement Ltd 0.34GlaxoSmithKlineConsumerHealthcareLtd 0.32Coromandel International Ltd 0.32Vedanta Ltd 0.29Jindal Steel and Power Ltd 0.25Aavas Financiers Ltd 0.24Exide Industries Ltd 0.21Astral Poly Technik Ltd 0.20Marico Ltd 0.17Somany Ceramics Ltd 0.136% Zee Entertainment Enterprises Ltd Pref Shares 0.03
Equity Kotak Group Balanced Fund
Others 15.20Asian Paints Ltd 0.93Aurobindo Pharma Ltd 0.92The Ramco Cements Ltd 0.70Sun Pharmaceuticals Ltd 0.65Bajaj Finance Ltd 0.64Tata Power Company Ltd 0.62Interglobe Aviation Ltd 0.60Apollo Tyres Ltd 0.59Zee Entertainment Enterprises Ltd 0.58S R F Ltd 0.54Voltas Ltd 0.54Ratnakar Bank Ltd 0.52Titan Industries Ltd 0.51Tata Consultancy Services Ltd 0.49Bharat Forge Ltd 0.49Whirlpool of India Ltd 0.49Supreme Industries Ltd 0.47Shree Cement Ltd 0.43Ashok Leyland Ltd 0.41Petronet L N G Ltd 0.41Coromandel International Ltd 0.40Hindalco Industries Ltd 0.38Marico Ltd 0.37Odisha Cement Ltd 0.36AU Small Finance Bank Ltd 0.36Vedanta Ltd 0.29Brigade Enterprises Ltd 0.27GlaxoSmithKlineConsumerHealthcareLtd 0.25Aavas Financiers Ltd 0.25Jindal Steel and Power Ltd 0.22Exide Industries Ltd 0.20Astral Poly Technik Ltd 0.19Somany Ceramics Ltd 0.106% Zee Entertainment Enterprises Ltd Pref Shares 0.01
ANNEXURE
AS ON 31st DECEMBER 2018

Market Outlook Fund Performance Contents Individual Funds Group Funds
MONTHLY UPDATE JANUARY 2019 | (based on last business day) 60
Disclaimer
Disclaimer :
About Us :Kotak Mahindra Life Insurance Company Ltd. (Formerly known as Kotak Mahindra Old Mutual Life Insurance Ltd.)
KotakMahindraLife InsuranceCompanyLimited(KotakLife Insurance) isa100%ownedsubsidiaryofKotakMahindraBank(Kotak).KotakLife Insuranceprovides world-class insurance products with high customer empathy. Its product suite leverages the combined prowess of protection and long term savings. KotakLifeInsuranceisoneofthefastestgrowinginsurancecompaniesinIndiaandhascoveredoverseveralmillionlives.Formoreinformation,pleasevisitthecompany’s website at https://insurance.kotak.com
Kotak Mahindra Group
Establishedin1985,KotakMahindraGroupisoneofIndia’sleadingfinancialservicesconglomerate.InFebruary2003,KotakMahindraFinanceLtd.(KMFL),theGroup’s flagship company, received banking license from the Reserve Bank of India (RBI), becoming the first nonbanking finance company in India to convert into abank-KotakMahindraBankLtd.TheGroupoffersawiderangeoffinancialservicesthatencompasseverysphereoflife.Fromcommercialbanking,tostockbroking, mutual funds, insurance and investment banking, the Group caters to the diverse financial needs of individuals and the corporate sector. The Group has a wide distribution network through branches and franchisees across India, and International Business Units. For more information, please visit the company’s website at www.kotak.com
Trade Logo Disclaimer
TradeLogodisplayedabovebelongstoKotakMahindraBankLimitedandisusedbyKotakMahindraLifeInsuranceCompanyLtd.underlicense.
Kotak Mahindra Life Insurance Company Ltd. (Formerly known as Kotak Mahindra Old Mutual Life Insurance Ltd.); Regn. No.: 107, CIN: U66030MH-2000PLC128503,Regd.Office:2ndFloor,Plot#C-12,G-Block,BKC,Bandra(E),Mumbai-400051.
Website: http://insurance.kotak.com Email:[email protected] I Toll Free No. – 1800 209 8800
Risk factors :
Thoughdocumentisthoroughlyresearched&preparedbyourfundexperts.KotakMahindraLifeInsuranceCompanyLtdhowevermakesnowarranties,repre-sentations, promises or statements that the information contained herein is clear, correct, precise or accurate. this document has been prepared for the purpose of providing an overview of kli funds without taking account of any particular investor’s objectives, financial situation or needs you are therefore requested not to substitute this document with any professional opinion/advice and to use your discretion basis your financial objectives.
• Unit Linked Life Insurance Products are different from traditional insurance products and are subject to the risk factors.
• The premium paid in Unit Linked Life Insurance Products are subject to investment risk associated with capital markets and the NAVs of the units may go up or down based on the performance of the fund and factors influencing the capital market and insured is responsible for his/her decisions.
• KotakLifeInsuranceisonlythenameoftheInsuranceCompanyandthespecifiedUnitLinkedfundsdonotinanywayindicatethequalityofthecontract,its future prospects or returns.
• Please know the associated risks and the applicable charges from your insurance agent or the intermediary or policy document of the insurer.
• Past performance of any of the funds is not indicative of their future prospects or returns.
AS ON 31st DECEMBER 2018