Embed Size (px)
Citation preview
1
Functional redundancy of linuron degradation in microbial 1
communities of agricultural soil and biopurification systems 2
Running title: Functional redundancy of linuron catabolic functions 3
Authors: Benjamin Horemans1*, Karolien Bers1, Erick Ruiz Romero2, Eva Pose Juan3, 4
Vincent Dunon1, René De Mot4, Dirk Springael1 5
1 Division of Soil and Water Management, KU Leuven, Heverlee, Belgium 6
2 Laboratory of Soil Ecology, Cinvestav, Mexico 7
3 Instituto de Recursos Naturales y Agrobiología de Salamanca, Salamanca, Spain 8
4 Centre of Microbial and Plant Genetics, KU Leuven, Heverlee, Belgium 9
10
*Corresponding author: 11
Dirk Springael 12
KU Leuven 13
Division of Soil and Water Management 14
Kasteelpark Arenberg 20 – bus 2459 15
B-3001 Leuven, Belgium 16
Tel: ++3216321604 17
Fax: ++3216321997 18
e-mail: [email protected] 19
keywords: linuron biodegradation, linuron hydrolase, catabolic gene abundance 20
AEM Accepted Manuscript Posted Online 4 March 2016Appl. Environ. Microbiol. doi:10.1128/AEM.04018-15Copyright © 2016, American Society for Microbiology. All Rights Reserved.
on May 17, 2018 by guest
http://aem.asm
.org/D
ownloaded from

2
Abstract 21
The abundance of libA, encoding a hydrolase that initiates linuron degradation in the 22
linuron metabolizing Variovorax sp. SRS16, was previously found to correlate well 23
with linuron mineralization in various environments, but not in all. Recently, an 24
alternative linuron hydrolase HylA was identified in Variovorax sp. WDL1, a strain that 25
initiates linuron degradation in a linuron mineralizing commensal bacterial 26
consortium. The discovery of alternative linuron hydrolases poses questions about 27
the respective contribution and competitive character of hylA and libA carrying 28
bacteria as well as the role of linuron mineralizing consortia versus single strains in 29
linuron exposed settings. Therefore, dynamics of hylA as well as dcaQ as a marker 30
for downstream catabolic functions involved in linuron mineralization, in response to 31
linuron treatment in agricultural soil and on-farm biopurification systems (BPS), were 32
compared with previously reported libA dynamics. The results suggest that (i) 33
organisms containing libA and hylA both contribute simultaneously to linuron 34
biodegradation in the same environment albeit to a varying extent, (ii) that 35
environmental linuron mineralization depends on multispecies bacterial food webs 36
and (iii) initiation of linuron mineralization can be governed by currently unidentified 37
enzymes. 38
Importance 39
Several years ago, linuron degrading bacteria and a cooperative consortium were 40
enriched and isolated from environmental samples that were exposed to linuron for a 41
period of time. However, it’s an unwarranted assumption that these bacterial isolates 42
would be key protagonists in the in situ removal of the pesticide in the samples where 43
they were isolated from. In this study, the complementary involvement of two 44
on May 17, 2018 by guest
http://aem.asm
.org/D
ownloaded from

3
initiators of linuron degradation executing the first step in the degradation of linuron 45
and essential for its final mineralization, as well as the involvement of metabolite 46
mineralizing bacterial populations, was illustrated. This study is a first in illustrating 47
the importance of the synergistic metabolism of linuron in agricultural soils and 48
biopurification systems. 49
on May 17, 2018 by guest
http://aem.asm
.org/D
ownloaded from
4
Introduction 50
Linuron (3-(3,4-dichlorophenyl)-1-methoxy-1-methyl urea) is a phenylurea herbicide 51
that is widely used in various agriculture crops and in orchards (1) but forms also a 52
contaminant in soil, groundwater and surface water (1, 2). Biodegradation is an 53
important mechanism for removal of linuron in the environment. In agricultural soils 54
that were treated with the compound on a long term base, microbial communities 55
respond to linuron application and specific bacterial populations proliferate that use 56
linuron as sole source of carbon, nitrogen and energy (2). 57
The major bacterial pathway for mineralization of linuron in soil is initiated with the 58
hydrolysis of linuron into 3,4-dicholoroaniline (3,4-DCA) and N,O-59
dimethylhydroxylamine (N,O-DMHA) which are subsequently mineralized (2). Various 60
bacterial isolates and consortia that mineralize linuron were reported. In both cases, 61
members of the genus Variovorax are essential. Most linuron mineralizing single 62
strains are Variovorax sp. and in consortia, the organism performs at least the initial 63
hydrolysis step (3-6). Recently, gene functions linked with linuron mineralization in 64
Variovorax sp. were identified. The libA gene was identified in Variovorax sp. SRS16 65
and encodes the linuron amidase LibA that hydrolyzes linuron into 3,4-DCA and N,O-66
DMHA (7). Until recently, libA was the only linuron hydrolysis gene linked with linuron 67
mineralization. In several environments like agricultural soil and on-farm 68
biopurification systems (BPS) used for the treatment of agricultural pesticide 69
contaminated wastewater, the abundance of libA increased in parallel with increasing 70
linuron mineralization capacity as a response to linuron application indicating a 71
prominent role for libA in linuron mineralization in environmental settings(8, 9). 72
However, in addition to LibA, other linuron hydrolases were proposed to contribute to 73
on May 17, 2018 by guest
http://aem.asm
.org/D
ownloaded from
5
linuron mineralization in Variovorax and in the environment as some linuron 74
degrading Variovorax isolates lack a libA homologue and libA did not proliferate in all 75
environments that developed linuron mineralization activity upon exposure to linuron 76
(7). Recently, we identified HylA as a second type of linuron hydrolase in Variovorax 77
sp. WDL1 (10). Interestingly, HylA is evolutionary unrelated to LibA and shows 78
different enzymatic kinetic properties (10). The linuron hydrolysis genes in both 79
strains WDL1 and SRS16, are combined with highly similar catabolic gene modules 80
encoding the downstream pathway for 3,4-DCA degradation. Apparently, the 81
expansion of a 3,4-DCA catabolic pathway toward linuron degradation in the two 82
strains involved divergent evolution and the independent acquisition of nonrelated 83
isofunctional linuron hydrolytic gene functions by horizontal gene transfer (10). 84
Moreover, in contrast to SRS16, WDL1 is a member of a commensal bacterial 85
consortium in which most of the produced 3,4-DCA from HylA dependent linuron 86
hydrolysis is channeled to 3,4-DCA catabolic strains (4). 87
The identification of HylA as an alternative linuron hydrolase in linuron degrading 88
Variovorax strains poses questions about its contribution to environmental linuron 89
degradation in agricultural environments in addition to this of LibA, i.e., about the 90
functional redundancy of environmental linuron biodegradation. Catabolic enzymes 91
for pesticide degradation are considered to be quite unique as only a few enzyme 92
types exist that perform the corresponding activity, making their genes excellent 93
molecular markers for assessing the corresponding biodegradation capacity and 94
activity. Several authors (8, 11, 12) reported on the use of catabolic molecular 95
markers to assess herbicide biodegradation in soil. However, isofunctional diversity 96
of enzymes in pesticide biodegradation and the role of their functional redundancy 97
on May 17, 2018 by guest
http://aem.asm
.org/D
ownloaded from
6
remains largely unexplored and is to date only reported for biodegradation of 98
phenoxy acid herbicides (11, 13-15). 99
In this study, we examined whether hylA hosting organisms can successfully 100
compete with libA hosting organisms in linuron exposed environments and whether 101
hylA gene copy numbers explain increases in linuron mineralization capacities in 102
linuron exposed environments where libA failed to do so. Moreover, we examined 103
whether commensalism in linuron metabolism as observed for hylA carrying WDL1 104
and hence multi-species food webs are involved in linuron biodegradation in the 105
environment. For those purposes, gene copy numbers of hylA as well as dcaQ were 106
determined in available DNA extracts from two different ecosystems for which the 107
response of the resident Variovorax community, the libA gene copy number and the 108
intrinsic capacity to mineralize linuron to the application of linuron was studied 109
previously (9, 16, 17). The gene dcaQ encodes the glutamine-aminotransferase-like 110
component of the multi-component enzyme 3,4-dioxygenase converting 3,4-DCA into 111
chlorocatechol and functions as a marker for linuron biodegradation beyond 3,4-DCA 112
(18, 19). The first ecosystem is an agricultural soil with a history of linuron treatment 113
and was studied as a field experiment followed by a lab scale soil microcosm (SM) 114
experiment that was initiated to verify results of the field experiment in a controlled 115
way (9). The second ecosystem mimicked the environment of an on-farm BPS. 116
Microcosms (BM) containing BPS material were treated with linuron (7, 16) and 117
different stress events were imposed to study their effects on linuron mineralization 118
(20, 21). 119
Materials and methods 120
on May 17, 2018 by guest
http://aem.asm
.org/D
ownloaded from

7
Real time quantitative PCR. Primer3web and Primer-Blast were used to design 121
primers targeting hylA encoding the linuron hydrolase HylA and dcaQ encoding the 122
glutamine-aminotransferase-like component of the multi-component enzyme 3,4-123
dioxygenase. Primers for hylA were designed based on the sequences of the 124
corresponding gene in the genomes of the linuron degrading Variovorax sp. strains 125
WDL1 and PBS-H4. Primers for dcaQ were designed based on the corresponding 126
gene sequences identified in Variovorax strains SRS16, WDL1, PBS-H4 and in a 127
range of chloroaniline degrading bacteria including the 3,4-DCA degrading 128
Comamonas testosteroni strain WDL7 which is part of the linuron mineralizing 129
commensal bacterial consortium that includes WDL1 (Table 1). Phylogenetic analysis 130
of dcaQ genes in chloroaniline degrading bacteria showed the existence of two main 131
groups that show around 80 % identity at the nucleotide level and 79 % at the amino 132
acid level. The groups were designated as dcaQI and dcaQII and primer sets were 133
designed that allowed to discriminate between both groups. Specificities of the primer 134
sets were assessed in silico with Primer-Blast and a Blast search and performing 135
PCR and qPCR on genomic DNA from several linuron/3,4-DCA degrading and non-136
linuron/3,4-DCA degrading Variovorax strains and bacteria of related and non-related 137
genera. qPCR was performed in a Rotor Gene Real-Time Centrifugal DNA 138
Amplification Apparatus (Corbett Research, Australia). The real time PCR reaction 139
mixtures contained 7.5 µL of Absolute QPCR SYBRs Green mix (ThermoFisher 140
Scientific, UK), 0.30 μL of forward primer (200 nM), 0.30 μL reverse primer (200 nM), 141
3.90 µL nuclease-free water and 3 µL of 10-fold diluted template DNA. The exception 142
was the hylA PCR mixture that used a 100 nM solution of reverse primer HylA-RT-F 143
instead of a 200 nM solution. Reaction conditions were 15 min at 95 °C, followed by 144
40 cycles of 15 s at 94 °C, 15 s at 60 °C and 15 s at 72 °C. Standard curves for 145
on May 17, 2018 by guest
http://aem.asm
.org/D
ownloaded from
8
qPCR were compiled using ten-fold serial dilutions of amplicons (ranging from 1 146
copy/µL until 108 copies/µL) of appropriate gene fragments generated by 147
conventional PCR from genomic DNA of strains SRS16 (dcaQI) and WDL1 (for hylA 148
and dcaQII) as reported below. The fragments were purified from agarose gels using 149
the QIAquick Gel Extraction Kit (Qiagen). DNA concentrations of the purified DNA 150
fragments were determined with the NanoDrop™ 1000 Spectrophotometer 151
(ThermoScientific). Limit of detection for all genes by qPCR was 1.2 x 10³ copies g-1 152
(dry weight) of soil/BM material. For each DNA extract, qPCRs were performed in 153
duplicate. Gene abundances are expressed as either the gene copy number of 154
hylA/dcaQI/dcaQII per copy of bacterial 16S rRNA gene or as the percentage of the 155
bacterial 16S rRNA gene copy number. Used values of bacterial 16S rRNA gene 156
copy numbers originated from Bers et al. (9, 16, 17). hylA, dcaQI and dcaQII gene 157
copy numbers were determined on the same DNA extracts that were previously used 158
to determine libA and 16S rRNA gene copy numbers (9, 16, 17). 159
Conventional PCR. Conventional PCR targeting hylA, dcaQI and dcaQII was 160
performed using the primer sets reported in Table 1. PCR reaction mixtures 161
contained 5 µL DreamTaq Green buffer (10 x) (Life Technologies), 5 µL 1 % BSA, 4 162
µL 2.5 mM dNTPs, 0.25 µL 0.1 mM forward and reverse primers, 0.25 µL DreamTaq 163
Polymerase (5 units/µL) (Life Technologies) adjusted to a total volume of 50 µL with 164
nuclease-free water. PCR reactions were performed in a Biometra Thermocycler 165
(AnalytikJena) and reaction conditions were 15 min at 95 °C, followed by 30 cycles of 166
1 min at 94 °C, 1 min at 60 °C and 1 min at 72 °C and a final elongation step at 72 °C 167
for 10 min. Amplicons were visualized by agarose gel electrophoresis (1 % agarose, 168
75 min, 90 V) using GelRed™ (Biotium) as nucleic acid stain. 169
on May 17, 2018 by guest
http://aem.asm
.org/D
ownloaded from

9
Agricultural soil DNA extracts. Used agricultural soil DNA extracts originated from 170
a field experiment and a concomitant SM experiment which assessed the response 171
of the Variovorax community, libA gene copy number and linuron mineralization 172
potential to linuron application. A detailed description of those experiments is found in 173
Bers et al. (9). Briefly, two adjacent potato field plots were either not treated with any 174
herbicide (Plot P0) or from day 0 onwards treated with 450 g linuron ha-1 (Plot PF). 175
Top soil samples were taken from each plot at three different positions (marked as A, 176
B and C in plot PF and D, E and F in plot P0) at day 0, before the pesticide 177
application, and at day 20 and 34 after the treatment. At each position, three soil 178
samples were taken in a radius of 0.2 m. Soil samples were homogenized and used 179
for DNA extraction for molecular analysis, dry weight measurement and 14C-linuron 180
mineralization assays in triplicate (9). After 176 days of pesticide treatment, soil 181
samples, taken from all six positions in plots P0 and PF, were mixed and six SMs 182
were setup consisting of glass columns (height 10 cm; diameter 4 cm) filled with the 183
soil mixture. All SMs were incubated at 25°C. Three SMs were irrigated with tap 184
water with linuron and three were irrigated with linuron-free tap water (9) according to 185
the scheme shown in Fig. 1 (9). For some SM replicates that originally received 186
linuron, linuron application was intermittently stopped as pictured in Fig. 1. At 187
selected time points, soil samples were taken for DNA extraction as reported (9). 188
Other DNA extracts used were those recovered previously from linuron mineralizing 189
liquid enrichment cultures that were started from samples of linuron fed soil 190
microcosms (‘L SM A’, ‘L SM B’ and ‘L SM C’) as described (9). 191
DNAs from Biopurification systems. Used BPS DNA extracts originated from a BM 192
experiment previously described by Sniegowski et al. (16, 20). Detailed description of 193
the experiment is found in Sniegowski et al. (16, 20). Briefly, the experiment made 194
on May 17, 2018 by guest
http://aem.asm
.org/D
ownloaded from
10
use of BMs set up in glass columns (height 10 cm; diameter 4 cm) filled with a 195
mixture of 25 vol% cut straw, 25 vol% peat and 50 vol% soil. The soil was either a 196
non-linuron primed soil C (BM type C) or a linuron primed soil L (BM type L). Soil L 197
originated from the agricultural field studied in the field experiment described above 198
but was taken at another location within the field and two years before the field 199
experiment. Soil C was a subsurface soil obtained from a construction site. All setups 200
were performed in triplicate. The setups were subjected to different treatments and 201
periods of stress (drought, freezing) as shown in Fig. 1 (16, 20). Samples were taken 202
as outlined in Fig. 1. 203
Data analysis. libA gene copy numbers, 16S rRNA gene copy numbers and linuron 204
mineralization capacity data used in this study were taken from previous reports (9, 205
16, 20, 21). The lag time determined in the linuron mineralization kinetics recorded in 206
linuron mineralization assays using samples taken from the field or SM and BM 207
experiments as inoculum were used as a measure for the linuron mineralization 208
capacity, i.e., the shorter the lag phase, the higher the mineralization capacity (9, 16). 209
The results were subjected to Student’s t-test on a significance level of 0.05 to 210
assess differences between gene copy numbers and to assess effects of linuron 211
application and perturbations. 212
Results 213
hylA and dcaQ dynamics in agricultural soil. The dynamics of hylA gene 214
abundancies were similar to those previously reported for libA, but throughout the 215
experiment hylA gene copy numbers were at least two log10 units higher than those 216
of libA both in the linuron-treated and non-treated plots (Fig. 2). At day 20, as was the 217
case for libA, hylA abundancies had significantly increased (40 to 80-fold) at two of 218
on May 17, 2018 by guest
http://aem.asm
.org/D
ownloaded from
11
the three sampling positions in the linuron treated plot PF compared to day 0 and 219
were significantly higher than those in the non-treated plot P0 (Fig. 2). Similar to libA 220
gene copy numbers at day 34, hylA gene copy numbers had decreased again to an 221
abundance similar to this at day 0. Overall, gene copy numbers of dcaQI and dcaQII 222
followed the same dynamics as libA and hylA with the highest number at day 20 in 223
the linuron treated plots. However, dcaQI and dcaQII abundancies were never in the 224
same order as those of libA and hylA. Especially dcaQII showed high copy numbers 225
that were 10 times higher than hylA and up to a 1000 times higher than libA at day 20 226
in the linuron treated plots. We conclude that as for libA, hylA, dcaQI and dcaQII 227
abundancies were highest when the mineralization capacity in the linuron treated 228
plots was highest compared to the non-treated plots, i.e., at day 20. At that time 229
point, the lag phase of linuron mineralization as a measure for the mineralization 230
capacity was reduced to approximately 5 days in the treated plot compared to the 8 231
days in the non-treated plot. Apparently, to obtain this reduction, the gene copy 232
numbers of libA, hylA, dcaQI and dcaQII have to reach respectively 1.7±0.4 x 10⁻⁴ %, 233
8.3±31 x 10-2 %, 1.8±40 x 10-3 % and 4.7±17.3 x 10⁻¹ % of the total number of 16S 234
rRNA gene copies. 235
In the controlled SM experiment, hylA gene copy numbers were initially (before 236
feeding with linuron) relatively high and as in the field, exceeded libA gene copy 237
numbers with a factor 100 to 1000 despite the low linuron mineralization capacity 238
(Table 2). These initial high hylA abundances were only maintained in microcosms 239
treated with linuron (Table 2) implying that the maintenance of the hylA containing 240
population(s) depended on linuron application. At day 149, hylA gene copy numbers, 241
however, also increased in the control microcosms which can be attributed to the 242
drought period between day 78 and day 110. A similar observation was previously 243
on May 17, 2018 by guest
http://aem.asm
.org/D
ownloaded from

12
done for libA (Table 2) (9). In case of linuron application, hylA abundance increased 244
further until 2.82±0.72 % of the bacterial 16S rRNA gene copies at day 491. The 245
dependency of hylA gene copy numbers on linuron was further apparent from the 246
drops in hylA abundance in replicate L-SM-C and replicate L-SM-B after ceasing 247
linuron application from day 159 till day 285 and from day 285 till day 491, 248
respectively (Table 2). Compared to hylA, both dcaQI and dcaQII abundances were 249
respectively a factor 1000 and 10 less at the start of the SM experiment (Fig. 3 and 250
Table 2). dcaQ gene copy numbers and especially those of dcaQII responded 251
positively on linuron application, but never coincided with hylA or libA abundances. 252
As libA and hylA, both dcaQI and dcaQII increased in abundance independently from 253
linuron application after the drought period between days 78 and 110. Ceasing 254
linuron application in microcosm L SM B affected dcaQII abundance (Fig. 3 and Table 255
2). Overall, it can be concluded that gene copy numbers of most catabolic markers 256
(except dcaQI) were highest when the mineralization capacity was highest. Lag times 257
as low as 0.7 days were reached in linuron fed SMs which corresponded with libA, 258
hylA, dcaQI and dcaQII abundances of, respectively, 5.4±1.4 x 10⁻¹ %, 1.5±0.6 x 10-259
1 % , 8.2±3.4 x 10⁻³ % and 5.1±2.2 x 100 % of the total number of 16S rRNA gene 260
copies. In addition, as previously found for libA, a correlation was found between 261
dcaQII gene copy numbers and lag time (representing the mineralization capacity) 262
(Fig. 4). This correlation was less obvious for hylA particularly due to the gene copy 263
numbers recorded at day 0 and for microcosm L-SM-B at day 491 where hylA gene 264
copy numbers were fairly high but mineralization capacity was relatively low (Fig. 4). 265
In Bers et al. (9), liquid enrichment cultures using linuron as sole source of carbon 266
and energy were obtained from soil samples taken from plot PF 20 days after 267
application of linuron and from soil samples taken from the linuron fed SMs on day 268
on May 17, 2018 by guest
http://aem.asm
.org/D
ownloaded from
13
134 of incubation. In these enrichment cultures, libA abundance became under the 269
detection limit after a few transfers although Variovorax was still present (9). 270
Conventional PCR targeting hylA showed that hylA instead of libA became the 271
dominant linuron hydrolysis gene in those cultures upon prolonged enrichment (see 272
Supplementary Figure S1). 273
hylA and dcaQ dynamics in biopurification systems. In BMs containing primed 274
soil L, overall hylA behaved similarly to libA (Fig. 5, top), although hylA abundances 275
were generally higher than those of libA (2 to 10 times). Similar to libA, hylA clearly 276
responded to the linuron feed with increasing gene copy numbers in the treated 277
microcosms and a decrease of gene copy numbers when linuron feed stopped. A 278
cold period without linuron application did not affect hylA gene copy numbers. While 279
the drought period without linuron application did neither affect libA and hylA 280
abundance, consequent rewetting and resuming the feed with linuron after the 281
drought period, resulted into a dramatic increase of hylA gene copy numbers until 282
2.3±0.3 x 10⁻⁴ % of the 16S rRNA gene copy number. In the non-linuron treated BMs 283
containing primed soil, drought-wetting events affected both libA and hylA gene copy 284
numbers positively. The abundance of dcaQI followed a similar increasing trend as 285
libA in the linuron treated BMs although the initial increase between week 0 and 286
week 2 was a 10-fold higher than for libA. dcaQII gene copy numbers remained 287
similar to those of hylA and followed a similar trend, but diverged towards the end to 288
a 10-fold difference (dcaQII > hylA) where it became the dominant dcaQ variant. In 289
the BMs containing primed soil, the highest linuron mineralization capacity (lowest lag 290
phase, 0.8±0.1 days) was reached in the linuron treated BMs at week 55 291
corresponding to the highest percentage of dcaQII (2.9±0.3 x 10⁻² %), dcaQI (1.4±0.3 292
on May 17, 2018 by guest
http://aem.asm
.org/D
ownloaded from
14
x 10-3 %), hylA (2.3±0.2 x 10⁻³ %) and libA (5.0±2.7 x 10⁻⁵ %) of the 16S rRNA gene 293
copy number. 294
In BMs containing non-primed soil C, libA was previously recorded in gene copy 295
numbers above the detection limit in only one replicate BM, i.e., BM3 of setup C+ 296
although similar high linuron mineralization capacities developed in the other two 297
replicates (9). In contrast to libA, hylA was detected at most time points except when 298
the mineralization capacity was very low (for instance week 17). However, even when 299
the mineralization capacity was relatively high (short lag time), for instance at week 300
55, hylA abundances were extremely low (down to 1.4±1.6 x 10⁻⁷ %) even in 301
replicates were libA gene copy numbers were below the detection limit (Fig. 5, 302
bottom). Despite the low abundancies of libA or hylA gene copies and the low linuron 303
mineralization capacity, both dcaQ genes increased in the first 17 weeks of linuron 304
treatment to reach and hold a high abundance until the end of the linuron treatment. 305
Nevertheless, linuron mineralization lag time was at a minimum when the copy 306
numbers of dcaQ genes were at a maximum, i.e., at week 55. No linuron 307
mineralization occurred in the samples taken from water treated BMs with non-308
primed soil. libA was not detected in any of these samples, while hylA and both dcaQ 309
genes were detected at low copy numbers (approx. 10-7 % of the 16S rRNA gene 310
copy number) . We conclude that in the BMs containing non-primed soil, the highest 311
linuron mineralization capacity (lowest lag time, 1.3±0.3 days) was reached in the 312
linuron treated BMs at day 55 corresponding to the highest percentage of dcaQII 313
(1.06±1.06 x 10⁻⁴ %), dcaQI (5.6±1.2 x 10⁻⁴ %) of the 16S rRNA gene copy number 314
but not of hylA (1.4±1.6 x 10⁻⁷ %) and libA (3.3 x 10⁻⁵ % in only one replicate BM3). 315
Discussion 316
on May 17, 2018 by guest
http://aem.asm
.org/D
ownloaded from
15
libA, hylA and dcaQ dynamics in agricultural soil. Our results show that hylA 317
gene copy numbers, like libA gene copy numbers, clearly depended and responded 318
to the application of linuron in agricultural soil with a history of linuron application. 319
Both hylA and libA containing bacteria were previously isolated from that soil and, 320
hence, known to be endogenous to the studied field (22). We conclude that as a 321
response to linuron application, both hylA and libA carrying bacteria grow in the soil 322
indicating that bacteria carrying hylA compete successfully with those carrying libA in 323
the same soil. None of the two are really outcompeted indicating that both benefit 324
simultaneously from the applied linuron to grow and/or maintain their population size. 325
It also indicates that hylA carrying hosts, in addition to libA carrying hosts, contribute 326
to linuron degradation in the soil. This is in contrast with studies that follow the 327
dynamics of alternative tfdA genes that encode for the enzyme that initiates the 328
metabolism of phenoxy acid herbicides, in soils as a response to treatment with 329
different types of phenoxy acid herbicides. It was found that depending on the 330
phenoxy acid substrate, specific tfdA gene groups became dominant, despite the 331
initial presence of multiple groups (11, 13, 23), implying that in case of phenoxy acid 332
herbicides the initial assessment of functional genes in soils does not necessarily 333
reflect the organisms or genes that proliferate and perform the degradation of the 334
compounds in question, which is the case in our study. 335
The high initial abundance of hylA in the agricultural soil at the start of the field 336
experiment might be a result of growth of hylA containing bacteria on residual linuron 337
from previous applications in the field and a higher persistence of those populations 338
compared to the libA carrying populations under field conditions. Surprisingly, in 339
contrast to libA, relatively high gene copy numbers of hylA in the agricultural soil did 340
not always correspond to a high linuron mineralization capacity (9) (see Fig. 4,and 341
on May 17, 2018 by guest
http://aem.asm
.org/D
ownloaded from
16
Table 2, day 0 and day 491 for microcosm L-SM-B after linuron application was 342
ceased) indicating that hylA gene copy numbers do not always contribute to the 343
measured mineralization capacity. This is explained by the abundances of dcaQ 344
involved in the downstream metabolism of linuron and hence actual 14C-labeled CO2 345
production. In contrast to other time points for which a high mineralization capacity 346
was recorded, dcaQ and more precisely dcaQII, showed relatively low gene copy 347
numbers at day 0 and for microcosm L-SM-B at day 491. The high gene copy 348
numbers of hylA containing bacteria and low gene copy numbers of dcaQ containing 349
bacteria indicates that at those time points linuron was converted to 3,4-DCA but only 350
slowly mineralized beyond 3,4-DCA and as such explains the apparent incongruence 351
between high hylA abundances and low linuron mineralization capacity. These data 352
have other important implications since it shows that hylA containing bacteria do not 353
always contain the downstream pathway and as such must make part of consortia 354
including 3,4-DCA mineralizing organisms that do not convert linuron into 3,4-DCA. 355
At other time points though, dcaQ gene copy numbers often exceeded hylA gene 356
copy numbers which implies that (i) each dcaQ containing cell might contain a hylA 357
copy but also that (ii) populations that only contained the 3,4-DCA catabolic pathway 358
profited from organisms that perform HylA/LibA activity. The complex dynamics of the 359
examined catabolic genes suggest a high plasticity of the different catabolic gene 360
modules involved in linuron degradation in the agricultural soil as a response to 361
linuron application potentially involving horizontal gene transfer as previously 362
suggested by Dunon et al. (24) Interestingly, hylA was identified in Variovorax strains 363
that are part of consortia in which efficient linuron conversion to 3,4-DCA and the 364
further mineralization of 3,4-DCA depend on synergistic metabolic interactions 365
between Variovorax and other bacteria. In the consortium reported by Dejonghe et al. 366
on May 17, 2018 by guest
http://aem.asm
.org/D
ownloaded from

17
(4), Variovorax sp. WDL1 that carries hylA, converts linuron to 3,4-DCA. Strain WDL1 367
can grow on 3,4-DCA but the conversion of 3,4-DCA is not that efficient, leading to a 368
release of 3,4-DCA that is used for growth by a second consortium member 369
Comamonas testosteroni WDL7. Concomitant removal of 3,4-DCA in the culture in 370
turn results into an improved rate of conversion of linuron by strain WDL1. In another 371
similarly composed consortium that depends on hylA for initial linuron hydrolysis, a 372
similar cooperation exists (3). IncP-1 plasmids are part of these consortia and for 373
instance carry the genes for 3,4-DCA biodegradation in strain WDL7 (19). In contrast 374
to hylA, libA was primarily found in Variovorax strains such as strain SRS16 (6), that 375
show efficient conversion of 3,4-DCA and hence growth on linuron as single strains. 376
libA gene copy numbers were always below dcaQ gene copy numbers and hence 377
each libA containing cell might contain a dcaQ gene copy. Interestingly, in liquid 378
cultures enriched for organisms that use linuron as sole C-source and initiated from 379
the studied agricultural soil, the coexistence of libA and hylA containing bacteria is 380
lost and hylA containing consortia start dominating. Apparently, libA containing 381
bacteria are less competitive than hylA containing strains under those culture 382
conditions. 383
libA, hylA, and dcaQ dynamics in BPS. The results show, that as in the agricultural 384
soil, in the BPS matrix containing primed soil, hylA containing bacteria compete 385
successfully with libA containing bacteria for linuron as a carbon source and grow 386
alongside. hylA gene copy numbers did not respond on linuron application in BMs 387
containing non-primed soil indicating that hylA carrying micro-organisms likely 388
originate from soil L that was included in the BM matrix indicating a successful 389
invasion of hylA linuron degrading bacteria from that primed soil in the overall 390
system. The same was concluded for libA (21). As for libA, hylA abundance appear 391
on May 17, 2018 by guest
http://aem.asm
.org/D
ownloaded from
18
to correlate with the observed dynamics of the linuron mineralization capacity in the 392
system containing primed soil, i.e., hylA gene copy numbers were relatively high and 393
low when the linuron mineralization capacity was high and low, respectively (Fig. 6). 394
Interestingly, between week 51 and week 55, libA gene copy numbers remained the 395
same or even tended to decrease in linuron amended BMs while the linuron 396
mineralization capacity significantly increased. In contrast, hylA gene copy numbers 397
were extremely high and had increased 8-fold from week 51 onward. This occurred 398
after the drought-rewetting period implemented between weeks 42 and 51. A similar 399
observation was done for hylA in the non-treated BMs containing primed soil, 400
indicating that this stress situation benefitted hylA carrying populations in BPS. In 401
contrast, libA carrying bacteria seem to benefit first from the drought stress in the 402
non-linuron treated microcosms. In contrast to the agicultural soil, dcaQ gene copy 403
numbers always exceeded hylA/libA gene copy numbers implying that each hylA/libA 404
containing cell might also contain a dcaQ gene copy. However, populations that only 405
contained dcaQ clearly benefitted from linuron application suggesting that as in the 406
agricultural soil, 3,4-DCA degrading organisms that only contain the pathway beyond 407
3,4-DCA profited from LibA/HylA activity performed by other organisms. 408
In the linuron fed BM setup that contained non-linuron primed soil, some response of 409
hylA gene copy numbers was recorded upon addition of linuron but this population 410
seems to deteriorate in time despite the maintenance of a high linuron mineralization 411
capacity. Previously, libA was only recorded to respond to linuron application in one 412
of the replicates of that SM setup and also not always explaining the observed high 413
mineralization capacity. As such, we conclude that still other linuron hydrolases or 414
biochemical systems to initiate linuron mineralization exist in that environment likely 415
originating from the non-primed soil C. PuhA (25) and PuhB (26) are other enzymes 416
on May 17, 2018 by guest
http://aem.asm
.org/D
ownloaded from

19
isofunctional to LibA and HylA, involved in linuron hydrolysis by Gram-positive 417
bacteria, but they have never been linked with mineralization of linuron. They might 418
form other alternatives for initiating linuron mineralization in the environment carrying 419
that capacity, potentially in accordance with dcaQ containing populations that clearly 420
proliferated upon linuron addition in the linuron-amended SMs containing non-primed 421
soil. 422
Conclusions. Our results provide further insight in the microbial ecology of linuron 423
biodegradationin agricultural environments. Both organisms containing libA and hylA 424
coexist and contributed to linuron biodegradation. However, situations occur in which 425
one is privileged over the other as observed under liquid enrichment conditions in 426
minimal medium and in the BM experiment after the drought-wet period. This might 427
be related to the particular bacterial host which carry the genes or otherwise to the 428
enzymatic kinetic parameters of the corresponding enzymes. LibA is known to have a 429
two-fold higher affinity for linuron compared to HylA. Due to a lack of data on the 430
maximal specific conversion rates for LibA, it is difficult, however, to conclude on the 431
role of the linuron hydrolysis kinetic parameters on usage of linuron as a growth 432
substrate. Our study further shows that both hydrolysis genes as well as downstream 433
catabolic genes should be used for assessing linuron mineralization capacity in 434
environmental samples. However, other (unknown) enzymes initiating linuron 435
mineralization apparently exist in the environment. Furthermore, our data strongly 436
suggest that consortia involving both linuron hydrolyzing organisms and organisms 437
that further degrade the produced 3,4-DCA cooperate in complete linuron 438
mineralization in the examined ecosystems. Moreover, complex dynamics and 439
interactions of hydrolysis genes and downstream catabolic genes exist in the 440
examined ecosystems potentially involving horizontal gene transfer. To the best of 441
on May 17, 2018 by guest
http://aem.asm
.org/D
ownloaded from

20
our knowledge, this is the first proof of the presence and activity of pesticide 442
degraders functioning as synergistic consortia in natural environments. 443
Acknowledgements. 444
This research was funded by FWO post-doctoral fellow grant n° 12Q0215N and grant 445
n°G.0371.06, IWT (Innovation by Science and Technology) project SB/73381, 446
OT10/03 project of KU Leuven, and the Inter-University Attraction Pole (IUAP) “µ-447
manager” of the Belgian Science Policy (BELSPO, P7/25). 448
on May 17, 2018 by guest
http://aem.asm
.org/D
ownloaded from

21
References 449
1. Caux PY, Kent RA, Fan GT, Grande C. 1998. Canadian water quality guidelines for linuron. 450 Environ Toxicol and Water Quality 13:1-41. 451
2. Sørensen SR, Bending GD, Jacobsen CS, Walker A, Aamand J. 2003. Microbial degradation of 452 isoproturon and related phenylurea herbicides in and below agricultural fields. FEMS 453 Microbiol Ecol 45:1-11. 454
3. Breugelmans P, D'Huys P-J, De Mot R, Springael D. 2007. Characterization of novel linuron-455 mineralizing bacterial consortia enriched from long-term linuron-treated agricultural soils. 456 FEMS Microbiol Ecol 62:374-385. 457
4. Dejonghe W, Berteloot E, Goris J, Boon N, Crul K, Maertens S, Höfte M, Vos PD, Verstraete 458 W, Top EM. 2003. Synergistic degradation of linuron by a bacterial consortium and isolation 459 of a single linuron-degrading Variovorax strain. Appl Environ Microbiol 69:1532-1541. 460
5. Satsuma K. 2010. Mineralisation of the herbicide linuron by Variovorax sp. strain RA8 461 isolated from Japanese river sediment using an ecosystem model (microcosm). Pest Manage 462 Sci 66:847-852. 463
6. Sørensen SR, Rasmusse J, Jacobsen CS, Jacobsen OS, Juhler RK, Aamand J. 2005. Elucidating 464 the key members of a linuron-mineralizing bacterial community by PCR and reverse 465 transcription-PCR denaturing gradient gel electrophoresis 16S rRNA gene fingerprinting and 466 cultivation. Appl Environ Microbiol 71:4144-4148. 467
7. Bers K, Leroy B, Breugelmans P, Albers P, Lavigne R, Sørensen SR, Aamand J, De Mot R, 468 Wattiez R, Springael D. 2011. A novel hydrolase identified by genomic-proteomic analysis of 469 phenylurea herbicide mineralization by Variovorax sp. strain SRS16. Appl Environ Microbiol 470 77:8754-8764. 471
8. Bælum J, Jacobsen CS, Holben WE. 2010. Comparison of 16S rRNA gene phylogeny and 472 functional tfdA gene distribution in thirty-one different 2,4-dichlorophenoxyacetic acid and 473 4-chloro-2-methylphenoxyacetic acid degraders. Syst Appl Microbiol 33:67-70. 474
9. Bers K, Mot RD, Springael D. 2013. In situ response of the linuron degradation potential to 475 linuron application in an agricultural field. FEMS Microbiol Ecol 85:403-416. 476
10. Bers K, Batisson I, Proost P, Wattiez R, De Mot R, Springael D. 2013. HylA, an alternative 477 hydrolase for initiation of catabolism of the phenylurea herbicide linuron in Variovorax sp. 478 strains. Appl Environ Microbiol 79:5258-5263. 479
11. Baelum J, Nicolaisen MH, Holben WE, Strobel BW, Sorensen J, Jacobsen CS. 2008. Direct 480 analysis of tfdA gene expression by indigenous bacteria in phenoxy acid amended agricultural 481 soil. ISME J 2:677-687. 482
12. Morán AC, Müller A, Manzano M, González B. 2006. Simazine treatment history determines 483 a significant herbicide degradation potential in soils that is not improved by bioaugmentation 484 with Pseudomonas sp. ADP. J Appl Microbiol 101:26-35. 485
13. Bælum J, Henriksen T, Bruun Hansen HC, Jacobsen CS. 2006. Degradation of 4-chloro-2-486 methylphenoxyacetic acid in top- and subsoil is quantitatively linked to the class III tfdA gene. 487 Appl Environ Microbiol 72:3803. 488
14. Ditterich F, Poll C, Pagel H, Babin D, Smalla K, Horn MA, Streck T, Kandeler E. 2013. 489 Succession of bacterial and fungal 4-chloro-2-methylphenoxyacetic acid degraders at the 490 soil–litter interface. FEMS Microbiol Ecol 86:85-100. 491
15. Bælum J, Prestat E, David MM, Strobel BW, Jacobsen CS. 2012. Modeling of phenoxy acid 492 herbicide mineralization and growth of microbial degraders in 15 soils monitored by 493 quantitative real-time PCR of the functional tfdA gene. Appl Environ Microbiol 78:5305-5312. 494
16. Sniegowski K, Bers K, Ryckeboer J, Jaeken P, Spanoghe P, Springael D. 2011. Robust linuron 495 degradation in on-farm biopurification systems exposed to sequential environmental 496 changes. Appl Environ Microbiol 77:6614-6621. 497
on May 17, 2018 by guest
http://aem.asm
.org/D
ownloaded from

22
17. Bers K, Sniegowski K, Albers P, Breugelmans P, Hendrickx L, De Mot R, Springael D. 2010. A 498 molecular toolbox to estimate the number and diversity of Variovorax in the environment: 499 application in soils treated with the phenylurea herbicide linuron. FEMS Microbiol Ecol 76:14-500 25. 501
18. Breugelmans P, Leroy B, Bers K, Dejonghe W, Wattiez R, De Mot R, Springael D. 2010. 502 Proteomic study of linuron and 3,4-dichloroaniline degradation by Variovorax sp. WDL1: 503 evidence for the involvement of an aniline dioxygenase-related multicomponent protein. Res 504 Microbiol 161:208-218. 505
19. Król JE, Penrod JT, McCaslin H, Rogers LM, Yano H, Stancik AD, Dejonghe W, Brown CJ, 506 Parales RE, Wuertz S, Top EM. 2012. Role of IncP-1β plasmids pWDL7::rfp and pNB8c in 507 chloroaniline catabolism as determined by genomic and functional analyses. Appl Environ 508 Microbiol 78:828-838. 509
20. Sniegowski K, Bers K, Van Goetem K, Ryckeboer J, Jaeken P, Spanoghe P, Springael D. 2011. 510 Improvement of pesticide mineralization in on-farm biopurification systems by 511 bioaugmentation with pesticide-primed soil. FEMS Microbiol Ecol 76:64-73. 512
21. Bers K, Sniegowski K, De Mot R, Springael D. 2012. Dynamics of the linuron hydrolase libA 513 gene pool size in response to linuron application and environmental perturbations in 514 agricultural soil and on-farm biopurification systems. Appl Environ Microbiol 78:2783-2789. 515
22. Breugelmans P, Barken KB, Tolker-Nielsen T, Hofkens J, Dejonghe W, Springael D. 2008. 516 Architecture and spatial organization in a triple-species bacterial biofilm synergistically 517 degrading the phenylurea herbicide linuron. FEMS Microbiol Ecol 64:271-282. 518
23. Bælum J, Jacobsen CS. 2009. TaqMan probe-based real-time PCR assay for detection and 519 discrimination of class I, II, and III tfdA genes in soils treated with phenoxy acid herbicides. 520 Appl Environ Microbiol 75:2969-2972. 521
24. Dunon V, Sniegowski K, Bers K, Lavigne R, Smalla K, Springael D. 2013. High prevalence of 522 IncP-1 plasmids and IS1071 insertion sequences in on-farm biopurification systems and other 523 pesticide-polluted environments. FEMS Microbiol Ecol 86:415-431. 524
25. Turnbull GA, Ousley M, Walker A, Shaw E, Morgan JAW. 2001. Degradation of substituted 525 phenylurea herbicides by Arthrobacter globiformis strain D47 and characterization of a 526 plasmid-associated hydrolase gene, puhA. Appl Environ Microbiol 67:2270-2275. 527
26. Khurana J, Jackson C, Scott C, Pandey G, Horne I, Russell R, Herlt A, Easton C, Oakeshott J. 528 2009. Characterization of the phenylurea hydrolases A and B: founding members of a novel 529 amidohydrolase subgroup. Biochem J 418:431-441. 530
531
532
on May 17, 2018 by guest
http://aem.asm
.org/D
ownloaded from

23
Table 1. Primer pairs used for either regular PCR or real time PCR targeting linuron specific catabolic genes 533
Target Primer* Primer sequence Amplicon size Genbank filehylA HylA-F AGGTCATGTCCACTCGCGTCT 1905 KC146403;
HylA-R GCCGATGCATAGGGCCATATTTGCT KC146406 HylA-RT-F GCATGGGTCTGTTGCTGATAC 90 HylA-RT-R CTGCGTGGAACTTCACTGTTAG
dcaQI dca I-F CTCTCATGGCCGGATCAATA 272 JN104632.1 dca I-R TACAGATCGGCCAGCATCCA dca I-RT F AAGGGATTGAACACGAAGGC 137 dca I-RT R TGGCCGGATCAATATGGTCTG
dcaQII dca II-F CGCCCACTGGTCATGTAAAG 377 KC146405.1 dca II-R GAAAAGCACGGCATCTGGTC dca II-RT F GCCAAGACAACCGAACCATC 80 dca II-RT R GGATACCCAGAAAGCCGCA
* Primers including RT in their designation where used for real time qPCR. The others for conventional PCR. 534 F in the primer naming indicates the forward primer, R the reverse primer. 535
536
537
on May 17, 2018 by guest
http://aem.asm
.org/D
ownloaded from
24
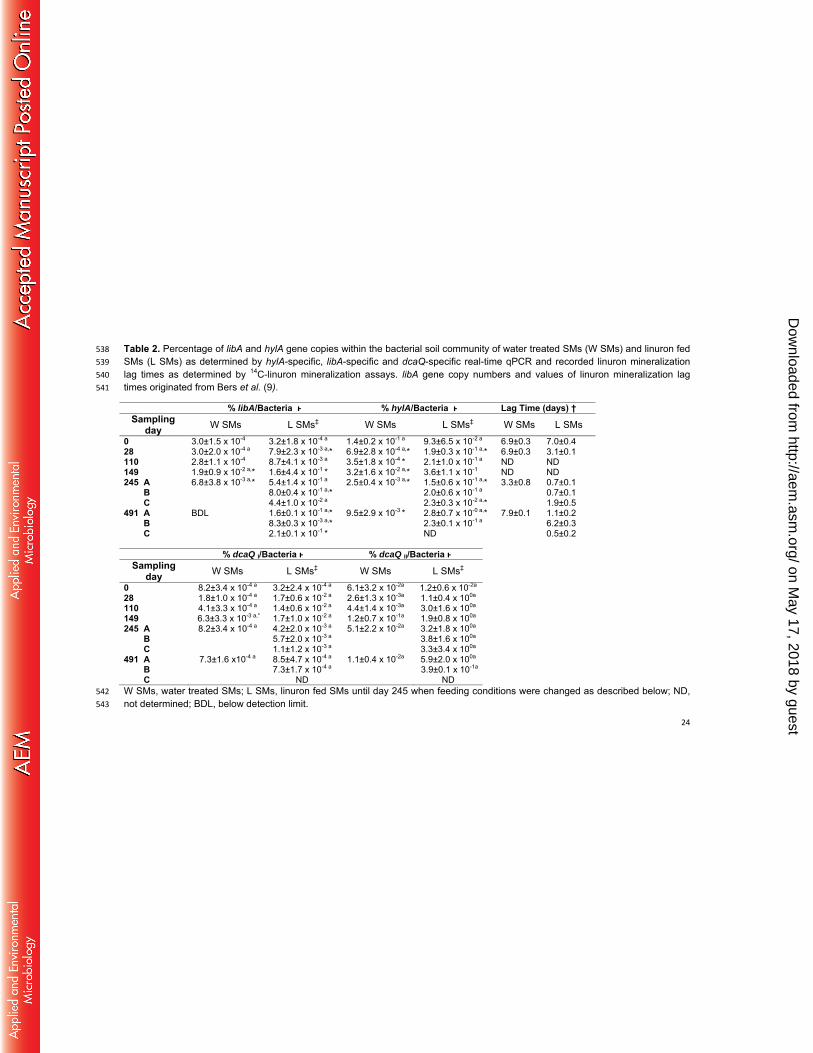
Table 2. Percentage of libA and hylA gene copies within the bacterial soil community of water treated SMs (W SMs) and linuron fed 538 SMs (L SMs) as determined by hylA-specific, libA-specific and dcaQ-specific real-time qPCR and recorded linuron mineralization 539 lag times as determined by 14C-linuron mineralization assays. libA gene copy numbers and values of linuron mineralization lag 540 times originated from Bers et al. (9). 541
% libA/Bacteria ⱶ % hylA/Bacteria ⱶ Lag Time (days) † Sampling
day W SMs L SMs‡ W SMs L SMs‡ W SMs L SMs 0 3.0±1.5 x 10⁻⁴ 3.2±1.8 x 10⁻⁴ a 1.4±0.2 x 10⁻¹ a 9.3±6.5 x 10⁻² a 6.9±0.3 7.0±0.4 28 3.0±2.0 x 10⁻⁴ a 7.9±2.3 x 10⁻³ a,* 6.9±2.8 x 10⁻⁴ a,* 1.9±0.3 x 10⁻¹ a,* 6.9±0.3 3.1±0.1 110 2.8±1.1 x 10⁻⁴ 8.7±4.1 x 10⁻³ a 3.5±1.8 x 10-4 * 2.1±1.0 x 10⁻¹ a ND ND 149 1.9±0.9 x 10⁻² a,* 1.6±4.4 x 10-1 * 3.2±1.6 x 10⁻² a,* 3.6±1.1 x 10⁻¹ ND ND 245 A 6.8±3.8 x 10⁻³ a,* 5.4±1.4 x 10⁻¹ a 2.5±0.4 x 10⁻³ a,* 1.5±0.6 x 10⁻¹ a,* 3.3±0.8 0.7±0.1 B 8.0±0.4 x 10⁻¹ a,* 2.0±0.6 x 10⁻¹ a 0.7±0.1 C 4.4±1.0 x 10⁻² a 2.3±0.3 x 10⁻² a,* 1.9±0.5 491 A BDL 1.6±0.1 x 10⁻¹ a,* 9.5±2.9 x 10-3 * 2.8±0.7 x 10-0 a,* 7.9±0.1 1.1±0.2 B 8.3±0.3 x 10⁻³ a,* 2.3±0.1 x 10⁻¹ a 6.2±0.3 C 2.1±0.1 x 10⁻¹ * ND 0.5±0.2
% dcaQ I/Bacteria ⱶ % dcaQ II/Bacteria ⱶ Sampling
day W SMs L SMs‡ W SMs L SMs‡ 0 8.2±3.4 x 10⁻⁴ a 3.2±2.4 x 10⁻⁴ a 6.1±3.2 x 10⁻²a 1.2±0.6 x 10⁻²a 28 1.8±1.0 x 10⁻⁴ a 1.7±0.6 x 10⁻² a 2.6±1.3 x 10⁻³a 1.1±0.4 x 100a 110 4.1±3.3 x 10⁻⁴ a 1.4±0.6 x 10⁻² a 4.4±1.4 x 10⁻³a 3.0±1.6 x 100a 149 6.3±3.3 x 10⁻³ a,* 1.7±1.0 x 10⁻² a 1.2±0.7 x 10⁻¹a 1.9±0.8 x 100a 245 A 8.2±3.4 x 10⁻⁴ a 4.2±2.0 x 10⁻³ a 5.1±2.2 x 10⁻²a 3.2±1.8 x 100a B 5.7±2.0 x 10⁻³ a 3.8±1.6 x 100a C 1.1±1.2 x 10⁻³ a 3.3±3.4 x 100a 491 A 7.3±1.6 x10⁻⁴ a 8.5±4.7 x 10⁻⁴ a 1.1±0.4 x 10⁻²a 5.9±2.0 x 100a B 7.3±1.7 x 10⁻⁴ a 3.9±0.1 x 10⁻¹a C ND ND W SMs, water treated SMs; L SMs, linuron fed SMs until day 245 when feeding conditions were changed as described below; ND, 542 not determined; BDL, below detection limit. 543
on May 17, 2018 by guest
http://aem.asm
.org/D
ownloaded from
25
ⱶ Average values (Avg) with standard deviation (SD) determined for triplicate SMs, all three measured in duplicate (n=6). Notation 544 is as follows: Avg±SD x 10Y with an exponent Y referring to both the average value and the standard deviation. 545
† Average values with standard deviation determined for duplicate samples of each SM 546 ‡ At day 245 and day 491, the results for microcosms ‘L SM A’, ‘L SM B’ and ‘L SM C’ are shown separately, with SM replicates ‘L 547
SM A’, ‘L SM B’, and ‘L SM C’ marked as A, B, and C, respectively, in the first column together with the sampling day. Linuron 548 supply was ceased after day 159 and resumed at day 285 for ‘L SM C’. After day 245, linuron supply was ceased for ‘L SM B’. 549
* Significant (p<0.05) differences in the abundance of genes on a sampling day compared to the preceding one within a specific 550 setup are indicated with ‘*’ behind the values. 551
a Significant (p<0.05) differences between the abundance of libA and hylA and dcaQI and dcaQII in a setup at a specific sampling 552 day are indicated behind the values. 553
on May 17, 2018 by guest
http://aem.asm
.org/D
ownloaded from

26
Figure legends 554
Fig. 1. Treatment schemes used in the microcosm experiments. In the agricultural 555
soil microcosm (SM) experiment (top), as described by Bers et al. (9), SMs A, B and 556
C were treated with linuron with an intermittent period of no linuron application for SM 557
A and SM B. SMs D,E and F were never treated with linuron. A drought period 558
without linuron application was invoked as indicated. In the BPS microcosm (BM) 559
experiment (bottom) as described by Bers et al. (21) and Sniegowski et al. (20), the 560
BPS matrix contained either linuron primed soil L or non-primed soil C. The BMs 561
were either treated with linuron (L+/C+) or with water (L-/C-). Linuron treatment was 562
ceased between week 12 and week 22 for BMs L+ and C+ and an intermittent 563
drought and cold period without linuron application was invoked for all BMs. 564
Fig. 2. Abundances of libA, hylA, dcaQI and dcaQII in samples taken at day 0, 20 and 565
34 from positions A, B and C in the linuron treated field plot PF and positions D, E 566
and F in the non-treated field plot P0. Reported values are the log10 of the average 567
hylA gene copy numbers expressed as a percentage of the bacterial 16S rRNA gene 568
copy number with SD (n=6; 3 soil samples per position, 2 qPCRs per sample) 569
(approx. 109 bacterial 16S rRNA gene copies/ g soil). Student’s t-test was used to 570
determine significant differences in treatment and time points (P<0.05). The asterisk 571
above the bar marks a significant difference in gene abundance at a specific position 572
(n=6) in a linuron treated plot when compared to the average abundance of that 573
gene determined at positions D, E and F of the non-treated field plot P0 at the same 574
time point. To indicate whether gene abundance is significantly different between 575
different time points at a specific position, a, b and c are used as markers above the 576
bars of each position. The ‘a’ marks a significant increase between day 0 and day 20, 577
on May 17, 2018 by guest
http://aem.asm
.org/D
ownloaded from
27
‘b’ marks a significant decrease between day 20 and day 34 and ‘c’ marks a 578
significant increase between day 0 and day 34. Lag time (bottom) as a measure for 579
the linuron mineralization capacity is shown for each position of plots PF and P0 on 580
day 0, 20 and 34. Values are averages (n = 3, 3 soil samples per position) with SD 581
shown as error bars. Values for libA abundances and mineralization capacity (lag 582
time) were taken from Bers et al. (9). 583
Fig. 3 Abundances of catabolic genes encoding linuron mineralization in the water 584
treated (left) and linuron treated (right) SMs setups of the agricultural soil experiment. 585
Linuron hydrolase genes libA () and hylA () and genes dcaQI (▲) and dcaQII (Δ) 586
are expressed as percentage of the bacterial 16S rRNA gene copy number (approx. 587
109 bacterial 16S rRNA gene copies/ g soil). Reported values are average values 588
with the SD (lag time, n=3 (3 replicates); qPCR, n=6 (3 replicate SMs, 2 qPCRs) 589
indicated by the error bars). Values for libA abundances were taken from Bers et al. 590
(9). 591
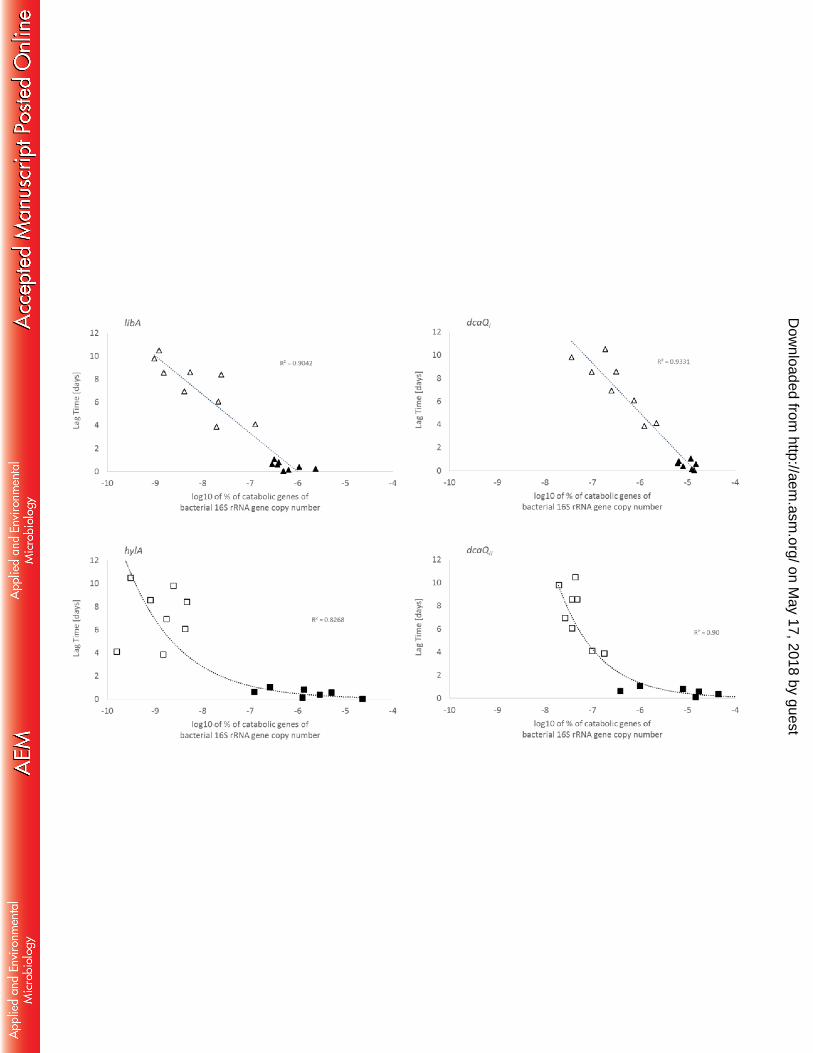
Fig. 4 Correlation between the lag time of linuron mineralization and the abundance 592
of the linuron hydrolases (left) (libA, hylA) and dcaQ genes (right) (dcaQI, dcaQII) as 593
log10 of the percentage of the bacterial 16S rRNA gene copy number for the water 594
(empty symbol) and linuron fed (full symbol) SMs containing agricultural soil. 595
Reported values are average values with the SD (lag time, n=3 (3 replicates); qPCR, 596
n=6 (3 replicate SMs, 2 qPCRs) shown by the error bars). Linear regressions are 597
shown as a dashed lines. R-square values are shown. Linuron mineralization lag 598
times and libA gene copy numbers were taken from Bers et al. (9). Symbols related 599
to time points zero and day 491 are indicated. 600
on May 17, 2018 by guest
http://aem.asm
.org/D
ownloaded from
28
Fig. 5 Dynamics of libA, hylA, dcaQI and dcaQII abundances and of the linuron 601
mineralization lag phase (as a measure for linuron mineralization capacity) in BMs 602
inoculated with linuron primed soil (top) (approx. 109 – 1010 bacterial 16S rRNA gene 603
copies/ g soil) and non-linuron primed soil (bottom) (approx. 108 – 109 bacterial 16S 604
rRNA gene copies/ g soil) either treated with water (left) or with linuron (right). 605
Abundances of the hydrolase genes (○) (libA (full line); hylA (dashed line)) and dcaQ 606
genes (∆) (dcaQI (full line); dcaQII (dashed line)) are expressed as log10 values of the 607
average ratio of the respective gene copy number over the bacterial 16S rRNA gene 608
copy number (n=6, 3 replicates; 2 qPCR for each replicate) with the SD shown by the 609
error bars. Values of libA for the linuron treated BM containing non-primed soil are 610
only from one replicate BM (BM3) since libA was not detected for the other two BMs. 611
Values of libA abundances were taken from Bers et al. (21). Values below the x-axis 612
are below detection limit. Values of the lag time (days) recorded in linuron 613
mineralization assays as a measure for the linuron degradation capacity were taken 614
from Bers et al. (21). Grey bars are average values with SD (n=3; 3 replicate 615
microcosms) for the water and the linuron treated BM setup. ‘NM’ means no 616
mineralization occurred and as such no lag time was registered. The schematic 617
under the graphs shows a time scheme of the sequential environmental perturbations 618
applied in the BMs with indicated sampling times (weeks). 619
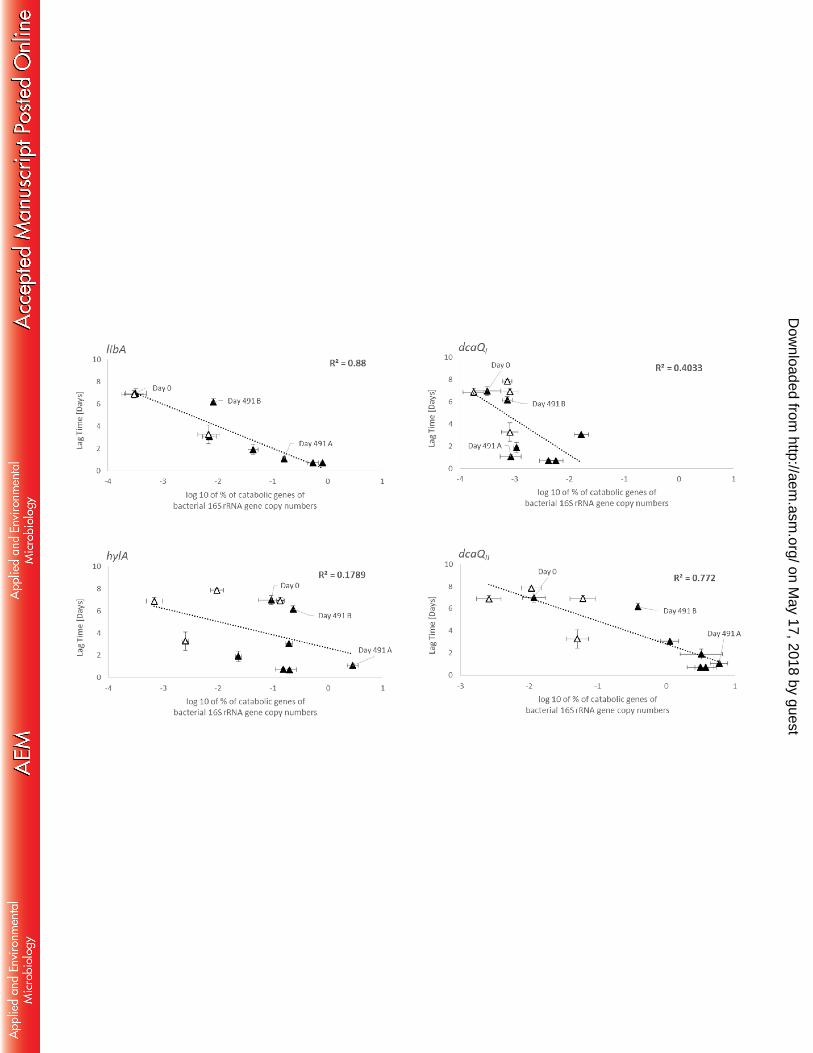
Fig. 6. Correlation between the lag time of linuron mineralization and the abundance 620
of libA (∆), hylA (□), dcaQI (∆) and dcaQII (□) as the log10 of the percentage of the 621
bacterial 16S rRNA gene copy number in BM setups with linuron primed soil treated 622
with linuron (black) and water (white) of the BPS experiment. Values are average 623
values (lag time (n=3); qPCR, n=6). Linear regressions for libA and dcaQII and 624
on May 17, 2018 by guest
http://aem.asm
.org/D
ownloaded from
29
exponential regressions hylA and dcaQII are shown as a dotted line. R-square values 625
and equation parameters are shown on the right. 626
on May 17, 2018 by guest
http://aem.asm
.org/D
ownloaded from