Embed Size (px)
Citation preview

MENTAL HEALTH Collaborative Programme
TOOLKIT

ii
© Crown copyright 2009
The Scottish Government
St Andrew’s House
Edinburgh
EH1 3DG
Produced for the Scottish Government by RR Donnelley B57636 02/09
Published by the Scottish Government, February, 2009
The text pages of this document are printed on recycled paper and are 100% recyclable
iii
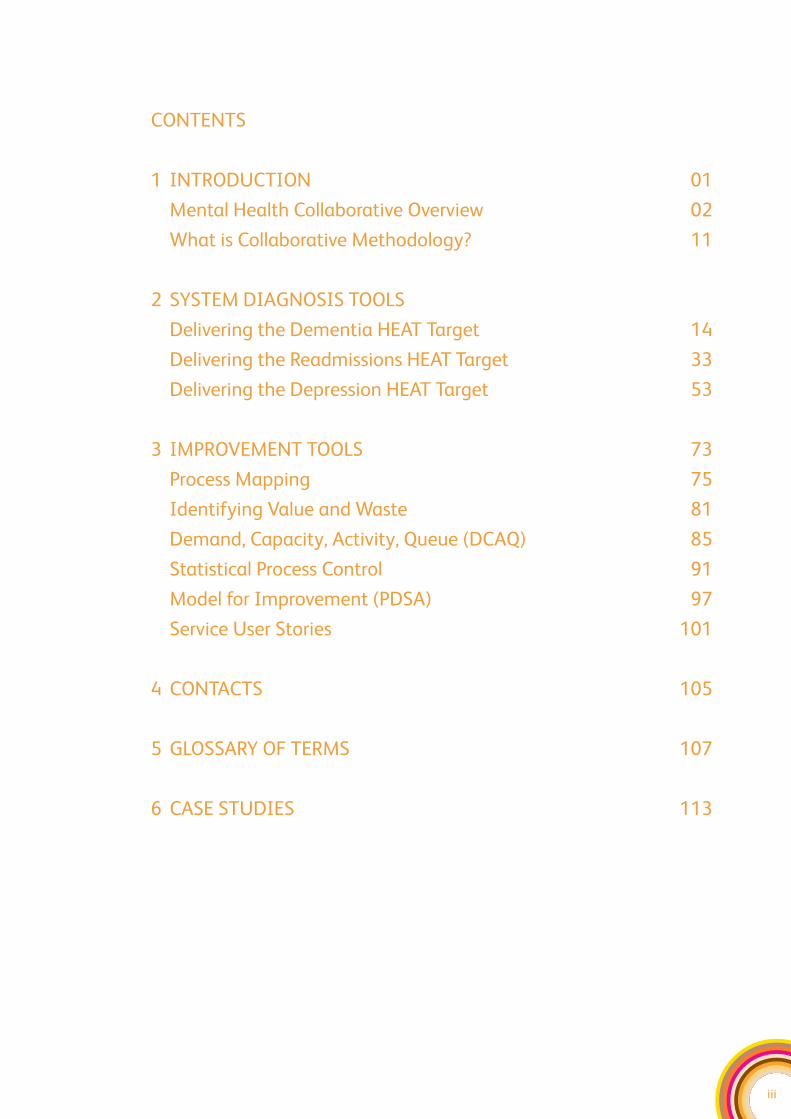
CONTENTS
1 INTRODUCTION 01
Mental Health Collaborative Overview 02
What is Collaborative Methodology? 11
2 SYSTEM DIAGNOSIS TOOLS
Delivering the Dementia HEAT Target 14
Delivering the Readmissions HEAT Target 33
Delivering the Depression HEAT Target 53
3 IMPROVEMENT TOOLS 73
Process Mapping 75
Identifying Value and Waste 81
Demand, Capacity, Activity, Queue (DCAQ) 85
Statistical Process Control 91
Model for Improvement (PDSA) 97
Service User Stories 101
4 CONTACTS 105
5 GLOSSARY OF TERMS 107
6 CASE STUDIES 113

iv

SECTION ONE:Introduction
Welcome to the Mental Health Collaborative Toolkit which has been
developed to support you in using improvement methods to deliver the
Mental Health HEAT targets.
This toolkit will develop over the life of the Collaborative. Our initial focus has been on
providing:
a) An overview of the Mental Health Collaborative;
b) Guidance on how to use improvement tools to analyse your current systems, identify
key areas for change and then to make change;
c) Information about the improvement tools we promote;
d) Key contact details for the National Collaborative Team.
We have also included a divider for a Case Study Section that will be populated over the
life of the Collaborative. These case studies will focus on the application of improvement
tools to deliver better services and will promote the sharing of good practice between
Boards about what has actually worked.
This guide is designed primarily for Mental Health Collaborative Programme Managers
and Clinical Leads – though the information in it may be useful to a range of others
involved with the work of the Collaborative. For this reason, the guide does use
improvement terminology. However, we have provided a glossary at the end to define
the terms we use and the section on Improvement Tools also provides more detailed
information about the various methods.
1
SECTION ONE
Introduction

MENTAL HEALTH COLLABORATIVE OVERVIEW
What are the Collaborative Aims and Objectives?
The overall aim of the Mental Health Collaborative is to support NHS Boards to make
the improvements needed to deliver against key national targets set out by the Scottish
Government. These targets are:
f To improve the quality of healthcare experienced;
f To reduce the annual rate of increase of defined daily dose per capita of
antidepressants to zero by 2009/10, and put in place the required support framework
to achieve a 10% reduction in future years;
f To reduce the number of hospital readmissions (within 1 year for those that have had
a psychiatric hospital admission of over 7 days) by 10% by the end of December 2009;
f To have achieved improvements in the early diagnosis and management of patients
with dementia by 2011.
Specifically, the objectives of the Mental Health Collaborative are:
f To deliver systematic and sustainable improvement to support the delivery of the four
HEAT targets;
f To identify where the use of improvement methods and techniques will lead to
improved performance, and to then work with NHS Boards and other key partners to
ensure effective application;
f Provide training for front line staff working in Mental Health services on the use of
improvement methods;
f To enable NHS Boards to use information effectively to support improvement;
f To develop a culture of NHS Boards sharing information and knowledge about what
works and what doesn’t for improving mental health services;
f To support the development of a culture of continuous improvement across mental
health services in Scotland.
How will it deliver its Aims and Objectives?
The MH Collaborative will deliver its aims and objectives through working at a national level
and in partnership with local NHS Boards as follows:
Nationally
f Provide training for front line staff working in Mental Health services on the use of
improvement methods;
f Provide funding to NHS Boards to develop improvement infrastructures which include
clinical leadership, programme management and information management;
f Set up a reference group of clinicians, managers, people who have a lived experience
of mental illness, carers and third sector representatives to identify: a) Additional
measures for improvement that relate to the HEAT targets and b) High Impact
Changes that, if implemented, will deliver significant improvements in key HEAT
target areas. This group has also informed the development of the diagnostic toolkit
for each workstream;
2
SECTION ONE
Collaborative Overview
f Put in place structures to enable effective sharing of information and knowledge
between different areas;
f Develop resources and toolkits to enable the application of improvement methods in
mental health services.
In partnership with local NHS Boards
f Provide support to NHS Boards to ensure effective programme management is in
place at a local level;
f Enable front line staff to access training both nationally and locally;
f Provide practical support to enable front line staff to put improvement methodology
into practice;
f Put in place mechanisms for monitoring the spend of collaborative resources and the
return on investment in terms of improvements actually delivered;
f Enable and support NHS Boards to make more effective use of information to inform
service improvement;
f Enable and support NHS Boards to effectively share information and ‘collaborate’ on
both what has worked and what hasn’t worked in terms of delivering improvements;
f Develop resources and toolkits to enable the application of improvement methods in
mental health services.
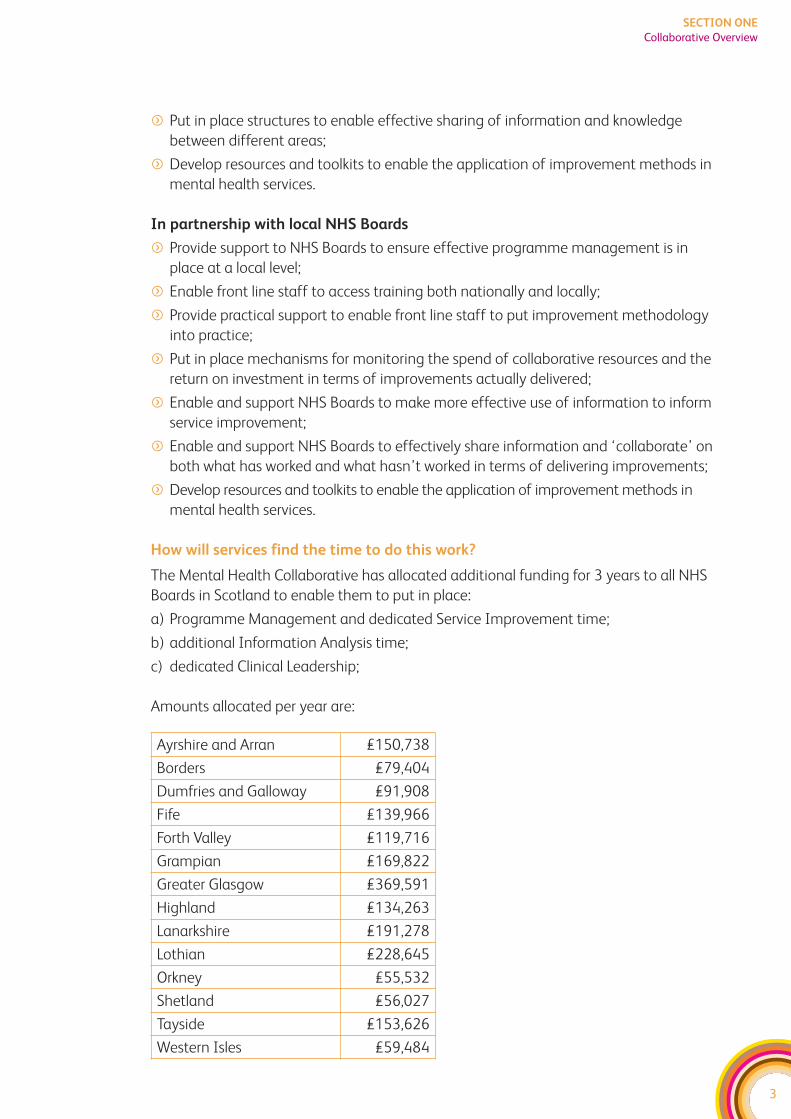
How will services find the time to do this work?
The Mental Health Collaborative has allocated additional funding for 3 years to all NHS
Boards in Scotland to enable them to put in place:
a) Programme Management and dedicated Service Improvement time;
b) additional Information Analysis time;
c) dedicated Clinical Leadership;
Amounts allocated per year are:
3
SECTION ONE
Collaborative Overview
Ayrshire and Arran £150,738
Borders £79,404
Dumfries and Galloway £91,908
Fife £139,966
Forth Valley £119,716
Grampian £169,822
Greater Glasgow £369,591
Highland £134,263
Lanarkshire £191,278
Lothian £228,645
Orkney £55,532
Shetland £56,027
Tayside £153,626
Western Isles £59,484
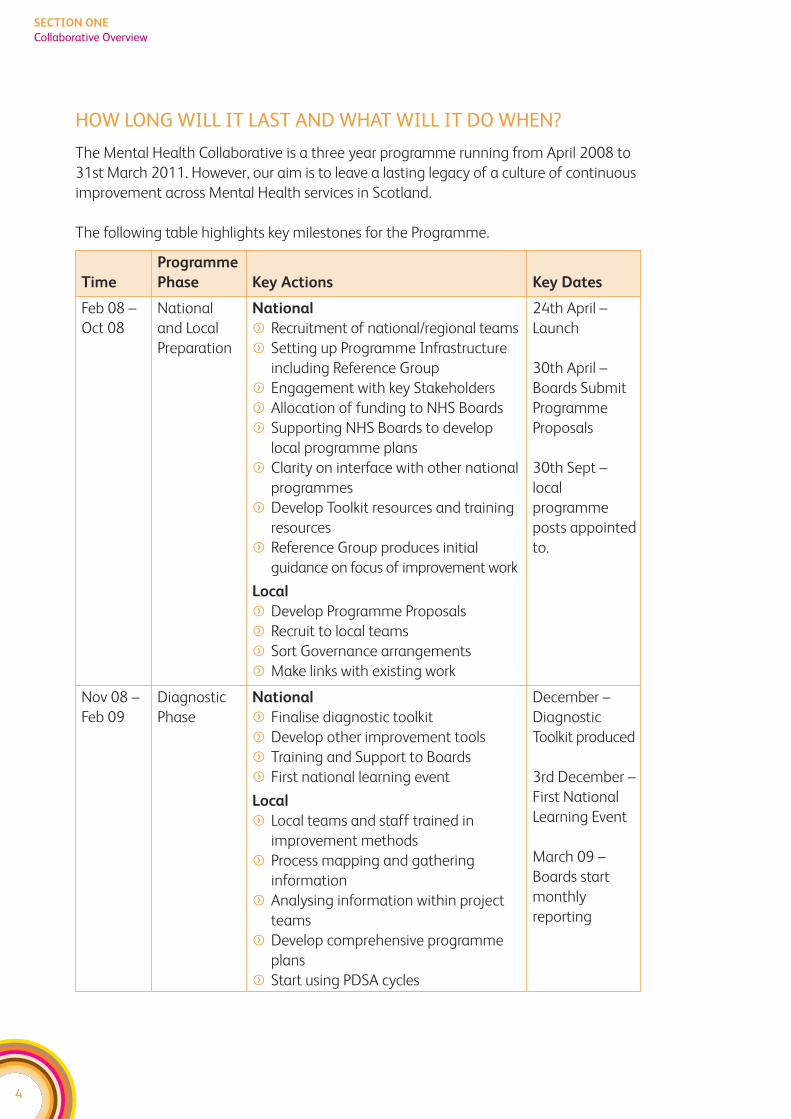
HOW LONG WILL IT LAST AND WHAT WILL IT DO WHEN?
The Mental Health Collaborative is a three year programme running from April 2008 to
31st March 2011. However, our aim is to leave a lasting legacy of a culture of continuous
improvement across Mental Health services in Scotland.
The following table highlights key milestones for the Programme.
4
SECTION ONE
Collaborative Overview
Time
Programme
Phase Key Actions Key Dates
Feb 08 –
Oct 08
National
and Local
Preparation
National
f Recruitment of national/regional teams
f Setting up Programme Infrastructure
including Reference Group
f Engagement with key Stakeholders
f Allocation of funding to NHS Boards
f Supporting NHS Boards to develop
local programme plans
f Clarity on interface with other national
programmes
f Develop Toolkit resources and training
resources
f Reference Group produces initial
guidance on focus of improvement work
Local
f Develop Programme Proposals
f Recruit to local teams
f Sort Governance arrangements
f Make links with existing work
24th April –
Launch
30th April –
Boards Submit
Programme
Proposals
30th Sept –
local
programme
posts appointed
to.
Nov 08 –
Feb 09
Diagnostic
Phase
National
f Finalise diagnostic toolkit
f Develop other improvement tools
f Training and Support to Boards
f First national learning event
Local
f Local teams and staff trained in
improvement methods
f Process mapping and gathering
information
f Analysing information within project
teams
f Develop comprehensive programme
plans
f Start using PDSA cycles
December –
Diagnostic
Toolkit produced
3rd December –
First National
Learning Event
March 09 –
Boards start
monthly
reporting
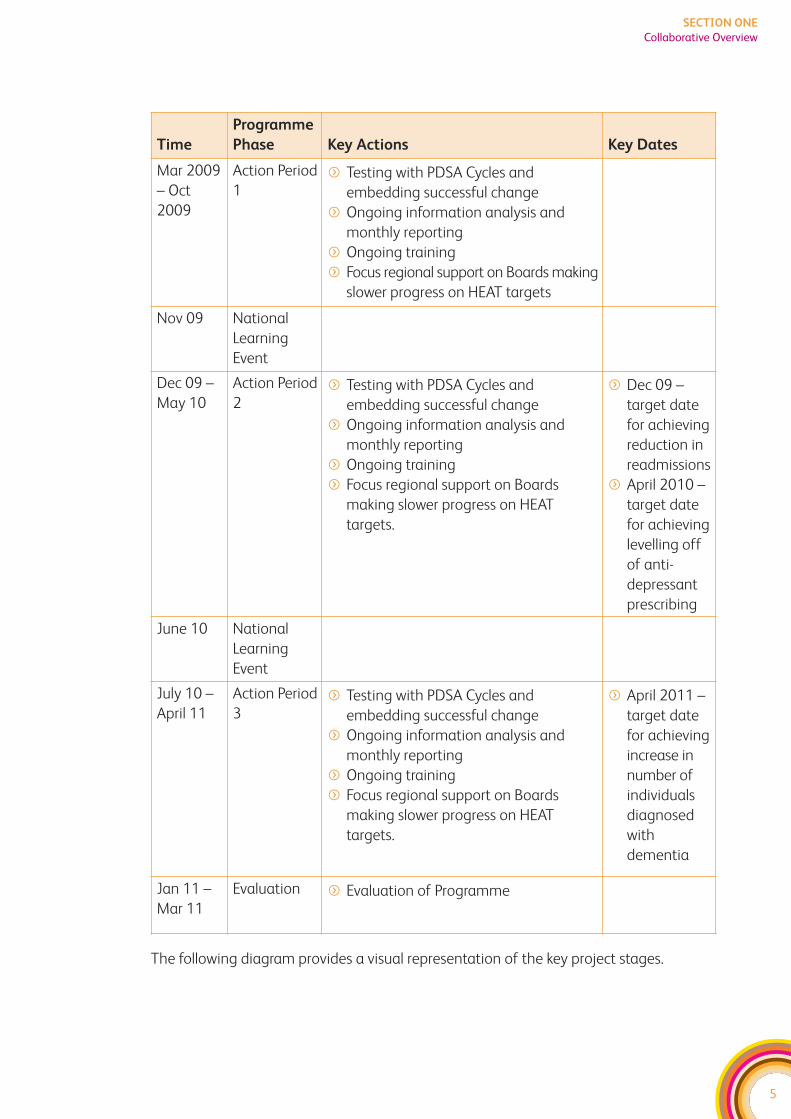
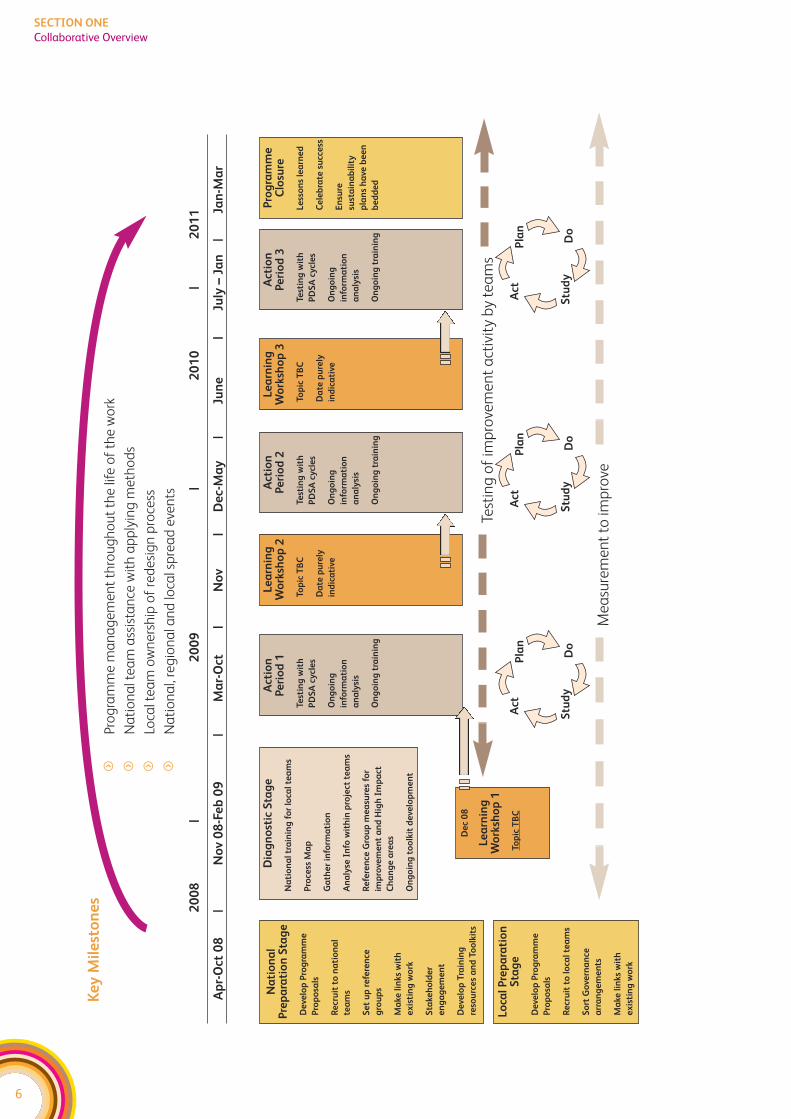
The following diagram provides a visual representation of the key project stages.
5
SECTION ONE
Collaborative Overview
Time
Programme
Phase Key Actions Key Dates
Mar 2009
– Oct
2009
Action Period
1f Testing with PDSA Cycles and
embedding successful change
f Ongoing information analysis and
monthly reporting
f Ongoing training
f Focus regional support on Boards making
slower progress on HEAT targets
Nov 09 National
Learning
Event
Dec 09 –
May 10
Action Period
2f Testing with PDSA Cycles and
embedding successful change
f Ongoing information analysis and
monthly reporting
f Ongoing training
f Focus regional support on Boards
making slower progress on HEAT
targets.
f Dec 09 –
target date
for achieving
reduction in
readmissions
f April 2010 –
target date
for achieving
levelling off
of anti-
depressant
prescribing
June 10 National
Learning
Event
July 10 –
April 11
Action Period
3f Testing with PDSA Cycles and
embedding successful change
f Ongoing information analysis and
monthly reporting
f Ongoing training
f Focus regional support on Boards
making slower progress on HEAT
targets.
f April 2011 –
target date
for achieving
increase in
number of
individuals
diagnosed
with
dementia
Jan 11 –
Mar 11
Evaluation f Evaluation of Programme
6
SECTION ONE
Collaborative Overview
Ke
y M
ile
sto
ne
sf
Pro
gra
mm
e m
an
ag
em
en
t th
rou
gh
ou
t th
e li
fe o
f th
e w
ork
fN
ati
on
al t
ea
m a
ssis
tan
ce w
ith
ap
ply
ing
me
tho
ds
fLo
cal t
ea
m o
wn
ers
hip
of
red
esi
gn
pro
cess
fN
ati
on
al,
reg
ion
al a
nd
loca
l sp
rea
d e
ven
ts
20
08
|2
00
9|
20
10
|2
01
1
Ap
r-O
ct 0
8|
No
v 0
8-F
eb
09
|M
ar-
Oct
|N
ov
|D
ec-
Ma
y|
Jun
e|
July
– J
an
|Ja
n-M
ar
Na
tio
na
lP
rep
ara
tio
n S
tag
e
De
velo
p P
rog
ram
me
Pro
po
sals
Re
cru
it t
o n
ati
on
al
tea
ms
Se
t u
p r
efe
ren
ce
gro
up
s
Ma
ke l
inks
wit
h
ex
isti
ng
wo
rk
Sta
keh
old
er
en
ga
ge
me
nt
De
velo
p T
rain
ing
reso
urc
es
an
d T
oo
lkit
s
Dia
gn
ost
ic S
tag
e
Na
tio
na
l tr
ain
ing
fo
r lo
cal
tea
ms
Pro
cess
Ma
p
Ga
the
r in
form
ati
on
An
aly
se I
nfo
wit
hin
pro
ject
te
am
s
Re
fere
nce
Gro
up
me
asu
res
for
imp
rove
me
nt
an
d H
igh
Im
pa
ct
Ch
an
ge
are
as
On
go
ing
to
olk
it d
eve
lop
me
nt
Act
ion
P
eri
od
1
Test
ing
wit
h
PD
SA
cy
cle
s
On
go
ing
info
rma
tio
n
an
aly
sis
On
go
ing
tra
inin
g
Le
arn
ing
Wo
rksh
op
2
Top
ic T
BC
Da
te p
ure
ly
ind
ica
tive
Le
arn
ing
Wo
rksh
op
3
Top
ic T
BC
Da
te p
ure
ly
ind
ica
tive
Act
ion
P
eri
od
2
Test
ing
wit
h
PD
SA
cy
cle
s
On
go
ing
info
rma
tio
n
an
aly
sis
On
go
ing
tra
inin
g
Act
ion
P
eri
od
3
Test
ing
wit
h
PD
SA
cy
cle
s
On
go
ing
info
rma
tio
n
an
aly
sis
On
go
ing
tra
inin
g
Pro
gra
mm
eC
losu
re
Le
sso
ns
lea
rne
d
Ce
leb
rate
su
cce
ss
En
sure
sust
ain
ab
ilit
y
pla
ns
ha
ve b
ee
n
be
dd
ed
Lo
cal
Pre
pa
rati
on
Sta
ge
De
velo
p P
rog
ram
me
Pro
po
sals
Re
cru
it t
o l
oca
l te
am
s
So
rt G
ove
rna
nce
arr
an
ge
me
nts
Ma
ke l
inks
wit
h
ex
isti
ng
wo
rk
De
c 0
8
Le
arn
ing
Wo
rksh
op
1
Top
ic T
BC
Test
ing
of
imp
rove
me
nt
act
ivit
y b
y te
am
s
Me
asu
rem
en
t to
imp
rove
Do
Act
Pla
n
Stu
dy
Do
Act
Pla
n
Stu
dy
Do
Act
Pla
n
Stu
dy
7
SECTION ONE
Collaborative Overview
HOW DOES THIS WORK LINK TO OTHER NATIONAL MENTALHEALTH PROGRAMMES?
The Mental Health Collaborative is one of a range of national initiatives attached to the
Mental Health Delivery Plan including:
f Benchmarking Programme
f Mental Health Integrated Care Pathways Programme
f Rights Relationships and Recovery Programme
f NES Psychological Therapies Programme
f SPARRA
f Towards a Mentally Flourishing Scotland
f Mental Health Leadership Programme
f Choose Life
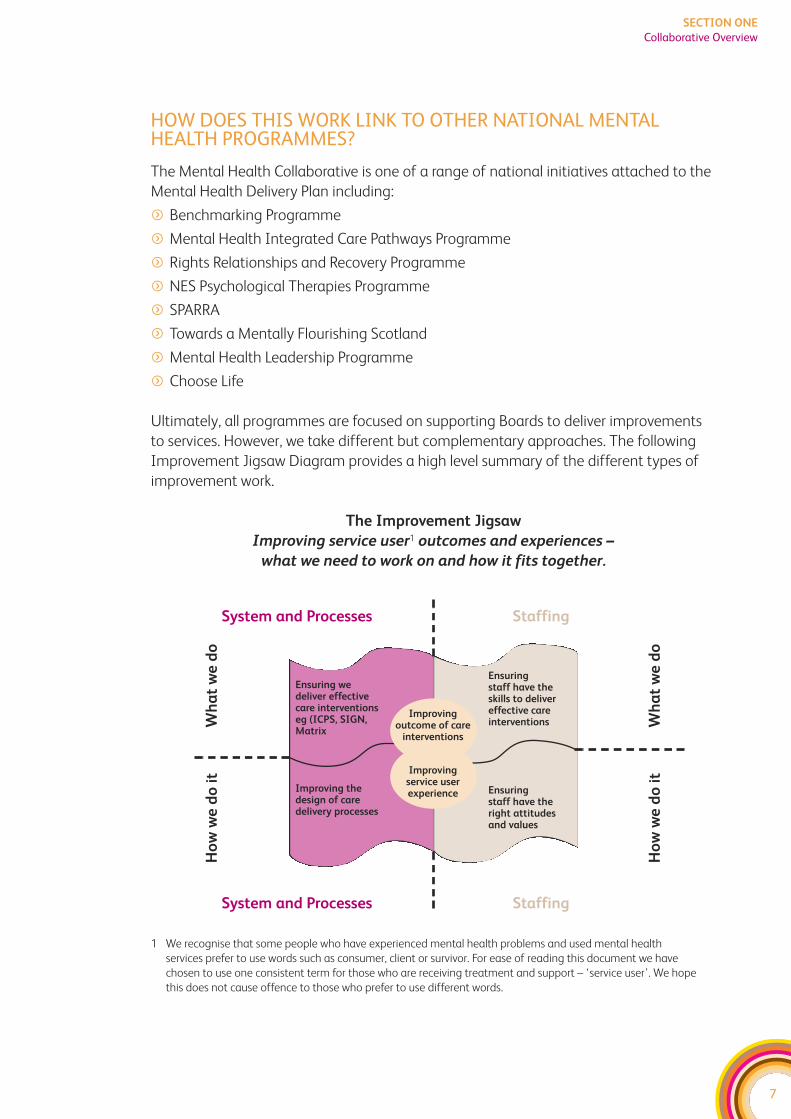
Ultimately, all programmes are focused on supporting Boards to deliver improvements
to services. However, we take different but complementary approaches. The following
Improvement Jigsaw Diagram provides a high level summary of the different types of
improvement work.
The Improvement Jigsaw
Improving service user1 outcomes and experiences –
what we need to work on and how it fits together.
System and Processes Staffing
System and Processes Staffing
Ensuring we deliver effectivecare interventionseg (ICPS, SIGN,Matrix
Improving thedesign of caredelivery processes
Ensuring staff have theskills to delivereffective careinterventions
Ensuring staff have theright attitudesand values
Wh
at
we
do
Wh
at
we
do
Ho
w w
e d
o i
t
Ho
w w
e d
o i
t
1 We recognise that some people who have experienced mental health problems and used mental health
services prefer to use words such as consumer, client or survivor. For ease of reading this document we have
chosen to use one consistent term for those who are receiving treatment and support – ‘service user’. We hope
this does not cause offence to those who prefer to use different words.
Improving service userexperience
Improving outcome of care
interventions

8
SECTION ONE
Collaborative Overview
The focus of all our work is improving the outcomes for service users and improving their
experience of the service. To do this we need to focus on a number of different issues:
a) Ensuring services deliver effective care interventions – this relates to ensuring
that ICP standards and any other best practice standards (ie SIGN, Crisis Standards,
Care Management Standards) are followed. The Mental Health Collaborative and
NQIS ICP work are both focused on this area of improvement.
b) Improving the design of the care delivery processes – this is about ensuring a
well designed process that eliminates duplication and unnecessary steps, minimises
potential for error, and delivers the right amount of treatment capacity to see the
work without unnecessary waits. This is central to the work of the Mental Health
Collaborative, which promotes a range of tools and techniques to help services deliver
this aspect of improvement.
c) Ensuring staff are appropriately equipped to deliver services – both in terms of
what they do, but also the attitudes and values that underpin their practice. Rights,
Relationships and Recovery, the 10 Essential Shared Capabilities, the NES
Psychological Therapies Programme, Working with Older People – A Framework for
Mental Health Nurses, Choose Life Training, and the Mental Health Leadership
Programme are all examples of national programmes which support services to
improve both the skills and attitudes of staff.
The Mental Health Collaborative is focused primarily on the left hand side of this
diagram – improving the systems and processes – both in terms of what we do but also
how we do it. It also has a skills development focus around improving the understanding
and use of improvement methods across Mental Health Services. However, this is only
part of the picture and clearly ensuring staff have the right skills, attitudes and values is
also vital. Further, previous Collaboratives have found that looking at systems and
processes will highlight a range of staff development issues. This means it is important
that the work of the Collaborative is linked locally to workforce planning and training
structures.
Another way of thinking about improvement work is that it is about answering the
questions:
i) Are we doing the right things?
ii) in the right way?
iii) with appropriately trained staff? and
iv) using information to review if we are doing all of the previous three?
9
SECTION ONE
Collaborative Overview
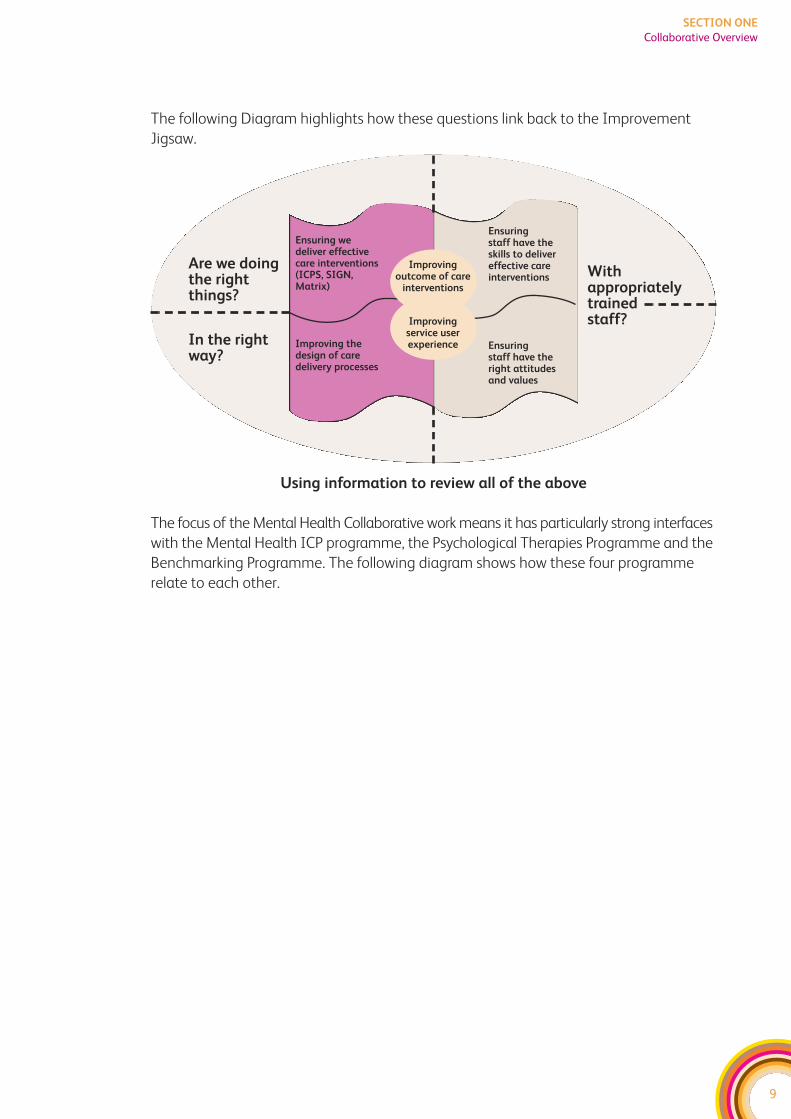
The following Diagram highlights how these questions link back to the Improvement
Jigsaw.
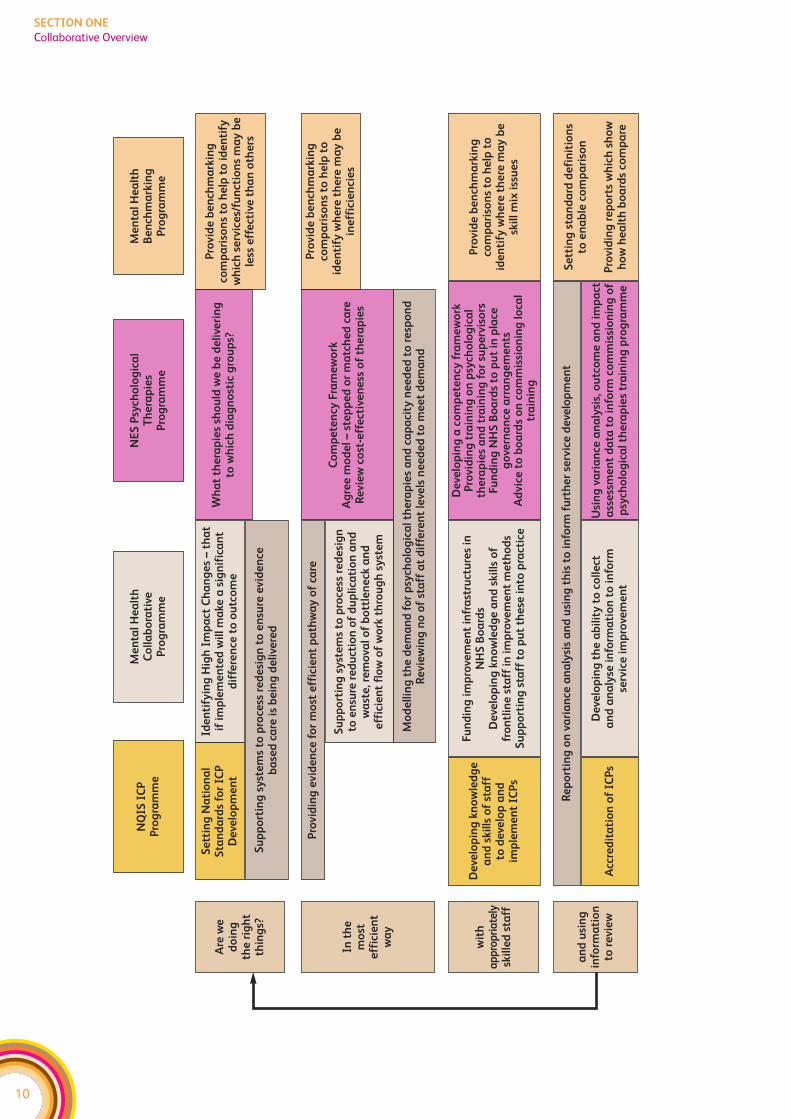
The focus of the Mental Health Collaborative work means it has particularly strong interfaces
with the Mental Health ICP programme, the Psychological Therapies Programme and the
Benchmarking Programme. The following diagram shows how these four programme
relate to each other.
Ensuring we deliver effectivecare interventions(ICPS, SIGN,Matrix)
Improving thedesign of caredelivery processes
Ensuring staff have theskills to delivereffective careinterventions
Ensuring staff have theright attitudesand values
Are we doingthe rightthings?
Withappropriatelytrained staff?
In the rightway?
Using information to review all of the above
Improving service userexperience
Improving outcome of care
interventions
10
SECTION ONE
Collaborative Overview
Are
we
d
oin
g
the
rig
ht
thin
gs?
NQ
IS I
CP
P
rog
ram
me
Me
nta
l H
ea
lth
C
oll
ab
ora
tive
P
rog
ram
me
NE
S P
sych
olo
gic
al
Th
era
pie
s P
rog
ram
me
Me
nta
l H
ea
lth
Be
nch
ma
rkin
gP
rog
ram
me
Pro
vid
e b
en
chm
ark
ing
com
pa
riso
ns
to h
elp
to
id
en
tify
wh
ich
se
rvic
es/
fun
ctio
ns
ma
y b
ele
ss e
ffe
ctiv
e t
ha
n o
the
rs
Pro
vid
e b
en
chm
ark
ing
com
pa
riso
ns
to h
elp
to
id
en
tify
wh
ere
th
ere
ma
y b
ein
eff
icie
nci
es
Pro
vid
e b
en
chm
ark
ing
com
pa
riso
ns
to h
elp
to
id
en
tify
wh
ere
th
ere
ma
y b
esk
ill
mix
iss
ue
s
Se
ttin
g s
tan
da
rd d
efi
nit
ion
s to
en
ab
le c
om
pa
riso
n
Pro
vid
ing
re
po
rts
wh
ich
sh
ow
ho
w h
ea
lth
bo
ard
s co
mp
are
Wh
at
the
rap
ies
sho
uld
we
be
de
live
rin
g
to w
hic
h d
iag
no
stic
gro
up
s?
Co
mp
ete
ncy
Fra
me
wo
rkA
gre
e m
od
el
–st
ep
pe
d o
r m
atc
he
d c
are
Re
vie
w c
ost
-eff
ect
ive
ne
ss o
f th
era
pie
s
Se
ttin
g N
ati
on
al
Sta
nd
ard
s fo
r IC
PD
eve
lop
me
nt
Ide
nti
fyin
g H
igh
Im
pa
ct C
ha
ng
es
–th
at
if i
mp
lem
en
ted
wil
l m
ake
a s
ign
ific
an
td
iffe
ren
ce t
o o
utc
om
e
Su
pp
ort
ing
sy
ste
ms
to p
roce
ss r
ed
esi
gn
to
en
sure
evid
en
ce
ba
sed
ca
re i
s b
ein
g d
eli
vere
d
Pro
vid
ing
evid
en
ce f
or
mo
st e
ffic
ien
t p
ath
wa
y o
f ca
re
Su
pp
ort
ing
sy
ste
ms
to p
roce
ss r
ed
esi
gn
to
en
sure
re
du
ctio
n o
f d
up
lica
tio
n a
nd
wa
ste
, re
mo
val
of
bo
ttle
ne
ck a
nd
e
ffic
ien
t fl
ow
of
wo
rk t
hro
ug
h s
yst
em
Fu
nd
ing
im
pro
vem
en
t in
fra
stru
ctu
res
in
NH
S B
oa
rds
De
velo
pin
g k
no
wle
dg
e a
nd
skil
ls o
f fr
on
tlin
e s
taff
in
im
pro
vem
en
t m
eth
od
sS
up
po
rtin
g s
taff
to
pu
t th
ese
in
to p
ract
ice
Mo
de
llin
g t
he
de
ma
nd
fo
r p
sych
olo
gic
al
the
rap
ies
an
d c
ap
aci
ty n
ee
de
d t
o r
esp
on
dR
evie
win
g n
o o
f st
aff
at
dif
fere
nt
leve
ls n
ee
de
d t
o m
ee
t d
em
an
d
In t
he
m
ost
eff
icie
nt
wa
y
wit
ha
pp
rop
ria
tely
skil
led
sta
ff
De
velo
pin
g k
no
wle
dg
ea
nd
skil
ls o
f st
aff
to
de
velo
p a
nd
imp
lem
en
t IC
Ps
De
velo
pin
g a
co
mp
ete
ncy
fra
me
wo
rkP
rovid
ing
tra
inin
g o
n p
sych
olo
gic
al
the
rap
ies
an
d t
rain
ing
fo
r su
pe
rvis
ors
Fu
nd
ing
NH
S B
oa
rds
to p
ut
in p
lace
go
vern
an
ce a
rra
ng
em
en
tsA
dvic
e t
o b
oa
rds
on
co
mm
issi
on
ing
lo
cal
tra
inin
g
Re
po
rtin
g o
n v
ari
an
ce a
na
lysi
s a
nd
usi
ng
th
is t
o i
nfo
rm f
urt
he
r se
rvic
e d
eve
lop
me
nt
Acc
red
ita
tio
n o
f IC
Ps
De
velo
pin
g t
he
ab
ilit
y t
o c
oll
ect
a
nd
an
aly
se i
nfo
rma
tio
n t
o i
nfo
rm
serv
ice
im
pro
vem
en
t
Usi
ng
va
ria
nce
an
aly
sis,
ou
tco
me
an
d i
mp
act
ass
ess
me
nt
da
ta t
o i
nfo
rm c
om
mis
sio
nin
g o
fp
sych
olo
gic
al
the
rap
ies
tra
inin
g p
rog
ram
me
an
d u
sin
gin
form
ati
on
to r
evie
w
11
SECTION ONE
Collaborative Methodology
WHAT IS COLLABORATIVE METHODOLOGY?
Collaborative methodology originates from the work of the Institute for Health
Improvement in 1996 in the USA and has been used to deliver successful improvements
to health services in Scotland, Wales and England.
A Collaborative is an evidence based, service improvement methodology, which delivers
systems-wide engagement and demonstrable improvements in the care offered to service
users and their carers.
The focus of the Collaborative is to support NHS Boards through the development of
capability and capacity in technical and behavioural change management. This means
that the programme design incorporates:
f an approach to engage all staff, acknowledging the roles of executive sponsorship,
improvement leaders and champions, at national and local level;
f dedicated time for clinical leadership, project management and information analysis;
f front line staff actively engaged in redesign through rapid cycles of change;
f use of Lean techniques to reduce waste and duplication, improve patient flow and
reliability of clinical processes;
f a robust training and development strategy to develop skills and competency in the
use of improvement tools and techniques and behavioural change management;
f practical support to help staff develop confidence in using these tools and techniques
through the establishment of technical experts at a national level;
f provision of formal and social networking opportunities to enable staff to share, adopt
and spread good practice: this includes the development of ‘shared space’ facilities,
national and regional events;
f a national, regional and local programme management infrastructure including
dedicated programme teams, who work to embed the changes through operational
and clinical management.
Key to the development of the programmes has been an approach of identifying,
co-ordinating and where appropriate integrating work already in progress at both a
national and local level.
Collaborative Methodology also focuses on the concept of High Impact Changes. These
are those key changes that will deliver significant improvements to outcomes. These can
be either changes to the clinical delivery of services or changes to the design of services.
The initial Collaboratives in the USA tended to focus on clinical issues, where there was
clear evidence that a clinical intervention would make a difference and clear evidence
that that services weren’t routinely implementing the intervention. The approach was
then developed to focus on system design issues – particularly those that impact on
access to services.
For Mental Health Services, clinical standards already exist in the form of the ICP Standards
and SIGN guidelines. At a local level, collaborative resources can be used to focus on
implementing those clinical standards that are relevant to the delivery of the HEAT targets.
For the design of care delivery processes, the first step is for each Board to understand
what their key system and process design issues are. This toolkit provides support on
how to do this. Please see the Diagnostic Section, which has been developed with the
support of the Collaborative Reference Groups. Each workstream (Depression, Dementia
and Readmissions) has a reference group that is populated with clinicians, service user
representatives, carer representatives, voluntary sector representatives, key partner
representatives and managers from across the Boards.
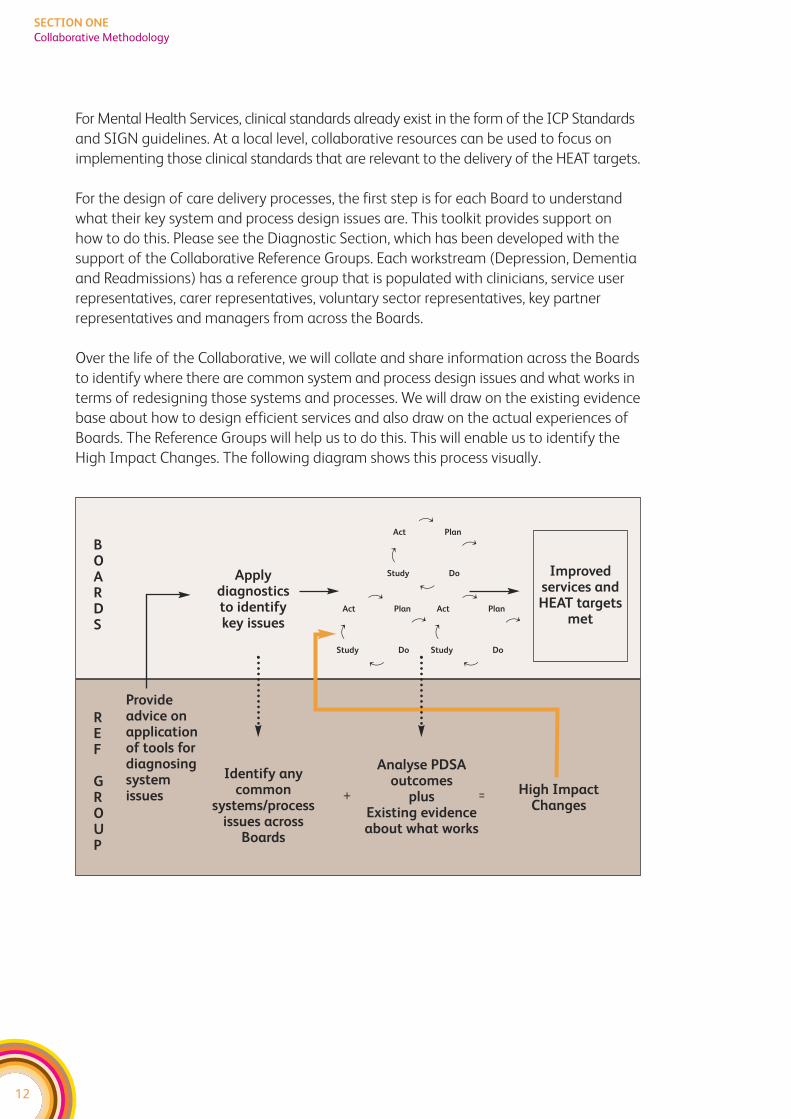
Over the life of the Collaborative, we will collate and share information across the Boards
to identify where there are common system and process design issues and what works in
terms of redesigning those systems and processes. We will draw on the existing evidence
base about how to design efficient services and also draw on the actual experiences of
Boards. The Reference Groups will help us to do this. This will enable us to identify the
High Impact Changes. The following diagram shows this process visually.
12
SECTION ONE
Collaborative Methodology
Applydiagnosticsto identifykey issues
Provideadvice onapplicationof tools fordiagnosingsystemissues
BOARDS
REF
GROUP
Identify anycommon
systems/processissues across
Boards
Analyse PDSAoutcomes
plusExisting evidenceabout what works
High ImpactChanges
Improvedservices andHEAT targets
met
+ =
df
d
f
Act Plan
Study Do
df
d
f
Act Plan
Study Do
df
d
f
Act Plan
Study Do
13
SECTION ONE
Collaborative Methodology
IS THIS JUST AN NHS INITIATIVE?
The Mental Health Collaborative is part of the Improvement and Support Team, which
sits within the Health Delivery Directorate at the Scottish Government. Funding for local
infrastructures has been allocated to NHS Boards. However, we recognise that NHS
Mental Health Services don’t sit in isolation and delivering the HEAT targets will mean
working across health, social care and the voluntary sector. Therefore, we expect all NHS
Boards to involve their key partners in the work of the Collaborative. At a national level,
we are also working to establish links with key partners.
We’ve taken the ‘Improvement Tools’ section of this toolkit directly from current online
resources:
f Improvement and Support Team Toolkit
http://member.goodpractice.net/ContinuousImprovementToolkit/resources/core-
improvement-tools
f 18 Weeks Toolkit
http://www.nodelaysscotland.scot.nhs.uk/ServiceImprovement/pages/default.aspx
That means some of the language used is health focused. However the tools equally
apply to social care and voluntary sector organisations.

14
SECTION ONE
Collaborative Methodology

SECTION TWO:System Diagnosis Tools
DELIVERING THE DEMENTIA HEAT TARGET
HEAT target
Each NHS Board will achieve agreed improvements in the early diagnosis
and management of patients with dementia by March 2011.
Delivering the Dementia HEAT target is about improving access to diagnosis and the
provision of early management and support. Improvements can be categorised under
three main headings:
1. Improving the design of the care delivery processes – this is about ensuring
well-designed processes that eliminate duplication and unnecessary steps, minimise
potential for error, and deliver the right amount of treatment capacity to see the work
without unnecessary waits. This needs to take a whole systems perspective working
across the traditional health and social care boundaries. Changes here should result in
an improved experience of using care services.
2. Ensuring the delivery of effective care interventions – this relates to ensuring ICP
standards and any other national approved guidance (ie SIGN) is routinely followed.
However, this is not just about improving the clinical standards of care – it is about
the range of care interventions including those delivered by the local authority and
voluntary sector services. Changes here should lead to improved outcomes for people
with dementia.
3. Ensuring staff are properly equipped to deliver services – this recognises the
importance of applying knowledge and skills within a values-based framework. All
improvement work is underpinned by continuous professional development and
workforce planning. There may be a need to develop the skills of existing staff, extend
roles, develop new roles and to review the skill mix within services. Training a wide
range of health and social care staff on how to respond effectively to individuals with
Dementia will be key to delivering this HEAT target. Changes here should contribute
to both improved outcomes and improved experiences for those using services.
15
SECTION TWO
Delivering the Dementia HEAT Target
The following diagram highlights the key elements of the Dementia Journey that you
will need to work on to meet the dementia HEAT target:
f For design of care delivery processes – the first step is for each Board and their key
partners, to understand what their key system and process design issues are and this
document provides advice on how to do this. Over the life of the collaborative we will
collate and share information across Boards and key partners, to identify where there
are common system and process design issues and what works in terms of
redesigning those systems and processes.
f Standards already exist for ensuring we deliver effective care interventions (eg
ICP Guidance and SIGN guidelines). At a local level, collaborative resources can be
used to focus on implementing those clinical and care standards that are relevant to
the delivery of the HEAT target. The following diagram shows how ICP Standards and
SIGN guidelines relate to this workstream. Further work will be completed to map
other relevant national guidance against the key elements of pathway. In addition,
action on ICP standards 6 and 7 will be of direct relevance to achieving the dementia
HEAT target.
f The diagram also highlights some of the key workforce programmes that underpin
the delivery of improved services.
16
SECTION TWO
Delivering the Dementia HEAT Target

17
SECTION TWO
Delivering the Dementia HEAT Target
DEL
IVER
ING
TH
E D
EMEN
TIA
HEA
T TA
RGET
Imp
rove
de
sig
n o
f ca
re
de
live
ry p
roce
sse
s
Cu
rre
nt
focu
s is
on
dia
gn
osi
ng
th
e k
ey is
sue
s w
ith
cu
rre
nt
syst
em
s a
nd
pro
cess
es
usi
ng
:
fP
ath
wa
y M
ap
pin
g, V
alu
e S
tre
am
ing
an
d F
low
An
aly
sis
to id
en
tify
: wh
at
ad
ds
valu
e, u
nn
ece
ssa
ry s
tep
s, d
up
lica
tio
n, r
ew
ork
be
cau
se n
ot
do
ne
rig
ht
firs
t ti
me
, bo
ttle
ne
cks
an
d h
an
d-o
ffs
fD
ata
An
aly
sis
to id
en
tify
va
ria
tio
n a
nd
un
de
rsta
nd
wh
en
th
is is
just
ifia
ble
an
d w
he
n it
ca
n b
e r
ed
uce
d
fD
em
an
d, C
ap
aci
ty a
nd
Qu
eu
e T
he
ory
so u
nd
ers
tan
d w
ha
t th
e d
em
an
d is
, wh
at
the
ca
pa
city
is t
o r
esp
on
d t
o it
, op
po
rtu
nit
ies
to
ma
ke m
ore
eff
ect
ive
use
of
curr
en
t ca
pa
city
, wh
en
qu
eu
es
are
ca
use
d b
eca
use
of
the
pro
cess
de
sig
n r
ath
er
tha
n a
mis
ma
tch
be
twe
en
de
ma
nd
an
d c
ap
aci
ty, a
nd
wh
ere
in t
he
pro
cess
th
ere
is a
mis
ma
tch
be
twe
en
de
ma
nd
an
d c
ap
aci
ty.
fP
DS
Ato
pilo
t im
pro
vem
en
ts
Ke
y e
lem
en
ts o
f D
em
en
tia
Pa
thw
ay
th
at
ne
ed
to
imp
rove
to
de
live
r H
EA
T
Targ
et.
Imp
rove
pu
bli
c a
nd
sta
ff
aw
are
ne
ss
En
sure
cla
rity
of
refe
rra
l
rou
tes
for
dia
gn
ost
ic
ass
ess
me
nts
En
sure
tim
ely
dia
gn
ost
ic
ass
ess
me
nt
Imp
rove
ea
rly
ma
na
ge
me
nt
an
d s
up
po
rt
En
suri
ng
th
e d
eli
very
of
eff
ect
ive
ca
re i
nte
rve
nti
on
s
ICP
Sta
nd
ard
s: 2
, 5, 3
8, 3
9IC
P S
tan
da
rds:
6, 9
, 14
IC
P S
tan
da
rds:
10
, 14
, 21
ICP
Sta
nd
ard
s: 1
1, 1
3, 1
6, 1
7,
21
, 27
, 28
, 38
, 39
Be
st P
ract
ice
Gu
ida
nce
-SIG
N 8
6
Ke
y N
ati
on
al
Wo
rkfo
rce
Pro
gra
mm
es
rele
van
t to
wo
rk
Rig
hts
, Re
lati
on
ship
s a
nd
Re
cove
ry i
ncl
ud
ing
: Th
e C
ap
ab
ilit
y F
ram
ew
ork
fo
r M
en
tal
He
alt
h
Nu
rse
s, W
ork
ing
wit
h O
lde
r P
eo
ple
in
Sco
tla
nd
Th
e 1
0 E
sse
nti
al
Sh
are
d C
ap
ab
ilit
ies
for
Me
nta
l H
ea
lth
Pra
ctic
e (
Sco
tla
nd
)
Ch
an
gin
g L
ive
s (S
oci
al
Wo
rk)

18
SECTION TWO
Delivering the Dementia HEAT Target
19
SECTION TWO
Delivering the Dementia HEAT Target
DEMENTIA PATHWAY – SYSTEMS DIAGNOSIS CHECKLIST
This document is aimed at those involved in leading and planning the Mental Health
Collaborative (MHC) work. It is provided as a supportive tool to help those involved in
leading and planning the work of the MHC locally to think about how to apply improvement
methods to enable the delivery of the Dementia HEAT target.
It is designed to be used as part of the Mental Health Collaborative Toolkit which
includes sections on the different improvement methods mentioned and an overview
of the Collaborative Approach.
It works on the basis that the first 3-6 months should be on visioning and diagnosis.
Visioning involves defining and describing the ideal systems, processes and pathways
of care to fulfil and exceed the HEAT targets. These ‘ideals’ will be firmly rooted in the
best evidence available and complemented by experiential input and insights from
service users, carers and staff. Diagnosis involves comparing current service behaviour
with the ideal to establish where changes need to be made and what these changes
might look like in order to achieve the ideal. It also involves understanding your current
processes, what works well and what doesn’t work so well.
As with clinical care – getting the diagnosis right is important as it guides what interventions
are taken. If clinicians treat the wrong problem – chances are the treatment won’t be
effective. Likewise – if change programmes are based on an incorrect analysis of the
problem – chances are that the change programme will be ineffective. So it’s worth
investing the time up front to get the diagnosis of the problem right. Visioning is a key
part of this – as we need to be clear that we are doing the right things, not just doing
the wrong things more efficiently.
We realise that many Boards (and key partners), have already made significant progress
against this target and we are not suggesting you put on hold any work already in progress.
However, the following suggestions may give you some ideas about how to progress this
work further.

20
SECTION TWO
Delivering the Dementia HEAT Target
21
SECTION TWO
Delivering the Dementia HEAT Target
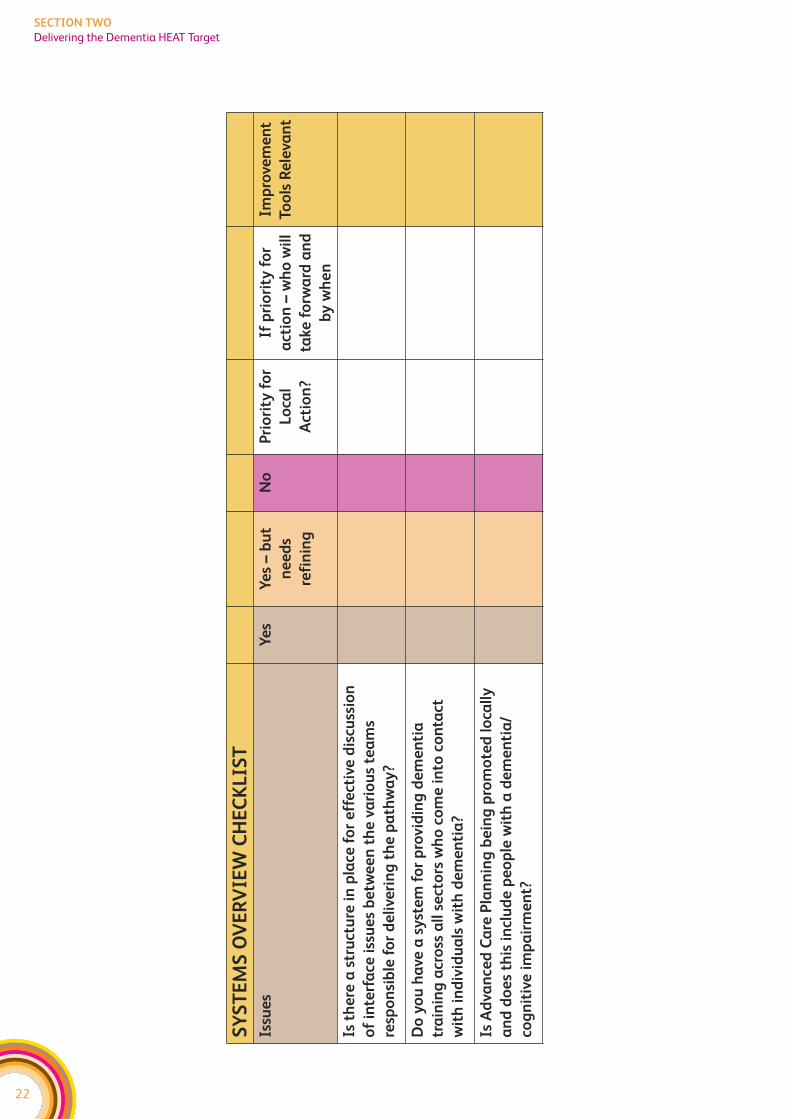
SYSTEMS OVERVIEW
When looking at changes to one part of the pathway, it’s important to consider the
impact on other parts of the system. Otherwise, services can end up making one part
work better but just move the problem elsewhere. For instance, a team might change
their referral criteria and end up effectively reducing the demand on this service, only to
find out that requests for services in another part of the system go up.
The Collaborative promotes looking at whole systems and to do this, services need to
have mechanisms in place for discussing potential changes across different parts of the
health and social care system. For the dementia pathway there are key interfaces
between all of the following:
f Primary Care
f Old Age Psychiatry
f Social Work Services and wider local authority services
f People with Dementia and their Carers
f Acute General Medicine
f Care Homes
f Voluntary and Independent sector provider
22
SECTION TWO
Delivering the Dementia HEAT Target
SY
ST
EM
S O
VE
RV
IEW
CH
EC
KL
IST
Issu
es
Ye
sY
es
– b
ut
ne
ed
s
refi
nin
g
No
Pri
ori
ty f
or
Lo
cal
Act
ion
?
If p
rio
rity
fo
r
act
ion
– w
ho
wil
l
take
fo
rwa
rd a
nd
by
wh
en
Imp
rove
me
nt
Too
ls R
ele
van
t
Is t
he
re a
str
uct
ure
in
pla
ce f
or
eff
ect
ive
dis
cuss
ion
of
inte
rfa
ce i
ssu
es
be
twe
en
th
e v
ari
ou
s te
am
s
resp
on
sib
le f
or
de
live
rin
g t
he
pa
thw
ay
?
Do
yo
u h
ave
a s
yst
em
fo
r p
rovid
ing
de
me
nti
a
tra
inin
g a
cro
ss a
ll s
ect
ors
wh
o c
om
e i
nto
co
nta
ct
wit
h i
nd
ivid
ua
ls w
ith
de
me
nti
a?
Is A
dva
nce
d C
are
Pla
nn
ing
be
ing
pro
mo
ted
lo
call
y
an
d d
oe
s th
is i
ncl
ud
e p
eo
ple
wit
h a
de
me
nti
a/
cog
nit
ive
im
pa
irm
en
t?
23
SECTION TWO
Delivering the Dementia HEAT Target
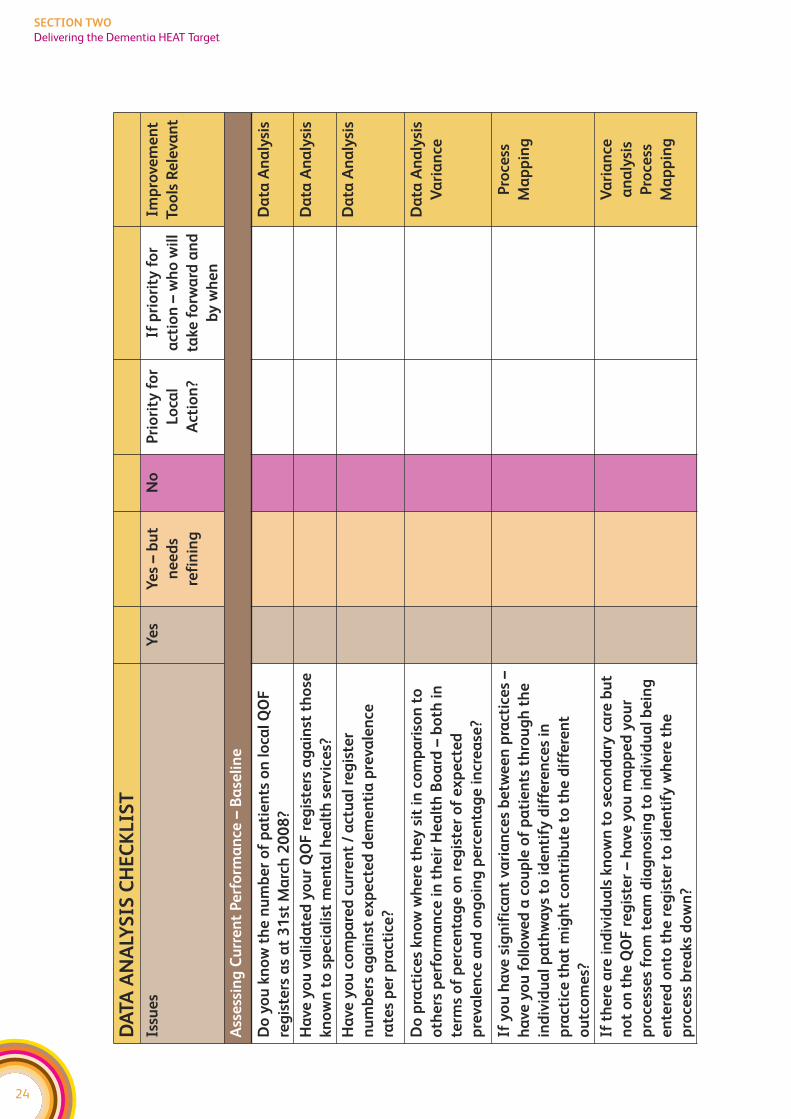
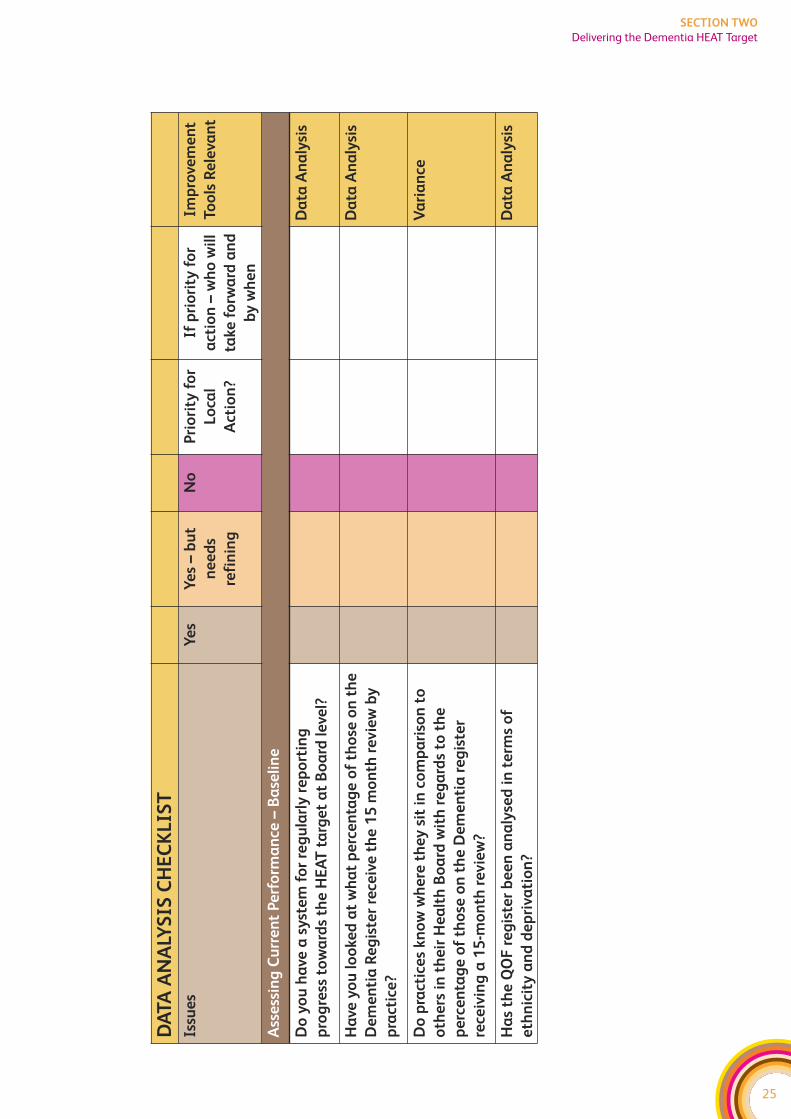
DATA ANALYSIS – ASSESSING CURRENT PERFORMANCE
The Mental Health Collaborative promotes using data to: understand how well your
current system is working; identify where to focus improvement actions; and to assess
whether any changes are really delivering improvements. Please also see the Model for
Improvement within the improvement tools section for further information on using data
to assess whether change is working.
The HEAT Target baseline year is the number of patients on the register at the 31st March
2007. A practical start point is therefore downloading data (from the ISD website –
http://www.isdscotland.org/isd/3305.html) on the number of patients on local GP QOF
registers as at 31st March 2007. You can also download data on the registers as at
31st March 2008 and identify those practices who are managing to increase numbers.
As a first step we recommend all areas compare QOF numbers against those
diagnosed with dementia in secondary care and cross-check names on lists to
establish if any registers are incomplete. Where there is a difference in names –
we recommend you then look at your processes to ensure those who are
diagnosed by secondary care are routinely entered onto the register.
A helpful step is to compare current (actual) QOF levels with expected UK Dementia
prevalence levels for each practice. This will give you an indication of how many patients
have been diagnosed compared to how many (given demographics and national
prevalence) ought to have been diagnosed for each practice.
If there is a Practice, or a number of Practices, with a high percentage of patients on the
register then you could consider comparing this practice with one at the lower end of
detection. Retrospective patient tracking may be helpful in addition to interviews with
GPs/Practice visits in order to compare and contrast knowledge, training, systems and
processes.
For those practices already displaying a high level of diagnosis (compared to expected
prevalence) it may be worthwhile comparing their performance with practices in other
Boards to see if they can further improve their performance. Please consult your
Regional Manager if you need help in identifying practices outside of your region.
We also recommend you look at the QOF information with regards to numbers of those
on the register who have had a formal review after 15 months.
The following table helps you to think about applying data analysis to the Dementia
workstream. This is not an exhaustive list, it is simply provided as a starting point to help
MHC teams think about how improvement tools apply to this work.
24
SECTION TWO
Delivering the Dementia HEAT Target
DA
TA
AN
ALY
SIS
CH
EC
KL
IST
Issu
es
Ye
sY
es
– b
ut
ne
ed
s
refi
nin
g
No
Pri
ori
ty f
or
Lo
cal
Act
ion
?
If p
rio
rity
fo
r
act
ion
– w
ho
wil
l
take
fo
rwa
rd a
nd
by
wh
en
Imp
rove
me
nt
Too
ls R
ele
van
t
Ass
ess
ing
Cu
rre
nt
Pe
rfo
rma
nce
–B
ase
lin
e
Do
yo
u k
no
w t
he
nu
mb
er
of
pa
tie
nts
on
lo
cal
QO
F
reg
iste
rs a
s a
t 3
1st
Ma
rch
20
08
?
Da
ta A
na
lysi
s
Ha
ve y
ou
va
lid
ate
d y
ou
r Q
OF
re
gis
ters
ag
ain
st t
ho
se
kn
ow
n t
o s
pe
cia
list
me
nta
l h
ea
lth
se
rvic
es?
Da
ta A
na
lysi
s
Ha
ve y
ou
co
mp
are
d c
urr
en
t /
act
ua
l re
gis
ter
nu
mb
ers
ag
ain
st e
xp
ect
ed
de
me
nti
a p
reva
len
ce
rate
s p
er
pra
ctic
e?
Da
ta A
na
lysi
s
Do
pra
ctic
es
kn
ow
wh
ere
th
ey
sit
in
co
mp
ari
son
to
oth
ers
pe
rfo
rma
nce
in
th
eir
He
alt
h B
oa
rd –
bo
th i
n
term
s o
f p
erc
en
tag
e o
n r
eg
iste
r o
f e
xp
ect
ed
pre
vale
nce
an
d o
ng
oin
g p
erc
en
tag
e i
ncr
ea
se?
Da
ta A
na
lysi
s
Va
ria
nce
If y
ou
ha
ve s
ign
ific
an
t va
ria
nce
s b
etw
ee
n p
ract
ice
s –
ha
ve y
ou
fo
llo
we
d a
co
up
le o
f p
ati
en
ts t
hro
ug
h t
he
ind
ivid
ua
l p
ath
wa
ys
to i
de
nti
fy d
iffe
ren
ces
in
pra
ctic
e t
ha
t m
igh
t co
ntr
ibu
te t
o t
he
dif
fere
nt
ou
tco
me
s?
Pro
cess
Ma
pp
ing
If t
he
re a
re i
nd
ivid
ua
ls k
no
wn
to
se
con
da
ry c
are
bu
t
no
t o
n t
he
QO
F r
eg
iste
r –
ha
ve y
ou
ma
pp
ed
yo
ur
pro
cess
es
fro
m t
ea
m d
iag
no
sin
g t
o i
nd
ivid
ua
l b
ein
g
en
tere
d o
nto
th
e r
eg
iste
r to
id
en
tify
wh
ere
th
e
pro
cess
bre
aks
do
wn
?
Va
ria
nce
an
aly
sis
Pro
cess
Ma
pp
ing
25
SECTION TWO
Delivering the Dementia HEAT Target
DA
TA
AN
ALY
SIS
CH
EC
KL
IST
Issu
es
Ye
sY
es
– b
ut
ne
ed
s
refi
nin
g
No
Pri
ori
ty f
or
Lo
cal
Act
ion
?
If p
rio
rity
fo
r
act
ion
– w
ho
wil
l
take
fo
rwa
rd a
nd
by
wh
en
Imp
rove
me
nt
Too
ls R
ele
van
t
Ass
ess
ing
Cu
rre
nt
Pe
rfo
rma
nce
–B
ase
lin
e
Do
yo
u h
ave
a s
yst
em
fo
r re
gu
larl
y r
ep
ort
ing
pro
gre
ss t
ow
ard
s th
e H
EA
T t
arg
et
at
Bo
ard
le
vel?
Da
ta A
na
lysi
s
Ha
ve y
ou
lo
oke
d a
t w
ha
t p
erc
en
tag
e o
f th
ose
on
th
e
De
me
nti
a R
eg
iste
r re
ceiv
e t
he
15
mo
nth
re
vie
w b
y
pra
ctic
e?
Da
ta A
na
lysi
s
Do
pra
ctic
es
kn
ow
wh
ere
th
ey
sit
in
co
mp
ari
son
to
oth
ers
in
th
eir
He
alt
h B
oa
rd w
ith
re
ga
rds
to t
he
pe
rce
nta
ge
of
tho
se o
n t
he
De
me
nti
a r
eg
iste
r
rece
ivin
g a
15
-mo
nth
re
vie
w?
Va
ria
nce
Ha
s th
e Q
OF
re
gis
ter
be
en
an
aly
sed
in
te
rms
of
eth
nic
ity
an
d d
ep
riva
tio
n?
Da
ta A
na
lysi
s

26
SECTION TWO
Delivering the Dementia HEAT Target
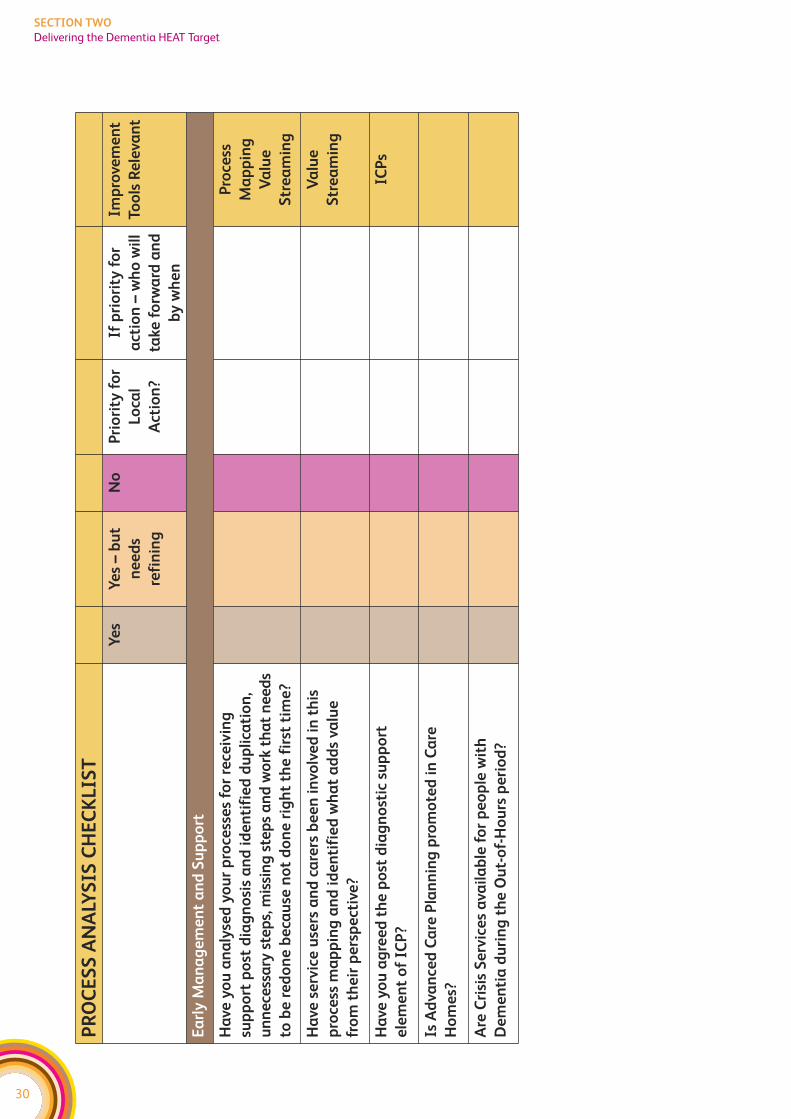
PROCESS ANALYSIS
Process Mapping is key for understanding what currently happens and where things
break down. It helps to identify what needs to change. Involving service users and carers
in the analysis helps you to understand how it feels to be on the receiving end of our
processes. Understanding care processes from the service user’s perspective is essential
for making service user focused improvements.
All the organisations/teams involved in the pathway should be identified and involved in
the process mapping activity. This process mapping work should already be taking
place in all Boards as part of the work to develop a Dementia ICP. The mapping work
should include service user and carers perspectives, in line with the ICP standards (See
ICP Process Standard 2). It should also include relevant social care providers. In addition
to the process mapping exercise – it might also help to undertake discovery interviews,
feedback questionnaires, and data sampling in order to fully understand the service
user and carers experience.
The Mental Health Collaborative team can help facilitate this process mapping exercise
and suggest approaches to other diagnostic work if you’re not sure. Please contact your
Regional Manager to discuss further.
But the work doesn’t stop at process mapping – you now need to look at streamlining
the pathway and look at the flow through the pathway. Using value-stream mapping,
you can identify:
f those steps in the process that don’t add any value
f bottlenecks in the process where capacity is not sufficient to meet the demand
f unnecessary delays (long waits)
f steps where there are quality issues – ie work has to be redone or sent back to a previous
step or where there is confusion over who is responsible for which aspects of care.
A further question to ask is whether there’s a group/individual that is responsible for
ensuring that the different teams/people involved in delivering care to someone with
dementia all work together effectively.
A range of tools within Lean are available to help with analysing the pathway, and
facilitation support is available from the Collaborative Team. The output of this
‘overview’ investigative work should be clarity on the key issues you need to address
locally to simplify and improve the care process. The Collaborative promotes then using
the PDSA approach to make incremental improvements to the process.
The following table helps you to think about applying process mapping to the Dementia
workstream. This is not an exhaustive list, it is simply provided as a starting point to help
MHC teams think about how improvement tools apply to this work.
27
SECTION TWO
Delivering the Dementia HEAT Target
28
SECTION TWO
Delivering the Dementia HEAT Target
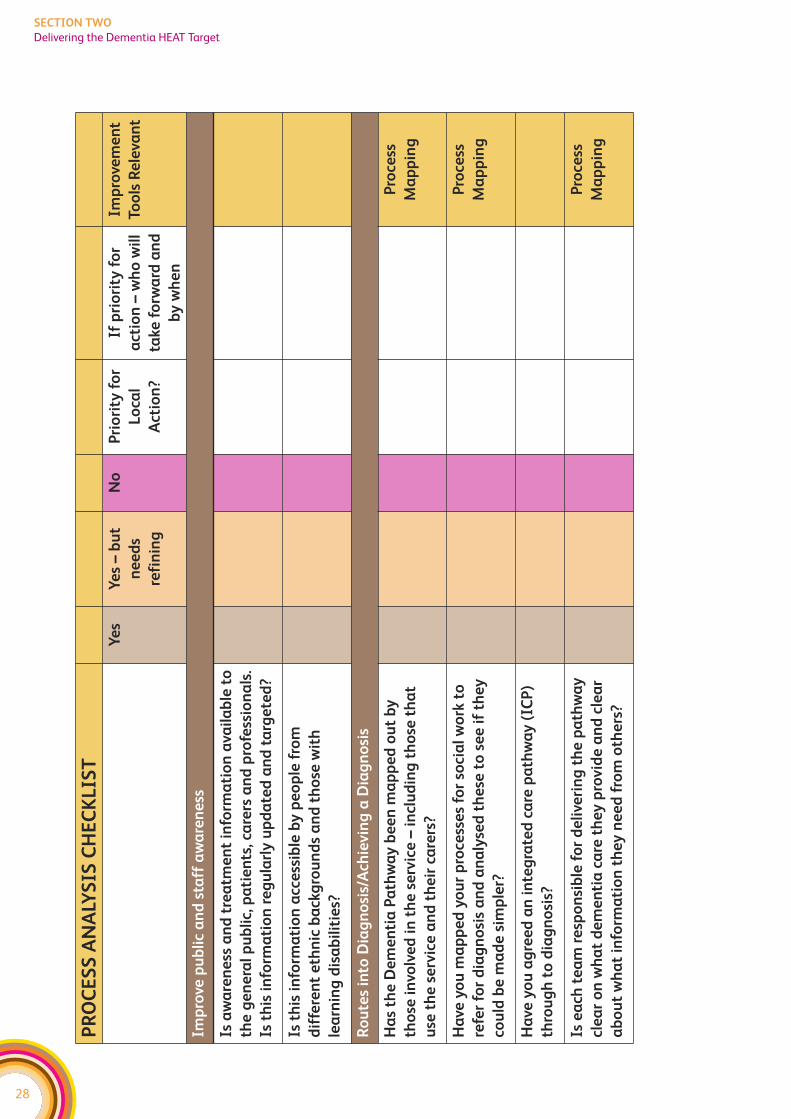
PR
OC
ES
S A
NA
LYS
IS C
HE
CK
LIS
T
Ye
sY
es
– b
ut
ne
ed
s
refi
nin
g
No
Pri
ori
ty f
or
Lo
cal
Act
ion
?
If p
rio
rity
fo
r
act
ion
– w
ho
wil
l
take
fo
rwa
rd a
nd
by
wh
en
Imp
rove
me
nt
Too
ls R
ele
van
t
Imp
rove
pu
bli
c a
nd
sta
ff a
wa
ren
ess
Is a
wa
ren
ess
an
d t
rea
tme
nt
info
rma
tio
n a
vail
ab
le t
o
the
ge
ne
ral
pu
bli
c, p
ati
en
ts, c
are
rs a
nd
pro
fess
ion
als
.
Is t
his
in
form
ati
on
re
gu
larl
y u
pd
ate
d a
nd
ta
rge
ted
?
Is t
his
in
form
ati
on
acc
ess
ible
by
pe
op
le f
rom
dif
fere
nt
eth
nic
ba
ckg
rou
nd
s a
nd
th
ose
wit
h
lea
rnin
g d
isa
bil
itie
s?
Ro
ute
s in
to D
iag
no
sis/
Ach
ievin
g a
Dia
gn
osi
s
Ha
s th
e D
em
en
tia
Pa
thw
ay
be
en
ma
pp
ed
ou
t b
y
tho
se i
nvo
lve
d i
n t
he
se
rvic
e –
in
clu
din
g t
ho
se t
ha
t
use
th
e s
erv
ice
an
d t
he
ir c
are
rs?
Pro
cess
Ma
pp
ing
Ha
ve y
ou
ma
pp
ed
yo
ur
pro
cess
es
for
soci
al
wo
rk t
o
refe
r fo
r d
iag
no
sis
an
d a
na
lyse
d t
he
se t
o s
ee
if
the
y
cou
ld b
e m
ad
e s
imp
ler?
Pro
cess
Ma
pp
ing
Ha
ve y
ou
ag
ree
d a
n i
nte
gra
ted
ca
re p
ath
wa
y (
ICP
)
thro
ug
h t
o d
iag
no
sis?
Is e
ach
te
am
re
spo
nsi
ble
fo
r d
eli
veri
ng
th
e p
ath
wa
y
cle
ar
on
wh
at
de
me
nti
a c
are
th
ey
pro
vid
e a
nd
cle
ar
ab
ou
t w
ha
t in
form
ati
on
th
ey
ne
ed
fro
m o
the
rs?
Pro
cess
Ma
pp
ing
29
SECTION TWO
Delivering the Dementia HEAT Target
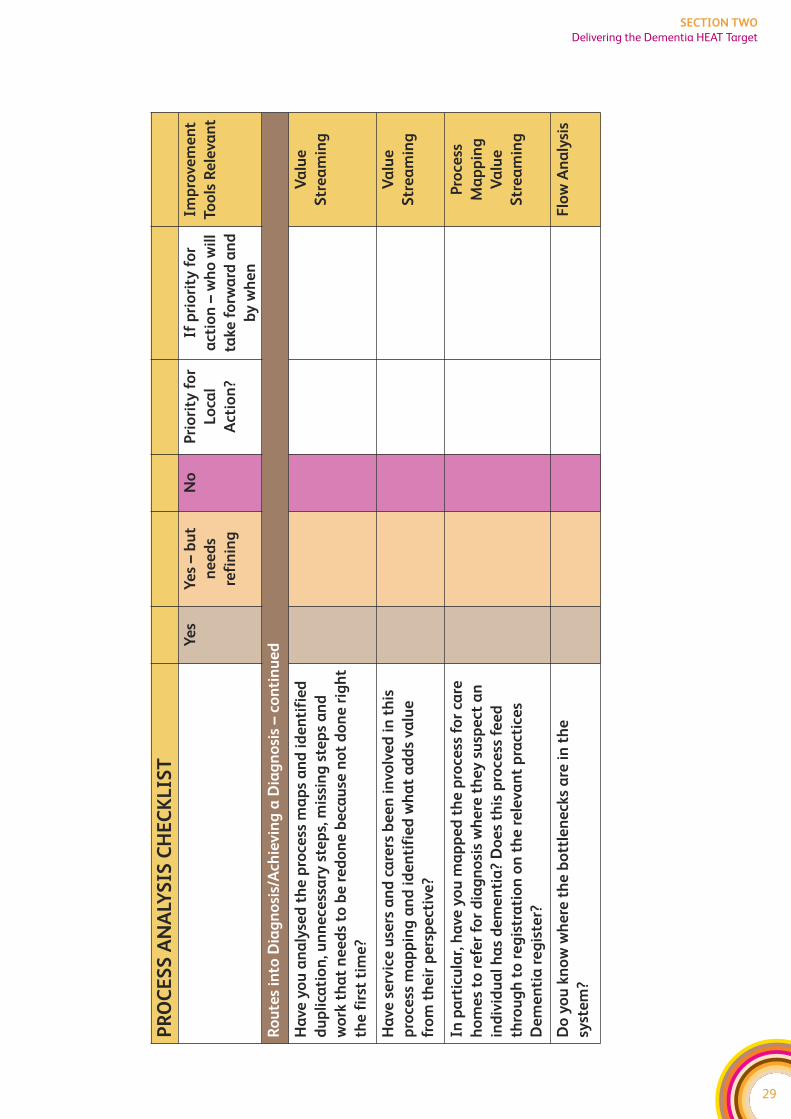
PR
OC
ES
S A
NA
LYS
IS C
HE
CK
LIS
T
Ye
sY
es
– b
ut
ne
ed
s
refi
nin
g
No
Pri
ori
ty f
or
Lo
cal
Act
ion
?
If p
rio
rity
fo
r
act
ion
– w
ho
wil
l
take
fo
rwa
rd a
nd
by
wh
en
Imp
rove
me
nt
Too
ls R
ele
van
t
Ro
ute
s in
to D
iag
no
sis/
Ach
ievin
g a
Dia
gn
osi
s –
con
tin
ue
d
Ha
ve y
ou
an
aly
sed
th
e p
roce
ss m
ap
s a
nd
id
en
tifi
ed
du
pli
cati
on
, un
ne
cess
ary
ste
ps,
mis
sin
g s
tep
s a
nd
wo
rk t
ha
t n
ee
ds
to b
e r
ed
on
e b
eca
use
no
t d
on
e r
igh
t
the
fir
st t
ime
?
Va
lue
Str
ea
min
g
Ha
ve s
erv
ice
use
rs a
nd
ca
rers
be
en
in
volv
ed
in
th
is
pro
cess
ma
pp
ing
an
d i
de
nti
fie
d w
ha
t a
dd
s va
lue
fro
m t
he
ir p
ers
pe
ctiv
e?
Va
lue
Str
ea
min
g
In p
art
icu
lar,
ha
ve y
ou
ma
pp
ed
th
e p
roce
ss f
or
care
ho
me
s to
re
fer
for
dia
gn
osi
s w
he
re t
he
y s
usp
ect
an
ind
ivid
ua
l h
as
de
me
nti
a?
Do
es
this
pro
cess
fe
ed
thro
ug
h t
o r
eg
istr
ati
on
on
th
e r
ele
van
t p
ract
ice
s
De
me
nti
a r
eg
iste
r?
Pro
cess
Ma
pp
ing
Va
lue
Str
ea
min
g
Do
yo
u k
no
w w
he
re t
he
bo
ttle
ne
cks
are
in
th
e
syst
em
?
Flo
w A
na
lysi
s
30
SECTION TWO
Delivering the Dementia HEAT Target
PR
OC
ES
S A
NA
LYS
IS C
HE
CK
LIS
T
Ye
sY
es
– b
ut
ne
ed
s
refi
nin
g
No
Pri
ori
ty f
or
Lo
cal
Act
ion
?
If p
rio
rity
fo
r
act
ion
– w
ho
wil
l
take
fo
rwa
rd a
nd
by
wh
en
Imp
rove
me
nt
Too
ls R
ele
van
t
Ea
rly
Ma
na
ge
me
nt
an
d S
up
po
rt
Ha
ve y
ou
an
aly
sed
yo
ur
pro
cess
es
for
rece
ivin
g
sup
po
rt p
ost
dia
gn
osi
s a
nd
id
en
tifi
ed
du
pli
cati
on
,
un
ne
cess
ary
ste
ps,
mis
sin
g s
tep
s a
nd
wo
rk t
ha
t n
ee
ds
to b
e r
ed
on
e b
eca
use
no
t d
on
e r
igh
t th
e f
irst
tim
e?
Pro
cess
Ma
pp
ing
Va
lue
Str
ea
min
g
Ha
ve s
erv
ice
use
rs a
nd
ca
rers
be
en
in
volv
ed
in
th
is
pro
cess
ma
pp
ing
an
d i
de
nti
fie
d w
ha
t a
dd
s va
lue
fro
m t
he
ir p
ers
pe
ctiv
e?
Va
lue
Str
ea
min
g
Ha
ve y
ou
ag
ree
d t
he
po
st d
iag
no
stic
su
pp
ort
ele
me
nt
of
ICP
?
ICP
s
Is A
dva
nce
d C
are
Pla
nn
ing
pro
mo
ted
in
Ca
re
Ho
me
s?
Are
Cri
sis
Se
rvic
es
ava
ila
ble
fo
r p
eo
ple
wit
h
De
me
nti
a d
uri
ng
th
e O
ut-
of-
Ho
urs
pe
rio
d?
31
SECTION TWO
Delivering the Dementia HEAT Target
UNDERSTANDING DEMAND AND CAPACITY
Understanding the demand for services is essential, as without this services cannot
effectively plan to meet this demand. However, they also need to understand the capacity
that they have to respond to that demand and whether they are making best use of this.
For instance, if a team has a highly skilled member of staff spending a day booking care
plan reviews, this is not making effective use of their current capacity. An audit across
one community mental health area showed that differences in waiting lists between
teams were five times more to do with what they did with each case (ie differences in
number of sessions and duration) than the number of referrals the teams received.
Matching demand and capacity is important because delays in receiving a timely response
can leave people in distress with no support. Further, delays can lead to an escalation of
someone’s illness.
The presence of a waiting list is a sign that demand is not being matched with capacity,
it is not necessarily an indication that the demand exceeds the capacity (please see
improvement tools section of toolkit for more information on this). It is therefore
important to gather information on demand, activity, and capacity and to analyse this
in greater detail to understand profiles, trends and variances and whether additional
resources are really needed, or it is a case of redesigning to make better use of what
already exists.
The following table helps you to think about areas you could apply demand and capacity
analysis in relation to the Dementia workstream. Again, it is not an exhaustive list, it is
just provided as a starting point to help MHC teams to think about how demand and
capacity work applies to the Dementia workstream.
32
SECTION TWO
Delivering the Dementia HEAT Target
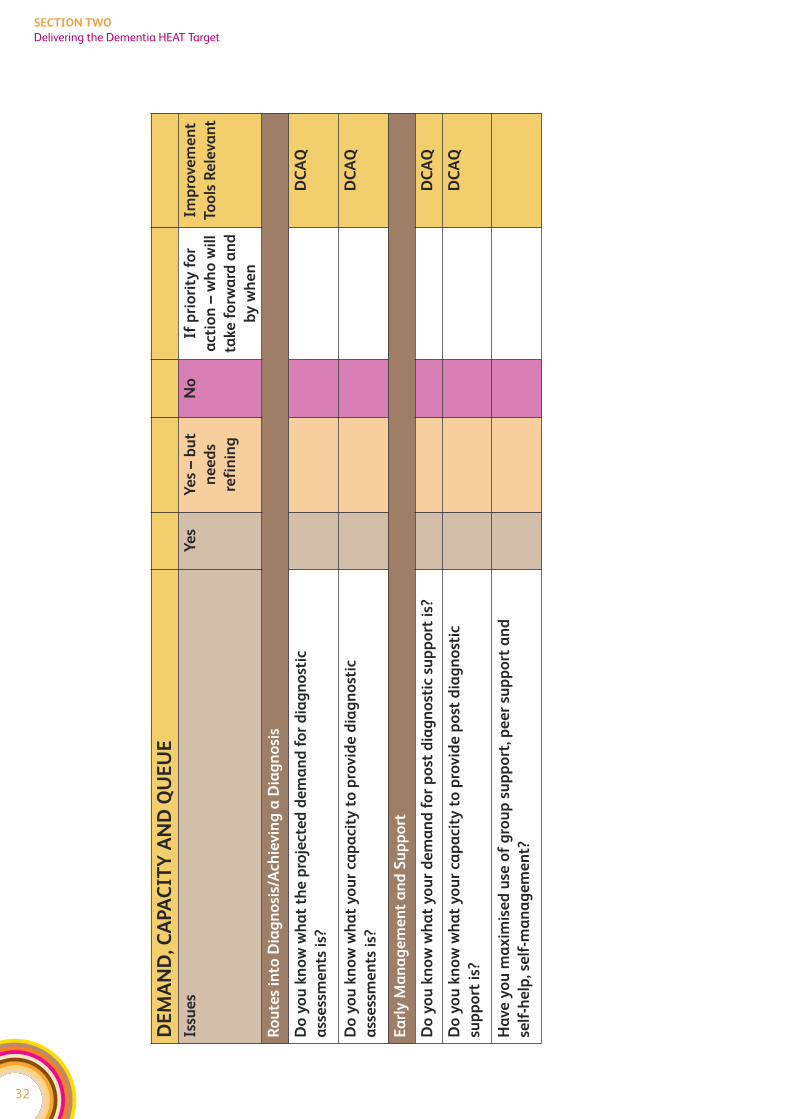
DE
MA
ND
, CA
PA
CIT
Y A
ND
QU
EU
E
Issu
es
Ye
sY
es
– b
ut
ne
ed
s
refi
nin
g
No
If p
rio
rity
fo
r
act
ion
– w
ho
wil
l
take
fo
rwa
rd a
nd
by
wh
en
Imp
rove
me
nt
Too
ls R
ele
van
t
Ro
ute
s in
to D
iag
no
sis/
Ach
ievin
g a
Dia
gn
osi
s
Do
yo
u k
no
w w
ha
t th
e p
roje
cte
d d
em
an
d f
or
dia
gn
ost
ic
ass
ess
me
nts
is?
DC
AQ
Do
yo
u k
no
w w
ha
t y
ou
r ca
pa
city
to
pro
vid
e d
iag
no
stic
ass
ess
me
nts
is?
DC
AQ
Ea
rly
Ma
na
ge
me
nt
an
d S
up
po
rt
Do
yo
u k
no
w w
ha
t y
ou
r d
em
an
d f
or
po
st d
iag
no
stic
su
pp
ort
is?
DC
AQ
Do
yo
u k
no
w w
ha
t y
ou
r ca
pa
city
to
pro
vid
e p
ost
dia
gn
ost
ic
sup
po
rt i
s?
DC
AQ
Ha
ve y
ou
ma
xim
ise
d u
se o
f g
rou
p s
up
po
rt, p
ee
r su
pp
ort
an
d
self
-he
lp, s
elf
-ma
na
ge
me
nt?
33
SECTION TWO
Delivering the Readmissions HEAT Target
DELIVERING THE READMISSIONS HEAT TARGET
HEAT target
To reduce number hospital readmissions (within one year for those that have
had a psychiatric hospital admission of over seven days) by 10% by the end
of 2009
Delivering the Readmissions HEAT target is about improving both community mental
health services (including crisis services/functions) and inpatient services. Improvements
can be categorised under three main headings:
1. Improving the design of the care delivery processes – this is about ensuring a well
designed processes that eliminate duplication and unnecessary steps, minimise the
potential for mistakes, and deliver the right amount of treatment capacity to see the
work without unnecessary waits. This needs to take a whole systems perspective
working across the traditional health and social care boundaries. Changes here should
result in an improved experience of using care services.
2. Ensuring we deliver effective care interventions – this relates to ensuring that the
relevant standards for Integrated Care Pathways and any other nationally approved
guidance (ie SIGN) is routinely followed. However, this is not just about improving the
clinical standards of care – it is about the range of care interventions including those
delivered by the local authority and voluntary sector services. Changes here should
lead to improved outcomes.
3. Ensuring staff are properly equipped to deliver services – this recognises the
importance of applying knowledge and skills within a values-based and recovery
oriented framework. All improvement work is underpinned by continuous professional
development and workforce planning. There may be a need to extend roles, to develop
new roles and to review the skill mix within teams. Changes here should contribute to
both improved outcomes and improved experiences for those using services.
The following diagram highlights the key elements of the services users journey of care
that you will need to work on to reduce readmissions:
f For the design of care delivery processes – the first step is for each Board, and their
key partners, to understand what their key system and process design issues are and
this document provides advice on how to do this. Over the life of the collaborative we
will collate and share information across Boards and key partners, to identify where
there are common system and process design issues and what works in terms of
redesigning those systems and processes.
f Standards already exist for ensuring we deliver effective care interventions (eg ICP
Guidance and SIGN guidelines). At a local level, collaborative resources can be used
to focus on implementing those clinical and care standards that are relevant to the
delivery of the HEAT target. The following diagram shows how ICP Standards and
SIGN guidelines relate to this work stream.
f The diagram also highlights the key workforce programmes that underpin the
delivery of improved services.
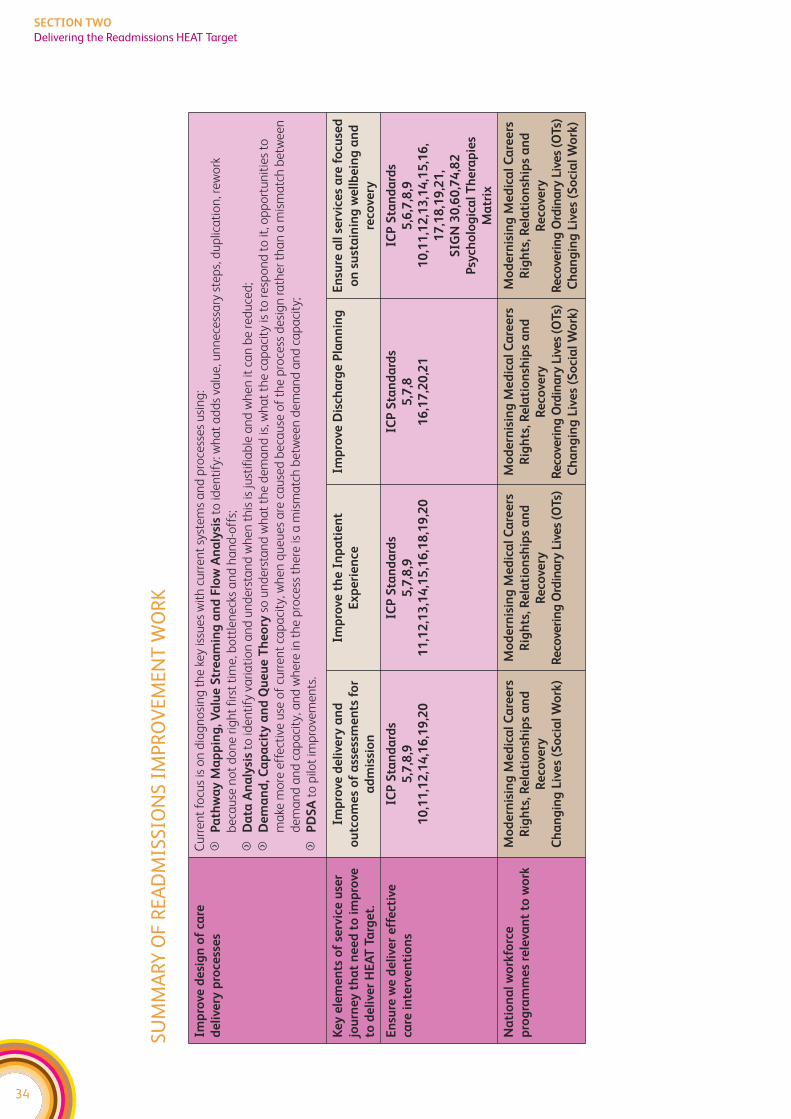
34
SECTION TWO
Delivering the Readmissions HEAT Target
SUM
MA
RY O
F RE
AD
MIS
SIO
NS
IMPR
OV
EMEN
T W
ORK
Imp
rove
de
sig
n o
f ca
re
de
live
ry p
roce
sse
s
Cu
rre
nt
focu
s is
on
dia
gn
osi
ng
th
e k
ey is
sue
s w
ith
cu
rre
nt
syst
em
s a
nd
pro
cess
es
usi
ng
:
fP
ath
wa
y M
ap
pin
g, V
alu
e S
tre
am
ing
an
d F
low
An
aly
sis
to id
en
tify
: wh
at
ad
ds
valu
e, u
nn
ece
ssa
ry s
tep
s, d
up
lica
tio
n, r
ew
ork
be
cau
se n
ot
do
ne
rig
ht
firs
t ti
me
, bo
ttle
ne
cks
an
d h
an
d-o
ffs;
fD
ata
An
aly
sis
to id
en
tify
va
ria
tio
n a
nd
un
de
rsta
nd
wh
en
th
is is
just
ifia
ble
an
d w
he
n it
ca
n b
e r
ed
uce
d;
fD
em
an
d, C
ap
aci
ty a
nd
Qu
eu
e T
he
ory
so u
nd
ers
tan
d w
ha
t th
e d
em
an
d is
, wh
at
the
ca
pa
city
is t
o r
esp
on
d t
o it
, op
po
rtu
nit
ies
to
ma
ke m
ore
eff
ect
ive
use
of
curr
en
t ca
pa
city
, wh
en
qu
eu
es
are
ca
use
d b
eca
use
of
the
pro
cess
de
sig
n r
ath
er
tha
n a
mis
ma
tch
be
twe
en
de
ma
nd
an
d c
ap
aci
ty, a
nd
wh
ere
in t
he
pro
cess
th
ere
is a
mis
ma
tch
be
twe
en
de
ma
nd
an
d c
ap
aci
ty;
fP
DS
Ato
pilo
t im
pro
vem
en
ts.
Ke
y e
lem
en
ts o
f se
rvic
e u
ser
jou
rne
y t
ha
t n
ee
d t
o i
mp
rove
to d
eli
ver
HE
AT
Ta
rge
t.
Imp
rove
de
live
ry a
nd
ou
tco
me
s o
f a
sse
ssm
en
ts f
or
ad
mis
sio
n
Imp
rove
th
e I
np
ati
en
t
Ex
pe
rie
nce
Imp
rove
Dis
cha
rge
Pla
nn
ing
En
sure
all
se
rvic
es
are
fo
cuse
d
on
su
sta
inin
g w
ell
be
ing
an
d
reco
very
En
sure
we
de
live
r e
ffe
ctiv
e
care
in
terv
en
tio
ns
ICP
Sta
nd
ard
s
5,7
,8,9
10
,11
,12
,14
,16
,19
,20
ICP
Sta
nd
ard
s
5,7
,8,9
11
,12
,13
,14
,15
,16
,18
,19
,20
ICP
Sta
nd
ard
s
5,7
,8
16
,17
,20
,21
ICP
Sta
nd
ard
s
5,6
,7,8
,9
10
,11
,12
,13
,14
,15
,16
,
17
,18
,19
,21
,
SIG
N 3
0,6
0,7
4,8
2
Psy
cho
log
ica
l T
he
rap
ies
Ma
trix
Na
tio
na
l w
ork
forc
e
pro
gra
mm
es
rele
van
t to
wo
rk
Mo
de
rnis
ing
Me
dic
al
Ca
ree
rs
Rig
hts
, Re
lati
on
ship
s a
nd
Re
cove
ry
Ch
an
gin
g L
ive
s (S
oci
al
Wo
rk)
Mo
de
rnis
ing
Me
dic
al
Ca
ree
rs
Rig
hts
, Re
lati
on
ship
s a
nd
Re
cove
ry
Re
cove
rin
g O
rdin
ary
Liv
es
(OT
s)
Mo
de
rnis
ing
Me
dic
al
Ca
ree
rs
Rig
hts
, Re
lati
on
ship
s a
nd
Re
cove
ry
Re
cove
rin
g O
rdin
ary
Liv
es
(OT
s)
Ch
an
gin
g L
ive
s (S
oci
al
Wo
rk)
Mo
de
rnis
ing
Me
dic
al
Ca
ree
rs
Rig
hts
, Re
lati
on
ship
s a
nd
Re
cove
ry
Re
cove
rin
g O
rdin
ary
Liv
es
(OT
s)
Ch
an
gin
g L
ive
s (S
oci
al
Wo
rk)

35
SECTION TWO
Delivering the Readmissions HEAT Target
READMISSIONS – SYSTEMS DIAGNOSIS CHECKLIST
This document is aimed at those involved in leading and planning the Mental Health
Collaborative work. It is provided as a supportive tool to help you think about how to
apply improvement methods to enable the delivery of the Readmissions HEAT target
and associated improvements. It is designed to be used as part of the Mental Health
Collaborative Toolkit which includes sections on the different improvement methods
mentioned and an overview of the Collaborative approach. It works on the basis that
the first 3-6 months should be on diagnosis – establishing the key problems that are
hindering effective delivery against the HEAT targets.
As with clinical care – getting the diagnosis right is important as it guides what interventions
you then go on to undertake. If you’re treating the wrong problem – chances are the
treatment won’t be effective. Likewise – if change programmes are based on an incorrect
analysis of the problem – chances are that the change programme will be ineffective. So
it’s worth investing the time up front to get the diagnosis of the problem right.
Visioning is a key part of diagnosis– as we need to be clear that we are doing the right
things, not just doing the wrong things more efficiently.
We realise that many Boards have already made significant progress against this target
and we are not suggesting you put on hold any work already in progress. However, the
following suggestions may give you some ideas about how to progress this work further.

36
SECTION TWO
Delivering the Readmissions HEAT Target
37
SECTION TWO
Delivering the Readmissions HEAT Target
SYSTEMS OVERVIEW
When looking at changes to one part of the pathway, it’s important to consider the
impact on other parts of the system. Otherwise, we can end up making one part work
better but just move the problem elsewhere. For instance, you might change referral
criteria into a community team and end up effectively reducing the demand on this
service, only to find out that your requests for community crisis assessments go up.
The Collaborative promotes looking at your whole system and to do this you need to
have mechanisms in place for discussing potential changes across teams and
organisations. For the readmissions workstream there are key interfaces between:
f Inpatient Wards – Crisis Services/Crisis Functions
f Crisis Services/Functions – Community Teams
f Community Teams – Inpatient Wards
f Health – Voluntary Sector – Social Work Services
f Primary Care – Specialist Services
f Mental Health Services – Substance Misuse Services
f Mental Health Services – Child and Adolescent Mental Health Services (CAMHS)
f Mental Health Services – Learning Disabilities Services
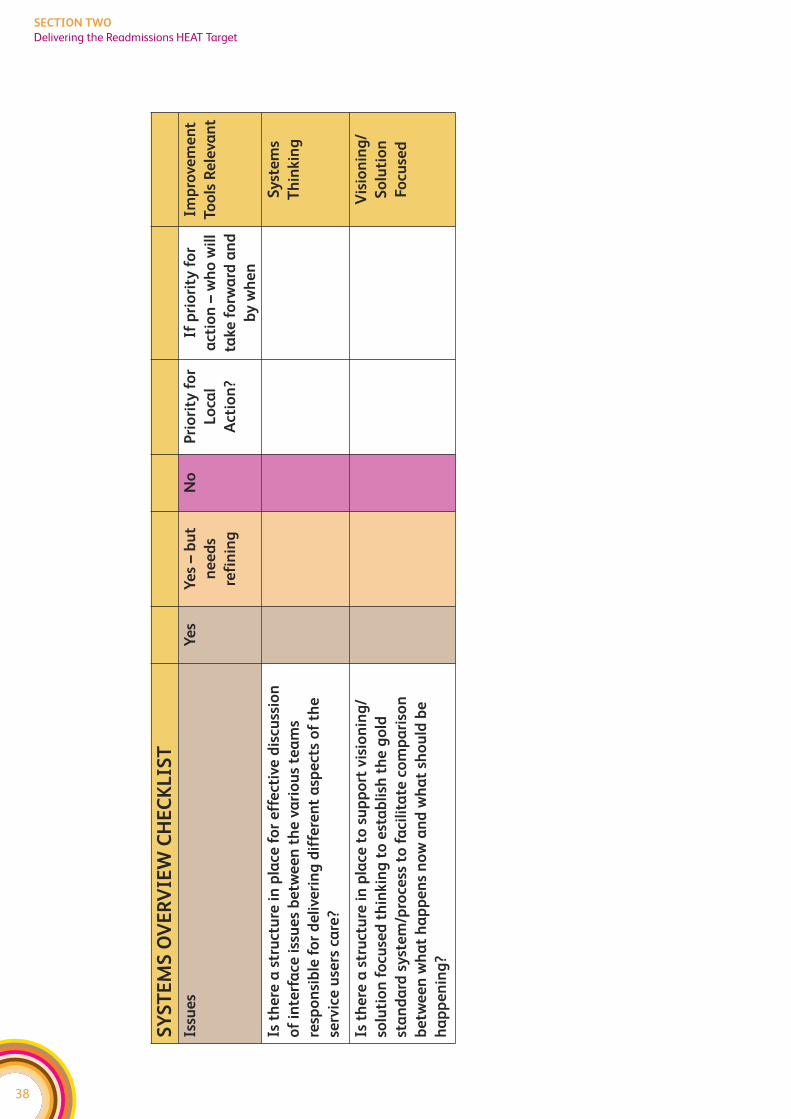
38
SECTION TWO
Delivering the Readmissions HEAT Target
SY
ST
EM
S O
VE
RV
IEW
CH
EC
KL
IST
Issu
es
Ye
sY
es
– b
ut
ne
ed
s
refi
nin
g
No
Pri
ori
ty f
or
Lo
cal
Act
ion
?
If p
rio
rity
fo
r
act
ion
– w
ho
wil
l
take
fo
rwa
rd a
nd
by
wh
en
Imp
rove
me
nt
Too
ls R
ele
van
t
Is t
he
re a
str
uct
ure
in
pla
ce f
or
eff
ect
ive
dis
cuss
ion
of
inte
rfa
ce i
ssu
es
be
twe
en
th
e v
ari
ou
s te
am
s
resp
on
sib
le f
or
de
live
rin
g d
iffe
ren
t a
spe
cts
of
the
serv
ice
use
rs c
are
?
Sy
ste
ms
Th
inkin
g
Is t
he
re a
str
uct
ure
in
pla
ce t
o s
up
po
rt v
isio
nin
g/
solu
tio
n f
ocu
sed
th
inkin
g t
o e
sta
bli
sh t
he
go
ld
sta
nd
ard
sy
ste
m/p
roce
ss t
o f
aci
lita
te c
om
pa
riso
n
be
twe
en
wh
at
ha
pp
en
s n
ow
an
d w
ha
t sh
ou
ld b
e
ha
pp
en
ing
?
Vis
ion
ing
/
So
luti
on
Focu
sed
39
SECTION TWO
Delivering the Readmissions HEAT Target
DATA ANALYSIS – ASSESSING CURRENT PERFORMANCE
The Mental Health Collaborative promotes using data to: understand how well your
current system is working, identify where to focus improvement actions, and to assess
whether any changes are really delivering improvements. Please see also the Model for
Improvement, within the improvement tools section, for further information on using
data to assess whether change is working.
The HEAT target is a proxy measure for improving both the quality of inpatient services
but also the range and quality of community services available. This means it’s important
that you have a system for collecting the reason for a readmission, as this will help to
identify if there are elements of the community system that are routinely breaking down
and hence leading to a readmission. Your data collection needs to consider not just the
presenting reason, but whether additional support/services might have removed the
need for readmission. We highly recommend you put mechanisms in place locally to
collect this data if you are not already doing so. If you have no historic information, then
you might consider doing a retrospective audit. For large services, this could focus on the
wards or teams that have high readmission rates.
We recommend you analyse the data to identify those areas/teams with high levels of
readmissions, and focus your work here. Where there are significant variances between
teams and wards covering the same speciality, we recommend you look at the reasons
for these differences. Retrospective patient tracking may be helpful in addition to
interviews with teams in order to compare and contrast knowledge, training, systems and
processes. You will also need to take deprivation into account in this analysis. If you want
further advice on how to do this, please contact your Collaborative Regional Manager.
We also recommend you use the SPARRA data to identify those individuals who are at
a high risk of readmission locally. This will give you named patients. You can then do an
audit of these care plans and check that relapse plans are in place. You may also want to
look at how you feed the SPARRA analysis into any social work assessment of eligibility
for services – as you may want to ensure that those identified as high risk of readmission
under SPARRA show as high risk under social work eligibility criteria and hence are a
priority for social work input.
You may also want to look at use of alternatives to admission – and compare any variances
between areas. For instance, if one area/team makes much better use of alternatives to
admission than another, do you know why?
The following table helps you think about applying data analysis to the readmissions
workstream. This is not an exhaustive list, it is simply provided as a starting point to help
MHC teams think about how improvement tools apply to this work.
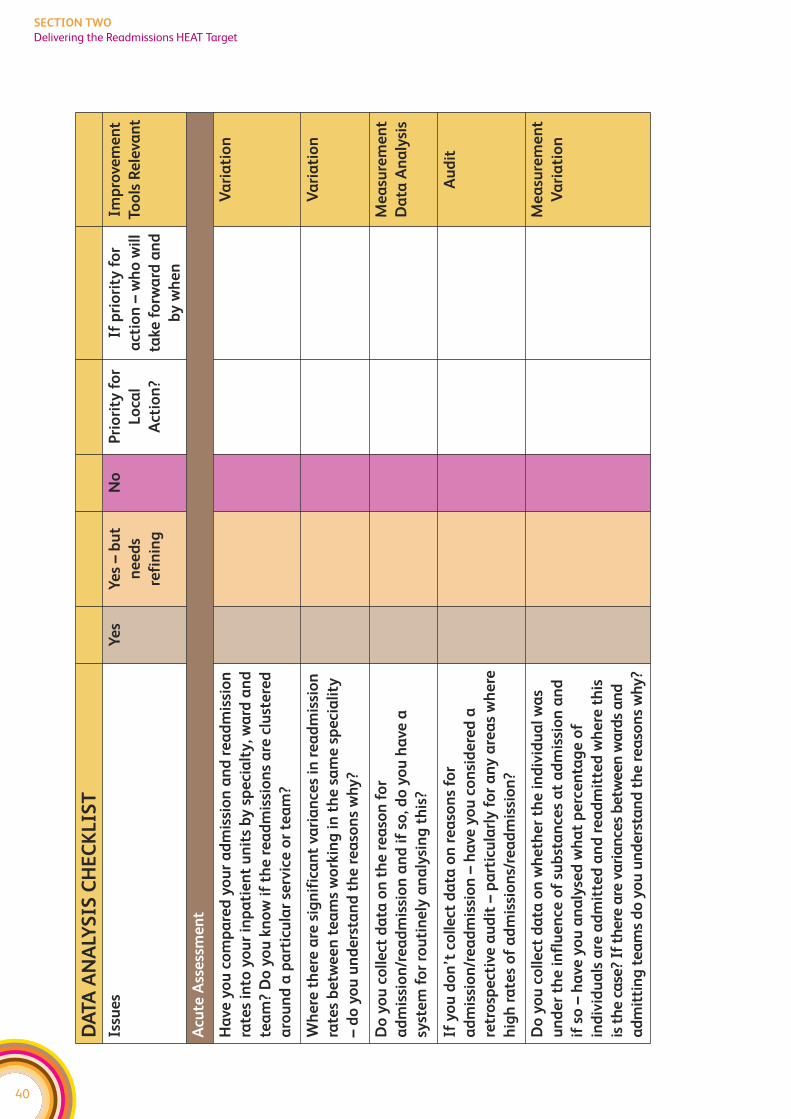
40
SECTION TWO
Delivering the Readmissions HEAT Target
DA
TA
AN
ALY
SIS
CH
EC
KL
IST
Issu
es
Ye
sY
es
– b
ut
ne
ed
s
refi
nin
g
No
Pri
ori
ty f
or
Lo
cal
Act
ion
?
If p
rio
rity
fo
r
act
ion
– w
ho
wil
l
take
fo
rwa
rd a
nd
by
wh
en
Imp
rove
me
nt
Too
ls R
ele
van
t
Acu
te A
sse
ssm
en
t
Ha
ve y
ou
co
mp
are
d y
ou
r a
dm
issi
on
an
d r
ea
dm
issi
on
rate
s in
to y
ou
r in
pa
tie
nt
un
its
by
sp
eci
alt
y, w
ard
an
d
tea
m?
Do
yo
u k
no
w i
f th
e r
ea
dm
issi
on
s a
re c
lust
ere
d
aro
un
d a
pa
rtic
ula
r se
rvic
e o
r te
am
?
Va
ria
tio
n
Wh
ere
th
ere
are
sig
nif
ica
nt
vari
an
ces
in r
ea
dm
issi
on
rate
s b
etw
ee
n t
ea
ms
wo
rkin
g i
n t
he
sa
me
sp
eci
ali
ty
– d
o y
ou
un
de
rsta
nd
th
e r
ea
son
s w
hy
?
Va
ria
tio
n
Do
yo
u c
oll
ect
da
ta o
n t
he
re
aso
n f
or
ad
mis
sio
n/r
ea
dm
issi
on
an
d i
f so
, do
yo
u h
ave
a
syst
em
fo
r ro
uti
ne
ly a
na
lysi
ng
th
is?
Me
asu
rem
en
t
Da
ta A
na
lysi
s
If y
ou
do
n’t
co
lle
ct d
ata
on
re
aso
ns
for
ad
mis
sio
n/r
ea
dm
issi
on
– h
ave
yo
u c
on
sid
ere
d a
retr
osp
ect
ive
au
dit
– p
art
icu
larl
y f
or
an
y a
rea
s w
he
re
hig
h r
ate
s o
f a
dm
issi
on
s/re
ad
mis
sio
n?
Au
dit
Do
yo
u c
oll
ect
da
ta o
n w
he
the
r th
e i
nd
ivid
ua
l w
as
un
de
r th
e i
nfl
ue
nce
of
sub
sta
nce
s a
t a
dm
issi
on
an
d
if s
o –
ha
ve y
ou
an
aly
sed
wh
at
pe
rce
nta
ge
of
ind
ivid
ua
ls a
re a
dm
itte
d a
nd
re
ad
mit
ted
wh
ere
th
is
is t
he
ca
se?
If t
he
re a
re v
ari
an
ces
be
twe
en
wa
rds
an
d
ad
mit
tin
g t
ea
ms
do
yo
u u
nd
ers
tan
d t
he
re
aso
ns
wh
y?
Me
asu
rem
en
t
Va
ria
tio
n
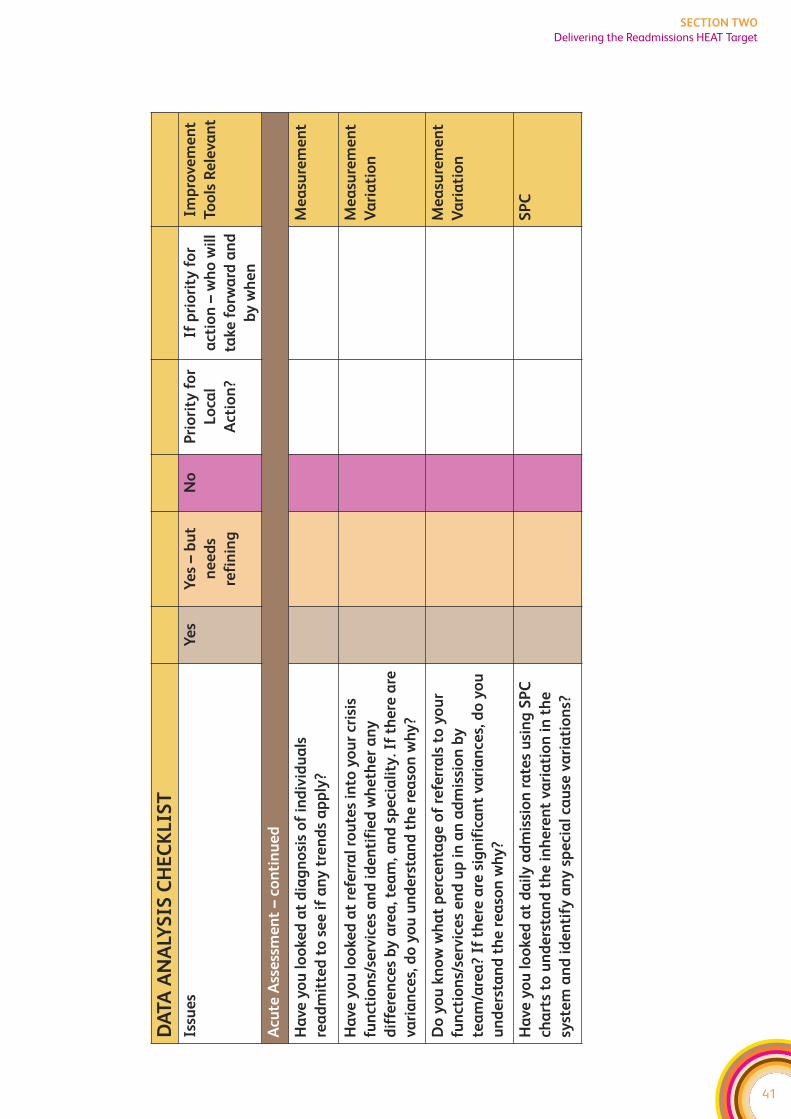
41
SECTION TWO
Delivering the Readmissions HEAT Target
DA
TA
AN
ALY
SIS
CH
EC
KL
IST
Issu
es
Ye
sY
es
– b
ut
ne
ed
s
refi
nin
g
No
Pri
ori
ty f
or
Lo
cal
Act
ion
?
If p
rio
rity
fo
r
act
ion
– w
ho
wil
l
take
fo
rwa
rd a
nd
by
wh
en
Imp
rove
me
nt
Too
ls R
ele
van
t
Acu
te A
sse
ssm
en
t –
con
tin
ue
d
Ha
ve y
ou
lo
oke
d a
t d
iag
no
sis
of
ind
ivid
ua
ls
rea
dm
itte
d t
o s
ee
if
an
y t
ren
ds
ap
ply
?
Me
asu
rem
en
t
Ha
ve y
ou
lo
oke
d a
t re
ferr
al
rou
tes
into
yo
ur
cris
is
fun
ctio
ns/
serv
ice
s a
nd
id
en
tifi
ed
wh
eth
er
an
y
dif
fere
nce
s b
y a
rea
, te
am
, an
d s
pe
cia
lity
. If
the
re a
re
vari
an
ces,
do
yo
u u
nd
ers
tan
d t
he
re
aso
n w
hy
?
Me
asu
rem
en
t
Va
ria
tio
n
Do
yo
u k
no
w w
ha
t p
erc
en
tag
e o
f re
ferr
als
to
yo
ur
fun
ctio
ns/
serv
ice
s e
nd
up
in
an
ad
mis
sio
n b
y
tea
m/a
rea
? If
th
ere
are
sig
nif
ica
nt
vari
an
ces,
do
yo
u
un
de
rsta
nd
th
e r
ea
son
wh
y?
Me
asu
rem
en
t
Va
ria
tio
n
Ha
ve y
ou
lo
oke
d a
t d
ail
y a
dm
issi
on
ra
tes
usi
ng
SP
C
cha
rts
to u
nd
ers
tan
d t
he
in
he
ren
t va
ria
tio
n i
n t
he
syst
em
an
d i
de
nti
fy a
ny
sp
eci
al
cau
se v
ari
ati
on
s?
SP
C
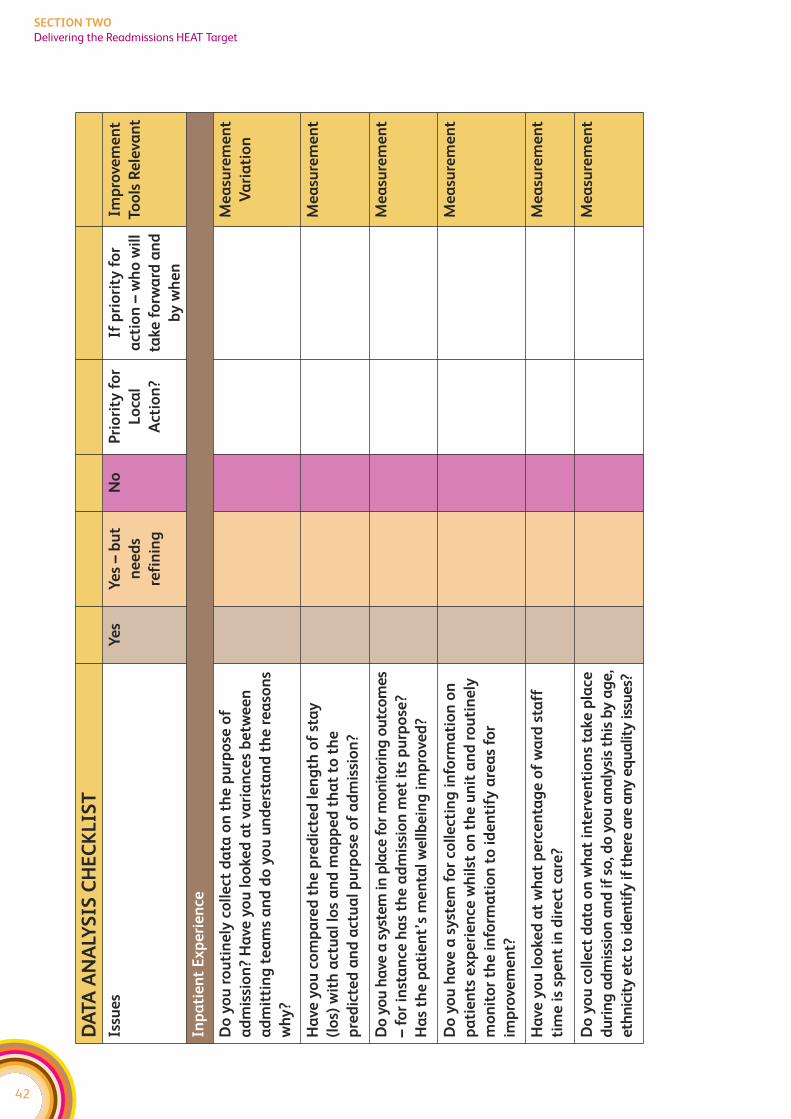
42
SECTION TWO
Delivering the Readmissions HEAT Target
DA
TA
AN
ALY
SIS
CH
EC
KL
IST
Issu
es
Ye
sY
es
– b
ut
ne
ed
s
refi
nin
g
No
Pri
ori
ty f
or
Lo
cal
Act
ion
?
If p
rio
rity
fo
r
act
ion
– w
ho
wil
l
take
fo
rwa
rd a
nd
by
wh
en
Imp
rove
me
nt
Too
ls R
ele
van
t
Inp
ati
en
t E
xp
eri
en
ce
Do
yo
u r
ou
tin
ely
co
lle
ct d
ata
on
th
e p
urp
ose
of
ad
mis
sio
n?
Ha
ve y
ou
lo
oke
d a
t va
ria
nce
s b
etw
ee
n
ad
mit
tin
g t
ea
ms
an
d d
o y
ou
un
de
rsta
nd
th
e r
ea
son
s
wh
y?
Me
asu
rem
en
t
Va
ria
tio
n
Ha
ve y
ou
co
mp
are
d t
he
pre
dic
ted
le
ng
th o
f st
ay
(lo
s) w
ith
act
ua
l lo
s a
nd
ma
pp
ed
th
at
to t
he
pre
dic
ted
an
d a
ctu
al
pu
rpo
se o
f a
dm
issi
on
?
Me
asu
rem
en
t
Do
yo
u h
ave
a s
yste
m in
pla
ce f
or
mo
nit
ori
ng
ou
tco
me
s
– f
or
inst
an
ce h
as
the
ad
mis
sio
n m
et
its
pu
rpo
se?
Ha
s th
e p
ati
en
t’s
me
nta
l w
ell
be
ing
im
pro
ved
?
Me
asu
rem
en
t
Do
yo
u h
ave
a s
yst
em
fo
r co
lle
ctin
g i
nfo
rma
tio
n o
n
pa
tie
nts
ex
pe
rie
nce
wh
ilst
on
th
e u
nit
an
d r
ou
tin
ely
mo
nit
or
the
in
form
ati
on
to
id
en
tify
are
as
for
imp
rove
me
nt?
Me
asu
rem
en
t
Ha
ve y
ou
lo
oke
d a
t w
ha
t p
erc
en
tag
e o
f w
ard
sta
ff
tim
e i
s sp
en
t in
dir
ect
ca
re?
Me
asu
rem
en
t
Do
yo
u c
oll
ect
da
ta o
n w
ha
t in
terv
en
tio
ns
take
pla
ce
du
rin
g a
dm
issi
on
an
d if
so
, do
yo
u a
na
lysi
s th
is b
y a
ge
,
eth
nic
ity
etc
to
ide
nti
fy if
th
ere
are
an
y e
qu
alit
y is
sue
s?
Me
asu
rem
en
t

43
SECTION TWO
Delivering the Readmissions HEAT Target
DA
TA
AN
ALY
SIS
CH
EC
KL
IST
Issu
es
Ye
sY
es
– b
ut
ne
ed
s
refi
nin
g
No
Pri
ori
ty f
or
Lo
cal
Act
ion
?
If p
rio
rity
fo
r
act
ion
– w
ho
wil
l
take
fo
rwa
rd a
nd
by
wh
en
Imp
rove
me
nt
Too
ls R
ele
van
t
Dis
cha
rge
Ha
ve y
ou
lo
oke
d a
t d
ail
y d
isch
arg
e r
ate
s u
sin
g S
PC
cha
rts
to u
nd
ers
tan
d t
he
in
he
ren
t va
ria
tio
n i
n t
he
syst
em
an
d i
de
nti
fy a
ny
sp
eci
al
cau
se v
ari
ati
on
?
Me
asu
rem
en
t
SP
C
Ha
ve y
ou
lo
oke
d a
t d
ela
ye
d d
isch
arg
es
an
d r
ea
son
s
wh
y?
Me
asu
rem
en
t
Ha
ve y
ou
au
dit
ed
th
e q
ua
lity
of
care
pla
ns
on
dis
cha
rge
?
Au
dit
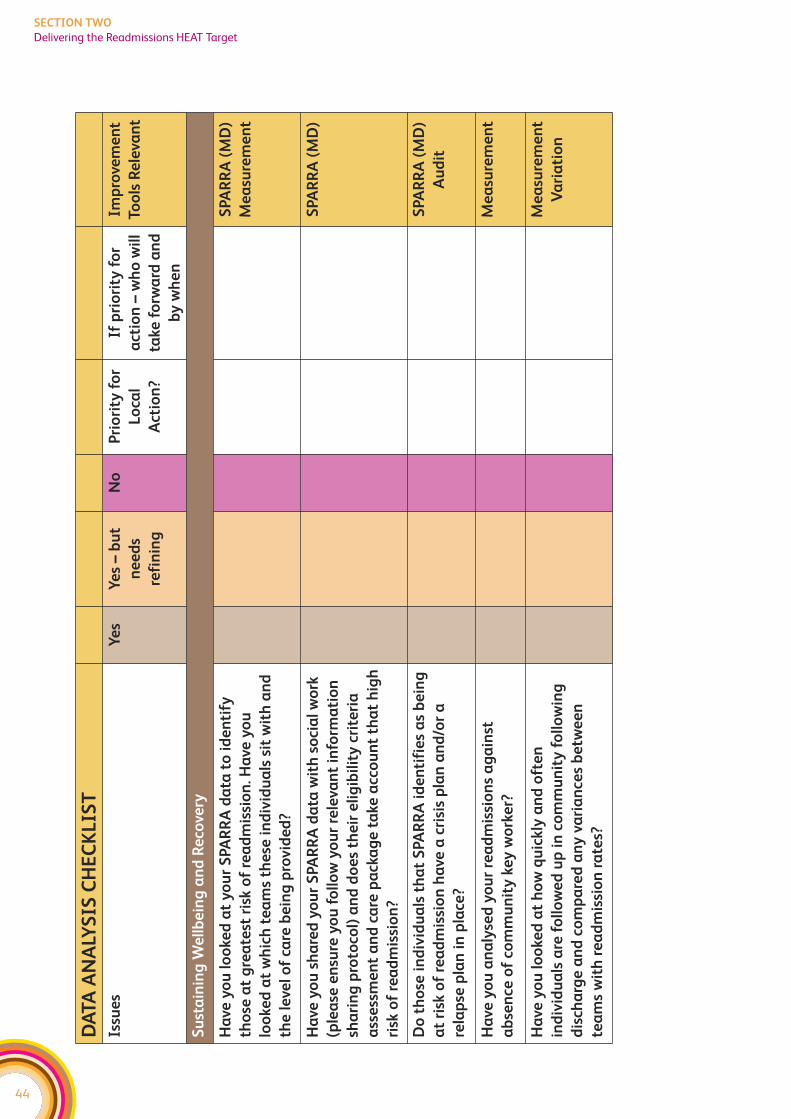
44
SECTION TWO
Delivering the Readmissions HEAT Target
DA
TA
AN
ALY
SIS
CH
EC
KL
IST
Issu
es
Ye
sY
es
– b
ut
ne
ed
s
refi
nin
g
No
Pri
ori
ty f
or
Lo
cal
Act
ion
?
If p
rio
rity
fo
r
act
ion
– w
ho
wil
l
take
fo
rwa
rd a
nd
by
wh
en
Imp
rove
me
nt
Too
ls R
ele
van
t
Su
sta
inin
g W
ell
be
ing
an
d R
eco
very
Ha
ve y
ou
lo
oke
d a
t y
ou
r S
PA
RR
A d
ata
to
id
en
tify
tho
se a
t g
rea
test
ris
k o
f re
ad
mis
sio
n. H
ave
yo
u
loo
ked
at
wh
ich
te
am
s th
ese
in
div
idu
als
sit
wit
h a
nd
the
le
vel
of
care
be
ing
pro
vid
ed
?
SPA
RR
A (
MD
)
Me
asu
rem
en
t
Ha
ve y
ou
sh
are
d y
ou
r S
PA
RR
A d
ata
wit
h s
oci
al
wo
rk
(ple
ase
en
sure
yo
u f
oll
ow
yo
ur
rele
van
t in
form
ati
on
sha
rin
g p
roto
col)
an
d d
oe
s th
eir
eli
gib
ilit
y c
rite
ria
ass
ess
me
nt
an
d c
are
pa
cka
ge
ta
ke a
cco
un
t th
at
hig
h
risk
of
rea
dm
issi
on
?
SPA
RR
A (
MD
)
Do
th
ose
in
div
idu
als
th
at
SPA
RR
A i
de
nti
fie
s a
s b
ein
g
at
risk
of
rea
dm
issi
on
ha
ve a
cri
sis
pla
n a
nd
/or
a
rela
pse
pla
n i
n p
lace
?
SPA
RR
A (
MD
)
Au
dit
Ha
ve y
ou
an
aly
sed
yo
ur
rea
dm
issi
on
s a
ga
inst
ab
sen
ce o
f co
mm
un
ity
ke
y w
ork
er?
Me
asu
rem
en
t
Ha
ve y
ou
lo
oke
d a
t h
ow
qu
ickly
an
d o
fte
n
ind
ivid
ua
ls a
re f
oll
ow
ed
up
in
co
mm
un
ity
fo
llo
win
g
dis
cha
rge
an
d c
om
pa
red
an
y v
ari
an
ces
be
twe
en
tea
ms
wit
h r
ea
dm
issi
on
ra
tes?
Me
asu
rem
en
t
Va
ria
tio
n
45
SECTION TWO
Delivering the Readmissions HEAT Target
PROCESS ANALYSIS
Process Mapping is key for understanding what currently happens and where things
break down. It helps to identify what needs to change. Involving service users and carers
in the analysis helps you to understand how it feels to be on the receiving end of our
processes. Understanding care processes from the service user’s perspective is essential
for making service user focused improvements.
All the organisations/teams involved in the care process should be identified and
involved in the process mapping activity. This process mapping work should already be
taking place in all Boards as part of the work to develop a Generic ICP (See ICP Process
Standard 3). The mapping work should include service user and carers perspectives, in
line with the ICP standards (See ICP Process Standard 2). In addition to the process
mapping exercise – it might also help to undertake discovery interviews, feedback
questionnaires, and data sampling in order to fully understand the service user and
carers experience.
The Mental Health Collaborative team can help facilitate this process mapping exercise
and suggest approaches to other diagnostic work if you’re not sure. Please contact your
Regional Manager to discuss further.
But the work doesn’t stop at process mapping – you now need to look at streamlining
the care process and look at the flow through it. Using value-stream mapping, you can
identify:
f those steps in the process that don’t add any value
f bottlenecks in the process where capacity is not sufficient to meet the demand
f unnecessary delays (long waits)
f steps where there are quality issues – ie work has to be redone or sent back to a previous
step or where there is confusion over who is responsible for which aspects of care.
A further question to ask is whether there’s a group/individual that is responsible for
ensuring that the different teams/people involved in delivering care all work together
effectively.
A range of tools within Lean are available to help analyse the care process, and facilitation
support is available from the Collaborative Team. Please also see the Improvement Tools
section of this Toolkit for further information on tools. The output of this ‘overview’
investigative work should be clarity on the key issues you need to address locally to simplify
and improve the care process. The Collaborative promotes then using the PDSA approach
to make incremental improvements to the process. It encourages all services to start
using the PDSA approach as quickly as possible – so you can start to see practical small
scale improvements.
The following table helps you to think about applying process mapping to the Readmissions
workstream. This is not an exhaustive list, it is simply provided as a starting point to help
MHC teams think about how improvement tools apply to this work.
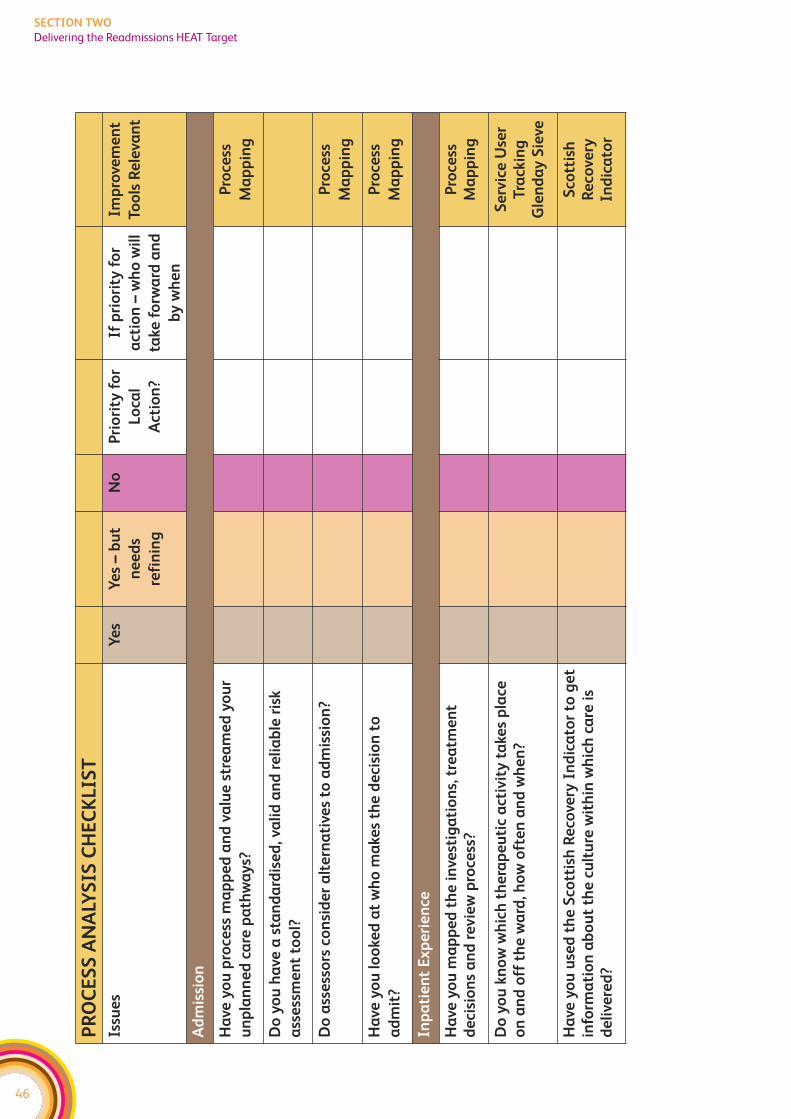
46
SECTION TWO
Delivering the Readmissions HEAT Target
PR
OC
ES
S A
NA
LYS
IS C
HE
CK
LIS
T
Issu
es
Ye
sY
es
– b
ut
ne
ed
s
refi
nin
g
No
Pri
ori
ty f
or
Lo
cal
Act
ion
?
If p
rio
rity
fo
r
act
ion
– w
ho
wil
l
take
fo
rwa
rd a
nd
by
wh
en
Imp
rove
me
nt
Too
ls R
ele
van
t
Ad
mis
sio
n
Ha
ve y
ou
pro
cess
ma
pp
ed
an
d v
alu
e s
tre
am
ed
yo
ur
un
pla
nn
ed
ca
re p
ath
wa
ys?
Pro
cess
Ma
pp
ing
Do
yo
u h
ave
a s
tan
da
rdis
ed
, va
lid
an
d r
eli
ab
le r
isk
ass
ess
me
nt
too
l?
Do
ass
ess
ors
co
nsi
de
r a
lte
rna
tive
s to
ad
mis
sio
n?
Pro
cess
Ma
pp
ing
Ha
ve y
ou
lo
oke
d a
t w
ho
ma
kes
the
de
cisi
on
to
ad
mit
?
Pro
cess
Ma
pp
ing
Inp
ati
en
t E
xp
eri
en
ce
Ha
ve y
ou
ma
pp
ed
th
e i
nve
stig
ati
on
s, t
rea
tme
nt
de
cisi
on
s a
nd
re
vie
w p
roce
ss?
Pro
cess
Ma
pp
ing
Do
yo
u k
no
w w
hic
h t
he
rap
eu
tic
act
ivit
y t
ake
s p
lace
on
an
d o
ff t
he
wa
rd, h
ow
oft
en
an
d w
he
n?
Se
rvic
e U
ser
Tra
ckin
gG
len
da
y S
ieve
Ha
ve y
ou
use
d t
he
Sco
ttis
h R
eco
very
In
dic
ato
r to
ge
tin
form
ati
on
ab
ou
t th
e c
ult
ure
wit
hin
wh
ich
ca
re i
sd
eli
vere
d?
Sco
ttis
hR
eco
very
Ind
ica
tor
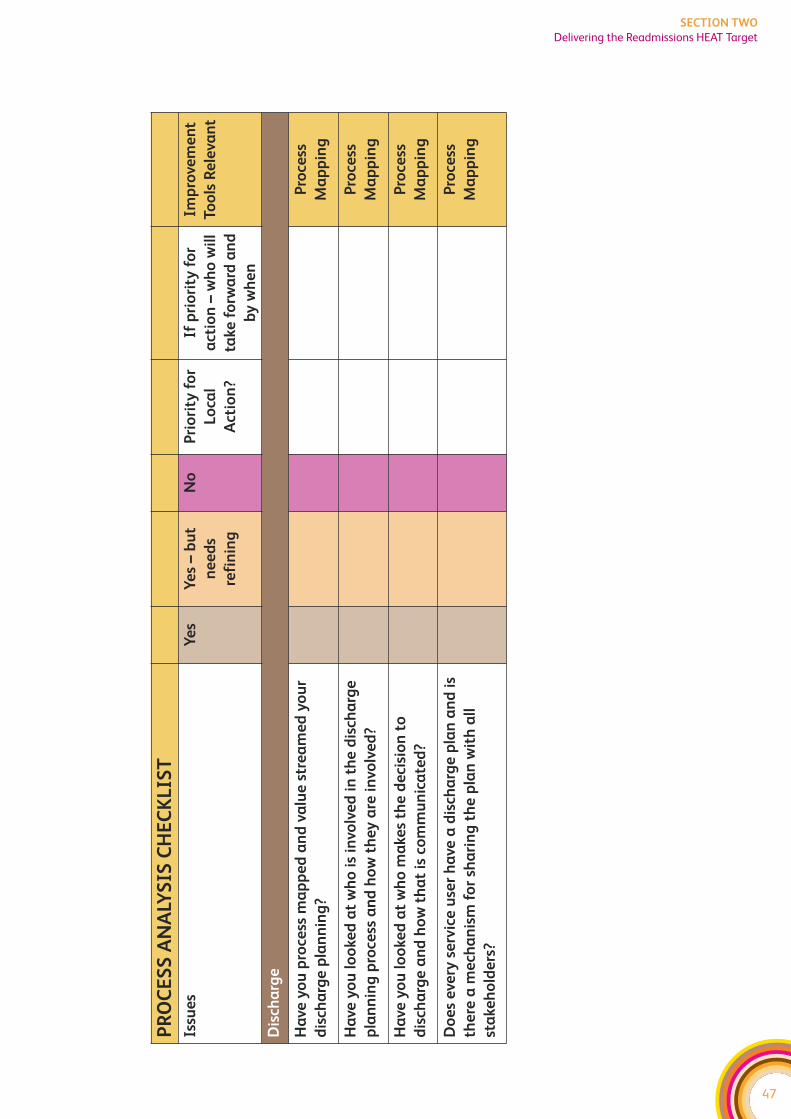
47
SECTION TWO
Delivering the Readmissions HEAT Target
PR
OC
ES
S A
NA
LYS
IS C
HE
CK
LIS
T
Issu
es
Ye
sY
es
– b
ut
ne
ed
s
refi
nin
g
No
Pri
ori
ty f
or
Lo
cal
Act
ion
?
If p
rio
rity
fo
r
act
ion
– w
ho
wil
l
take
fo
rwa
rd a
nd
by
wh
en
Imp
rove
me
nt
Too
ls R
ele
van
t
Dis
cha
rge
Ha
ve y
ou
pro
cess
ma
pp
ed
an
d v
alu
e s
tre
am
ed
yo
ur
dis
cha
rge
pla
nn
ing
?
Pro
cess
Ma
pp
ing
Ha
ve y
ou
lo
oke
d a
t w
ho
is
invo
lve
d i
n t
he
dis
cha
rge
pla
nn
ing
pro
cess
an
d h
ow
th
ey
are
in
volv
ed
?
Pro
cess
Ma
pp
ing
Ha
ve y
ou
lo
oke
d a
t w
ho
ma
kes
the
de
cisi
on
to
dis
cha
rge
an
d h
ow
th
at
is c
om
mu
nic
ate
d?
Pro
cess
Ma
pp
ing
Do
es
eve
ry s
erv
ice
use
r h
ave
a d
isch
arg
e p
lan
an
d i
s
the
re a
me
cha
nis
m f
or
sha
rin
g t
he
pla
n w
ith
all
sta
keh
old
ers
?
Pro
cess
Ma
pp
ing
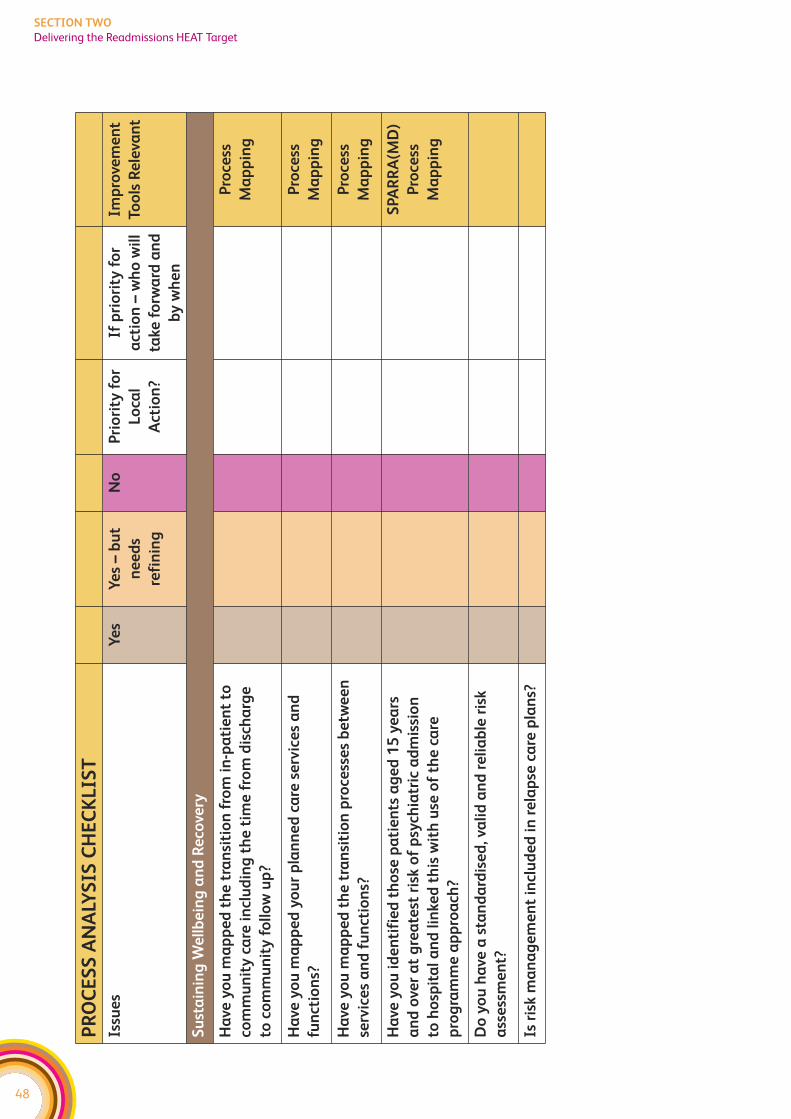
48
SECTION TWO
Delivering the Readmissions HEAT Target
PR
OC
ES
S A
NA
LYS
IS C
HE
CK
LIS
T
Issu
es
Ye
sY
es
– b
ut
ne
ed
s
refi
nin
g
No
Pri
ori
ty f
or
Lo
cal
Act
ion
?
If p
rio
rity
fo
r
act
ion
– w
ho
wil
l
take
fo
rwa
rd a
nd
by
wh
en
Imp
rove
me
nt
Too
ls R
ele
van
t
Su
sta
inin
g W
ell
be
ing
an
d R
eco
very
Ha
ve y
ou
ma
pp
ed
th
e t
ran
siti
on
fro
m i
n-p
ati
en
t to
com
mu
nit
y c
are
in
clu
din
g t
he
tim
e f
rom
dis
cha
rge
to c
om
mu
nit
y f
oll
ow
up
?
Pro
cess
Ma
pp
ing
Ha
ve y
ou
ma
pp
ed
yo
ur
pla
nn
ed
ca
re s
erv
ice
s a
nd
fun
ctio
ns?
Pro
cess
Ma
pp
ing
Ha
ve y
ou
ma
pp
ed
th
e t
ran
siti
on
pro
cess
es
be
twe
en
serv
ice
s a
nd
fu
nct
ion
s?
Pro
cess
Ma
pp
ing
Ha
ve y
ou
id
en
tifi
ed
th
ose
pa
tie
nts
ag
ed
15
ye
ars
an
d o
ver
at
gre
ate
st r
isk o
f p
sych
iatr
ic a
dm
issi
on
to h
osp
ita
l a
nd
lin
ked
th
is w
ith
use
of
the
ca
re
pro
gra
mm
e a
pp
roa
ch?
SPA
RR
A(M
D)
Pro
cess
Ma
pp
ing
Do
yo
u h
ave
a s
tan
da
rdis
ed
, va
lid
an
d r
eli
ab
le r
isk
ass
ess
me
nt?
Is r
isk m
an
ag
em
en
t in
clu
de
d i
n r
ela
pse
ca
re p
lan
s?
49
SECTION TWO
Delivering the Readmissions HEAT Target
UNDERSTANDING DEMAND AND CAPACITY
Understanding the demand for your service is essential, as without this you cannot
effectively plan to meet that demand. However, you also need to understand the capacity
that you have to respond to that demand and whether you are making best use of this.
For instance, if you have a highly skilled member of staff spending a day booking care
plan reviews, this is not making effective use of your current capacity. An audit across
one community mental health area showed that differences in waiting lists between
teams were five times more to do with what they did with each case (ie differences in
number of sessions and duration) than the number of referrals the teams received.
Matching demand and capacity is important because delays in receiving a timely response
can leave people in distress with no support. Further, delays can lead to an escalation of
someone’s illness which may result in an admission. For inpatients, a difference between
capacity and demand can lead to individuals being ‘boarded’ out in other wards. This
can impact on the quality of care received and results in unnecessary moves for the
individual patient. In some circumstances, it can also make it a lot harder for relatives to
remain in contact (if individuals are boarded out at a distance).
The presence of a waiting list or ‘boarding out’, is a sign that demand is not being matched
with capacity, it is not necessarily an indication that the demand exceeds the capacity
(please see improvement tools section of toolkit for more information on this). It is
therefore important to gather information on demand, activity, and capacity and to
analyse this in greater detail to understand profiles, trends and variances. There are a range
of tools that can be used to analyse data in a format that identifies trends over time.
The Mental Health Collaborative is working on a demand and capacity analysis tool for
community mental health teams. Please liaise with your regional manager for more
information on this tool which is currently in its testing phase.
The following table helps you to think about areas you could apply demand and capacity
analysis in relation to the Readmissions Workstream. Again, it is not an exhaustive list, it
is just provided as a starting point to help MHC teams to think about how demand and
capacity work applies to the Readmissions work.
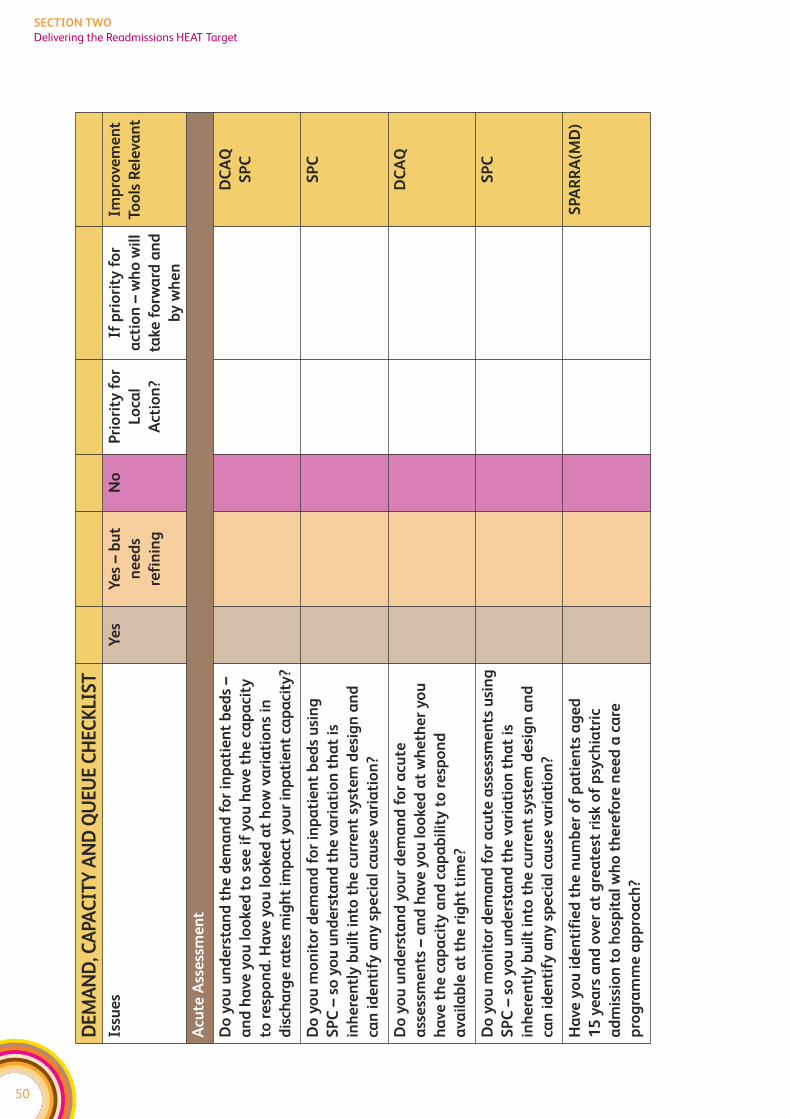
50
SECTION TWO
Delivering the Readmissions HEAT Target
DE
MA
ND
, CA
PAC
ITY
AN
D Q
UE
UE
CH
EC
KLI
ST
Issu
es
Ye
sY
es
– b
ut
ne
ed
s
refi
nin
g
No
Pri
ori
ty f
or
Lo
cal
Act
ion
?
If p
rio
rity
fo
r
act
ion
– w
ho
wil
l
take
fo
rwa
rd a
nd
by
wh
en
Imp
rove
me
nt
Too
ls R
ele
van
t
Acu
te A
sse
ssm
en
t
Do
yo
u u
nd
ers
tan
d t
he
de
ma
nd
fo
r in
pa
tie
nt
be
ds
–
an
d h
ave
yo
u l
oo
ked
to
se
e i
f y
ou
ha
ve t
he
ca
pa
city
to r
esp
on
d. H
ave
yo
u l
oo
ked
at
ho
w v
ari
ati
on
s in
dis
cha
rge
ra
tes
mig
ht
imp
act
yo
ur
inp
ati
en
t ca
pa
city
?
DC
AQ
SP
C
Do
yo
u m
on
ito
r d
em
an
d f
or
inp
ati
en
t b
ed
s u
sin
g
SP
C –
so
yo
u u
nd
ers
tan
d t
he
va
ria
tio
n t
ha
t is
inh
ere
ntl
y b
uil
t in
to t
he
cu
rre
nt
syst
em
de
sig
n a
nd
can
id
en
tify
an
y s
pe
cia
l ca
use
va
ria
tio
n?
SP
C
Do
yo
u u
nd
ers
tan
d y
ou
r d
em
an
d f
or
acu
te
ass
ess
me
nts
– a
nd
ha
ve y
ou
lo
oke
d a
t w
he
the
r y
ou
ha
ve t
he
ca
pa
city
an
d c
ap
ab
ilit
y t
o r
esp
on
d
ava
ila
ble
at
the
rig
ht
tim
e?
DC
AQ
Do
yo
u m
on
ito
r d
em
an
d f
or
acu
te a
sse
ssm
en
ts u
sin
g
SP
C –
so
yo
u u
nd
ers
tan
d t
he
va
ria
tio
n t
ha
t is
inh
ere
ntl
y b
uil
t in
to t
he
cu
rre
nt
syst
em
de
sig
n a
nd
can
id
en
tify
an
y s
pe
cia
l ca
use
va
ria
tio
n?
SP
C
Ha
ve y
ou
id
en
tifi
ed
th
e n
um
be
r o
f p
ati
en
ts a
ge
d
15
ye
ars
an
d o
ver
at
gre
ate
st r
isk o
f p
sych
iatr
ic
ad
mis
sio
n t
o h
osp
ita
l w
ho
th
ere
fore
ne
ed
a c
are
pro
gra
mm
e a
pp
roa
ch?
SPA
RR
A(M
D)
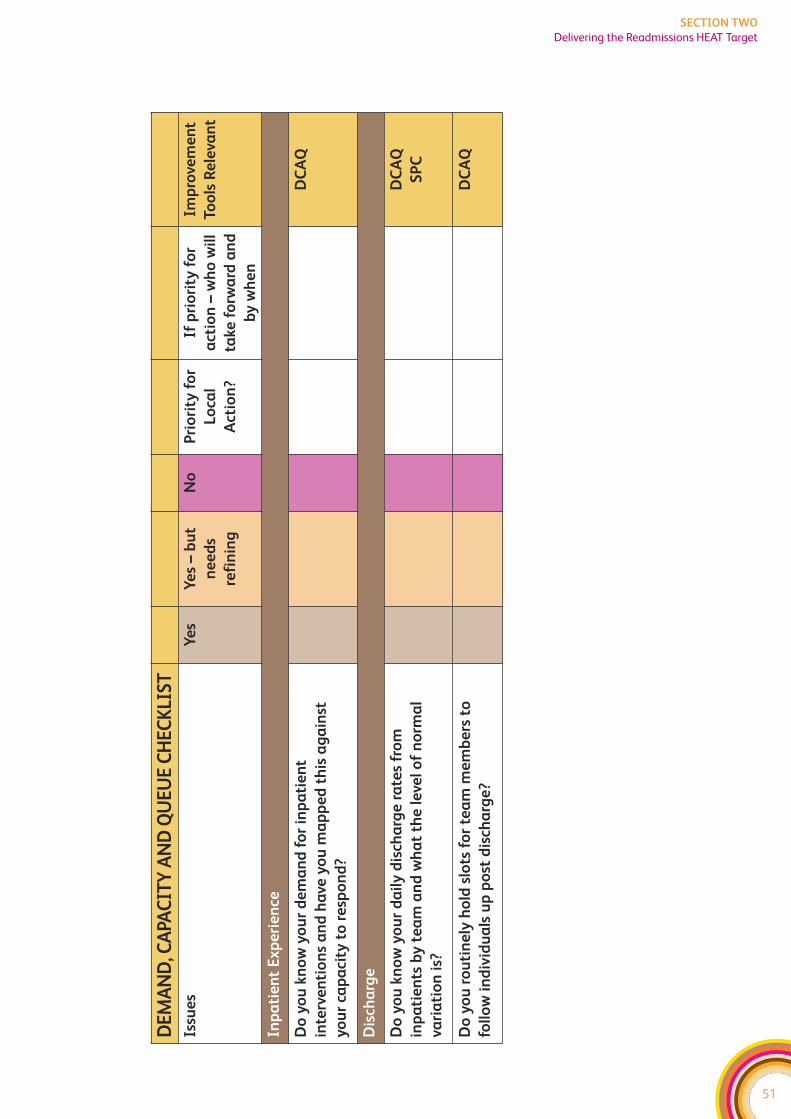
51
SECTION TWO
Delivering the Readmissions HEAT Target
DE
MA
ND
, CA
PAC
ITY
AN
D Q
UE
UE
CH
EC
KLI
ST
Issu
es
Ye
sY
es
– b
ut
ne
ed
s
refi
nin
g
No
Pri
ori
ty f
or
Lo
cal
Act
ion
?
If p
rio
rity
fo
r
act
ion
– w
ho
wil
l
take
fo
rwa
rd a
nd
by
wh
en
Imp
rove
me
nt
Too
ls R
ele
van
t
Inp
ati
en
t E
xp
eri
en
ce
Do
yo
u k
no
w y
ou
r d
em
an
d f
or
inp
ati
en
t
inte
rve
nti
on
s a
nd
ha
ve y
ou
ma
pp
ed
th
is a
ga
inst
yo
ur
cap
aci
ty t
o r
esp
on
d?
DC
AQ
Dis
cha
rge
Do
yo
u k
no
w y
ou
r d
ail
y d
isch
arg
e r
ate
s fr
om
inp
ati
en
ts b
y t
ea
m a
nd
wh
at
the
le
vel
of
no
rma
l
vari
ati
on
is?
DC
AQ
SP
C
Do
yo
u r
ou
tin
ely
ho
ld s
lots
fo
r te
am
me
mb
ers
to
foll
ow
in
div
idu
als
up
po
st d
isch
arg
e?
DC
AQ
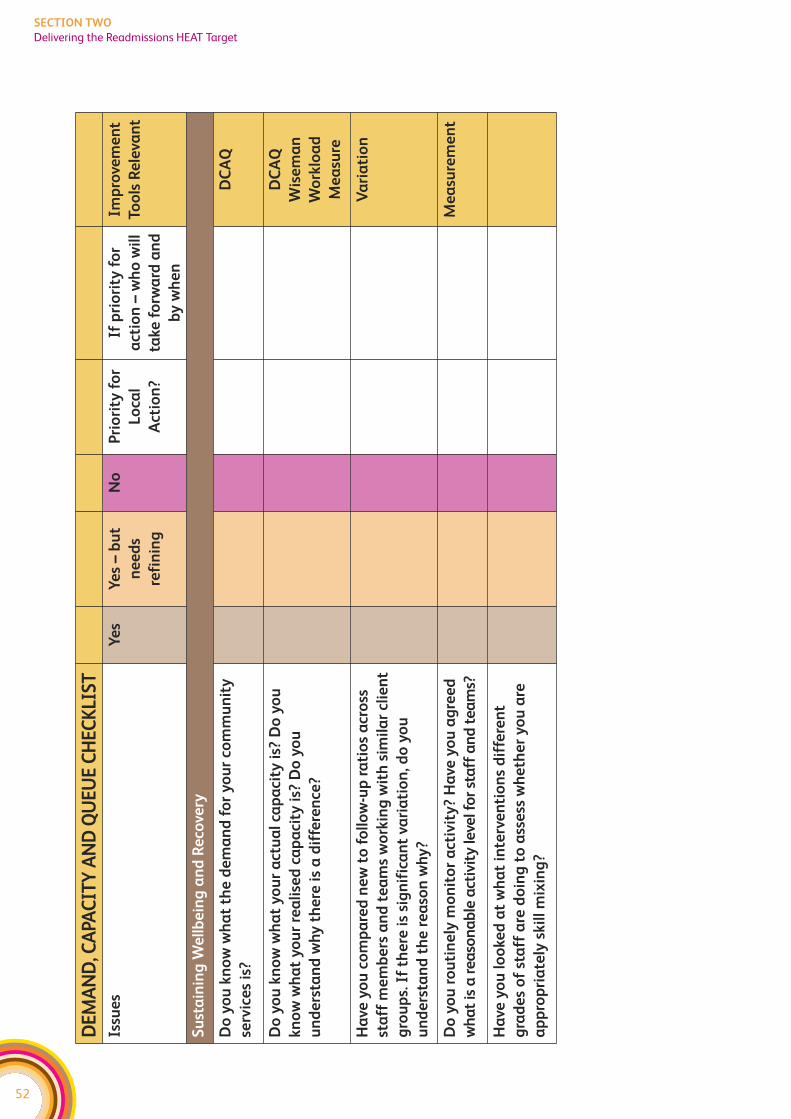
52
SECTION TWO
Delivering the Readmissions HEAT Target
DE
MA
ND
, CA
PAC
ITY
AN
D Q
UE
UE
CH
EC
KLI
ST
Issu
es
Ye
sY
es
– b
ut
ne
ed
s
refi
nin
g
No
Pri
ori
ty f
or
Lo
cal
Act
ion
?
If p
rio
rity
fo
r
act
ion
– w
ho
wil
l
take
fo
rwa
rd a
nd
by
wh
en
Imp
rove
me
nt
Too
ls R
ele
van
t
Su
sta
inin
g W
ell
be
ing
an
d R
eco
very
Do
yo
u k
no
w w
ha
t th
e d
em
an
d f
or
yo
ur
com
mu
nit
y
serv
ice
s is
?
DC
AQ
Do
yo
u k
no
w w
ha
t y
ou
r a
ctu
al
cap
aci
ty i
s? D
o y
ou
kn
ow
wh
at
yo
ur
rea
lise
d c
ap
aci
ty i
s? D
o y
ou
un
de
rsta
nd
wh
y t
he
re i
s a
dif
fere
nce
?
DC
AQ
Wis
em
an
Wo
rklo
ad
Me
asu
re
Ha
ve y
ou
co
mp
are
d n
ew
to
fo
llo
w-u
p r
ati
os
acr
oss
sta
ff m
em
be
rs a
nd
te
am
s w
ork
ing
wit
h s
imil
ar
clie
nt
gro
up
s. I
f th
ere
is
sig
nif
ica
nt
vari
ati
on
, do
yo
u
un
de
rsta
nd
th
e r
ea
son
wh
y?
Va
ria
tio
n
Do
yo
u r
ou
tin
ely
mo
nit
or
act
ivit
y?
Ha
ve y
ou
ag
ree
d
wh
at
is a
re
aso
na
ble
act
ivit
y le
vel f
or
sta
ff a
nd
te
am
s?
Me
asu
rem
en
t
Ha
ve y
ou
lo
oke
d a
t w
ha
t in
terv
en
tio
ns
dif
fere
nt
gra
de
s o
f st
aff
are
do
ing
to
ass
ess
wh
eth
er
yo
u a
re
ap
pro
pri
ate
ly s
kil
l m
ixin
g?
53
SECTION TWO
Delivering the Readmissions HEAT Target
DELIVERING THE DEPRESSION HEAT TARGET
HEAT target
To reduce the annual rate of increase of defined daily dose per capita of
antidepressants to zero by 2009/10, and put in place the required support
framework to achieve a 10 per cent reduction in future years;
The HEAT target for depression aims to improve the treatment of depression, particularly
within Primary Care. It is therefore vital that Primary Care is actively engaged in
this work. Improvements can be categorised under three main headings:
1. Improving the quality and effectiveness of care interventions – this relates to
ensuring that the relevant standards for Integrated Care Pathways and any other
nationally approved guidance (ie SIGN, Crisis Standards, NICE) is routinely followed.
However, this is not just about improving the clinical standards of care – it is about
the range of care interventions including those delivered by the local authority and
voluntary sector services. Changes here should lead to improved outcomes.
2. Improving the design of the care delivery processes – this is about ensuring a
well designed process that eliminates duplication and unnecessary steps, minimises
the potential for mistakes, and delivers the right amount of treatment capacity to
see the work without unnecessary waits. Again, this needs to take a whole systems
perspective working across the traditional health and social care boundaries.
Changes here should result in an improved experience of using care services.
3. Ensuring staff are properly equipped to deliver services – this recognises the
importance of applying knowledge and skills within a values based and recovery
oriented framework. All improvement work is underpinned by continuous professional
development and workforce planning. There may be a need to extend roles, to
develop new roles and to review the skill mix within teams. Further, staff must be
treated with the same respect and care that we expect them to provide for patients.
Changes here should contribute to both improved outcomes and improved
experiences for those using services.
The following diagram highlights the key issues that Boards (and their partners) will
need to focus on to improve the treatment of depression and hence support delivery of
the HEAT target. As part of the plan to deliver the Depression HEAT target, Boards will
also need to take action on the preventative agenda in line with the forthcoming
‘Towards a Mentally Flourishing Scotland’.
f Standards already exist with regards to improving the quality of clinical services
provided (ICP Guidance, draft SIGN non pharmacological treatment of mild to
moderate depression, and NICE guidelines). At a local level, collaborative resources
can be used to focus on implementing those clinical standards that are relevant to
the delivery of the HEAT target. The following diagram shows how ICP Standards and
SIGN guidelines relate to this work stream. Further work will be completed to map
other relevant national guidance against the key issues.
f To improve the design of care delivery processes – the first step is for each Board
to understand what their key system and process design issues are, and this document
provides advice on how to do this. Over the life of the collaborative we will collate and
share information across Boards to identify where there are common system and
process design issues across Boards and what works in terms of redesigning those
systems and processes
f The diagram also highlights the links between the Collaborative work and the NES
Psychological Therapies Programme. Further, over the next 2 years, the Collaborative
will highlight any relevant workforce issues that need a national response in relation
to the commissioning of training or support to develop new roles.
54
SECTION TWO
Delivering the Depression HEAT Target
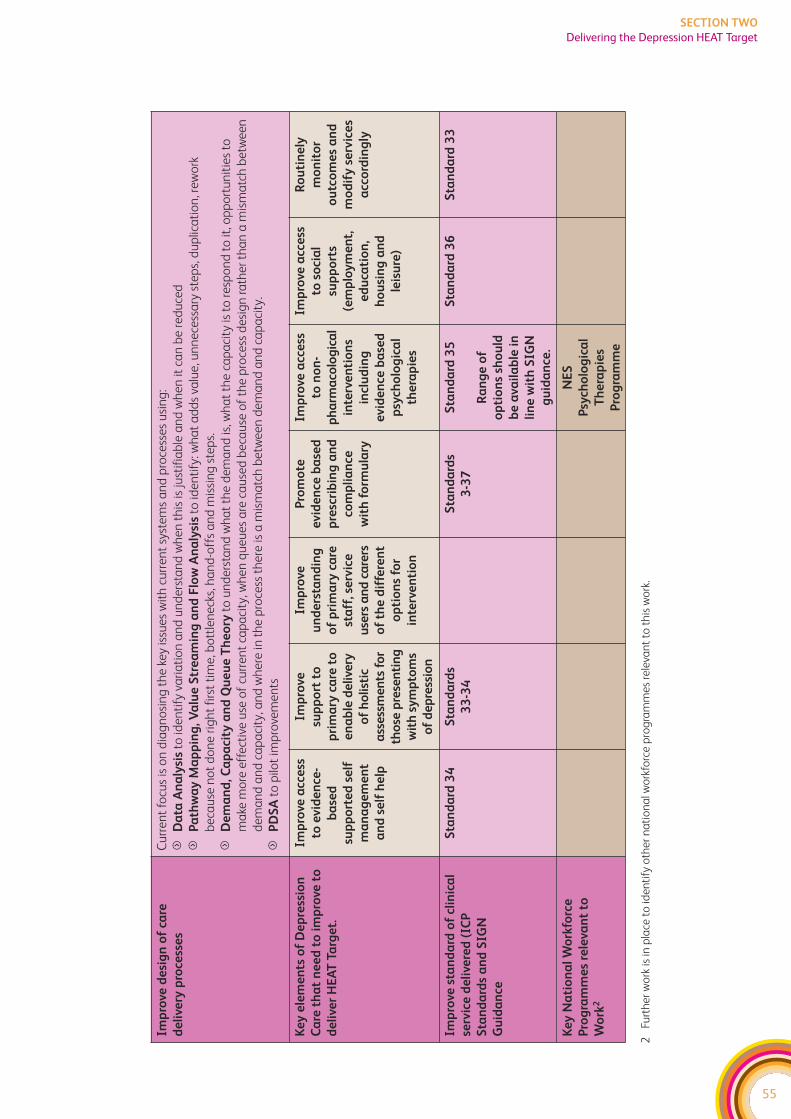
55
SECTION TWO
Delivering the Depression HEAT Target
Imp
rove
de
sig
n o
f ca
re
de
live
ry p
roce
sse
s
Cu
rre
nt
focu
s is
on
dia
gn
osi
ng
th
e k
ey is
sue
s w
ith
cu
rre
nt
syst
em
s a
nd
pro
cess
es
usi
ng
:
fD
ata
An
aly
sis
to id
en
tify
va
ria
tio
n a
nd
un
de
rsta
nd
wh
en
th
is is
just
ifia
ble
an
d w
he
n it
ca
n b
e r
ed
uce
d
fP
ath
wa
y M
ap
pin
g, V
alu
e S
tre
am
ing
an
d F
low
An
aly
sis
to id
en
tify
: wh
at
ad
ds
valu
e, u
nn
ece
ssa
ry s
tep
s, d
up
lica
tio
n, r
ew
ork
be
cau
se n
ot
do
ne
rig
ht
firs
t ti
me
, bo
ttle
ne
cks,
ha
nd
-off
s a
nd
mis
sin
g s
tep
s.
fD
em
an
d, C
ap
aci
ty a
nd
Qu
eu
e T
he
ory
to u
nd
ers
tan
d w
ha
t th
e d
em
an
d is
, wh
at
the
ca
pa
city
is t
o r
esp
on
d t
o it
, op
po
rtu
nit
ies
to
ma
ke m
ore
eff
ect
ive
use
of
curr
en
t ca
pa
city
, wh
en
qu
eu
es
are
ca
use
d b
eca
use
of
the
pro
cess
de
sig
n r
ath
er
tha
n a
mis
ma
tch
be
twe
en
de
ma
nd
an
d c
ap
aci
ty, a
nd
wh
ere
in t
he
pro
cess
th
ere
is a
mis
ma
tch
be
twe
en
de
ma
nd
an
d c
ap
aci
ty.
fP
DS
Ato
pilo
t im
pro
vem
en
ts
Ke
y e
lem
en
ts o
f D
ep
ress
ion
Ca
re t
ha
t n
ee
d t
o i
mp
rove
to
de
live
r H
EA
T T
arg
et.
Imp
rove
acc
ess
to e
vid
en
ce-
ba
sed
sup
po
rte
d s
elf
ma
na
ge
me
nt
an
d s
elf
he
lp
Imp
rove
sup
po
rt t
o
pri
ma
ry c
are
to
en
ab
led
eli
very
of
ho
list
ic
ass
ess
me
nts
fo
r
tho
se p
rese
nti
ng
wit
h s
ym
pto
ms
of
de
pre
ssio
n
Imp
rove
un
de
rsta
nd
ing
of
pri
ma
ry c
are
sta
ff, s
erv
ice
use
rs a
nd
ca
rers
of
the
dif
fere
nt
op
tio
ns
for
inte
rve
nti
on
Pro
mo
te
evid
en
ce b
ase
d
pre
scri
bin
g a
nd
com
pli
an
ce
wit
h f
orm
ula
ry
Imp
rove
acc
ess
to n
on
-
ph
arm
aco
log
ica
l
inte
rve
nti
on
s
incl
ud
ing
evid
en
ce b
ase
d
psy
cho
log
ica
l
the
rap
ies
Imp
rove
acc
ess
to s
oci
al
sup
po
rts
(em
plo
ym
en
t,
ed
uca
tio
n,
ho
usi
ng
an
d
leis
ure
)
Ro
uti
ne
ly
mo
nit
or
ou
tco
me
s a
nd
mo
dif
y s
erv
ice
s
acc
ord
ing
ly
Imp
rove
sta
nd
ard
of
clin
ica
l
serv
ice
de
live
red
(IC
P
Sta
nd
ard
s a
nd
SIG
N
Gu
ida
nce
Sta
nd
ard
34
S
tan
da
rds
33
-34
Sta
nd
ard
s
3-3
7
Sta
nd
ard
35
Ra
ng
e o
f
op
tio
ns
sho
uld
be
ava
ila
ble
in
lin
e w
ith
SIG
N
gu
ida
nce
.
Sta
nd
ard
36
S
tan
da
rd 3
3
Ke
y N
ati
on
al
Wo
rkfo
rce
Pro
gra
mm
es
rele
van
t to
Wo
rk2
NE
S
Psy
cho
log
ica
l
Th
era
pie
s
Pro
gra
mm
e
2Fu
rth
er
wo
rk is
in p
lace
to
ide
nti
fy o
the
r n
ati
on
al w
ork
forc
e p
rog
ram
me
s re
leva
nt
to t
his
wo
rk.

56
SECTION TWO
Delivering the Depression HEAT Target
DEPRESSION PATHWAY – SYSTEMS DIAGNOSIS CHECKLIST
This document is aimed at those involved in leading and planning the Mental Health
Collaborative (MHC) work. It is provided as a supportive tool to help those involved
in leading and planning the work of the MHC locally to think about how to apply
improvement methods to enable the delivery of the Depression HEAT target and
associated improvements. It is designed to be used as part of the Mental Health
Collaborative Toolkit which includes sections on the different improvement methods
mentioned and an overview of the Collaborative approach.
It works on the basis that the first 3-6 months should be on visioning and diagnosing
the issues with the current system. Visioning involves defining and describing the ideal
systems, processes and pathways of care to fulfil and exceed the HEAT targets. These
‘ideals’ will be firmly rooted in the best evidence available and complemented by
experiential input and insights from service users, carers and staff. Diagnosing the
system involves comparing current service behaviour with the ideal to establish where
changes need to be made and what these changes might look like in order to achieve
the ideal. It also involves understanding your current processes, what works well and
what doesn’t work so well.
We realise that many Boards (and key partners), have already made significant progress
against this target and we are not suggesting that any work is put on hold that is already
in progress. However, the suggestions below may give you some ideas about how to
progress this work further.
57
SECTION TWO
Delivering the Depression HEAT Target

58
SECTION TWO
Delivering the Depression HEAT Target
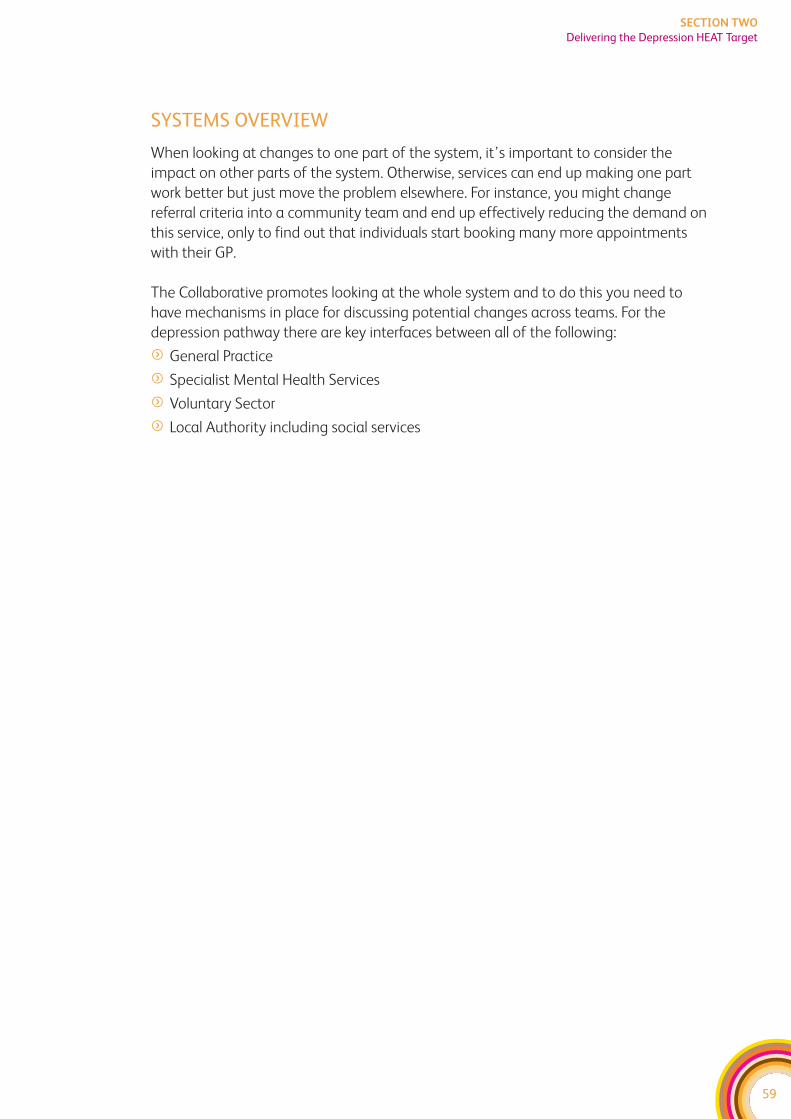
59
SECTION TWO
Delivering the Depression HEAT Target
SYSTEMS OVERVIEW
When looking at changes to one part of the system, it’s important to consider the
impact on other parts of the system. Otherwise, services can end up making one part
work better but just move the problem elsewhere. For instance, you might change
referral criteria into a community team and end up effectively reducing the demand on
this service, only to find out that individuals start booking many more appointments
with their GP.
The Collaborative promotes looking at the whole system and to do this you need to
have mechanisms in place for discussing potential changes across teams. For the
depression pathway there are key interfaces between all of the following:
f General Practice
f Specialist Mental Health Services
f Voluntary Sector
f Local Authority including social services
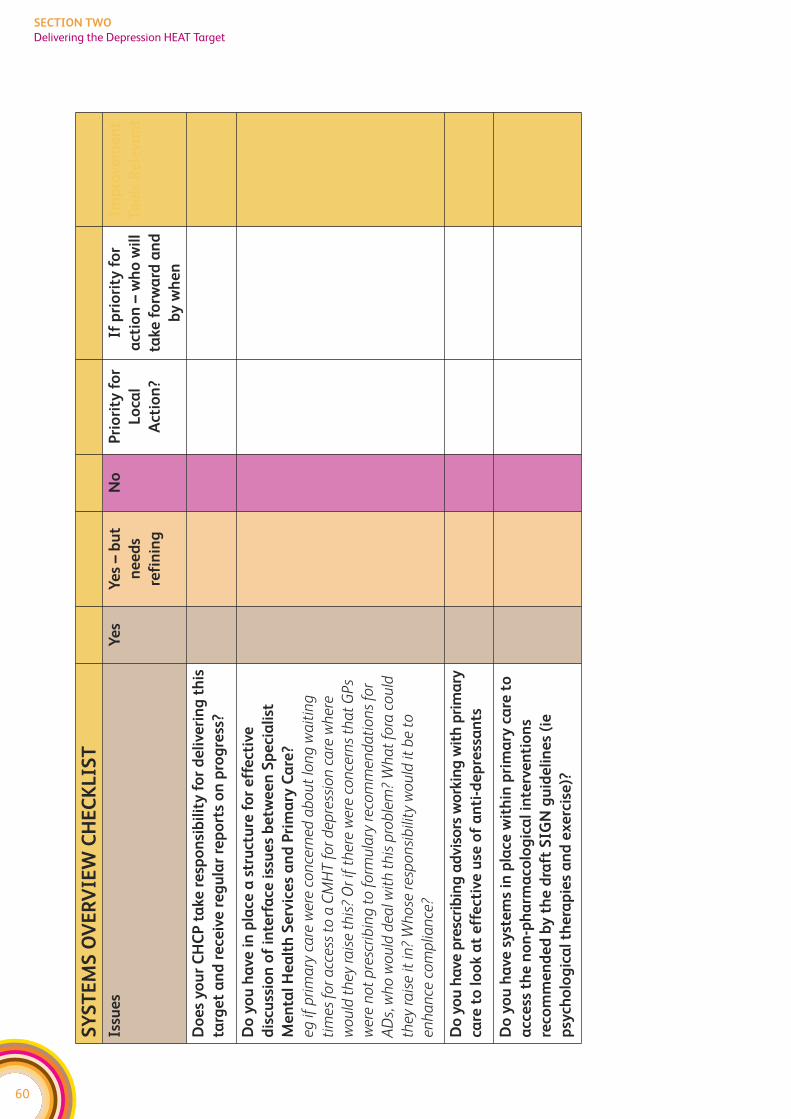
60
SECTION TWO
Delivering the Depression HEAT Target
SY
ST
EM
S O
VE
RV
IEW
CH
EC
KL
IST
Issu
es
Ye
sY
es
– b
ut
ne
ed
s
refi
nin
g
No
Pri
ori
ty f
or
Lo
cal
Act
ion
?
If p
rio
rity
fo
r
act
ion
– w
ho
wil
l
take
fo
rwa
rd a
nd
by
wh
en
Imp
rove
me
nt
Too
ls R
ele
van
t
Do
es
yo
ur
CH
CP
ta
ke r
esp
on
sib
ilit
y f
or
de
live
rin
g t
his
targ
et
an
d r
ece
ive
re
gu
lar
rep
ort
s o
n p
rog
ress
?
Do
yo
u h
ave
in
pla
ce a
str
uct
ure
fo
r e
ffe
ctiv
e
dis
cuss
ion
of
inte
rfa
ce i
ssu
es
be
twe
en
Sp
eci
ali
st
Me
nta
l H
ea
lth
Se
rvic
es
an
d P
rim
ary
Ca
re?
eg
if p
rim
ary
ca
re w
ere
co
nce
rne
d a
bo
ut
lon
g w
ait
ing
tim
es
for
acc
ess
to
a C
MH
T f
or
de
pre
ssio
n c
are
wh
ere
wo
uld
th
ey r
ais
e t
his
? O
r if
th
ere
we
re c
on
cern
s th
at
GP
s
we
re n
ot
pre
scri
bin
g t
o f
orm
ula
ry r
eco
mm
en
da
tio
ns
for
AD
s, w
ho
wo
uld
de
al w
ith
th
is p
rob
lem
? W
ha
t fo
ra c
ou
ld
they
ra
ise
it in
? W
ho
se r
esp
on
sib
ility
wo
uld
it b
e t
o
en
ha
nce
co
mp
lian
ce?
Do
yo
u h
ave
pre
scri
bin
g a
dvi
sors
wo
rkin
g w
ith
pri
ma
ry
care
to
lo
ok a
t e
ffe
ctiv
e u
se o
f a
nti
-de
pre
ssa
nts
Do
yo
u h
ave
sy
ste
ms
in p
lace
wit
hin
pri
ma
ry c
are
to
acc
ess
th
e n
on
-ph
arm
aco
log
ica
l in
terv
en
tio
ns
reco
mm
en
de
d b
y t
he
dra
ft S
IGN
gu
ide
lin
es
(ie
psy
cho
log
ica
l th
era
pie
s a
nd
ex
erc
ise
)?
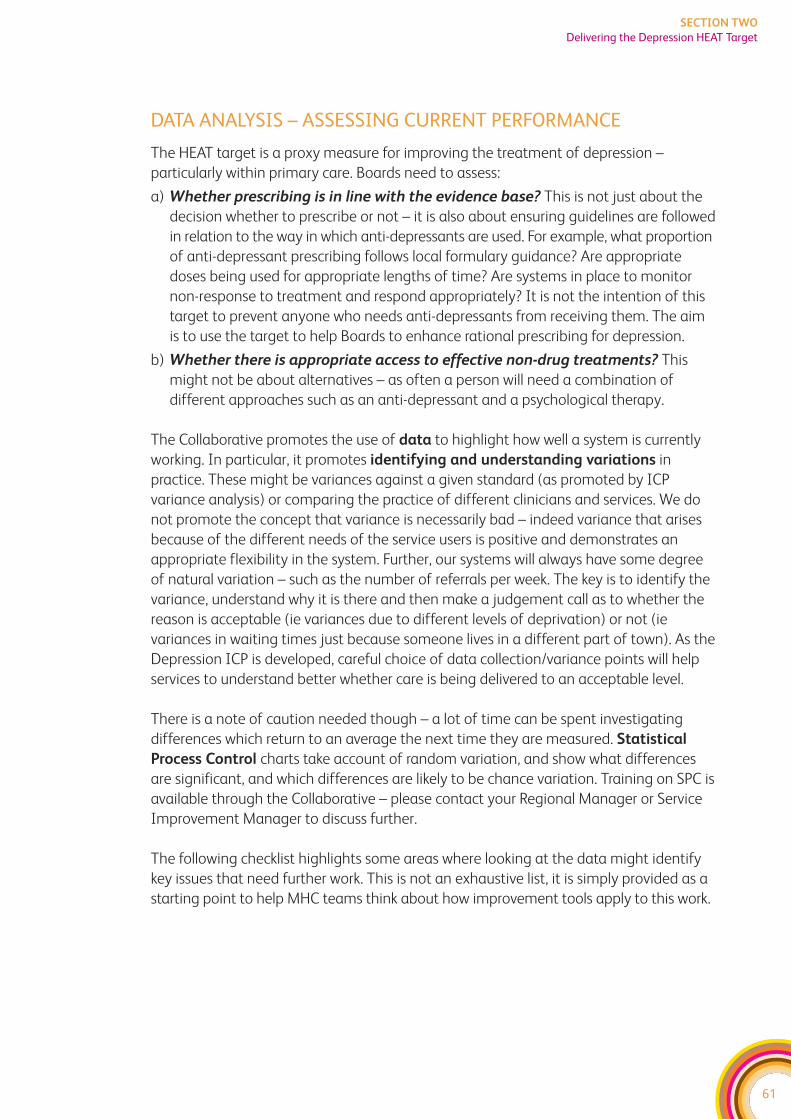
DATA ANALYSIS – ASSESSING CURRENT PERFORMANCE
The HEAT target is a proxy measure for improving the treatment of depression –
particularly within primary care. Boards need to assess:
a) Whether prescribing is in line with the evidence base? This is not just about the
decision whether to prescribe or not – it is also about ensuring guidelines are followed
in relation to the way in which anti-depressants are used. For example, what proportion
of anti-depressant prescribing follows local formulary guidance? Are appropriate
doses being used for appropriate lengths of time? Are systems in place to monitor
non-response to treatment and respond appropriately? It is not the intention of this
target to prevent anyone who needs anti-depressants from receiving them. The aim
is to use the target to help Boards to enhance rational prescribing for depression.
b) Whether there is appropriate access to effective non-drug treatments? This
might not be about alternatives – as often a person will need a combination of
different approaches such as an anti-depressant and a psychological therapy.
The Collaborative promotes the use of data to highlight how well a system is currently
working. In particular, it promotes identifying and understanding variations in
practice. These might be variances against a given standard (as promoted by ICP
variance analysis) or comparing the practice of different clinicians and services. We do
not promote the concept that variance is necessarily bad – indeed variance that arises
because of the different needs of the service users is positive and demonstrates an
appropriate flexibility in the system. Further, our systems will always have some degree
of natural variation – such as the number of referrals per week. The key is to identify the
variance, understand why it is there and then make a judgement call as to whether the
reason is acceptable (ie variances due to different levels of deprivation) or not (ie
variances in waiting times just because someone lives in a different part of town). As the
Depression ICP is developed, careful choice of data collection/variance points will help
services to understand better whether care is being delivered to an acceptable level.
There is a note of caution needed though – a lot of time can be spent investigating
differences which return to an average the next time they are measured. Statistical
Process Control charts take account of random variation, and show what differences
are significant, and which differences are likely to be chance variation. Training on SPC is
available through the Collaborative – please contact your Regional Manager or Service
Improvement Manager to discuss further.
The following checklist highlights some areas where looking at the data might identify
key issues that need further work. This is not an exhaustive list, it is simply provided as a
starting point to help MHC teams think about how improvement tools apply to this work.
61
SECTION TWO
Delivering the Depression HEAT Target
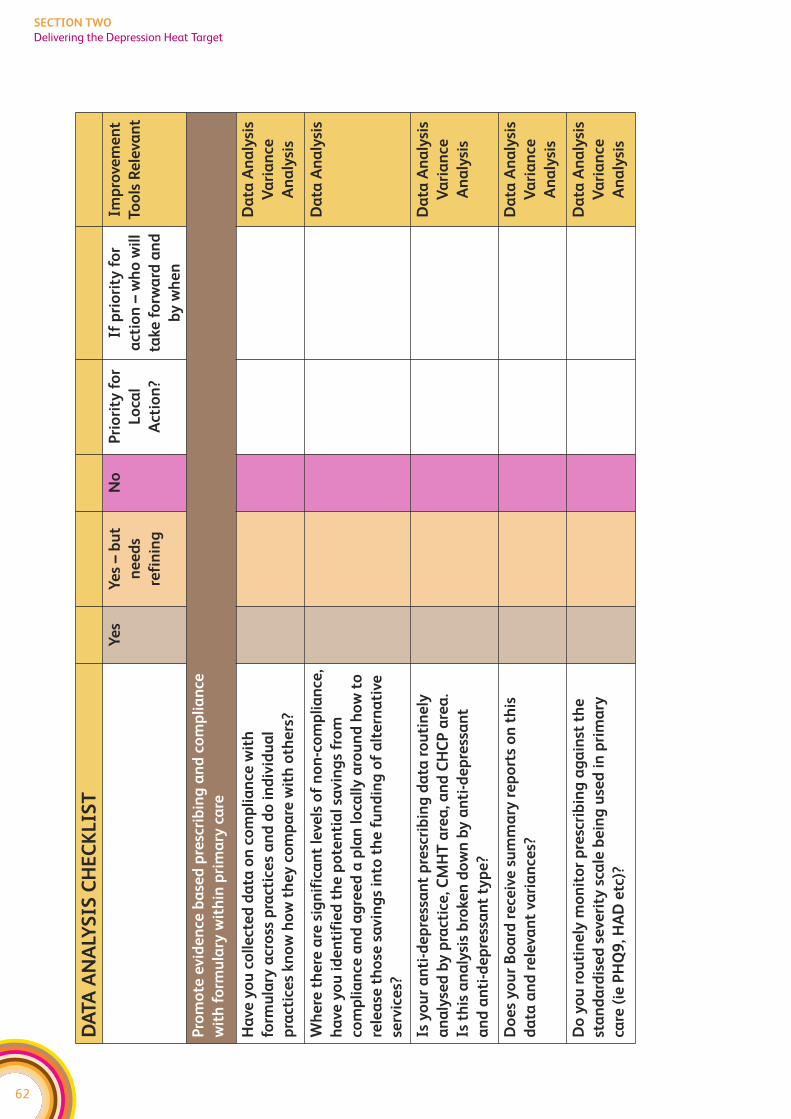
62
SECTION TWO
Delivering the Depression Heat Target
DA
TA
AN
ALY
SIS
CH
EC
KL
IST
Ye
sY
es
– b
ut
ne
ed
s
refi
nin
g
No
Pri
ori
ty f
or
Lo
cal
Act
ion
?
If p
rio
rity
fo
r
act
ion
– w
ho
wil
l
take
fo
rwa
rd a
nd
by
wh
en
Imp
rove
me
nt
Too
ls R
ele
van
t
Pro
mo
te e
vid
en
ce b
ase
d p
resc
rib
ing
an
d c
om
pli
an
ce
wit
h f
orm
ula
ry w
ith
in p
rim
ary
ca
re
Ha
ve y
ou
co
lle
cte
d d
ata
on
co
mp
lia
nce
wit
h
form
ula
ry a
cro
ss p
ract
ice
s a
nd
do
in
div
idu
al
pra
ctic
es
kn
ow
ho
w t
he
y c
om
pa
re w
ith
oth
ers
?
Da
ta A
na
lysi
s
Va
ria
nce
An
aly
sis
Wh
ere
th
ere
are
sig
nif
ica
nt
leve
ls o
f n
on
-co
mp
lia
nce
,
ha
ve y
ou
id
en
tifi
ed
th
e p
ote
nti
al
savin
gs
fro
m
com
pli
an
ce a
nd
ag
ree
d a
pla
n l
oca
lly
aro
un
d h
ow
to
rele
ase
th
ose
sa
vin
gs
into
th
e f
un
din
g o
f a
lte
rna
tive
serv
ice
s?
Da
ta A
na
lysi
s
Is y
ou
r a
nti
-de
pre
ssa
nt
pre
scri
bin
g d
ata
ro
uti
ne
ly
an
aly
sed
by
pra
ctic
e, C
MH
T a
rea
, an
d C
HC
P a
rea
.
Is t
his
an
aly
sis
bro
ken
do
wn
by
an
ti-d
ep
ress
an
t
an
d a
nti
-de
pre
ssa
nt
typ
e?
Da
ta A
na
lysi
s
Va
ria
nce
An
aly
sis
Do
es
yo
ur
Bo
ard
re
ceiv
e s
um
ma
ry r
ep
ort
s o
n t
his
da
ta a
nd
re
leva
nt
vari
an
ces?
Da
ta A
na
lysi
s
Va
ria
nce
An
aly
sis
Do
yo
u r
ou
tin
ely
mo
nit
or
pre
scri
bin
g a
ga
inst
th
e
sta
nd
ard
ise
d s
eve
rity
sca
le b
ein
g u
sed
in
pri
ma
ry
care
(ie
PH
Q9
, HA
D e
tc)?
Da
ta A
na
lysi
s
Va
ria
nce
An
aly
sis
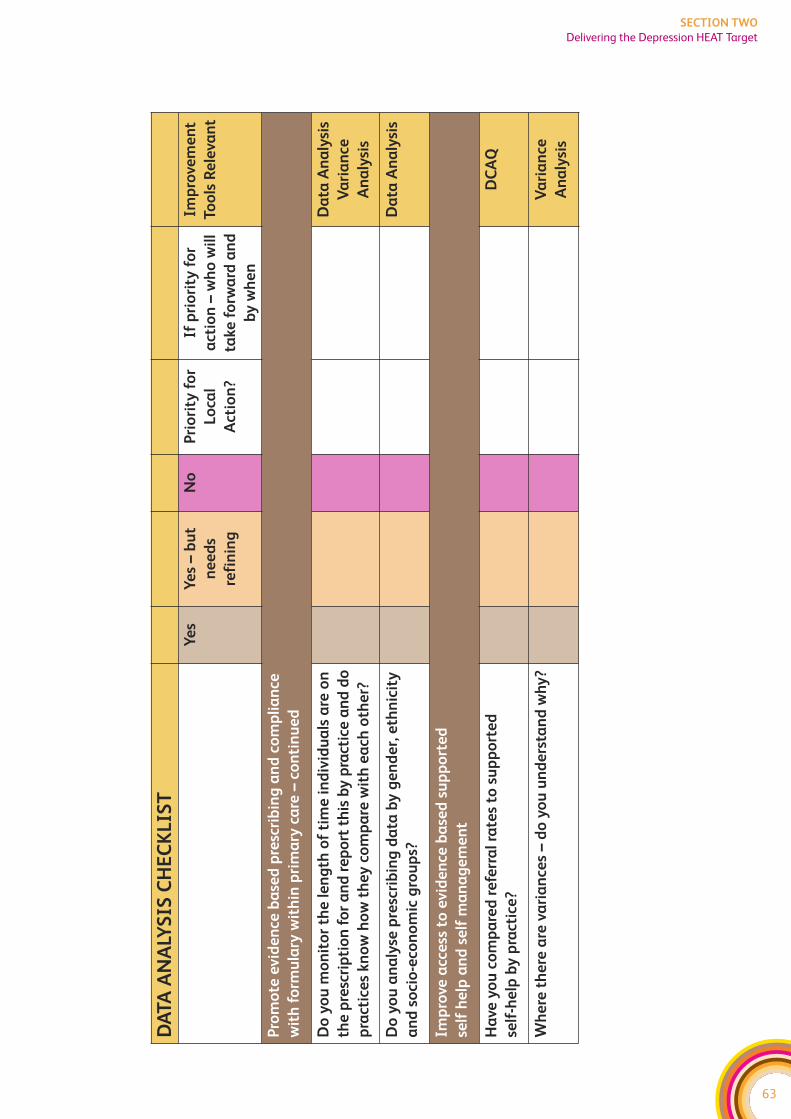
63
SECTION TWO
Delivering the Depression HEAT Target
DA
TA
AN
ALY
SIS
CH
EC
KL
IST
Ye
sY
es
– b
ut
ne
ed
s
refi
nin
g
No
Pri
ori
ty f
or
Lo
cal
Act
ion
?
If p
rio
rity
fo
r
act
ion
– w
ho
wil
l
take
fo
rwa
rd a
nd
by
wh
en
Imp
rove
me
nt
Too
ls R
ele
van
t
Pro
mo
te e
vid
en
ce b
ase
d p
resc
rib
ing
an
d c
om
pli
an
ce
wit
h f
orm
ula
ry w
ith
in p
rim
ary
ca
re –
con
tin
ue
d
Do
yo
u m
on
ito
r th
e l
en
gth
of
tim
e i
nd
ivid
ua
ls a
re o
n
the
pre
scri
pti
on
fo
r a
nd
re
po
rt t
his
by
pra
ctic
e a
nd
do
pra
ctic
es
kn
ow
ho
w t
he
y c
om
pa
re w
ith
ea
ch o
the
r?
Da
ta A
na
lysi
s
Va
ria
nce
An
aly
sis
Do
yo
u a
na
lyse
pre
scri
bin
g d
ata
by
ge
nd
er,
eth
nic
ity
an
d s
oci
o-e
con
om
ic g
rou
ps?
Da
ta A
na
lysi
s
Imp
rove
acc
ess
to
evid
en
ce b
ase
d s
up
po
rte
d
self
he
lp a
nd
se
lf m
an
ag
em
en
t
Ha
ve y
ou
co
mp
are
d r
efe
rra
l ra
tes
to s
up
po
rte
d
self
-he
lp b
y p
ract
ice
?
DC
AQ
Wh
ere
th
ere
are
va
ria
nce
s –
do
yo
u u
nd
ers
tan
d w
hy
?V
ari
an
ce
An
aly
sis
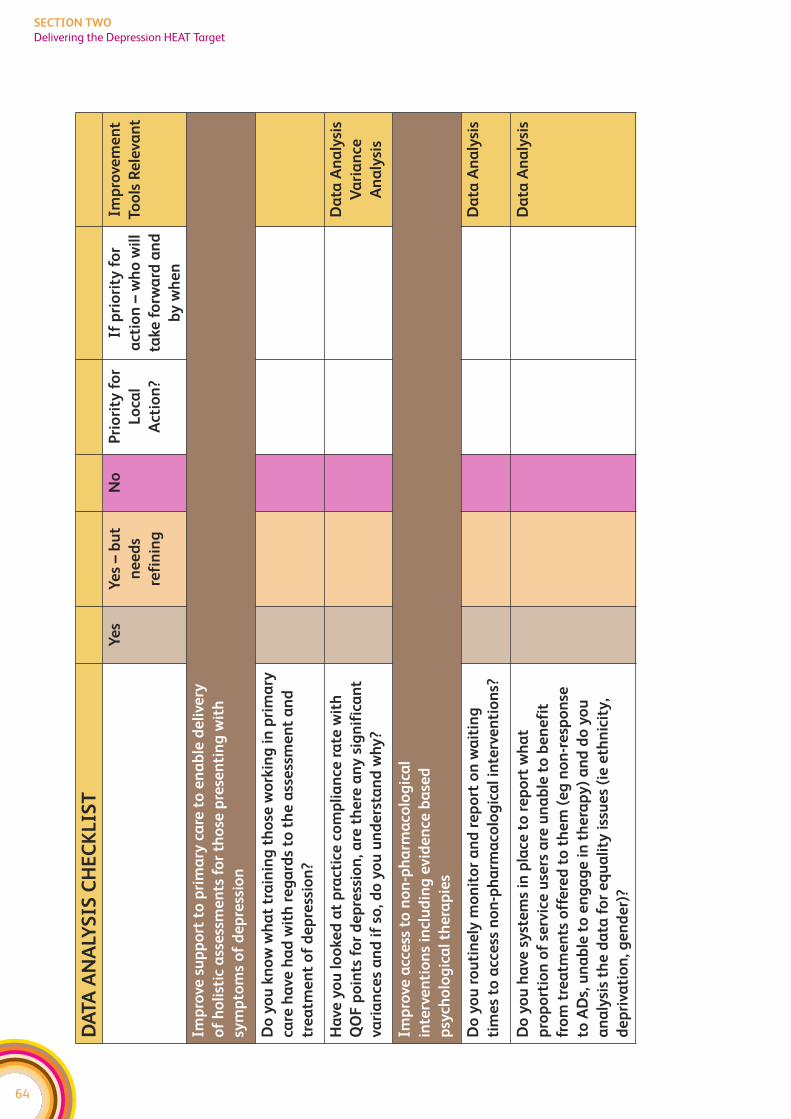
64
SECTION TWO
Delivering the Depression HEAT Target
DA
TA
AN
ALY
SIS
CH
EC
KL
IST
Ye
sY
es
– b
ut
ne
ed
s
refi
nin
g
No
Pri
ori
ty f
or
Lo
cal
Act
ion
?
If p
rio
rity
fo
r
act
ion
– w
ho
wil
l
take
fo
rwa
rd a
nd
by
wh
en
Imp
rove
me
nt
Too
ls R
ele
van
t
Imp
rove
su
pp
ort
to
pri
ma
ry c
are
to
en
ab
le d
eli
very
of
ho
list
ic a
sse
ssm
en
ts f
or
tho
se p
rese
nti
ng
wit
h
sym
pto
ms
of
de
pre
ssio
n
Do
yo
u k
no
w w
ha
t tr
ain
ing
th
ose
wo
rkin
g i
n p
rim
ary
care
ha
ve h
ad
wit
h r
eg
ard
s to
th
e a
sse
ssm
en
t a
nd
tre
atm
en
t o
f d
ep
ress
ion
?
Ha
ve y
ou
lo
oke
d a
t p
ract
ice
co
mp
lia
nce
ra
te w
ith
QO
F p
oin
ts f
or
de
pre
ssio
n, a
re t
he
re a
ny
sig
nif
ica
nt
vari
an
ces
an
d i
f so
, do
yo
u u
nd
ers
tan
d w
hy
?
Da
ta A
na
lysi
s
Va
ria
nce
An
aly
sis
Imp
rove
acc
ess
to
no
n-p
ha
rma
colo
gic
al
inte
rve
nti
on
s in
clu
din
g e
vid
en
ce b
ase
d
psy
cho
log
ica
l th
era
pie
s
Do
yo
u r
ou
tin
ely
mo
nit
or
an
d r
ep
ort
on
wa
itin
g
tim
es
to a
cce
ss n
on
-ph
arm
aco
log
ica
l in
terv
en
tio
ns?
Da
ta A
na
lysi
s
Do
yo
u h
ave
sy
ste
ms
in p
lace
to
re
po
rt w
ha
t
pro
po
rtio
n o
f se
rvic
e u
sers
are
un
ab
le t
o b
en
efi
t
fro
m t
rea
tme
nts
off
ere
d t
o t
he
m (
eg
no
n-r
esp
on
se
to A
Ds,
un
ab
le t
o e
ng
ag
e i
n t
he
rap
y)
an
d d
o y
ou
an
aly
sis
the
da
ta f
or
eq
ua
lity
iss
ue
s (i
e e
thn
icit
y,
de
pri
vati
on
, ge
nd
er)
?
Da
ta A
na
lysi
s
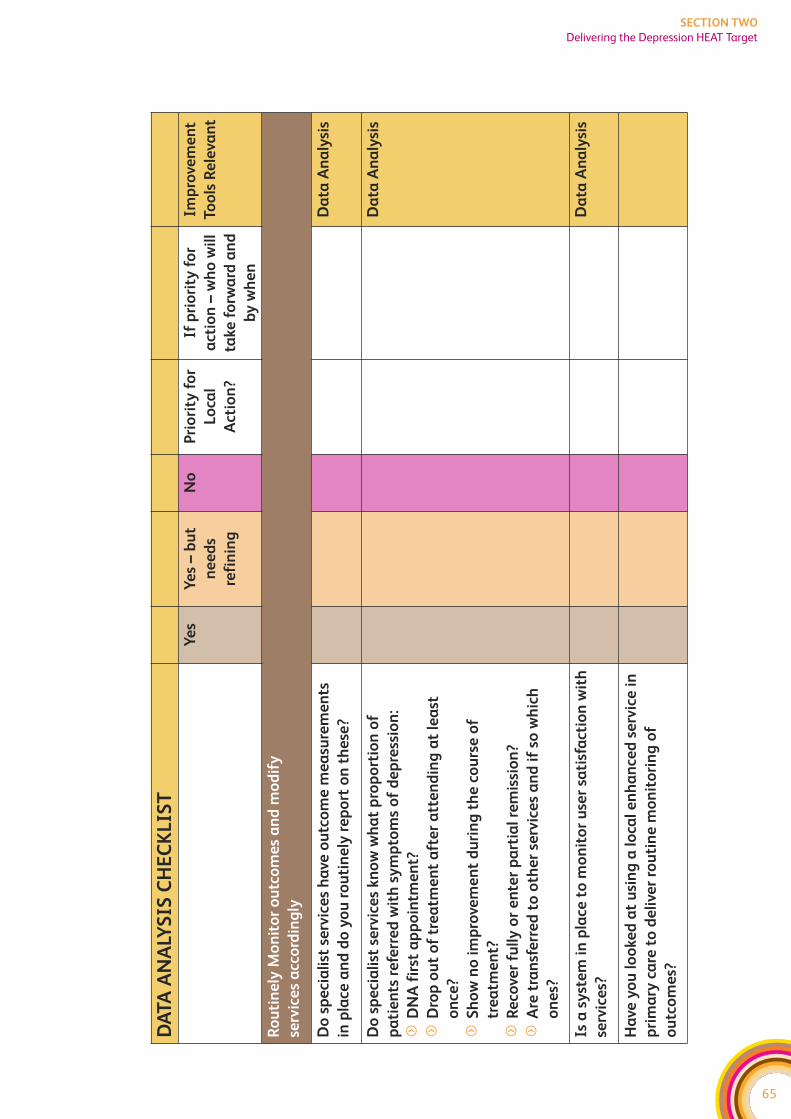
65
SECTION TWO
Delivering the Depression HEAT Target
DA
TA
AN
ALY
SIS
CH
EC
KL
IST
Ye
sY
es
– b
ut
ne
ed
s
refi
nin
g
No
Pri
ori
ty f
or
Lo
cal
Act
ion
?
If p
rio
rity
fo
r
act
ion
– w
ho
wil
l
take
fo
rwa
rd a
nd
by
wh
en
Imp
rove
me
nt
Too
ls R
ele
van
t
Ro
uti
ne
ly M
on
ito
r o
utc
om
es
an
d m
od
ify
serv
ice
s a
cco
rdin
gly
Do
sp
eci
ali
st s
erv
ice
s h
ave
ou
tco
me
me
asu
rem
en
ts
in p
lace
an
d d
o y
ou
ro
uti
ne
ly r
ep
ort
on
th
ese
?
Da
ta A
na
lysi
s
Do
sp
eci
ali
st s
erv
ice
s kn
ow
wh
at
pro
po
rtio
n o
f
pa
tie
nts
re
ferr
ed
wit
h s
ym
pto
ms
of
de
pre
ssio
n:
fD
NA
fir
st a
pp
oin
tme
nt?
fD
rop
ou
t o
f tr
ea
tme
nt
aft
er
att
en
din
g a
t le
ast
on
ce?
fS
ho
w n
o i
mp
rove
me
nt
du
rin
g t
he
co
urs
e o
f
tre
atm
en
t?
fR
eco
ver
full
y o
r e
nte
r p
art
ial
rem
issi
on
?
fA
re t
ran
sfe
rre
d t
o o
the
r se
rvic
es
an
d i
f so
wh
ich
on
es?
Da
ta A
na
lysi
s
Is a
sy
ste
m i
n p
lace
to
mo
nit
or
use
r sa
tisf
act
ion
wit
h
serv
ice
s?
Da
ta A
na
lysi
s
Ha
ve y
ou
lo
oke
d a
t u
sin
g a
lo
cal
en
ha
nce
d s
erv
ice
in
pri
ma
ry c
are
to
de
live
r ro
uti
ne
mo
nit
ori
ng
of
ou
tco
me
s?
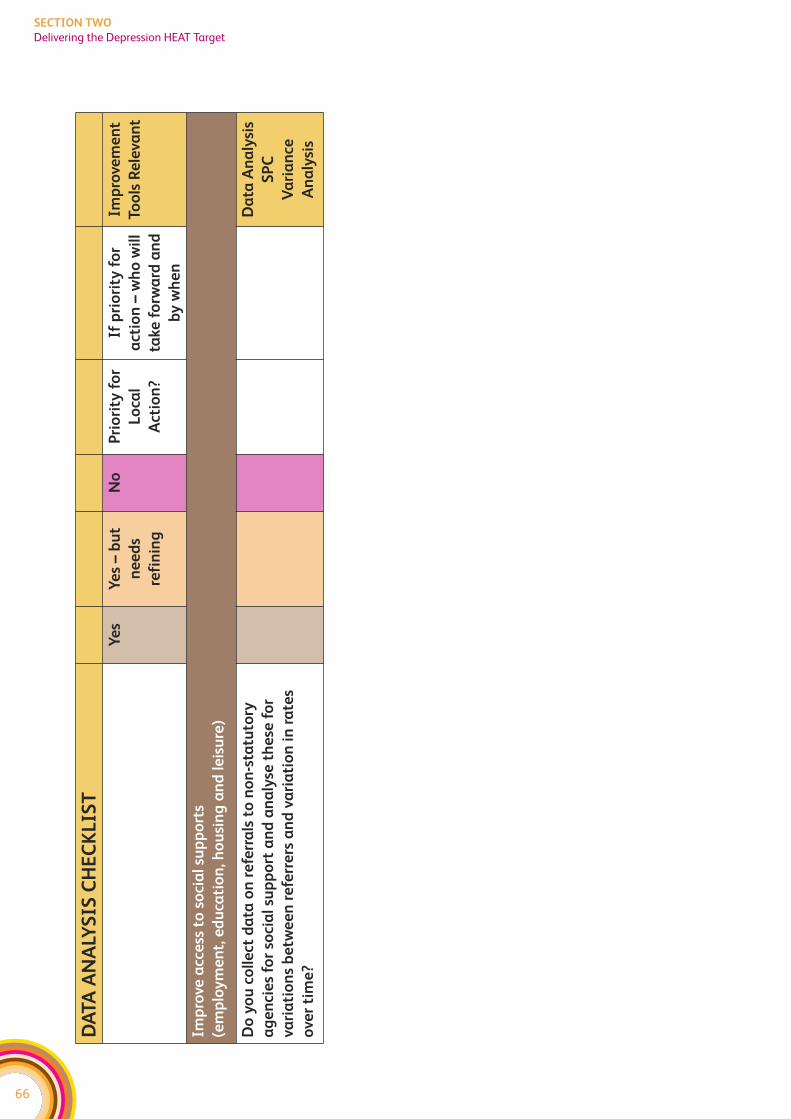
66
SECTION TWO
Delivering the Depression HEAT Target
DA
TA
AN
ALY
SIS
CH
EC
KL
IST
Ye
sY
es
– b
ut
ne
ed
s
refi
nin
g
No
Pri
ori
ty f
or
Lo
cal
Act
ion
?
If p
rio
rity
fo
r
act
ion
– w
ho
wil
l
take
fo
rwa
rd a
nd
by
wh
en
Imp
rove
me
nt
Too
ls R
ele
van
t
Imp
rove
acc
ess
to
so
cia
l su
pp
ort
s
(em
plo
ym
en
t, e
du
cati
on
, ho
usi
ng
an
d l
eis
ure
)
Do
yo
u c
oll
ect
da
ta o
n r
efe
rra
ls t
o n
on
-sta
tuto
ry
ag
en
cie
s fo
r so
cia
l su
pp
ort
an
d a
na
lyse
th
ese
fo
r
vari
ati
on
s b
etw
ee
n r
efe
rre
rs a
nd
va
ria
tio
n i
n r
ate
s
ove
r ti
me
?
Da
ta A
na
lysi
s
SP
C
Va
ria
nce
An
aly
sis
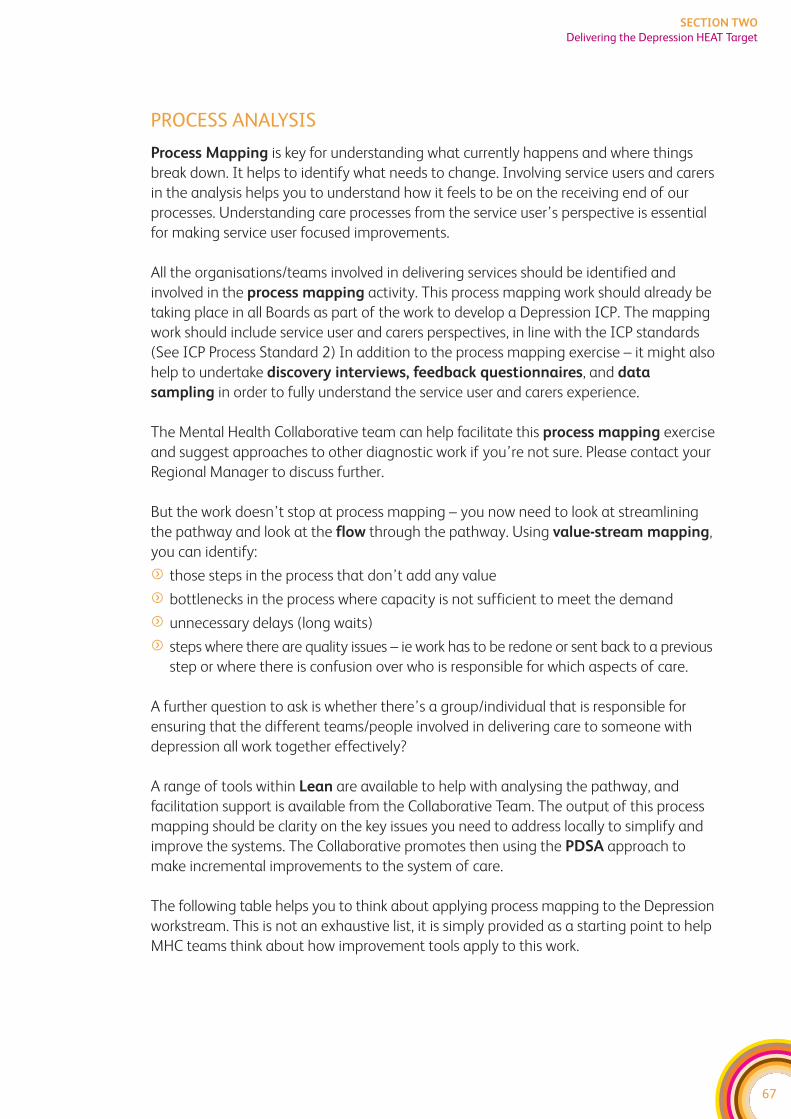
67
SECTION TWO
Delivering the Depression HEAT Target
PROCESS ANALYSIS
Process Mapping is key for understanding what currently happens and where things
break down. It helps to identify what needs to change. Involving service users and carers
in the analysis helps you to understand how it feels to be on the receiving end of our
processes. Understanding care processes from the service user’s perspective is essential
for making service user focused improvements.
All the organisations/teams involved in delivering services should be identified and
involved in the process mapping activity. This process mapping work should already be
taking place in all Boards as part of the work to develop a Depression ICP. The mapping
work should include service user and carers perspectives, in line with the ICP standards
(See ICP Process Standard 2) In addition to the process mapping exercise – it might also
help to undertake discovery interviews, feedback questionnaires, and data
sampling in order to fully understand the service user and carers experience.
The Mental Health Collaborative team can help facilitate this process mapping exercise
and suggest approaches to other diagnostic work if you’re not sure. Please contact your
Regional Manager to discuss further.
But the work doesn’t stop at process mapping – you now need to look at streamlining
the pathway and look at the flow through the pathway. Using value-stream mapping,
you can identify:
f those steps in the process that don’t add any value
f bottlenecks in the process where capacity is not sufficient to meet the demand
f unnecessary delays (long waits)
f steps where there are quality issues – ie work has to be redone or sent back to a previous
step or where there is confusion over who is responsible for which aspects of care.
A further question to ask is whether there’s a group/individual that is responsible for
ensuring that the different teams/people involved in delivering care to someone with
depression all work together effectively?
A range of tools within Lean are available to help with analysing the pathway, and
facilitation support is available from the Collaborative Team. The output of this process
mapping should be clarity on the key issues you need to address locally to simplify and
improve the systems. The Collaborative promotes then using the PDSA approach to
make incremental improvements to the system of care.
The following table helps you to think about applying process mapping to the Depression
workstream. This is not an exhaustive list, it is simply provided as a starting point to help
MHC teams think about how improvement tools apply to this work.
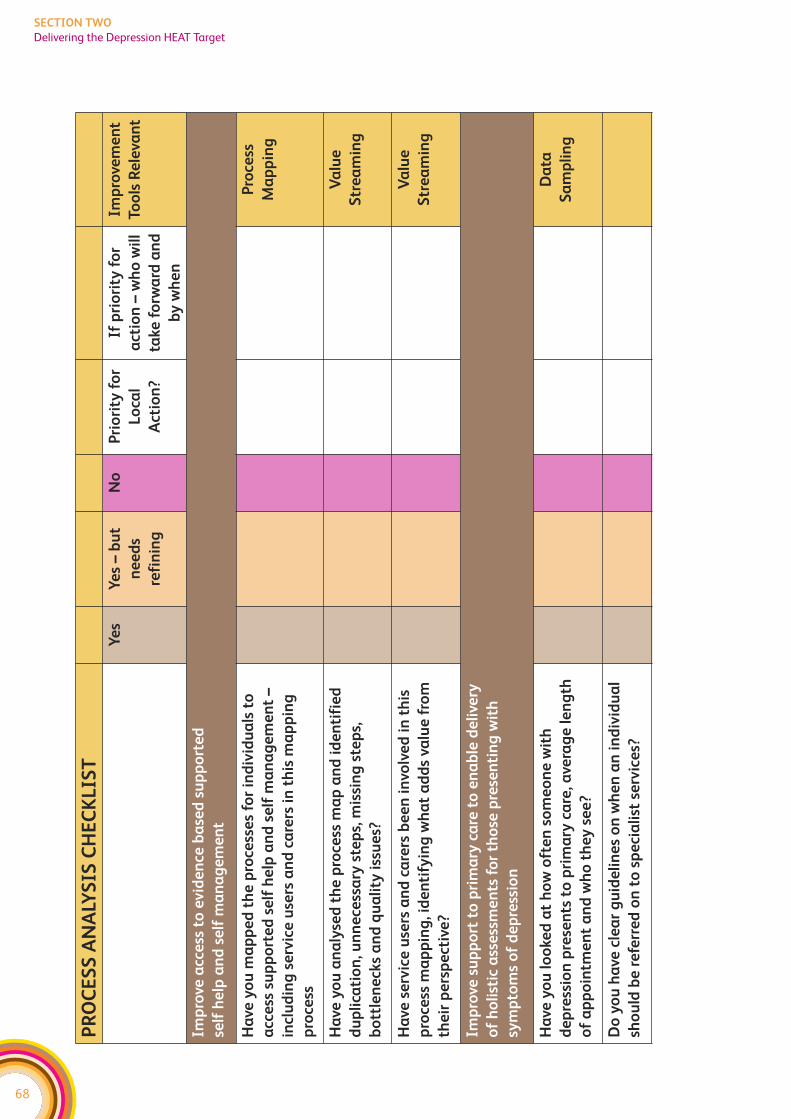
68
SECTION TWO
Delivering the Depression HEAT Target
PR
OC
ES
S A
NA
LYS
IS C
HE
CK
LIS
T
Ye
sY
es
– b
ut
ne
ed
s
refi
nin
g
No
Pri
ori
ty f
or
Lo
cal
Act
ion
?
If p
rio
rity
fo
r
act
ion
– w
ho
wil
l
take
fo
rwa
rd a
nd
by
wh
en
Imp
rove
me
nt
Too
ls R
ele
van
t
Imp
rove
acc
ess
to
evid
en
ce b
ase
d s
up
po
rte
d
self
he
lp a
nd
se
lf m
an
ag
em
en
t
Ha
ve y
ou
ma
pp
ed
th
e p
roce
sse
s fo
r in
div
idu
als
to
acc
ess
su
pp
ort
ed
se
lf h
elp
an
d s
elf
ma
na
ge
me
nt
–
incl
ud
ing
se
rvic
e u
sers
an
d c
are
rs i
n t
his
ma
pp
ing
pro
cess
Pro
cess
Ma
pp
ing
Ha
ve y
ou
an
aly
sed
th
e p
roce
ss m
ap
an
d i
de
nti
fie
d
du
pli
cati
on
, un
ne
cess
ary
ste
ps,
mis
sin
g s
tep
s,
bo
ttle
ne
cks
an
d q
ua
lity
iss
ue
s?
Va
lue
Str
ea
min
g
Ha
ve s
erv
ice
use
rs a
nd
ca
rers
be
en
in
volv
ed
in
th
is
pro
cess
ma
pp
ing
, id
en
tify
ing
wh
at
ad
ds
valu
e f
rom
the
ir p
ers
pe
ctiv
e?
Va
lue
Str
ea
min
g
Imp
rove
su
pp
ort
to
pri
ma
ry c
are
to
en
ab
le d
eli
very
of
ho
list
ic a
sse
ssm
en
ts f
or
tho
se p
rese
nti
ng
wit
h
sym
pto
ms
of
de
pre
ssio
n
Ha
ve y
ou
lo
oke
d a
t h
ow
oft
en
so
me
on
e w
ith
de
pre
ssio
n p
rese
nts
to
pri
ma
ry c
are
, ave
rag
e l
en
gth
of
ap
po
intm
en
t a
nd
wh
o t
he
y s
ee
?
Da
ta
Sa
mp
lin
g
Do
yo
u h
ave
cle
ar
gu
ide
lin
es
on
wh
en
an
in
div
idu
al
sho
uld
be
re
ferr
ed
on
to
sp
eci
ali
st s
erv
ice
s?
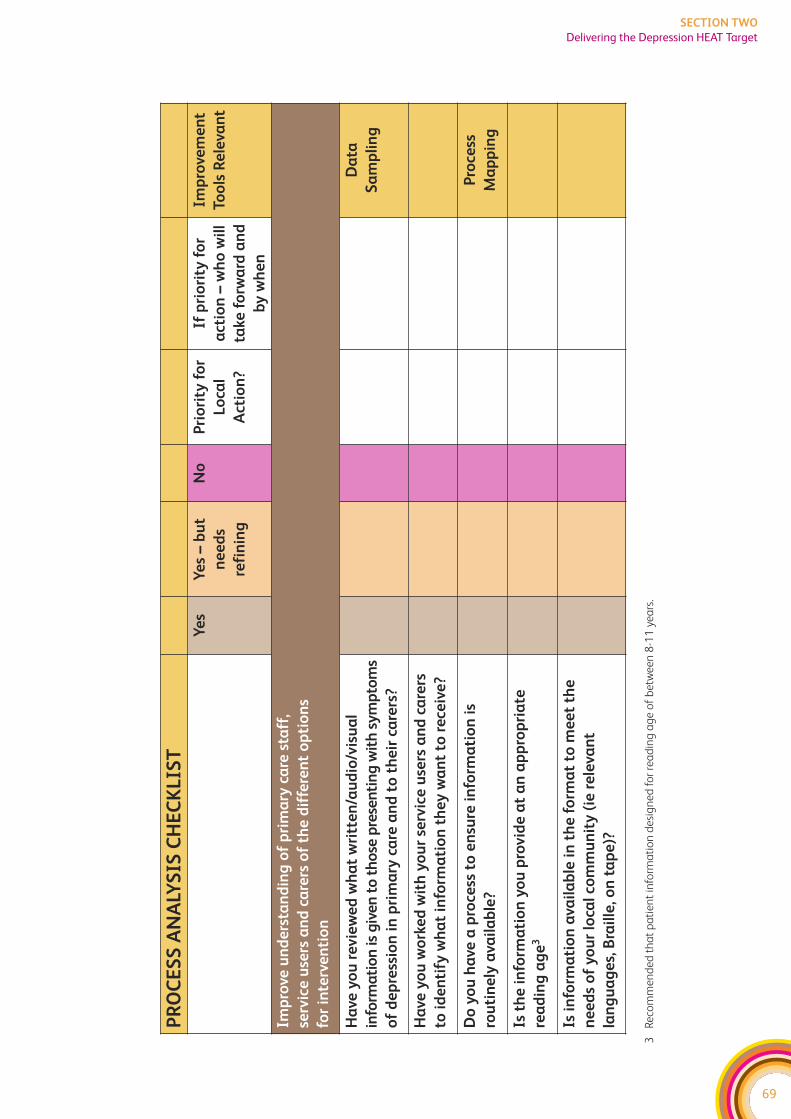
69
SECTION TWO
Delivering the Depression HEAT Target
PR
OC
ES
S A
NA
LYS
IS C
HE
CK
LIS
T
Ye
sY
es
– b
ut
ne
ed
s
refi
nin
g
No
Pri
ori
ty f
or
Lo
cal
Act
ion
?
If p
rio
rity
fo
r
act
ion
– w
ho
wil
l
take
fo
rwa
rd a
nd
by
wh
en
Imp
rove
me
nt
Too
ls R
ele
van
t
Imp
rove
un
de
rsta
nd
ing
of
pri
ma
ry c
are
sta
ff,
serv
ice
use
rs a
nd
ca
rers
of
the
dif
fere
nt
op
tio
ns
for
inte
rve
nti
on
Ha
ve y
ou
re
vie
we
d w
ha
t w
ritt
en
/au
dio
/vis
ua
l
info
rma
tio
n is
giv
en
to
th
ose
pre
sen
tin
g w
ith
sy
mp
tom
s
of
de
pre
ssio
n i
n p
rim
ary
ca
re a
nd
to
th
eir
ca
rers
?
Da
ta
Sa
mp
lin
g
Ha
ve y
ou
wo
rke
d w
ith
yo
ur
serv
ice
use
rs a
nd
ca
rers
to i
de
nti
fy w
ha
t in
form
ati
on
th
ey
wa
nt
to r
ece
ive
?
Do
yo
u h
ave
a p
roce
ss t
o e
nsu
re i
nfo
rma
tio
n i
s
rou
tin
ely
ava
ila
ble
?
Pro
cess
Ma
pp
ing
Is t
he
in
form
ati
on
yo
u p
rovid
e a
t a
n a
pp
rop
ria
te
rea
din
g a
ge
3
Is i
nfo
rma
tio
n a
vail
ab
le i
n t
he
fo
rma
t to
me
et
the
ne
ed
s o
f y
ou
r lo
cal
com
mu
nit
y (
ie r
ele
van
t
lan
gu
ag
es,
Bra
ille
, on
ta
pe
)?
3R
eco
mm
en
de
d t
ha
t p
ati
en
t in
form
ati
on
de
sig
ne
d f
or
rea
din
g a
ge
of
be
twe
en
8-1
1 y
ea
rs.
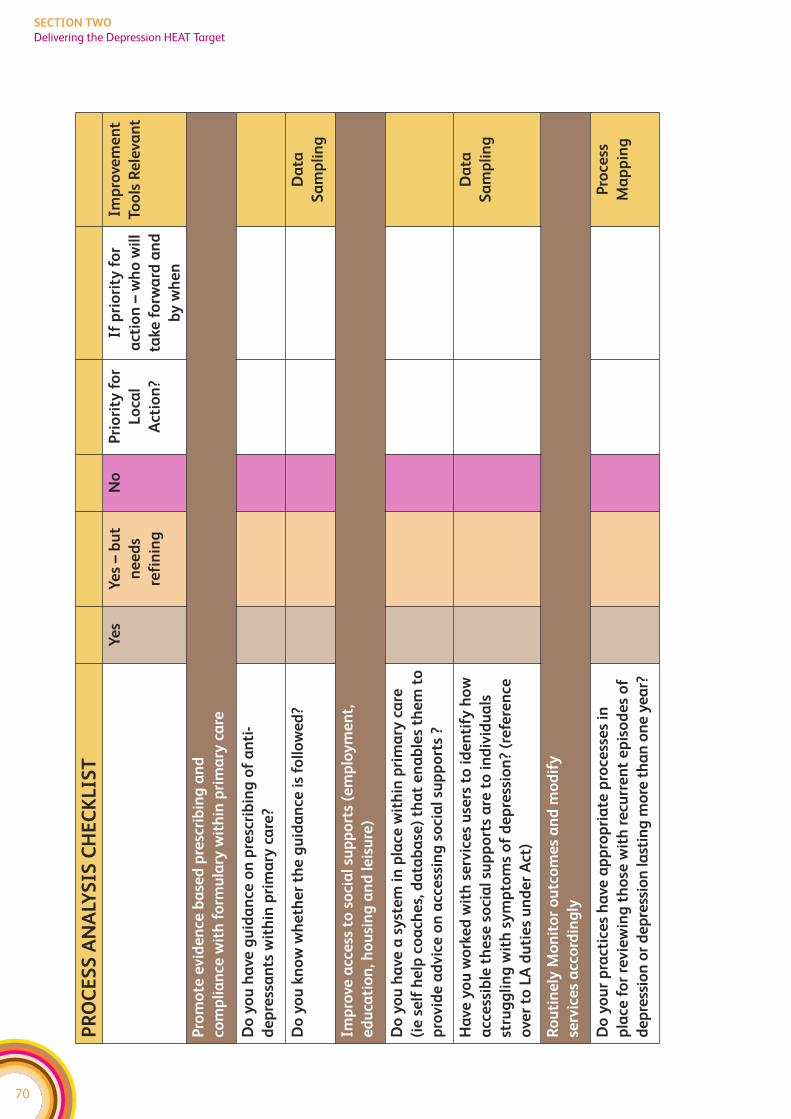
70
SECTION TWO
Delivering the Depression HEAT Target
PR
OC
ES
S A
NA
LYS
IS C
HE
CK
LIS
T
Ye
sY
es
– b
ut
ne
ed
s
refi
nin
g
No
Pri
ori
ty f
or
Lo
cal
Act
ion
?
If p
rio
rity
fo
r
act
ion
– w
ho
wil
l
take
fo
rwa
rd a
nd
by
wh
en
Imp
rove
me
nt
Too
ls R
ele
van
t
Pro
mo
te e
vid
en
ce b
ase
d p
resc
rib
ing
an
d
com
pli
an
ce w
ith
fo
rmu
lary
wit
hin
pri
ma
ry c
are
Do
yo
u h
ave
gu
ida
nce
on
pre
scri
bin
g o
f a
nti
-
de
pre
ssa
nts
wit
hin
pri
ma
ry c
are
?
Do
yo
u k
no
w w
he
the
r th
e g
uid
an
ce i
s fo
llo
we
d?
Da
ta
Sa
mp
lin
g
Imp
rove
acc
ess
to
so
cia
l su
pp
ort
s (e
mp
loy
me
nt,
ed
uca
tio
n, h
ou
sin
g a
nd
le
isu
re)
Do
yo
u h
ave
a s
yst
em
in
pla
ce w
ith
in p
rim
ary
ca
re
(ie
se
lf h
elp
co
ach
es,
da
tab
ase
) th
at
en
ab
les
the
m t
o
pro
vid
e a
dvic
e o
n a
cce
ssin
g s
oci
al
sup
po
rts
?
Ha
ve y
ou
wo
rke
d w
ith
se
rvic
es
use
rs t
o i
de
nti
fy h
ow
acc
ess
ible
th
ese
so
cia
l su
pp
ort
s a
re t
o i
nd
ivid
ua
ls
stru
gg
lin
g w
ith
sy
mp
tom
s o
f d
ep
ress
ion
? (r
efe
ren
ce
ove
r to
LA
du
tie
s u
nd
er
Act
)
Da
ta
Sa
mp
lin
g
Ro
uti
ne
ly M
on
ito
r o
utc
om
es
an
d m
od
ify
serv
ice
s a
cco
rdin
gly
Do
yo
ur
pra
ctic
es
ha
ve a
pp
rop
ria
te p
roce
sse
s in
pla
ce f
or
revie
win
g t
ho
se w
ith
re
curr
en
t e
pis
od
es
of
de
pre
ssio
n o
r d
ep
ress
ion
last
ing
mo
re t
ha
n o
ne
ye
ar?
Pro
cess
Ma
pp
ing
71
SECTION TWO
Delivering the Depression HEAT Target
UNDERSTANDING DEMAND AND CAPACITY
Understanding the demand for services is essential, without this services cannot effectively
plan to meet that demand. However, you also need to understand the capacity to respond
to that demand and whether best use is being made of this. For instance, seeing everyone
individually is not necessarily the best use of the capacity, particularly when some
interventions can be just as effectively provided in groups or even over the telephone.
Matching demand and capacity is important because delays in receiving a timely response
can leave people in distress with no support. Further, delays can lead to an escalation of
someone’s illness which will take up more resources in the longer term. In primary care,
a failure to match demand and capacity can lead to an individual repeatedly presenting
to primary care, which can result in far more time being allocated to them than if the
appropriate time was given in the first place.
Mental Health Services often refer to demand as the number of referrals received, however,
this is not the demand. Each referral is a request for clinical input so the demand is the
total number of clinical hours provided in response to that request. Hence demand is
partly impacted by the type of service teams provide. An audit across one community
mental health area showed that differences in waiting lists between teams were five
times more to do with what they did with each case (ie differences in number of
sessions and duration) than the number of referrals the teams received.
In addition to understanding their demand, teams/services also need to understand
their capacity. Capacity is the number of clinical hours that are available. Not all of this
will be available for direct patient contact as time will be spent travelling, on leave, at
meetings etc. The Collaborative promotes careful analysis of capacity and how it is used.
For instance, where clinically appropriate, seeing individuals in groups enables limited
capacity to meet a much higher level of demand than just using one to one contact.
The Mental Health Collaborative is working on a demand and capacity analysis tool for
community teams and this is currently in testing stage. Please liaise with your Regional
Manager for more information on this tool. We plan to modify this tool so it can also be
applied specifically to psychological therapy services.
The following table helps you to think about areas you could apply demand and capacity
analysis in relation to the Depression Workstream. This is not an exhaustive list, it is
simply provided as a starting point to help MHC teams think about how improvement
tools apply to this work.
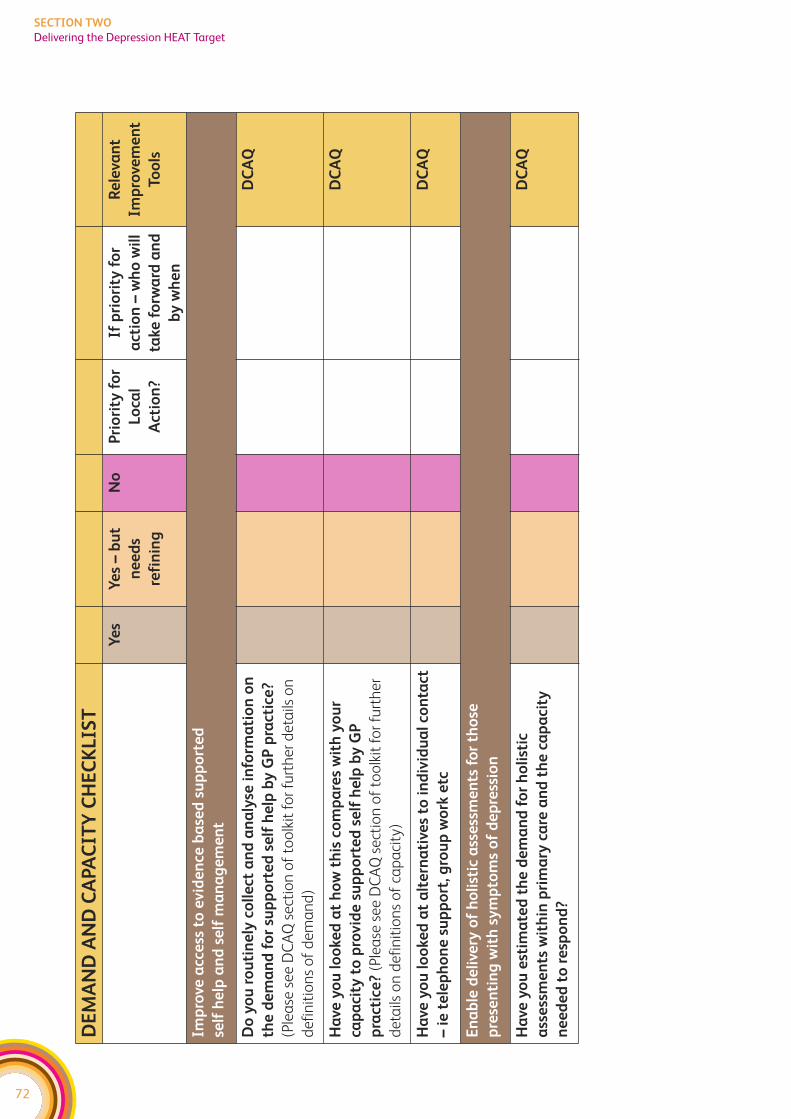
72
SECTION TWO
Delivering the Depression HEAT Target
DE
MA
ND
AN
D C
APA
CIT
Y C
HE
CK
LIS
T
Ye
sY
es
– b
ut
ne
ed
s
refi
nin
g
No
Pri
ori
ty f
or
Lo
cal
Act
ion
?
If p
rio
rity
fo
r
act
ion
– w
ho
wil
l
take
fo
rwa
rd a
nd
by
wh
en
Re
leva
nt
Imp
rove
me
nt
Too
ls
Imp
rove
acc
ess
to
evid
en
ce b
ase
d s
up
po
rte
d
self
he
lp a
nd
se
lf m
an
ag
em
en
t
Do
yo
u r
ou
tin
ely
co
lle
ct a
nd
an
aly
se i
nfo
rma
tio
n o
n
the
de
ma
nd
fo
r su
pp
ort
ed
se
lf h
elp
by
GP
pra
ctic
e?
(Ple
ase
se
e D
CA
Q s
ect
ion
of
too
lkit
fo
r fu
rth
er
de
tails
on
de
fin
itio
ns
of
de
ma
nd
)
DC
AQ
Ha
ve y
ou
lo
oke
d a
t h
ow
th
is c
om
pa
res
wit
h y
ou
r
cap
aci
ty t
o p
rovid
e s
up
po
rte
d s
elf
he
lp b
y G
P
pra
ctic
e?
(Ple
ase
se
e D
CA
Q s
ect
ion
of
too
lkit
fo
r fu
rth
er
de
tails
on
de
fin
itio
ns
of
cap
aci
ty)
DC
AQ
Ha
ve y
ou
lo
oke
d a
t a
lte
rna
tive
s to
in
div
idu
al
con
tact
– i
e t
ele
ph
on
e s
up
po
rt, g
rou
p w
ork
etc
DC
AQ
En
ab
le d
eli
very
of
ho
list
ic a
sse
ssm
en
ts f
or
tho
se
pre
sen
tin
g w
ith
sy
mp
tom
s o
f d
ep
ress
ion
Ha
ve y
ou
est
ima
ted
th
e d
em
an
d f
or
ho
list
ic
ass
ess
me
nts
wit
hin
pri
ma
ry c
are
an
d t
he
ca
pa
city
ne
ed
ed
to
re
spo
nd
?
DC
AQ
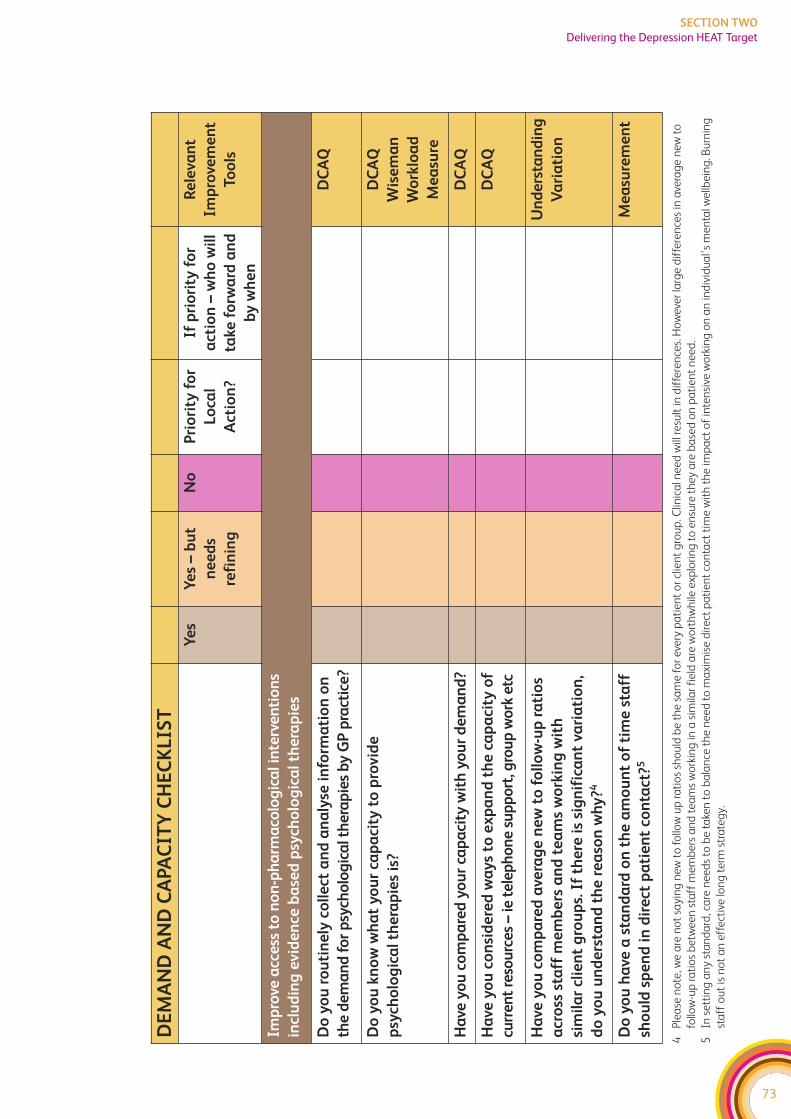
73
SECTION TWO
Delivering the Depression HEAT Target
DE
MA
ND
AN
D C
APA
CIT
Y C
HE
CK
LIS
T
Ye
sY
es
– b
ut
ne
ed
s
refi
nin
g
No
Pri
ori
ty f
or
Lo
cal
Act
ion
?
If p
rio
rity
fo
r
act
ion
– w
ho
wil
l
take
fo
rwa
rd a
nd
by
wh
en
Re
leva
nt
Imp
rove
me
nt
Too
ls
Imp
rove
acc
ess
to
no
n-p
ha
rma
colo
gic
al i
nte
rve
nti
on
s
incl
ud
ing
evid
en
ce b
ase
d p
sych
olo
gic
al
the
rap
ies
Do
yo
u r
ou
tin
ely
co
lle
ct a
nd
an
aly
se i
nfo
rma
tio
n o
n
the
de
ma
nd
fo
r p
sych
olo
gic
al t
he
rap
ies
by
GP
pra
ctic
e?
DC
AQ
Do
yo
u k
no
w w
ha
t y
ou
r ca
pa
city
to
pro
vid
e
psy
cho
log
ica
l th
era
pie
s is
?
DC
AQ
Wis
em
an
Wo
rklo
ad
Me
asu
re
Ha
ve y
ou
co
mp
are
d y
ou
r ca
pa
city
wit
h y
ou
r d
em
an
d?
DC
AQ
Ha
ve y
ou
co
nsi
de
red
wa
ys
to e
xp
an
d t
he
ca
pa
city
of
curr
en
t re
sou
rce
s –
ie t
ele
ph
on
e s
up
po
rt, g
rou
p w
ork
etc
DC
AQ
Ha
ve y
ou
co
mp
are
d a
vera
ge
ne
w t
o f
oll
ow
-up
ra
tio
s
acr
oss
sta
ff m
em
be
rs a
nd
te
am
s w
ork
ing
wit
h
sim
ila
r cl
ien
t g
rou
ps.
If
the
re i
s si
gn
ific
an
t va
ria
tio
n,
do
yo
u u
nd
ers
tan
d t
he
re
aso
n w
hy
?4
Un
de
rsta
nd
ing
Va
ria
tio
n
Do
yo
u h
ave
a s
tan
da
rd o
n t
he
am
ou
nt
of
tim
e s
taff
sho
uld
sp
en
d i
n d
ire
ct p
ati
en
t co
nta
ct?5
Me
asu
rem
en
t
4P
lea
se n
ote
, we
are
no
t sa
yin
g n
ew
to
fo
llow
up
ra
tio
s sh
ou
ld b
e t
he
sa
me
fo
r e
very
pa
tie
nt
or
clie
nt
gro
up
. Clin
ica
l ne
ed
will
re
sult
in d
iffe
ren
ces.
Ho
we
ver
larg
e d
iffe
ren
ces
in a
vera
ge
ne
w t
o
follo
w-u
p r
ati
os
be
twe
en
sta
ff m
em
be
rs a
nd
te
am
s w
ork
ing
in a
sim
ilar
fie
ld a
re w
ort
hw
hile
exp
lori
ng
to
en
sure
th
ey a
re b
ase
d o
n p
ati
en
t n
ee
d.
5In
se
ttin
g a
ny
sta
nd
ard
, ca
re n
ee
ds
to b
e t
ake
n t
o b
ala
nce
th
e n
ee
d t
o m
axi
mis
e d
ire
ct p
ati
en
t co
nta
ct t
ime
wit
h t
he
imp
act
of
inte
nsi
ve w
ork
ing
on
an
ind
ivid
ua
l’s
me
nta
l we
llbe
ing
. Bu
rnin
g
sta
ff o
ut
is n
ot
an
eff
ect
ive
lon
g t
erm
str
ate
gy.
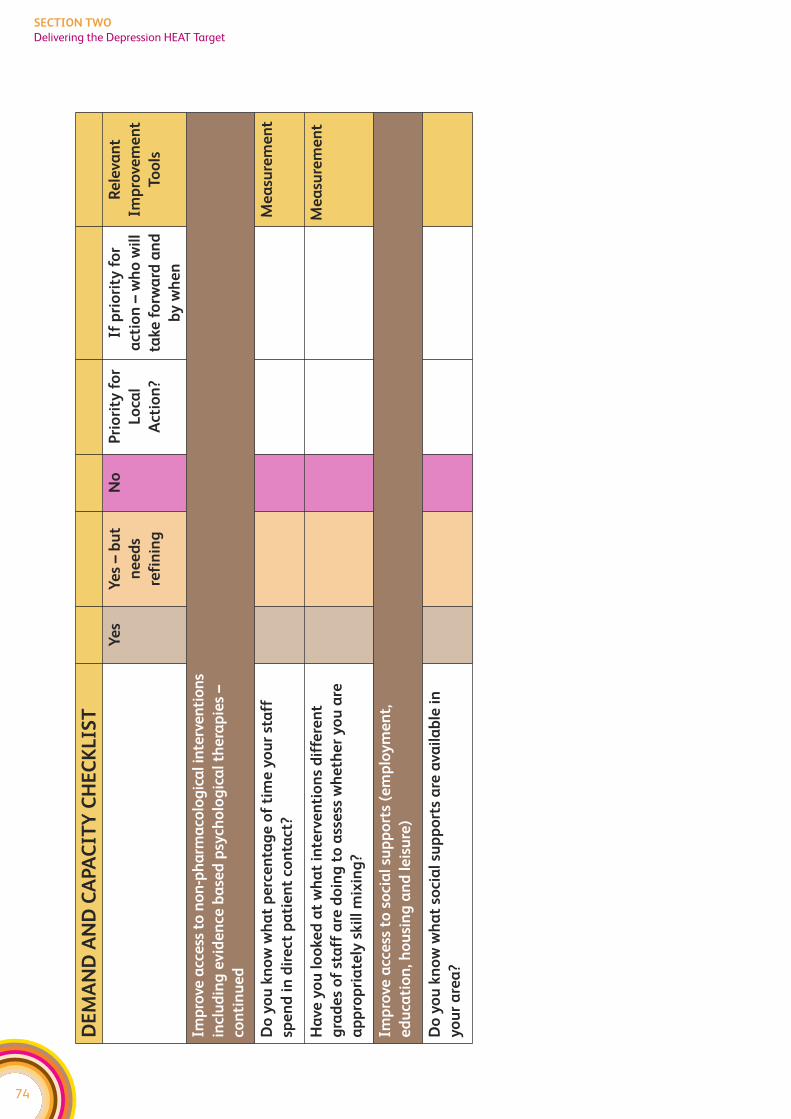
74
SECTION TWO
Delivering the Depression HEAT Target
DE
MA
ND
AN
D C
APA
CIT
Y C
HE
CK
LIS
T
Ye
sY
es
– b
ut
ne
ed
s
refi
nin
g
No
Pri
ori
ty f
or
Lo
cal
Act
ion
?
If p
rio
rity
fo
r
act
ion
– w
ho
wil
l
take
fo
rwa
rd a
nd
by
wh
en
Re
leva
nt
Imp
rove
me
nt
Too
ls
Imp
rove
acc
ess
to
no
n-p
ha
rma
colo
gic
al i
nte
rve
nti
on
s
incl
ud
ing
evid
en
ce b
ase
d p
sych
olo
gic
al
the
rap
ies
–
con
tin
ue
d
Do
yo
u k
no
w w
ha
t p
erc
en
tag
e o
f ti
me
yo
ur
sta
ff
spe
nd
in
dir
ect
pa
tie
nt
con
tact
?
Me
asu
rem
en
t
Ha
ve y
ou
lo
oke
d a
t w
ha
t in
terv
en
tio
ns
dif
fere
nt
gra
de
s o
f st
aff
are
do
ing
to
ass
ess
wh
eth
er
yo
u a
re
ap
pro
pri
ate
ly s
kil
l m
ixin
g?
Me
asu
rem
en
t
Imp
rove
acc
ess
to
so
cia
l su
pp
ort
s (e
mp
loy
me
nt,
ed
uca
tio
n, h
ou
sin
g a
nd
le
isu
re)
Do
yo
u k
no
w w
ha
t so
cia
l su
pp
ort
s a
re a
vail
ab
le i
n
yo
ur
are
a?

SECTION THREE:Improvement Tools
75
SECTION THREE
Process Mapping
PROCESS MAPPING
What is the Tool?
Health and Social care systems and processes are often complex and fragmented.
It is unlikely that a single member of staff would fully understand a complete
service user pathway or process. Process Mapping is a powerful tool to understand
how service users and information flows through the health and social care system,
and to demonstrate how various parts of the system link together.
The aim of process mapping is to involve a multi-disciplinary team to identify each step
of the current process, which may help to identify opportunities for improvement.
Furthermore, a process mapping event presents the opportunity for all members of the
team to identify issues with the current process and generate ideas for testing improvements.
The Mental Health Collaborative strongly recommends that service users and
carers are involved in the process mapping exercise.
The outcome is a map of the service user or information’s journey as a visual representation
– a picture or model – of the relevant procedures and administrative processes. The map
shows how things are and what happens, rather than what should happen. This helps
anyone involved see other people’s views and roles. It can also help you to diagnose
problems and identify areas for improvement.
There are different approaches to mapping service user journeys, procedures and
administrative processes in healthcare services. Which one you select will depend on:
f What you need to know
f Resources and timescales
f Engagement and interest of staff
Each one gives you a slightly different perspective and there is no definitive right or wrong.
The key is to reflect how things are – and not how they should be.
How to use it?
1. Prior to the Process Mapping Event:
f Define start and end point of process to be mapped;
f Invite all members of the multi-disciplinary team involved in that process to a
mapping event, including service user and carer representatives;
f Do not be too concerned if you can’t get all members of the multi-disciplinary team
to attend. After the event you can take the map to them;
f Send out some preparatory information on process mapping for participants to read
prior to the event.
The following resources may be required at the Process Mapping Event:
f Brown paper or flipcharts or wallpaper/lining paper;
f Post-it® notes (possible coloured for different types of issues);
f Marker pens;
f Sellotape.
2. At the event, start by outlining the process to be mapped and then encourage
participants to start writing their part of the process on Post-it® notes. Please note the
following:
f Process mapping events often require strong facilitation to keep people on track with
the task and prevent distractions caused by discussing the issues in detail;
f Encourage people to write issues and ideas for improvements on separate Post-it notes
and park them on a flipchart;
f Reinforce the importance of mapping the process as it usually happens, not the ideal
or how it should happen, but what happens for the majority of service users;
f Arrange the Post-it® notes to ensure they capture the service user journey in the
correct sequence;
f Where relevant capture times, delays, waits, hand-offs etc;
f Thank all participants for their involvement, and reinforce the need for a follow-up
meeting to agree the map and actions to be progressed;
Following on from the process mapping exercise, ensure you walk the service user
journey and continue to involve service users to gain an understanding of their
experience and to capture their ideas for improvement. Show the process map to the
relevant individuals from the multi-disciplinary team who were unable to attend the
event and encourage comments on current state as well as ideas for improvement.
Also, display the process map in the relevant clinical area and encourage all staff to
amend/update and put forward ideas for improvement. And finally, type up the process
map, issues and ideas and send out to all participants with a date for a follow-up
meeting quite soon afterwards, to maintain momentum.
3. Follow-up meeting recommended activities
It is often too time consuming to analyse the process map in the first meeting. It is
recommended that this is undertaken at a follow-up meeting which will allow relevant
information to be captured from other members of staff, service users and carers as well
as vital information from walking a service user journey.
76
SECTION THREE
Process Mapping
At the follow-up meeting it is advisable to start by analysing the process map. Consider
the following:
f How many times is the service user passed from one person another (hand off)?
f Where are delays, queues built into the process?
f Where are the bottlenecks?
f What are the longest delays?
f What is the approximate time taken for each step (task time)?
f What is the approximate time between each step (wait time)?
f What is the approximate time between the first and last step?
f How many steps are there for the service user?
f How many steps add no value for the service user? (see section on value and waste
for more information on this)
f Are there things that are done more than once?
f Look for rework loops
f Is work being batched?
f Where are the problems for the service user?
f At each step is the action being undertaken by the most appropriate staff member?
f Where are the problems for staff?
f Where is the greatest amount of time currently lost or wasted?
f Can any processes be carried out simultaneously?
f Consider what service users complain about.
f Whether any other teams might be affected should your team change its processes –
processes seldom work.
You don’t need to map everything: concentrate on the area where there is a gap in your
understanding, or which needs improvement. Ideally, you will know where the bottleneck
is before you go into more detailed mapping, as the information you need should be
slightly different.
Wherever possible, use photographs and pictures of places, staff and equipment in
mapping exercises. This brings your representation of ‘how things are’ to life. Also, try
and look beyond the pathway when mapping, as it’s often the same staff or resources
who look after service user before and after the first step of treatment.
Adapted from:
f http://member.goodpractice.net/ContinuousImprovementToolkit/resources/core-
improvement-tools/systems-and-processes.gp
f http://www.nodelaysachiever.nhs.uk/ServiceImprovement/Tools/IT220_A+
Comprehensive+Overview+of+Mapping+Processes+and+Patient+Journeys.htm
77
SECTION THREE
Process Mapping

Sample Process Maps and further information available at:
f NHS Scotland’s Centre for Change and Innovation covers measurement, analysis,
techniques and solutions for service improvement in health, including a section on
mapping at http://www.scotland.gov.uk/Resource/Doc/76169/0019037.pdf
f Tools, software and ideas for mapping are also available from
http://www.mindtools.com/pages/article/newPPM_03.htm
f Visit the CHAIN’s Lean Subgroup, which includes contacts and information about
improvement in healthcare at the website at http://chain.ulcc.ac.uk/chain/index.html
78
SECTION THREE
Process Mapping
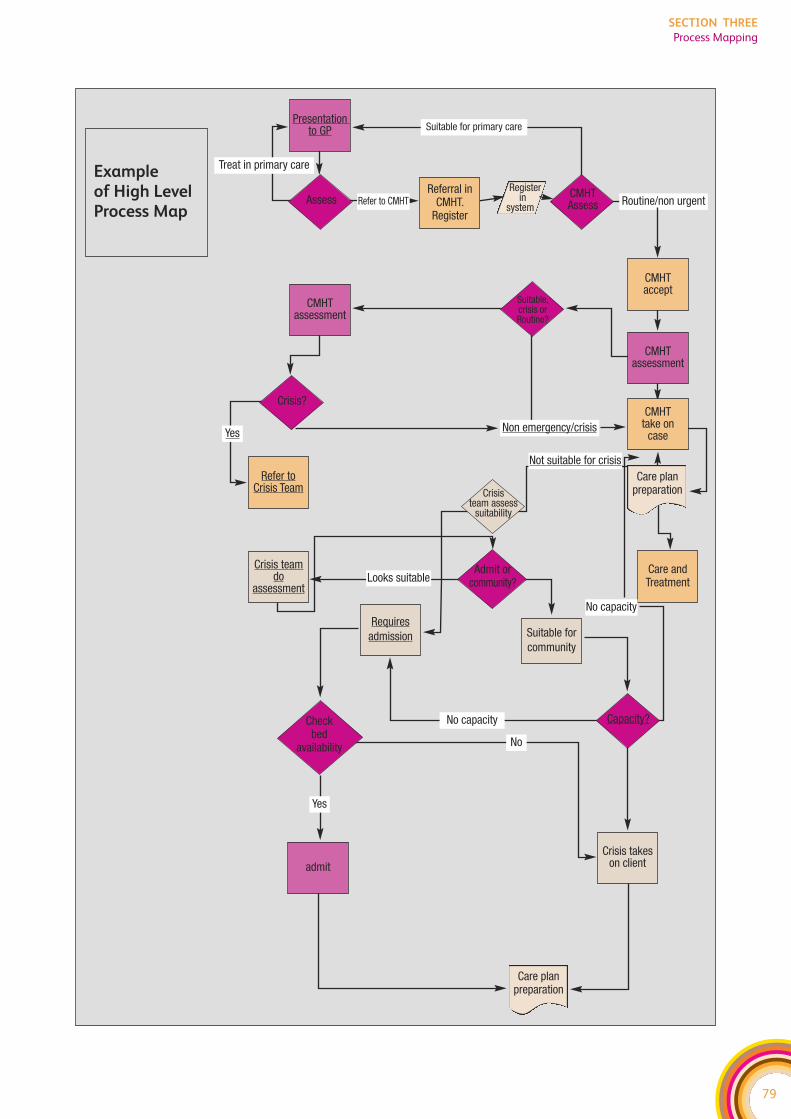
79
SECTION THREE
Process Mapping
Example of High LevelProcess Map
Register in
system
Care planpreparation
Care andTreatment
Refer toCrisis Team
Suitable for primary care
Assess Refer to CMHTReferral in
CMHT. Register
Routine/non urgentCMHTAssess
CMHT take on
caseNon emergency/crisis
No capacity
CMHTassessment
Suitable, crisis or Routine?
CMHT assessment
Care planpreparation
Looks suitableAdmit or
community?
Crisis team assess
suitability
Requiresadmission Suitable for
community
Capacity?Check bed
availability
admitCrisis takes
on client
Yes
No
No capacity
Crisis teamdo
assessment
Yes
Not suitable for crisis
Crisis?
CMHT accept
Treat in primary care
Presentation to GP

80
SECTION THREE
Process Mapping
IDENTIFYING VALUE AND WASTE
What is the Tool?
In healthcare systems, as in most other systems, there are value adding, non-value
adding and wasteful activities. Value-adding activities are those which service
users can easily identify as being an important part of their journey. Non-value
adding activities are those which are difficult for service users to identify as
being an important part of their journey. Wasteful activities are those which are
non value-adding and do not make any contribution to supporting the service
user journey.
It is important to identify the steps in the service user journey that add value, and also
the areas of waste, in order to create a flow that is effective and valuable through the
eyes of service users.
Waste-free activities are ones that:
f Are done right first time. It is important that the right care is delivered at the right
time, the first time and every time. So doing a test for a second time because the first
one was lost is a wasteful activity.
f Transform the service user in some way. There should be a direct result or outcome
for the service user (e.g. assessment of service user that leads to a plan of intervention).
The activity should help move the service user along the pathway, or the activity
should help add to the overall service user experience (e.g. effective communications
with the service user).
f The service user cares about. Waste-free activities are valuable in the eye of the
service user, e.g. an x-ray to enable diagnosis. One way to identify this is by asking
the service user.
How to use it?
Waste
Waste is anything that does not add real value for the service user and slows systems
down unnecessarily. Asking staff to stand back and analyse the systems in which they
work, the way they work, and the way their colleagues work can be a very useful exercise
to identify waste within the system.
There are seven commonly recognised types of waste that exist in service user journeys:
1. Waiting
Waits may manifest in different ways, for example waits for treatment, waits for
decisions, waits for transport, etc. It is important to continually seek to eliminate waits
by identifying where service users wait in your system. Think as well about who else
might be able to undertake activities, e.g. therapist-led discharge instead of consultants.
Look for where processes are not linked (so the service user arrives at the next process
before it is ready) and consider how they can be improved.
81
SECTION THREE
Identifying Value and Waste
2. Mistakes
Mistakes can not only directly impact on service user care, they can also cause harm to
service users and can lengthen the time it takes service users to be treated due to
unnecessary rework. It is vital that mistakes are identified and acted on as soon as
possible. This can be achieved in two ways:
f Building redundancy/check points into the system.
f Designing a system that enables people to do the right thing every time, e.g.
windowed envelopes for sending out service user letters – so that letters are always
sent to the right person.
3. Unco-ordinated activity
It is important that processes are linked across the service user journey and that each
stage of the process has effective communication/information links with the previous
stage of the journey. Unco-ordinated activity is where two parts of the service user journey
are not seamlessly joined together, for example, requesting a therapy assessment for a
service user who was previously discharged.
4. Stock
Stock refers to consumables, equipment or medical supplies. Too much equates to waste,
but too little can cause delays in service user treatment, which again is wasteful. Too much
or too little stock, and stock that is in the wrong place can inhibit staff from finding things
quickly, which is wasteful. It is important to store appropriate levels of stock where it is
easily identified and accessible.
5. Transportation
Transportation, for example of notes, information and materials add no value to the
service user, but may be necessary. Unnecessary transportation can be reduced. Consider
co-locating staff to encourage interaction. Also examine how communication and
information flows can be improved so that people pass on the relevant information to
the next person in the process, or input it into the appropriate recording system.
6. Unnecessary movement
Waste may occur, for example with staff who have to walk excessive distances between
wards to see service users; or it may be small wasteful movements repeated many times
a day, e.g. having to walk round a pillar to answer a phone. Staff searching for equipment,
notes, information etc. is unnecessary movement and is wasteful. Unnecessary movement
can be monitored through the use of pedometers and video recordings.
7. Inappropriate processing
Inappropriate processing is any activity that is unnecessary. Duplicating activity is waste,
e.g. recording data manually as well as electronically. Batching is an example of inefficient
processing. It is important to look for ways to reduce duplication and delays in the
service user’s journey.
82
SECTION THREE
Identifying Value and Waste
Conclusion
The identification of opportunities to reduce waste can produce numerous benefits to
both service users and staff in reducing frustration, rework, hunting and gathering. This
will ultimately lead to a more efficient and effective service user-focused service.
Adapted from
f http://member.goodpractice.net/ContinuousImprovementToolkit/resources/core-
improvement-tools/lean/documents/identifying-value-and-waste.gp
Further Reading
f Bicheno J (2004) ‘The New Lean Tool Box’ PICSIE Books, Buckingham.
f Hopp W and Spearman M (2000) ‘Factory Physics’ McGraw Hill, Boston.
f Rich N, Bateman N, Esain A, Massey L and Samuel D (2006) ‘Lean Evolutions’
Cambridge University Press, Cambridge.
f Rother and Shook (1999) ‘Learning to See’.
f Womack J and Jones D (1996) ‘Lean Thinking’ Simon and Schuster, New York.
f Womack J and Jones D (2005) ‘Lean Solutions’ Simon and Schuster, New York.
83
SECTION THREE
Identifying Value and Waste

84
SECTION THREE
Identifying Value and Waste
85
SECTION THREE
Demand, Capacity, Activity, Queue
DEMAND, CAPACITY, ACTIVITY, QUEUE (DCAQ)
What is the Tool?
Traditional models of healthcare process design tend to focus on improving a
particular department or part of the process in isolation, rather than achieving
a whole system improvement.
The philosophy underpinning today’s improvement thinking starts from a different
mindset to these historical performance improvement strategies. It is firmly grounded in
the view that the SYSTEM should be designed to function effectively and efficiently
with the ability to continuously improve. Therefore, utilising tools such as DCAQ allows
us to analyse systems and processes that support clinical activities.
The variation between demand and capacity is one of the main reasons why queues
occur in the NHS, because every time demand exceeds capacity, a queue is formed,
showing itself as a waiting list or backlog. Knowing what your demand is, and having the
right capacity at the right time to respond to it, is key to reducing overall service user
journey times.
Improvement of the service user’s journey (Flow) will not be made by having more staff,
more equipment and more facilities alone. Improvement will be achieved by:
f Taking a process view of service user FLOW, and following the service user journey
through the healthcare delivery SYSTEM;
f Working smarter by focusing on bottlenecks that prevent smooth service user flow, and
removing activities that do not add any value to service users;
f Understanding capacity and demand. Several studies have demonstrated that
continually adding capacity is not the answer to our problems;
f Managing and reducing sources of demand and capacity variation in service user flow.
Poor understanding of this variation is compounded by low yields at key resources
and by increases in resources at parts of the process that are not bottlenecks (that
results in excess activity without any increase in service user throughput);
f Segmenting service users according to specific needs;
f Implementing measurement systems that identify the true performance of the system
and the opportunities for improvement.
A first step in making improvements to service user flow is to look at bottlenecks in the
process. A bottleneck is often the stage in the process under most pressure; it creates
queues and slows down the whole process. It may be the most time consuming step in a
process, or it may be a functional bottleneck where two or more service user flows
converge at say a diagnostic unit.
A bottleneck determines the pace at which the whole process can work. If changes are
made to improve parts of the care process without addressing the bottleneck, improvement
projects are unlikely to succeed. The objective at all times must be to systematically identify
and then eliminate bottlenecks in the service user flow process.
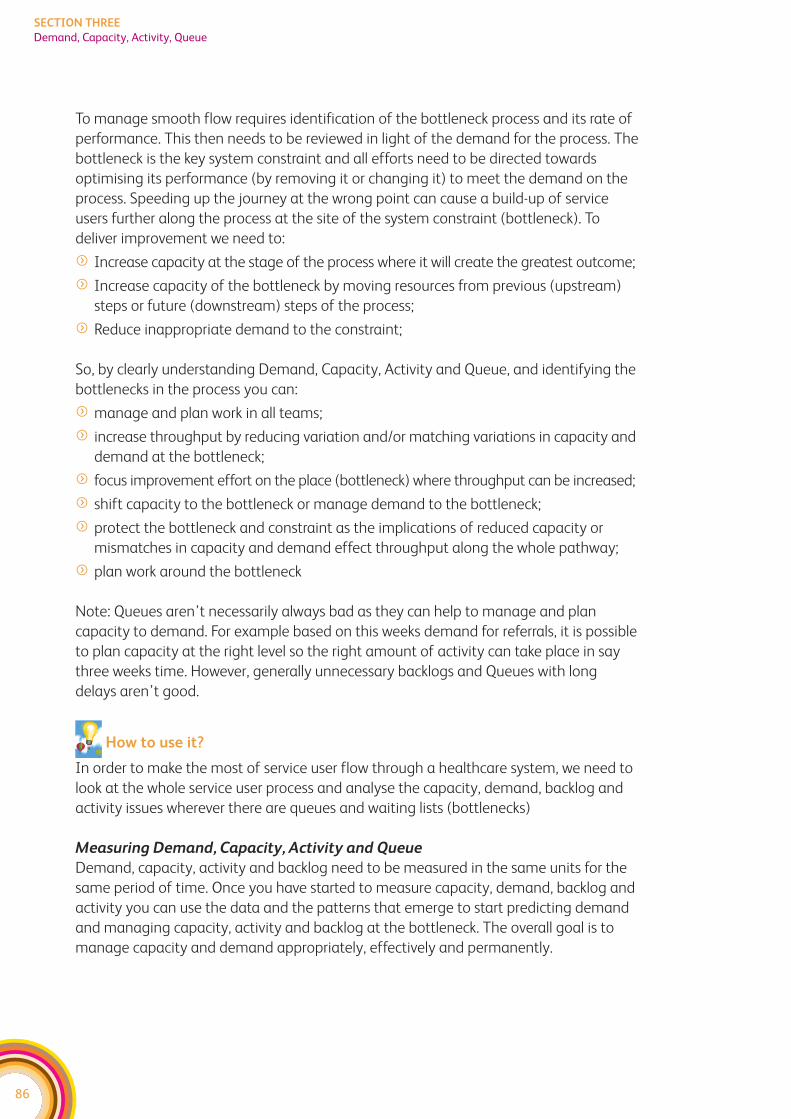
86
SECTION THREE
Demand, Capacity, Activity, Queue
To manage smooth flow requires identification of the bottleneck process and its rate of
performance. This then needs to be reviewed in light of the demand for the process. The
bottleneck is the key system constraint and all efforts need to be directed towards
optimising its performance (by removing it or changing it) to meet the demand on the
process. Speeding up the journey at the wrong point can cause a build-up of service
users further along the process at the site of the system constraint (bottleneck). To
deliver improvement we need to:
f Increase capacity at the stage of the process where it will create the greatest outcome;
f Increase capacity of the bottleneck by moving resources from previous (upstream)
steps or future (downstream) steps of the process;
f Reduce inappropriate demand to the constraint;
So, by clearly understanding Demand, Capacity, Activity and Queue, and identifying the
bottlenecks in the process you can:
f manage and plan work in all teams;
f increase throughput by reducing variation and/or matching variations in capacity and
demand at the bottleneck;
f focus improvement effort on the place (bottleneck) where throughput can be increased;
f shift capacity to the bottleneck or manage demand to the bottleneck;
f protect the bottleneck and constraint as the implications of reduced capacity or
mismatches in capacity and demand effect throughput along the whole pathway;
f plan work around the bottleneck
Note: Queues aren’t necessarily always bad as they can help to manage and plan
capacity to demand. For example based on this weeks demand for referrals, it is possible
to plan capacity at the right level so the right amount of activity can take place in say
three weeks time. However, generally unnecessary backlogs and Queues with long
delays aren’t good.
How to use it?
In order to make the most of service user flow through a healthcare system, we need to
look at the whole service user process and analyse the capacity, demand, backlog and
activity issues wherever there are queues and waiting lists (bottlenecks)
Measuring Demand, Capacity, Activity and Queue
Demand, capacity, activity and backlog need to be measured in the same units for the
same period of time. Once you have started to measure capacity, demand, backlog and
activity you can use the data and the patterns that emerge to start predicting demand
and managing capacity, activity and backlog at the bottleneck. The overall goal is to
manage capacity and demand appropriately, effectively and permanently.
87
SECTION THREE
Demand, Capacity, Activity, Queue
Demand – Mental Health Services often refer to demand as the number of referrals
received. However this is not the demand. Each referral is a request for clinical input so
demand is the total number of clinical hours provided in response to that request.
Hence demand is partly impacted by the type of service teams provide. An audit across
one community mental health area showed that differences in waiting lists between
teams were five times more to do with what they did with each case (ie differences in
number of sessions and duration) than the number of referrals the teams received.
f Actual demand. What we are asked for.
f Failure demand. What we have to do again as didn’t do right the first time
f Created demand. Demand we create because of way respond to needs
f Hidden demand. Demand that is out there but not currently presenting – ie those
who need psychological therapies but due to length of waiting lists are not referred
through.
f Total demand = actual + failure + created + hidden demand
Capacity – Resources available to do work which includes staff and any equipment needed
(such as rooms). Not all of the clinical staff time will be available for direct service user
contact as time will be spent travelling, on leave, at meetings etc. It is important to take
this into account when looking at your capacity.
Activity – All the work done. This does not necessarily reflect capacity or demand on a
day to day basis. The activity or the work done on say a Monday may be a result of some
of Mondays demand (i.e. emergency) and the previous weeks’ demand. The capacity is
the capacity available on the Monday but activity is often less than the available capacity.
Queue – Previous demand that has not yet been dealt with, showing itself as a backlog
of work or a waiting list. It’s logical, if you don’t deal with today’s demand today, there
will be a backlog for tomorrow.
Identifying backlog and queues
Queues occur where demand has not been dealt with and results in a backlog. The main
reason why a queue develops is the mismatch between variation in demand and capacity
at specific times, because the right people or equipment (e.g. suitable rooms to see
people in) are not always available to deal with the demand in a timely manner.
Every time the demand exceeds the capacity, a queue is formed. However, every time
the capacity exceeds the demand, the extra capacity is lost or it is filled from the queue.
So plans based on matching the average daily demand to the average daily capacity are
fundamentally flawed.
The diagram below illustrates how waiting lists may build up if demand for work exceeds
our capacity to do that work. Evidence suggests that our capacity to deal with work
varies more than the demand.
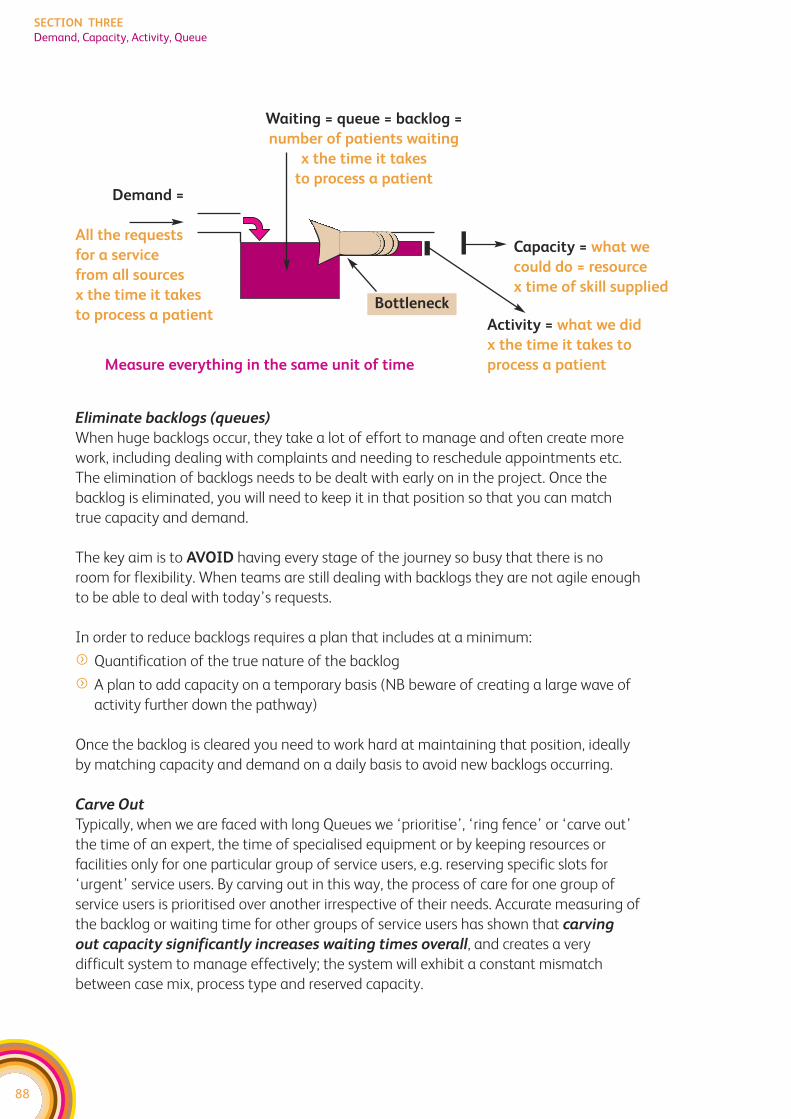
Eliminate backlogs (queues)
When huge backlogs occur, they take a lot of effort to manage and often create more
work, including dealing with complaints and needing to reschedule appointments etc.
The elimination of backlogs needs to be dealt with early on in the project. Once the
backlog is eliminated, you will need to keep it in that position so that you can match
true capacity and demand.
The key aim is to AVOID having every stage of the journey so busy that there is no
room for flexibility. When teams are still dealing with backlogs they are not agile enough
to be able to deal with today’s requests.
In order to reduce backlogs requires a plan that includes at a minimum:
f Quantification of the true nature of the backlog
f A plan to add capacity on a temporary basis (NB beware of creating a large wave of
activity further down the pathway)
Once the backlog is cleared you need to work hard at maintaining that position, ideally
by matching capacity and demand on a daily basis to avoid new backlogs occurring.
Carve Out
Typically, when we are faced with long Queues we ‘prioritise’, ‘ring fence’ or ‘carve out’
the time of an expert, the time of specialised equipment or by keeping resources or
facilities only for one particular group of service users, e.g. reserving specific slots for
‘urgent’ service users. By carving out in this way, the process of care for one group of
service users is prioritised over another irrespective of their needs. Accurate measuring of
the backlog or waiting time for other groups of service users has shown that carving
out capacity significantly increases waiting times overall, and creates a very
difficult system to manage effectively; the system will exhibit a constant mismatch
between case mix, process type and reserved capacity.
88
SECTION THREE
Demand, Capacity, Activity, Queue
Waiting = queue = backlog =
number of patients waiting
x the time it takes
to process a patientDemand =
All the requests
for a service
from all sources
x the time it takes
to process a patient
Measure everything in the same unit of time
Bottleneck
Capacity = what we
could do = resource
x time of skill supplied
Activity = what we did
x the time it takes to
process a patient
89
SECTION THREE
Demand, Capacity, Activity, Queue
This means that Carve out worsens both queues and waiting times because:
f Slots reserved for urgent service users may not be filled, creating greater capacity loss;
f Carved out spaces are misused, being filled by non-urgent service users;
f If service users are not seen in chronological order variation and maximum waiting
times will increase;
f Frustrated service users and clinicians will ‘game the system’ typically labelling every
request urgent in order to jump a continually climbing ‘routine’ queue.
An alternative may be Segmentation, which is about the separation of the whole process
of care for one group, to improve the overall flow of service users, but not at the expense
of other service users. Segmentation identifies service users with similar needs and or
preferences and groups them together.
Matching Demand and Capacity
Once the backlog has been eliminated, the next aim is to ensure that demand and capacity
are in equilibrium. This requires that capacity and demand are matched. Matching of
(service) capacity to (service user) demand is critical to ensure access to every stage of
the service user journey. The capacity of the system needs to be flexible enough to cope
with small changes in daily demand. There are two key strategies, which are outlined below,
and at this time we also need to start thinking about possibilities to reduce demand, or
increase capacity:
Thinking about – reducing demand:
f Should we see all these service users? – implement protocols
f Who is appropriate to see them? – provide alternatives
f Do we need to see them for as long as we are? – caseload management
f Can the service user pathway or the process at the bottleneck be streamlined? (Do
we need to do all these steps?)
f Reduce waiting lists – reduce the demands they create
f Prevention and service user education
Thinking about – extending capacity:
f look for ways of gaining capacity within the system – for instance can you reduce your
sickness rates, can you reduce time spent travelling, can you reduce time in meetings,
is your skill mix right or do you have very expensive staff doing basic admin duties?
f look for ways of increasing the flexibility of the capacity so you have it available at
the right time – for instance, can you organise your service so discharges from
inpatient user units are done daily?
f Reduce the number of appointment types to reduce complexity/carve out!
f Bid for resources only when constraint is equipment or staff and working differently
will not help
Adapted from
f http://member.goodpractice.net/content.htm?id=29b53fe7-5362-0024-9d1e-
0019b9df0ed9&format=rtf
f http://www.nodelaysachiever.nhs.uk/ServiceImprovement/Tools/IT247_Demand
andCapacityBasicConcepts.htm
f http://www.nodelaysachiever.nhs.uk/ServiceImprovement/Tools/IT052_Demand
andCapacityAComprehensiveGuide.htm
Spread sheets for modelling DCAQ are available at
f http://www.nodelaysachiever.nhs.uk/Resources/ResourceGuideItems/Demand+and
+Capacity+Spreadsheet.htm
f www.steyn.org.uk
f Mental Health specific spreadsheets are available from your Regional Service
Improvement Manager or Regional Information Manager. These are currently in
testing phase.
Further reading
f Bicheno J (2004) ‘The New Lean Tool Box’, PICSIE Books, Buckingham Goldratt E
(1990) ‘The Theory of Constraints’, North River Press, New York Hopp W and
Spearman M (2000) ‘Factory Physics’, McGraw Hill, Bosto
f www.goldratt.com
f NHS Modernisation Agency Capacity and Demand Improvement Leaders Guide 2003.
f Sylvester et al; Reducing Waiting Times in the NHS: is Lack of capacity the Problem?
(Sylvester et al September 2003)
90
SECTION THREE
Demand, Capacity, Activity, Queue
91
SECTION THREE
Statistical Process Control
STATISTICAL PROCESS CONTROL
What is the Tool?
Statistical Process Control (SPC) is a statistical tool based on robust methodology
that uses data to analyse and understand the inherent variation within processes
and systems.
S – Statistical, because we use some statistical concepts to help us understand
processes
P – Process, because we deliver our work through processes, ie how we do things
C – Control, by this we mean predictable
SPC can help in virtually all aspects of managing healthcare. From monitoring of waiting
times for a Board, to monitoring prescribing on a ward, SPC provides a way of separating
the ‘information’ from the ‘noise’ so that managers and clinicians can understand what
is going on. It does this by providing a mathematical basis for establishing the upper
and lower limits of variation in processes that occur normally. Too often decisions are
made without knowing whether changes in data are due to actions taken, or merely
due to chance.
Two of the simplest SPC techniques to implement are the run chart and control chart.
The purpose of these two techniques is to identify when a process is displaying strange
or unusual behaviour. Formally, the purpose of the run chart and the control chart is to
distinguish between two sorts of variation that a process can exhibit, namely common
cause variation and special cause variation. Common cause variation is normal
and expected. Special cause variation produces unusual or unexpected variations for
the system. As special cause variations occur only occasionally, they need to be
addressed differently from common cause variations. This is to prevent anyone from
making unnecessary changes or tampering with a system that works well.
Run charts are a significant improvement over traditional reporting techniques, because
they introduce the concept of changes over time. In order to manage a trend it is
necessary to go one step further and ask, ‘Is the change in the run chart due to a
change in the process, or is it simply due to random fluctuation?’ To do this, the trend
must be separated from the ‘noise’ resulting from random variation.
Much damage can be done by assuming a monthly change is the break in a trend, or
represents a change resulting from action taken last month, when in fact it represents
the effect of routine variation caused by random factors.
This is where control charts come in. The control chart is a type of run chart. The aim of
a run chart is to look for changes in performance over time. The aim of a process control
chart is to show whether the changes seen in the run chart are as a result of routine
variation in the process or the result of exceptional variation, ie an indication that
something in the process has changed. From the separation of routine exceptional
variation it is possible to determine whether the changes in data represent changes in
performance or simply the normal variability of the system.
How to use it?
If you want a free excel based SPC chart generator please contact your Regional
Service Improvement Manager or Information Manager for the Mental Health
Collaborative.
SPC charts enable you to identify whether variation is common or special cause. When
you are interpreting SPC charts there are 4 rules that help you identify what the system
is doing. If one of the rules has been broken, this means that ‘special cause’ variation is
present in the system. It is also perfectly normal for a process to show no signs of special
cause. This means that only ‘common cause’ variation is present.
Rule 1 Any point outside one of the control limits.
Rule 2 A run of seven points all above or all below the centre line, or all increasing or
decreasing.
Rule 3 Any unusual pattern or trends within the control limits.
Rule 4 The number of points within the middle third of the region between the control
limits differs markedly from two-thirds of the total number of points.
If you want a more efficient system, you need to reduce the variation. Common causes
and special causes of variation indicate the need for two different types of improvement
which can help you achieve this.
f If controlled variation (common cause) is displayed in the SPC chart, the process is
stable and predictable, which means that the variation is inherent in the process. If
you want to improve the process, you will have to change the whole system.
f If uncontrolled variation (special cause) is displayed in the SPC chart, the process is
unstable and unpredictable. Variation may be caused by factors outside the process.
In this case, you need to identify these sources and resolve them, rather than change
the system itself.
92
SECTION THREE
Statistical Process Control
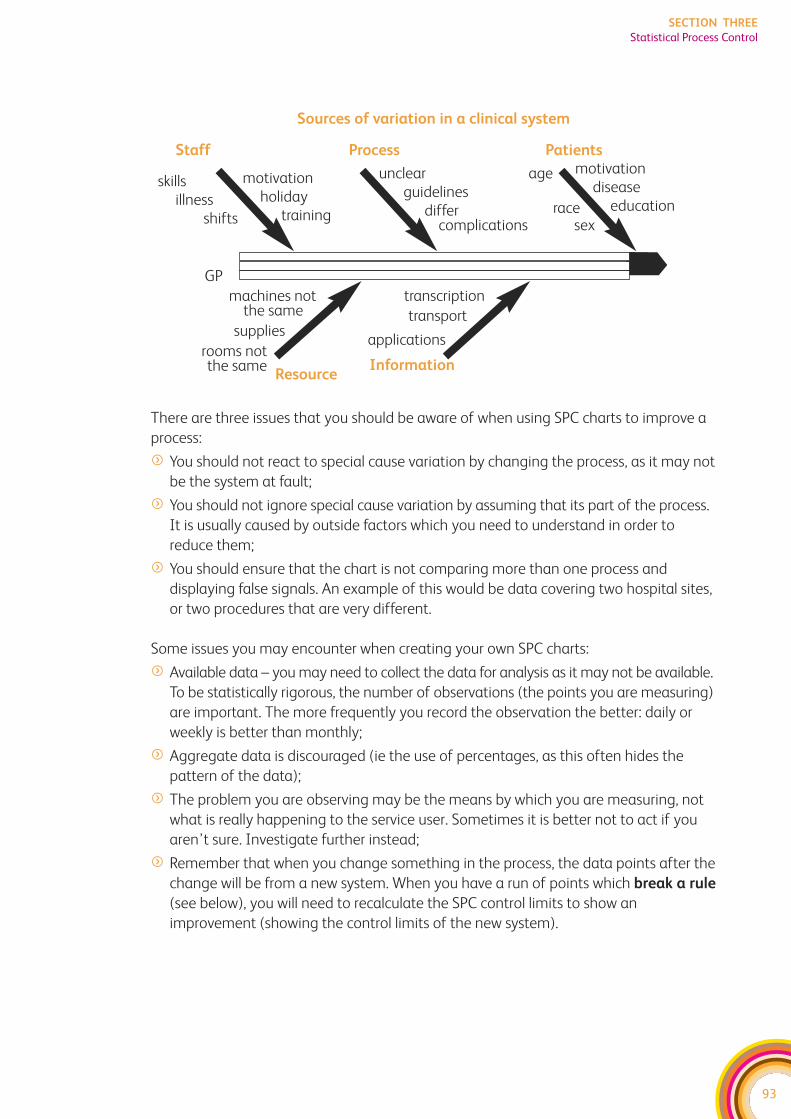
93
SECTION THREE
Statistical Process Control
There are three issues that you should be aware of when using SPC charts to improve a
process:
f You should not react to special cause variation by changing the process, as it may not
be the system at fault;
f You should not ignore special cause variation by assuming that its part of the process.
It is usually caused by outside factors which you need to understand in order to
reduce them;
f You should ensure that the chart is not comparing more than one process and
displaying false signals. An example of this would be data covering two hospital sites,
or two procedures that are very different.
Some issues you may encounter when creating your own SPC charts:
f Available data – you may need to collect the data for analysis as it may not be available.
To be statistically rigorous, the number of observations (the points you are measuring)
are important. The more frequently you record the observation the better: daily or
weekly is better than monthly;
f Aggregate data is discouraged (ie the use of percentages, as this often hides the
pattern of the data);
f The problem you are observing may be the means by which you are measuring, not
what is really happening to the service user. Sometimes it is better not to act if you
aren’t sure. Investigate further instead;
f Remember that when you change something in the process, the data points after the
change will be from a new system. When you have a run of points which break a rule
(see below), you will need to recalculate the SPC control limits to show an
improvement (showing the control limits of the new system).
Sources of variation in a clinical system
Staff Process Patients
skillsillness
shifts
machines not the same
supplies
rooms not the same
GP
Resource
motivationholiday
training
unclearguidelines
differcomplications
age
racesex
motivationdisease
education
transcription
transport
applications
Information
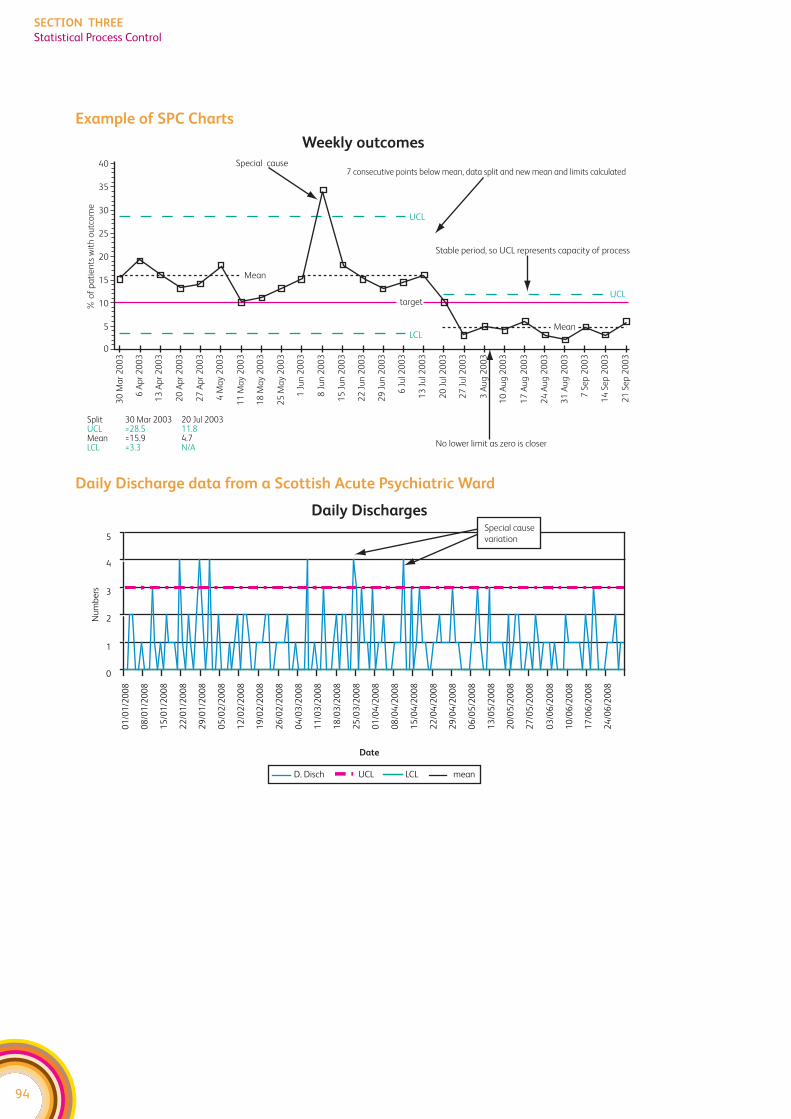
Example of SPC Charts
Daily Discharge data from a Scottish Acute Psychiatric Ward
94
SECTION THREE
Statistical Process Control
Weekly outcomesSpecial cause
Mean
40
% o
f p
ati
en
ts w
ith
ou
tco
me
35
30
25
20
15
10
5
0
Split 30 Mar 2003 20 Jul 2003UCL =28.5 11.8Mean =15.9 4.7LCL =3.3 N/A
30
Ma
r 2
00
3
6 A
pr
20
03
13
Ap
r 2
00
3
20
Ap
r 2
00
3
27
Ap
r 2
00
3
4 M
ay
20
03
11
Ma
y 2
00
3
18
Ma
y 2
00
3
25
Ma
y 2
00
3
1 J
un
20
03
8 J
un
20
03
15
Ju
n 2
00
3
22
Ju
n 2
00
3
29
Ju
n 2
00
3
6 J
ul 2
00
3
13
Ju
l 20
03
20
Ju
l 20
03
27
Ju
l 20
03
3 A
ug
20
03
10
Au
g 2
00
3
17
Au
g 2
00
3
24
Au
g 2
00
3
31
Au
g 2
00
3
7 S
ep
20
03
14
Se
p 2
00
3
21
Se
p 2
00
3
target
No lower limit as zero is closer
Mean
Stable period, so UCL represents capacity of process
UCL
LCL
UCL
7 consecutive points below mean, data split and new mean and limits calculated
Daily Discharges
Date
0
1
2
3
4
5
01
/01
/20
08
08
/01
/20
08
15
/01
/20
08
22
/01
/20
08
29
/01
/20
08
05
/02
/20
08
12
/02
/20
08
19
/02
/20
08
26
/02
/20
08
04
/03
/20
08
11
/03
/20
08
18
/03
/20
08
25
/03
/20
08
01
/04
/20
08
08
/04
/20
08
15
/04
/20
08
22
/04
/20
08
29
/04
/20
08
06
/05
/20
08
13
/05
/20
08
20
/05
/20
08
27
/05
/20
08
03
/06
/20
08
10
/06
/20
08
17
/06
/20
08
24
/06
/20
08
Nu
mb
ers
D. Disch UCL LCL mean
Special cause
variation
95
SECTION THREE
Statistical Process Control
Adapted from
f http://member.goodpractice.net/content.htm?id=ab7f41cd-5362-0024-9d1e-
0019b9df0ed9&format=rtf
f http://www.nodelaysachiever.nhs.uk/ServiceImprovement/Tools/IT16_spc.htm
Sample SPC Charts and further information available at:
f The Clinical Indicators Support Team has produced an SPC chart package and
tutorial that can be accessed at: http://www.indicators.scot.nhs.uk/SPC/SPC.html
f They have also developed workshops presentations that can be accessed at:
http://www.indicators.scot.nhs.uk/Workshops/SPC.html
f The Institute for Innovation and Improvement have developed SPC packages which
are available at: http://www.nodelaysachiever.nhs.uk/NR/rdonlyres/84CC2E80-A839-
4952-A64A-8B9FC73BAFC1/0/SPCgenerator.xls
Further Reading
f Bicheno and Catherwood ‘Six Sigma and the Total Quality Toolbox’ Picsie Books,
2005
f Donald Wheeler ‘Understanding Variation’ Knoxville: SPC Press Inc, 1995
f Donald Wheeler ‘Making Sense of Data. SPC for the Service Sector’ Knoxville, SPC
Press Inc, 2003
f Walter A Shewhart ‘Economic Control of Quality of Manufactured Product’ New York,
D Van Nostrand 1931
f W E Deming ‘Out of the Crisis’ Massachusetts: MIT 1986
f Donald M Berwick ‘Controlling Variation in Health Care: a Consultation from Walter
Shewhart’ Med Care 1991; 29: 1212-25.
f Esain, A ‘Problem Solving, TQM and Six Sigma’ in Rich, Batemen, Esain, Massey and
Samuel (2006)
f ‘Lean Evolution: Lessons from the Workplace’ Cambridge University Press

96
SECTION THREE
Statistical Process Control
MODEL FOR IMPROVEMENT (PDSA)
What is the Tool?
The Model for Improvement (PDSA Cycle) is a tried and tested framework for
developing, testing and implementing changes that lead to improvement. The
Model was developed for use in healthcare systems by the Institute for Healthcare
Improvement based in the USA. It has been widely used to deliver improvements
in healthcare systems throughout Europe and the USA. It is popular with clinicians
and managers because it is simple to use.
The model offers the following benefits:
f It is a simple approach that anyone can apply
f It reduces risk by starting small
f Changes can be focused at the operational level around your teams needs
f It supports rapid cycles of improvement
f It is highly effective, changes are quick and immediately evident
f It is a powerful tool for learning. As much is learned from ideas that don't work as
from those that do
f Where people have been involved in testing and developing ideas there is often less
resistance on implementation
f It can also be used to support the implementation of large scale strategic plans
How to use it?
PDSA Cycles are small scale, reflective tests used to try out ideas for improvement. They
should be repeated and built on using learning from each test cycle to refine the
improvement idea.
1. Plan. What are you trying to accomplish? How will you know that a change is an
improvement? What will be done, who will do it, in what timescales. You may need to
collect data to inform your study of the change.
2. Do. This is the stage where the plan is put into action. Remember to keep it small and
manageable, i.e. one service user, one doctor, one nurse, one day.
3. Study. At this stage, the cycle is reviewed and reflected on with all relevant stakeholders.
Any data collected will be analysed. Any ideas for improvements to the cycle should
be raised prior to re-testing.
4. Act. It may be that the cycle should be tested again unchanged under different
conditions, i.e. different service user, doctor, nurse or day of the week. Alternatively,
you may decide to amend your plan to reflect learning from first cycle and re-test.
If all has gone well, you may decide to roll your change out.
97
SECTION THREE
Model for Improvement
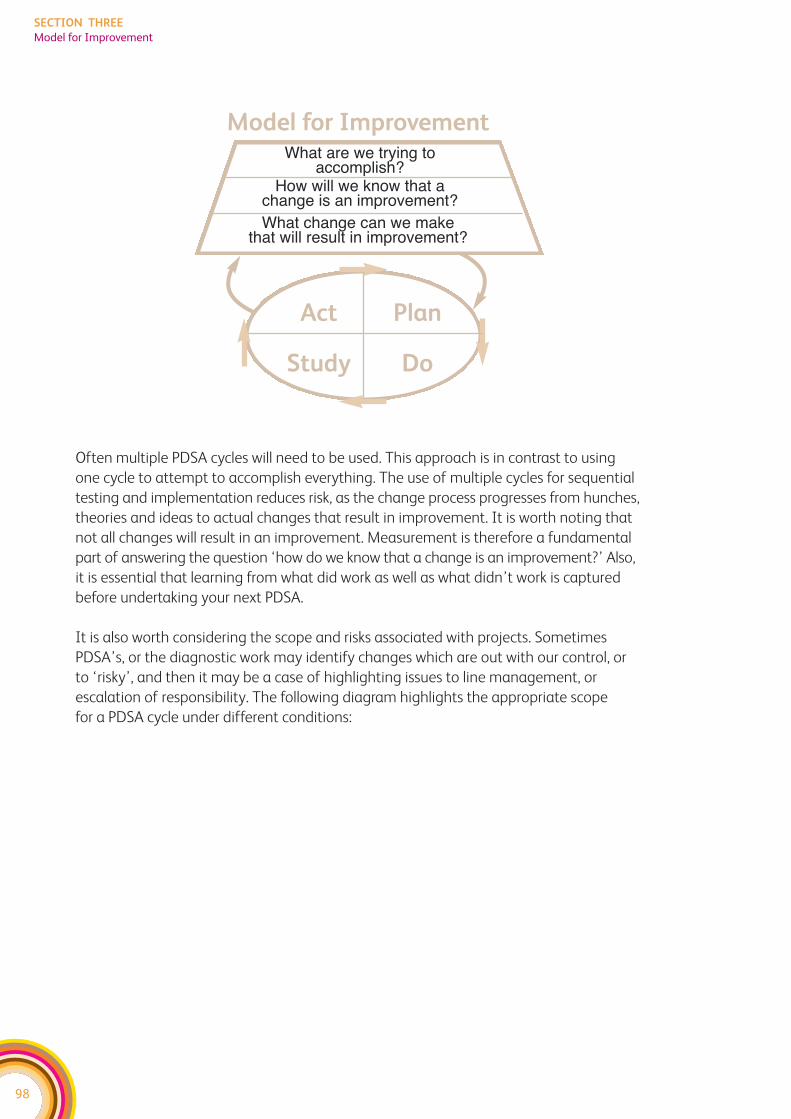
Often multiple PDSA cycles will need to be used. This approach is in contrast to using
one cycle to attempt to accomplish everything. The use of multiple cycles for sequential
testing and implementation reduces risk, as the change process progresses from hunches,
theories and ideas to actual changes that result in improvement. It is worth noting that
not all changes will result in an improvement. Measurement is therefore a fundamental
part of answering the question ‘how do we know that a change is an improvement?’ Also,
it is essential that learning from what did work as well as what didn’t work is captured
before undertaking your next PDSA.
It is also worth considering the scope and risks associated with projects. Sometimes
PDSA’s, or the diagnostic work may identify changes which are out with our control, or
to ‘risky’, and then it may be a case of highlighting issues to line management, or
escalation of responsibility. The following diagram highlights the appropriate scope
for a PDSA cycle under different conditions:
98
SECTION THREE
Model for Improvement
Model for ImprovementWhat are we trying to
accomplish?How will we know that a
change is an improvement?What change can we make
that will result in improvement?
Act Plan
Study Do
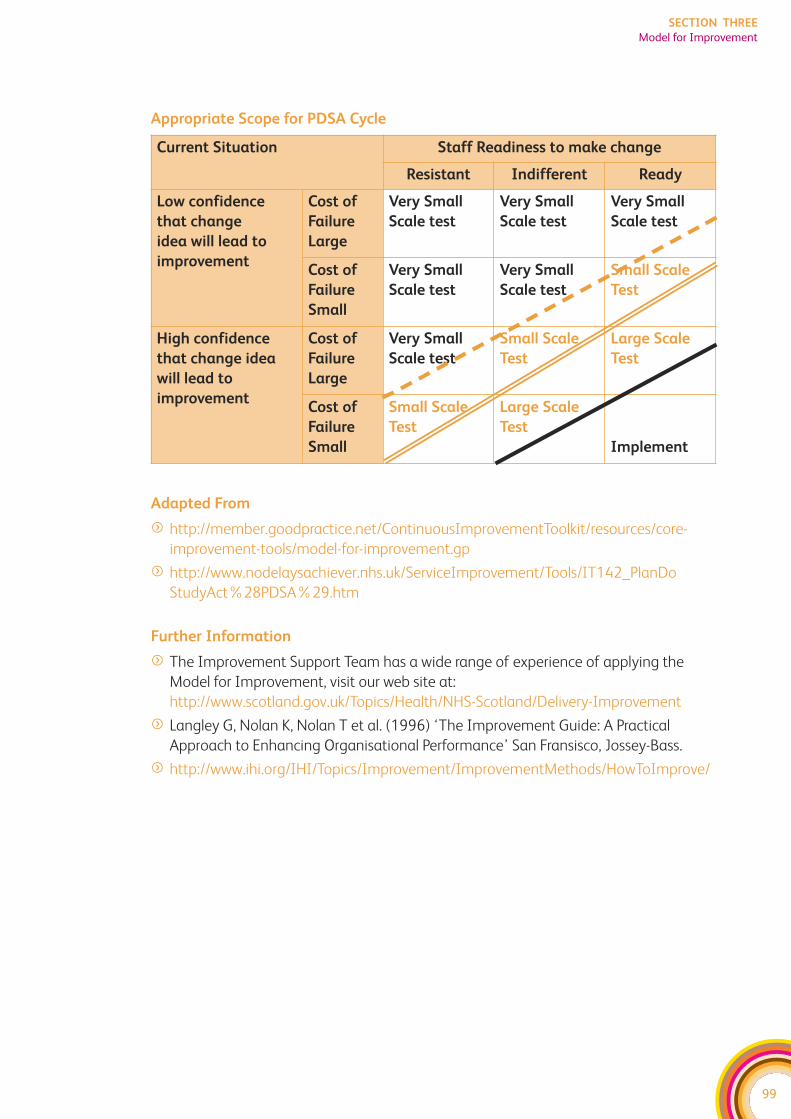
Appropriate Scope for PDSA Cycle
Adapted From
f http://member.goodpractice.net/ContinuousImprovementToolkit/resources/core-
improvement-tools/model-for-improvement.gp
f http://www.nodelaysachiever.nhs.uk/ServiceImprovement/Tools/IT142_PlanDo
StudyAct%28PDSA%29.htm
Further Information
f The Improvement Support Team has a wide range of experience of applying the
Model for Improvement, visit our web site at:
http://www.scotland.gov.uk/Topics/Health/NHS-Scotland/Delivery-Improvement
f Langley G, Nolan K, Nolan T et al. (1996) ‘The Improvement Guide: A Practical
Approach to Enhancing Organisational Performance’ San Fransisco, Jossey-Bass.
f http://www.ihi.org/IHI/Topics/Improvement/ImprovementMethods/HowToImprove/
99
SECTION THREE
Model for Improvement
Current Situation Staff Readiness to make change
Resistant Indifferent Ready
Low confidence
that change
idea will lead to
improvement
Cost of
Failure
Large
Very Small
Scale test
Very Small
Scale test
Very Small
Scale test
Cost of
Failure
Small
Very Small
Scale test
Very Small
Scale test
Small Scale
Test
High confidence
that change idea
will lead to
improvement
Cost of
Failure
Large
Very Small
Scale test
Small Scale
Test
Large Scale
Test
Cost of
Failure
Small
Small Scale
Test
Large Scale
Test
Implement

100
SECTION THREE
Model for Improvement
101
SECTION THREE
Service User Stories
SERVICE USER STORIES
What is the Tool?
Stories are more than just a listing of random incidents and anecdotes. They have
a beginning, middle, and end and they include characters who convey feelings and
communicate ideas. This facilitates an insight into what it feels like to be on the
receiving end of services, and that makes them powerful tools to create recognition
for the need to change, and discomfort with the status quo. It also helps to place the
service user and their needs at the centre of any discussion, and hence can be used to
improve services.
How to use it?
There is no one right way of collecting service users’ views: different methods suit different
purposes. However, it is important that to use a method appropriate to the group of
service users involved, and the planned service improvement. Four of the main methods
of obtaining service user perspectives: questionnaires, focus groups, semi-structured
interviews and service user shadowing, are described below.
1. Questionnaires
A questionnaire is a straightforward way of getting information from lots of people.
Easy to administer, they can capture the perceptions and experiences of service users,
users, and carers. They can also be used to measure levels of satisfaction with a process
or service. Questionnaires are useful for measuring baseline information, and to evaluate
change over time.
2. Focus groups
A focus group is an informal collection of people sharing common characteristics. They
meet to discuss and debate their experiences about a specific topic or problem e.g.
service users who have recently visited the department. They are a useful way to listen
to a wide range of experiences about a single area.
3. Semi-structured service user interviews
Semi-structured one to one interviews are used to collect qualitative data. They aim to
understand the respondent’s point of view rather than make generalisations. The
interviewer can delve more deeply and ask why. This often yields more information and
emotional response than a questionnaire. The service user also has the opportunity to
ask for clarification, and highlight ‘their’ most significant issues or needs. They are
however, more time consuming to conduct.
102
SECTION THREE
Service User Stories
4. Service user shadowing
This is when a member of staff or volunteer accompanies the service user on their
journey through the health and social care system. Preferably, the shadower will
be unfamiliar with the process and should also be comfortable asking 'why?’.
It provides objective, observational feedback that needs to be balanced by other
approaches, for example by obtaining the views of the staff providing the service.
Using this technique, a service user movement record in time and space can
be developed, as well as capturing perceptions of the service. This enables a
comprehensive picture of movement, combined with a flow diagram of actions
and a qualitative perception of the process, to be developed. While the service user
is being shadowed, their shadower can use interview techniques and observation
to supplement the information provided by the service user, to develop a richer,
more detailed picture.
Adapted from
f http://www.nodelaysachiever.nhs.uk/ServiceImprovement/Tools/IT080_Listening_
to_patient_perspectives.htm
f http://www.healthliteracy.com/article.asp?PageID=3809
Further Reading
f Wheeler, Rosie ‘Making a Difference: Stories from the Point of Care’, AORN Journal,
Feb, 2007 http://www.pickereurope.org/page.php?id=6
103
SECTION THREE
Service User Stories
FURTHER INFORMATION ON IMPROVEMENT TOOLS ANDTECHNIQUES
By accessing the following websites you will find further information on the tools and
techniques described in this ‘toolkit’ and used in service improvement including
examples of case studies:
www.goodpractice.net
www.goldratt.org.uk
www.institute.nhs.uk
www.ihi.org/ihi
www.improvementfoundation.org
www.nodelaysscotland.scot.nhs.uk
www.scotland.gov.uk/Publications
www.steyn.org.uk
www.tin.nhs.uk
www.wise.nhs.uk
To access The Continuous Improvement Toolkit please visit:
www.scotland.gov.uk/Topics/Health/NHS-Scotland/Delivery-Improvement

104
SECTION THREE
Service User Stories

SECTION FOUR:Contacts
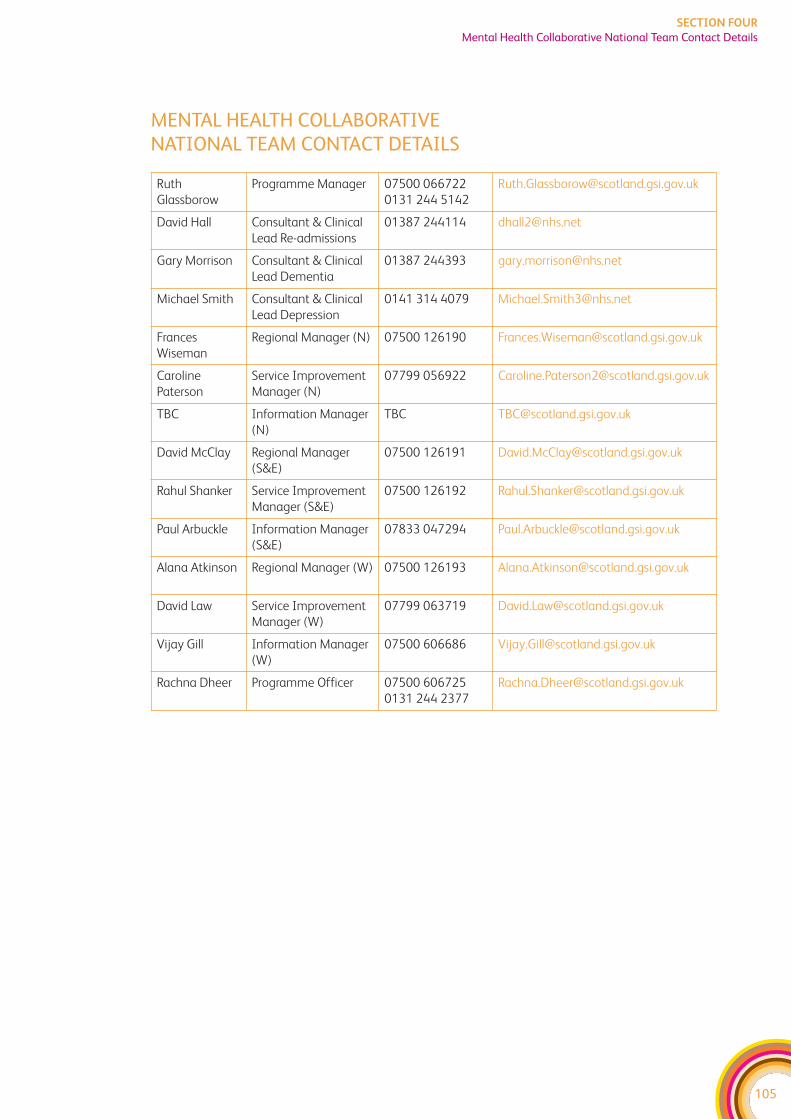
105
SECTION FOUR
Mental Health Collaborative National Team Contact Details
MENTAL HEALTH COLLABORATIVE NATIONAL TEAM CONTACT DETAILS
Ruth
Glassborow
Programme Manager 07500 066722
0131 244 5142
David Hall Consultant & Clinical
Lead Re-admissions
01387 244114 [email protected]
Gary Morrison Consultant & Clinical
Lead Dementia
01387 244393 [email protected]
Michael Smith Consultant & Clinical
Lead Depression
0141 314 4079 [email protected]
Frances
Wiseman
Regional Manager (N) 07500 126190 [email protected]
Caroline
Paterson
Service Improvement
Manager (N)
07799 056922 [email protected]
TBC Information Manager
(N)
David McClay Regional Manager
(S&E)
07500 126191 [email protected]
Rahul Shanker Service Improvement
Manager (S&E)
07500 126192 [email protected]
Paul Arbuckle Information Manager
(S&E)
07833 047294 [email protected]
Alana Atkinson Regional Manager (W) 07500 126193 [email protected]
David Law Service Improvement
Manager (W)
07799 063719 [email protected]
Vijay Gill Information Manager
(W)
07500 606686 [email protected]
Rachna Dheer Programme Officer 07500 606725
0131 244 2377

106
SECTION FOUR
Mental Health Collaborative National Team Contact Details

SECTION FIVE:Glossary
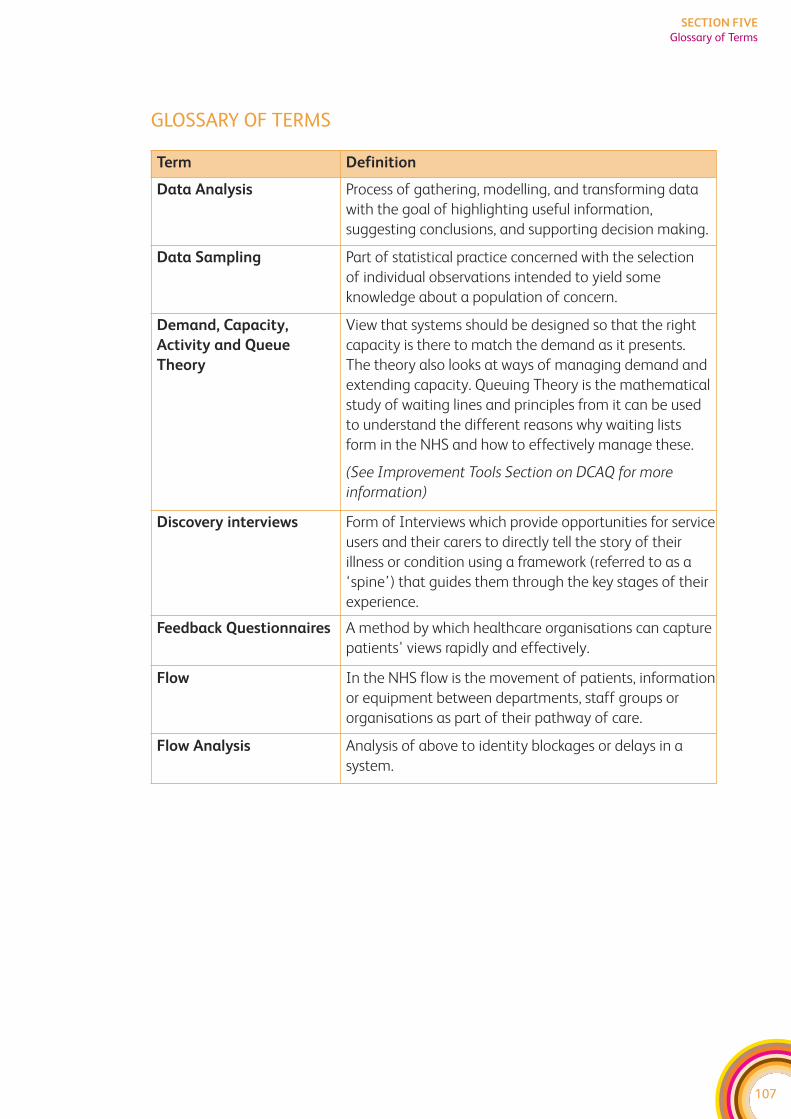
107
SECTION FIVE
Glossary of Terms
GLOSSARY OF TERMS
Term Definition
Data Analysis Process of gathering, modelling, and transforming data
with the goal of highlighting useful information,
suggesting conclusions, and supporting decision making.
Data Sampling Part of statistical practice concerned with the selection
of individual observations intended to yield some
knowledge about a population of concern.
Demand, Capacity,
Activity and Queue
Theory
View that systems should be designed so that the right
capacity is there to match the demand as it presents.
The theory also looks at ways of managing demand and
extending capacity. Queuing Theory is the mathematical
study of waiting lines and principles from it can be used
to understand the different reasons why waiting lists
form in the NHS and how to effectively manage these.
(See Improvement Tools Section on DCAQ for more
information)
Discovery interviews Form of Interviews which provide opportunities for service
users and their carers to directly tell the story of their
illness or condition using a framework (referred to as a
‘spine’) that guides them through the key stages of their
experience.
Feedback Questionnaires A method by which healthcare organisations can capture
patients' views rapidly and effectively.
Flow In the NHS flow is the movement of patients, information
or equipment between departments, staff groups or
organisations as part of their pathway of care.
Flow Analysis Analysis of above to identity blockages or delays in a
system.
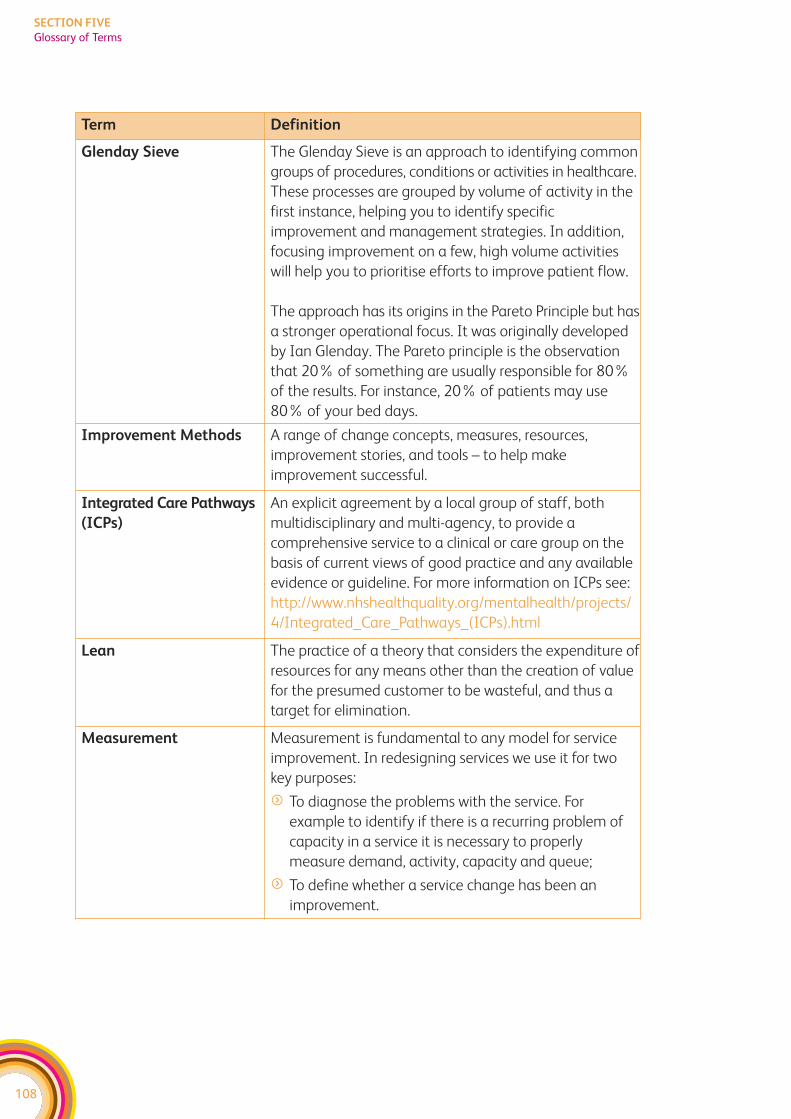
108
SECTION FIVE
Glossary of Terms
Term Definition
Glenday Sieve The Glenday Sieve is an approach to identifying common
groups of procedures, conditions or activities in healthcare.
These processes are grouped by volume of activity in the
first instance, helping you to identify specific
improvement and management strategies. In addition,
focusing improvement on a few, high volume activities
will help you to prioritise efforts to improve patient flow.
The approach has its origins in the Pareto Principle but has
a stronger operational focus. It was originally developed
by Ian Glenday. The Pareto principle is the observation
that 20% of something are usually responsible for 80%
of the results. For instance, 20% of patients may use
80% of your bed days.
Improvement Methods A range of change concepts, measures, resources,
improvement stories, and tools – to help make
improvement successful.
Integrated Care Pathways
(ICPs)
An explicit agreement by a local group of staff, both
multidisciplinary and multi-agency, to provide a
comprehensive service to a clinical or care group on the
basis of current views of good practice and any available
evidence or guideline. For more information on ICPs see:
http://www.nhshealthquality.org/mentalhealth/projects/
4/Integrated_Care_Pathways_(ICPs).html
Lean The practice of a theory that considers the expenditure of
resources for any means other than the creation of value
for the presumed customer to be wasteful, and thus a
target for elimination.
Measurement Measurement is fundamental to any model for service
improvement. In redesigning services we use it for two
key purposes:
f To diagnose the problems with the service. For
example to identify if there is a recurring problem of
capacity in a service it is necessary to properly
measure demand, activity, capacity and queue;
f To define whether a service change has been an
improvement.
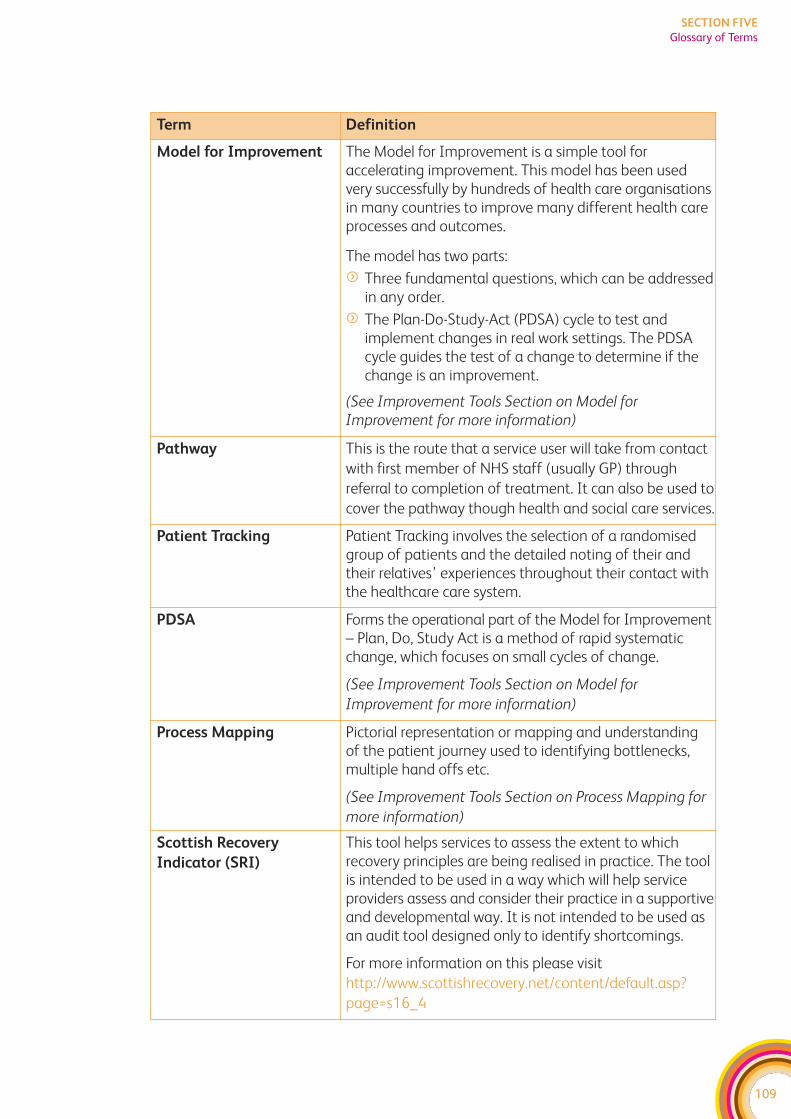
109
SECTION FIVE
Glossary of Terms
Term Definition
Model for Improvement The Model for Improvement is a simple tool foraccelerating improvement. This model has been usedvery successfully by hundreds of health care organisationsin many countries to improve many different health careprocesses and outcomes.
The model has two parts:
f Three fundamental questions, which can be addressedin any order.
f The Plan-Do-Study-Act (PDSA) cycle to test andimplement changes in real work settings. The PDSAcycle guides the test of a change to determine if thechange is an improvement.
(See Improvement Tools Section on Model forImprovement for more information)
Pathway This is the route that a service user will take from contact
with first member of NHS staff (usually GP) through
referral to completion of treatment. It can also be used to
cover the pathway though health and social care services.
Patient Tracking Patient Tracking involves the selection of a randomisedgroup of patients and the detailed noting of their andtheir relatives’ experiences throughout their contact withthe healthcare care system.
PDSA Forms the operational part of the Model for Improvement– Plan, Do, Study Act is a method of rapid systematicchange, which focuses on small cycles of change.
(See Improvement Tools Section on Model for
Improvement for more information)
Process Mapping Pictorial representation or mapping and understanding of the patient journey used to identifying bottlenecks,multiple hand offs etc.
(See Improvement Tools Section on Process Mapping for
more information)
Scottish Recovery
Indicator (SRI)
This tool helps services to assess the extent to whichrecovery principles are being realised in practice. The toolis intended to be used in a way which will help serviceproviders assess and consider their practice in a supportiveand developmental way. It is not intended to be used asan audit tool designed only to identify shortcomings.
For more information on this please visit
http://www.scottishrecovery.net/content/default.asp?
page=s16_4
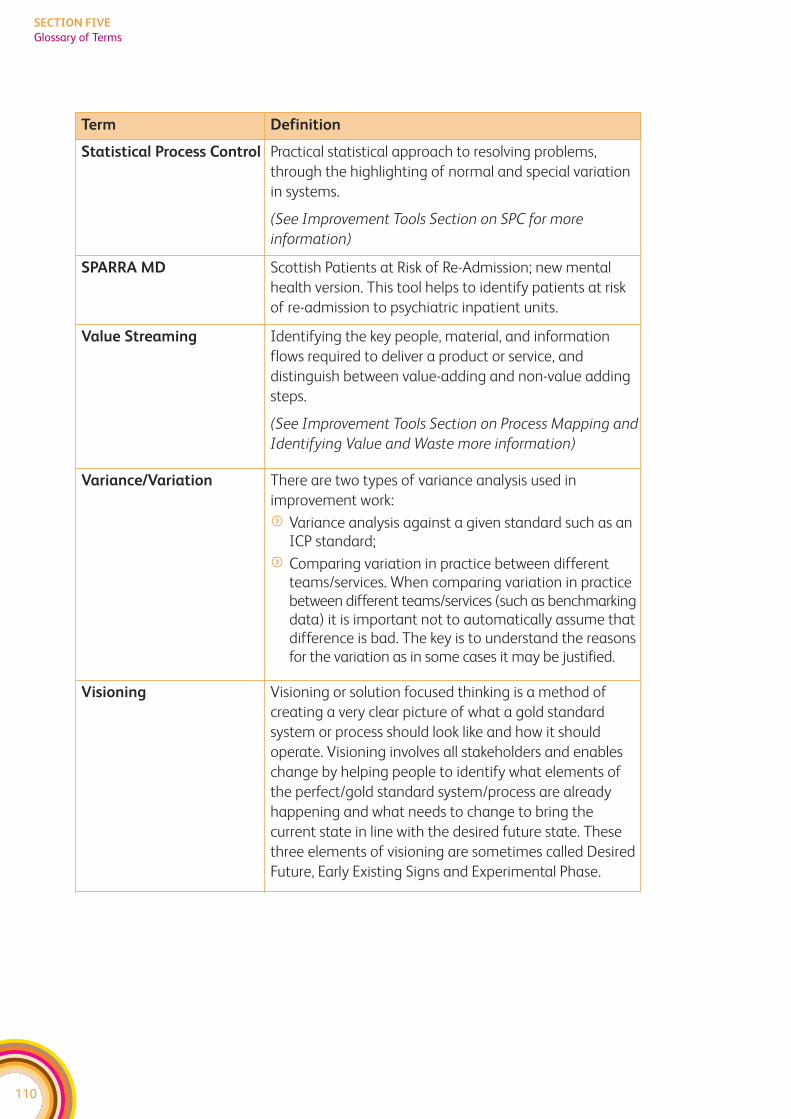
110
SECTION FIVE
Glossary of Terms
Term Definition
Statistical Process Control Practical statistical approach to resolving problems,
through the highlighting of normal and special variation
in systems.
(See Improvement Tools Section on SPC for more
information)
SPARRA MD Scottish Patients at Risk of Re-Admission; new mental
health version. This tool helps to identify patients at risk
of re-admission to psychiatric inpatient units.
Value Streaming Identifying the key people, material, and information
flows required to deliver a product or service, and
distinguish between value-adding and non-value adding
steps.
(See Improvement Tools Section on Process Mapping and
Identifying Value and Waste more information)
Variance/Variation There are two types of variance analysis used in
improvement work:
f Variance analysis against a given standard such as anICP standard;
f Comparing variation in practice between differentteams/services. When comparing variation in practicebetween different teams/services (such as benchmarkingdata) it is important not to automatically assume thatdifference is bad. The key is to understand the reasonsfor the variation as in some cases it may be justified.
Visioning Visioning or solution focused thinking is a method of
creating a very clear picture of what a gold standard
system or process should look like and how it should
operate. Visioning involves all stakeholders and enables
change by helping people to identify what elements of
the perfect/gold standard system/process are already
happening and what needs to change to bring the
current state in line with the desired future state. These
three elements of visioning are sometimes called Desired
Future, Early Existing Signs and Experimental Phase.
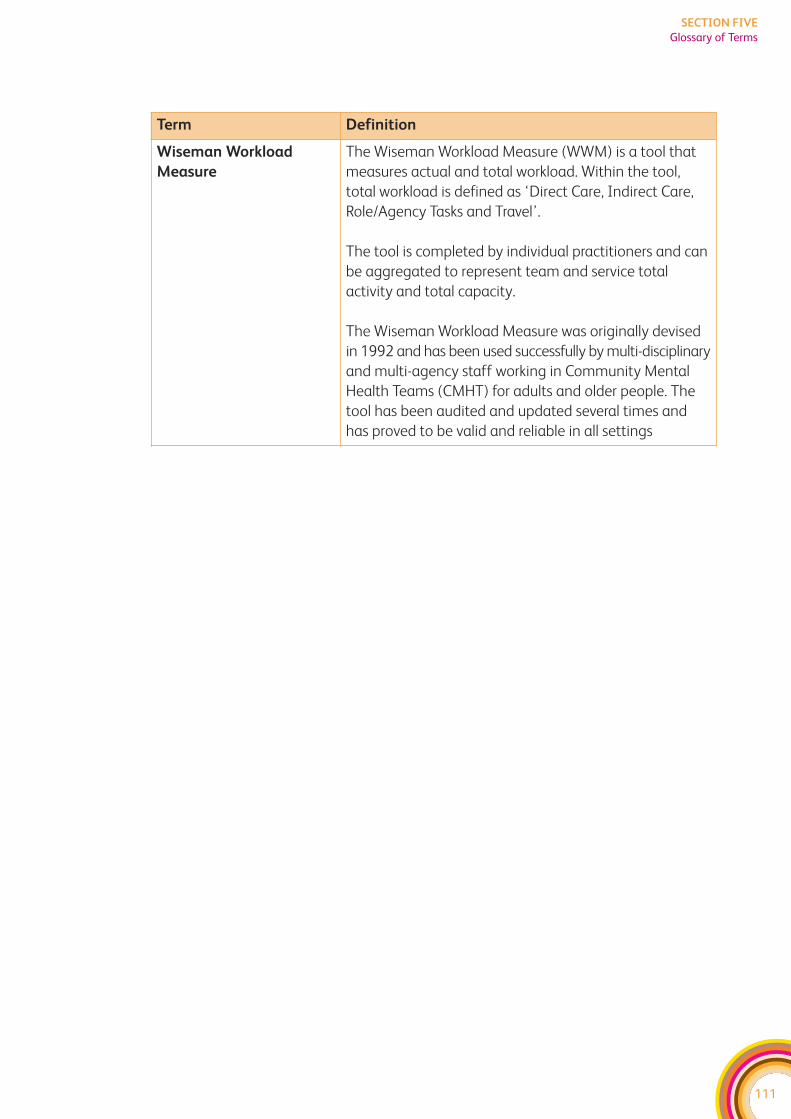
111
SECTION FIVE
Glossary of Terms
Term Definition
Wiseman Workload
Measure
The Wiseman Workload Measure (WWM) is a tool that
measures actual and total workload. Within the tool,
total workload is defined as ‘Direct Care, Indirect Care,
Role/Agency Tasks and Travel’.
The tool is completed by individual practitioners and can
be aggregated to represent team and service total
activity and total capacity.
The Wiseman Workload Measure was originally devised
in 1992 and has been used successfully by multi-disciplinary
and multi-agency staff working in Community Mental
Health Teams (CMHT) for adults and older people. The
tool has been audited and updated several times and
has proved to be valid and reliable in all settings

112

SECTION SIX:Case Studies


![Child Welfare/Mental Health learning Collaborative Directory · August 2014 [CHILD WELFARE/MENTAL HEALTH LEARNING COLLABORATIVE DIRECTORY] 4 Last Name First Name Email Title Agency](https://img.pdfslide.us/doc/110x75/5e1dac02e1fc7b6ce1261dcf/child-welfaremental-health-learning-collaborative-directory-august-2014-child.jpg)