Embed Size (px)
Citation preview
Epps et al. 20
Functional NeuroCognitive ImagingTM and Notus NeuroCogsTM: A Novel Use of fMRI in the Assessment of Cognitive Function in Major Neurocognitive Disorder
Research Article Open Access
https://doi.org/10.17756/jnpn.2017-015
Caleb T. Epps1*, Braden J. Tucker2, Alina K. Fong3-5 and Mark Allen3, 4
1University of North Carolina School of Medicine, Chapel Hill, NC, USA2Case Western Reserve University School of Medicine, Cleveland, OH, USA3Cognitive FX, Provo, UT, USA4Notus Neuropsychological Imaging, Orem, UT, USA5Utah Valley Regional Medical Center, Provo, UT, USA
*Correspondence to:Caleb T. EppsCognitive FX, 280 West River Park DriveSuite 110, Provo, Utah 84604, USATel: (385) 375-8590Fax: (888) 511-1397E-mail: [email protected]
Received: June 27, 2017Accepted: August 04, 2017Published: August 17, 2017
Citation: Epps CT, Tucker BJ, Fong AK, Allen MD. 2017. Functional NeuroCognitive ImagingTM and Notus NeuroCogsTM: A Novel Use of fMRI in the Assessment of Cognitive Function in Major Neurocognitive Disorder. J Neuroimaging Psychiatry Neurol 2(1): 20-29.
Copyright: © 2017 Epps et al. This is an Open Access article distributed under the terms of the Creative Commons Attribution 4.0 International License (CC-BY) (http://creativecommons.org/licenses/by/4.0/) which permits commercial use, including reproduction, adaptation, and distribution of the article provided the original author and source are credited.
Published by United Scientific Group
Abstract Background: Current diagnostic approaches to MND rely heavily upon the
history of present illness and neurocognitive testing with functional neuroimaging playing a minimal role. The use of fMRI as a clinical tool has been limited due to the lack of a standardized protocol of cognitive testing appropriate for the scanning environment and lack of normalized data to which the individual patient can be compared. We therefore present Functional NeuroCognitive ImagingTM and Notus NeuroCogsTM, a unique protocol for the assessment of MND.
Methods: The fNCITM and Notus NeuroCogsTM protocol was initially performed on a population of 60 normative reference volunteers (32 Female, 28 Male) between the ages of 19-57 years old to produce a normative atlas. Four patients with clinical complaints of cognitive impairment underwent fNCITM and Notus NeuroCogsTM imaging and were compared to the normative atlas.
Results: Structural imaging of Patient A-D alone could not confirm the diagnosis of MND. Patient A demonstrated severe cognitive deficits in 16 of 57 regions of interest (ROI), patient B in 26 of 57 ROI, patient C in 20 of 57 ROI, and patient D in 14 of 57 ROI. These results correspond with Moderate, Severe, Severe, and Moderate neurovascular uncoupling, respectively.
Conclusions: This report outlines the novel use of fMRI in the assessment of MND and demonstrates its effective use in four patients. Specifically, we show the protocol’s possible use as a clinical tool in characterizing the severity of cognitive impairment and early detection of cognitive impairment in patients at risk for MND.
KeywordsAlzheimer’s disease, Cognitive impairment, Functional MRI, Functional
neuroimaging, Neuropsychological testing, Neurovascular coupling, Neurovascular uncoupling, Major neurocognitive disorder
IntroductionMajor Neurocognitive Disorder (MND) represents a group of heterogeneous
disorders characterized by progressive decline in one or more of the following cognitive domains: language, executive function, memory and learning, social cognition, attention, and perceptual-motor. The deficit must reveal a decline from a previous point of function and show evidence of interference with the independence and day-to-day operations of the individual [1].
Journal of Neuroimaging in Psychiatry & Neurology
Journal of Neuroimaging in Psychiatry and Neurology | Volume 2 Issue 1, 2017
Functional NeuroCognitive ImagingTM and Notus NeuroCogsTM: A Novel Use of fMRI in the Assessment of Cognitive Function in Major Neurocognitive Disorder Epps et al.
21
accepted tool for detection of brain activation [19]. Simply, when an area of the brain is activated, for example, the occipital lobe during visual activity, there is a sharp inflow of oxyhemoglobin that is far greater than the transient oxygen consumption in that region. This leads to a decrease in deoxyhemoglobin concentration in the area and alteration of the local magnetic susceptibility (blood oxygen level-dependent (BOLD) signal), which is picked up by MRI. Thus providing an indirect measurement of neuronal activity, including changes resulting in hypo-or hyperactivation of neurons.
In patients with MND, task-related (i.e. neurocognitive tests) fMRI has the theoretical potential to detect early brain NVU [20, 21]. The ability to combine neurocognitive testing with fMRI provides the foundation for MND screening, early intervention, and even characterization of MND based on specific cognitive deficits. However, its use has largely been limited to research because it lacks essential features necessary for clinical assessment: 1) a concurrently validated, reliable, and objective standardized protocol appropriate for the MRI scanning environment; and 2) a clinically acceptable normative- based contextualization procedure for appropriate individualized patient assessment. We therefore present Functional NeuroCognitive ImagingTM (fNCI) and Notus NeuroCogsTM (Cognitive FX; Provo, UT), a unique assessment protocol that combines the validity of conventional neuropsychological testing standards with the reliability and objectivity of informational data output provided by fMRI.
The fNCITM and Notus NeuroCogsTM protocol successfully identified both severity and localization of NVU in 300+ patients who suffered a mild traumatic brain injury (mTBI). For many patients, subjective post-concussion symptom scale measurements were not indicative of the degree of NVU. However, the sensitivity of our protocol allowed for detection of significant differences in severity and locations of NVU [22, 23]. This objective analysis of the regional NVU in comparison to a normative atlas allowed for the development of a customized neurotherapy regimen based on each patient’s unique cognitive deficit profile.
The pathophysiology of mTBI, like MND as described above, is associated with NVU. Therefore, this report describes the novel use of fNCI and Notus NeuroCogsTM in the evaluation of four patients with suspected MND. It is believed that this protocol will a) aid in the early detection and characterization of MND, providing opportunity for early intervention, and b) be clinically relevant allowing for its use in the individual patient.
Methods and MaterialsFunctional task battery
The Notus NeuroCogsTM functional task battery (Notus Neuropsychological, Orem, UT) employed in fNCI underwent iterative pilot testing to ensure concurrent validity, reliability, objectivity, and suitability for the MRI scanning environment [22-27], and is comprised of six neuropsychologic
The most prevalent form of MND is Alzheimer’s disease (60-80%) [2]. It is estimated that 6.7 million individuals in the U.S over 65 years of age will have Alzheimer’s disease by 2025 [2]. Vascular dementia, fronto-temporal dementia, and Lewy body dementia are significant, but less common, causes [3-5].
The expanding burden of MND calls for the need of clinical tools to help in both the early identification of at risk patients and the ability to clearly discriminate between spectrums of severity within MND. This will enable the development of successful preventative and treatment stratagems.
Currently, the approach to diagnosing a patient with MND relies heavily upon the history of present illness, neurocognitive testing, and ruling out other causes of cognitive impairment (medications, thyroid function, vitamin deficiencies, chronic disease, etc.). Traditional cognitive tests include the Mini-mental State Exam (MMSE), the Montreal Cognitive Assessment (MoCA), and the Clinical Dementia Rating with the MMSE being the most widely used in the clinical setting [6].
Neuroimaging plays a less prominent role in diagnosing MND compared to cognitive testing. Current guidelines recommend the use of neuroimaging in the evaluation of MND to rule out structural and reversible causes such as neoplasms, chronic subdural hematomas, or normal pressure hydrocephalus [7, 8].
Functional neuroimaging (fNI) in MND is an area of ongoing research. fNI includes a variety of imaging techniques with the ability to examine tissue perfusion and metabolism. In other words, healthy brain function relies on highly responsive mechanisms of blood flow regulation that are sensitive to the immediate and shifting demands for steady glucose metabolism throughout the brain [9]. This can be termed neurovascular coupling (NVC). Any disruption in precise NVC, termed neurovascular uncoupling (NVU), may result in obvious cognitive and physical deficits [10].
Evidence continues to increase linking MND and NVU [11, 12]. Specifically, studies using arterial spin labeling, an MRI technique that measures blood flow through arterioles and capillaries, have found cerebral hypoperfusion in patients with mild MND [13]. Interestingly, the same areas of cerebral hypoperfusion found on arterial spin labeling demonstrated hypometabolism on 18F-2-flouro-2-deoxy-D-glucose (FDG)-PET images [13, 14]. Chronic NVU, as seen in MND, can hasten neurodegeneration via several proposed processes including neuroinflammation and oxidative stress induction with associated amyloid beta (Aβ) deposition, tau hyperphosphorylation, and synaptic malfunction leading to eventual neuronal injury [10, 15-18]. Additionally, chronic oxidative stress from Aβ deposition inhibits production of vasodilator agents further increasing NVU [18]. However, the research linking MND and NVU largely investigates Alzheimer’s disease where evidence that links NVU to other forms of MND is lacking and needs further elucidation.
Alzheimer’s disease where evidence that links NVU to other forms of MND is lacking and needs further elucidation. Functional MRI (fMRI) is widely used and a commonly
Journal of Neuroimaging in Psychiatry and Neurology | Volume 2 Issue 1, 2017 22
Functional NeuroCognitive ImagingTM and Notus NeuroCogsTM: A Novel Use of fMRI in the Assessment of Cognitive Function in Major Neurocognitive Disorder Epps et al.
test adaptations: the functional Matrix Reasoning TestTM (f-MRT), the functional Trail Making Test-BTM (f-TMT), the functional Picture Naming TestTM (f-PNT), the functional Face Memory TestTM (f-FMT), the functional Verbal Memory TestTM (f-VMT), and the functional Verbal Fluency TestTM (f-VFT). Each of the six tasks includes eight test phases presented in alternating fashion with rest phases, in which the subject is asked to silently count from 1 to 10. Compliance monitoring is performed at intervals during each task. Operative descriptions are outlined below:
The f-MRT tests non-verbal problem solving using a 3x3 array of visually complex figures with one figure missing. The subject is then instructed to select the best match for the missing figure from among four “candidate” figures by pressing a designated button.
The f-TMT measures cognitive flexibility by presenting a virtual connect-the-dots tasks using a button pad response system. Randomly arranged numbers and letters are displayed on a screen and the subject must locate and connect each series of numbers and letters in ascending order while alternating back and forth between the two character types.
The f-PNT assesses semantic object recognition by displaying line drawings of common objects for a period of 1.5 seconds each. Subjects are instructed to silently identify each object upon presentation.
The f-FMT investigates long-term memory. Subjects are instructed to memorize colored photographs of unfamiliar faces and informed that they will be required to identify some of the faces at a later time. Twenty faces are presented twice in 2 random orders for three seconds each during scanning. Recognition accuracy is recorded on a post-scan test.
The f-VMT analyzes short-term verbal memory. For each test run, the subject views a series of eight common words for one second each and is instructed to silently memorize the words as they appear. Subjects are given 12 additional seconds after all words have been presented to recall as many as possible. The f-VFT is a letter-based fluency test. The subject is instructed to silently generate as many unique words as possible (excluding proper names or variants of the same word) within a 20-second time limit using a given first letter.
Normative atlasTypical fMRI studies utilize a group-averaging approach,
which compares groups of patients against a sample of healthy controls, thereby limiting the clinical applicability of this traditional fMRI approach at the single subject level. In order to bypass this limitation and further support the reliability of our functional task battery to employ its clinical application, we utilized a group-summary analysis approach [26]. Single - subject fNCI is assessed for NVC/NVU by a qualified neuroanatomist and is projected against a normative data set comprised of healthy reference data to extrapolate clinically relevant evaluations.
The fNCI assessment protocol was initially performed on a population comprised of 60 normative reference volunteers (32 Female, 28 Male) between the ages of 19-57 years old
(Mean = 30.1, σ = 8.5). Edinburgh Handedness Inventory analysis found right-hand dominance in 91.7% of subjects. Majority of participants within this population were Caucasian (75.0%), with the remaining being: Hispanic (11.7%), Asian (10.0%), and African American (3.3%). Reference subjects all spoke English as their first language and 180 had at least one year of higher education (Mean = 14.3, σ = 2.9).
Data analysis revealed 57 specific neural activation regions, or regions of interest (ROI) found to be task-associated with Notus NeuroCogsTM (Figure 1). Additionally, these regions of interest were found to possess a normal distribution of functional NVC amongst reference subjects. This distributive property formulated a three-dimensional activation standard, or normative atlas, which was later used to statistically contextualize both severity and localization of NVU in a sample consisting of four patients with suspected MND (Figures 2-4).
Patient characteristics Patients A-D presented to the clinic with symptoms
concerning for MND. Patient A is a 63 year-old male with a past medical history of mild cognitive impairment (MCI) who presented with worsening short-term and spatial memory loss, decreased processing speed, and irritability. He had a provincial diagnosis of MCI, made 2 years prior, and was taking Aricept. He also has a family history of unspecified neurologic disorders.
Patient B is a 78 year-old male with a past medical history of coronary heart disease (CAD) who presented with short-term memory loss, episodes of confusion, and impaired focus. He first noticed the symptoms 2 years prior and endorses progressive worsening. His CAD has been stable on Metoprolol and low dose Aspirin. He has no family history of
Figure 1: Interpreting Reports and ROI columns. Each column in the Notus NeuroCogsTM results of Patient A-D represents a single ROI. Each ROI indicates a brain region that was found to be reliably activated in 60 normal control subjects, who were used as a comparison sample. These ROI sets are also highly consistent with outcomes found in the vast majority of fMRI research studies using these cognitive tasks. In each exam figure, ROIs are grouped together by cognitive function and color-coded with a descriptive heading for that function (e.g., Executive Functioning, Visual Processing, etc.). It is important to keep in mind that some regions might be considered more central to the major cognitive components of the task than others. The findings sections are thus organized roughly by regions of greater to lesser essential contribution to each cognitive task.
Journal of Neuroimaging in Psychiatry and Neurology | Volume 2 Issue 1, 2017 23
Functional NeuroCognitive ImagingTM and Notus NeuroCogsTM: A Novel Use of fMRI in the Assessment of Cognitive Function in Major Neurocognitive Disorder Epps et al.
neurologic disorders.
Patient C is a 79 year-old female with a past medical history of general anxiety disorder, hypothyroidism, and arrhythmia who presented with word finding difficulty in both speech and writing, irritability, short-term memory loss, brain fog, and headaches. She noticed these symptoms 5 months prior to presentation and endorses progressive worsening. Her medical conditions remain stable on Levothyroxine, Buproprion, and Metoprolol. She has no family history of neurologic disorders.
Patient D is a 72 year-old female with no significant past medical history who presented with gait instability and brain fog. She noticed these symptoms 7 months prior to presentation and endorses progressive worsening. She has a family history of unspecified neurologic disorders.
Structural and functional imaging of patients A-DPrior to functional imaging with fNCITM and Notus
NeuroCogsTM patients A-D underwent a structural MRI of the brain and/or cervical spine. Specifically, axial T1 3D FSPGR, sagittal T1 FLAIR, axial T2 FLAIR, coronal T1 FLAIR, and SWI images were obtained. Cervical MRI included axial T1 GRE, axial 2D MERGE, an axial 3D fiesta sequence, sagittal T1 FSE, sagittal T2 fr FSE, sagittal STIR, sagittal T2 Oblique, and axial T2 fr FSE.
The MRI’s were read by a qualified neuroradiologist and impressions recorded. fMRI with fNCITM and Notus NeuroCogsTM was subsequently performed. The Notus NeuroCogsTM were performed as outlined in “Functional Task Battery”.
Statistical analysisThe location and severity of NVU in each of the 57 specific
ROI of Patients A-D were compared to the three-dimensional activation standard formulated from our 60 healthy volunteers.
The amount of average deviation was calculated for each patient. The average deviation compares the overall standard deviation of the 57 ROI to our 60 healthy volunteers and categorizing them into Healthy, Mild, Moderate, and Severe levels. It is important to note that these classifications only identify the severity of NVU, not the severity of MND. Also, because the deviation from the mean for any specific ROI could be negative or positive the scores have been rectified so that any negative value is changed to positive. This allows for more simple characterization of overall deviation (i.e. hypoactive deviation does not cancel out hyperactive deviation).
ResultsStructural MRI of patients A-D
A summary of the structural imaging findings of Patients A-D can be found in Table 2. fMRI with fNCITM and Notus NeuroCogsTM of Patients A-D. A summary of the functional imaging results for patients A-D is found in Table 1.
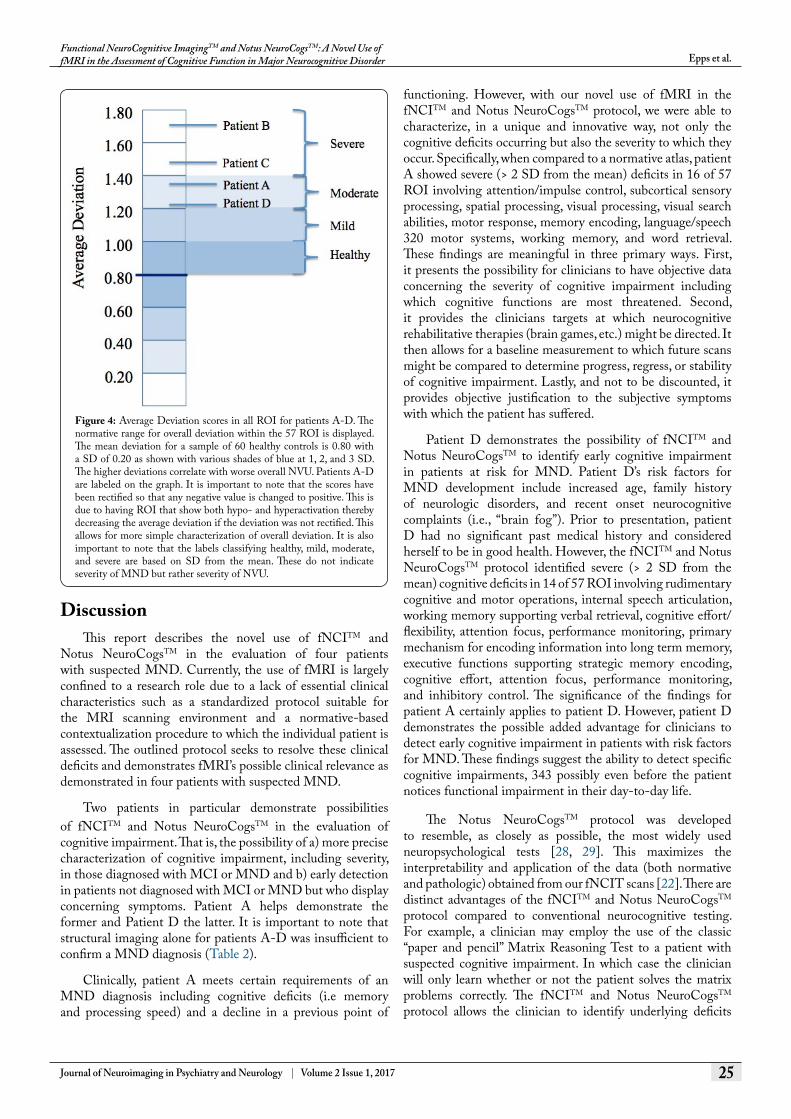
Overall, Patient A demonstrated severe cognitive deficits (> 2 SD from the mean) in 16 of 57 ROI (average deviation
of 1.38), patient B in 26 of 57 ROI (average deviation of 1.73), patient C in 20 of 57 ROI (average deviation of 1.49), and patient D in 14 of 57 ROI (average deviation of 1.27). These results correspond with Moderate, Severe, Severe, and Moderate neurovascular uncoupling, respectively (Figure 4) Only the specific Notus NeuroCogTM scoring of Patient A and D will be presented here, as these two patients are of particular interest as will be outlined in the “discussion” section.
Patient A’s average deviation of 1.38 (> 2 SD in 16/57 ROI) indicates Moderate overall NVU (Figure 2 and 4).
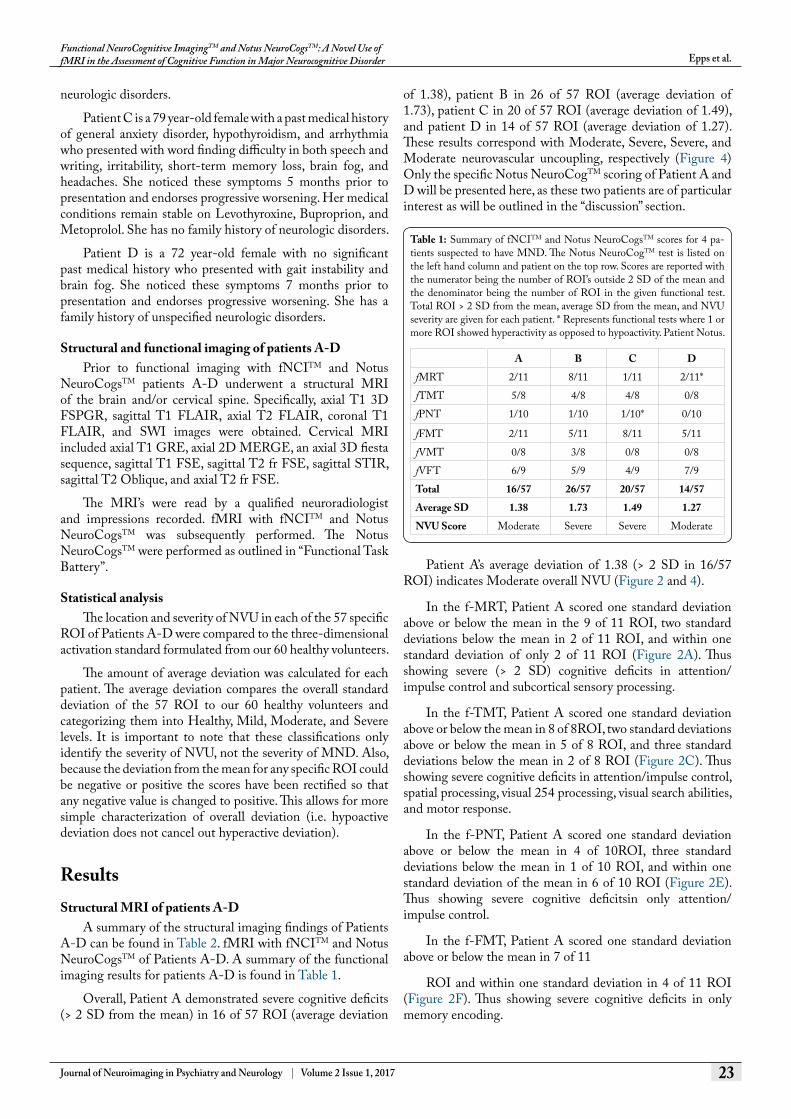
In the f-MRT, Patient A scored one standard deviation above or below the mean in the 9 of 11 ROI, two standard deviations below the mean in 2 of 11 ROI, and within one standard deviation of only 2 of 11 ROI (Figure 2A). Thus showing severe (> 2 SD) cognitive deficits in attention/impulse control and subcortical sensory processing.
In the f-TMT, Patient A scored one standard deviation above or below the mean in 8 of 8ROI, two standard deviations above or below the mean in 5 of 8 ROI, and three standard deviations below the mean in 2 of 8 ROI (Figure 2C). Thus showing severe cognitive deficits in attention/impulse control, spatial processing, visual 254 processing, visual search abilities, and motor response.
In the f-PNT, Patient A scored one standard deviation above or below the mean in 4 of 10ROI, three standard deviations below the mean in 1 of 10 ROI, and within one standard deviation of the mean in 6 of 10 ROI (Figure 2E). Thus showing severe cognitive deficitsin only attention/impulse control.
In the f-FMT, Patient A scored one standard deviation above or below the mean in 7 of 11
ROI and within one standard deviation in 4 of 11 ROI (Figure 2F). Thus showing severe cognitive deficits in only memory encoding.
Table 1: Summary of fNCITM and Notus NeuroCogsTM scores for 4 pa-tients suspected to have MND. The Notus NeuroCogTM test is listed on the left hand column and patient on the top row. Scores are reported with the numerator being the number of ROI’s outside 2 SD of the mean and the denominator being the number of ROI in the given functional test. Total ROI > 2 SD from the mean, average SD from the mean, and NVU severity are given for each patient. * Represents functional tests where 1 or more ROI showed hyperactivity as opposed to hypoactivity. Patient Notus.
A B C D
fMRT 2/11 8/11 1/11 2/11*
fTMT 5/8 4/8 4/8 0/8
fPNT 1/10 1/10 1/10* 0/10
fFMT 2/11 5/11 8/11 5/11
fVMT 0/8 3/8 0/8 0/8
fVFT 6/9 5/9 4/9 7/9
Total 16/57 26/57 20/57 14/57
Average SD 1.38 1.73 1.49 1.27
NVU Score Moderate Severe Severe Moderate
Journal of Neuroimaging in Psychiatry and Neurology | Volume 2 Issue 1, 2017 24
Functional NeuroCognitive ImagingTM and Notus NeuroCogsTM: A Novel Use of fMRI in the Assessment of Cognitive Function in Major Neurocognitive Disorder Epps et al.
In the f-VMT, Patient A scored within one standard deviation of the mean in 8 of 8 ROI (Figure 2B). Thus showing no severe cognitive deficits in this functional task.
In the f-VFT, Patient A scored above or below one standard deviation of the mean in 9 of 9 ROI, two standard deviations above or below the mean in 6 of 9 ROI, and three standard deviations above or below the mean in 2 of 9 ROI (Figure 2D). Thus showing severe cognitive deficits in language/speech motor systems, working memory, executive attention, and word retrieval.
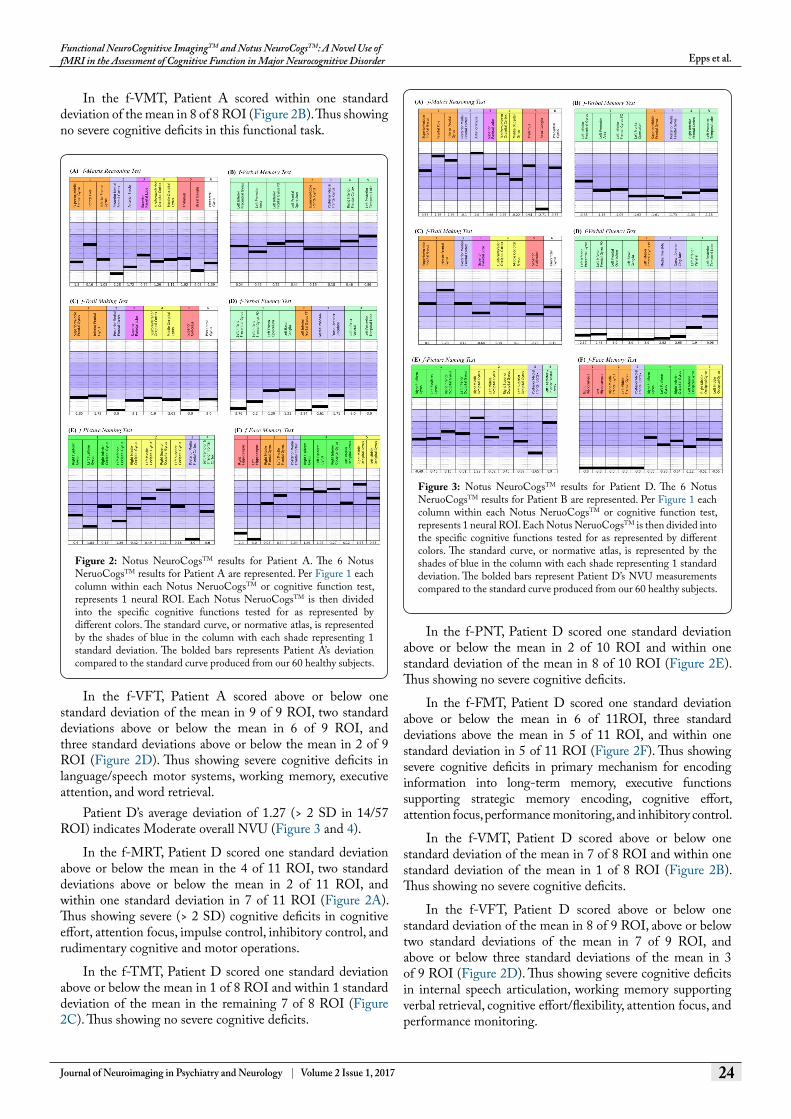
Patient D’s average deviation of 1.27 (> 2 SD in 14/57 ROI) indicates Moderate overall NVU (Figure 3 and 4).
In the f-MRT, Patient D scored one standard deviation above or below the mean in the 4 of 11 ROI, two standard deviations above or below the mean in 2 of 11 ROI, and within one standard deviation in 7 of 11 ROI (Figure 2A). Thus showing severe (> 2 SD) cognitive deficits in cognitive effort, attention focus, impulse control, inhibitory control, and rudimentary cognitive and motor operations.
In the f-TMT, Patient D scored one standard deviation above or below the mean in 1 of 8 ROI and within 1 standard deviation of the mean in the remaining 7 of 8 ROI (Figure 2C). Thus showing no severe cognitive deficits.
In the f-PNT, Patient D scored one standard deviation above or below the mean in 2 of 10 ROI and within one standard deviation of the mean in 8 of 10 ROI (Figure 2E). Thus showing no severe cognitive deficits.
In the f-FMT, Patient D scored one standard deviation above or below the mean in 6 of 11ROI, three standard deviations above the mean in 5 of 11 ROI, and within one standard deviation in 5 of 11 ROI (Figure 2F). Thus showing severe cognitive deficits in primary mechanism for encoding information into long-term memory, executive functions supporting strategic memory encoding, cognitive effort, attention focus, performance monitoring, and inhibitory control.
In the f-VMT, Patient D scored above or below one standard deviation of the mean in 7 of 8 ROI and within one standard deviation of the mean in 1 of 8 ROI (Figure 2B). Thus showing no severe cognitive deficits.
In the f-VFT, Patient D scored above or below one standard deviation of the mean in 8 of 9 ROI, above or below two standard deviations of the mean in 7 of 9 ROI, and above or below three standard deviations of the mean in 3 of 9 ROI (Figure 2D). Thus showing severe cognitive deficits in internal speech articulation, working memory supporting verbal retrieval, cognitive effort/flexibility, attention focus, and performance monitoring.
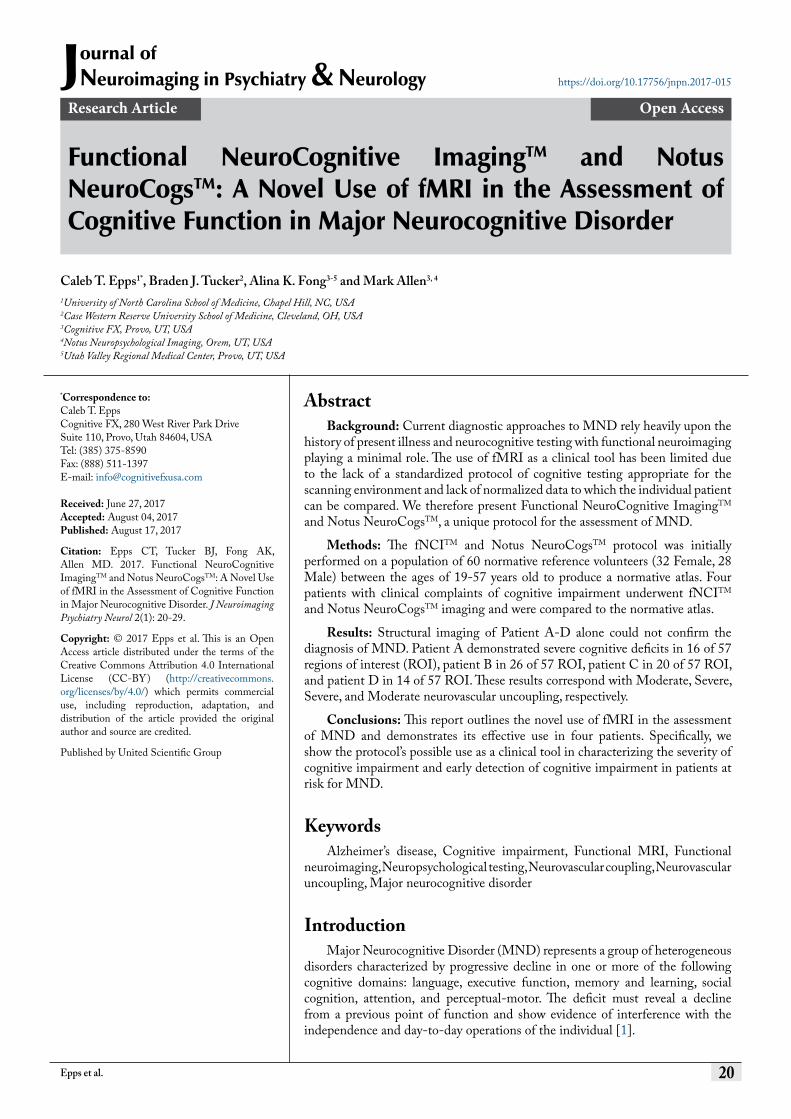
Figure 3: Notus NeuroCogsTM results for Patient D. The 6 Notus NeruoCogsTM results for Patient B are represented. Per Figure 1 each column within each Notus NeruoCogsTM or cognitive function test, represents 1 neural ROI. Each Notus NeruoCogsTM is then divided into the specific cognitive functions tested for as represented by different colors. The standard curve, or normative atlas, is represented by the shades of blue in the column with each shade representing 1 standard deviation. The bolded bars represent Patient D’s NVU measurements compared to the standard curve produced from our 60 healthy subjects.
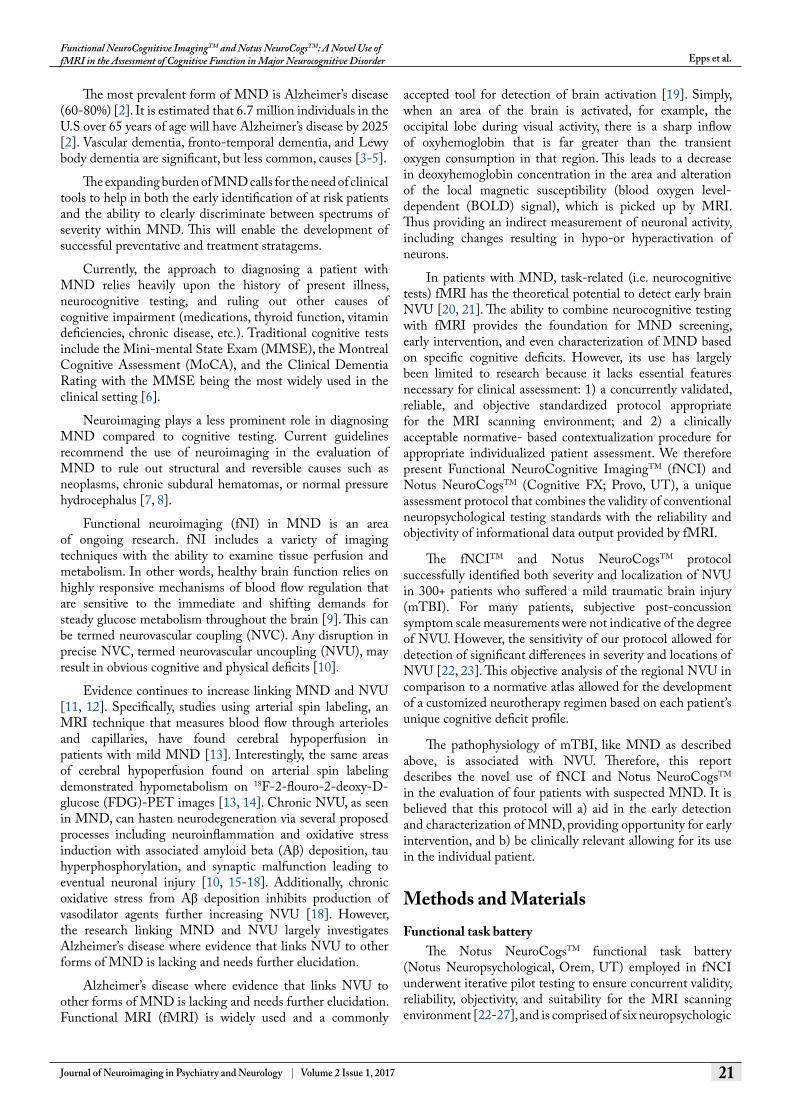
Figure 2: Notus NeuroCogsTM results for Patient A. The 6 Notus NeruoCogsTM results for Patient A are represented. Per Figure 1 each column within each Notus NeruoCogsTM or cognitive function test, represents 1 neural ROI. Each Notus NeruoCogsTM is then divided into the specific cognitive functions tested for as represented by different colors. The standard curve, or normative atlas, is represented by the shades of blue in the column with each shade representing 1 standard deviation. The bolded bars represents Patient A’s deviation compared to the standard curve produced from our 60 healthy subjects.
Journal of Neuroimaging in Psychiatry and Neurology | Volume 2 Issue 1, 2017 25
Functional NeuroCognitive ImagingTM and Notus NeuroCogsTM: A Novel Use of fMRI in the Assessment of Cognitive Function in Major Neurocognitive Disorder Epps et al.
DiscussionThis report describes the novel use of fNCITM and
Notus NeuroCogsTM in the evaluation of four patients with suspected MND. Currently, the use of fMRI is largely confined to a research role due to a lack of essential clinical characteristics such as a standardized protocol suitable for the MRI scanning environment and a normative-based contextualization procedure to which the individual patient is assessed. The outlined protocol seeks to resolve these clinical deficits and demonstrates fMRI’s possible clinical relevance as demonstrated in four patients with suspected MND.
Two patients in particular demonstrate possibilities of fNCITM and Notus NeuroCogsTM in the evaluation of cognitive impairment. That is, the possibility of a) more precise characterization of cognitive impairment, including severity, in those diagnosed with MCI or MND and b) early detection in patients not diagnosed with MCI or MND but who display concerning symptoms. Patient A helps demonstrate the former and Patient D the latter. It is important to note that structural imaging alone for patients A-D was insufficient to confirm a MND diagnosis (Table 2).
Clinically, patient A meets certain requirements of an MND diagnosis including cognitive deficits (i.e memory and processing speed) and a decline in a previous point of
functioning. However, with our novel use of fMRI in the fNCITM and Notus NeuroCogsTM protocol, we were able to characterize, in a unique and innovative way, not only the cognitive deficits occurring but also the severity to which they occur. Specifically, when compared to a normative atlas, patient A showed severe (> 2 SD from the mean) deficits in 16 of 57 ROI involving attention/impulse control, subcortical sensory processing, spatial processing, visual processing, visual search abilities, motor response, memory encoding, language/speech 320 motor systems, working memory, and word retrieval. These findings are meaningful in three primary ways. First, it presents the possibility for clinicians to have objective data concerning the severity of cognitive impairment including which cognitive functions are most threatened. Second, it provides the clinicians targets at which neurocognitive rehabilitative therapies (brain games, etc.) might be directed. It then allows for a baseline measurement to which future scans might be compared to determine progress, regress, or stability of cognitive impairment. Lastly, and not to be discounted, it provides objective justification to the subjective symptoms with which the patient has suffered.
Patient D demonstrates the possibility of fNCITM and Notus NeuroCogsTM to identify early cognitive impairment in patients at risk for MND. Patient D’s risk factors for MND development include increased age, family history of neurologic disorders, and recent onset neurocognitive complaints (i.e., “brain fog”). Prior to presentation, patient D had no significant past medical history and considered herself to be in good health. However, the fNCITM and Notus NeuroCogsTM protocol identified severe (> 2 SD from the mean) cognitive deficits in 14 of 57 ROI involving rudimentary cognitive and motor operations, internal speech articulation, working memory supporting verbal retrieval, cognitive effort/flexibility, attention focus, performance monitoring, primary mechanism for encoding information into long term memory, executive functions supporting strategic memory encoding, cognitive effort, attention focus, performance monitoring, and inhibitory control. The significance of the findings for patient A certainly applies to patient D. However, patient D demonstrates the possible added advantage for clinicians to detect early cognitive impairment in patients with risk factors for MND. These findings suggest the ability to detect specific cognitive impairments, 343 possibly even before the patient notices functional impairment in their day-to-day life.
The Notus NeuroCogsTM protocol was developed to resemble, as closely as possible, the most widely used neuropsychological tests [28, 29]. This maximizes the interpretability and application of the data (both normative and pathologic) obtained from our fNCIT scans [22]. There are distinct advantages of the fNCITM and Notus NeuroCogsTM protocol compared to conventional neurocognitive testing. For example, a clinician may employ the use of the classic “paper and pencil” Matrix Reasoning Test to a patient with suspected cognitive impairment. In which case the clinician will only learn whether or not the patient solves the matrix problems correctly. The fNCITM and Notus NeuroCogsTM protocol allows the clinician to identify underlying deficits
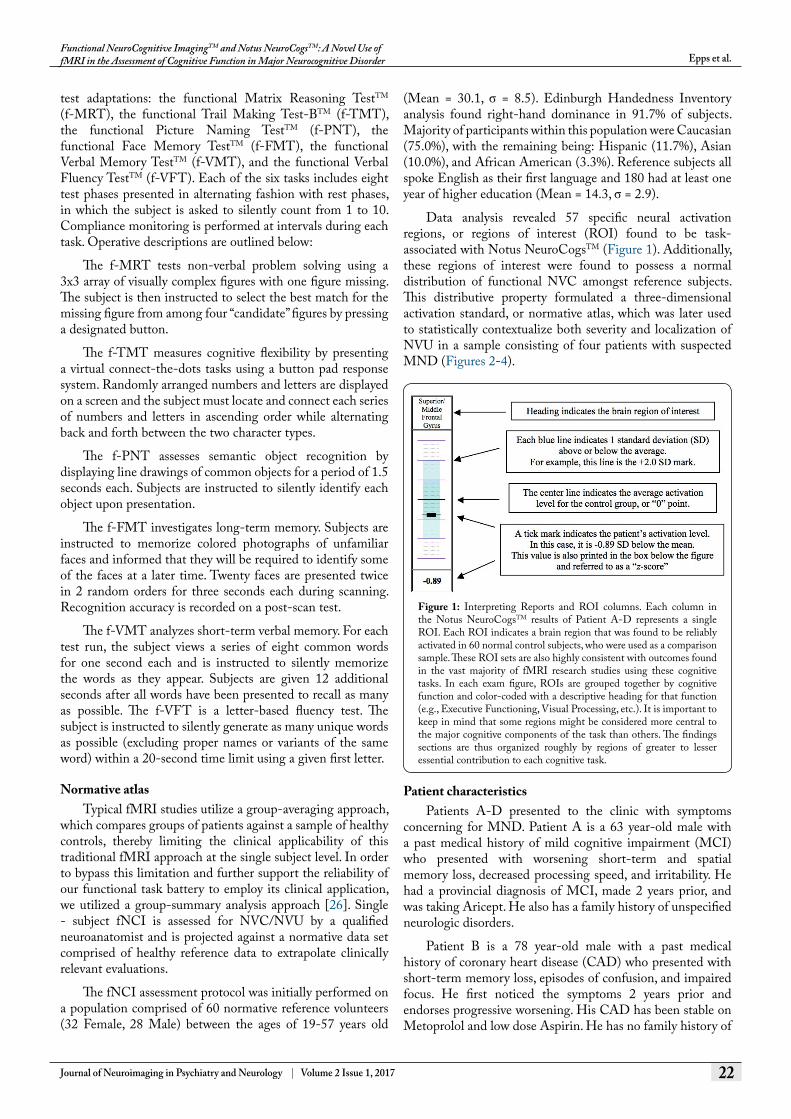
Figure 4: Average Deviation scores in all ROI for patients A-D. The normative range for overall deviation within the 57 ROI is displayed. The mean deviation for a sample of 60 healthy controls is 0.80 with a SD of 0.20 as shown with various shades of blue at 1, 2, and 3 SD. The higher deviations correlate with worse overall NVU. Patients A-D are labeled on the graph. It is important to note that the scores have been rectified so that any negative value is changed to positive. This is due to having ROI that show both hypo- and hyperactivation thereby decreasing the average deviation if the deviation was not rectified. This allows for more simple characterization of overall deviation. It is also important to note that the labels classifying healthy, mild, moderate, and severe are based on SD from the mean. These do not indicate severity of MND but rather severity of NVU.
Journal of Neuroimaging in Psychiatry and Neurology | Volume 2 Issue 1, 2017 26
Functional NeuroCognitive ImagingTM and Notus NeuroCogsTM: A Novel Use of fMRI in the Assessment of Cognitive Function in Major Neurocognitive Disorder Epps et al.
and functionality of the independent neural mechanisms (i.e., NVU) contributing to the patient’s impairment in terms of a single value (i.e., z-score). The data can be used to guide neurotherapy and improvement of deterioration resulting from the underlying pathology as opposed to a superficial representation of the pathology (i.e., pencil and paper test) [22].
The use of fMRI in patients with MND is limited to a selected number of research group [20]. Early on, the use of fMRI to assess MCI and MND focused on memory tasks, correlating it with hippocampal activation and other medial temporal lobe structures. Results were largely consistent, showing decreased hippocampal activity with memory tasks in patients with diagnosed MND [30-34]. The results of this report support these findings as the severe deficits (> 2 SD from the mean) of patients A-D in memory associated Notus NeuroCogsTM (i.e., f-FMT, f-VMT, and f-VFT) all demonstrated hypoactivation, representing a decrease in metabolic activity 365 and associated neuronal dysfunction in ROI associated with memory tasks (Table 1).
Few studies have researched MCI patients and those genetically at risk for MND development [35-38]. These studies have yielded less consistent results with some studies reporting decreased temporal lobe activation with memory tasks and others showing an increase in activity [39-42]. However, it has been hypothesized that this temporal lobe hyper-activation in memory-task associated fMRI may be a result of compensation for neuronal malfunction in other regions of the brain and predict near-future cognitive decline [39, 43, 44]. Interestingly, patient A showed regions of both hypoactivation and hyperactivation (Figure 2). Specifically, hyperactivation was seen with memory-associated tasks in occipital lobe structures (f-FMT) and in temporal lobe
structures (f-VMT) (Figure 2B and 2F). This suggests that although significant NVU has occurred in several ROI for patient A, these particular areas may be attempting to compensate via hyperactivation and are therefore in the early stages of increasing NVU and impending malfunction. This may be supported on future scans of patient A if severe hypoactivation is seen in these same ROI.
Most studies investigating task-related fMRI and MND use memory-associated tasks. Our fNCITM and Notus NeuroCogsTM protocol is novel in that we use not only memory associated tasks, but also tasks associated with executive functioning, attention/impulse control, spatial processing, visual processing, visual search abilities, motor response, complex object recognition, language and speech motor areas, and word retrieval. This allows for additional assessment of other cognitive functions affected by MND. Assessment of additional functional areas may aid in 388 the diagnosis of atypically presenting or early stage MND.
Another possibility of our fNCITM and Notus NeuroCogsTM protocol is the capability to guide not only neurocognitive rehabilitation but also pharmacotherapy. Studies have shown that neural regions of NVU in patients with MCI and MND overlap with anatomical regions of high amyloid burden [45-47], which is confirmed by supportive PET imaging evidence [48, 49]. As anti-amyloid therapies continue to be developed that target these NVU sensitive areas, fNCITM and Notus NeuroCogsTM could serve as a therapeutic guide and a monitor of treatment efficacy.
An area of particular interest to our study, though not directly addressed, is the use of fMRI in the resting state. Resting state connectivity studies allow for further understanding of intrinsic connectivity networks, specifically the Default
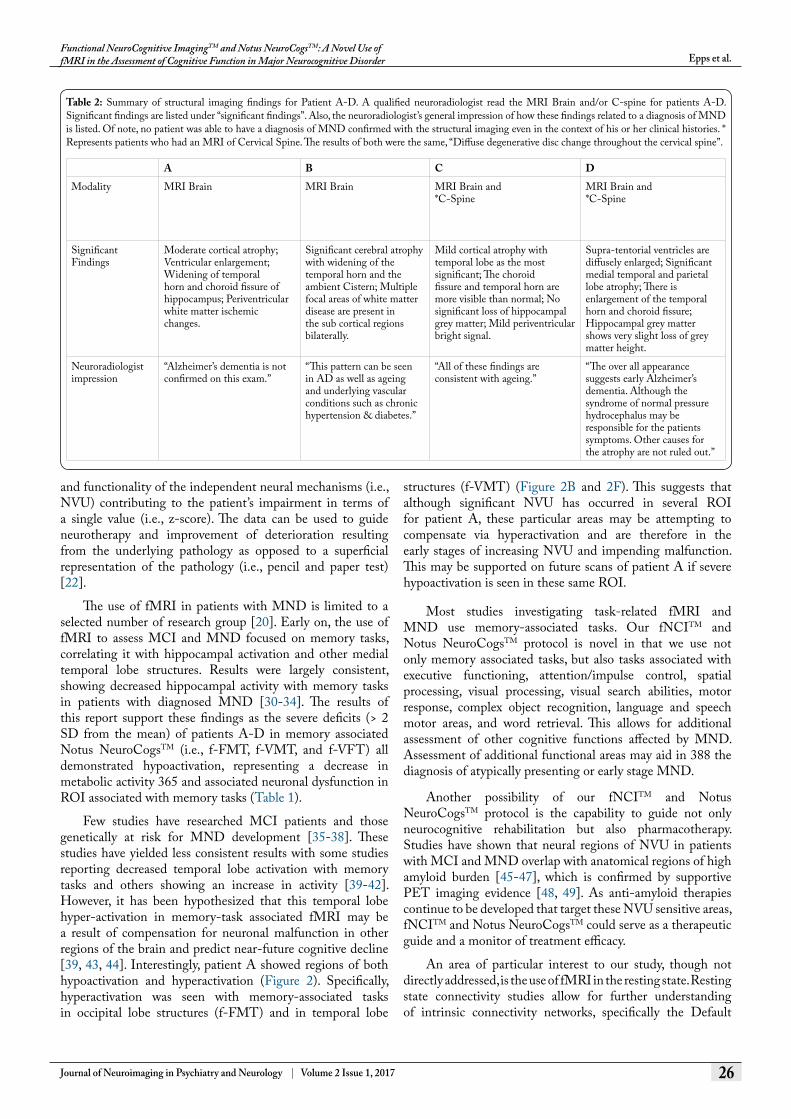
Table 2: Summary of structural imaging findings for Patient A-D. A qualified neuroradiologist read the MRI Brain and/or C-spine for patients A-D. Significant findings are listed under “significant findings”. Also, the neuroradiologist’s general impression of how these findings related to a diagnosis of MND is listed. Of note, no patient was able to have a diagnosis of MND confirmed with the structural imaging even in the context of his or her clinical histories. * Represents patients who had an MRI of Cervical Spine. The results of both were the same, “Diffuse degenerative disc change throughout the cervical spine”.
A B C D
Modality MRI Brain MRI Brain MRI Brain and*C-Spine
MRI Brain and*C-Spine
Significant Findings
Moderate cortical atrophy; Ventricular enlargement; Widening of temporal horn and choroid fissure of hippocampus; Periventricular white matter ischemic changes.
Significant cerebral atrophy with widening of the temporal horn and the ambient Cistern; Multiple focal areas of white matter disease are present in the sub cortical regions bilaterally.
Mild cortical atrophy with temporal lobe as the most significant; The choroid fissure and temporal horn are more visible than normal; No significant loss of hippocampal grey matter; Mild periventricular bright signal.
Supra-tentorial ventricles are diffusely enlarged; Significant medial temporal and parietal lobe atrophy; There is enlargement of the temporal horn and choroid fissure; Hippocampal grey matter shows very slight loss of grey matter height.
Neuroradiologist impression
“Alzheimer’s dementia is not confirmed on this exam.”
“This pattern can be seen in AD as well as ageing and underlying vascular conditions such as chronic hypertension & diabetes.”
“All of these findings are consistent with ageing.”
“The over all appearance suggests early Alzheimer’s dementia. Although the syndrome of normal pressure hydrocephalus may be responsible for the patients symptoms. Other causes for the atrophy are not ruled out.”
Journal of Neuroimaging in Psychiatry and Neurology | Volume 2 Issue 1, 2017 27
Functional NeuroCognitive ImagingTM and Notus NeuroCogsTM: A Novel Use of fMRI in the Assessment of Cognitive Function in Major Neurocognitive Disorder Epps et al.
Mode Network (DMN) [50]. Included in the DMN are brain regions that are activated (i.e. functional connectivity) when an individual is awake and alert but deactivated when the brain engages in task performance. Interestingly, DMN functional connectivity has been consistently shown to decrease in patients with MND, specifically Alzheimer’s disease, and even those at risk for MND development [48, 51-53]. Though the present study was particularly interested in task-related functional changes, future studies investigating the use of our protocol and DMN changes in patients with MND are warranted.
It is of utmost importance that the findings and claims presented in this report be tempered according to the several limitations of the study. First, due to the small sample size (n = 4) the ability to generalize to any population is wanting. A larger sample size must be used in future studies for more reliable generalization. Second, when considering the findings in Patient A and D, confounding factors, specifically non-reversible risk factors such as age, sex, and family history, cannot be discounted. Third, the adaptation of the cognitive functional tests for the fMRI scanning environment must demonstrate the same, if not better, sensitivity and specificity for detecting cognitive impairment as do the classic “paper and pencil” versions to merit its use in assessment of MND. This has been addressed by using standardized administration procedures, refined through years of extensive pre-testing, and verifying the validity, reliability, and objectivity of our functional task battery [22-27]. Fourth, the population from which our normative atlas was derived included healthy 19-57 year-olds. The mean age of MND onset is above 60 years of age. Therefore, the mean NVU occurring in healthy 60 + year-olds may be slightly higher than the mean derived from our normative atlas. However, studies of cognitive decline in normal aging have shown only minimal changes in NVU [54]. Also, the cognitive decline occurring in normal aging is not as diffuse as that found for patients A-D. Nevertheless, a normative atlas using a healthy population of 60 + year-olds should be obtained in future studies. Fifth, the possibilities of our described protocol to detect early brain NVU and to discriminate between severities in MND largely relies on the assumption that NVU and MND have a causal relationship. There is an increasing body of evidence supporting NVU’s role in MND. However, these studies largely investigate Alzheimer’s disease and the role between NVU and other MND’s (i.e. fronto-temporal degeneration, lewy body disease, vascular disease, substance/medication induced, prion disease, Parkinson’s disease, Huntington’s disease, MND secondary to another medical condition, MND due to multiple etiologies, and unspecified 434 MND) must further be elucidated before our protocol can be generalized to other forms of MND. Lastly, the fNCITM and Notus NeuroCogsTM protocol has largely been used in the assessment of cognitive function in patients with mild traumatic brain injury (mTBI), not MND. Regardless, the pathophysiology of cognitive decline in mTBI and MND both involve NVU and our protocol has been successfully applied to patients with other neurologic disorders such as narcolepsy and obsessive-compulsive disorder [24, 26].
Traditional assessment of MND by fMRI lacks clinical
characteristics necessary to apply this technology to the individual patient. Our fNCITM and Notus NeuroCogsTM protocol provides standardized and verified task-related tests suitable for the MRI scanning environment and the normative data required to contextualize the individual patient both on levels of characterization of cognitive impairment as well as severity. Specifically, patient A and D demonstrated the possibility of fNCITM and Notus NeuroCogsTM to a) more precisely characterize cognitive impairment in those diagnosed with MCI or MND and b) detect MND earlier, respectively.
ConclusionThis report outlines the novel use of fMRI in the
assessment of MND and demonstrates its use in four patients. Our fNCITM and Notus NeuroCogsTM protocol provides standardization and verification of classical neuropsychologic testing adapted to the MRI scanning environment with the normative data required to apply the protocol to the individual patient. fNCITM hopes to increase the clinical capability of fMRI in the assessment of MND. Thus giving clinicians a powerful tool in the assessment of cognitive impairment and helping them to guide diagnosis and therapy. The reported findings are admittedly preliminary and future studies are needed to further support the claims made in this report. Future studies using the fNCITM and Notus NeuroCogsTM protocol should focus on its use in a) early screening and detection of MCI and MND, b) establishing pre-treatment benchmarks and treatment monitoring using age appropriate study groups, c) identifying targets for neurocognitive rehabilitation and other forms of neurotherapy, d) elucidating the degree of NVU occurring in the healthy aging population, and e) characterization of MND based on specific cognitive deficits.
Conflicts of InterestDr.’s Fong and Allen are co-owners of a private clinic
where patient data was obtained for the study. This research did not receive any funding or support from agencies in the public, commercial, or not-for-profit sectors.
AcknowledgementsWe would like to thank Cognitive Fx for providing the
necessary data and patients included in this report.
References1. Association AP. 2013. Diagnostic and statistical manual of mental
disorders, 5th (DSM-5). American Psychiatric Association. Arlington, TX, USA.
2. Hebert LE, Scherr PA, Bienias JL, Bennett DA, Evans DA. 2003. Alzheimer disease in the US population: prevalence estimates using the 2000 census. Arch Neurol 60(8): 1119-1122. https://doi.org/10.1001/archneur.60.8.1119
3. Fernando MS, Ince PG, MRC Cognitive Function and Ageing Neuropathology Study Group. 2004. Vascular pathologies and cognition in a population-based cohort of elderly people. J Neurol Sci 226(1-2): 13-17. https://doi.org/10.1016/j.jns.2004.09.004
Journal of Neuroimaging in Psychiatry and Neurology | Volume 2 Issue 1, 2017 28
Functional NeuroCognitive ImagingTM and Notus NeuroCogsTM: A Novel Use of fMRI in the Assessment of Cognitive Function in Major Neurocognitive Disorder Epps et al.
4. Schneider JA, Arvanitakis Z, Bang W, Bennett DA. 2007. Mixed brain pathologies account for most dementia cases in community-dwelling older persons. Neurology 69(24): 2197-2204. https://doi.org/10.1212/01.wnl.0000271090.28148.24
5. Schneider JA, Arvanitakis Z, Leurgans SE, Bennett DA. 2009. The neuropathology of probable Alzheimer disease and mild cognitive impairment. Ann Neurol 66(2): 200-208. https://doi.org/10.1002/ana.21706
6. Tangalos EG, Smith GE, Ivnik RJ, Petersen RC, Kokmen E, et al. 1996. The Mini-Mental State Examination in general medical practice: clinical utility and acceptance. Mayo Clin Proc 71(9): 829-837. https://doi.org/10.1016/S0025-6196(11)63745-2
7. Alexander EM, Wagner EH, Buchner DM, Cain KC, Larson EB. 1995. Do surgical brain lesions present as isolated dementia? A population-based study. J Am Geriatr Soc 43(2): 138-143. https://doi.org/10.1111/j.1532-5415.1995.tb06378.x
8. Knopman DS, DeKosky ST, Cummings JL, Chui H, Corey-Bloom J, et al. 2001. Practice parameter: diagnosis of dementia (an evidence-based review). Report of the quality standards subcommittee of the american academy of neurology. Neurology 56(9): 1143-1153. https://doi.org/ 10. 1212/ WNL. 56. 9. 1143
9. Giza CC, Hovda DA. 2014. The new neurometabolic cascade of concussion. Neurosurgery 75(Suppl-4): S24-S33. https://doi.org/ 10.1227/NEU.0000000000000505
10. Mikulis DJ. 2013. Chronic neurovascular uncoupling syndrome. Stroke 44(6 Suppl 1): S55-S57. https://doi.org/10.1161/STROKEAHA.113.001081
11. Fleisher AS, Podraza KM, Bangen KJ, Taylor C, Sherzai A, et al. 2009. Cerebral perfusion and oxygenation differences in Alzheimer’s disease risk. Neurobiol Aging 30(11): 1737-1748. https://doi.org/10.1016/j.neurobiolaging.2008.01.012
12. Luckhaus C, Flub MO, Wittsack HJ, Grass-Kapanke B, Janner M, et al. 2008. Detection of changed regional cerebral blood flow in mild cognitive impairment and early Alzheimer’s dementia by perfusion-weighted magnetic resonance imaging. Neuroimage 40(2): 495-503. https://doi.org/10.1016/j.neuroimage.2007.11.053
13. Tosun D, Schuff N, Jagust W, Weiner MW, Alzheimer’’s Disease Neuroimaging Intiative. 2016. Discriminative power of arterial spin labeling magnetic resonance imaging and 18F-fluorodeoxyglucose positron emission tomography changes for amyloid-beta-positive subjects in the Alzheimer’s disease continuum. Neurodegener Dis 16(1-2): 87-94. https://doi.org/10.1159/000439257
14. Chen Y, Wolk DA, Reddin JS, Korczykowski M, Martinez PM, et al. 2011. Voxel-level comparison of arterial spin-labeled perfusion MRI and FDG-PET in Alzheimer disease. Neurology 77(22): 1977-1985. https://doi.org/10.1212/WNL.0b013e31823a0ef7
15. Iadecola C. 2013. The pathobiology of vascular dementia. Neuron 80(4): 844-866. https://doi.org/10.1016/j.neuron.2013.10.008
16. Sochocka M, Koutsouraki ES, Gasiorowski K, Leszek J. 2013. Vascular oxidative stress and mitochondrial failure in the pathobiology of Alzheimer’s disease: a new approach to therapy. CNS Neurol Disord Drug Targets 12(6): 870-881. https://doi.org/10.2174/18715273113129990072
17. Zlokovic BV. 2011. Neurovascular pathways to neurodegeneration in Alzheimer’s disease, and other disorders. Nat Rev Neurosci 12(12): 723-738. https://doi.org/10.1038/nrn3114
18. Attwell D, Buchan AM, Charpak S, Lauritzen M, Macvicar BA, et al. 2010. Glial and neuronal control of brain blood flow. Nature 468(7321): 232-243. https://doi.org/10.1038/nature09613
19. Winter F, Bludszuweit-Philipp C, Wolkenhauer O. 2017. Mathematical analysis of the influence of brain metabolism on the BOLD signal in Alzheimer’s disease. J Cereb Blood Flow Metab In Press. https://doi.org/10.1177/0271678X17693024
20. Johnson KA, Fox NC, Sperling RA, Klunk WE. 2012. Brain imaging
in Alzheimer disease. Cold Spring Harb Perspect Med 2(4): a006213. https://doi.org/10.1101/cshperspect.a006213
21. Sperling R. 2011. Potential of functional MRI as a biomarker in early Alzheimer’s disease. Neurobiol Aging 32(Suppl 1): S37-S43. https://doi.org/10.1016/j.neurobiolaging.2011.09.009
22. Allen MD, Fong AK. 2008. Clinical application of standardized cognitive assessment using fMRI. I. Matrix reasoning. Behav Neurol 20(3): 127-140. https://doi.org/10.3233/BEN-2008-0223
23. Allen MD, Fong AK. 2008. Clinical application of standardized cognitive assessment using fMRI. II. Verbal fluency. Behav Neurol 20(3): 141-152. https://doi.org/10.3233/BEN-2008-0224
24. Allen MD, Hedges DW, Farrer TJ, Larson MJ. 2012. Assessment of brain activity during memory encoding in a narcolepsy patient on and off modafinil using normative fMRI data. Neurocase 18(1): 13-25. https://doi.org/10.1080/13554794.2010.547508
25. Allen MD, Owens TE, Fong AK, Richards DR. 2011. A functional neuroimaging analysis of the trail making test-B: implications for clinical application. Behav Neurol 24(2): 159-171. https://doi.org/10.3233/BEN-2011-0278
26. Woon FL, Allen MD, Miller CH, Hedges DW. 2012. The functional magnetic resonance imaging-based verbal fluency test in obsessive-compulsive disorder. Neurocase 18(5): 424-440. https://doi.org/10.1080/13554794.2011.627342
27. Allen MD, WU TC, Bigler ED. 2011. Traumatic brain injury alters word memory test performance by slowing response time and increasing cortical activation: an fMRI study of a symptom validity test. Psychological Injury and Law 4(2): 140-146. https://doi.org/10.1007/s12207-011-9105-4
28. Mitrushina M, Boone KB, Razani J, and D’Elia LF. 2005. Handbook of normative data for neuropsychological assessment. 2nd edition, Oxford University Press, New York, USA.
29. Lezak M. 2004. Neuropsychological assessment. 4th edition, Oxford University Press, New York, USA.
30. Gron G, Bittner D, Schmitz B, Wunderlich AP, Riepe MW. 2002. Subjective memory complaints: objective neural markers in patients with Alzheimer’s disease and major depressive disorder. Ann Neurol 51(4): 491-498. https://doi.org/10.1002/ana.10157
31. Kato T, Knopman D, Liu H. 2001. Dissociation of regional activation in mild AD during visual encoding: a functional MRI study. Neurology 57(5): 812-816. https://doi.org/10. 1212/ WNL. 57. 5. 812
32. Machulda MM, Ward HA, Borowski B, Gunter JL, Cha RH, et al. 2003. Comparison of memory fMRI response among normal, MCI, and Alzheimer’s patients. Neurology 61(4): 500-506. https://doi.org/10. 1212/ WNL. 61. 8. 1164
33. Small SA, Perera GM, DeLaPaz R, Mayeux R, Stern Y. 1999. Differential regional dysfunction of the hippocampal formation among elderly with memory decline and Alzheimer’s disease. Ann Neurol 45(4): 466-472. https://doi.org/10.1002/1531-8249(199904)45:4<466::AID-ANA8>3.0.CO;2-Q
34. Sperling RA, Dickerson BC, Pihlajamaki M, Vannini P, LaViolette PS, et al. 2010. Functional alterations in memory networks in early Alzheimer’s disease. Neuromolecular Med 12(1): 27-43. https://doi.org/10.1007/s12017-009-8109-7
35. Johnson SC, Schmitz TW, Moritz CH, Meyerand ME, Rowley HA, et al. 2006. Activation of brain regions vulnerable to Alzheimer’s disease: the effect of mild cognitive impairment. Neurobiol Aging 27(11): 1604-1612. https://doi.org/10.1016/j.neurobiolaging.2005.09.017
36. Mondadori CR, de Quervain DJ, Buchmann A, Mustovic H, Wollmer MA, et al. 2007. Better memory and neural efficiency in young apolipoprotein E epsilon4 carriers. Cereb Cortex 17(8): 1934-1947. https://doi.org/10.1093/cercor/bhl103
37. Petrella JR, Krishnan S, Slavin MJ, Tran TT, Murty L, et al. 2006. Mild cognitive impairment: evaluation with 4-T functional MR imaging. Radiology 240(1): 177-186. https://doi.org/10.1148/radiol.2401050739
Journal of Neuroimaging in Psychiatry and Neurology | Volume 2 Issue 1, 2017 29
Functional NeuroCognitive ImagingTM and Notus NeuroCogsTM: A Novel Use of fMRI in the Assessment of Cognitive Function in Major Neurocognitive Disorder Epps et al.
38. Ringman JM, Medina LD, Braskie M, Rodriguez-Agudelo Y, Geschwind DH, et al. 2011. Effects of risk genes on BOLD activation in presymptomatic carriers of familial Alzheimer’s disease mutations during a novelty encoding task. Cereb Cortex 21(4): 877-883. https://doi.org/10.1093/cercor/bhq158
39. Celone KA, Calhoun VD, Dickerson BC, Atri A, Chua EF, et al. 2006. Alterations in memory networks in mild cognitive impairment and Alzheimer’s disease: an independent component analysis. J Neurosci 26(40): 10222-10231. https://doi.org/10.1523/JNEUROSCI.2250-06.2006
40. Dickerson BC, Salat DH, Greve DN, Chua EF, Rand-Giovannetti E, et al. 2005. Increased hippocampal activation in mild cognitive impairment compared to normal aging and AD. Neurology 65(3): 404-411. https://doi.org/10.1212/01.wnl.0000171450.97464.49
41. Filippini N, MacIntosh BJ, Hough MG, Goodwin GM, Frisoni GB, et al. 2009. Distinct patterns of brain activity in young carriers of the APOE-epsilon4 allele. Proc Natl Acad Sci U S A 106(17): 7209-7214. https://doi.org/10.1073/pnas.0811879106
42. Lenzi D, Serra L, Perri R, Pantano P, Lenzi GL, et al. 2011. Single domain amnestic MCI: a multiple cognitive domains fMRI investigation. Neurobiol Aging 32(9): 1542-1557. https://doi.org/10.1016/j.neurobiolaging.2009.09.006
43. Miller SL, Fenstermacher E, Bates J, Blacker D, Sperling RA, et al. 2008. Hippocampal activation in adults with mild cognitive impairment predicts subsequent cognitive decline. J Neurol Neurosurg Psychiatry 79(6): 630-635. https://doi.org/10.1136/jnnp.2007.124149
44. O’Brien JL, O’Keefe KM, LaViolette PS, DeLuca AN, Blacker D, et al. 2010. Longitudinal fMRI in elderly reveals loss of hippocampal activation with clinical decline. Neurology 74(24): 1969-1976. https://doi.org/10.1212/WNL.0b013e3181e3966e
45. Buckner RL, Sepulcre J, Talukdar T, Krienen FM, Liu H, et al. 2009. Cortical hubs revealed by intrinsic functional connectivity: mapping, assessment of stability, and relation to Alzheimer’s disease. J Neurosci 29(6): 1860-1873. https://doi.org/10.1523/JNEUROSCI.5062-08.2009
46. Klunk WE, Engler H, Nordberg A, Wang Y, Blomqvist G, et al. 2004. Imaging brain amyloid in Alzheimer’s disease with Pittsburgh Compound-B. Ann Neurol 55(3): 306-319. https://doi.org/10.1002/ana.20009
47. Sperling RA, Laviolette PS, O’Keefe K, O’Brien J, Rentz DM, et al. 2009. Amyloid deposition is associated with impaired default network function in older persons without dementia. Neuron 63(2): 178-188. https://doi.org/10.1016/j.neuron.2009.07.003
48. Hedden T, Van Dijk KR, Becker JA, Mehta A, Sperling RA, et al. 2009. Disruption of functional connectivity in clinically normal older adults harboring amyloid burden. J Neurosci 29(40): 12686-12694. https://doi.org/10.1523/JNEUROSCI.3189-09.2009
49. Sheline YI, Raichle ME, Snyder AZ, Morris JC, Head D, et al. 2010. Amyloid plaques disrupt resting state default mode network connectivity in cognitively normal elderly. Biol Psychiatry 67(6): 584-587. https://doi.org/10.1016/j.biopsych.2009.08.024
50. Buckner RL, Andrews-Hanna JR, Schacter DL. 2008. The brain’s default network: anatomy, function, and relevance to disease. Ann N Y Acad Sci 1124: 1-38. https://doi.org/10.1196/annals.1440.011
51. Brier MR, Thomas JB, Snyder AZ, Benzinger TL, Zhang D, et al. 2012. Loss of intranetwork and internetwork resting state functional connections with Alzheimer’s disease progression. J Neurosci 32(26): 8890-8899. https://doi.org/10.3389/fnhum.2015.00449
52. Gili T, Cercignani M, Serra L, Perri R, Giove F, et al. 2011. Regional brain atrophy and functional disconnection across Alzheimer’s disease evolution. J Neurol Neurosurg Psychiatry 82(1): 58-66. https://doi.org/10.1136/jnnp.2009.199935
53. Griffanti L, Dipasquale O, Lagana MM, Nemni R, Clerici M, et al. 2015. Effective artifact removal in resting state fMRI data improves detection of DMN functional connectivity alteration in Alzheimer’s disease. Front Hum Neurosci 9: 449. https://doi.org/10.3389/fnhum.2015.00449
54. Harada CN, Love MN, Triebel KL. 2013. Normal cognitive aging. Clin Geriatr Med 29(4): 737-752. https://doi.org/10.1016/j.cger.2013.07.002