Embed Size (px)
Citation preview
A
OMmrR(ioCdP
K
1
ddfmenar(
UU
0d
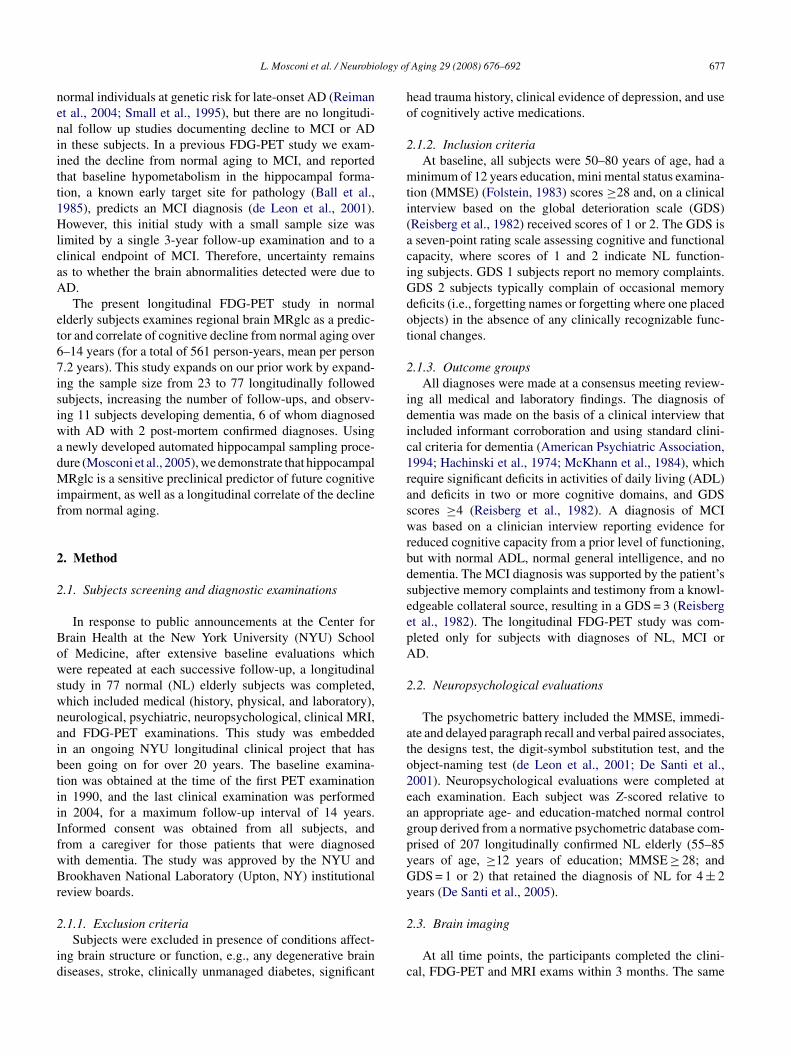
Neurobiology of Aging 29 (2008) 676–692
Hippocampal hypometabolism predictscognitive decline from normal aging
Lisa Mosconi a, Susan De Santi a, Juan Li a, Wai Hon Tsui a,b,Yi Li a, Madhu Boppana a, Eugene Laska b,
Henry Rusinek a, Mony J. de Leon a,b,∗a New York University School of Medicine, New York, NY 10016, USA
b Nathan Kline Institute, Orangeburg, NY 10962, USA
Received 20 April 2006; received in revised form 4 December 2006; accepted 5 December 2006Available online 11 January 2007
bstract
bjective: This longitudinal study used FDG-PET imaging to predict and monitor cognitive decline from normal aging.ethods: Seventy-seven 50–80-year-old normal (NL) elderly received longitudinal clinical examinations over 6–14 years (561 person-years,ean per person 7.2 years). All subjects had a baseline FDG-PET scan and 55 subjects received follow-up PET exams. Glucose metabolic
ates (MRglc) in the hippocampus and cortical regions were examined as predictors and correlates of clinical decline.esults: Eleven NL subjects developed dementia, including six with Alzheimer’s disease (AD), and 19 declined to mild cognitive impairment
MCI), on average 8 years after the baseline exam. The baseline hippocampal MRglc predicted decline from NL to AD (81% accuracy),ncluding two post-mortem confirmed cases, from NL to other dementias (77% accuracy), and from NL to MCI (71% accuracy). Greater rates
f hippocampal and cortical MRglc reductions were found in the declining as compared to the non-declining NL.onclusions: Hippocampal MRglc reductions using FDG-PET during normal aging predict cognitive decline years in advance of the clinicaliagnosis. Future studies are needed to increase preclinical specificity in differentiating dementing disorders.ublished by Elsevier Inc.pocamp
sbp
2mmcc
eywords: Alzheimer’s disease; Early detection; Glucose metabolism; Hip
. Introduction
The development of biomarkers for the preclinicaletection of neurodegenerative disease is a vital step ineveloping prevention therapies. Testing a candidate markeror Alzheimer’s disease (AD) or other dementias requiresonitoring normal healthy elderly longitudinally until they
xpress the clinical symptoms and receive the ultimate diag-ostic confirmation. A suitably sensitive biomarker must
ccurately predict the clinical endpoint and demonstrate cor-elated progression with the clinical course of the diseaseFrank et al., 2003). The low incidence and slow progres-∗ Corresponding author at: Center for Brain Health, MHL 400, New Yorkniversity School of Medicine, 560 First Avenue, New York, NY 10016,SA. Tel.: +1 212 263 5805; fax: +1 212 263 3270.
E-mail address: [email protected] (M.J. de Leon).
e((tMvtd
197-4580/$ – see front matter. Published by Elsevier Inc.oi:10.1016/j.neurobiolaging.2006.12.008
us; Mild cognitive impairment; Normal aging
ion of normal elderly to dementia (Petersen et al., 1999) haseen a major obstacle in the design of studies to identify brainredictors of future cognitive impairment.
Positron emission tomography (PET) imaging with-[18F]fluoro-2-deoxy-d-glucose (FDG) is a candidateodality for detecting the preclinical stages of dementia byeasuring reductions in the cerebral metabolic rate for glu-
ose (MRglc). FDG-PET studies show that brain MRglc isonsistently reduced in AD and other major neurodegen-rative disorders, as well as in mild cognitive impairmentMCI), a condition at high-risk for developing dementiaGauthier et al., 2006; Petersen et al., 1999), the extent ofhe metabolic reduction being related to disease severity (see
osconi, 2005; Nestor et al., 2004 for review). However,ery little work has been done with FDG-PET to study theransition from normal aging to AD and other dementingisorders. FDG-PET studies show reduced brain MRglc in
logy of
neniitt1HlcaA
et67isiwadMif
2
2
BowswnaibtiiIfwBr
2
id
ho
2
mti(aciGdot
2
idic1raswrbdseepA
2
ato2eagpyGy
L. Mosconi et al. / Neurobio
ormal individuals at genetic risk for late-onset AD (Reimant al., 2004; Small et al., 1995), but there are no longitudi-al follow up studies documenting decline to MCI or ADn these subjects. In a previous FDG-PET study we exam-ned the decline from normal aging to MCI, and reportedhat baseline hypometabolism in the hippocampal forma-ion, a known early target site for pathology (Ball et al.,985), predicts an MCI diagnosis (de Leon et al., 2001).owever, this initial study with a small sample size was
imited by a single 3-year follow-up examination and to alinical endpoint of MCI. Therefore, uncertainty remainss to whether the brain abnormalities detected were due toD.The present longitudinal FDG-PET study in normal
lderly subjects examines regional brain MRglc as a predic-or and correlate of cognitive decline from normal aging over–14 years (for a total of 561 person-years, mean per person.2 years). This study expands on our prior work by expand-ng the sample size from 23 to 77 longitudinally followedubjects, increasing the number of follow-ups, and observ-ng 11 subjects developing dementia, 6 of whom diagnosedith AD with 2 post-mortem confirmed diagnoses. Usingnewly developed automated hippocampal sampling proce-ure (Mosconi et al., 2005), we demonstrate that hippocampalRglc is a sensitive preclinical predictor of future cognitive
mpairment, as well as a longitudinal correlate of the declinerom normal aging.
. Method
.1. Subjects screening and diagnostic examinations
In response to public announcements at the Center forrain Health at the New York University (NYU) Schoolf Medicine, after extensive baseline evaluations whichere repeated at each successive follow-up, a longitudinal
tudy in 77 normal (NL) elderly subjects was completed,hich included medical (history, physical, and laboratory),eurological, psychiatric, neuropsychological, clinical MRI,nd FDG-PET examinations. This study was embeddedn an ongoing NYU longitudinal clinical project that haseen going on for over 20 years. The baseline examina-ion was obtained at the time of the first PET examinationn 1990, and the last clinical examination was performedn 2004, for a maximum follow-up interval of 14 years.nformed consent was obtained from all subjects, androm a caregiver for those patients that were diagnosedith dementia. The study was approved by the NYU androokhaven National Laboratory (Upton, NY) institutional
eview boards.
.1.1. Exclusion criteriaSubjects were excluded in presence of conditions affect-
ng brain structure or function, e.g., any degenerative brainiseases, stroke, clinically unmanaged diabetes, significant
2
c
Aging 29 (2008) 676–692 677
ead trauma history, clinical evidence of depression, and usef cognitively active medications.
.1.2. Inclusion criteriaAt baseline, all subjects were 50–80 years of age, had a
inimum of 12 years education, mini mental status examina-ion (MMSE) (Folstein, 1983) scores ≥28 and, on a clinicalnterview based on the global deterioration scale (GDS)Reisberg et al., 1982) received scores of 1 or 2. The GDS isseven-point rating scale assessing cognitive and functionalapacity, where scores of 1 and 2 indicate NL function-ng subjects. GDS 1 subjects report no memory complaints.DS 2 subjects typically complain of occasional memoryeficits (i.e., forgetting names or forgetting where one placedbjects) in the absence of any clinically recognizable func-ional changes.
.1.3. Outcome groupsAll diagnoses were made at a consensus meeting review-
ng all medical and laboratory findings. The diagnosis ofementia was made on the basis of a clinical interview thatncluded informant corroboration and using standard clini-al criteria for dementia (American Psychiatric Association,994; Hachinski et al., 1974; McKhann et al., 1984), whichequire significant deficits in activities of daily living (ADL)nd deficits in two or more cognitive domains, and GDScores ≥4 (Reisberg et al., 1982). A diagnosis of MCIas based on a clinician interview reporting evidence for
educed cognitive capacity from a prior level of functioning,ut with normal ADL, normal general intelligence, and noementia. The MCI diagnosis was supported by the patient’subjective memory complaints and testimony from a knowl-dgeable collateral source, resulting in a GDS = 3 (Reisbergt al., 1982). The longitudinal FDG-PET study was com-leted only for subjects with diagnoses of NL, MCI orD.
.2. Neuropsychological evaluations
The psychometric battery included the MMSE, immedi-te and delayed paragraph recall and verbal paired associates,he designs test, the digit-symbol substitution test, and thebject-naming test (de Leon et al., 2001; De Santi et al.,001). Neuropsychological evaluations were completed atach examination. Each subject was Z-scored relative ton appropriate age- and education-matched normal controlroup derived from a normative psychometric database com-rised of 207 longitudinally confirmed NL elderly (55–85ears of age, ≥12 years of education; MMSE ≥ 28; andDS = 1 or 2) that retained the diagnosis of NL for 4 ± 2ears (De Santi et al., 2005).
.3. Brain imaging
At all time points, the participants completed the clini-al, FDG-PET and MRI exams within 3 months. The same

6 logy of
Pe
2
92odetnriasscwoot(us0o
2
((rcTGtT
2
MrbvStsCecg3ri
ramuseetattPr1
w(momssrpAwa
(eNoiwasttwP
bsFetaeAuT
78 L. Mosconi et al. / Neurobio
ET and MRI scanners and scan protocols were used for allxaminations.
.3.1. FDG-PET studyFDG-PET scans were acquired at BNL on a CTI-
31 scanner (Siemens, Knoxville, TN; 10 cm axial FOV,0 cm transaxial FOV, 6.2 mm FWHM in-plane axial res-lution, 6.7 mm cross-slice resolution, 6.75 mm inter-sliceistance) as described (de Leon et al., 2001; De Santit al., 2001). Each subject’s head was positioned usingwo orthogonal laser beams and imaged with the scan-er tilted 25◦ negative to the canthomeatal plane. Subjectseceived 5–8 mCi of FDG intravenously while laying supinen a dimly lit room. PET images were obtained 35 minfter injection and acquired over 20 min. Arterial bloodamples were drawn at standard intervals throughout thetudy and the absolute glucose consumption rate was cal-ulated using the Sokoloff equation (Sokoloff et al., 1977)ith standard kinetic constants (Reivich et al., 1985). Webtained and interleaved two 15-slice PET volumes thatverlapped by a half-slice thickness (∼3.4 mm) to improvehe counting statistics and reduce tissue sampling errorsde Leon et al., 2001). Attenuation correction was obtainedsing 68Ga/68Ge transmission scans. Images were recon-tructed using the Hanning filter with a frequency cut-off of.5 cycles/pixel, yielding 128 × 128 matrix with a pixel sizef 1.56 mm.
.3.2. MRI studyMRI scans were acquired on a 1.5 T GE Signa imager
General Electric, Milwaukee, USA) as previously describedde Leon et al., 2001; Rusinek et al., 2003). All subjectseceived clinical and research MRI studies. The clinical MRIonsisted of contiguous 3 mm axial T2-weighted images.he research MRI was a 124 slice T1-weighted Fast-radient-Echo acquired in a coronal orientation as 1.3 mm
hick sections (FOV = 18 cm, NEX = 1, matrix = 256 × 128,R = 35 ms, TE = 9 ms and FA = 60◦).
.4. Image analysis
All PET scans were coregistered with the correspondingRI. After MRI-coregistration, the PET scans were cor-
ected for CSF partial volume effects (Ibanez et al., 1999)y using a 2-segment (i.e., brain tissue and CSF) partialolume correction (PVC) model (de Leon et al., 2001; Deanti et al., 2001; Meltzer et al., 1990). Based on phan-
om validated threshold techniques, MRI regions are locallyampled to minimize RF coil inhomogeneity (Rusinek andhandra, 1993) and converted to binary images where pix-ls corresponding to brain are given a value of 1 and thoseorresponding to non-brain, such as CSF and air spaces, are
iven a value of 0. This binary image is convolved with theD point spread function of the PET camera, resulting in aecovery coefficient (RC) image, and the coregistered PETmage is divided by the RC image to yield PET images cor-2
p
Aging 29 (2008) 676–692
ected for the partial volume of CSF. All subsequent PETnalyses were done with and without PVC. Statistical Para-etric Mapping (SPM’2) (Friston et al., 1995) routines were
sed to spatially normalize the MRI scans to a custom-madetandard MRI brain template (Friston et al., 1995; Mosconit al., 2005). The spatial normalization process involvesstimating the optimum (least squares) 12-parameter affineransformation, followed by an iterative estimate of locallignment based on a family of 7 × 8 × 7 discrete cosine func-ions (Friston et al., 1995). The estimated parameters werehen applied to spatially normalize the MRI-coregisteredET scans. The spatially normalized PET images were thenesampled on a 105 × 126 × 91 matrix with a voxel size of.5 mm × 1.5 mm × 1.5 mm.
The HipMask sampling technique (Mosconi et al., 2005)as used to sample hippocampal metabolic rate for glucose
MRglc). This technique uses a probabilistic hippocampalasking image (HipMask) that samples only those portions
f the hippocampus where the overlap across subjects isaximal after inter-subject averaging. For each PET, the
ampling accuracy was verified on the coregistered MRIcans. The procedure has been validated against manualegions-of-interest measurements showing equivalent hip-ocampal metabolism sampling estimates in NL, MCI andD (Mosconi et al., 2005). Metabolic means (�mol/(g min))ere computed and the hippocampal MRglc values averaged
cross hemispheres.Given reports of consistent posterior cingulate cortex
PCC) MRglc abnormalities in MCI and early AD (Chetelatt al., 2003; Drzezga et al., 2003; Minoshima et al., 1997;estor et al., 2003), this region was examined using a regionf interest (ROI) approach (Mosconi et al., 2005). A maskingmage of the PCC was created in the space of the templateith the SPM-compatible WFU Pick Atlas tool (Maldjian et
l., 2003) [http://www.fmri.wfubmc.edu/] and was used as atandardized ROI. The PCC ROI sampled the gray matter ofhe retrosplenial cortex (Brodmann Areas, BA, 29/30) andhe dorsal PCC (BA 23) (Nestor et al., 2003). The PCC ROIas applied to the spatially normalized PET scans to sampleCC MRglc (�mol/(g min)).
SPM’2 was used to examine MRglc effects in the whole-rain on a voxel-wise basis. As per accepted methods, thepatially normalized PET scans were smoothed with a 12 mmWHM Gaussian filter prior to group comparisons (Fristont al., 1995). Only voxels with values greater than 80% ofhe whole brain mean MRglc were included in the analysisnd only clusters exceeding an extent threshold of 30 vox-ls (i.e., >2 times the FWHM) were considered significant.natomical location of hypometabolic areas was describedsing the Talairach and Tournoux coordinates (Talairach andournoux, 1988).
.5. Statistical analysis
Our first aim was to test the hypothesis that hippocam-al MRglc reductions during the normal stages of cognition
logy of
awcM
Iuaaav
ptdhewdawapec
tgaFjsatg
gbapapgfwt
pb(Nt
afb
ai
aq
3
3
a5DdbsdMNt6tmtd(i
eotr2tPacba(GPs3(t9
aa
L. Mosconi et al. / Neurobio
re predictive of future cognitive decline. Our second aimas to determine whether greater rates of MRglc reduction
orrelate with the progression from normal aging to AD andCI.SPSS (version 12.0; Chicago, IL), SAS (version 8.02; SAS
nstitute Inc., Cary, NC) and SPM’2 (Friston et al., 1995) weresed for data analyses. MRglc data were residualized for agend pons MRglc. Pons MRglc was sampled at the centre ofmid pontine slice with a 16 mm × 16 mm box (De Santi et
l., 2001; Mosconi et al., 2005) and was used to adjust forariations in global MRglc (Minoshima et al., 1995).
The general linear model/univariate analysis (GLM) withost hoc LSD tests and chi-square (χ2) tests were used toest for clinical, neuropsychological and baseline MRglcifferences across outcome groups in the examination ofypothesis 1. Logistic and Weibull survival regression mod-ls (Hosmer and Lemeshow, 1999) were used to examinehether the probability of decline and the time to clinicalecline can be predicted by the baseline MRglc measures,fter controlling for age, gender, and education. Stepwise for-ard logistic regressions were used to examine the combined
nd incremental accuracy of the baseline MRglc measures asredictors of outcome. The reliability of the prediction mod-ls was assessed by cross-validation, using the leave-one-outlassification method.
Hierarchical mixed (random) effects models were used inhe examination of hypothesis 2 to calculate individual lon-itudinal trajectories of MRglc reductions over time afterdjusting for subject-specific effects (Diggle et al., 2002;riston et al., 2004) ((A) Appendix A). The individual tra-
ectories were used to estimate the regional MRglc for eachubject at the time of decline (Diggle et al., 2002; Friston etl., 2004) ((B) Appendix A). The GLM with post hoc LSDests was used to test for MRglc differences across outcomeroups at the time of decline.
Linear regressions were applied to the baseline and lon-itudinal MRglc of the brain regions showing significantaseline and longitudinal group effects to estimate the aver-ge age of disease origin and the average number of yearsrior to diagnosis when statistical differentiation was possiblecross outcome groups (Diggle et al., 2002). This was accom-lished by estimating the mean MRglc measures for eachroup every 0.5 years prior to the baseline after accountingor pons MRglc. For each time point the mean MRglc valuesere compared between groups using independent-sample
-tests.In additional analyses, we compared MRglc in the hip-
ocampus and PCC at baseline and at the time of declineetween amnestic and non-amnestic NL–MCI subgroupsPetersen et al., 1999), and between NL–MCI subgroups andL–NL using the GLM/univariate analysis accounting for
he same confounds as above.
Results were considered significant at p < .05. For the SPMnalyses, the reporting criterion was p < .05, after correctionor family-wise errors (FWE). As the FWE correction maye overly conservative in neuroimaging studies, results were
(d(i
Aging 29 (2008) 676–692 679
lso assessed at p < .001, uncorrected for multiple compar-sons (Friston et al., 1995).
PET analyses were done with and without PVC. Resultsre first presented without PVC, and with PVC in a subse-uent section.
. Results
.1. Clinical and neuropsychological study
All 77 NL subjects received a baseline FDG-PET scan andt least two follow-up clinical evaluations during a total of61 person-years of follow-up (mean per person 7.2 years).uring this interval, 11/77 (14%) of the baseline NL subjectseveloped dementia, of whom 6 fulfilled criteria for proba-le AD (NL–AD). Of the other 5 decliners (NL–non-AD), 3ubjects developed vascular dementia, 1 subject Parkinson’sisease and 1 subject Fronto-temporal dementia. Decline toCI was observed in 19/77 (25%) subjects (NL–MCI). AllL–MCI subjects showed objective evidence for mild cogni-
ive impairment on psychometric examination. This includedamnestic MCI subjects (memory scores ≥1.5 S.D. below
he NL reference values (Petersen et al., 1999)), 6 MCI withemory scores 1 S.D. below NL, and 7 with scores on atten-
ion or language tests 1 S.D. below NL without memoryeficits. A total of 47/77 (61%) subjects remained normalNL–NL). Clinical characteristics of these subjects are foundn Table 1.
The five subjects who developed other dementias were notnrolled in the longitudinal PET study but received at leastne clinical follow-up visit. Of the remaining 72 subjectshat were enrolled in the longitudinal PET study, 8 did noteturn for the follow-up PET but all 72 did return for at leastclinical follow-up visits. Nine NL–NL subjects completed
he follow-up PET but were excluded from the longitudinalET analysis due to technical reasons related to the scans (i.e.,rtifacts or incomplete head coverage which precluded imageoregistration and size normalization of the PET scans, seeelow). Overall, all 77 subjects had a baseline FDG-PET scannd follow-up clinical exams, and a total of 55/77 subjectsbaseline age 67 ± 6 years, 64% female, 17 subjects withDS = 1 and 38 with GDS = 2) also received longitudinalET scans. Of these 55 subjects, all had one follow-up PETtudy after 3 ± 1 (range 2–4) years from the baseline, and0/55 subjects also had a second follow-up PET study 9 ± 2range 6–11) years from the baseline. The 30 subjects withhe second follow-up PET included all the 6 NL–AD subjects,NL–MCI, and 15 NL–NL.With respect to the baseline, decline to AD was observed
fter 8 ± 3 (range 6–14) years, decline to another dementiafter 3 ± 1 (range 2–5) years, and decline to MCI after 8 ± 2
range 4–12) years from baseline. All six NL–AD received aiagnosis of MCI before declining to AD, on average 3 ± 1range 2–5) years after the baseline. This transition occurredn five subjects by the time of the second follow-up PET scan,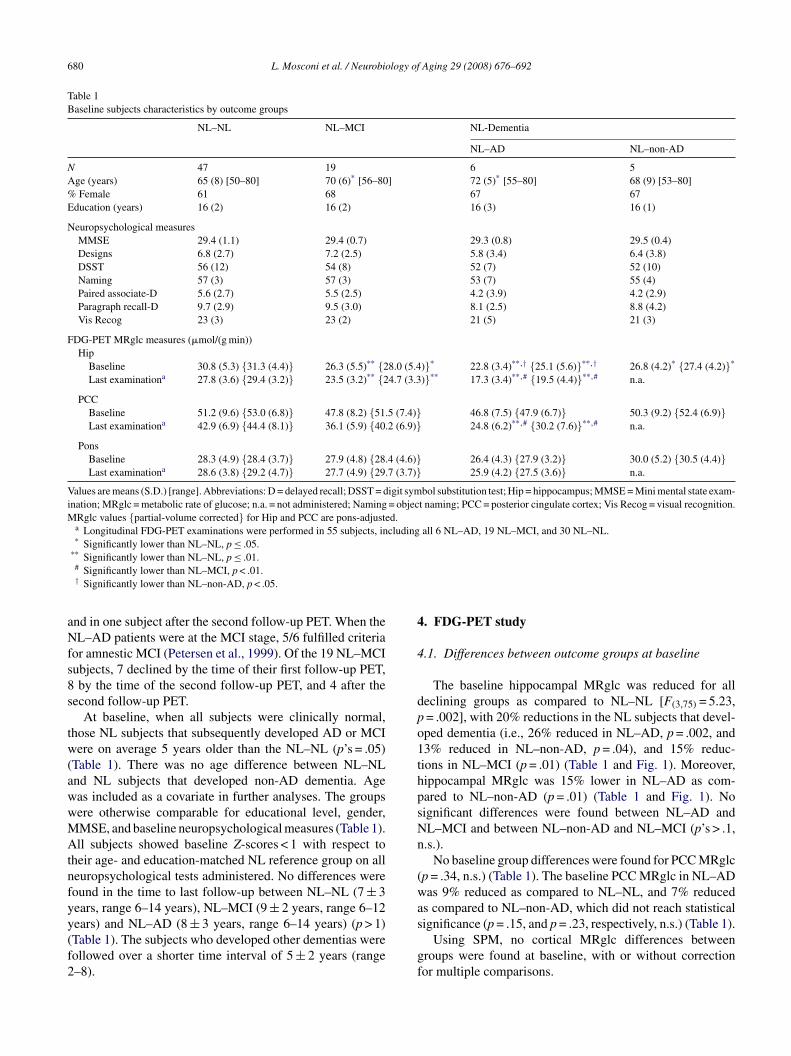
680 L. Mosconi et al. / Neurobiology of Aging 29 (2008) 676–692
Table 1Baseline subjects characteristics by outcome groups
NL–NL NL–MCI NL-Dementia
NL–AD NL–non-AD
N 47 19 6 5Age (years) 65 (8) [50–80] 70 (6)* [56–80] 72 (5)* [55–80] 68 (9) [53–80]% Female 61 68 67 67Education (years) 16 (2) 16 (2) 16 (3) 16 (1)
Neuropsychological measuresMMSE 29.4 (1.1) 29.4 (0.7) 29.3 (0.8) 29.5 (0.4)Designs 6.8 (2.7) 7.2 (2.5) 5.8 (3.4) 6.4 (3.8)DSST 56 (12) 54 (8) 52 (7) 52 (10)Naming 57 (3) 57 (3) 53 (7) 55 (4)Paired associate-D 5.6 (2.7) 5.5 (2.5) 4.2 (3.9) 4.2 (2.9)Paragraph recall-D 9.7 (2.9) 9.5 (3.0) 8.1 (2.5) 8.8 (4.2)Vis Recog 23 (3) 23 (2) 21 (5) 21 (3)
FDG-PET MRglc measures (�mol/(g min))Hip
Baseline 30.8 (5.3) {31.3 (4.4)} 26.3 (5.5)** {28.0 (5.4)}* 22.8 (3.4)**,† {25.1 (5.6)}**,† 26.8 (4.2)* {27.4 (4.2)}*
Last examinationa 27.8 (3.6) {29.4 (3.2)} 23.5 (3.2)** {24.7 (3.3)}** 17.3 (3.4)**,# {19.5 (4.4)}**,# n.a.
PCCBaseline 51.2 (9.6) {53.0 (6.8)} 47.8 (8.2) {51.5 (7.4)} 46.8 (7.5) {47.9 (6.7)} 50.3 (9.2) {52.4 (6.9)}Last examinationa 42.9 (6.9) {44.4 (8.1)} 36.1 (5.9) {40.2 (6.9)} 24.8 (6.2)**,# {30.2 (7.6)}**,# n.a.
PonsBaseline 28.3 (4.9) {28.4 (3.7)} 27.9 (4.8) {28.4 (4.6)} 26.4 (4.3) {27.9 (3.2)} 30.0 (5.2) {30.5 (4.4)}Last examinationa 28.6 (3.8) {29.2 (4.7)} 27.7 (4.9) {29.7 (3.7)} 25.9 (4.2) {27.5 (3.6)} n.a.
Values are means (S.D.) [range]. Abbreviations: D = delayed recall; DSST = digit symbol substitution test; Hip = hippocampus; MMSE = Mini mental state exam-ination; MRglc = metabolic rate of glucose; n.a. = not administered; Naming = object naming; PCC = posterior cingulate cortex; Vis Recog = visual recognition.MRglc values {partial-volume corrected} for Hip and PCC are pons-adjusted.
a Longitudinal FDG-PET examinations were performed in 55 subjects, including all 6 NL–AD, 19 NL–MCI, and 30 NL–NL.* Significantly lower than NL–NL, p ≤ .05.
**
aNfs8s
tw(awwMAtnfyy(f2
4
4
dpo1thpsNn
(wa
Significantly lower than NL–NL, p ≤ .01.# Significantly lower than NL–MCI, p < .01.† Significantly lower than NL–non-AD, p < .05.
nd in one subject after the second follow-up PET. When theL–AD patients were at the MCI stage, 5/6 fulfilled criteria
or amnestic MCI (Petersen et al., 1999). Of the 19 NL–MCIubjects, 7 declined by the time of their first follow-up PET,by the time of the second follow-up PET, and 4 after the
econd follow-up PET.At baseline, when all subjects were clinically normal,
hose NL subjects that subsequently developed AD or MCIere on average 5 years older than the NL–NL (p’s = .05)
Table 1). There was no age difference between NL–NLnd NL subjects that developed non-AD dementia. Ageas included as a covariate in further analyses. The groupsere otherwise comparable for educational level, gender,MSE, and baseline neuropsychological measures (Table 1).ll subjects showed baseline Z-scores < 1 with respect to
heir age- and education-matched NL reference group on alleuropsychological tests administered. No differences wereound in the time to last follow-up between NL–NL (7 ± 3ears, range 6–14 years), NL–MCI (9 ± 2 years, range 6–12
ears) and NL–AD (8 ± 3 years, range 6–14 years) (p > 1)Table 1). The subjects who developed other dementias wereollowed over a shorter time interval of 5 ± 2 years (range–8).s
gf
. FDG-PET study
.1. Differences between outcome groups at baseline
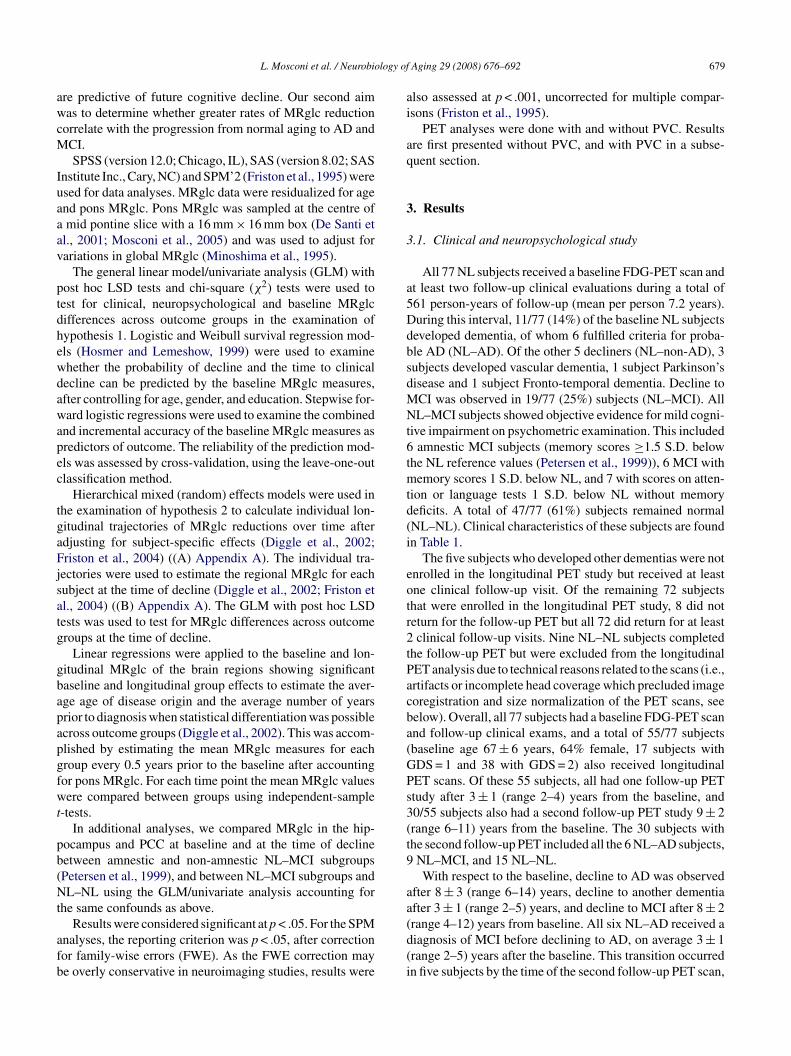
The baseline hippocampal MRglc was reduced for alleclining groups as compared to NL–NL [F(3,75) = 5.23,= .002], with 20% reductions in the NL subjects that devel-ped dementia (i.e., 26% reduced in NL–AD, p = .002, and3% reduced in NL–non-AD, p = .04), and 15% reduc-ions in NL–MCI (p = .01) (Table 1 and Fig. 1). Moreover,ippocampal MRglc was 15% lower in NL–AD as com-ared to NL–non-AD (p = .01) (Table 1 and Fig. 1). Noignificant differences were found between NL–AD andL–MCI and between NL–non-AD and NL–MCI (p’s > .1,.s.).
No baseline group differences were found for PCC MRglcp = .34, n.s.) (Table 1). The baseline PCC MRglc in NL–ADas 9% reduced as compared to NL–NL, and 7% reduced
s compared to NL–non-AD, which did not reach statistical
ignificance (p = .15, and p = .23, respectively, n.s.) (Table 1).Using SPM, no cortical MRglc differences betweenroups were found at baseline, with or without correctionor multiple comparisons.
L. Mosconi et al. / Neurobiology of
Fig. 1. Pons-adjusted baseline hippocampal (Hip) and posterior cingulatecbc
4
l87pcNfiO
tAχ
p7NC
brNpw(OM
11
fy[ndptpb
n
np
mf[da
76cnanpr
Miira
ortex (PCC) glucose metabolism (�mol/(g min)) by outcome group. Sym-ols: NL–NL (black squares), NL–MCI (white circles), NL–AD (blackircles), and NL–non-AD (white diamonds).
.2. Predicting who will decline
After accounting for age, education, and gender, the base-ine hippocampal MRglc predicted future dementia with2% sensitivity (9/11 decliners correctly identified) and9% specificity (37/47 NL–NL) [79% accuracy, χ2
(1) = 6.2,= .01, odds ratio (OR) = 2.3, 95% CI = 2.0–2.7]. Specifi-
ally, hippocampal MRglc correctly predicted decline fromL to AD with 83% sensitivity (5/6 NL–AD) and 81% speci-city (38/47 NL–NL) [81% accuracy, χ2(1) = 6.7, p < .01,R = 2.3, 95% CI = 2.0–2.6], and predicted decline from NL
1awχ
Aging 29 (2008) 676–692 681
o non-AD dementia with 80% sensitivity (4/5 NL–non-D) and 77% specificity (36/47 NL–NL) [77% accuracy,2(1) = 6.71, p = .023, OR = 2.1, 95% CI = 1.4–2.4]. Hip-ocampal MRglc predicted decline from NL to MCI with4% sensitivity (14/19 NL–MCI) and 70% specificity (33/47L–NL) [71% accuracy, χ2
(1) = 9.94, p = .01, OR = 2.1, 95%I = 1.8–2.6].
Although both NL–AD and NL–non-AD showed reducedaseline hippocampal MRglc as compared to NL–NL, theeduction was more severe in NL–AD as compared toL–non-AD (see above). As a result, the baseline hip-ocampal MRglc distinguished NL–AD from NL–non-ADith 83% sensitivity (4/5 NL–AD) and 60% specificity
3/5 NL–non-AD) [73% accuracy, χ2(1) = 6.03, p = .014,
R = 1.5, 95% CI = 0.7–2.1]. The baseline hippocampalRglc did not distinguish NL–AD from NL–MCI [χ2
(1) =.92, p = .19, n.s.], nor NL–non-AD from NL–MCI [χ2
(1) =.86, p = .12, n.s.].
The baseline PCC MRglc did not significantly predictuture cognitive decline from NL. Baseline PCC MRglcielded 55% accuracy in predicting decline from NL to AD67% sensitivity and 53% specificity, χ2
(1) = 1.26, p = .26,.s.], 57% accuracy in predicting decline from NL to non-ADementia [60% sensitivity and 57% specificity, χ2
(1) = 0.95,= .33, n.s.], and 56% accuracy in predicting decline from NL
o MCI [63% sensitivity and 53% specificity, χ2(1) = 1.56,
= .21, n.s.]. The baseline PCC MRglc did not distinguishetween NL–AD and NL–non-AD [χ2
(1) = 2.15, p = .12,
.s], between NL–AD and NL–MCI [χ2(1) = 1.84, p = .18,
.s]., and between NL–MCI and NL–non-AD [χ2(1) = 1.26,
= .23, n.s].Combining the baseline hippocampal and PCC MRglc
easures in the logistic regression model predicted declinerom NL to AD with 83% sensitivity and 85% specificity85% accuracy, χ2
(2) = 9.71, p = .008], from NL to non-ADementia with 60% sensitivity and 81% specificity [79%ccuracy, χ2
(2) = 4.12, p = .045], and from NL to MCI with
4% sensitivity and 70% specificity [71% accuracy, χ2(2) =
.56, p = .038]. Therefore, the prediction accuracy of theombined baseline hippocampal and PCC MRglc was not sig-ificantly higher than that of the baseline hippocampus alone,nd adding the baseline PCC to the hippocampal MRglc didot significantly improve the prediction accuracy of the hip-ocampal MRglc measures for any comparisons [χ2
increment (1)ange: 0.81–1.14, p’s > .1, n.s.].
Likewise, adding the baseline PCC to the hippocampalRglc in the logistic regression model did not significantly
mprove the accuracy of the hippocampal MRglc measuresn the discrimination between outcome groups [χ2
increment (1)ange: 1.12–1.29, p’s > .1, n.s.]. It is worth noticing that,lthough the increment was not significant χ2
increment (1) =.49, p = .22, n.s.], the combination of baseline hippocampal
nd PCC MRglc distinguished NL–AD from NL–non-ADith 83% sensitivity and 80% specificity [82% accuracy,2(2) = 7.52, p = .023]. The gain in specificity from 60%, as
682 L. Mosconi et al. / Neurobiology of
Fig. 2. Hippocampal glucose metabolism and the risk for Alzheimer’s dis-ease (AD). Weibull survival regression curves of normal subjects whosehippocampal (Hip) metabolism (MRglc, �mol/(g min)) at baseline was ≤24(bold line), 25–29 (plain line), and ≥30 (dashed line). The prediction modelshows that for baseline Hip MRglc ≤24 �mol/(g min) the median predictedtime to decline to AD is 7 years, for baseline Hip MRglc 25–29 �mol/(g min)the median predicted time to decline to AD is 9.5 years, and for baselineHgt
otcc
4
ptud[(o[y
7otMotMoa≥N1
dp
4
gN(
f(pb
eA(Zr(NNrr
4.5. Differences between outcome groups at the time of
Fp
ip MRglc ≥30 �mol/(g min) the median predicted time to decline to AD isreater than 14 years. The median estimated time to decline to AD for eachertile of Hip MRglc is indicated with dashed arrows.
btained by using the hippocampus alone, to 80% by usinghe combined hippocampus and PCC, derives from correctlylassifying one additional NL–non-AD subject that was mis-lassified as NL–AD by using the hippocampal MRglc alone.
.3. Predicting the time to decline
Weibull regression models showed that baseline hip-ocampal MRglc is a statistically significant predictor ofhe time to cognitive decline [χ2
(1) = 4.5, p = .03]. For everynit decrease in baseline hippocampal MRglc, the time toecline to AD is decreased by 8.7% (95% CI: 3.0–14.1%)χ2
(1) = 8.6, p = .003], which corresponds to a time ratio
TR) of 1.1 (95% CI: 1.0–1.4) years; the time to decline tother dementias is decreased by 4.7% (95% CI: .3–8.9%)χ2(1) = 4.6, p < .05], for a TR of 1.0 (95% CI: 0.8–1.2)ears; and the time to decline to MCI is decreased by
d
b
ig. 3. Individual trajectories of Hip glucose metabolism (�mol/(g min), pons-adjlotted relative to the time of the first PET examination for NL–NL (black squares)
Aging 29 (2008) 676–692
.2% (95% CI: 2.8–11.5%) [χ2(1) = 9.93, p < .01], for a TR
f 1.08 years (95% CI: 1.03–1.11). As shown in Fig. 2,he prediction model shows that a baseline hippocampal
Rglc ≤ 24 �mol/(g min) (corresponding to the averagef the NL–AD group) predicts the median time to declineo be 7 years. For comparison, for baseline hippocampal
Rglc 25–29 �mol/(g min) (corresponding to the averagef the NL–MCI group) the predicted time to decline isbout 9.5 years, while for baseline hippocampal MRglc30 �mol/(g min) (corresponding to the average of theL–NL group) the predicted time to decline is greater than4 years and beyond the follow-up interval in our study.
Since the baseline PCC MRglc was not a significant pre-ictor of future decline, this ROI was not examined as aredictor of the time to cognitive decline.
.4. Longitudinal differences between outcome groups
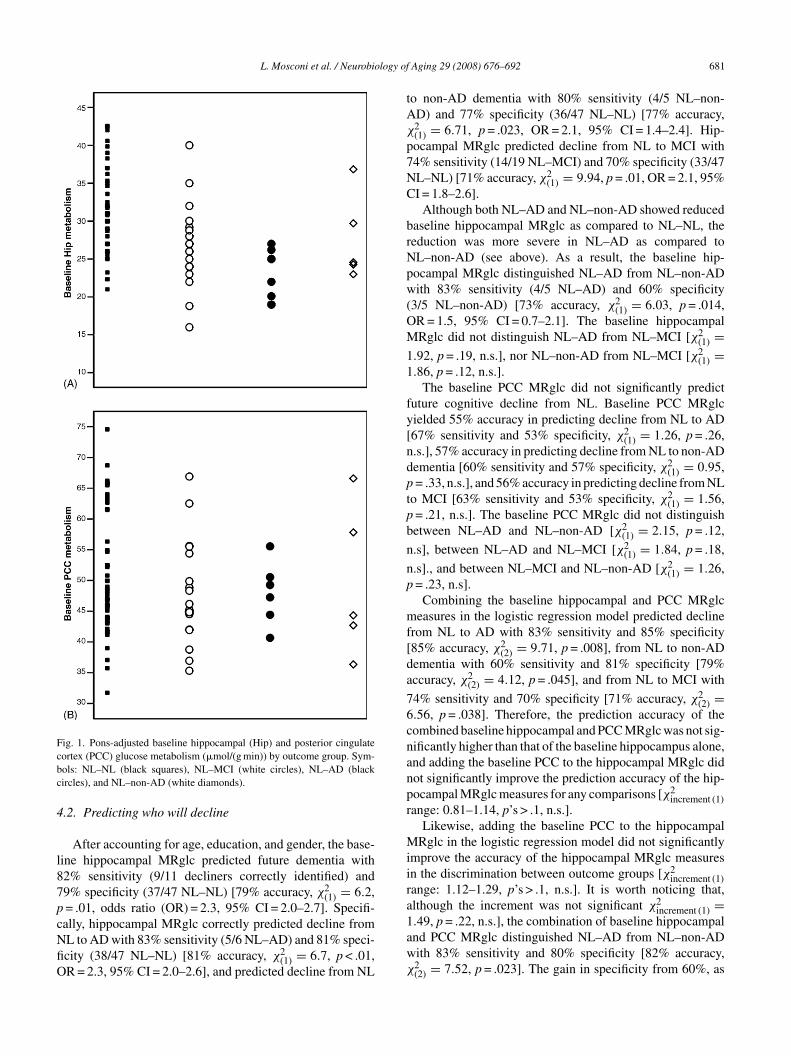
The annual rate of hippocampal MRglc reduction wasreater for the NL–AD (−4.4 ± 0.7%, p < .001) and theL–MCI (−2.3 ± 0.2%, p < .01) relative to the NL–NL
−0.8 ± 0.3%) (Fig. 3).The annual rate of PCC MRglc reduction was higher
or the NL–AD (−4.1 ± 0.8%) relative to the NL–NL−1.3 ± 0.8%, p = .005) and to the NL–MCI (−1.8 ± 0.9%,= .034). The rate of PCC MRglc reduction was not differentetween NL–NL and NL–MCI (p = .50, n.s.).
SPM analyses showed group by time MRglc interactionffects in the left middle temporal gyrus (MiTG, Brodmannrea 21, cluster extent = 120 voxels; Talairach coordinates
Talairach and Tournoux, 1988): x = −61, y = −44, z = −8,score = 4.09, p < .05 cluster-level corrected). The annual
ate of MiTG MRglc reduction was higher for the NL–AD−1.5 ± 0.3%) relative to the NL–NL (0.3 ± 0.6%) and to theL–MCI (−0.4 ± 0.5%) (p’s < .05), and was higher for theL–MCI relative to the NL–NL (p = .02). No other cortical
egions showed longitudinal effects by examining the SPMesults at p < .001, uncorrected.
ecline
At the time of decline, hippocampal MRglc was reduced inoth NL–AD (38%, p < .001) and NL–MCI (16%, p < .001)
usted, atrophy corrected values) derived from the mixed effects model are, NL–MCI (white circles), and NL–AD (black circles).
L. Mosconi et al. / Neurobiology of Aging 29 (2008) 676–692 683
Table 2Results from SPM study: cross-sectional group differences at the time of decline
Cluster size Coordinatesa Z† Functional area Brodmann area
x y z
Reduced MRglc for NL–MCI relative to NL–NL124 −47 −34 6 2.78 Superior temporal gyrus 22
Reduced MRglc for NL–AD relative to NL–NL1952 60 −48 32 4.57 Inferior parietal lobule 40
58 −54 35 4.32 40614 −48 −55 38 3.68 Inferior parietal lobule 40
−41 −53 44 3.39 40237 −3 −64 18 3.23 Posterior cingulate gyrus 31177 −63 −36 1 3.42 Middle temporal gyrus 21
Reduced MRglc for NL–AD relative to NL–MCI1043 53 −52 32 4.12 Inferior parietal lobule 40
326 −53 −56 40 4.07 Inferior parietal lobule 40323 −4 −67 20 3.25 Posterior cingulate gyrus 31
istancep ferior (−
ap
NNMn
tc
TsaaS
FtM
a Coordinates from the atlas of Talairach and Tournoux (1988). x is the dosterior (−) to the anterior commissure; z is the distance superior (+) or in† Z values at p < .05, corrected for multiple comparisons.
s compared to NL–NL, and was reduced in NL–AD as com-ared to NL–MCI (26%, p = .001) (Table 1).
At the time of decline, PCC MRglc was reduced inL–AD as compared to NL–NL (42%, p = .002) and toL–MCI (31%, p = .014) (Table 1). No differences in PCCRglc were found between NL–MCI and NL–NL (p = .11,
.s.) (Table 1).SPM analyses at the time of decline showed MRglc reduc-
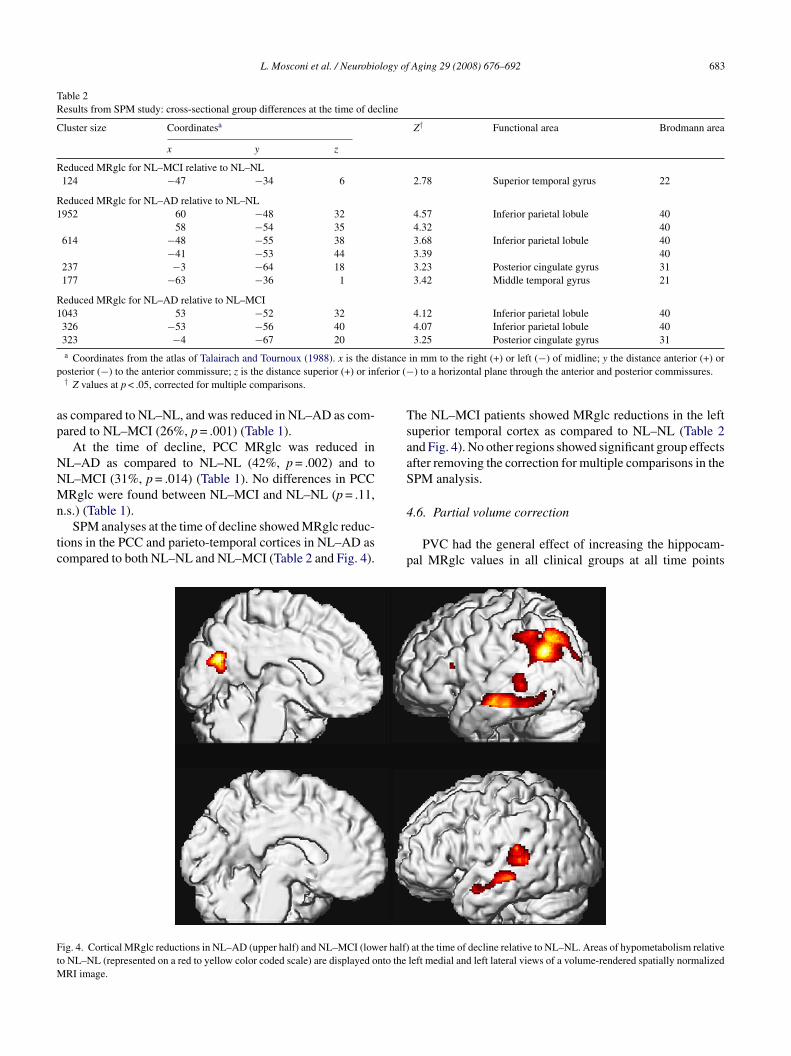
ions in the PCC and parieto-temporal cortices in NL–AD asompared to both NL–NL and NL–MCI (Table 2 and Fig. 4).
4
p
ig. 4. Cortical MRglc reductions in NL–AD (upper half) and NL–MCI (lower half)o NL–NL (represented on a red to yellow color coded scale) are displayed onto the
RI image.
in mm to the right (+) or left (−) of midline; y the distance anterior (+) or) to a horizontal plane through the anterior and posterior commissures.
he NL–MCI patients showed MRglc reductions in the leftuperior temporal cortex as compared to NL–NL (Table 2nd Fig. 4). No other regions showed significant group effectsfter removing the correction for multiple comparisons in thePM analysis.
.6. Partial volume correction
PVC had the general effect of increasing the hippocam-al MRglc values in all clinical groups at all time points
at the time of decline relative to NL–NL. Areas of hypometabolism relativeleft medial and left lateral views of a volume-rendered spatially normalized
6 logy of
(tufraCdNχ
fNaPMfiO
blr(t
Tbtr
4
tT
ttanoM
tpdlp
PNsd(
4
5pbrafdh
4
M2FgMwooN
TH
NN
V
84 L. Mosconi et al. / Neurobio
range 0–25%), which left the cross-sectional baseline andhe longitudinal hippocampal MRglc effects essentiallynchanged (Table 1). PVC hippocampal MRglc predicteduture dementia with 82% sensitivity (9/11 decliners cor-ectly identified) and 70% specificity (33/47 NL–NL) [72%ccuracy, χ2
(1) = 6.1, p = .013, odds ratio (OR) = 1.9, 95%I = 1.7–2.2]. Specifically, PVC hippocampal MRglc pre-icted decline from NL to AD with 83% sensitivity (5/6L–AD) and 79% specificity (37/47 NL–NL) [79% accuracy,2(1) = 6.42, p = .01, OR = 2.0, 95% CI = 1.85–2.2], decline
rom NL to non-AD dementia with 80% sensitivity (4/5L–non-AD) and 77% specificity (36/47 NL–NL) [77%
ccuracy, χ2(1) = 6.1, p = .01, OR = 2.0, 95% CI = 1.2–2.4].
VC hippocampal MRglc predicted decline from NL toCI with 74% sensitivity (14/19 NL–MCI) and 70% speci-
city (31/47 NL–NL) [68% accuracy, χ2(1) = 8.7, p = .012,
R = 1.9, 95% CI = 1.8–2.2].With respect to the PCC ROI, the slight reduction in the
aseline MRglc in NL–AD as compared to NL–NL was noonger evident after PVC (p = .23, n.s., Table 1). The annualate of PCC MRglc reduction remained higher for the NL–AD−2.3 ± 0.9%) relative to the NL–NL (−0.2 ± 0.2%) and tohe NL–MCI (−0.5 ± 0.5%) (p’s < .05).
Likewise, SPM results remained unchanged after PVC.he results continued to show no MRglc group differences ataseline, with MRglc reductions found at the time of declineo AD or to MCI for the same parieto-temporal and PCCegions (p’s ≤ .001).
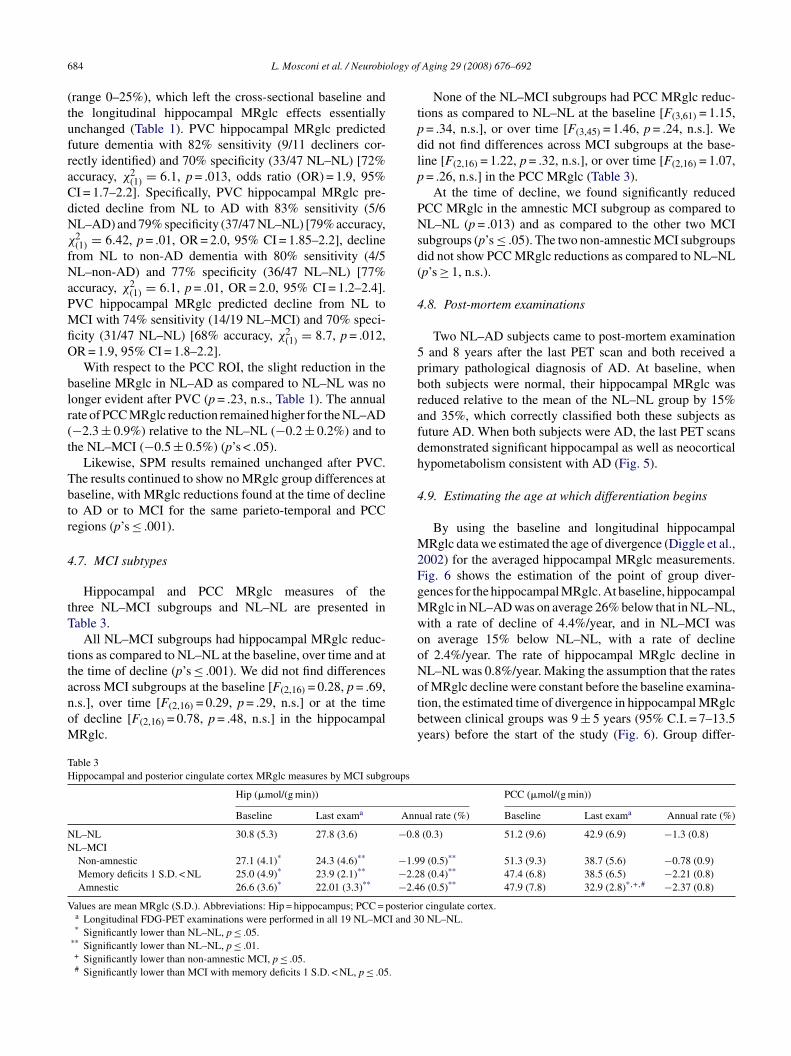
.7. MCI subtypes
Hippocampal and PCC MRglc measures of thehree NL–MCI subgroups and NL–NL are presented inable 3.
All NL–MCI subgroups had hippocampal MRglc reduc-ions as compared to NL–NL at the baseline, over time and athe time of decline (p’s ≤ .001). We did not find differences
cross MCI subgroups at the baseline [F(2,16) = 0.28, p = .69,.s.], over time [F(2,16) = 0.29, p = .29, n.s.] or at the timef decline [F(2,16) = 0.78, p = .48, n.s.] in the hippocampalRglc.otby
able 3ippocampal and posterior cingulate cortex MRglc measures by MCI subgroups
Hip (�mol/(g min))
Baseline Last exama Ann
L–NL 30.8 (5.3) 27.8 (3.6) −0.8L–MCINon-amnestic 27.1 (4.1)* 24.3 (4.6)** −1.9Memory deficits 1 S.D. < NL 25.0 (4.9)* 23.9 (2.1)** −2.2Amnestic 26.6 (3.6)* 22.01 (3.3)** −2.4
alues are mean MRglc (S.D.). Abbreviations: Hip = hippocampus; PCC = posterioa Longitudinal FDG-PET examinations were performed in all 19 NL–MCI and 3* Significantly lower than NL–NL, p ≤ .05.
** Significantly lower than NL–NL, p ≤ .01.+ Significantly lower than non-amnestic MCI, p ≤ .05.# Significantly lower than MCI with memory deficits 1 S.D. < NL, p ≤ .05.
Aging 29 (2008) 676–692
None of the NL–MCI subgroups had PCC MRglc reduc-ions as compared to NL–NL at the baseline [F(3,61) = 1.15,= .34, n.s.], or over time [F(3,45) = 1.46, p = .24, n.s.]. Weid not find differences across MCI subgroups at the base-ine [F(2,16) = 1.22, p = .32, n.s.], or over time [F(2,16) = 1.07,= .26, n.s.] in the PCC MRglc (Table 3).
At the time of decline, we found significantly reducedCC MRglc in the amnestic MCI subgroup as compared toL–NL (p = .013) and as compared to the other two MCI
ubgroups (p’s ≤ .05). The two non-amnestic MCI subgroupsid not show PCC MRglc reductions as compared to NL–NLp’s ≥ 1, n.s.).
.8. Post-mortem examinations
Two NL–AD subjects came to post-mortem examinationand 8 years after the last PET scan and both received a
rimary pathological diagnosis of AD. At baseline, whenoth subjects were normal, their hippocampal MRglc waseduced relative to the mean of the NL–NL group by 15%nd 35%, which correctly classified both these subjects asuture AD. When both subjects were AD, the last PET scansemonstrated significant hippocampal as well as neocorticalypometabolism consistent with AD (Fig. 5).
.9. Estimating the age at which differentiation begins
By using the baseline and longitudinal hippocampalRglc data we estimated the age of divergence (Diggle et al.,
002) for the averaged hippocampal MRglc measurements.ig. 6 shows the estimation of the point of group diver-ences for the hippocampal MRglc. At baseline, hippocampalRglc in NL–AD was on average 26% below that in NL–NL,ith a rate of decline of 4.4%/year, and in NL–MCI wasn average 15% below NL–NL, with a rate of declinef 2.4%/year. The rate of hippocampal MRglc decline inL–NL was 0.8%/year. Making the assumption that the rates
f MRglc decline were constant before the baseline examina-ion, the estimated time of divergence in hippocampal MRglcetween clinical groups was 9 ± 5 years (95% C.I. = 7–13.5ears) before the start of the study (Fig. 6). Group differ-PCC (�mol/(g min))
ual rate (%) Baseline Last exama Annual rate (%)
(0.3) 51.2 (9.6) 42.9 (6.9) −1.3 (0.8)
9 (0.5)** 51.3 (9.3) 38.7 (5.6) −0.78 (0.9)8 (0.4)** 47.4 (6.8) 38.5 (6.5) −2.21 (0.8)6 (0.5)** 47.9 (7.8) 32.9 (2.8)*,+,# −2.37 (0.8)
r cingulate cortex.0 NL–NL.

L. Mosconi et al. / Neurobiology of Aging 29 (2008) 676–692 685
F 73 year1 firmedr ocampa
erwi(tGstN(t
ttab3M
FpambN
aoM7
bn
5
pdtM
ig. 5. Longitudinal FDG-PET scans of one subject (female, baseline age:991) to MCI (1994), and then to AD (1997), and had the AD diagnosis conunning parallel to the hippocampal plane. The scans show progressive hipp
nces in hippocampal MRglc between NL–NL and NL–ADeached statistical significance 6 years before the baseline,hen the estimated mean hippocampal MRglc was 9% lower
n NL–AD (29.9 ± 3.1 �mol/(g min)) as compared to NL–NL32.7 ± 2.5 �mol/(g min), p = .041, one-sided). At that timehe mean age for the NL–AD group was 66 ± 5 years.roup differences between NL–MCI and NL–NL reached
tatistical significance 5 years before the baseline, whenhe estimated mean hippocampal MRglc was 8% lower inL–MCI (30.4 ± 2.1 �mol/(g min)) as compared to NL–NL
32.9 ± 2.5 �mol/(g min), p = .026, one-sided). At that timehe mean age for the NL–MCI group was 65 ± 6 years.
Although PCC MRglc was not different across groups athe baseline, we estimated the age of statistical differentia-ion for the PCC MRglc in NL–AD as compared to NL–NL
fter the baseline exam. Group differences in PCC MRglcetween NL–NL and NL–AD reached statistical significance.5 years after the baseline, when the estimated mean PCCRglc was 16% lower in NL–AD (41.1 ± 7.5 �mol/(g min))ig. 6. Predicted origin of divergence and differentiation in hippocam-al (Hip) glucose metabolism between clinical outcome groups. Boldrrows indicate the estimated time of the first significant reductions in Hipetabolism in the decliners as compared to NL–NL, which was 6 years
efore the baseline PET for NL–AD and 5 years before the baseline PET forL–MCI.
MaMam
mLvtTcsLMotsbm
if
s, education: 12 years, baseline MMSE: 30/30) that declined from NL (inat post-mortem (2000). Axial mages are displayed in a negative-angulationl (red arrows) and temporal cortex (white arrows) metabolic reductions.
s compared to NL–NL (49.2 ± 9.6 �mol/(g min), p = .05,ne-sided). At that time, 5/6 NL–AD subjects were at theCI stage, and the mean age for the NL–AD group was
6 ± 5 years.The annual change in PCC MRglc was not different
etween NL–MCI and NL–NL, and therefore the model wasot estimated.
. Discussion
This FDG-PET study shows that reductions in hippocam-al MRglc during normal aging predict future cognitiveecline and that greater rates of hippocampal MRglc reduc-ions correlate with the progression to late-onset AD and
CI. Our findings also show that reduced hippocampalRglc is associated with a shorter duration of survival time
s normal. These results suggest that reduced hippocampalRglc in normal aging is a risk factor for cognitive decline,
nd suggest that this measure may serve as a preclinicalarker for future cognitive deterioration.Although it has been suggested that reduced brain MRglc
ay predispose individuals to develop AD in old age (deeon et al., 2001; Reiman et al., 2004; Small et al., 1995),ery little work has been done with FDG PET to study theransition from normal aging to AD and other dementias.o date, the only information about preclinical brain MRglchanges derives from our previous longitudinal FDG-PETtudy that examined the decline from normal to MCI (deeon et al., 2001). The prior study showed that baselineRglc reductions in the entorhinal cortex (EC), which is part
f the hippocampal formation, predicted 3 years in advancehe decline to MCI (de Leon et al., 2001). This study alsohowed that the prediction accuracy significantly improvedy combining the hippocampal and entorhinal cortex MRglc
easures.The present study expands on the previous work byncreasing the subject sample size from 23 to 77, and theollow-up interval from 3 to up to 14 years. This enabled
6 logy of
uoaTnaptphtPcaswfsapet1nt
5d
FfpcModnpbdd
dMrplpolmpowo
iitMiswP(hvac
bNNeA(todspspApo
ipsFtoibtif2Mn
acvws
86 L. Mosconi et al. / Neurobio
s to follow NL elderly individuals through the expressionf the clinical symptoms of dementia in addition to MCI,nd in two probable AD cases to autopsy confirmation.he data shows that hippocampal hypometabolism amongormal elderly subjects predicts future cognitive declinend greater rates of MRglc reduction correlate with diseaserogression. A unique contribution of the present study ishe application of automated procedures to sample the hip-ocampus on PET (Mosconi et al., 2005). To date, EC andippocampal MRglc measures could be obtained only withhe labor intensive manual outlining of the structure on theET-coregistered MRI scans. This is not feasible in routinelinical examinations or with large data sets. In contrast, theutomated technique used in the present study for the mea-urement of hippocampal MRglc does not require an MRI,hich makes the method operator-independent and suitable
or high-throughput examination of PET data and clinicalcreening. Automated techniques for sampling the EC are notvailable at the moment. Although the EC and the hippocam-us are both involved in learning and memory and are affectedarly by AD pathology, the accumulation of AD lesions inhe EC may precede that in the hippocampus (Ball et al.,985; Braak and Braak, 1991). Future longitudinal studies areeeded to compare the MRglc reductions in these structures inhe hope of staging brain abnormalities during normal aging.
.1. Hippocampal metabolism and the risk for cognitiveecline
We demonstrate that reduced hippocampal MRglc onDG-PET among normal elderly subjects increases the riskor developing cognitive impairment and dementia. Hip-ocampal MRglc reductions during the normal stages ofognition predict future dementia and MCI, with lowerRglc being associated with a shorter time to the expression
f cognitive symptoms. Overall, the risk for future cognitiveecline was two-fold increased and the time of survival asormal was two-fold decreased per 1 unit reduction in hip-ocampal MRglc. Hippocampal MRglc abnormalities at theaseline predicted decline from NL to AD with 81% accuracy,ecline from NL to non-AD dementia with 77% accuracy, andecline from NL to MCI with 71% accuracy.
The finding of an early role for the hippocampus in theetection of future dementia is in agreement with a recentRI prediction study in cognitively normal individuals that
eported an association between reduced baseline hippocam-al volumes and shorter time until onset of dementia 6 yearsater (den Heijer et al., 2006). Our data shows that hippocam-al hypometabolism is also detectable years prior to the onsetf cognitive symptoms. Moreover, by using the baseline andongitudinal hippocampal MRglc measures, the prediction
odel shows that the first detectable reductions in hippocam-
al MRglc in the future decliners to AD and MCI may haveccurred 5–6 years before our study began, suggesting thate might be able to further anticipate the preclinical detectionf future cognitive decline.sfbM
Aging 29 (2008) 676–692
However, we observed substantial overlap across declin-ng groups. Reduced baseline hippocampal MRglc was foundn NL subjects who developed both AD and non-AD demen-ia, as well as MCI. These data indicate that the hippocampal
Rglc reduction is a sensitive marker for future cognitivempairment but lacks intrinsic disease specificity. In ourtudy, five NL subjects progressed to non-AD dementia, ofhom three subjects with vascular dementia (VaD), 1 witharkinson’s disease (PD) and 1 with frontotemporal dementiaFTD). As a group, these subjects showed reduced baselineippocampal MRglc as compared to NL–NL. On an indi-idual basis, the baseline hippocampal MRglc was reduceds compared to NL–NL in 4/5 NL–non-AD subjects, andomparable to NL–NL in the NL subject who developed VaD.
Although both NL–AD and NL–non-AD groups showedaseline hippocampal hypometabolism as compared toL–NL, hippocampal MRglc was further 15% reduced inL–AD as compared to NL–non-AD. These baseline differ-
nces yielded a preclinical accuracy of 73% in differentiatingD from other dementias, with 5/6 (83%) NL–AD and 3/5
60%) NL–non-AD correctly classified. The combination ofhe baseline hippocampal and PCC MRglc resulted in anverall accuracy of 82% in differentiating AD from otherementias, thanks to the re-classification of one NL–non-ADubject that was misclassified as NL–AD using the hippocam-al MRglc measures alone. Although this is a small gain inpecificity in light of the limited number of subjects availableer outcome group and of the heterogeneity of the NL–non-D group, this data suggests that FDG-PET measures have aotential for being used as biomarkers in the early detectionf dementing disorders.
We offer that, despite the sensitivity of FDG-PET imagingn detecting brain damage prior to clinical diagnosis, hip-ocampal MRglc reductions per se are not diagnosticallypecific for AD or other dementias. Hypometabolism onDG-PET is found in several neurodegenerative diseases, and
here is evidence that patterns of MRglc reduction, insteadf specific regions alone, have differential diagnostic valuen the major dementing disorders, such as AD, FTD, Lewyody dementia and VaD (see Mosconi, 2005 for review). Dis-inctive combinations of hypometabolic regions have beendentified that are useful in the differential diagnosis of ADrom normal aging and other dementias (Silverman et al.,001). However, there are no studies examining whetherRglc abnormalities can be used to differentiate among these
eurodegenerative disorders prior to overt symptom onset.Our results indicate that hippocampal FDG-PET measures
re sufficiently sensitive to identify normal elderly at risk forognitive decline. A means for early detection of at risk indi-iduals is the aim of much research, as treatment interventionsould be most likely to benefit patients in the earliest disease
tages. In order to confer specificity to the preclinical diagno-
is, other studies are warranted to examine whether the riskor developing a specific type of dementia can be predictedased on the detection of individual FDG-PET patterns ofRglc abnormalities, as well as whether the combination
logy of
osa(
5
ststftjTdsGwl
eretsapsm1ittfiirshai(fi
jeae
5v
a
MpsstdTireebfoMiipaoed
5t
taNttap1aMeNihw(2OMotdD2a
L. Mosconi et al. / Neurobio
f the disease-sensitive MRglc measures with pathology-pecific biomarkers, such as CSF measures of amyloid betand tau proteins (Frank et al., 2003) or amyloid PET imagingKlunk et al., 2004).
.2. FDG-PET as a correlate of cognitive decline
In addition to the advance prediction capacity demon-trated by both PET and MRI measures, our study shows forhe first time that greater rates of MRglc reductions, as mea-ured with longitudinal PET examinations, correlate with theransition from normal aging to an impaired state. Specificallyor AD, significantly greater rates of hippocampal, PCC andemporal cortex MRglc reductions were found in normal sub-ects that declined to AD as compared to the non-decliners.he fact that the progressive MRglc reductions parallel theecline to AD is of interest, as an ideal biomarker for ADhould correlate with disease progression (Frank et al., 2003).reater rates of hippocampal and temporal cortex MRglcere also found in the declining MCI patients, although to a
esser extent than in AD (discussed below).There are no longitudinal MRI studies that specifically
xamined the decline from normal aging to late-onset spo-adic AD. However, longitudinal MRI studies in normallderly demonstrated increased hippocampal atrophy duringhe decline from normal to MCI (Jack et al., 2004), and onetudy showed greater medial temporal lobe atrophy rates ingroup of normal subjects declining to MCI or AD as com-ared to controls (Rusinek et al., 2003). Likewise, serial MRItudies in individuals with early-onset familial AD as deter-ined by autosomal dominant genetic mutations (Fox et al.,
999, 2001) showed that the rate of hippocampal atrophyncreases as a function of time, with a quadratic model beinghe best fit. In the present PET study in late-onset AD, addinghe quadratic to the linear term did not improve the datat (χ2
(1) = 2.8, p = .92, n.s.). Longitudinal FDG-PET stud-es in familial AD would be of interest to assess whether theate of MRglc reductions also accelerates close to conver-ion. However, there is evidence that clinical presentation andistopathological findings are comparable between familialnd sporadic AD (Mesulam, 1999) despite the fact that famil-al AD patients typically develop dementia at an early agetypically 30–50s) than in the sporadic form, suggesting aaster and more aggressive progression of brain damage thann sporadic AD.
The longitudinal PET study was not completed in the sub-ects that declined to non-AD dementia, so it remains to bestablished whether greater rates of MRglc reductions wouldlso be found along with clinical progression in neurodegen-rative disorders other than AD.
.3. Hypometabolism remains significant after partial
olume correctionIn our PET study, all the effects remained significantfter partial volume correction (PVC) from the coregistered
cad
Aging 29 (2008) 676–692 687
RI scans. Particularly, the sensitivity of the baseline hip-ocampal measures in predicting future decline remainedubstantially unchanged in all outcome groups. These resultsuggest that a true reduction in brain MRglc occurs early inhe course of dementing disorders that is relatively indepen-ent of the partial volume effects of the increasing CSF pool.his finding is consistent with previous PET studies show-
ng that MRglc reductions in clinical MCI and AD patientsemain significant after PVC (de Leon et al., 2001; De Santit al., 2001; Ibanez et al., 1999; Meltzer et al., 1990; Mosconit al., 2005, 2006). In the present study, PVC increased theaseline MRglc values in all groups, leaving the group dif-erences substantially unchanged, with an average increasef 6%, a relatively minor adjustment. The knowledge thatRglc reductions in dementia represent intrinsic reductions
n MRglc per gram brain tissue (as measured after PVC)s valuable from a biological point of view. From a clinicaloint of view, the fact that unadjusted FDG-PET measureslone represent a reliable estimate of the underlying pathol-gy suggests a diagnostically useful role for PET in thexamination of normal subjects at risk for future cognitiveecline.
.4. Metabolic reductions in AD and MCI patients at theime of decline
At the time of clinical decline, the normal subjectshat declined to AD showed hippocampal, parieto-temporalnd PCC hypometabolism as compared to controls. WhenL–MCI patients were at the MCI stage, hypometabolism in
his group was restricted to the hippocampus and the leftemporal cortex. This data is consistent with the idea of
progressive pathological spreading in AD from the hip-ocampal formation to the association cortex (Ball et al.,985), as well as with prior FDG-PET reports of more severend widespread cortical hypometabolism in AD relative toCI (Chetelat et al., 2003; De Santi et al., 2001; Drzezga
t al., 2003; Minoshima et al., 1997; Mosconi et al., 2004;estor et al., 2003). Moreover, FDG-PET prediction stud-
es in MCI showed that PCC and parieto-temporal cortexypometabolism is consistently found in those MCI patientsithin 3 years of decline to AD as compared to stable MCI
Anchisi et al., 2005; Chetelat et al., 2003; Drzezga et al.,003, 2005; Minoshima et al., 1997; Mosconi et al., 2004).ur results for the NL–AD subjects, who went through anCI stage before declining to AD, are consistent with the
bservation that MRglc reductions within PCC and parieto-emporal regions at the MCI stage are involved with theecline to AD (Anchisi et al., 2005; Chetelat et al., 2003;rzezga et al., 2003; Minoshima et al., 1997; Mosconi et al.,004), and provide evidence that hippocampal abnormalitiesre also implicated.
While parieto-temporal and PCC hypometabolism isonsensually recognized as the metabolic feature of AD,nd there are increasing reports of medial temporal lobeeficits, there is currently no specific pattern of cortical

6 logy of
hMiisi1dti2eah(MnsPwitostwcccothwpeMcMf
htigpl(owcpeoihd
NeiaNNes
5
riMcn5fbcis2eoccEai(atpiasceNtmi(
saaat
88 L. Mosconi et al. / Neurobio
ypometabolism considered to be a hallmark for MCI (seeosconi, 2005; Nestor et al., 2004 for recent reviews). It
s well known that regional patterns of MRglc reductionsn individual AD and MCI patients are variable, and corre-pond to patterns of cognitive and behavioral abnormalitiesn individual patients (Anchisi et al., 2005; Haxby et al.,990). Most of the FDG-PET research on MCI has beenone with amnestic patients. FDG-PET studies in amnes-ic MCI patients report cortical hypometabolism, mainlynvolving the PCC and temporal cortices (Chetelat et al.,003; Drzezga et al., 2003; Minoshima et al., 1997; Mosconit al., 2004; Nestor et al., 2003). Some studies in non-mnestic MCI patients show either relative absence of corticalypometabolism or hypometabolism in diverse brain regionsBerent et al., 1999; de Leon et al., 2001; De Santi et al., 2001;
osconi et al., 2006; Reed et al., 1989). At present there iso universal agreement on the categorization of patients withuspected MCI into clinical subgroups (Gauthier et al., 2006;etersen et al., 1999). In our study, the diagnosis of MCIas based on clinical criteria with subsequent stratification
nto amnestic and non-amnestic subtypes based on cogni-ive performance. By comparing the FDG-PET measures inur three NL–MCI subgroups, we found that all NL–MCIubgroups had hippocampal MRglc reductions as comparedo controls at baseline and at the last examination. As such,e conclude that hippocampal hypometabolism is evident in
linically detected MCI regardless of the neuropsychologi-al profile. This observation is in keeping with our previousross-sectional FDG-PET results in an independent samplef MCI patients (Mosconi et al., 2006). In addition, at theime of decline to MCI, the amnestic MCI subgroup showedypometabolism in the PCC as compared to controls, whichas not evident in the other MCI subgroups. According torevious FDG-PET findings (Anchisi et al., 2005; Chetelatt al., 2003; Drzezga et al., 2003; Minoshima et al., 1997;osconi et al., 2004), this data suggests that the additional
ortical MRglc reductions detected in the currently amnesticCI subjects may predispose them to develop AD in the near
uture.In our study, the baseline and longitudinal regional
ypometabolism in the NL–MCI group was less severe andhe standard deviations larger than in the NL–AD group,ndicating heterogeneity in the metabolic deficits in thisroup. Further follow-up examinations of our currently MCIatients are needed to assess whether those MCI subjects withower MRglc will eventually develop AD or other dementiasPetersen et al., 1999), and possibly show a more extendedr diversified topography of MRglc reductions, while thoseith higher MRglc will remain stable or develop other out-
omes. The small sample sizes of our NL–MCI subgroupsrecluded meaningful examination of regional MRglc differ-nces across subtypes. The prediction of individual clinical
utcome in MCI patients is very important and more stud-es are needed to examine whether distinctive patterns ofypometabolism can be discerned in MCI patients prior toecline to AD or other outcomes.tgta
Aging 29 (2008) 676–692
Likewise, there remains the possibility that some of theL–NL subjects are at risk for future decline. In our study,
ven though the follow-up times were comparable across clin-cal outcome groups, the NL–NL subjects were studied overslightly shorter interval as compared to both NL–MCI andL–AD. It is possible that as a consequence, some of theL–NL subjects may be close to decline. We offer that the
ffect of this would be to conservatively misclassify theseubjects as NL and so reduce the diagnostic accuracy.
.5. Methodological considerations
The present study shows that, while hippocampal MRglceductions were significant prior to cognitive decline, signif-cant cortical hypometabolism was not observed. Significant
Rglc reductions in the PCC in the NL–AD group asompared to NL–NL were estimated to reach statistical sig-ificance 3.5 years after the baseline PET, and at that time/6 NL–AD subjects were diagnosed as MCI, includingour amnestic MCI patients. Our findings of MRglc deficitseginning in the hippocampus during the normal stages ofognition that progressively involve the cortical regions dur-ng decline to AD are consistent with pathology and MRItudies in both topography and timing (den Heijer et al.,006; Jack et al., 2004; Morrison and Hof, 1997; Rusinekt al., 2003). However, we cannot exclude the possibility thatther brain regions besides the hippocampus might show pre-linical effects that were not detectable in our study usingurrently available image analysis tools, for example theC, as mentioned above. In the present study, two imagenalysis approaches were used, i.e., automated regions ofnterest (ROI) and whole-brain voxel-based analysis (VBA)Friston et al., 1995). Based on previous post-mortem, MRInd FDG-PET results, we stated the a priori hypothesis thathe hippocampus is the brain structure most likely to showreclinical effects. The hippocampus was therefore exam-ned using a region of interest (ROI) approach (Mosconi etl., 2005). For methodological comparability, an ROI analy-is was also performed for the PCC, the cortical region mostonsistently hypometabolic in MCI and early AD (Chetelatt al., 2003; Drzezga et al., 2003; Minoshima et al., 1997;estor et al., 2003). VBA was performed to test for statis-
ical effects for the whole brain, first with a correction forultiple comparisons, and then at a more liberal probabil-
ty value of p < .001, uncorrected for multiple comparisonsFriston et al., 1995).
In our study, the ROI and the VBA approaches showedimilar results with respect to the PCC. Both ROI and VBAnalyses showed no baseline group differences in the PCC,nd significant PCC hypometabolism in the NL–AD patientst the time of decline as compared to NL–NL. However, onlyhe ROI analysis revealed greater rates of PCC MRglc reduc-
ions in NL–AD as compared to both NL–NL and NL–MCIroups, which were significant at p = .005 and .034, respec-ively. Likewise, the hippocampal effects found with the ROIpproach were not found with VBA.
logy of
iitwcrj2d(tticrVepibafnwcItwsrioriwttpdd
cteMVhtpIitpaH
ofdm
5c
wtredmtwsaapdid
tcemtceovesplmanopwjybogWGw
L. Mosconi et al. / Neurobio
We previously showed that the pre-processing stepsnvolved with VBA (i.e., spatial normalization and smooth-ng) and particularly the need for more conservative statisticalhresholds, which are necessary in a whole-brain analysishere hundreds of voxels are examined at the same time, may
ompromise detection of MRglc abnormalities in small brainegions such as the hippocampus, which is particularly sub-ect to anatomical distortions in aging and AD (Mosconi et al.,005). The ROI approach proved more accurate than VBA inetecting hippocampal MRglc abnormalities in AD and MCIMosconi et al., 2005). The use of ROIs offers increased sta-istical power because selecting ROIs for a priori hypothesisesting reduces the number of multiple statistical compar-sons, and also provides a quantitative estimation of signalhange in each ROI that can be used to compare across neu-oanatomical regions. On the other hand, the advantage ofBA is that effects in every region of the brain, as well as
ffects within an anatomical region, can be tested. VBA waserformed on spatially smoothed images, and spatial smooth-ng has the effect of improving alignment across subjectsy reducing anatomical inter-individual variability, as wells increasing the signal-to-noise ratio by clustering togetherunctionally related voxels and averaging out uncorrelatedoise across voxels (Friston et al., 1995). This is similar tohat the ROI technique accomplishes by averaging metabolic
ounts within a functionally homogenous anatomical region.n fact, PET VBA studies in MCI and AD showed consis-ency with ROI data with respect to the cortical regions,hich are larger than the hippocampus and less prone to sub-
tantial anatomical sampling errors (see Mosconi, 2005 foreview). However, detection of a significant cluster or voxeln VBA depends critically on setting a probability thresh-ld, and this might hinder detection of statistical effects in aegion containing mildly hypometabolic voxels. Therefore,t is possible that the lack of baseline cortical effects foundith VBA may be due to the more conservative probability
hreshold used, and caution should be used in the interpre-ation of the absence of cortical effects at baseline. It isossible that other image analysis techniques may be able toetect additional regions of MRglc abnormalities in the futureecliners.
According to much of the PET literature, the PCC is theortical region most likely to show early MRglc abnormali-ies (Chetelat et al., 2003; Drzezga et al., 2003; Minoshimat al., 1997; Nestor et al., 2003). The absence of baselineRglc reductions in the PCC with both the ROI and theBA methods suggests that the absence of baseline corticalypometabolism in the future decliners may not be relatedo the sensitivity of the analytic method but rather to theresymptomatic state of the subjects enrolled in this study.n the present study, the baseline PCC MRglc did not signif-cantly predict future cognitive decline from NL and adding
his measure in the logistic regression model with the hip-ocampal MRglc did not significantly improve the predictionccuracy of the hippocampal measures for any comparisons.owever, we do not exclude that MRglc abnormalities in2(wp
Aging 29 (2008) 676–692 689
ther brain regions, or the multivariate combination of dif-erent regions, may significantly contribute to the preclinicaletection of individuals at risk for future cognitive impair-ent.
.6. Memory performance and subjective memoryomplaints
At the time of the first examination, when all subjectsere clinically and cognitively normal, there were no sta-
istical differences between decliners and non-decliners withespect to cognitive performance. Although the subjects whoventually developed dementia scored slightly lower on theelayed recall of paired associates test than both stable nor-al and future MCI patients (on average 1.3 points, Table 1),
his measure did not significantly predict future dementia,ith only 47% accuracy for decline from NL to AD [50%
ensitivity and 47% specificity, χ2(1) = 0.12, n.s.], and 49%
ccuracy for decline from NL to non-AD [60% sensitivitynd 49% specificity, χ2
(1) = 0.33, n.s.], nor did it add to therediction accuracy of the hippocampal MRglc. Our findingso not exclude that psychometric tests other than those exam-ned in our study might predict decline from normal aging toementia or MCI.
At baseline, some subjects reported age-related subjec-ive memory changes in the absence of objective findings forognitive change resulting in a GDS score of 2 (Reisbergt al., 1982). Some studies suggest that memory complaintsay be more frequent in subjects with incipient demen-
ia (Geerlings et al., 1999). However, subjective memoryomplaints are very common in the elderly with prevalencestimates of 25–50% (Jonker et al., 2000) and the validityf these complaints in predicting future decline is contro-ersial (Geerlings et al., 1999; Purser et al., 2006). Whilexperiencing memory decline is often one of the first rea-ons for elderly individuals to seek clinical attention, severaloints indicate that our subjects were in fact normal at base-ine. First, none of the subjects showed any objective or
easurable evidence for functional or cognitive impairment,nd none would meet criteria for MCI. Second, there waso difference in the proportion of decliners as a functionf the presence (or absence) of subjective memory com-laints at baseline. Cognitive decline to dementia or MCIas found in 11/29 GDS = 1 subjects and 19/49 GDS = 2 sub-
ects (χ2(1) = 0.02, n.s.). Both groups declined on average 8
ears later, and there was no difference in the time to declineetween GDS 1 and GDS 2 groups [F(1,29) = 0.1, n.s.]. More-ver, there were no differences between GDS 1 and GDS 2roups in hippocampal MRglc at baseline [F(1,76) = .02, n.s.].e then repeated the analyses for the subjects within theDS 1 group and found that baseline hippocampal MRglcas 18% reduced in the decliners to MCI or AD (n = 11,
6.5 ± 7.2 �mol/(g min)) as compared to the non-declinersn = 18, 32.3 ± 6.4 �mol/(g min)) [F(1,27) = 8.58, p = .007],hich resulted in 82% sensitivity and 78% specificity inredicting cognitive decline in NL subjects without subjec-
6 logy of
tO
tNoAdddMfMarb
5
tnbrrc2lt(sva(eltraprdaiirMM(a
5
ti
ebneddtdsoaetto
C
A
ANSoSd
A
w
(
90 L. Mosconi et al. / Neurobio
ive memory complaints [79% accuracy, χ2(1) = 7.81, p < .01,
R = 2.2, 95% CI = 1.9–2.6].Lastly, 30/77 (39%) of our baseline NL subjects declined
o dementia or MCI over the course of the study. Of theseL subjects, 6/77 (0.8%) declined to AD after an averagef 8 years, for an average annual rate of decline from NL toD of less than 1%/year, 5/77 (6.5%) declined to non-ADementia after an average of 3 years, for an average rate ofecline from NL to non-AD of 2%/year, and 19/77 (24.6%)eclined to MCI, for an average rate of decline from NL toCI of 3%/year. These estimates are consistent with those
rom other imaging studies following progression from NL toCI or AD in research settings (de Leon et al., 2001; Jack et
l., 2004; Rusinek et al., 2003). Future studies are needed toeplicate these preliminary research findings in community-ased samples.
.7. Selection of the reference region
In the present study, pons was used as the reference regiono adjust for individual differences in global MRglc. Mosteurodegenerative disorders are characterized on FDG PETy regional hypometabolism in the parieto-temporal, poste-ior cingulate, frontal and occipital cortices associated withelatively preserved metabolism in the pons, sensorimotorortex, thalamus, putamen, and cerebellum (see Mosconi,005 for review). The choice of a reference region is particu-arly important in PET studies in dementia since, in additiono regional abnormalities, there is global reduction of MRglcMosconi, 2005). The ideal reference region for FDG-PETtudies should show both pathological and metabolic preser-ation. As such, the pons is reportedly the least metabolicallyffected region in mild to severe AD and other dementiasAlbin et al., 1996; Minoshima et al., 1995; Vander Borghtt al., 1997). There is evidence that pons MRglc shows theowest coefficients of variation (CV (%) = standard devia-ion/mean × 100) as compared to the other possible referenceegions, indicating stable metabolic activity (Minoshima etl., 1995). To our knowledge, there are no reports of reducedons MRglc in other dementias. However, attenuation cor-ection may be thought to have a negative impact on theetermination of radioactivity in this structure because of itsnatomical position, introducing noise and therefore increas-ng inter-subject variability. Consistent with previous reports,n the present study, the CVs for pons MRglc were also low,anging between 11% and 17% across the groups (Table 1).
oreover, our data shows no group differences in ponsRglc at baseline, over time or at the last examination
Table 1), further suggesting the suitability of this structures a reference region for FDG-PET studies in dementia.
.8. Conclusions
Overall, these data indicate that FDG-PET imaging hashe potential for contributing to clinical diagnosis at preclin-cal dementia stages, when clinical symptoms are not yet
Aging 29 (2008) 676–692
xpressed. As disease-modifying and prevention treatmentsecome available, such as recent amyloid beta-peptide immu-ization for AD (Nicoll et al., 2003; Schenk et al., 1999),valuations of brain MRglc in combination with other moreisease-specific measures may help to identify suitable can-idates for treatment as well as to assess the efficacy of suchreatments. Our results demonstrate that the first signs ofecline to dementia and MCI can be detected in a progres-ively reduced hippocampal MRglc, making the recognitionf normal subjects at risk for future cognitive deteriorationrealistic goal. Future studies are needed to prospectively
xamine these and other regional MRglc measures as predic-ors of future impairment on an individual basis, as well aso improve specificity in the preclinical differential diagnosisf dementing disorders.
onflicts of interest
None.
cknowledgments
This work was supported by the NIH-NIA grantsG12101, AG13616, AG08051 and AG022374, and NIHCRR MO1RR0096. We thank Joanna Fowler, Davidchlyer and Gene-Jack Wang at Brookhaven National Lab-ratory, Upton, NY, for their support of the PET studies,chantel Williams and Ronit Notkin at NYU for study coor-ination and psychometric testing.
ppendix A
Results from hierarchical random (mixed) effects modelere derived as follows:
A) Individual trajectories of MRglc reductions over timeafter adjusting for subject-specific effects were derivedby fitting the following equations (Diggle et al., 2002;Friston et al., 2004):
For subject i at visit j:
Yij = Ai + Bitij + eij
where
Ai = αi1 + αi2xi + ui
Bi = βi1 + βi2xi + vi
so that
Yij = αi1 + αi2xi + βi1tij + βi2tijxi + ui + vi + eij
where tij = time of jth scan for subject i belong-ing to group x, where [tij = 0,1, . . .,tij(dec), . . .,T] withtij(dec) = time of jth scan for subject i at the time of clin-
logy of
(
tc
(
(
R
A
A
A
B
B
B
C
d
D
D
d
D
D
D
F
F
F
F
F
F
G
G
H
L. Mosconi et al. / Neurobio
ical decline, and (eij, ui, vi) ∼N(0, σ2); Ai = predictedintercept (i.e., predicted MRglc values at baseline);Bitij = predicted regression slope (i.e., predicted rate ofMRglc change).
B) Regional MRglc for each subject at the time of declinewas estimated by using the above individual trajectoriesand fitting the following equations (Diggle et al., 2002;Friston et al., 2004):For subject i at visit j:
Yij(dec) = Ai + Bitij(dec)
where tij(dec) = time of jth scan for subject i at the timeof clinical decline, and Ai = predicted intercept (i.e., pre-dicted MRglc values at baseline).
These equations were applied to the coregistered and spa-ially normalized whole-brain PET scans of each subject i toreate:
A) A slope (Bitij) PET image, where each voxel in theslope image contains the estimated rate of MRglc changein that voxel. The slope images were then comparedbetween clinical groups to examine differences in therate of MRglc reduction in the whole-brain on a voxel-by-voxel basis.
B) A PET image at the time of decline (Yij(dec)), where eachvoxel in the image contains the estimated MRglc activ-ity at the time of decline. The time of the last clinicalexam was used for the NL–NL subjects. These imageswere then compared between clinical groups to examineMRglc differences at the time of decline in the whole-brain on a voxel-by-voxel basis.
eferences
lbin, R.L., Minoshima, S., DAmato, C.J., Frey, K.A., Kuhl, D.E., Sima,A.A.F., 1996. Fluoro-deoxyglucose positron emission tomography indiffuse lewy body disease. Neurology 47, 462–466.
merican Psychiatric Association. Diagnostic and Statistical Manual ofMental Disorders (Fourth Edition), 4th ed., American Psychiatric Asso-ciation, Washington, D.C., 1994.
nchisi, D., Borroni, B., Franceschi, M., Kerrouche, N., Kalbe, E., Beuthien-Beumann, B., Cappa, S., Lenz, O., Ludecke, S., Marcone, A., Mielke, R.,Ortelli, P., Padovani, A., Pelati, O., Pupi, A., Scarpini, E., Weisenbach,S., Herholz, K., Salmon, E., Holthoff, V., Sorbi, S., Fazio, F., Perani,D., 2005. Heterogeneity of brain glucose metaboism in mild cognitiveimpairment and clinical progression to Alzheimer disease. Arch. Neurol.62, 1728–1733.
all, M.J., Hachinski, V., Fox, A., Kirshen, A.J., Fisman, M., Blume, W.,Kral, V.A., Fox, H., 1985. A new definition of Alzheimer’s disease: ahippocampal dementia. Lancet 1, 14–16.
erent, S., Giordani, B., Foster, N., Minoshima, S., Lajiness-O’Neill, R.,Koeppe, R., Kuhl, D.E., 1999. Neuropsychological function and cere-bral glucose utilization in isolated memory impairment and Alzheimer’sdisease. J. Psychiat. Res. 33, 7–16.
raak, H., Braak, E., 1991. Neuropathological stageing of Alzheimer-related
changes. Acta Neuropathol. 82, 239–259.hetelat, G., Desgranges, B., De La Sayette, V., Viader, F., Eustache,F., Baron, J.C., 2003. Mild cognitive impairment: can FDG-PET pre-dict who is to rapidly convert to Alzheimer’s disease? Neurology 60,1374–1377.
H
Aging 29 (2008) 676–692 691
e Leon, M.J., Convit, A., Wolf, O.T., Tarshish, C.Y., De Santi, S.,Rusinek, H., Tsui, W., Kandil, E., Scherer, A.J., Roche, A., Imossi, A.,Thorn, E., Bobinski, M., Caraos, C., Lesbre, P., Schlyer, D., Poirier,J., Reisberg, B., Fowler, J., 2001. Prediction of cognitive decline innormal elderly subjects with 2-[18F]fluoro-2-deoxy-d-glucose/positron-emission tomography (FDG/PET). Proc. Natl. Acad. Sci. U.S.A. 98,10966–10971.
e Santi, S., de Leon, M.J., Rusinek, H., Convit, A., Tarshish, C.Y., Boppana,M., Tsui, W.H., Daisley, K., Wang, G.J., Schlyer, D., 2001. Hippocam-pal formation glucose metabolism and volume losses in MCI and AD.Neurobiol. Aging 22, 529–539.
e Santi, S., Li, J., Reisberg, B., Notkin-Schwab, R., Rogers, K., Williams,S., Tierney, M., Ferris, S., de Leon, M.J., 2005. How good are singleamnestic and multiple domains for characterizing MCI patients at riskfor AD? Alzh. Dementia 1, S81.
en Heijer, T., Geerlings, M.I., Hoebeek, F.E., Hofman, A., Koudstaal, P.J.,Breteler, M., 2006. Use of hippocampal and amygdalar volumes on mag-netic resonance imaging to predict dementia in cognitively intact elderlypeople. Arch. Gen. Psychiat. 63, 57–62.
iggle, P.J., Heagerty, P., Liang, K.-Y., Zeger, S.C., 2002. Analysis of Lon-gitudinal Data. Oxford University Press, New York.
rzezga, A., Grimmer, T., Riemenschneider, M., Lautenschlager, N., Sieb-ner, H., Alexopoulus, P., Minoshima, S., Schwaiger, M., Kurz, A., 2005.Prediction of individual outcome in MCI by means of genetic assessmentand 18F-FDG PET. J. Nucl. Med. 46, 1625–1632.
rzezga, A., Lautenschlager, N., Siebner, H., Riemenschneider, M., Willoch,F., Minoshima, S., Schwaiger, M., Kurz, A., 2003. Cerebral metabolicchanges accompanying conversion of mild cognitive impairment intoAlzheimer’s disease: a PET follow-up study. Eur. J. Nucl. Med. 30,1104–1113.
olstein, M., 1983. The mini-mental state examination. In: Crook, T., Ferris,S.H., Bartus, R. (Eds.), Assessment in Geriatric Psychopharmacology.Mark Powley Associates, New Canaan, pp. 47–51.
ox, N.C., Crum, W.R., Scahill, R.I., Stevens, J.M., Janssen, J.C., Rossor,M.N., 2001. Imaging of onset and progression of Alzheimer’s diseasewith voxel-compression mapping of serial magnetic resonance images.Lancet 358, 201–205.
ox, N.C., Warrington, E.K., Rossor, M.N., 1999. Serial magnetic resonanceimaging of cerebral atrophy in preclinical Alzheimer’s disease. Lancet353, 2125.
rank, R.A., Galasko, D., Hampel, H., Hardy, J., de Leon, M.J., Mehta, P.D.,Rogers, J., Siemers, E., Trojanowski, J.Q., 2003. Biological markers fortherapeutic trials in Alzheimer’s disease: proceedings of the biologicalmarkers working group; NIA initiative on neuroimaging in Alzheimer’sdisease. Neurobiol. Aging 24, 521–536.
riston, K.J., Holmes, A.P., Worsley, K.J., Poline, J.-P., Frith, C.D., Frack-owiak, R.S.J., 1995. Statistical parametric maps in functional imaging:a general linear approach. Hum. Brain Mapping 2, 189–210.
riston, K.J., Stephan, K.E., Lund, T.E., Morcom, A., Kiebel, S.J., 2004.Mixed-effects and fMRI studies. Neuroimage 24, 244–252.
authier, S., Reisberg, B., Zaudig, M., Petersen, R.C., Ritchie, K., Broich,K., Belleville, S., Brodaty, H., Bennett, D., Cummings, J., de Leon, M.J.,Feldman, H., Ganguli, M., Hampel, H., Scheltens, P., Tierney, M., White-house, P., Winblad, B., 2006. Mild cognitive impairment. Lancet 367,1262–1270.
eerlings, M.I., Jonker, C., Bouter, L.M., Ader, H.J., Schmand, B., 1999.Association between memory complaints and incident Alzheimer’s dis-ease in elderly people with normal baseline cognition. Am. J. Psychiat.156, 531–537.
achinski, V.C., Lassen, N.A., Marshall, J., 1974. Multi-infarct demen-tia, a cause of mental deterioration in the elderly. Lancet 2, 207–210.
axby, J.V., Grady, C.L., Koss, E., Horwitz, B., Heston, L., Schapiro,M., Friedland, R.P., Rapoport, S.I., 1990. Longitudinal study of cere-bral metabolic asymmetries and associated neuropsychological patternsin early dementia of the Alzheimer type. Arch. Neurol. 47, 753–760.
6 logy of
H
I
J
J
K
M
M
M
M
M
M
M
M
M
M
M
N
N
N
P
P
R
R
R
R
R
R
S
S
S
S
T
92 L. Mosconi et al. / Neurobio
osmer Jr., D.W., Lemeshow, S., 1999. In: Hosmer Jr., D.W., Lemeshow,S. (Eds.), Parametric Regression Models. Wiley, New York, NY, pp.289–299.
banez, V., Pietrini, P., Alexander, G.E., Furey, M.L., Teichberg, D.,Rajapakse, J.C., Rapoport, S.I., Schapiro, M., Horwitz, B., 1999.Regional gluose metabolic abnormalities are not the result of atrophyin Alzheimer’s disease. Neurology 50, 1585–1593.
ack, C.R., Shiung, M.M., Gunter, J.L., O’Brien, P.C., Weigand, S.D., Knop-man, D.S., Boeve, B.F., Ivnik, R.J., Smith, G.E., Cha, R.H., Tangalos,E.G., Petersen, R.C., 2004. Comparison of different MRI brain atrophyrate measures with clinical disease progression in AD. Neurology 62,591–600.
onker, C., Geerlings, M.I., Schmand, B., 2000. Are memory complaints pre-dictive for dementia? A review of clinical and population-based studies.Int. J. Geriatr. Psych. 15, 983–991.
lunk, W.E., Engler, H., Nordberg, A., Yanming, W., Blomqvist, G., Holt,D.P., Bergstrom, M., Savitcheva, I., Huang, G.F., Estrada, S., Ausen,B., Debnath, M.L., Barletta, J., Price, J.C., Sandell, J., Lopresti, B.J.,Wall, A., Koivisto, P., Antoni, Mathis, C.A., Langstrom, B., 2004. Imag-ing brain amyloid in Alzheimer’s disease with Pittsburgh Compound-B.Ann. Neurol. 55, 306–319.
aldjian, J.A., Laurienti, P.J., Kraft, R.A., Burdette, J.H., 2003. An auto-mated method for neuroanatomic and cytoarchitectonic atlas-basedinterrogation of fMRI data sets. Neuroimage 19, 1233–1239.
cKhann, G., Drachman, D., Folstein, M., Katzman, R., Price, D., Stad-lan, E.M., 1984. Clinical diagnosis of Alzheimer’s disease: report ofthe NINCDS-ADRDA work group under the auspices of Department ofHealth & Human Services Task Force on Alzheimer’s disease. Neurology34, 939–944.
eltzer, C.C., Leal, J.P., Mayberg, H.S., Wagner Jr., H.N., Frost, J.J., 1990.Correction of PET data for partial volume effects in human cerebralcortex by MR imaging. J. Comp. Assist. Tomogr. 14, 561–570.
esulam, M.M., 1999. Neuroplasticity failure in Alzheimer’s disease: bridg-ing the gap between plaques and tangles. Neuron 24, 521–529.
inoshima, S., Frey, K.A., Foster, N.L., Kuhl, D.E., 1995. Preserved pon-tine glucose metabolism in Alzheimer’s Disease: a reference region forfunctional brain image (PET) analysis. J. Comp. Assist. Tomogr. 19,541–547.
inoshima, S., Giordani, B., Berent, S., Frey, K.A., Foster, N.L., Kuhl, D.E.,1997. Metabolic reduction in the posterior cingulate cortex in very earlyAlzheimer’s disease. Ann. Neurol. 42, 85–94.
orrison, J.H., Hof, P.R., 1997. Life and death of neurons in the aging brain.Science 278, 412–419.
osconi, L., 2005. Brain glucose metabolism in the early and specific diag-nosis of Alzheimer’s disease. Eur. J. Nucl. Med. 32, 486–510.
osconi, L., De Santi, S., Li, Y., Li, J., Zhan, J., Tsui, W.H., Boppana,M., Pupi, A., de Leon, M.J., 2006. Visual rating of medial temporal lobemetabolism in mild cognitive impairment and Alzheimer’s disease usingFDG-PET. Eur. J. Nucl. Med. 33, 210–221.
osconi, L., Perani, D., Sorbi, S., Herholz, K., Nacmias, B., Holthoff, V.,Salmon, E., Baron, J.-C., De Cristofaro, M.T.R., Padovani, A., Bor-roni, B., Franceschi, M., Bracco, L., Pupi, A., 2004. MCI conversionto dementia and the APOE genotype: a prediction study with FDG-PET.Neurology 63, 2332–2340.
osconi, L., Tsui, W.H., De Santi, S., Rusinek, H., Li, J., Convit, A., Li, Y.,de Leon, M.J., 2005. Reduced hippocampal metabolism in mild cogni-tive impairment and Alzheimer’s disease: automated FDG-PET ImageAnalysis. Neurology 64, 1860–1867.
estor, P.J., Fryer, T.D., Smielewski, P., Hodges, J.R., 2003. Limbichypometabolism in Alzheimer’s disease and mild cognitive impairment.Ann. Neurol. 54, 343–351.
estor, P.J., Scheltens, P., Hodges, J.R., 2004. Advances in the early detectionof Alzheimer’s disease. Nat. Med. 10, S34–S41.
V
Aging 29 (2008) 676–692
icoll, J.A.R., Wilkinson, D., Holmes, C., Steart, P., Markham, H., Weller,R.O., 2003. Neuropathology of human Alzheimer disease after immu-nization with amyloid-[beta] peptide: a case report. Nat. Med. 9,448–452.
etersen, R.C., Smith, G.E., Waring, S.C., Ivnik, R.J., Tangalos, E.G., Kok-men, E., 1999. Mild cognitive impairment: clinical characterization andoutcome. Arch. Neurol. 56, 303–308.
urser, J.L., Fillenbaum, G.G., Wallace, R.B., 2006. Memory complaint isnot necessary for diagnosis of mild cognitive impairment and does notpredict 10-year trajectories of functional disability, word recall, or shortportable mental status questionnaire limitations. J. Am. Geriatr. Soc. 54,335–338.
eed, B.R., Jagust, W.J., Seab, J.P., Ober, B.A., 1989. Memory and regionalcerebral blood flow in mildly symptomatic Alzheimer’s disease. Neurol-ogy 39, 1537–1539.
eiman, E.M., Chen, K., Alexander, G.E., Caselli, R.J., Bandy, D., Osborne,D., Saunders, A.M., Hardy, J., 2004. Functional brain abnormalities inyoung adults at genetic risk for late-onset Alzheimer’s dementia. Proc.Natl. Acad. Sci. U.S.A. 101, 284–289.
eisberg, B., Ferris, S.H., de Leon, M.J., Crook, T., 1982. The global dete-rioration scale for assessment of primary degenerative dementia. Am. J.Psychiat. 139, 1136–1139.
eivich, M., Alavi, A., Wolf, A., Fowler, J., Russell, J., Arnett, C.,MacGregor, R.R., Shiue, C.Y., Atkins, H., Anand, A., Dann, R.,Greenberg, J., 1985. Glucose metabolic rate kinetic model parameterdetermination in humans: The lumped constants and rate constants for[18F]fluorodeoxyglucose and [11C]deoxyglucose. J. Cereb. Blood FlowMetab. 5, 179–192.
usinek, H., Chandra, R., 1993. Accuracy of tissue volume determinationfrom MRI: a phantom study. Invest Radiol. 28, 890–895.
usinek, H., De Santi, S., Frid, D., Tsui, W., Tarshish, C., Convit, A., de Leon,M.J., 2003. Regional brain atrophy rate predicts future cognitive decline:6-year longitudinal MR imaging study of normal aging. Radiology 229,691–696.
chenk, D., Barbour, R., Dunn, W., Gordon, G., Grajeda, H., Guido, T.,Hu, K., Huang, J., Johnson-Wood, K., Khan, K., Kholodenko, D., Lee,M., Liao, Z., Lieberburg, I., Motter, R., Mutter, L., Soriano, F., Shopp,G., et al., 1999. Immunization with amyloid-beta attenuates Alzheimer-disease-like pathology in the PDAPP mouse. Nature 400, 173–177.
ilverman, D.H.S., Small, G.W., Chang, C.Y., Lu, C.S., Kung de Aburto,M.A., Chen, W., Czernin, J., Rapoport, S.I., Pietrini, P., Alexander,G.E., Schapiro, M.B., Jagust, W.J., Hoffman, J.H., Welsh-Bohmer, K.A.,Alavi, A., Clark, C.M., Salmon, E., de Leon, M.J., Mielke, R., Cum-mings, J.L., Kowell, A.P., Gambhir, S.S., Hoh, C.K., Phelps, M.E., 2001.Positron emission tomography in evaluation of dementia: regional brainmetabolism and long-term outcome. JAMA 286, 2120–2127.
mall, G.W., Mazziotta, J.C., Collins, M.T., Baxter, L.R., Phelps, M.E.,Mandelkern, M.A., Kaplan, A., LaRue, A., Adamson, C.F., Chang, L.,Guze, B.H., Corder, E.H., Saunders, A.M., Haines, J.L., Pericak-Vance,M.A., Roses, A.D., 1995. Apolipoprotein E type 4 allele and cerebralglucose metabolism in relatives at risk for familial Alzheimer’s disease.JAMA 273, 942–947.
okoloff, L., Reivich, M., Kennedy, C., Des Rosiers, M.H., Patlak,C.S., Pettigrew, K.D., Sakurada, O., Shinohara, M., 1977. The[14C]deoxyglucose method for the measurement of local cerebral glu-cose utilization: theory, procedure, and normal values in the consciousand anesthetized albino rat. J. Neurochem. 28, 897–916.
alairach, J., Tournoux, P., 1988. Co-Planar Stereotaxic Atlas of the Human
Brain. Thieme, Stuttgart.ander Borght, T., Minoshima, S., Giordani, B., Foster, N.L., Frey, K.A.,Berent, S., Albin, R.L., Koeppe, R.A., Kuhl, D.E., 1997. Cerebralmetabolic differences in Parkinson’s and Alzheimer’s disease matchedfor dementia severity. J. Nucl. Med. 38, 797–802.