Embed Size (px)
Citation preview
Zurich Open Repository andArchiveUniversity of ZurichMain LibraryStrickhofstrasse 39CH-8057 Zurichwww.zora.uzh.ch
Year: 2018
Functional hyperconnectivity vanishes in children with developmentaldyscalculia after numerical intervention
Michels, Lars ; O’Gorman, Ruth ; Kucian, Karin
Abstract: Developmental dyscalculia (DD) is a developmental learning disability associated with deficitsin processing numerical and mathematical information. Although behavioural training can reduce thesedeficits, it is unclear which neuronal resources show a functional reorganization due to training. We exam-ined typically developing (TD) children (N=16, mean age: 9.5 years) and age-, gender-, and handedness-matched children with DD (N=15, mean age: 9.5 years) during the performance of a numerical ordertask with fMRI and functional connectivity before and after 5-weeks of number line training. Usingthe intraparietal sulcus (IPS) as seed region, DD showed hyperconnectivity in parietal, frontal, visual,and temporal regions before the training controlling for age and IQ. Hyperconnectivity disappeared aftertraining, whereas math abilities improved. Multivariate classification analysis of task-related fMRI datacorroborated the connectivity results as the same group of TD could be discriminated from DD beforebut not after number line training (86.4 vs. 38.9%, respectively). Our results indicate that abnormallyhigh functional connectivity in DD can be normalized on the neuronal level by intensive number linetraining. As functional connectivity in DD was indistinguishable to TD’s connectivity after training, weconclude that training lead to a re-organization of inter-regional task engagement.
DOI: https://doi.org/10.1016/j.dcn.2017.03.005
Posted at the Zurich Open Repository and Archive, University of ZurichZORA URL: https://doi.org/10.5167/uzh-138251Journal ArticlePublished Version
The following work is licensed under a Creative Commons: Attribution-NonCommercial-NoDerivatives4.0 International (CC BY-NC-ND 4.0) License.
Originally published at:Michels, Lars; O’Gorman, Ruth; Kucian, Karin (2018). Functional hyperconnectivity vanishes in childrenwith developmental dyscalculia after numerical intervention. Developmental Cognitive Neuroscience,30:291-303.DOI: https://doi.org/10.1016/j.dcn.2017.03.005
Contents lists available at ScienceDirect
Developmental Cognitive Neuroscience
journal homepage: www.elsevier.com/locate/dcn
Functional hyperconnectivity vanishes in children with developmental
dyscalculia after numerical intervention
Lars Michelsa,b,c,⁎
, Ruth O’Gormanb,c, Karin Kucianb,c,d
a Clinic of Neuroradiology, University Hospital Zurich, Switzerlandb Center for MR-Research, University Children's Hospital Zurich, Zurich, Switzerlandc Children's Research Center, University Children's Hospital Zurich, Zurich, Switzerlandd Center for Neuroscience Zurich, University and ETH Zurich, Zurich, Switzerland
A R T I C L E I N F O
Keywords:
Functional connectivity
Functional magnetic resonance imaging
Developmental dyscalculia
Intraparietal sulcus
Number line training
A B S T R A C T
Developmental dyscalculia (DD) is a developmental learning disability associated with deficits in processing
numerical and mathematical information. Although behavioural training can reduce these deficits, it is unclear
which neuronal resources show a functional reorganization due to training. We examined typically developing
(TD) children (N = 16, mean age: 9.5 years) and age-, gender-, and handedness-matched children with DD
(N = 15, mean age: 9.5 years) during the performance of a numerical order task with fMRI and functional
connectivity before and after 5-weeks of number line training. Using the intraparietal sulcus (IPS) as seed region,
DD showed hyperconnectivity in parietal, frontal, visual, and temporal regions before the training controlling for
age and IQ. Hyperconnectivity disappeared after training, whereas math abilities improved. Multivariate
classification analysis of task-related fMRI data corroborated the connectivity results as the same group of TD
could be discriminated from DD before but not after number line training (86.4 vs. 38.9%, respectively). Our
results indicate that abnormally high functional connectivity in DD can be normalized on the neuronal level by
intensive number line training. As functional connectivity in DD was indistinguishable to TD’s connectivity after
training, we conclude that training lead to a re-organization of inter-regional task engagement.
1. Introduction
The term “developmental dyscalculia” (DD) was first introduced in
1968 (Cohn, 1968) to describe a learning disability in basic numerical
and mathematical operations, such as addition or subtraction deficits.
Similar to dyslexia, DD affects about 3–6% of the population (Badian,
1999; Gross-Tsur et al., 1996; Kosc, 1974), and recent findings suggest
that slightly more girls are affected than boys (Fischbach et al., 2013).
One interesting observation is that individuals with DD cannot master
mathematics despite normal cognitive abilities in other domains.
Children with DD also show a persistent inability to commit basic
arithmetic information to long-term memory, to understand, or access
magnitudes associated with number words and Arabic numerals, as
well as a delay in the learning of arithmetical procedures (Butterworth
et al., 2011; Geary, 1993; Jordan et al., 2003; Rousselle and Noël, 2007;
Mazzocco et al., 2011).
Several behavioural and neuroimaging studies examined children
with DD relative to typically developing (TD) children to identify the
role of confounding behavioural factors and underlying neuronal
substrates associated with DD. Behavioural studies predominantly
focused on tasks involving addition problems and could show that
children with DD rely more on counting strategies relative to TD (Geary
et al., 2004). Structural and functional MRI studies revealed that DD
show structural disparities from TD, particularly in the parietal and
frontal cortex (Rotzer et al., 2008; Rykhlevskaia et al., 2009), as well as
altered “activation” (i.e. fMRI signal changes) in parietal and frontal
regions during various arithmetic tasks (Ashkenazi et al., 2012; Kucian
et al., 2006a; Berteletti et al., 2014; Morocz et al., 2012; Molko et al.,
2003; Kucian et al., 2011a; Mussolin et al., 2010a; Kucian et al., 2011b;
Dinkel et al., 2013; Kaufmann et al., 2009a; Kaufmann et al., 2011).
Although these findings are based on different numerical tasks, ranging
from rather basic number sense (non-symbolic distance effect (Price
et al., 2007)) to the understanding of ordinality (Kucian et al., 2011b),
symbolic number comparison (Mussolin et al., 2010b), arithmetic
(multiplication or approximate addition) (Kucian et al., 2006a;
Berteletti et al., 2014), and non-numerical skills that are processed by
overlapping networks (spatial working memory) (Rotzer et al., 2009),
coincident reductions of brain activation has been reported in the
parietal lobe. These findings suggest that children with demonstrate
functional demonstrate deficits in the core region for number proces-
http://dx.doi.org/10.1016/j.dcn.2017.03.005
Received 8 December 2016; Received in revised form 23 February 2017; Accepted 16 March 2017
⁎ Corresponding author at: Sternwartstr. 6, 8091 Zurich, Switzerland.
E-mail address: [email protected] (L. Michels).
Developmental Cognitive Neuroscience xxx (xxxx) xxx–xxx
1878-9293/ © 2017 The Authors. Published by Elsevier Ltd. This is an open access article under the CC BY-NC-ND license (http://creativecommons.org/licenses/BY-NC-ND/4.0/).
Please cite this article as: Michels, L., Developmental Cognitive Neuroscience (2017), http://dx.doi.org/10.1016/j.dcn.2017.03.005
sing in the parietal lobe, which might be seen as a direct neuronal
correlate of math difficulties (for review see Kucian, 2016).
However, it is known that functional changes in DD affect multiple
distributed brain networks including different subparts of the frontal
and parietal cortex but also areas in the (ventral) temporo-occipital
cortex and subcortical regions (Ashkenazi et al., 2012; Mussolin et al.,
2010a; Kaufmann et al., 2011; Kucian and von Aster, 2015). Com-
monly, activity is less modulated in DD (comparing simple and complex
task situations) in the bilateral inferior parietal sulcus (IPS), irrespec-
tive of the overall difference in signal level, indicating that the IPS is not
just under-activated but also lacks the ability to generate distinct
neuronal responses for arithmetic problems with different task-com-
plexities. Pinel et al. found that regions whose activation was modu-
lated by numerical distance were located in the bilateral IPS, the
precuneus, and the left precentral gyrus. Activation decreased quasi-
monotonically as the numerical distance increased in each of these
brain regions (Pinel et al., 2001). Some fMRI studies using numbers
larger than 10 in a number comparison task (Le Clec et al., 2000;
Rickard et al., 2000) reported bilateral or unilateral activation of the
IPS or angular gyrus. More recently, Berteletti and colleagues demon-
strated that DD children could only engage numerical processing
regions (i.e. reflected in fMRI signal changes of the IPS) when solving
small problems, suggesting an impaired functionality of the IPS
particularly in complex mathematical operations. In a longitudinal
study, Dumontheil and Klingberg reported that working memory
related activation of the (left) IPS predicts arithmetical outcome better
than behavioural measures alone (Dumontheil and Klingberg, 2012),
providing further evidence for the apparent link between the IPS and
mathematical reasoning abilities.
To our knowledge, only two studies investigating changes in brain
activation after intervention in children with DD have been conducted
so far (Kucian et al., 2011b; Iuculano et al., 2015). In the study by
Kucian and co-workers, children with and without DD completed a 5-
week training program with the aim of improving number representa-
tions and strengthening the link between numbers and spatial proces-
sing on the internal mental number line (Kucian et al., 2011b). Results
indicated that, after completion of the training, functional circuitry was
positively influenced, i.e. the pattern of brain activation altered from
atypical towards more typical brain activation. Iuculano and colleagues
demonstrated that cognitive tutoring induced widespread neuroplasti-
city and restores brain function in children with mathematical learning
disabilities (MLD) using an addition (verification) task (Iuculano et al.,
2015). Typically, the definition of MLD is based on a slightly more
liberal cut-off criterion (1 SD below norm) with respect to math abilities
than usually conducted in DD (1.5 SD below norm). The authors found
non-discriminable fMRI brain activity only after cognitive tutoring. In
the identical sample, Supekar et al. (2015) additionally demonstrated a
remediation of (childhood) math anxiety and associated neuronal
circuits through cognitive tutoring.
To study development-related cognitive deficits, it is important to
consider not only alterations in local brain responses but also neuronal
network properties, especially since arithmetic processing is thought to
rely on multiregional coordination (Rosenberg-Lee et al., 2011). Fast
and accurate connections between the different brain regions are
crucial for efficient transfer and maintenance of information during
number processing and calculation. Little is currently known concern-
ing specific impairments of brain connections that are probable
neuronal correlates of DD (for review see Kucian, 2016). Nevertheless,
existing diffusion tensor imaging (DTI) studies provide evidence of
impaired fiber tracts connecting different brain areas of the fronto-
parietal network known to be responsible for number processing and
calculation. More specifically, Rykhlevskaia et al. reported long-range
white matter projection fibres linking the right fusiform gyrus with
temporo-parietal white matter as a specific source of vulnerability in
children with DD. More recent results of Kucian et al. (Kucian et al.,
2013a) highlighted a deficit in children with DD of the superior
longitudinal fasciculus, a fibre tract that connects parietal, frontal,
and temporal areas. In particular, the superior longitudinal fasciculus
seemed to be affected in parts that are adjacent to key areas for number
processing, namely the IPS. Few functional connectivity (FC) studies,
using fMRI, examined inter-regional communication in DD (i.e. children
with mathematical disabilities) during either addition and subtraction
tasks (Rosenberg-Lee et al., 2015) or a rest (eyes closed) condition
(Jolles et al., 2016). Rosenberg-Lee and colleagues selected a subtrac-
tion task as it is subtraction which is thought to draw more on an
internal representation of quantity (Dehaene et al., 2003) and the
execution of calculation procedures (Campbell and Xue, 2001). The
authors reported greater fMRI signal changes in the IPS and other visuo-
parietal brain regions in DD compared to TD (Rosenberg-Lee et al.,
2015). For the (effective) FC analysis, the authors focused on the IPS,
due to its important role in numerical processing and arithmetic deficits
in DD (for a review see: Kucian (Ashkenazi et al., 2012; Kucian et al.,
2006a; Kucian et al., 2011a)), and since it is known that greater
structural connectivity is linked to better math ability (Emerson and
Cantlon, 2012; Kucian et al., 2013b). One possible explanation for the
hyperconnectivity in DD could be due to its spatial specificity, present
in the Default Mode Network (DMN) and Task Positive Network (TPN).
Specifically, and consistent with observations from another fMRI study
(Davis et al., 2009), children with DD seem to be unable to deactivate
core regions of the DMN (such as the posterior cingulate cortex and
ventromedial prefrontal cortex) during subtraction or addition. Alter-
natively, hyperconnectivity in the TPN might reflect prefrontal com-
pensation (as children with DD showed stronger fMRI responses across
tasks in part of this network).
Based on these previous studies, it is not yet known whether
hyperconnectivity in DD is also observable during other tasks, such as
numerical ordinality judgement. Secondly, it is unknown if number line
training leads to normalization of this hyperconnectivity, especially of
prefronto-parietal regions in DD, similar to the reported neuronal
normalization using cognitive tutoring. Different approaches have been
proposed, in order to assess task-related neuroplasticity changes on the
level of connectivity measures. For example, some studies applied
(spontaneous) background FC analysis to extract task-related FC (Fair
et al., 2007; Ghisleni et al., 2015; Norman-Haignere et al., 2012).
Although the strength of FC is constrained by structural connectivity, it
is modulated by mental states and current context, such that intrinsic
activity constitutes the brain’s internal context for processing external
information and generating behaviour (Fontanini and Katz, 2008;
Sadaghiani et al., 2010a; Sadaghiani et al., 2010b). Hence, background
FC captures “general task engagement”, as it removes some portion of
the FC differences that are simply due to co-activation as a response to
the task but the remaining residual signal still contains task effects.
Alternatively, Psycho-Physical Interaction (PPI) analysis informs about
the interaction between a psychological state (e.g. ordinality proces-
sing) and the functional coupling between two (or more) brain areas
(Friston et al., 1997).
In this study, we applied background and PPI FC analysis in order to
asses if a 5-week number line training (Kucian et al., 2011b) can
normalize aberrant neuronal connectivity patterns in DD relative to TD
who also received the same intervention. We then applied a multi-
variate classification analysis to assess if brain activity before and after
number line training can dissociate TD from DD. Based on previous
findings (Kucian et al., 2011b; Iuculano et al., 2015; Rosenberg-Lee
et al., 2015; Supekar et al., 2015) we hypothesize that number line
training leads to a neuronal normalization (i.e. comparable FC to TD) of
fronto-parietal brain regions and increased task performance in DD. To
test this hypothesis, we selected a numerical order task for fMRI, as it
has been demonstrated that children with DD show altered activation in
the bilateral IPS and various frontal (superior frontal and insular)
regions during ordinality judgement (Kucian et al., 2011b).
L. Michels et al. Developmental Cognitive Neuroscience xxx (xxxx) xxx–xxx
2
2. Methods
2.1. Participants
The participants were chosen from a former study (Kucian et al.,
2011b) including originally 16 TD children and 16 DD. We had to
exclude data from one DD child (from the original sample used in
(Kucian et al., 2011b)) because the log-file of the fMRI paradigm (post
training) was not readable anymore. This resulted in a total of 31
children between 7.8 and 11.8 years of age, which could be included in
the present study, of whom 15 children fulfilled the clinical criteria of
DD and 16 were age-, gender-, and handedness-matched TD children
with age-appropriate calculation performance.
This sample size is similar to previously published studies of
children with MLD or DD (Kucian et al., 2011a; Price et al., 2007;
Iuculano et al., 2015; Rosenberg-Lee et al., 2015; Kaufmann et al.,
2009b). According to the DSM-5 (Association, 2013), criteria for DD
were met (and applied in this study) if a child's performance in the
Neuropsychological Test Battery for Number Processing and Calcula-
tion in Children (ZAREKI-R (Kucian et al., 2006b)) was below the 10th
percentile in at least three subtests or in the total score, and estimated
intelligence quotient lay in the normal range.
None of the participants had neurological or psychiatric disorders,
was on medication, or had exclusion criteria for MRI such as braces. A
detailed list (including demographical and cognitive measures) of all
volunteers is provided in Table 1. Ethics approval was obtained from
the cantonal ethics-commission Zurich based on guidelines from the
World Medical Association's Declaration of Helsinki (WMA, http://
www.wma.net/en/30publications/10policies/b3/). The parents of all
participants gave written informed consent prior to the study.
2.2. Cognitive assessment
2.2.1. Number processing
Numerical abilities were assessed using the standardized
Neuropsychological Test Battery for Number Processing and
Calculation in Children (ZAREKI-R (Kucian et al., 2006b)). This
neuropsychological battery examines basic skills in calculation and
arithmetic and aims to identify and characterize the profile of mathe-
matical abilities in children with DD. It is composed of 12 subtests: 1.
counting dots, 2. counting backwards, 3. writing Arabic digits, 4.
mental calculation (addition, subtraction, and multiplication), 5. read-
ing Arabic digits, 6. number line I (allocation of a number word or an
Arabic digit to one of four given marks on a number line 0–100), and
number line II (mark the position of a number word or an Arabic digit
on a number line 0–100), 7. digit span forward and backward, 8.
number word comparison, 9. perceptive magnitude judgement (estima-
tion of number of dots, balls, cups shown for 2 or 5 s), 10. cognitive
contextual magnitude evaluation (e.g. four fridges in a kitchen – is this
few, normal, a lot?), 11. word problems, 12. Arabic digit comparison.
According to the ZAREKI-R instructions for diagnosis, criteria for DD
are met if a child's performance in the ZAREKI-R is below the 10th
percentile in the total score or in at least three of the following subtests:
writing Arabic digits, reading Arabic digits, mental calculation addi-
tion, mental calculation subtraction, mental calculation multiplication,
number word comparison, Arabic digit comparison, cognitive contex-
tual magnitude evaluation, number line I, number line II. However,
ZAREKI does not use results for counting backwards, digit span
forwards and backwards, and hence working memory related tests
are not considered by this type of DD diagnosis.
2.2.2. Number line performance
The spatial representation of numbers was measured by a paper-
and-pencil number line task. Children had to indicate on a left-to-right
oriented number line from 0 to 100 the location of 20 Arabic digits,
results of 20 additions and 20 subtractions (task conditions), or the
estimated number of 10 different dot arrays (control condition). First, a
card with an Arabic digit was shown to the child. Then, the child
marked with a pencil the location of the number on the number line, at
which point the next card was shown and the child indicated the
location on the next number line template. After 20 Arabic digits, 20
cards with additions were presented, which the child had to solve and
indicate the location of the result on the number line. The same
procedure was repeated for 20 subtraction problems. Finally, 10 cards
were shown for only 3 s, which contained randomly arranged dots. The
child had to estimate the number of dots and mark the location on the
number line. The error rate of the paper-and-pencil number line task
was evaluated by measuring the distance in percent (% distance)
relative to the position of the correct number for each trial. Mean%
distance was then calculated over all trials (Arabic digits, additions,
subtractions, dots), but only correctly calculated addition and subtrac-
tion problems were included. A detailed description of the task is
described in one previous publication of our group (Kucian et al.,
2011b).
Children performed balanced different versions of this task imme-
diately before starting the training and after finishing the training
period of 5 weeks to examine domain specific effects of the number line
intervention.
2.2.3. Arithmetic
Arithmetic performance was assessed from the mean number of
correctly solved addition and subtraction problems solved in the
number line task. In total 40 arithmetic problems had to be solved
(20 additions, 20 subtractions) in the number range 0–100. Difficulty
levels of additions and subtractions were balanced. Arithmetical skills
were measured before and after the training by paralleled versions of
the task to evaluate possible transfer effects of an approximate number
line intervention to exact arithmetical skills.
2.2.4. Intelligence
Intelligence was measured with three verbal (Vocabulary,
Arithmetic, Similarities) and two performance subtests (Picture
Arrangement, Block Design) of the Wechsler Intelligence Scale for
Children (WISC-III) (Wechsler, 1992).
2.2.5. Spatial memory span & spatial working memory
Spatial memory span was measured with the CORSI-Block Tapping
test (Schellig, 1997), which requires participants to repeat the se-
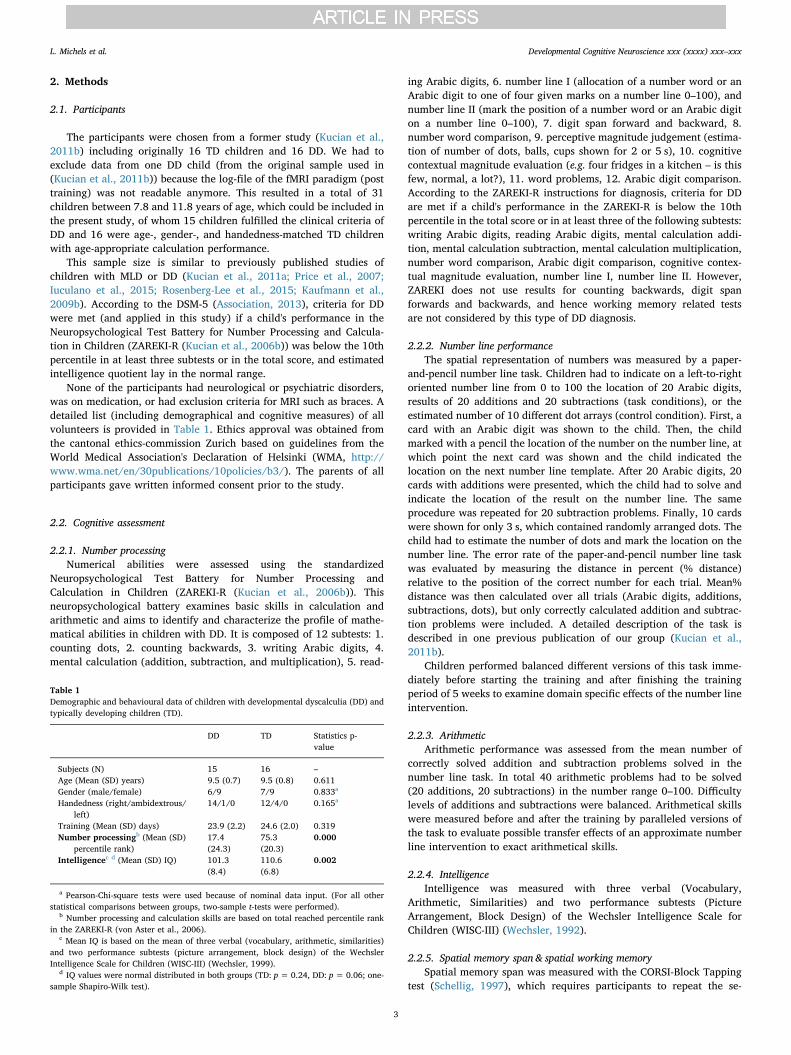
Table 1
Demographic and behavioural data of children with developmental dyscalculia (DD) and
typically developing children (TD).
DD TD Statistics p-
value
Subjects (N) 15 16 –
Age (Mean (SD) years) 9.5 (0.7) 9.5 (0.8) 0.611
Gender (male/female) 6/9 7/9 0.833a
Handedness (right/ambidextrous/
left)
14/1/0 12/4/0 0.165a
Training (Mean (SD) days) 23.9 (2.2) 24.6 (2.0) 0.319
Number processingb (Mean (SD)
percentile rank)
17.4
(24.3)
75.3
(20.3)
0.000
Intelligencec d (Mean (SD) IQ) 101.3
(8.4)
110.6
(6.8)
0.002
a Pearson-Chi-square tests were used because of nominal data input. (For all other
statistical comparisons between groups, two-sample t-tests were performed).b Number processing and calculation skills are based on total reached percentile rank
in the ZAREKI-R (von Aster et al., 2006).c Mean IQ is based on the mean of three verbal (vocabulary, arithmetic, similarities)
and two performance subtests (picture arrangement, block design) of the Wechsler
Intelligence Scale for Children (WISC-III) (Wechsler, 1999).d IQ values were normal distributed in both groups (TD: p = 0.24, DD: p = 0.06; one-
sample Shapiro-Wilk test).
L. Michels et al. Developmental Cognitive Neuroscience xxx (xxxx) xxx–xxx
3
quences of touched cubes on a wooden board in the same order as that
demonstrated by the examiner. While the sequences gradually increase
in length, the number of cubes last tapped in two consecutively correct
sequences is defined as the maximum span. Spatial working memory
was assessed by the Block Suppression Test (Beblo et al., 2004). This
test is based on the CORSI-Block tapping test, and subjects need to
reproduce every second block in a given sequence. Both, spatial
memory span and spatial working memory were assessed before and
after training to test if the numeric intervention has also an effect on
general cognitive abilities.
2.2.6. Handedness
Handedness was determined by the Edinburgh Handedness
Inventory (Oldfield, 1971).
2.3. Training
All TD and DD received the same training. By this, we could track
(1) if DD children overcome their difficulties in numerical and
mathematical operations (see behavioural results) and (2) if TD benefit
from the training as well. Children trained at home 15 min a day, 5 days
a week for 5 weeks with the computer-based intervention software
“Rescue Calcularis” (Kucian et al., 2011b). A timer controls the daily
training time, which is always visible during the game. After complet-
ing the 15 min training session, the program is automatically blocked
until the next day. The program consists of a number line training
program, which aims to improve the spatial representation of numbers
and automated access to the internal mental number line, including an
improved association between representations of numbers and space,
the understanding of ordinality of numbers, estimation, and arithme-
tical skills. Therefore, the evaluation of possible training effects
included a variety of numerical skills ranging from number line
performance and ordinality judgements to arithmetic. The training
consists of a number line 0–100 that is displayed at the bottom of the
screen, while from the top of the screen a spaceship appears carrying an
Arabic digit, an addition or subtraction problem, or a set of dots. The
player is asked to steer the spaceship to the exact location on the
number line corresponding to the Arabic digit, the result of the addition
or subtraction problem, or the estimated number of dots displayed on it.
If the child lands within a range of± 10 of the correct position, the
challenge is rated as successful. Immediately after landing, the exact
position within the range of± 10 is given as feedback. The training
consists of 30 levels with increasing difficulty. Each level is built of 75
trials, resulting in 2250 trials for all levels. The next level can be
reached when each problem on the current level has been solved
correctly. Incorrectly solved tasks are repeated until they are solved
successfully to support learning. Thus, a major virtue of the training is
that it works in an adaptive way and each child trains at her or his
individual performance level and speed. To sustain motivation and
focus attention, the rocket flies with a speed that can be accelerated or
decelerated to the initial velocity, and motivating feedback appears
when the child has performed very well or very badly. For further
description of the training procedure, please see Kucian et al. (Kucian
et al., 2011a).
2.4. Brain imaging
2.4.1. Functional MRI paradigm
To investigate possible effects of the number line training on brain
function, children performed a numerical order judgement task in the
scanner, since the mental representation of ordinal sequences is
spatially organized and therefore related to the internal mental number
line representation (e.g. Gevers et al., 2003; Rubinsten and Sury, 2011;
Goffin and Ansari, 2016). The fMRI task was comprised of two
conditions: numerical order and control. In both conditions three
single-digit Arabic numbers were presented horizontally via video
goggles (MRI Audio/Video System, Resonance Technology, Inc., USA)
and button press answers were recorded by means of the response box
(LUMINA, Cedrus Corporation, San Pedro, USA). In the order condition,
children were instructed to judge whether the three numbers were in
ascending or descending order. In the control task, they had to
distinguish whether one of the digits was a “2” or not. The contrast
between order and control condition was selected to map numerical
ordinality. The paradigm was programmed on E-Prime (E-Prime,
Psychology Software Tools Inc.). It lasted 10.5 min and consisted of
four epochs of the order and four epochs of the control condition.
Epochs of order and control tasks were presented in a counter-balanced
manner between subjects. A fixation cross was displayed for 20 s
between any epoch. Each epoch included 10 trials, each of which was
presented for 2 s, followed by a blank screen. The inter-stimulus-
interval was jittered between 3 and 5 s. For further details, please see
(Kucian et al., 2011b).
2.4.2. FMRI data acquisition
FMRI data was collected on a 3 T GE scanner (GE Medical Systems,
Milwaukee, WI, USA), equipped with an 8-channel head coil. Thirty-six
slices were acquired parallel to the anterior commissure – posterior
commissure line. Others parameters were: slice thickness: 3.4 mm,
matrix size: 64 × 64, field of view: 220 mm× 220 mm, flip angle: 45°,
echo time: 31 ms, and repetition time: 2100 ms. Three-dimensional
anatomical images of the entire brain were obtained with a T1-
weighted gradient echo pulse sequence (number of slices: 172, slice
thickness: 1.0 mm, repetition time: 9.972 ms, echo time: 2.912 ms, field
of view: 240 mm × 240 mm, flip angle: 20°, and matrix size:
256 × 192). Cushions were placed around participants’ heads to
minimize head movement.
2.5. Data analyses
2.5.1. Behavioural data
Statistical analysis of behavioural data was performed with IBM
SPSS Statistics Version 22. A repeatedmeasures general linear model
(GLM) analysis was conducted to evaluate training effects (pre-/post-
training) as within-subject factor and group (DD/TD) as between-
subject factor. Effects of training, training x group interaction, as well
as tests of between group effects are reported. In the case that one of
these effects turned out to be significant, post-hoc t-tests were
conducted. In addition, partial eta-squared (ƞ2) effect sizes are
reported, whereas effects 0.01–0.06 are interpreted as small effects,
0.06–0.14 as medium effects, and>0.14 as large effects (Cohen,
1988). Pearson-Chi-squared tests were used for nominal data compar-
isons between groups.
2.5.2. FMRI data pre-processing
SPM5 (Wellcome Department of Cognitive Neurology, London, UK)
was used for all prepossessing steps. The steps included head motion
realignment, coregistration of the individual T1-images to the first
motion-corrected functional image of each subject, normalisation of the
T1-images an age-matched paediatric template (CCHMC paediatric
brain template, http://www.irc.cchmc.org/ped_brain_templates.htm),
transformation of normalisation parameters to the realigned functional
images, and spatial smoothing (6 mm Gaussian kernel). All children
fulfilled the inclusion criteria of (1) fMRI task performance above
chance level, (2) mean scan-to-scan displacement< 1 mm (for the pre-
and post-training fMRI run) and (3) head rotation below 1° in pitch, jaw
or roll direction. Movement parameters did not differ between DD and
TD between the pre- and post-training sessions (all p > 0.13). Within
each group, no differences in movement parameters were seen between
the pre and post training session (all p > 0.16). No differences were
seen in the mean scan-to-scan displacement between groups and session
(all p > 0.21).
L. Michels et al. Developmental Cognitive Neuroscience xxx (xxxx) xxx–xxx
4
2.5.3. Functional connectivity (FC) analysis
All FC analyses (using the pre-processed fMRI data) were performed
with the Conn toolbox (version 15b, Whitfield-Gabrieli and Nieto-
Castanon (Whitfield-Gabrieli and Nieto-Castanon, 2012)). Additionally,
data were temporally filtered (0.01–0.1 Hz) as is common for fMRI FC
analysis (Biswal et al., 1995). In addition to the six motion parameters,
white matter- and cerebrospinal fluid signals were used as covariates of
no interest to reduce variance unlikely to reflect functional connectiv-
ity-related neuronal activity (Fair et al., 2007; Villalobos et al., 2005).
Only the white matter and cerebrospinal fluid signals were removed to
avoid any bias introduced by removing the global signal (i.e., grey
matter) (Behzadi et al., 2007; Murphy et al., 2009). This denoising step
should ‘normalize' the distribution of voxel-to-voxel connectivity values
as effectively as including the global signal as a covariate of no interest,
but without the potential problems of the latter method. Although we
did not record respiration and cardiac responses, it has been demon-
strated that non-neuronal physiological noise (e.g., cardiac and respira-
tory signal) can successfully be removed by the CompCor algorithm
(Behzadi et al., 2007), as implemented in the Conn toolbox. After the
denoising step, we visualized the distribution of voxel-to-voxel con-
nectivity for each step. Participants were only included if the values
were normally distributed.
For each individual, the fMRI time-series were extracted for the seed
region of interest using MarsBaR (Brett, Anton (Brett et al., 2002);
http://marsbar.sourceforge.net/). As seed, we selected the bilateral IPS
with identical coordinates (left:−28,−64, 42, right: 32,−60, 44) to a
previous FC study in DD (Rosenberg-Lee et al., 2015). The size of each
seed was determined as a 6-mm-diameter sphere.
First, we investigated FC related to spontaneous background activity
to assess FC differences related to the general task engagement. For
each subject, we defined one regressor that spanned the whole time
interval of the fMRI run. The effect of task conditions (i.e., pre and post
ordinality blocks) was regressed out by moving them to the first-level
covariates list (Fair et al., 2007). On the second level, we first estimated
the main effects (F-tests) of group (TD or DD) and time (before and after
training) using a 2 × 2 analysis of variance. We also calculated group x
time interaction effects. In case of significant main effects, we applied
planned contrasts (using t-tests) to assess the within and between group
differences prior and after number line training. This results in eight
group comparisons: TD pre vs. TD post (and vice versa), DD pre vs. DD
post (and vice versa), TD pre vs. DD pre (and vice versa), and TD post vs.
DD post (and vice versa). Further, we compared DD post vs. TD pre to
have further estimate of abnormal FC pattern in DD. In a subsequent
analysis, we included IQ as nuisance regressor to elucidate if any TD vs.
DD FC difference (before and after training) was modulated by IQ, as IQ
differs between TD and DD. As it has been argued that parametric
analysis of fMRI data are not always warranted (Eklund et al., 2012),
we repeated the analysis for the two main effects of interest: TD pre vs.
DD pre (and vice versa) and DD post vs. TD pre (and vice versa), using
non-parametric tests with a voxel threshold of p < 0.001 (uncor-
rected) and a cluster-mass correction of k > 32 voxels to achieve a
p < 0.05 (corrected).
In addition, and similar to Rosenberg and colleagues, we applied a
PPI analysis for the two contrasts of interests (i.e. TD > DD and
DD > TD) prior and after number line training. In our case, PPI
measures the temporal relation between the IPS seed regions and all
other brain voxels after accounting for the common driving influence of
task activity on both the IPS seed and target voxel (Friston et al., 1997).
We used a generalized form of PPI (gPPI) as implemented in Conn
(McLaren et al., 2012). The gPPI method has the flexibility of
estimating task-dependent FC for more than one task condition, as it
models all condition effects and interactions simultaneously in a single
model instead of using a separate model for each task condition tested.
Simulation and empirical studies have shown that gPPI is more
powerful than the standard PPI implementation in SPM, and is
especially suited to assessing FC in block design experiments (Cisler
et al., 2014). At the individual participant level, we included: (1) a
psychological variable representing the two types of conditions (control
condition and numerical order condition), (2) one physiological vari-
able (i.e. the time course in the seed region), and (3) a PPI term (i.e. the
cross product of the first two regressors). As for the background FC
analysis, we used the bilateral IPS as seed region to determine between-
group differences.
FC comparisons are initially calculated at a voxel threshold of
p < 0.001 (uncorrected for multiple comparisons, t > 3.2). We
additionally applied a cluster-correction (using AlphaSim, afni.nimh.-
nih.gov/afni/doc/manual/AlphaSim) of k > 32 voxels to achieve
p < 0.05, corrected, and these results are reported in the paper. The
voxel-threshold is identical to a previous report examining FC in DD
(Rosenberg-Lee et al., 2015).
2.5.4. Multivariate classification analysis
In order to validate the FC results, we applied statistical pattern
recognition analysis in order to test if (task-related) brain activity can
be used to discriminate DD from TD (before and after number line
training). Brain activity maps (ordinal task – control, p < 0.001,
t > 3.2 uncorrected) were taken from the fMRI results described in
our previous publication (Kucian et al., 2011b). The (freely-available)
software PRoNTo (http://www.mlnl.cs.ucl.ac.uk/pronto/) (Schrouff
et al., 2013) was used to perform the multivariate classification analysis
with a classification algorithm using a linear model. Leave-One-Out
cross-validation was applied and contained the following steps: (1)
dividing the data in n-folds (i.e. number of subjects), (2) using n-1 folds
as training data (the remaining fold is the test data), (3) rotate which
fold is the test data, (4) estimate the result for each fold and an overall
result. The pre- and post-training brain activity maps were used as input
feature sets to a pattern based classifier. Classification accuracy (see
below) was estimated in % and accuracies for each subject were
combined at the group level in an unpaired t-test and were compared
to chance level. Chance level was 50%, since we had a two-class
problem (TD and DD before training, and TD and DD after training).
The accuracy is the total number of correctly classified test samples
divided by the total number of test samples N, irrespective of class. The
accuracy is exactly equivalent to:
NlAccuracy = 1 −
1Σ 01(y , f/x )
n n n
where l01(yn, f/xn) is a 0–1 loss function that counts each classification
error as costing 1 and each classification success as costing 0. The fMRI
data was mean corrected (z-transformed) before computing the classi-
fication analysis, in order to ensure that group differences were
independent of differences in task-related activity levels.
2.5.5. Bayesian power estimation analyses and “classical” power analysis
In terms of sample size, we used Bayesian power estimation
analysis, which provide full distributions of credible values for group
means and their differences (Kruschke, 2013). Specifically, it was tested
if a pre-training between-group difference −based on the available
fMRI data- was seen using our sample size. We additionally performed a
“classical” power analysis (based on the means’ and SDs of each
sample) for a mask including all significantly activated clusters (see
Table 4 in (Kucian et al., 2011b)) showing an fMRI group difference (TD
vs. DD) using a confidence interval of 95% (alpha error rate of 5%). This
analysis was repeated for all individual clusters for this comparison too
(Kucian et al., 2011b).
3. Results
3.1. Demographic and cognitive measures
Groups were matched for age, gender, and handedness. All children
completed more than 19 training days within 5 weeks and groups did
L. Michels et al. Developmental Cognitive Neuroscience xxx (xxxx) xxx–xxx
5
not differ with respect to the amount of training days. DD children's
numerical and calculation abilities based on the ZAREKI-R were
significantly lower compared to TD children (p < 0.001). IQ values
were normally distributed (TD: p = 0.24, DD: p = 0.06; one-sample
Shapiro-Wilk test) and were in the normal range for both groups, but
differed significantly between groups (p < 0.01). Please see Table 1.
3.2. Training effects
3.2.1. fMRI task performance
Neither TD nor DD showed ceiling effects with regard to fMRI task
performance before the intervention, leaving enough room for im-
provement after the training (Table 2). 100% task accuracy was only
achieved by one TD (before training) and one DD (after training). A
repeated-measures GLM analysis with mean accuracy rate or reaction
time of the numerical order task as within-subject factor (pre-/post-
training) and group as between subject factor (DD/TD) showed no
significant training effects or interaction for the number of correctly
solved trials or mean reaction time of correct solved items during the
fMRI examination (Table 2). Tests of between group effects revealed
significant group differences in accuracy (F(1, 22) = 5.630, p < 0.05,
ƞ2 = 0.204), but not for reaction time. Post-hoc tests for accuracy
between groups indicated lower performance of DD compared to TD
before training (p < 0.01) and after training (p < 0.05).
3.2.2. Number line performance
Significant training effects and group differences were found for the
number line performance. Repeated-measures GLM analysis with
percent distance between exact and indicated location on a number
line 0–100 as within-subject factor (pre-/post-training) and group (DD/
TD) as between-subjects factor revealed a significant main effect of
training (F(1, 29) = 25.65, p < 0.001, ƞ2 = 0.469) and no interaction
between training x group. Hence, children were significantly more
accurate in the number line task after training. Test of between group
effects was significant as well (F(1, 29) = 8.458, p < 0.01,
ƞ2 = 0.226). Post-hoc analyses for group differences pre and post
training indicated that DD children performed less accurately before
the training compared to TD (p < 0.05), but this significant difference
was no longer evident after the training.
3.2.3. Arithmetic
Significant improvements in arithmetic after training and group
differences were found. Repeated-measures GLM analysis, using the
mean of correctly solved addition and subtraction trials as within-
subject factor (pre-/post-training) and group as between subjects factor
(DD/TD), revealed a significant main effect of training (F(1, 23)
= 14.12, p < 0.005, effect size partial eta-squared = 0.380). This
indicates that both groups increased in arithmetical performance after
training (Table 2), but the interaction between training x group was not
significant. Test of between group effects was significant (F(1, 23)
= 13.689, p < 0.005, ƞ2 = 0.373). Post-hoc analyses between groups
showed that TD outperformed DD children in arithmetic before
(p < 0.005) and after training (p < 0.005).
3.2.4. Spatial memory span and spatial working memory
The training had no effect on spatial memory span or spatial
working memory. Repeated-measures GLM revealed no significant
training effects or interactions between groups and task performance
for both general cognitive memory skills (spatial memory span and
spatial working memory). Please see Table 2. Test of between group
effects showed significant group differences for spatial working mem-
ory (F(1, 29) = 10.123, p < 0.005, ƞ2 = 0.259), but not for spatial
memory span. Subsequent t-test analyses showed that DD children
performed worse in spatial working memory before (p < 0.05) and
after the training (p < 0.01).
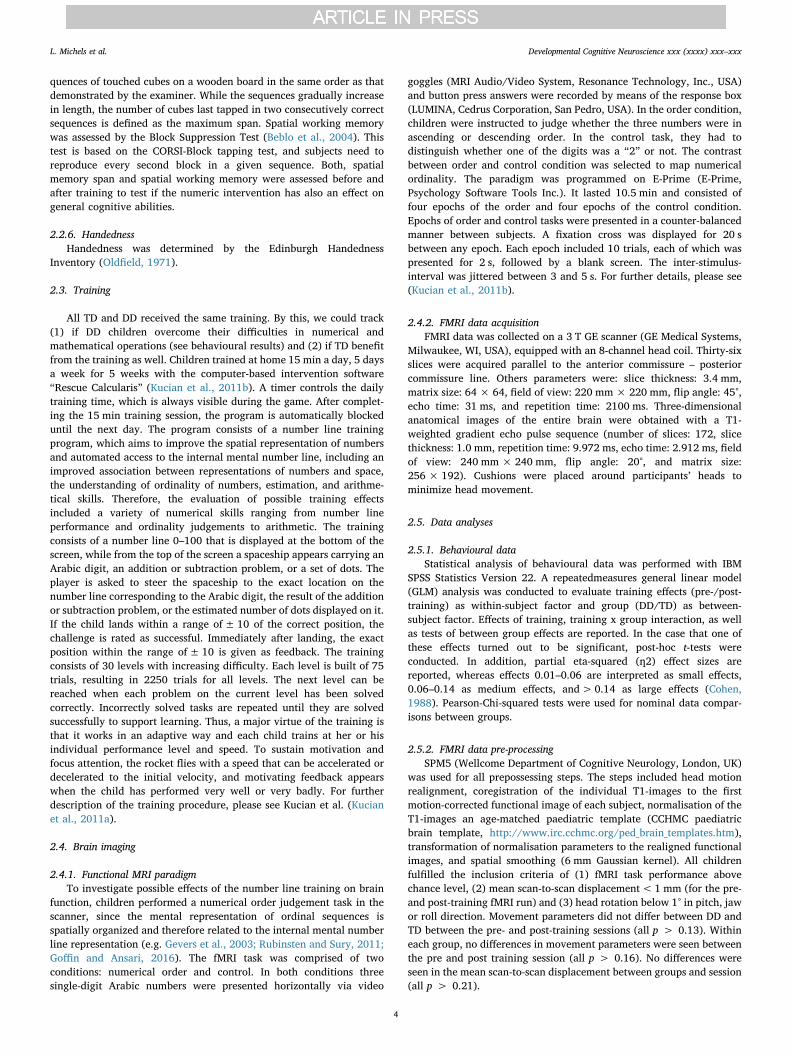
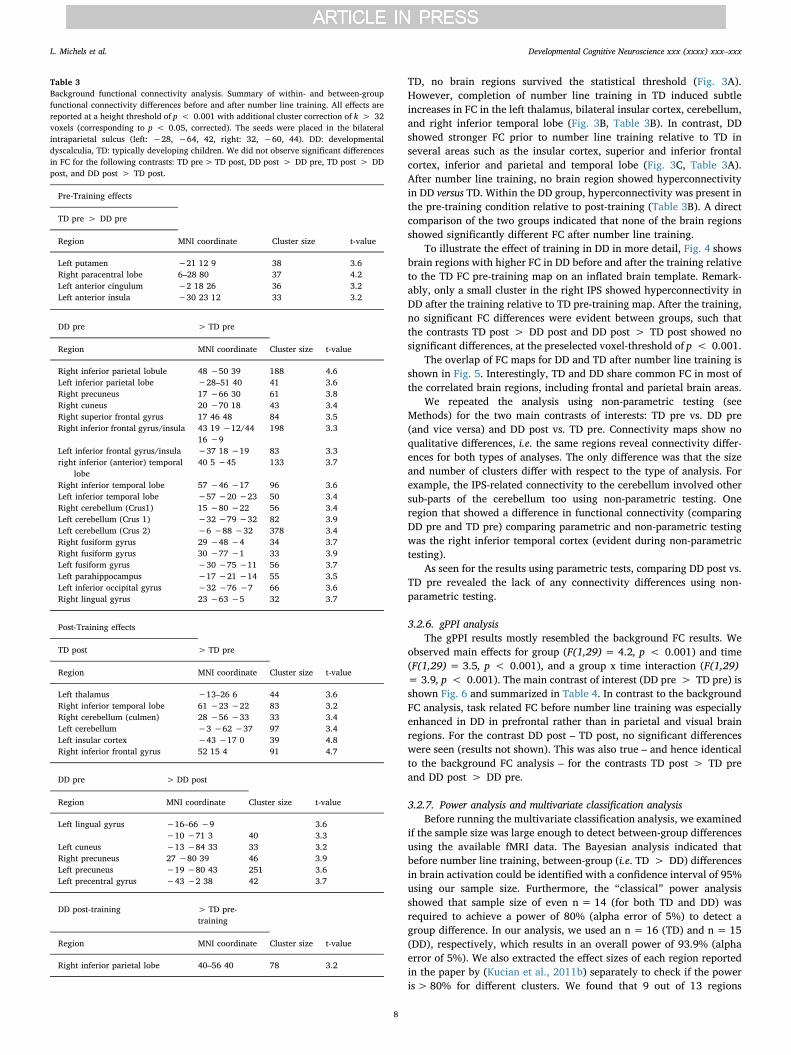
3.2.5. Background FC analysis
Fig. 1 shows IPS-related within-group FC for the two examined
groups (TD and DD) before (left columns) and after the training (right
columns). Already this visual illustration indicates hyperconnectivity in
the DD pre-training group relative to the TD pre-training group, which
drops after number line training. Indeed, we observed a main effect of
group (F(1, 29)= 3.83, p< 0.001) in several brain regions. To
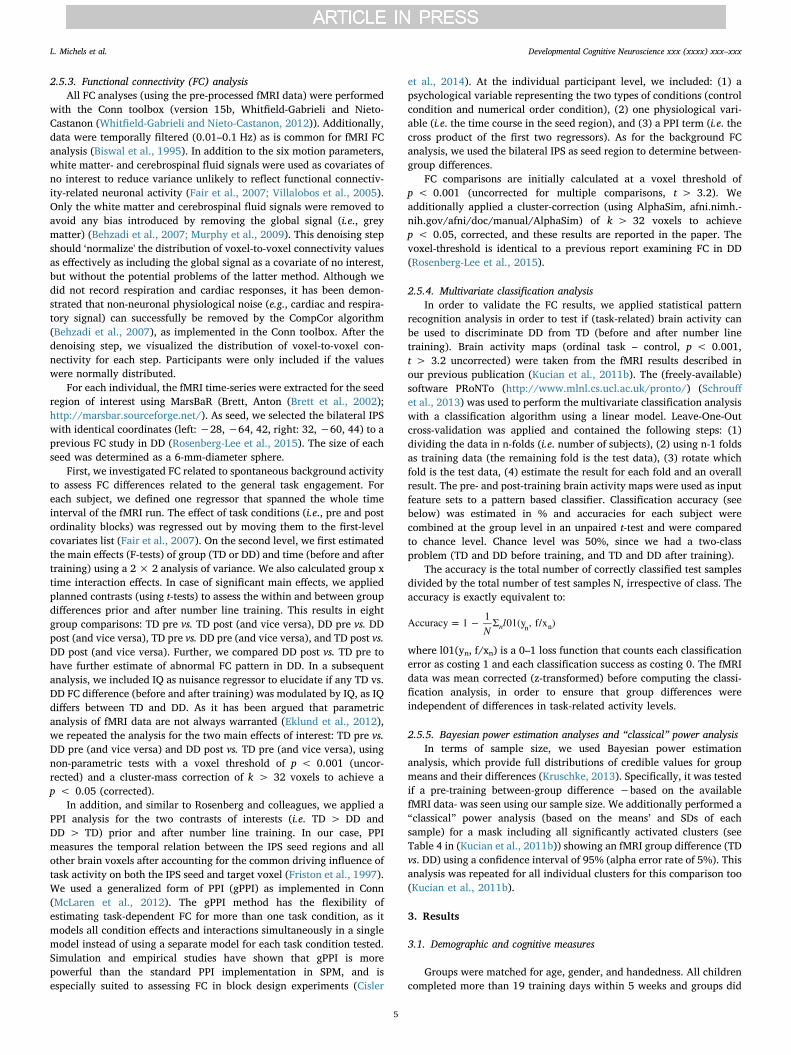
examine this in more detail, we calculated between-group FC differ-
ences before training (Fig. 2 and Table 3A) as well as within (Fig. 3) and
between FC group (Fig. 4 and Table 3B) differences after training. Since
IQ significantly differed between TD and DD, we performed FC group
analyses (comparing DD − TD before and after training) using IQ
values as a nuisance variable in the statistical model. FC findings did
not lead to qualitative changes, i.e. hyperconnectivity was evident in
the same brain regions in DD (relative to TD) and this pattern
disappeared after training (TD – DD, p > 0.05, two-sided t-tests;
results not shown). The same pattern of FC group differences was
observed using age as a nuisance variable, since the age range was wide
(7.8–11.8 years) but not significantly different between groups.
a) Between-group differences before number line training
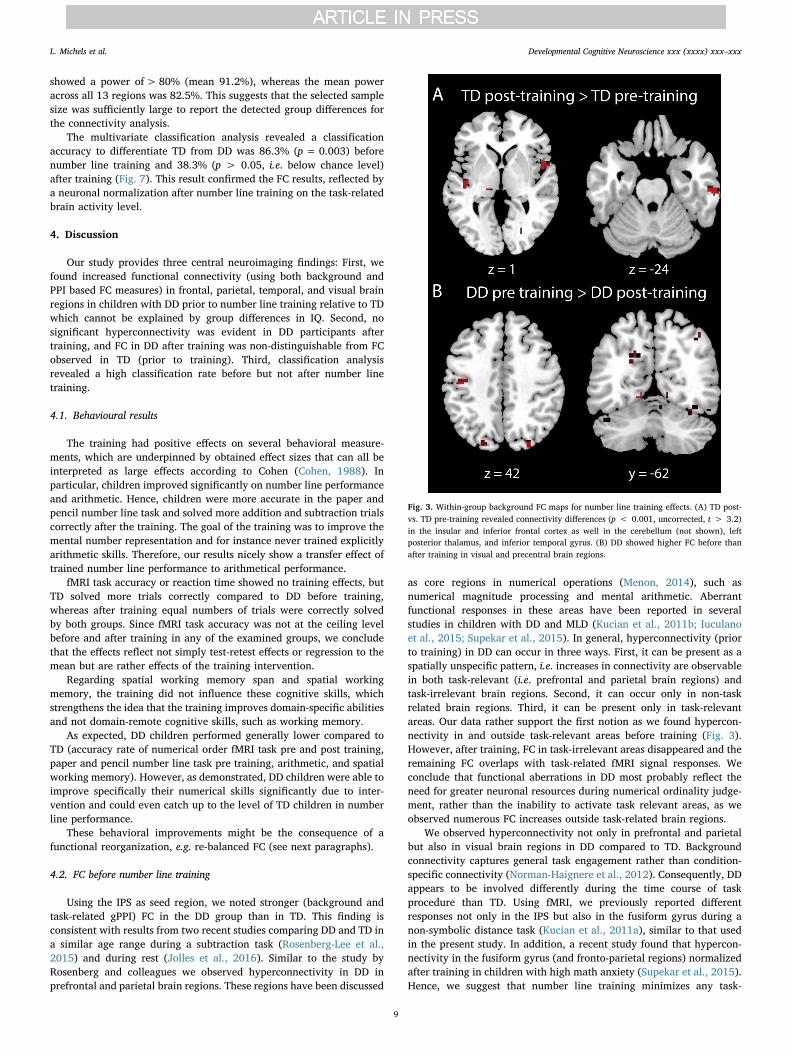
DD demonstrated hyperconnectivity relative to TD in parietal,
frontal, visual, cerebellar, and temporal brain regions (Fig. 2). A full
list of between-group differences before number line training is listed in
Table 3A.
• Training effects
The 2 × 2 analysis of variance revealed a main effect of time (F
(1,29) = 3.41, p < 0.001) as well as a group x time interaction (F
(1,29) = 3.72, p < 0.001) in numerous brain regions, the latter
indicating that number line training mediates between-group FC
differences. Comparing pre vs. post number line training effects in
Table 2
Training effects of children with developmental dyscalculia (DD) and typical developing children (TD).
DD TD Training effects
Training: pre post pre post p-value Partial eta-squared
fMRI task accuracy (Mean (SD) %) 69.7 (15.7) 77.8 (16.0) 83.9 (12.2) 86.5 (10.0) n.s. –
fMRI task reaction time (Mean (SD) ms) 1722.0 (398.1) 1788.4 (431.5) 1829.8 (326.7) 1790.0 (457.6) n.s. –
Number linea (Mean (SD) % distance) 10.2 (3.1) 7.0 (1.8) 7.8 (2.0) 6.0 (1.1) <0.001 0.469
Arithmetic accuracyb (Mean (SD) %) 74.7 (18.4) 82.5 (11.7) 92.0 (4.3) 94.4 (6.0) <0.005 0.380
Spatial memory spanc (Mean (SD) total score) 4.7 (0.6) 4.8 (0.7) 4.9 (1.0) 5.2 (0.9) n.s. –
Spatial working memoryd (Mean (SD) total score) 2.2 (0.4) 2.3 (0.5) 2.8 (0.9) 3.1 (0.9) n.s. –
a Number line performance is based on mean percent distance of digits, additions, subtractions, and dots between exact and indicated location on a number line 0–100.b Arithmetic is based on percent correctly solved additions and subtractions of totally 40 arithmetical problems.c Spatial memory span is based on total score of CORSI-Block-Tapping test.d Spatial working memory is based on total score of CORSI-Block-Suppression test.
L. Michels et al. Developmental Cognitive Neuroscience xxx (xxxx) xxx–xxx
6
Fig. 1. Functional connectivity results before (A and C) and after (B and D) number line training for typically developing (TD) children (top row) and children with developmental
dyscalculia (DD) (bottom row). The seed for the background FC analysis was placed bilaterally in the IPS (highlighted by the white dots in all panels). All results are shown at p < 0.001
(uncorrected, t > 3.2).
Fig. 2. Background FC maps before number line training. DD showed hyperconnectivity in frontal, parietal, and visual areas relative to TD. For example, DD showed higher FC in the
bilateral parietal cortex, such as the intraparietal sulcus (IPS). Results for both contrasts (TD > DD and DD > TD) are summarized in Table 3. All results are shown at p < 0.001
(uncorrected, t > 3.2). The seed was placed in the bilateral IPS.
L. Michels et al. Developmental Cognitive Neuroscience xxx (xxxx) xxx–xxx
7
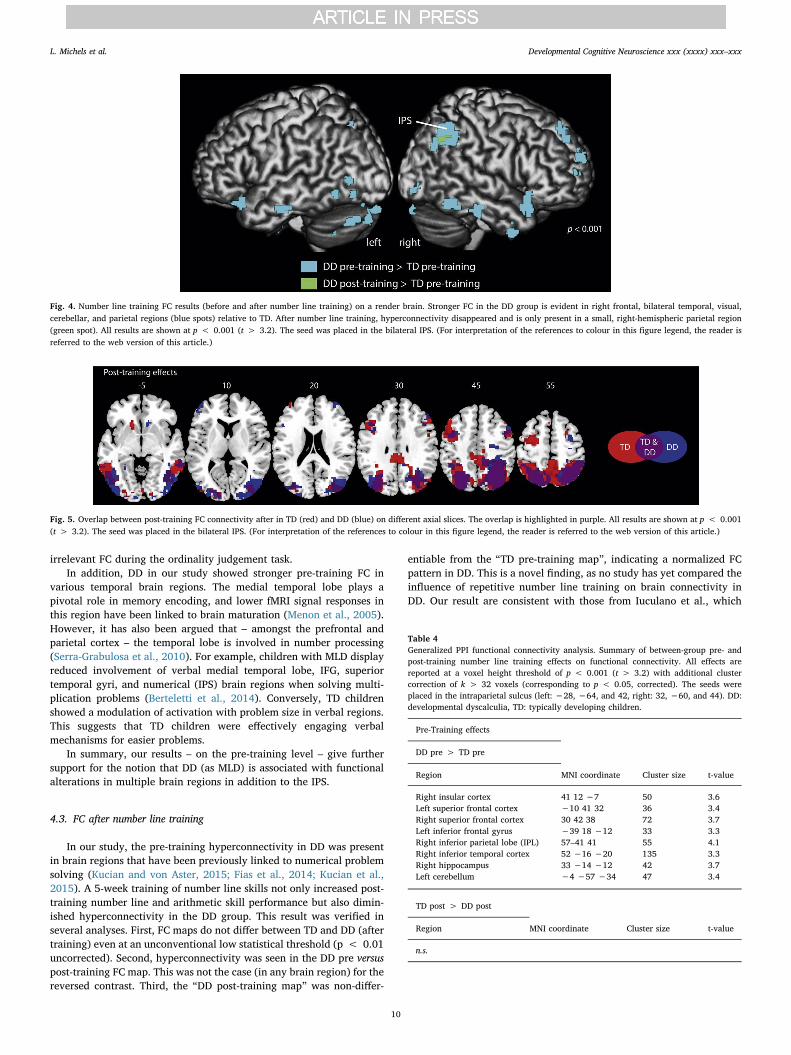
TD, no brain regions survived the statistical threshold (Fig. 3A).
However, completion of number line training in TD induced subtle
increases in FC in the left thalamus, bilateral insular cortex, cerebellum,
and right inferior temporal lobe (Fig. 3B, Table 3B). In contrast, DD
showed stronger FC prior to number line training relative to TD in
several areas such as the insular cortex, superior and inferior frontal
cortex, inferior and parietal and temporal lobe (Fig. 3C, Table 3A).
After number line training, no brain region showed hyperconnectivity
in DD versus TD. Within the DD group, hyperconnectivity was present in
the pre-training condition relative to post-training (Table 3B). A direct
comparison of the two groups indicated that none of the brain regions
showed significantly different FC after number line training.
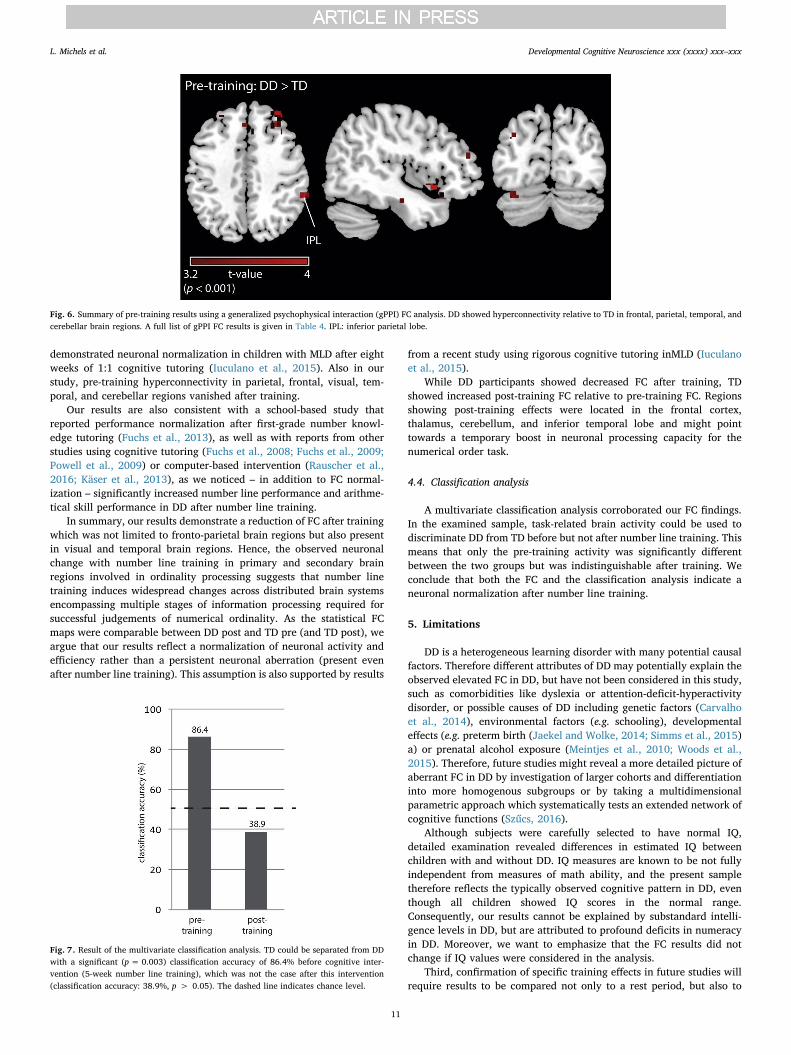
To illustrate the effect of training in DD in more detail, Fig. 4 shows
brain regions with higher FC in DD before and after the training relative
to the TD FC pre-training map on an inflated brain template. Remark-
ably, only a small cluster in the right IPS showed hyperconnectivity in
DD after the training relative to TD pre-training map. After the training,
no significant FC differences were evident between groups, such that
the contrasts TD post > DD post and DD post > TD post showed no
significant differences, at the preselected voxel-threshold of p < 0.001.
The overlap of FC maps for DD and TD after number line training is
shown in Fig. 5. Interestingly, TD and DD share common FC in most of
the correlated brain regions, including frontal and parietal brain areas.
We repeated the analysis using non-parametric testing (see
Methods) for the two main contrasts of interests: TD pre vs. DD pre
(and vice versa) and DD post vs. TD pre. Connectivity maps show no
qualitative differences, i.e. the same regions reveal connectivity differ-
ences for both types of analyses. The only difference was that the size
and number of clusters differ with respect to the type of analysis. For
example, the IPS-related connectivity to the cerebellum involved other
sub-parts of the cerebellum too using non-parametric testing. One
region that showed a difference in functional connectivity (comparing
DD pre and TD pre) comparing parametric and non-parametric testing
was the right inferior temporal cortex (evident during non-parametric
testing).
As seen for the results using parametric tests, comparing DD post vs.
TD pre revealed the lack of any connectivity differences using non-
parametric testing.
3.2.6. gPPI analysis
The gPPI results mostly resembled the background FC results. We
observed main effects for group (F(1,29) = 4.2, p < 0.001) and time
(F(1,29) = 3.5, p < 0.001), and a group x time interaction (F(1,29)
= 3.9, p < 0.001). The main contrast of interest (DD pre > TD pre) is
shown Fig. 6 and summarized in Table 4. In contrast to the background
FC analysis, task related FC before number line training was especially
enhanced in DD in prefrontal rather than in parietal and visual brain
regions. For the contrast DD post – TD post, no significant differences
were seen (results not shown). This was also true – and hence identical
to the background FC analysis – for the contrasts TD post > TD pre
and DD post > DD pre.
3.2.7. Power analysis and multivariate classification analysis
Before running the multivariate classification analysis, we examined
if the sample size was large enough to detect between-group differences
using the available fMRI data. The Bayesian analysis indicated that
before number line training, between-group (i.e. TD > DD) differences
in brain activation could be identified with a confidence interval of 95%
using our sample size. Furthermore, the “classical” power analysis
showed that sample size of even n = 14 (for both TD and DD) was
required to achieve a power of 80% (alpha error of 5%) to detect a
group difference. In our analysis, we used an n = 16 (TD) and n = 15
(DD), respectively, which results in an overall power of 93.9% (alpha
error of 5%). We also extracted the effect sizes of each region reported
in the paper by (Kucian et al., 2011b) separately to check if the power
is> 80% for different clusters. We found that 9 out of 13 regions
Table 3
Background functional connectivity analysis. Summary of within- and between-group
functional connectivity differences before and after number line training. All effects are
reported at a height threshold of p < 0.001 with additional cluster correction of k > 32
voxels (corresponding to p < 0.05, corrected). The seeds were placed in the bilateral
intraparietal sulcus (left: −28, −64, 42, right: 32, −60, 44). DD: developmental
dyscalculia, TD: typically developing children. We did not observe significant differences
in FC for the following contrasts: TD pre>TD post, DD post > DD pre, TD post > DD
post, and DD post > TD post.
Pre-Training effects
TD pre > DD pre
Region MNI coordinate Cluster size t-value
Left putamen −21 12 9 38 3.6
Right paracentral lobe 6–28 80 37 4.2
Left anterior cingulum −2 18 26 36 3.2
Left anterior insula −30 23 12 33 3.2
DD pre > TD pre
Region MNI coordinate Cluster size t-value
Right inferior parietal lobule 48 −50 39 188 4.6
Left inferior parietal lobe −28–51 40 41 3.6
Right precuneus 17 −66 30 61 3.8
Right cuneus 20 −70 18 43 3.4
Right superior frontal gyrus 17 46 48 84 3.5
Right inferior frontal gyrus/insula 43 19 −12/44
16 −9
198 3.3
Left inferior frontal gyrus/insula −37 18 −19 83 3.3
right inferior (anterior) temporal
lobe
40 5 −45 133 3.7
Right inferior temporal lobe 57 −46 −17 96 3.6
Left inferior temporal lobe −57−20−23 50 3.4
Right cerebellum (Crus1) 15 −80 −22 56 3.4
Left cerebellum (Crus 1) −32−79−32 82 3.9
Left cerebellum (Crus 2) −6 −88 −32 378 3.4
Right fusiform gyrus 29 −48 −4 34 3.7
Right fusiform gyrus 30 −77 −1 33 3.9
Left fusiform gyrus −30−75−11 56 3.7
Left parahippocampus −17−21−14 55 3.5
Left inferior occipital gyrus −32 −76 −7 66 3.6
Right lingual gyrus 23 −63 −5 32 3.7
Post-Training effects
TD post > TD pre
Region MNI coordinate Cluster size t-value
Left thalamus −13–26 6 44 3.6
Right inferior temporal lobe 61 −23 −22 83 3.2
Right cerebellum (culmen) 28 −56 −33 33 3.4
Left cerebellum −3 −62 −37 97 3.4
Left insular cortex −43 −17 0 39 4.8
Right inferior frontal gyrus 52 15 4 91 4.7
DD pre > DD post
Region MNI coordinate Cluster size t-value
Left lingual gyrus −16–66 −9 3.6
−10 −71 3 40 3.3
Left cuneus −13 −84 33 33 3.2
Right precuneus 27 −80 39 46 3.9
Left precuneus −19 −80 43 251 3.6
Left precentral gyrus −43 −2 38 42 3.7
DD post-training > TD pre-
training
Region MNI coordinate Cluster size t-value
Right inferior parietal lobe 40–56 40 78 3.2
L. Michels et al. Developmental Cognitive Neuroscience xxx (xxxx) xxx–xxx
8
showed a power of> 80% (mean 91.2%), whereas the mean power
across all 13 regions was 82.5%. This suggests that the selected sample
size was sufficiently large to report the detected group differences for
the connectivity analysis.
The multivariate classification analysis revealed a classification
accuracy to differentiate TD from DD was 86.3% (p= 0.003) before
number line training and 38.3% (p > 0.05, i.e. below chance level)
after training (Fig. 7). This result confirmed the FC results, reflected by
a neuronal normalization after number line training on the task-related
brain activity level.
4. Discussion
Our study provides three central neuroimaging findings: First, we
found increased functional connectivity (using both background and
PPI based FC measures) in frontal, parietal, temporal, and visual brain
regions in children with DD prior to number line training relative to TD
which cannot be explained by group differences in IQ. Second, no
significant hyperconnectivity was evident in DD participants after
training, and FC in DD after training was non-distinguishable from FC
observed in TD (prior to training). Third, classification analysis
revealed a high classification rate before but not after number line
training.
4.1. Behavioural results
The training had positive effects on several behavioral measure-
ments, which are underpinned by obtained effect sizes that can all be
interpreted as large effects according to Cohen (Cohen, 1988). In
particular, children improved significantly on number line performance
and arithmetic. Hence, children were more accurate in the paper and
pencil number line task and solved more addition and subtraction trials
correctly after the training. The goal of the training was to improve the
mental number representation and for instance never trained explicitly
arithmetic skills. Therefore, our results nicely show a transfer effect of
trained number line performance to arithmetical performance.
fMRI task accuracy or reaction time showed no training effects, but
TD solved more trials correctly compared to DD before training,
whereas after training equal numbers of trials were correctly solved
by both groups. Since fMRI task accuracy was not at the ceiling level
before and after training in any of the examined groups, we conclude
that the effects reflect not simply test-retest effects or regression to the
mean but are rather effects of the training intervention.
Regarding spatial working memory span and spatial working
memory, the training did not influence these cognitive skills, which
strengthens the idea that the training improves domain-specific abilities
and not domain-remote cognitive skills, such as working memory.
As expected, DD children performed generally lower compared to
TD (accuracy rate of numerical order fMRI task pre and post training,
paper and pencil number line task pre training, arithmetic, and spatial
working memory). However, as demonstrated, DD children were able to
improve specifically their numerical skills significantly due to inter-
vention and could even catch up to the level of TD children in number
line performance.
These behavioral improvements might be the consequence of a
functional reorganization, e.g. re-balanced FC (see next paragraphs).
4.2. FC before number line training
Using the IPS as seed region, we noted stronger (background and
task-related gPPI) FC in the DD group than in TD. This finding is
consistent with results from two recent studies comparing DD and TD in
a similar age range during a subtraction task (Rosenberg-Lee et al.,
2015) and during rest (Jolles et al., 2016). Similar to the study by
Rosenberg and colleagues we observed hyperconnectivity in DD in
prefrontal and parietal brain regions. These regions have been discussed
as core regions in numerical operations (Menon, 2014), such as
numerical magnitude processing and mental arithmetic. Aberrant
functional responses in these areas have been reported in several
studies in children with DD and MLD (Kucian et al., 2011b; Iuculano
et al., 2015; Supekar et al., 2015). In general, hyperconnectivity (prior
to training) in DD can occur in three ways. First, it can be present as a
spatially unspecific pattern, i.e. increases in connectivity are observable
in both task-relevant (i.e. prefrontal and parietal brain regions) and
task-irrelevant brain regions. Second, it can occur only in non-task
related brain regions. Third, it can be present only in task-relevant
areas. Our data rather support the first notion as we found hypercon-
nectivity in and outside task-relevant areas before training (Fig. 3).
However, after training, FC in task-irrelevant areas disappeared and the
remaining FC overlaps with task-related fMRI signal responses. We
conclude that functional aberrations in DD most probably reflect the
need for greater neuronal resources during numerical ordinality judge-
ment, rather than the inability to activate task relevant areas, as we
observed numerous FC increases outside task-related brain regions.
We observed hyperconnectivity not only in prefrontal and parietal
but also in visual brain regions in DD compared to TD. Background
connectivity captures general task engagement rather than condition-
specific connectivity (Norman-Haignere et al., 2012). Consequently, DD
appears to be involved differently during the time course of task
procedure than TD. Using fMRI, we previously reported different
responses not only in the IPS but also in the fusiform gyrus during a
non-symbolic distance task (Kucian et al., 2011a), similar to that used
in the present study. In addition, a recent study found that hypercon-
nectivity in the fusiform gyrus (and fronto-parietal regions) normalized
after training in children with high math anxiety (Supekar et al., 2015).
Hence, we suggest that number line training minimizes any task-
Fig. 3. Within-group background FC maps for number line training effects. (A) TD post-
vs. TD pre-training revealed connectivity differences (p < 0.001, uncorrected, t > 3.2)
in the insular and inferior frontal cortex as well in the cerebellum (not shown), left
posterior thalamus, and inferior temporal gyrus. (B) DD showed higher FC before than
after training in visual and precentral brain regions.
L. Michels et al. Developmental Cognitive Neuroscience xxx (xxxx) xxx–xxx
9
irrelevant FC during the ordinality judgement task.
In addition, DD in our study showed stronger pre-training FC in
various temporal brain regions. The medial temporal lobe plays a
pivotal role in memory encoding, and lower fMRI signal responses in
this region have been linked to brain maturation (Menon et al., 2005).
However, it has also been argued that – amongst the prefrontal and
parietal cortex – the temporal lobe is involved in number processing
(Serra-Grabulosa et al., 2010). For example, children with MLD display
reduced involvement of verbal medial temporal lobe, IFG, superior
temporal gyri, and numerical (IPS) brain regions when solving multi-
plication problems (Berteletti et al., 2014). Conversely, TD children
showed a modulation of activation with problem size in verbal regions.
This suggests that TD children were effectively engaging verbal
mechanisms for easier problems.
In summary, our results – on the pre-training level – give further
support for the notion that DD (as MLD) is associated with functional
alterations in multiple brain regions in addition to the IPS.
4.3. FC after number line training
In our study, the pre-training hyperconnectivity in DD was present
in brain regions that have been previously linked to numerical problem
solving (Kucian and von Aster, 2015; Fias et al., 2014; Kucian et al.,
2015). A 5-week training of number line skills not only increased post-
training number line and arithmetic skill performance but also dimin-
ished hyperconnectivity in the DD group. This result was verified in
several analyses. First, FC maps do not differ between TD and DD (after
training) even at an unconventional low statistical threshold (p < 0.01
uncorrected). Second, hyperconnectivity was seen in the DD pre versus
post-training FC map. This was not the case (in any brain region) for the
reversed contrast. Third, the “DD post-training map” was non-differ-
entiable from the “TD pre-training map”, indicating a normalized FC
pattern in DD. This is a novel finding, as no study has yet compared the
influence of repetitive number line training on brain connectivity in
DD. Our result are consistent with those from Iuculano et al., which
Fig. 5. Overlap between post-training FC connectivity after in TD (red) and DD (blue) on different axial slices. The overlap is highlighted in purple. All results are shown at p < 0.001
(t > 3.2). The seed was placed in the bilateral IPS. (For interpretation of the references to colour in this figure legend, the reader is referred to the web version of this article.)
Fig. 4. Number line training FC results (before and after number line training) on a render brain. Stronger FC in the DD group is evident in right frontal, bilateral temporal, visual,
cerebellar, and parietal regions (blue spots) relative to TD. After number line training, hyperconnectivity disappeared and is only present in a small, right-hemispheric parietal region
(green spot). All results are shown at p < 0.001 (t > 3.2). The seed was placed in the bilateral IPS. (For interpretation of the references to colour in this figure legend, the reader is
referred to the web version of this article.)
Table 4
Generalized PPI functional connectivity analysis. Summary of between-group pre- and
post-training number line training effects on functional connectivity. All effects are
reported at a voxel height threshold of p < 0.001 (t > 3.2) with additional cluster
correction of k > 32 voxels (corresponding to p < 0.05, corrected). The seeds were
placed in the intraparietal sulcus (left: −28, −64, and 42, right: 32, −60, and 44). DD:
developmental dyscalculia, TD: typically developing children.
Pre-Training effects
DD pre > TD pre
Region MNI coordinate Cluster size t-value
Right insular cortex 41 12 −7 50 3.6
Left superior frontal cortex −10 41 32 36 3.4
Right superior frontal cortex 30 42 38 72 3.7
Left inferior frontal gyrus −39 18 −12 33 3.3
Right inferior parietal lobe (IPL) 57–41 41 55 4.1
Right inferior temporal cortex 52 −16 −20 135 3.3
Right hippocampus 33 −14 −12 42 3.7
Left cerebellum −4 −57 −34 47 3.4
TD post > DD post
Region MNI coordinate Cluster size t-value
n.s.
L. Michels et al. Developmental Cognitive Neuroscience xxx (xxxx) xxx–xxx
10
demonstrated neuronal normalization in children with MLD after eight
weeks of 1:1 cognitive tutoring (Iuculano et al., 2015). Also in our
study, pre-training hyperconnectivity in parietal, frontal, visual, tem-
poral, and cerebellar regions vanished after training.
Our results are also consistent with a school-based study that
reported performance normalization after first-grade number knowl-
edge tutoring (Fuchs et al., 2013), as well as with reports from other
studies using cognitive tutoring (Fuchs et al., 2008; Fuchs et al., 2009;
Powell et al., 2009) or computer-based intervention (Rauscher et al.,
2016; Käser et al., 2013), as we noticed – in addition to FC normal-
ization – significantly increased number line performance and arithme-
tical skill performance in DD after number line training.
In summary, our results demonstrate a reduction of FC after training
which was not limited to fronto-parietal brain regions but also present
in visual and temporal brain regions. Hence, the observed neuronal
change with number line training in primary and secondary brain
regions involved in ordinality processing suggests that number line
training induces widespread changes across distributed brain systems
encompassing multiple stages of information processing required for
successful judgements of numerical ordinality. As the statistical FC
maps were comparable between DD post and TD pre (and TD post), we
argue that our results reflect a normalization of neuronal activity and
efficiency rather than a persistent neuronal aberration (present even
after number line training). This assumption is also supported by results
from a recent study using rigorous cognitive tutoring inMLD (Iuculano
et al., 2015).
While DD participants showed decreased FC after training, TD
showed increased post-training FC relative to pre-training FC. Regions
showing post-training effects were located in the frontal cortex,
thalamus, cerebellum, and inferior temporal lobe and might point
towards a temporary boost in neuronal processing capacity for the
numerical order task.
4.4. Classification analysis
A multivariate classification analysis corroborated our FC findings.
In the examined sample, task-related brain activity could be used to
discriminate DD from TD before but not after number line training. This
means that only the pre-training activity was significantly different
between the two groups but was indistinguishable after training. We
conclude that both the FC and the classification analysis indicate a
neuronal normalization after number line training.
5. Limitations
DD is a heterogeneous learning disorder with many potential causal
factors. Therefore different attributes of DD may potentially explain the
observed elevated FC in DD, but have not been considered in this study,
such as comorbidities like dyslexia or attention-deficit-hyperactivity
disorder, or possible causes of DD including genetic factors (Carvalho
et al., 2014), environmental factors (e.g. schooling), developmental
effects (e.g. preterm birth (Jaekel and Wolke, 2014; Simms et al., 2015)
a) or prenatal alcohol exposure (Meintjes et al., 2010; Woods et al.,
2015). Therefore, future studies might reveal a more detailed picture of
aberrant FC in DD by investigation of larger cohorts and differentiation
into more homogenous subgroups or by taking a multidimensional
parametric approach which systematically tests an extended network of
cognitive functions (Szűcs, 2016).
Although subjects were carefully selected to have normal IQ,
detailed examination revealed differences in estimated IQ between
children with and without DD. IQ measures are known to be not fully
independent from measures of math ability, and the present sample
therefore reflects the typically observed cognitive pattern in DD, even
though all children showed IQ scores in the normal range.
Consequently, our results cannot be explained by substandard intelli-
gence levels in DD, but are attributed to profound deficits in numeracy
in DD. Moreover, we want to emphasize that the FC results did not
change if IQ values were considered in the analysis.
Third, confirmation of specific training effects in future studies will
require results to be compared not only to a rest period, but also to
Fig. 7. Result of the multivariate classification analysis. TD could be separated from DD
with a significant (p= 0.003) classification accuracy of 86.4% before cognitive inter-
vention (5-week number line training), which was not the case after this intervention
(classification accuracy: 38.9%, p > 0.05). The dashed line indicates chance level.
Fig. 6. Summary of pre-training results using a generalized psychophysical interaction (gPPI) FC analysis. DD showed hyperconnectivity relative to TD in frontal, parietal, temporal, and
cerebellar brain regions. A full list of gPPI FC results is given in Table 4. IPL: inferior parietal lobe.
L. Michels et al. Developmental Cognitive Neuroscience xxx (xxxx) xxx–xxx
11
another intervention. Yet, both groups completed the training success-
fully and did not differ in the number of training days. Furthermore, as
the present number line training had specific positive effects on the
numerical domain (number line performance and arithmetic), but
showed no influence on general cognitive skills like spatial memory
span and working memory, we conclude that the completed training
specifically induced behavioural improvements in number processing
and calculation and reduced hyperconnectivity in DD children. We
would argue that the change in FC in DD after training is unlikely to be
driven by strategies acquired during training but is rather the result of
neuroplastic adaptations, as we (1) did not observe a ‘task x group’
interaction, and (2) because the FC pattern in DD was not separable
after training relative to TD (Fig. 5). If TD and DD subjects used
differing strategies to solve the task, we would expect that one or more
brain regions would have shown a post-training group effect.
6. Conclusion
Our study highlights that children with developmental dyscalculia
not only profit from a 5 week number line training with respect to
numerical skills but additionally show training induced functional brain
plasticity which leads to a reduction in aberrant functional hypercon-
nectivity relative to that seen in typically developing children.
Compliance with Ethical Standards
Funding
We would like to thank the University Children's Hospital Zurich
and the Clinic of Neuroradiology from the University Hospital Zurich
for financial support. These institutions had no role in study design,
data collection and analysis, decision to publish, or preparation of the
manuscript.
Ethical approval
All procedures performed in studies involving human participants
were in accordance with the ethical standards of the institutional and/
or national research committee and with the 1964 Helsinki declaration
and its later amendments or comparable ethical standards.
Conflict of interest
The authors have no (financial, personal, or any other) conflict of
interest.
Acknowledgment
We thank all children and parents for their participation in this
study.
References
Cohn, R., 1968. Developmental dyscalculia. Pediatr. Clin. North Am. 15 (3), 651–668.
Badian, N.A., 1999. Persistent arithmetic, reading, or arithmetic and reading disability.
Ann. Dyslexia. 49, 45–70.
Gross-Tsur, V., Manor, O., Shalev, R.S., 1996. Developmental dyscalculia: prevalence and
demographic features. Dev. Med. Child Neurol. 38 (1), 25–33.
Kosc, L., 1974. Developmental dyscalculia. J. Learn. Disabil. 7 (3), 164–177.
Fischbach, A., et al., 2013. Prävalenz von Lernschwächen und Lernstörungen: Zur
Bedeutung der Diagnosekriterien. Lernen und Lernstörungen 2 (2), 65–76.
Butterworth, B., Varma, S., Laurillard, D., 2011. Dyscalculia: from brain to education.
Science 332 (6033), 1049–1053.
Geary, D.C., 1993. Mathematical disabilities: cognitive, neuropsychological, and genetic
components. Psychol. Bull. 114 (2), 345–362.
Jordan, N.C., Hanich, L.B., Kaplan, D., 2003. A longitudinal study of mathematical
competencies in children with specific mathematics difficulties versus children with
comorbid mathematics and reading difficulties. Child Dev. 74 (3), 834–850.
Rousselle, L., Noël, M.P., 2007. Basic numerical skills in children with mathematics
learning disabilities: a comparison of symbolic vs non-symbolic number magnitude
processing. Cognition 102 (3), 361–395.
Mazzocco, M.M., Feigenson, L., Halberda, J., 2011. Impaired acuity of the approximate
number system underlies mathematical learning disability (dyscalculia). Child Dev.
82 (4), 1224–1237.
Geary, D.C., et al., 2004. Strategy choices in simple and complex addition: contributions
of working memory and counting knowledge for children with mathematical
disability. J. Exp. Child Psychol. 88 (2), 121–151.
Rotzer, S., et al., 2008. Optimized voxel-based morphometry in children with
developmental dyscalculia. Neuroimage 39 (1), 417–422.
Rykhlevskaia, E., et al., 2009. Neuroanatomical correlates of developmental dyscalculia:
combined evidence from morphometry and tractography. Front. Hum. Neurosci.
3, 51.
Ashkenazi, S., et al., 2012. Weak task-related modulation and stimulus representations
during arithmetic problem solving in children with developmental dyscalculia. Dev.
Cogn. Neurosci. 2 (Suppl 1), S152–S166.
Kucian, K., et al., 2006a. Impaired neural networks for approximate calculation in
dyscalculic children: a functional MRI study. Behav. Brain Funct. 2, 31.
Berteletti, I., Prado, J., Booth, J.R., 2014. Children with mathematical learning disability
fail in recruiting verbal and numerical brain regions when solving simple
multiplication problems. Cortex 57, 143–155.
Morocz, I.A., et al., 2012. Time-resolved and spatio-temporal analysis of complex
cognitive processes and their role in disorders like developmental dyscalculia. Int. J.
Imaging Syst. Technol. 22 (1), 81–96.
Molko, N., et al., 2003. Functional and structural alterations of the intraparietal sulcus in
a developmental dyscalculia of genetic origin. Neuron 40 (4), 847–858.
Kucian, K., et al., 2011a. Non-symbolic numerical distance effect in children with and
without developmental dyscalculia: a parametric fMRI study. Dev. Neuropsychol. 36
(6), 741–762.
Mussolin, C., et al., 2010a. Neural correlates of symbolic number comparison in
developmental dyscalculia. J. Cogn. Neurosci. 22 (5), 860–874.
Kucian, K., et al., 2011b. Mental number line training in children with developmental
dyscalculia. Neuroimage 57 (3), 782–795.
Dinkel, P.J., et al., 2013. Diagnosing developmental dyscalculia on the basis of reliable
single case FMRI methods: promises and limitations. PLoS One 8 (12), e83722.
Kaufmann, L., et al., 2009a. Developmental dyscalculia: compensatory mechanisms in left
intraparietal regions in response to nonsymbolic magnitudes. Behav. Brain Funct.
5, 35.
Kaufmann, L., et al., 2011. Meta-analyses of developmental fMRI studies investigating
typical and atypical trajectories of number processing and calculation. Dev.
Neuropsychol. 36 (6), 763–787.
Price, G.R., et al., 2007. Impaired parietal magnitude processing in developmental
dyscalculia. Curr. Biol. 17 (24), R1042–3.
Mussolin, C., Mejias, S., Noel, M.P., 2010b. Symbolic and nonsymbolic number
comparison in children with and without dyscalculia. Cognition 115 (1), 10–25.
Rotzer, S., et al., 2009. Dysfunctional neural network of spatial working memory
contributes to developmental dyscalculia. Neuropsychologia 47 (13), 2859–2865.
Kucian, K., 2016. Developmental Dyscalculia and the Brain. In: Berch, D.B., Geary, D.,
Mann Koepke, K. (Eds.), Development of Mathematical Cognition: Neural Substrates
and Genetic Influences. Elsevier, Amsterdam, pp. 165–193.
Kucian, K., von Aster, M., 2015. Developmental dyscalculia. Eur. J. Pediatr. 174 (1),
1–13.
Pinel, P., et al., 2001. Modulation of parietal activation by semantic distance in a number
comparison task. Neuroimage 14 (5), 1013–1026.
Le Clec, H.G., et al., 2000. Distinct cortical areas for names of numbers and body parts
independent of language and input modality. Neuroimage 12 (4), 381–391.
Rickard, T.C., et al., 2000. The calculating brain: an fMRI study. Neuropsychologia 38 (3),
325–335.
Dumontheil, I., Klingberg, T., 2012. Brain activity during a visuospatial working memory
task predicts arithmetical performance 2 years later. Cereb Cortex 22 (5), 1078–1085.
Iuculano, T., et al., 2015. Cognitive tutoring induces widespread neuroplasticity and
remediates brain function in children with mathematical learning disabilities. Nat.
Commun. 6, 8453.
Rosenberg-Lee, M., Barth, M., Menon, V., 2011. What difference does a year of schooling
make? Maturation of brain response and connectivity between 2nd and 3rd grades
during arithmetic problem solving. Neuroimage 57 (3), 796–808.
Kucian, K., et al., 2013a. Developmental dyscalculia: a dysconnection syndrome? Brain
Struct. Funct. 219 (5), 1721–1733.
Rosenberg-Lee, M., et al., 2015. Brain hyper-connectivity and operation-specific deficits
during arithmetic problem solving in children with developmental dyscalculia. Dev.
Sci. 18 (3), 351–372.
Jolles, D., et al., 2016. Parietal hyper-connectivity, aberrant brain organization, and
circuit-based biomarkers in children with mathematical disabilities. Dev. Sci. 19 (4),
613–631.
Dehaene, S., et al., 2003. Three parietal circuits for number processing. Cogn.
Neuropsychol. 20 (3), 487–506.
Campbell, J.I., Xue, Q., 2001. Cognitive arithmetic across cultures. J Exp Psychol Gen 130
(2), 299–315.
Emerson, R.W., Cantlon, J.F., 2012. Early math achievement and functional connectivity
in the fronto-parietal network. Dev Cogn Neurosci 2 (Suppl 1), S139–S151.
Kucian, K., et al., 2013b. Operational momentum effect in children with and without
developmental dyscalculia. Front. Psychol. 4, 847.
Davis, N., et al., 2009. Aberrant functional activation in school age children at-risk for
mathematical disability: a functional imaging study of simple arithmetic skill.
Neuropsychologia 47 (12), 2470–2479.
Supekar, K., et al., 2015. Remediation of childhood math anxiety and associated neural
L. Michels et al. Developmental Cognitive Neuroscience xxx (xxxx) xxx–xxx
12
circuits through cognitive tutoring. J. Neurosci. 35 (36), 12574–12583.
Fair, D.A., et al., 2007. A method for using blocked and event-related fMRI data to study
resting state functional connectivity. Neuroimage 35 (1), 396–405.
Ghisleni, C., et al., 2015. Subcortical glutamate mediates the reduction of short-range
functional connectivity with age in a developmental cohort. J. Neurosci. 35 (22),
8433–8441.
Norman-Haignere, S.V., et al., 2012. Category-selective background connectivity in
ventral visual cortex. Cereb Cortex 22 (2), 391–402.
Fontanini, A., Katz, D.B., 2008. Behavioral states, network states, and sensory response
variability. J. Neurophysiol. 100 (3), 1160–1168.
Sadaghiani, S., et al., 2010a. The relation of ongoing brain activity, evoked neural
responses, and cognition. Front. Syst. Neurosci. 4, 20.
Sadaghiani, S., et al., 2010b. Intrinsic connectivity networks, alpha oscillations, and tonic
alertness: a simultaneous electroencephalography/functional magnetic resonance
imaging study. J. Neurosci. 30 (30), 10243–10250.
Friston, K.J., et al., 1997. Psychophysiological and modulatory interactions in
neuroimaging. Neuroimage 6 (3), 218–229.
Kaufmann, L., et al., 2009b. Developmental dyscalculia: compensatory mechanisms in left
intraparietal regions in response to nonsymbolic magnitudes. Behav. Brain Funct. 5.
Association, A.P., 2013. Diagnostic and Statistical Manual of Mental Disorders, 5th ed.
American Psychiatric Publishing, Arlington, VA.
Kucian, K., et al., 2006b. Impaired neural networks for approximate calculation in
dyscalculic children: a functional MRI study. Behav. Brain Funct. 2, 31.
Wechsler, D., 1992. Wechsler Intelligence Scale for Children, 3rd ed. The Psychological
Corporation, London.
Schellig, D., 1997. Block-tapping-test. In: Zeitlinger, S.a. (Ed.), Lisse.
Beblo, T., et al., 2004. A new approach in clinical neuropsychology to the assessment of
spatial working memory: the block suppression test. J. Clin. Exp. Neuropsychol. 26
(1), 105–114.
Oldfield, R.C., 1971. The assessment and analysis of handedness: the Edinburgh
inventory. Neuropsychologia 9 (1), 97–113.
Gevers, W., Reynvoet, B., Fias, W., 2003. The mental representation of ordinal sequences
is spatially organized. Cognition 87 (3), B87–95.
Rubinsten, O., Sury, D., 2011. Processing ordinality and quantity: the case of
developmental dyscalculia. PLoS One 6 (9), e24079.
Goffin, C., Ansari, D., 2016. Beyond magnitude: judging ordinality of symbolic number is
unrelated to magnitude comparison and independently relates to individual
differences in arithmetic. Cognition 150, 68–76.
Cohen, J., 1988. Statistical Power Analysis for the Behavioral Sciences, 2 ed. Lawrence
Erlbaum., Hillsdale, NJ.
Whitfield-Gabrieli, S., Nieto-Castanon, A., 2012. Conn: a functional connectivity toolbox
for correlated and anticorrelated brain networks. Brain Connect. 2 (3), 125–141.
Biswal, B., et al., 1995. Functional connectivity in the motor cortex of resting human
brain using echo-planar MRI. Magn. Reson. Med. 34 (4), 537–541.
Villalobos, M.E., et al., 2005. Reduced functional connectivity between V1 and inferior
frontal cortex associated with visuomotor performance in autism. Neuroimage 25 (3),
916–925.
Behzadi, Y., et al., 2007. A component based noise correction method (CompCor) for
BOLD and perfusion based fMRI. Neuroimage 37 (1), 90–101.
Murphy, K., et al., 2009. The impact of global signal regression on resting state
correlations: are anti-correlated networks introduced? Neuroimage 44 (3), 893–905.
Brett, M., et al., 2002. Region of Interest Analysis Using an SPM Toolbox in Presented at
the 8th International Conference on Functional Mapping of the Human Brain. In:
A.o.C.-R.i NeuroImage (Ed.), Sendai, Japan.
Eklund, A., et al., 2012. Does parametric fMRI analysis with SPM yield valid results? An
empirical study of 1484 rest datasets. Neuroimage 61 (3), 565–578.
McLaren, D.G., et al., 2012. A generalized form of context-dependent psychophysiological
interactions (gPPI): a comparison to standard approaches. Neuroimage 61 (4),
1277–1286.
Cisler, J.M., Bush, K., Steele, J.S., 2014. A comparison of statistical methods for detecting
context-modulated functional connectivity in fMRI. Neuroimage 84, 1042–1052.
Schrouff, J., et al., 2013. PRoNTo: pattern recognition for neuroimaging toolbox.
Neuroinformatics 11 (3), 319–337.
Kruschke, J.K., 2013. Bayesian estimation supersedes the t-test. J. Exp. Psychol. Gen. 142
(2), 573–603.
Menon, V., 2014. Arithmetic in the Child and Adult Brain. In: Oxford (Ed.), Oxford UP.
Menon, V., Boyett-Anderson, J.M., Reiss, A.L., 2005. Maturation of medial temporal lobe
response and connectivity during memory encoding. Brain Res. Cogn. Brain Res. 25
(1), 379–385.
Serra-Grabulosa, J.M., et al., 2010. Neural bases of numerical processing and calculation.
Rev. Neurol. 50 (1), 39–46.
Fias, W., Menon, V., Szucs, D., 2014. Multiple components of developmental dyscalculia.
Trend Neurosci. Educ. 2, 43–47.
Kucian, K., Kaufmann, L., Von Aster, M., 2015. Development of the numerical brain. In:
Kadosh, R.C., Dowker, A. (Eds.), The Oxford Handbook of Numerical Cognition.
Oxford Univ. Press.
Fuchs, L.S., et al., 2013. Effects of first-grade number knowledge tutoring with contrasting
forms of practice. J. Educ. Psychol. 105 (1), 58–77.
Fuchs, L.S., et al., 2008. Remediating computational deficits at third grade: a randomized
field trial. J. Res. Educ. Eff. 1 (1), 2–32.
Fuchs, L.S., et al., 2009. Remediating number combination and word problem deficits
among students with mathematics difficulties: a randomized control trial. J. Educ.
Psychol. 101 (3), 561–576.
Powell, S.R., et al., 2009. Effects of fact retrieval tutoring on third-grade students with
math difficulties with and without reading difficulties. Learn. Disabil. Res. Pract. 24
(1), 1–11.
Rauscher, L., et al., 2016. Evaluation of a computer-based training program for enhancing
arithmetic skills and spatial number representation in primary school children. Front.
Psychol. 7.
Käser, T., et al., 2013. Design and evaluation of the computer-based training program
Calcularis for enhancing numerical cognition. Front. Dev. Psychol. 4, 1–13.
Carvalho, M.R., et al., 2014. Are 22q11.2 distal deletions associated with math
difficulties? Am. J. Med. Genet. A 164A (9), 2256–2262.
Jaekel, J., Wolke, D., 2014. Preterm birth and dyscalculia. J. Pediatr. 164 (6), 1327–1332.
Simms, V., et al., 2015. Nature and origins of mathematics difficulties in very preterm
children: a different etiology than developmental dyscalculia. Pediatr. Res. 77 (2),
389–395.
Meintjes, E.M., et al., 2010. An fMRI study of number processing in children with fetal
alcohol syndrome. Alcoholism-Clin. Exp. Res. 34 (8), 1450–1464.
Woods, K.J., et al., 2015. Parietal dysfunction during number processing in children with
fetal alcohol spectrum disorders. Neuroimage Clin. 8, 594–605.
Szűcs, D., 2016. Chapter 11 − Subtypes and comorbidity in mathematical learning
disabilities: multidimensional study of verbal and visual memory processes is key to
understanding. In: Marinella, C., Wim, F. (Eds.), Progress in Brain Research. Elsevier.,
pp. 277–304.
L. Michels et al. Developmental Cognitive Neuroscience xxx (xxxx) xxx–xxx
13