Embed Size (px)
Citation preview

1
Functional Expression of Sodium-Dependent Glucose Transporter in Amelogenesis
H. Ida-Yonemochi, K. Otsu, H. Harada, and H. Ohshima
Appendix
Appendix Materials and Methods
Immunohistochemistry
Immunohistochemistry was performed using the Envision+/HRP system (Dako, Glostrup,
Denmark). The primary antibodies used in this study are anti-SGLT1, SGLT2, GLUT2,
Na+-K+-ATPase, enamelin, Ki67 and HIF-1 as listed in Appendix Table 1. When needed,
antigens were exposed by autoclaving the samples in citric acid buffer (pH 6.0) at 121°C for 5
minutes, followed by treatment with 0.3% hydrogen peroxide in methanol for 30 minutes at
room temperature to block endogenous peroxidase activity. To visualize the reaction products,
sections were treated with 0.02% 3,3’-diaminobenzidine (Dohjin Laboratories, Kumamoto,
Japan) in 0.05 M Tris-HCl buffer (pH 7.4) containing 0.005% hydrogen peroxide and were
counterstained with hematoxylin. For control experiments, primary antibodies were replaced
with pre-immune rabbit serum or mouse immunoglobulin Gs (IgGs). For immunofluorescent
staining, paraffin sections were treated with anti-SGLT1, SGLT2, Na+-K+-ATPase, GLUT2 and
HIF-1, and incubated with FITC-conjugated anti-rabbit IgG (diluted to 1:500; Vector
Laboratories, Burlingame, CA, USA) or Texas Red-conjugated anti-mouse IgG + IgM (diluted to
1:500; Rockland, Gilbertsville, PA, USA). For immunofluorescent staining, stained sections were
analyzed with a confocal laser scanning microscope (FV300, Olympus, Tokyo, Japan). After
image acquisition, contrast and brightness were adjusted using Photoshop CS4 (Adobe Systems,
Inc., San Jose, CA, USA).

2
For immunohistochemistry with anti-SGLT1 and anti-SGLT2 antibody at the
electron-microscopic level, the immunostaining procedure was the same as described above,
except for the inhibition of endogenous peroxidase. The immunostained sections were
subsequently postfixed in 1% osmium tetroxide reduced with 1.5% potassium ferrocyanide,
dehydrated in an ascending series of ethanol, and finally embedded in Epon 812 (Taab, Berkshire,
UK). Ultrathin sections (70 nm thick) were double-stained with uranyl acetate and lead citrate
and examined with an H-7650 transmission electron microscope (Hitachi High-Technologies
Corp., Tokyo, Japan).
Mouse incisor and molar organ cultures
Incisors were dissected from the lower jaws of ICR mice (CLEA Japan) on postnatal day 1 and
were put onto membrane filters (0.1 μm pore size, OMNIPORETM, Millipore, Bedford, MA,
USA) in a Trowell system and cultured for 4 days at 37°C in Dulbecco’s Modified Eagle’s
Medium (DMEM; Gibco BRL, Grand Island, NY, USA) with 10% fetal bovine serum, 100
μg/ml ascorbic acid (Seikagaku Kogyo, Tokyo, Japan) and 100 U/ml penicillin-streptomycin
(Gibco BRL). For molar organ culture, mandibular molar buds were dissected from ICR
embryonic mice at E13.5 and were grown for 10 days at 37°C in a Trowell system as described
above. After cultivation +/− exogenous reagents, the explants were fixed in 4% PFA and were
embedded into paraffin. For histological analysis, we made serial paraffin sections of whole
explants in the mesial-distal direction and compared them with the sections, including most
differentiated ameloblasts.
For the cell proliferation assay using Ki67 immunoreactivity, we selected dental
epithelial tissue areas of 0.013 mm2 from apical bud lesion, and the number of Ki67-positive
cells was normalized to total cells of the areas.

3
Cells and cell culture
A mouse dental epithelial cell line, mHAT-9a was maintained in DMEM/Ham’s F12 medium
(Invitrogen, Carlsbad, CA, USA) containing B-27 supplement (Invitrogen) with 20 ng/ml EGF
(R&D Systems, Minneapolis, MN, USA), 25 ng/ml FGF2 (R&D Systems) and 1%
penicillin-streptomycin (Gibco BRL). In some experiments, exogenous reagents were added into
the culture medium when the cells reached 80% confluence, and the cultures were incubated for
2 or 3 days.
Cell proliferation assay
For the quantitation of the viable cell number, mHAT-9a cells were plated in 96-well plates at a
density of 5 x 10³ cells/well and were incubated with 500 µM phloridzin or 50 µM ouabain for
24 hrs. Then, 10 l of the Cell Counting Kit-8 (CCK-8, Dohjin Laboratories, Kumamoto, Japan)
was added to each well, and the plate was incubated for 4 hrs. The absorbance value was
measured by a GloMax system (Promega Corp., Wisconsin, USA) at a wavelength of 450 nm.
Small interfering RNA experiment
Small interfering RNA (siRNA) transfection to mHAT-9a cells was performed using
Lipofectamine TM RNAiMAX (Invitrogen). Control siRNA and Sglt2 siRNA were purchased
from Santa Cruz Biotech Inc. (sc-37007, sc-61540; CA, USA). Each siRNA (10 nM) was applied
to the cells and cultured for 48 hrs.
Quantitative real-time PCR analysis
cDNA was synthesized using the Prime Script 1st strand cDNA Synthesis Kit (Takara, Otsu,
Japan). Amplification condition of real-time PCR was as follows: 30 s at 95°C; 50 cycles of
95°C for 5 s and 60°C for 30 s; dissociation for 15 s at 95°C; and 30 s at 60°C.

4
Western immunoblotting
mHAT-9a cells were lysed in RIPA buffer [50 mM Tris pH 7.5, 150 mM NaCl, 1 mM EDTA, 1%
Triton X-100, and 1% phosphatase inhibitor cocktail (Nacalai Tesque, Kyoto, Japan)]. Cell
lysates were separated by sodium dodecyl sulfate-polyacrylamide gel electrophoresis
(SDS-PAGE) and then electrophoretically transferred to PVDF membranes (Bio-Rad, MA, USA).
For immunodetection, the following antibodies were used: anti--tubulin (Proteintech, IL, USA),
anti-SGLT1, anti-SGLT2 and anti-HIF-1. The Envision+/HRP system (Dako) was used and
antigens were detected using Western BLoT Quant HRP Substrate (Takara). Signals were acquired
using the ImageQuant LAS 4000mini system (GE Healthcare, Chicago, USA).

5
Appendix Table 1. List of antibodies for immunohistochemistry (IHC),
immunocytochemistry (ICC) and western blotting (WB).
Primary antibody
Name Type Resource Dilution for
IHC/ICC
Dilution for
WB
SGLT1 Rabbit polyclonal Abcam, ab14686 1:100 1:500
SGLT2 Rabbit polyclonal Abcam, ab85626 1:200 1:1000
GLUT2 Rabbit polyclonal Santa Cruz, sc-9117 1:200
Na+-K+-ATPase 1 Mouse monoclonal Abcam, ab7671 1:400
Enamelin Rabbit polyclonal Uchida et al., 1991. 1:1000
Ki67 Rat monoclonal Dako, M77249 1:100
HIF-1 Rabbit polyclonal Novus, NB100-479 1:100 1:1000
-tubulin Mouse monoclonal Proteintech, 66031-1 1:2000
Reference: Enamelin (Uchida T, Tanabe T, Fukae M, Shimizu M, Yamada M, Miake K, Kobayashi S.
1991. Immunochemical and immunohistochemical studies, using antisera against porcine 25 kDa
amelogenin, 89 kDa enamelin and the 13-17 kDa nonamelogenins, on immature enamel of the pig and rat.
Histochem. 96:129-138.)
6
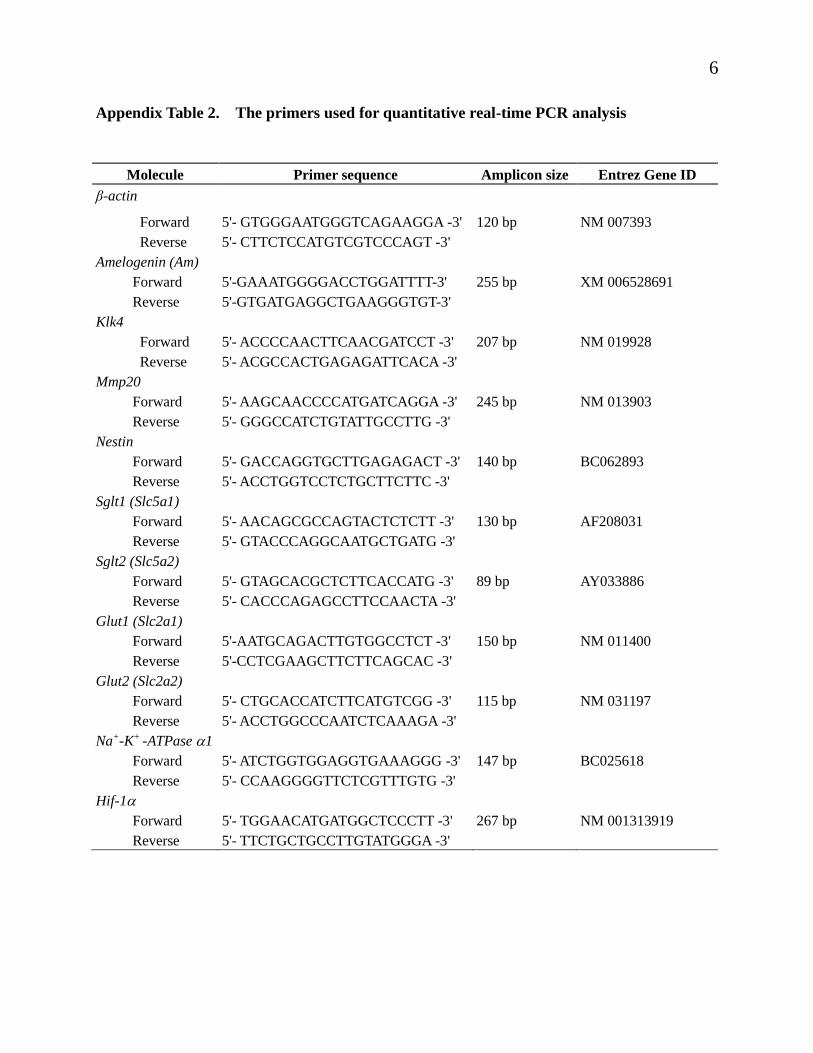
Appendix Table 2. The primers used for quantitative real-time PCR analysis
Molecule Primer sequence Amplicon size Entrez Gene ID
β-actin
Forward 5'- GTGGGAATGGGTCAGAAGGA -3' 120 bp NM 007393
Reverse 5'- CTTCTCCATGTCGTCCCAGT -3'
Amelogenin (Am)
Forward 5'-GAAATGGGGACCTGGATTTT-3' 255 bp XM 006528691
Reverse 5'-GTGATGAGGCTGAAGGGTGT-3'
Klk4
Forward 5'- ACCCCAACTTCAACGATCCT -3' 207 bp NM 019928
Reverse 5'- ACGCCACTGAGAGATTCACA -3'
Mmp20
Forward 5'- AAGCAACCCCATGATCAGGA -3' 245 bp NM 013903
Reverse 5'- GGGCCATCTGTATTGCCTTG -3'
Nestin
Forward 5'- GACCAGGTGCTTGAGAGACT -3' 140 bp BC062893
Reverse 5'- ACCTGGTCCTCTGCTTCTTC -3'
Sglt1 (Slc5a1)
Forward 5'- AACAGCGCCAGTACTCTCTT -3' 130 bp AF208031
Reverse 5'- GTACCCAGGCAATGCTGATG -3'
Sglt2 (Slc5a2)
Forward 5'- GTAGCACGCTCTTCACCATG -3' 89 bp AY033886
Reverse 5'- CACCCAGAGCCTTCCAACTA -3'
Glut1 (Slc2a1)
Forward 5'-AATGCAGACTTGTGGCCTCT -3' 150 bp NM 011400
Reverse 5'-CCTCGAAGCTTCTTCAGCAC -3'
Glut2 (Slc2a2)
Forward 5'- CTGCACCATCTTCATGTCGG -3' 115 bp NM 031197
Reverse 5'- ACCTGGCCCAATCTCAAAGA -3'
Na+-K+ -ATPase 1
Forward 5'- ATCTGGTGGAGGTGAAAGGG -3' 147 bp BC025618
Reverse 5'- CCAAGGGGTTCTCGTTTGTG -3'
Hif-1
Forward 5'- TGGAACATGATGGCTCCCTT -3' 267 bp NM 001313919
Reverse 5'- TTCTGCTGCCTTGTATGGGA -3'

7
Appendix Figure 1. Whole image of the expression of SGLT1, SGLT2, and Na+-K+-ATPase in the
maxillary incisor at 3 weeks.

8
(A) Whole image of the maxillary incisor at 3 weeks shown in Figure 1A. (B, C) Double
immunofluorescent staining for SGLT1/Na+-K+-ATPase and SGLT2/Na+-K+-ATPase in the ameloblasts at
the secretory (B) and maturation (C) stages shown in Figure 1B. SGLT1 and SGLT2 are visualized with
FITC (green), and Na+-K+-ATPase is stained with Texas Red (red). Single and merged images. am,
ameloblast; si, stratum intermedium; pl, papillary layer. Bars, 500 μm (A), 25 μm (B, C).

9
Appendix Figure 2. The expression of SGLT1, SGLT2, and Na+-K+-ATPase in the maxillary molar
tooth germ.
SGLT2 starts to localize in the enamel organ cells from cap stage molar germs (E, H) and is strongly
immunopositive in the ameloblasts at the secretory and maturation stage, enamel organ cells (K, N), and

10
odontoblasts (K). SGLT1 is not observed in the molar tooth germs at embryonic stage (A, D, G).
Na+-K+-ATPase is strongly immunolocalized in the stratum intermedium of secretory and maturation
stages similar to that of maxillary incisor at the postnatal stage (L, O). eo, enamel organ; am, ameloblast;
si, stratum intermedium; dp; dental papilla/pulp. Bars, 50 μm (A, D, G); 100 μm (J, M).

11
Appendix Figure 3. Organ culture of mandibular incisor tooth germ with SGLT1/2 inhibitor,
phloridzin and sotagliflozin.
Macroscopic view of the explants of P1 mandibular incisors after 4 days of culture and HE stained
sections. The histological features of the phloridzin-treated explants are similar among the concentration
of 50 to 500 µM. Cell death is not observed in the 500 µM phloridzin-treated explant. In contrast, the

12
dental epithelial cells in the sotagliflozin-treated explants are about to die at the concentration of 50 µM.
Therefore, we used 500 µM phloridzin for in vitro culture experiments in the present study. de, dental
epithelium; dp, dental pulp. Bars, 50 μm.

13
Appendix Figure 4. Growth of molar tooth germ is disturbed by SGLT1/2 inhibitor.
Macroscopic view of the explants of E13.5 mandibular molars after 10 days of culture (A, D). HE
staining (B, D). Real-time PCR analysis of molar explants (C, E). Treatment with SGLT1/2 inhibitors,
phloridzin (500 µM, A-C) and sotagliflozin (10 µM, D, E). The control explants show the differentiation
of preameloblasts and preodontoblasts. In contrast, the phloridzin-treated explants show disturbance of

14
their differentiation (A, B). The cusp shape of explants becomes rounded in the phloridzin-treated molars
(B). mRNA expression of ameloblast-differentiation markers tends to reduce in the phloridzin- and
ouabain-treated molars (C). Sotagliflozin-treated molars show similar morphological changes with
phloridzin-treated molars (D, E). iee, inner enamel epithelium; pa, preameloblast; po, preodontoblast; dp;
dental papilla. Bars, 100 μm (B, upper, D); 50 m (B, lower). C: n = 5, 1-way ANOVA analysis. E: n = 4,
Student’s t-test.

15
Appendix Figure 5. The effects of extracellular glucose concentration on the expression of Sglt1 and
Sglt2 in ameloblast-lineage cells in vitro.
Real-time PCR analysis of ameloblast-lineage cells in low- and high-glucose condition. The mRNA
expressions of Sglt1, Sglt2, Na+-K+-ATPase and Glut1 were not significantly changed by glucose-free and
high-glucose conditions. n = 5, 1-way ANOVA analysis.