Embed Size (px)
Citation preview
FULL YEAR 2020
Vestas Wind Systems A/SCopenhagen, 10 February 2021
Classification: PublicFull year 20202
DISCLAIMER AND CAUTIONARY STATEMENT
This document contains forward-looking statements concerning Vestas’ financial condition, results of operations and business. All statements otherthan statements of historical fact are, or may be deemed to be, forward-looking statements. Forward-looking statements are statements of futureexpectations that are based on management’s current expectations and assumptions and involve known and unknown risks and uncertainties thatcould cause actual results, performance, or events to differ materially from those expressed or implied in these statements.
Forward-looking statements include, among other things, statements concerning Vestas’ potential exposure to market risks and statementsexpressing management’s expectations, beliefs, estimates, forecasts, projections and assumptions. A number of factors that affect Vestas’ futureoperations and could cause Vestas’ results to differ materially from those expressed in the forward-looking statements included in this document,include (without limitation): (a) changes in demand for Vestas’ products; (b) currency and interest rate fluctuations; (c) loss of market share andindustry competition; (d) environmental and physical risks, including adverse weather conditions; (e) legislative, fiscal, and regulatory developments,including changes in tax or accounting policies; (f) economic and financial market conditions in various countries and regions; (g) political risks,including the risks of expropriation and renegotiation of the terms of contracts with governmental entities, and delays or advancements in theapproval of projects; (h) ability to enforce patents; (i) product development risks; (j) cost of commodities; (k) customer credit risks; (l) supply ofcomponents; and (m) customer created delays affecting product installation, grid connections and other revenue-recognition factors.
All forward-looking statements contained in this document are expressly qualified by the cautionary statements contained or referenced to in thisstatement. Undue reliance should not be placed on forward-looking statements. Additional factors that may affect future results are contained inVestas’ annual report for the year ended 31 December 2020 (available at www.vestas.com/investor) and these factors also should be considered.Each forward-looking statement speaks only as of the date of this document. Vestas does not undertake any obligation to publicly update or reviseany forward-looking statement as a result of new information or future events other than as required by Danish law. In light of these risks, resultscould differ materially from those stated, implied or inferred from the forward-looking statements contained in this document.
Classification: Public
KEY HIGHLIGHTS
3
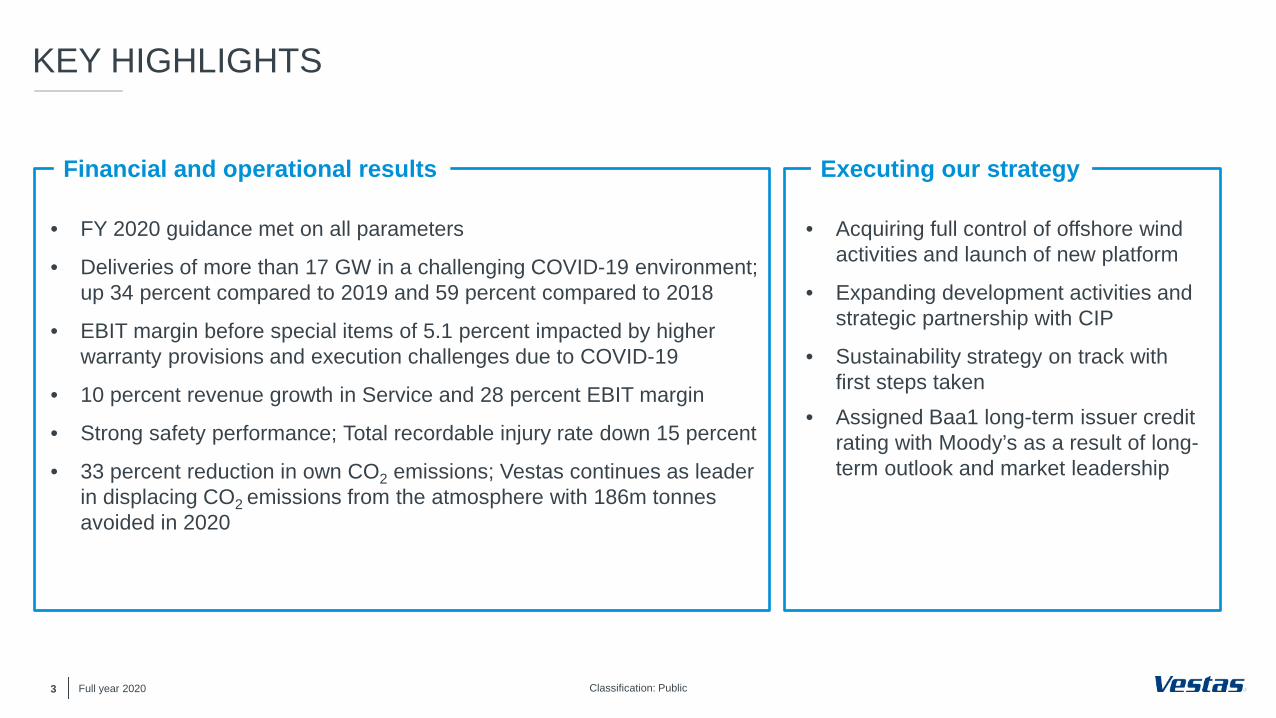
• FY 2020 guidance met on all parameters
• Deliveries of more than 17 GW in a challenging COVID-19 environment; up 34 percent compared to 2019 and 59 percent compared to 2018
• EBIT margin before special items of 5.1 percent impacted by higher warranty provisions and execution challenges due to COVID-19
• 10 percent revenue growth in Service and 28 percent EBIT margin
• Strong safety performance; Total recordable injury rate down 15 percent
• 33 percent reduction in own CO2 emissions; Vestas continues as leader in displacing CO2 emissions from the atmosphere with 186m tonnes avoided in 2020
Full year 2020
Financial and operational results
• Acquiring full control of offshore wind activities and launch of new platform
• Expanding development activities and strategic partnership with CIP
• Sustainability strategy on track with first steps taken
• Assigned Baa1 long-term issuer credit rating with Moody’s as a result of long-term outlook and market leadership
Executing our strategy

Classification: Public4
Orders and markets
Financials
Strategy and market outlook
AGENDA
Outlook & Q&A
Full year 2020
Classification: PublicFull year 20205
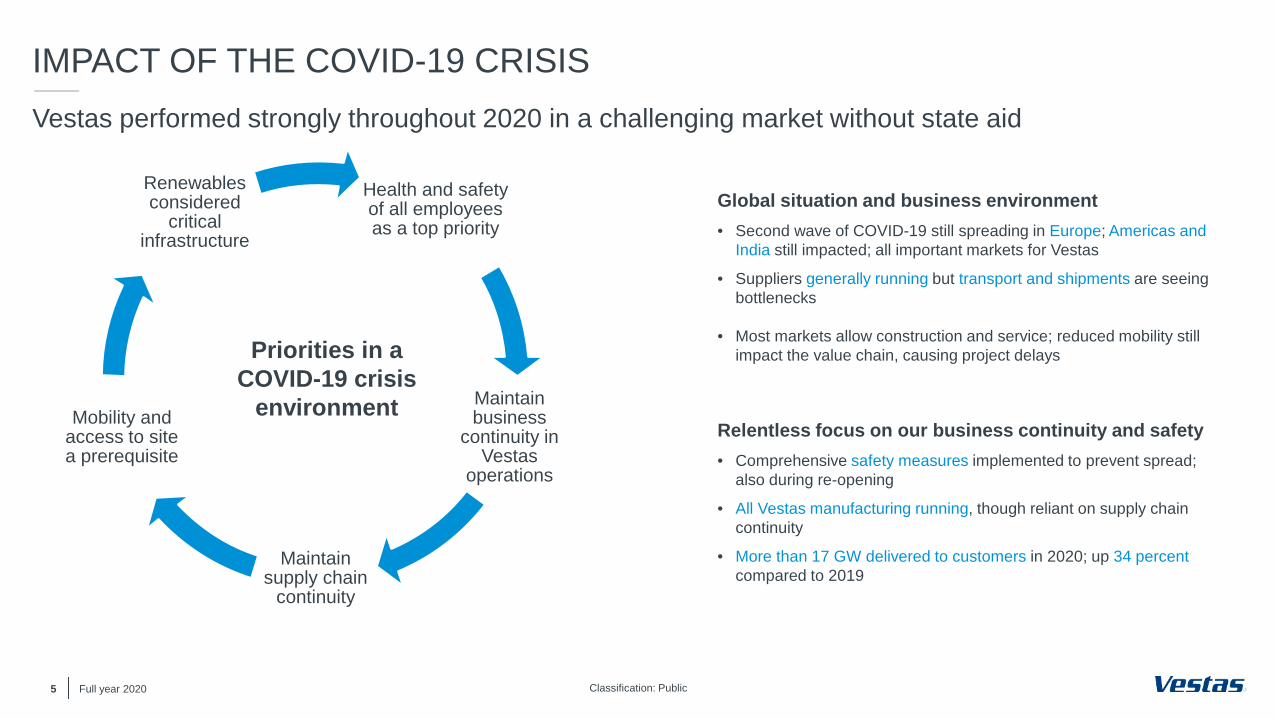
IMPACT OF THE COVID-19 CRISISVestas performed strongly throughout 2020 in a challenging market without state aid
Health and safety of all employees as a top priority
Maintain business
continuity in Vestas
operations
Maintain supply chain
continuity
Mobility and access to site a prerequisite
Renewables considered
critical infrastructure
Priorities in a COVID-19 crisis
environment
Global situation and business environment• Second wave of COVID-19 still spreading in Europe; Americas and
India still impacted; all important markets for Vestas
• Suppliers generally running but transport and shipments are seeing bottlenecks
• Most markets allow construction and service; reduced mobility still impact the value chain, causing project delays
Relentless focus on our business continuity and safety• Comprehensive safety measures implemented to prevent spread;
also during re-opening
• All Vestas manufacturing running, though reliant on supply chain continuity
• More than 17 GW delivered to customers in 2020; up 34 percentcompared to 2019
Classification: PublicFull year 20206
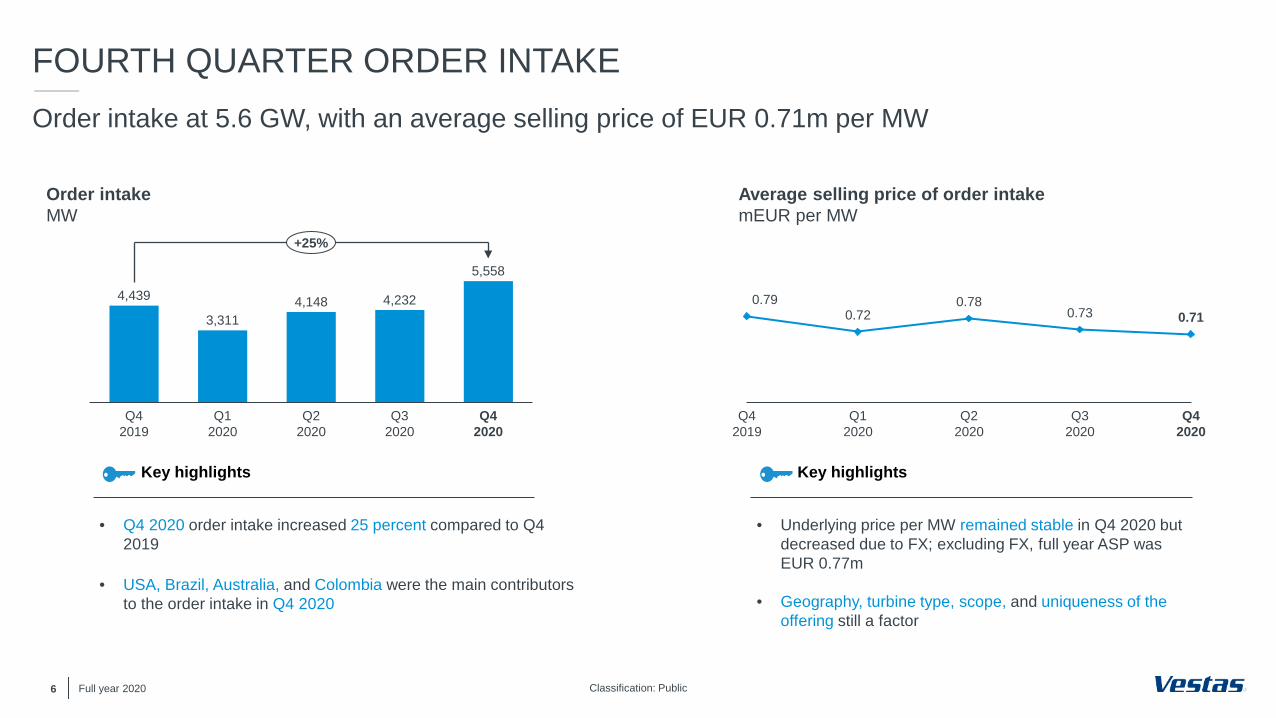
FOURTH QUARTER ORDER INTAKEOrder intake at 5.6 GW, with an average selling price of EUR 0.71m per MW
4,148
Q42019
Q42020
Q12020
Q22020
Q32020
4,2324,439
3,311
5,558
+25%
Average selling price of order intakemEUR per MW
Q32020
0.73
Q42019
0.790.72
Q12020
0.78
Q22020
Q42020
0.71
• Q4 2020 order intake increased 25 percent compared to Q4 2019
• USA, Brazil, Australia, and Colombia were the main contributors to the order intake in Q4 2020
Key highlights
• Underlying price per MW remained stable in Q4 2020 but decreased due to FX; excluding FX, full year ASP was EUR 0.77m
• Geography, turbine type, scope, and uniqueness of the offering still a factor
Key highlights
Order intake MW
Classification: Public
* Compared to FY 2019.
Full year 20207
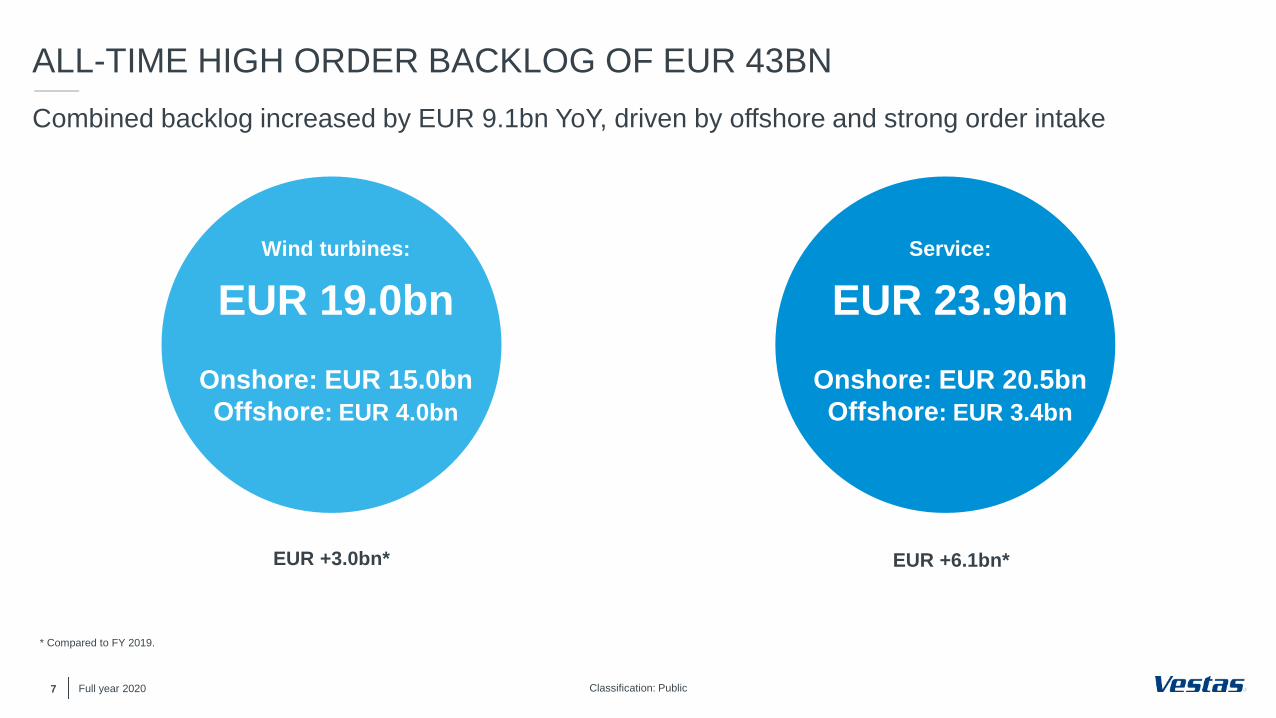
ALL-TIME HIGH ORDER BACKLOG OF EUR 43BNCombined backlog increased by EUR 9.1bn YoY, driven by offshore and strong order intake
EUR +3.0bn* EUR +6.1bn*
Wind turbines:
EUR 19.0bnOnshore: EUR 15.0bnOffshore: EUR 4.0bn
Service:
EUR 23.9bnOnshore: EUR 20.5bnOffshore: EUR 3.4bn
Classification: PublicFull year 20208
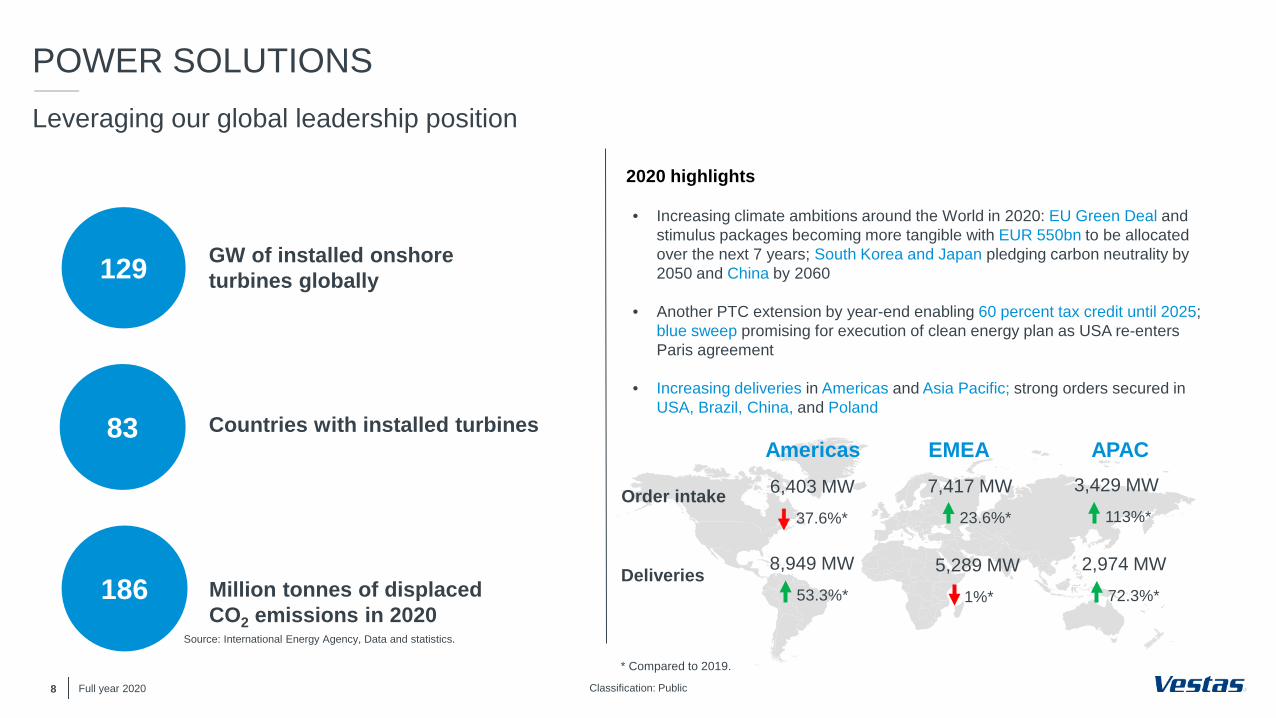
POWER SOLUTIONSLeveraging our global leadership position
• Increasing climate ambitions around the World in 2020: EU Green Deal and stimulus packages becoming more tangible with EUR 550bn to be allocated over the next 7 years; South Korea and Japan pledging carbon neutrality by 2050 and China by 2060
• Another PTC extension by year-end enabling 60 percent tax credit until 2025; blue sweep promising for execution of clean energy plan as USA re-enters Paris agreement
• Increasing deliveries in Americas and Asia Pacific; strong orders secured in USA, Brazil, China, and Poland
83 Countries with installed turbines
129 GW of installed onshore turbines globally
186 Million tonnes of displaced CO2 emissions in 2020
2020 highlights
Americas EMEA APAC6,403 MW
37.6%*
7,417 MW 23.6%*
3,429 MW 113%*
8,949 MW 53.3%*
5,289 MW 1%*
2,974 MW 72.3%*
Order intake
Deliveries
Source: International Energy Agency, Data and statistics.
* Compared to 2019.
Classification: PublicFull year 20209
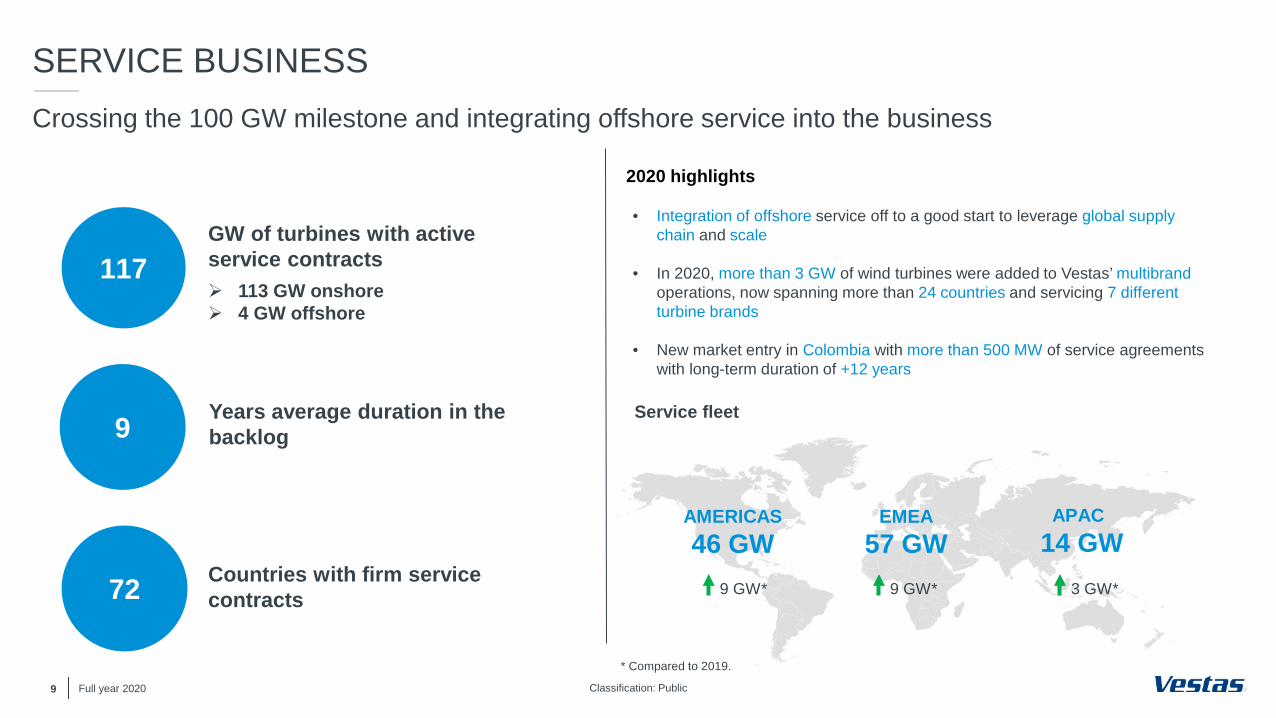
SERVICE BUSINESSCrossing the 100 GW milestone and integrating offshore service into the business
AMERICAS46 GW
EMEA57 GW
APAC14 GW
• Integration of offshore service off to a good start to leverage global supply chain and scale
• In 2020, more than 3 GW of wind turbines were added to Vestas’ multibrandoperations, now spanning more than 24 countries and servicing 7 different turbine brands
• New market entry in Colombia with more than 500 MW of service agreements with long-term duration of +12 years
Service fleet9 Years average duration in the backlog
117GW of turbines with active service contracts 113 GW onshore 4 GW offshore
72 Countries with firm service contracts 9 GW* 9 GW* 3 GW*
* Compared to 2019.
2020 highlights
Classification: Public10
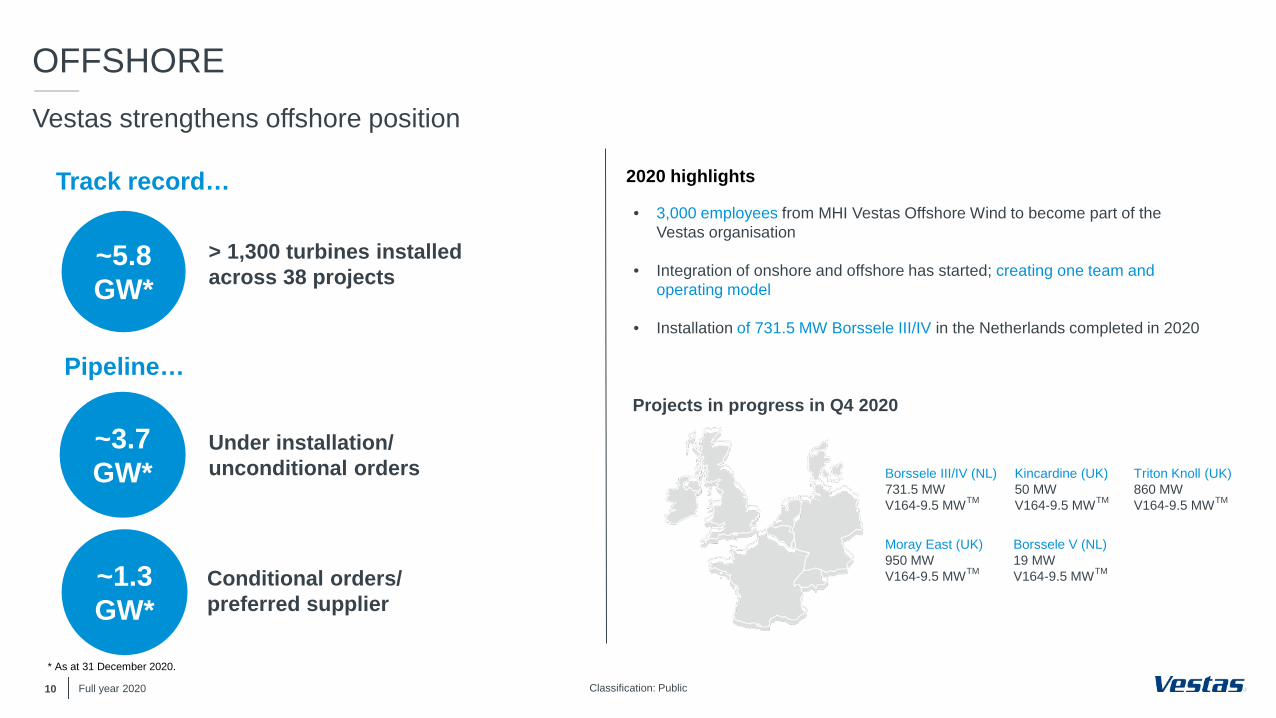
OFFSHOREVestas strengthens offshore position
• 3,000 employees from MHI Vestas Offshore Wind to become part of the Vestas organisation
• Integration of onshore and offshore has started; creating one team and operating model
• Installation of 731.5 MW Borssele III/IV in the Netherlands completed in 2020
~3.7 GW*
Under installation/ unconditional orders
~5.8 GW*
> 1,300 turbines installed across 38 projects
Track record…
Pipeline…
~1.3 GW*
Conditional orders/preferred supplier
Projects in progress in Q4 2020
Full year 2020
* As at 31 December 2020.
Borssele III/IV (NL)731.5 MWV164-9.5 MWTM
Borssele V (NL)19 MWV164-9.5 MWTM
Kincardine (UK)50 MWV164-9.5 MWTM
Moray East (UK)950 MWV164-9.5 MWTM
Triton Knoll (UK)860 MWV164-9.5 MWTM
2020 highlights
Classification: PublicFull year 202011
Orders and markets
Financials
Strategy and market outlook
AGENDA
Outlook & Q&A
Classification: Public
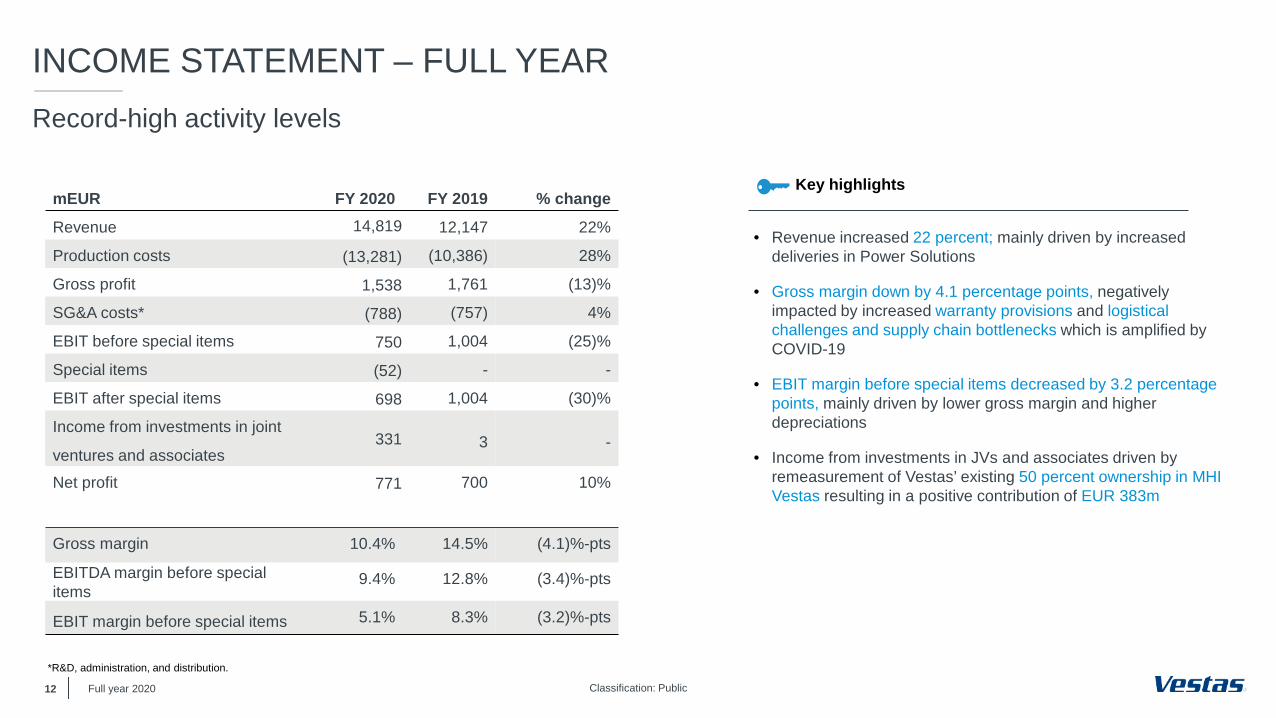
INCOME STATEMENT – FULL YEAR
12
Record-high activity levels
mEUR FY 2020 FY 2019 % changeRevenue 14,819 12,147 22%
Production costs (13,281) (10,386) 28%
Gross profit 1,538 1,761 (13)%
SG&A costs* (788) (757) 4%
EBIT before special items 750 1,004 (25)%
Special items (52) - -
EBIT after special items 698 1,004 (30)%
Income from investments in joint
ventures and associates331 3 -
Net profit 771 700 10%
Gross margin 10.4% 14.5% (4.1)%-pts
EBITDA margin before special items
9.4% 12.8% (3.4)%-pts
EBIT margin before special items 5.1% 8.3% (3.2)%-pts
• Revenue increased 22 percent; mainly driven by increaseddeliveries in Power Solutions
• Gross margin down by 4.1 percentage points, negatively impacted by increased warranty provisions and logistical challenges and supply chain bottlenecks which is amplified by COVID-19
• EBIT margin before special items decreased by 3.2 percentage points, mainly driven by lower gross margin and higher depreciations
• Income from investments in JVs and associates driven by remeasurement of Vestas’ existing 50 percent ownership in MHI Vestas resulting in a positive contribution of EUR 383m
Key highlights
Full year 2020
*R&D, administration, and distribution.
Classification: Public
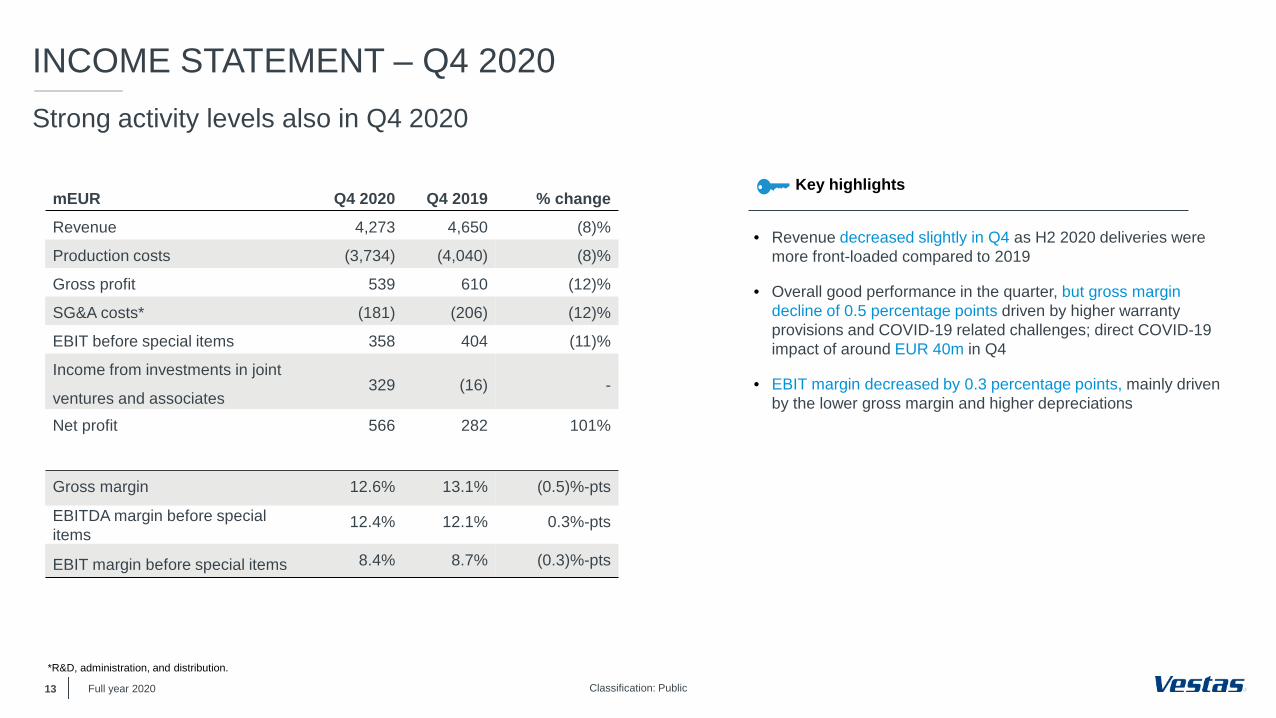
INCOME STATEMENT – Q4 2020
13
Strong activity levels also in Q4 2020
mEUR Q4 2020 Q4 2019 % changeRevenue 4,273 4,650 (8)%
Production costs (3,734) (4,040) (8)%
Gross profit 539 610 (12)%
SG&A costs* (181) (206) (12)%
EBIT before special items 358 404 (11)%
Income from investments in joint
ventures and associates329 (16) -
Net profit 566 282 101%
Gross margin 12.6% 13.1% (0.5)%-pts
EBITDA margin before special items
12.4% 12.1% 0.3%-pts
EBIT margin before special items 8.4% 8.7% (0.3)%-pts
• Revenue decreased slightly in Q4 as H2 2020 deliveries weremore front-loaded compared to 2019
• Overall good performance in the quarter, but gross margin decline of 0.5 percentage points driven by higher warranty provisions and COVID-19 related challenges; direct COVID-19 impact of around EUR 40m in Q4
• EBIT margin decreased by 0.3 percentage points, mainly driven by the lower gross margin and higher depreciations
Key highlights
Full year 2020
*R&D, administration, and distribution.
Classification: Public
SG&A COSTS
14
SG&A costs under control
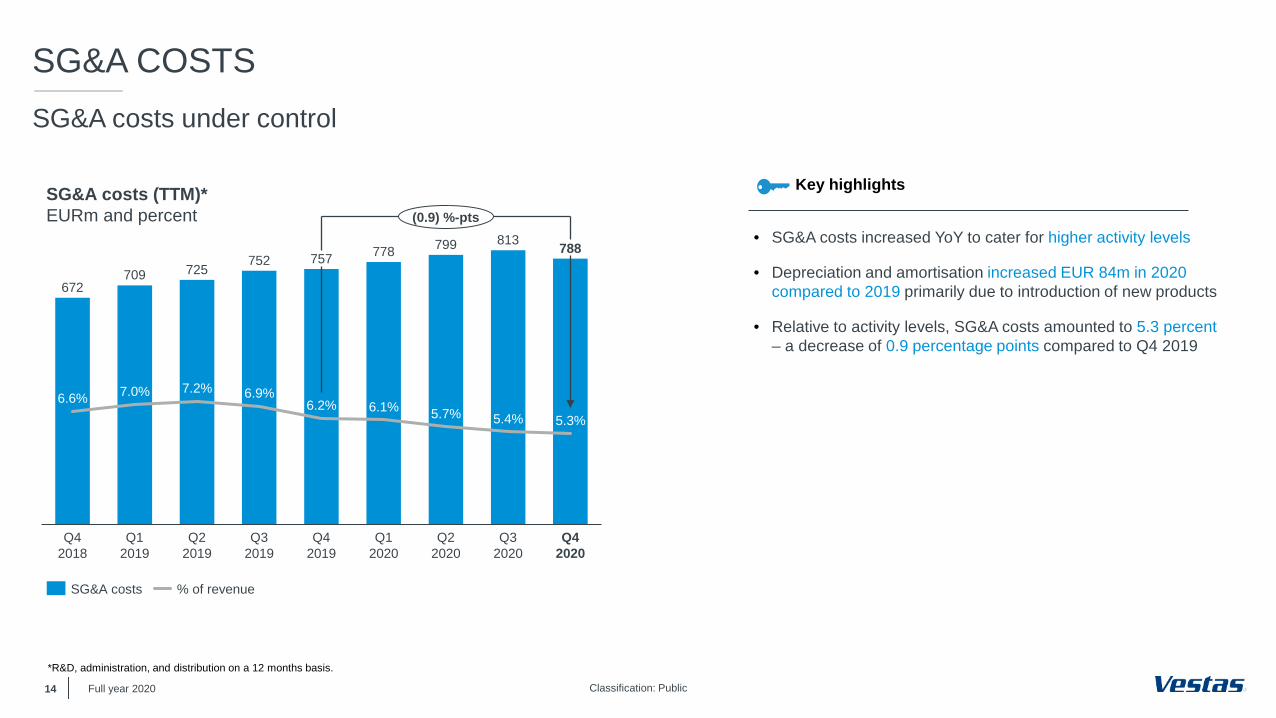
SG&A costs (TTM)*EURm and percent
672709 725
752 757 778 799 813 788
Q42020
6.6% 6.9%7.2%7.0%
Q42018
Q12019
Q22019
Q32019
6.2%
Q42019
6.1%
Q12020
5.7%
Q22020
5.4%
Q32020
5.3%
(0.9) %-pts• SG&A costs increased YoY to cater for higher activity levels
• Depreciation and amortisation increased EUR 84m in 2020 compared to 2019 primarily due to introduction of new products
• Relative to activity levels, SG&A costs amounted to 5.3 percent – a decrease of 0.9 percentage points compared to Q4 2019
Key highlights
Full year 2020
SG&A costs % of revenue
*R&D, administration, and distribution on a 12 months basis.
Classification: Public
SERVICE BUSINESS
15
Strong service performance
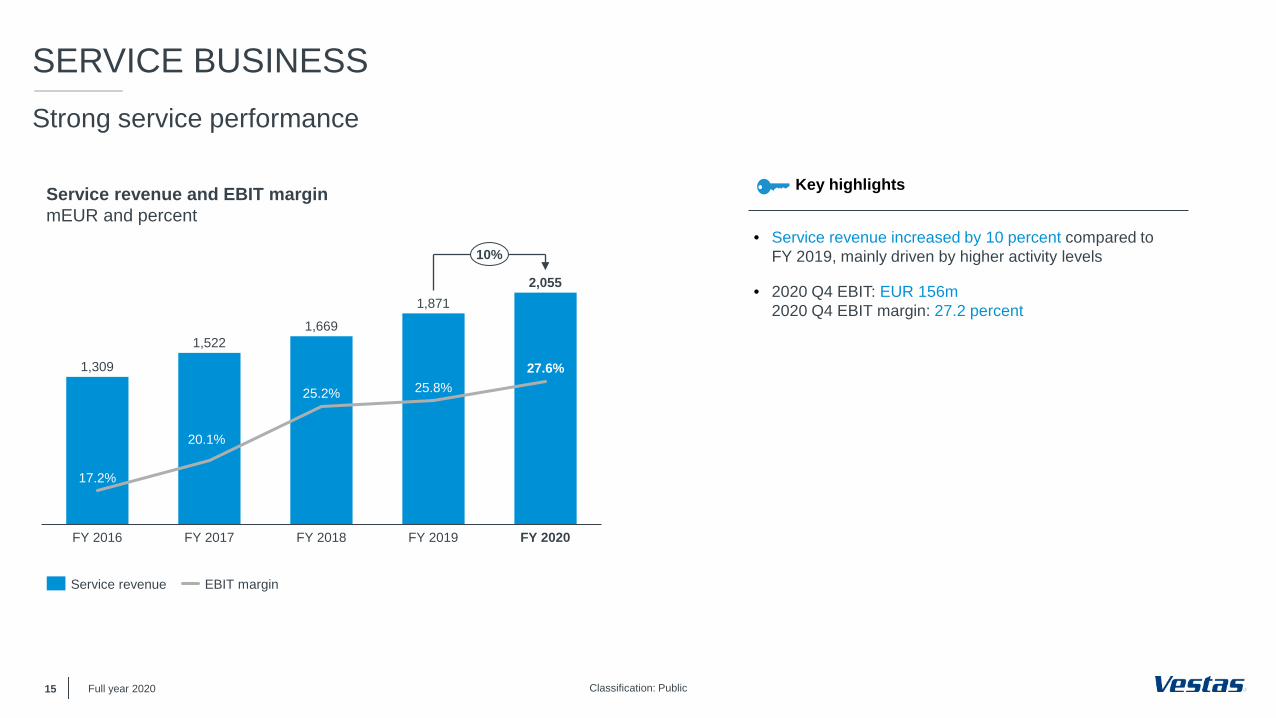
Service revenue and EBIT marginmEUR and percent
25.2%
17.2%
FY 2016
25.8%
20.1%
FY 2017
2,055
FY 2018 FY 2019
27.6%
FY 2020
1,309
1,5221,669
1,871
10%• Service revenue increased by 10 percent compared to
FY 2019, mainly driven by higher activity levels
• 2020 Q4 EBIT: EUR 156m2020 Q4 EBIT margin: 27.2 percent
Key highlights
Full year 2020
Service revenue EBIT margin
Classification: Public
MHI VESTAS OFFSHORE WIND
16
Stable activity levels in offshore
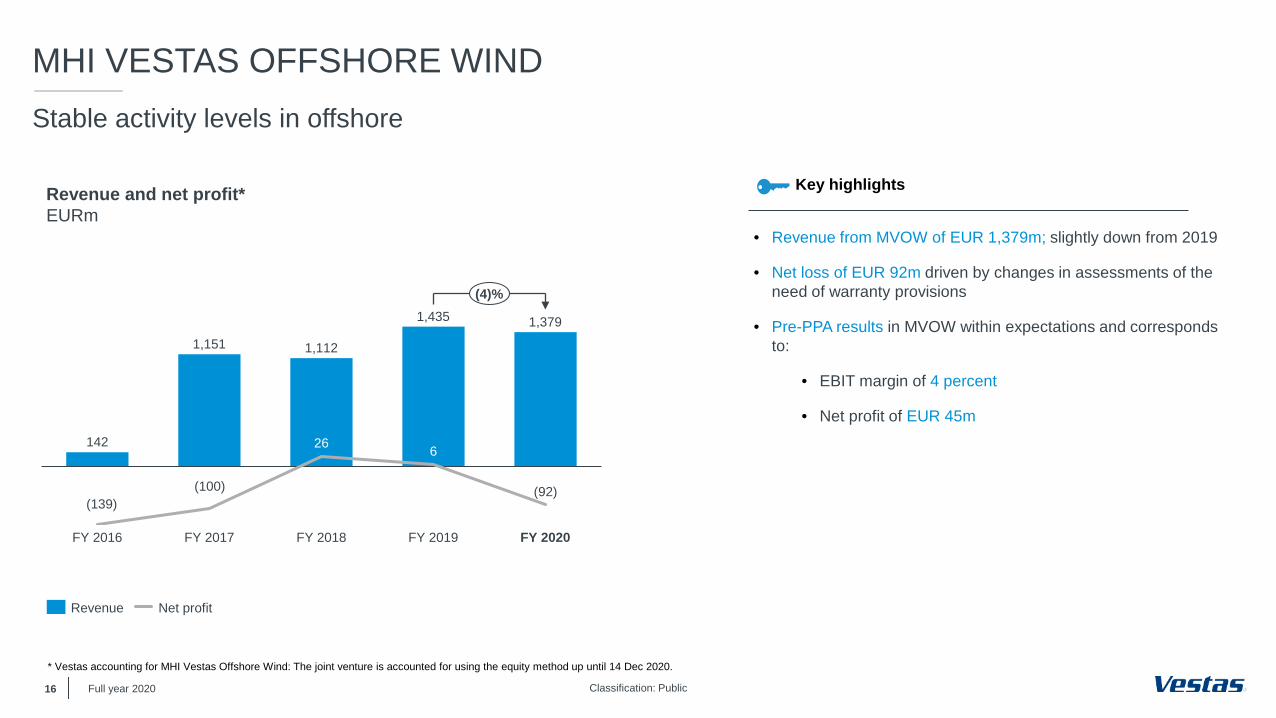
Revenue and net profit*EURm
142 26 6
FY 2019
(139)
FY 2016
(100)
FY 2017
(92)
FY 2018 FY 2020
1,151 1,112
1,435 1,379
(4)%
• Revenue from MVOW of EUR 1,379m; slightly down from 2019
• Net loss of EUR 92m driven by changes in assessments of the need of warranty provisions
• Pre-PPA results in MVOW within expectations and corresponds to:
• EBIT margin of 4 percent
• Net profit of EUR 45m
Key highlights
Full year 2020
* Vestas accounting for MHI Vestas Offshore Wind: The joint venture is accounted for using the equity method up until 14 Dec 2020.
Revenue Net profit
Classification: Public17
CHANGE IN NET WORKING CAPITALNet working capital continues to be negative
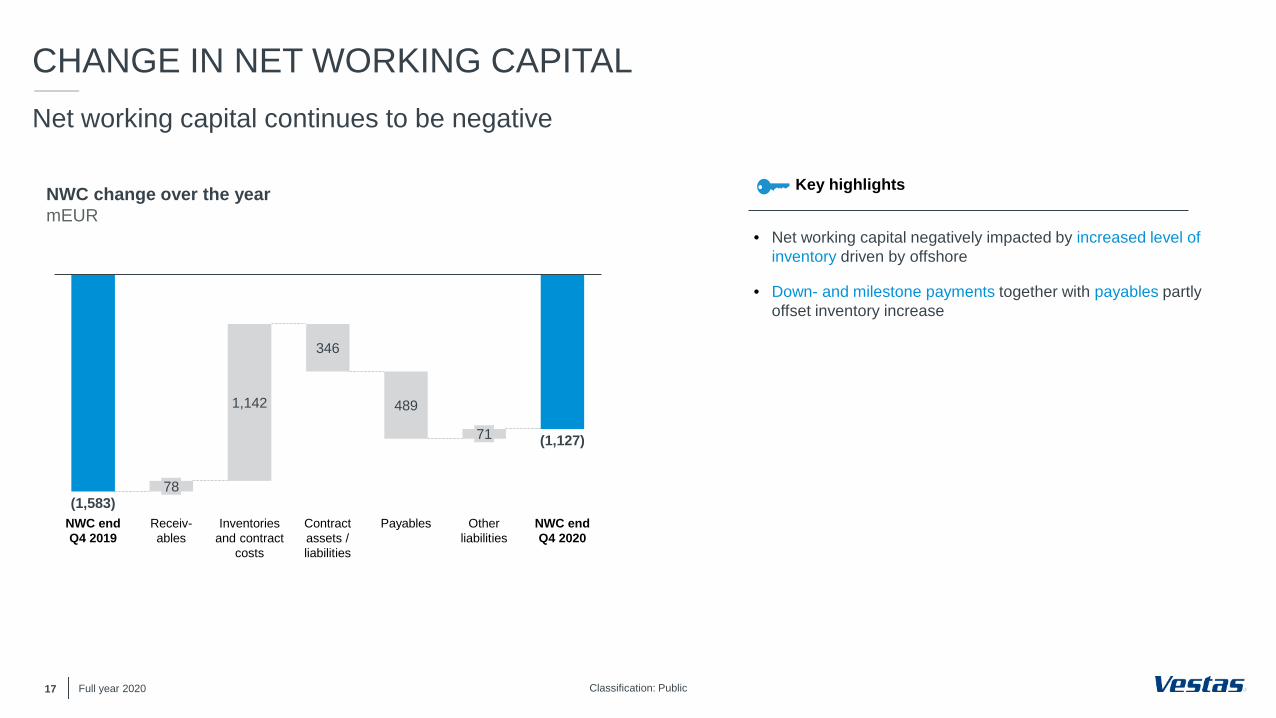
489
NWC endQ4 2019
Contract assets / liabilities
78
Inventories and contract
costs
Receiv-ables
1,142
346
Payables
71
Other liabilities
NWC endQ4 2020
(1,583)
(1,127)
NWC change over the yearmEUR
• Net working capital negatively impacted by increased level of inventory driven by offshore
• Down- and milestone payments together with payables partly offset inventory increase
Key highlights
Full year 2020
Classification: Public
CASH FLOW STATEMENT
18
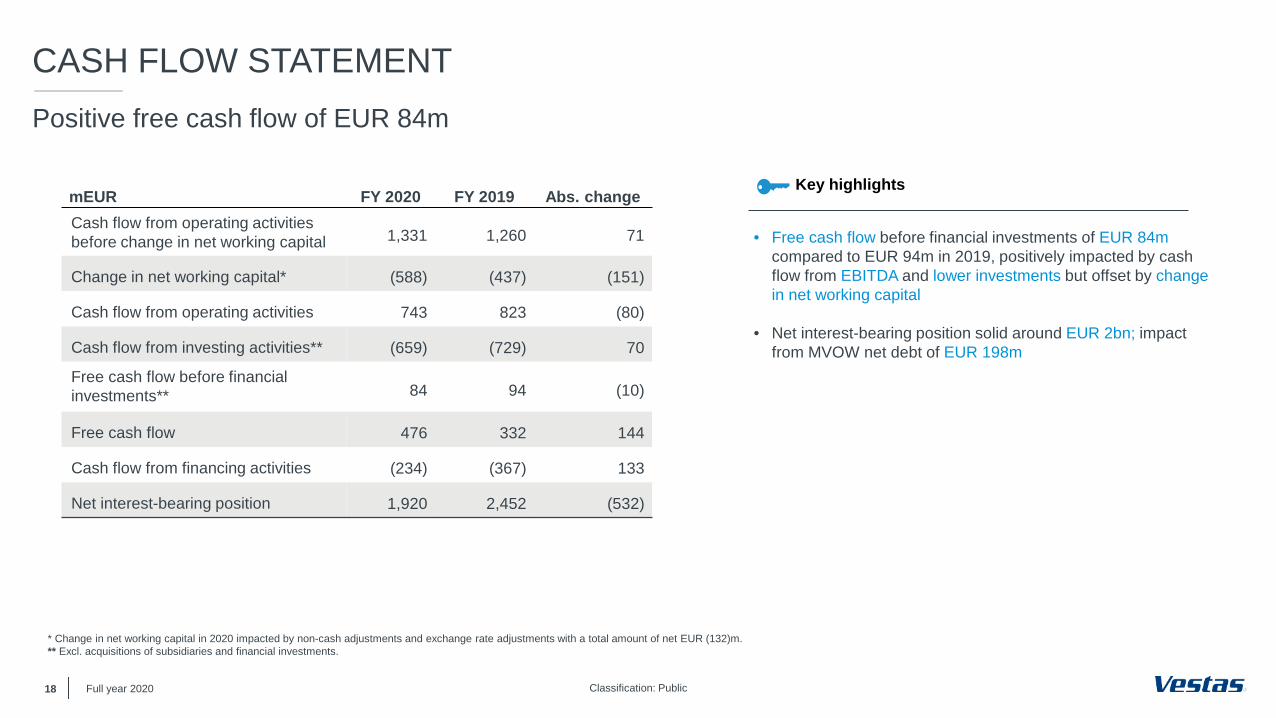
Positive free cash flow of EUR 84m
Full year 2020
• Free cash flow before financial investments of EUR 84m compared to EUR 94m in 2019, positively impacted by cash flow from EBITDA and lower investments but offset by change in net working capital
• Net interest-bearing position solid around EUR 2bn; impact from MVOW net debt of EUR 198m
Key highlights
* Change in net working capital in 2020 impacted by non-cash adjustments and exchange rate adjustments with a total amount of net EUR (132)m.** Excl. acquisitions of subsidiaries and financial investments.
mEUR FY 2020 FY 2019 Abs. changeCash flow from operating activities before change in net working capital 1,331 1,260 71
Change in net working capital* (588) (437) (151)
Cash flow from operating activities 743 823 (80)
Cash flow from investing activities** (659) (729) 70
Free cash flow before financial investments** 84 94 (10)
Free cash flow 476 332 144
Cash flow from financing activities (234) (367) 133
Net interest-bearing position 1,920 2,452 (532)
Classification: Public
TOTAL INVESTMENTS
19
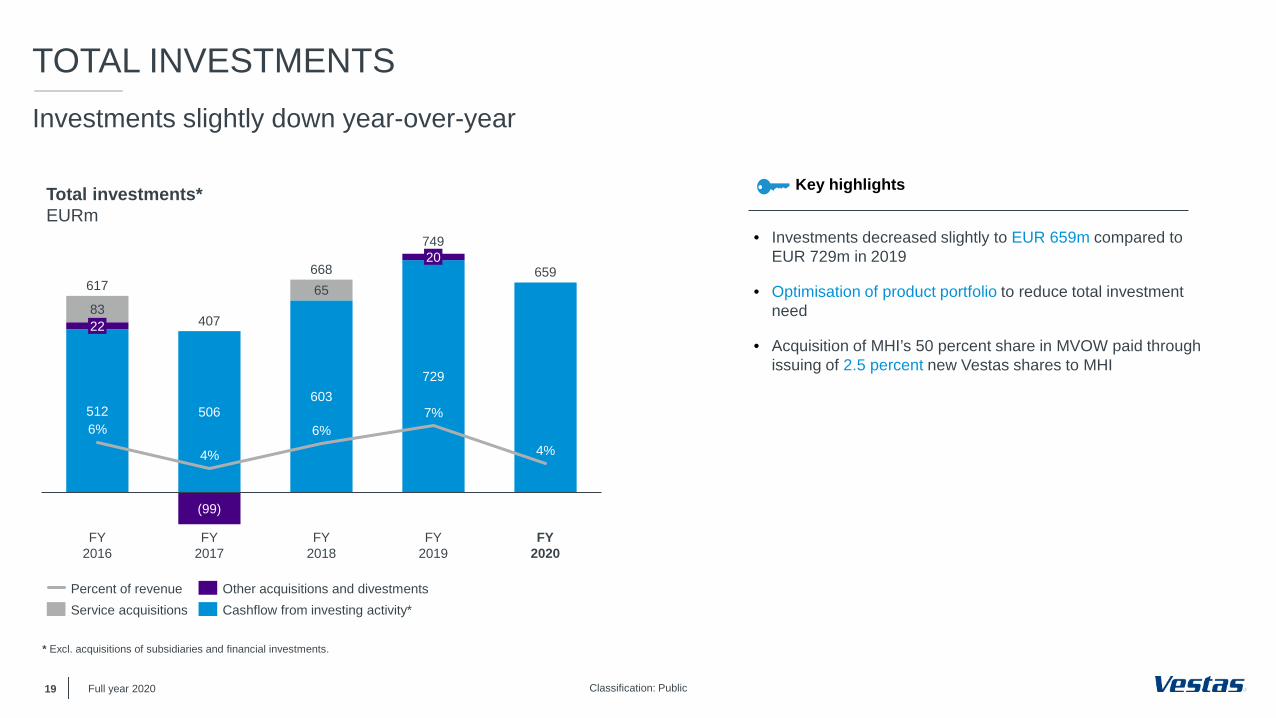
Investments slightly down year-over-year
Total investments*EURm
• Investments decreased slightly to EUR 659m compared to EUR 729m in 2019
• Optimisation of product portfolio to reduce total investment need
• Acquisition of MHI’s 50 percent share in MVOW paid through issuing of 2.5 percent new Vestas shares to MHI
Key highlights
Full year 2020
* Excl. acquisitions of subsidiaries and financial investments.
512 506603
729
65965
83
6% 6%
FY2017
22
FY2016
4%
FY2018
(99)
4%
7%
FY2019
20
FY2020
617
407
668
749
Percent of revenueService acquisitions
Other acquisitions and divestmentsCashflow from investing activity*
Classification: Public20
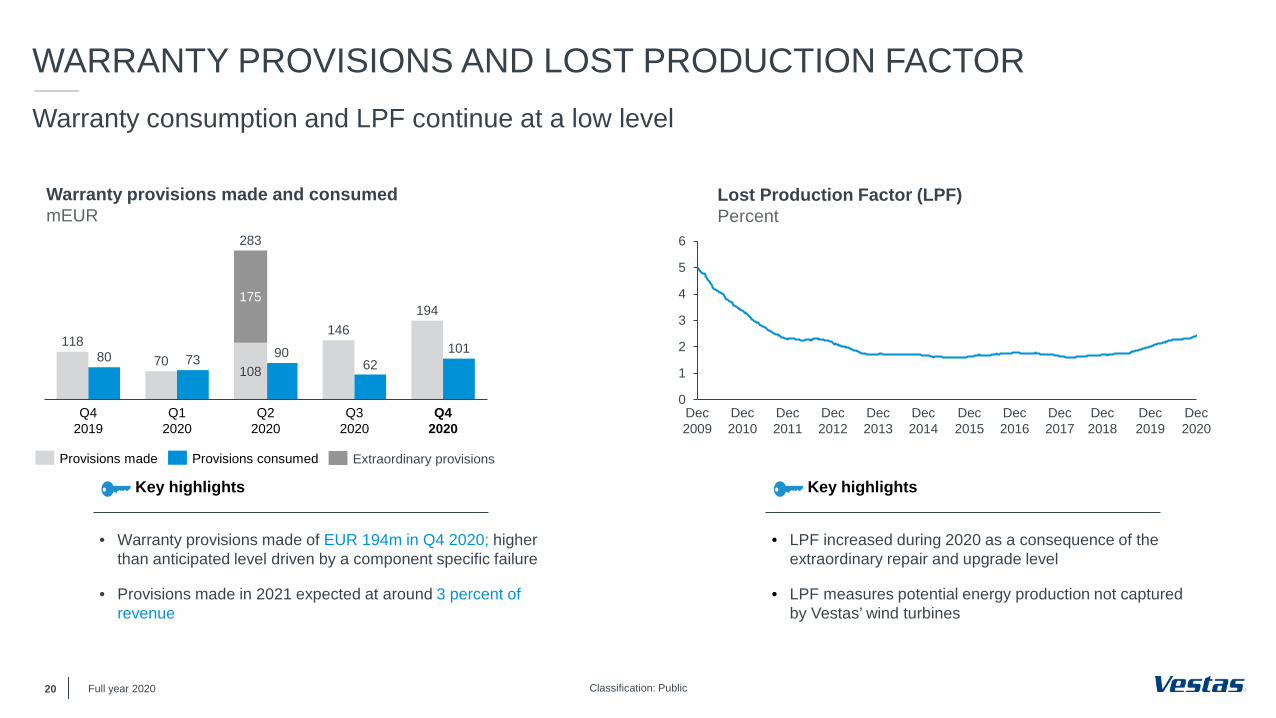
WARRANTY PROVISIONS AND LOST PRODUCTION FACTORWarranty consumption and LPF continue at a low level
Lost Production Factor (LPF)Percent
• Warranty provisions made of EUR 194m in Q4 2020; higher than anticipated level driven by a component specific failure
• Provisions made in 2021 expected at around 3 percent of revenue
Key highlights
• LPF increased during 2020 as a consequence of the extraordinary repair and upgrade level
• LPF measures potential energy production not captured by Vestas’ wind turbines
Key highlights
Warranty provisions made and consumedmEUR
Full year 2020
0
1
2
3
4
5
6
Dec 2010
Dec 2009
Dec 2016
Dec 2011
Dec 2012
Dec 2013
Dec 2014
Dec 2015
Dec 2017
Dec 2018
Dec 2019
Dec 2020
11870
146194
80 73 9062
101
Q32020
Q42019
Q12020
Q42020
Q22020
0
Provisions made Provisions consumed
108
175
283
Extraordinary provisions
Classification: Public21
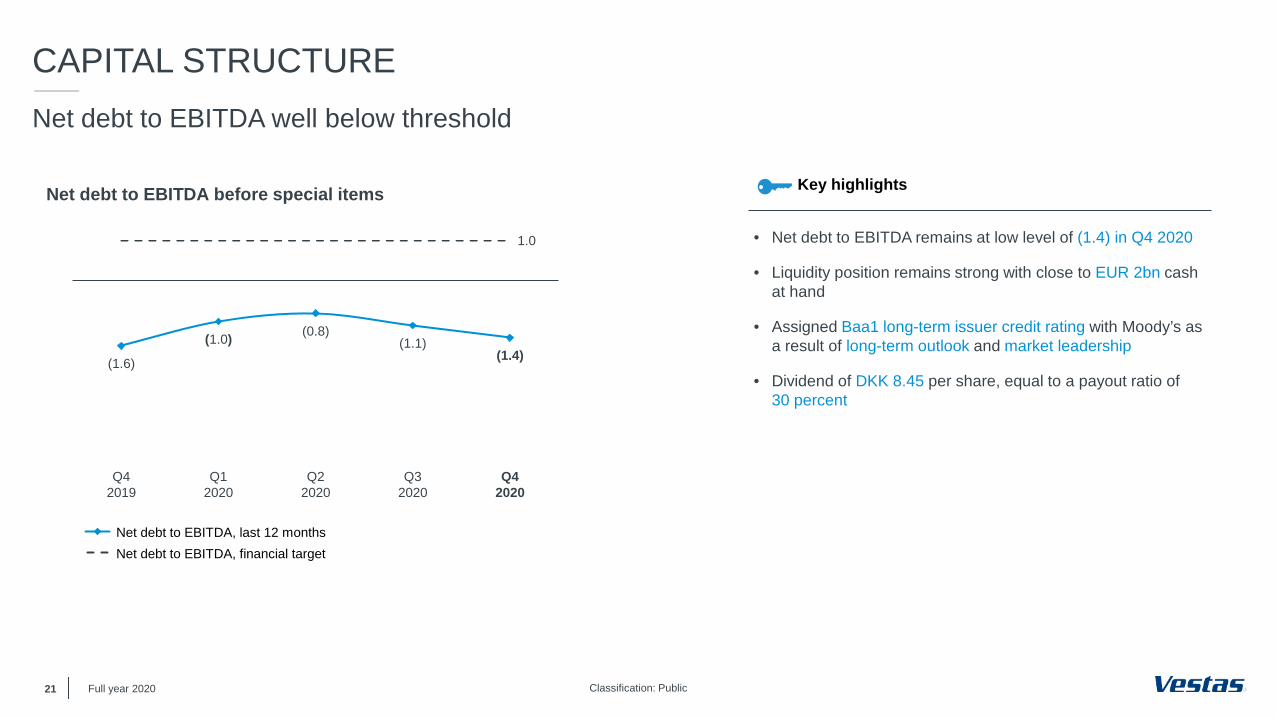
CAPITAL STRUCTURENet debt to EBITDA well below threshold
Net debt to EBITDA before special items
Q42019
Q32020
(1.6)
Q22020
(0.8)(1.0)
Q12020
(1.1)
Q42020
(1.4)
1.0
Net debt to EBITDA, last 12 monthsNet debt to EBITDA, financial target
• Net debt to EBITDA remains at low level of (1.4) in Q4 2020
• Liquidity position remains strong with close to EUR 2bn cash at hand
• Assigned Baa1 long-term issuer credit rating with Moody’s as a result of long-term outlook and market leadership
• Dividend of DKK 8.45 per share, equal to a payout ratio of 30 percent
Key highlights
Full year 2020
Classification: PublicFull year 202022
Orders and markets
Financials
Strategy and market outlook
AGENDA
Outlook & Q&A
Classification: Public
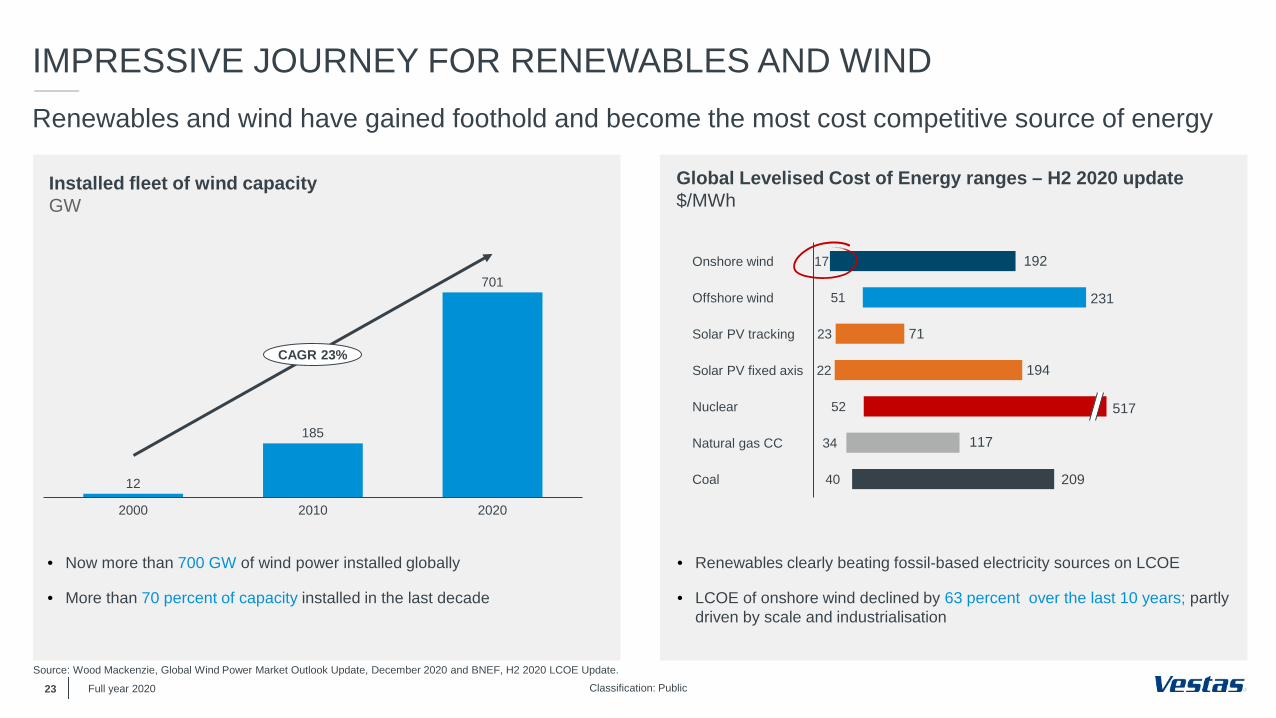
Global Levelised Cost of Energy ranges – H2 2020 update$/MWh
• Renewables clearly beating fossil-based electricity sources on LCOE
• LCOE of onshore wind declined by 63 percent over the last 10 years; partly driven by scale and industrialisation
Installed fleet of wind capacity GW
• Now more than 700 GW of wind power installed globally
• More than 70 percent of capacity installed in the last decade
17
51
23
22
52
34
40
Solar PV tracking
Coal
Onshore wind
Offshore wind
Solar PV fixed axis
Nuclear
Natural gas CC
Source: and Wood Mackenzie, Global Wind Power Market Outlook Update, December 2020 BNEF, H2 2020 LCOE Update.
23
Renewables and wind have gained foothold and become the most cost competitive source of energy
12
185
701
20202000 2010
CAGR 23%
192
231
71
194
517
117
209
Full year 2020
IMPRESSIVE JOURNEY FOR RENEWABLES AND WIND
Classification: Public24
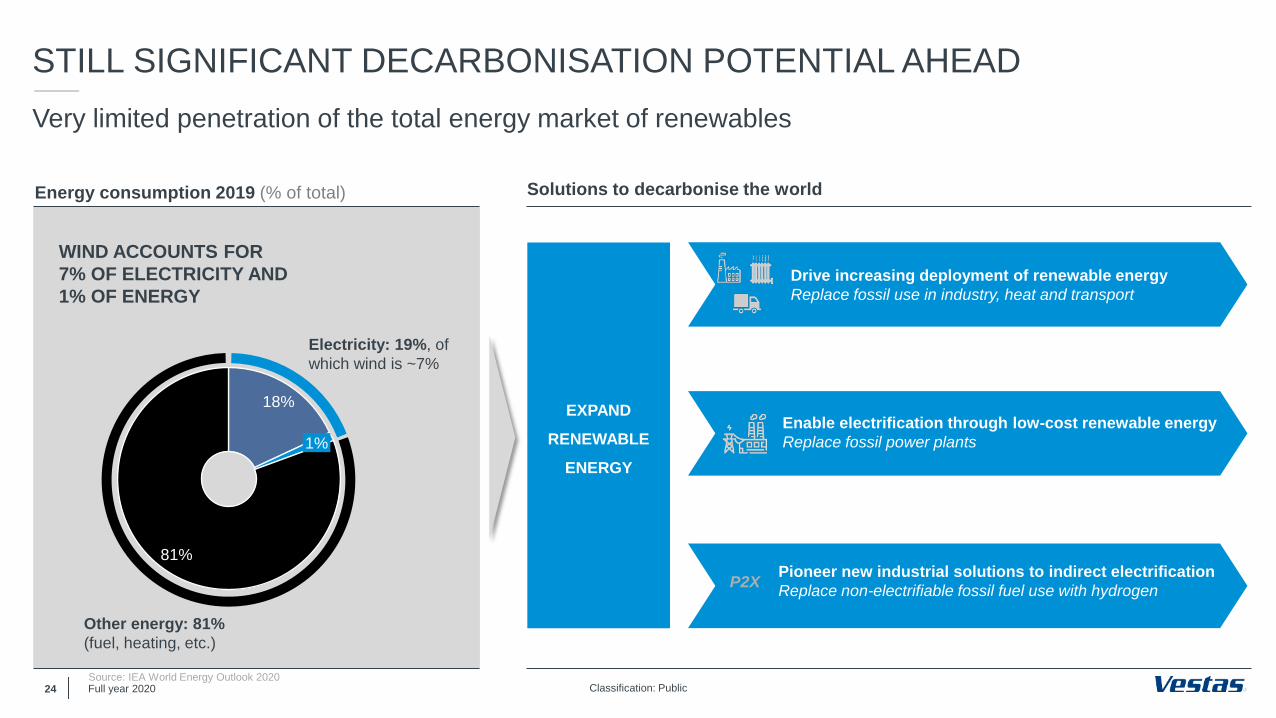
STILL SIGNIFICANT DECARBONISATION POTENTIAL AHEADVery limited penetration of the total energy market of renewables
18%
81%
1%
Electricity: 19%, of which wind is ~7%
Other energy: 81%(fuel, heating, etc.)
Energy consumption 2019 (% of total)
WIND ACCOUNTS FOR 7% OF ELECTRICITY AND 1% OF ENERGY
Solutions to decarbonise the world
EXPAND
RENEWABLE
ENERGY
Drive increasing deployment of renewable energyReplace fossil use in industry, heat and transport
P2X
Full year 2020Source: IEA World Energy Outlook 2020
Enable electrification through low-cost renewable energyReplace fossil power plants
Pioneer new industrial solutions to indirect electrificationReplace non-electrifiable fossil fuel use with hydrogen
Classification: Public
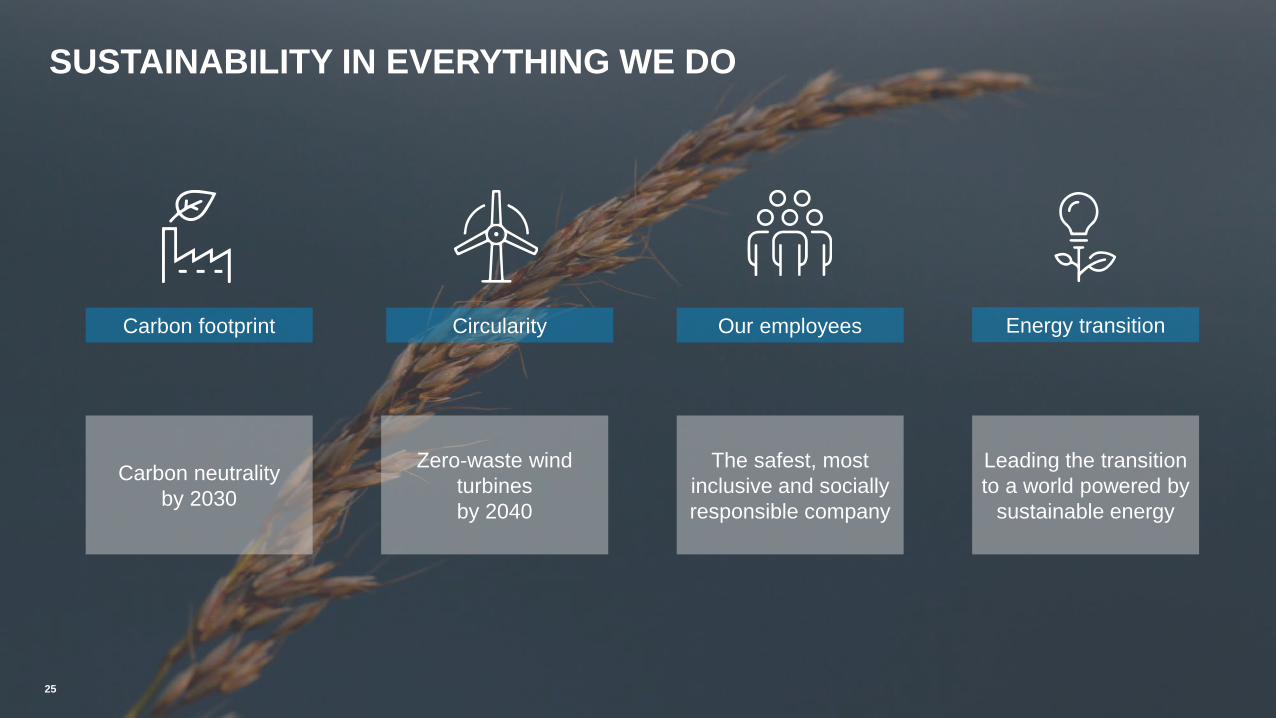
SUSTAINABILITY IN EVERYTHING WE DO
25
CircularityCarbon footprint Our employees Energy transition
Zero-waste wind turbinesby 2040
Carbon neutralityby 2030
The safest, most inclusive and socially responsible company
Leading the transition to a world powered by
sustainable energy
Classification: Public26
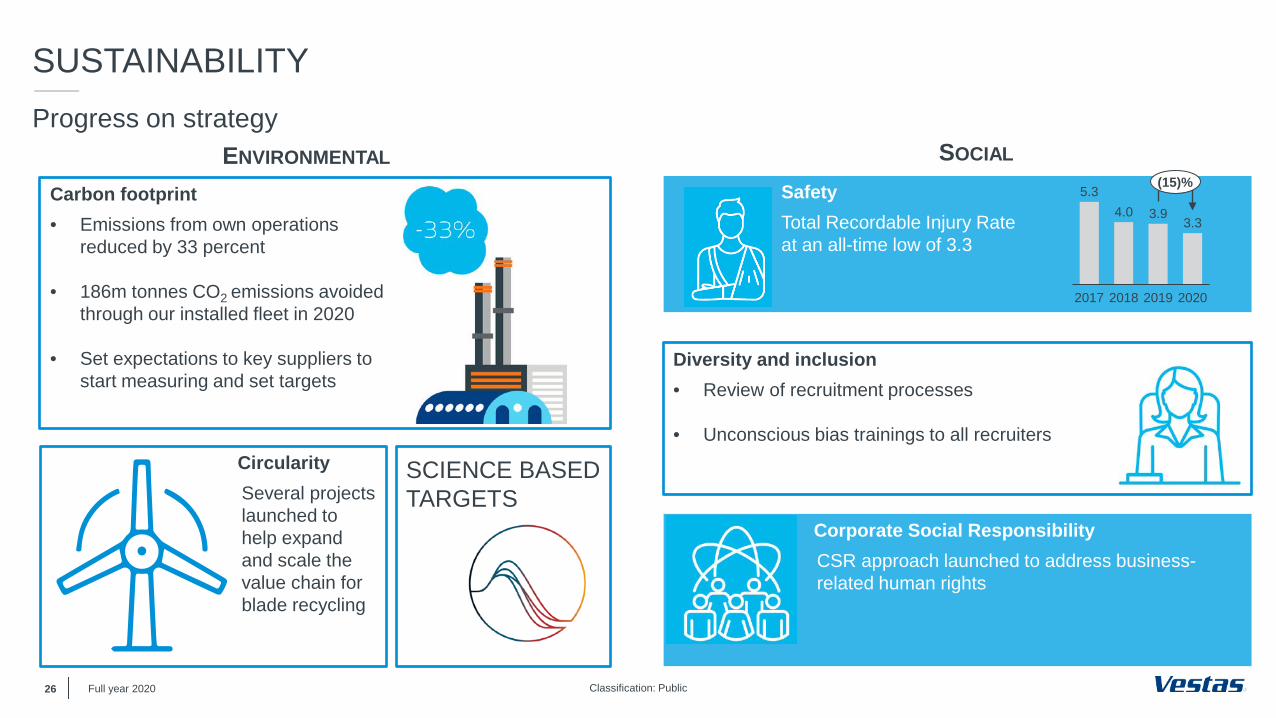
SUSTAINABILITYProgress on strategy
SOCIALENVIRONMENTAL
Diversity and inclusion• Review of recruitment processes
• Unconscious bias trainings to all recruiters
Corporate Social ResponsibilityCSR approach launched to address business-related human rights
Carbon footprint• Emissions from own operations
reduced by 33 percent
• 186m tonnes CO2 emissions avoided through our installed fleet in 2020
• Set expectations to key suppliers to start measuring and set targets
CircularitySeveral projects launched to help expand and scale the value chain for blade recycling
SafetyTotal Recordable Injury Rate at an all-time low of 3.3
4.0
20182017 20202019
5.33.9
3.3
(15)%
26 Full year 2020
SCIENCE BASED TARGETS
Classification: Public27
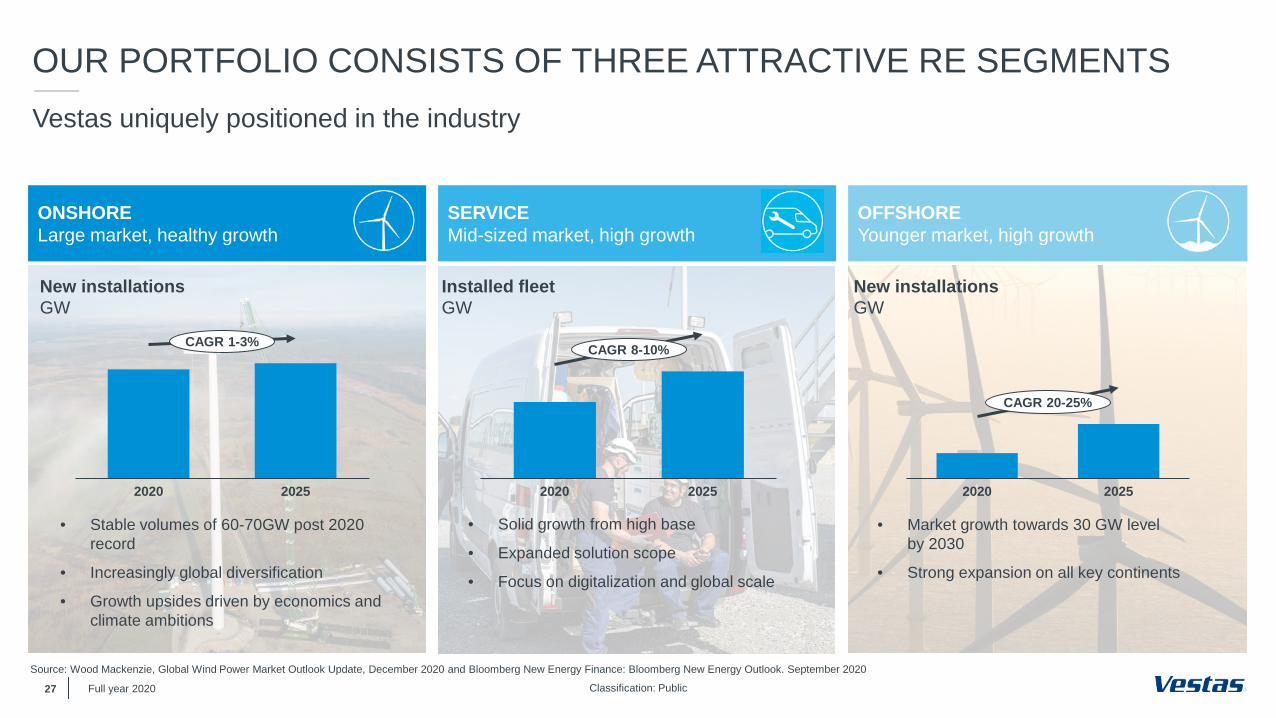
OUR PORTFOLIO CONSISTS OF THREE ATTRACTIVE RE SEGMENTS
ONSHORELarge market, healthy growth
SERVICEMid-sized market, high growth
OFFSHOREYounger market, high growth
New installationsGW
Installed fleetGW
New installationsGW
Source: Wood Mackenzie, Global Wind Power Market Outlook Update, December 2020 and Bloomberg New Energy Finance: Bloomberg New Energy Outlook. September 2020
Full year 2020
2020 2025
CAGR 1-3%
2020 2025
CAGR 8-10%
20252020
CAGR 20-25%
Vestas uniquely positioned in the industry
• Stable volumes of 60-70GW post 2020 record
• Increasingly global diversification
• Growth upsides driven by economics and climate ambitions
• Solid growth from high base
• Expanded solution scope
• Focus on digitalization and global scale
• Market growth towards 30 GW level by 2030
• Strong expansion on all key continents
Classification: Public
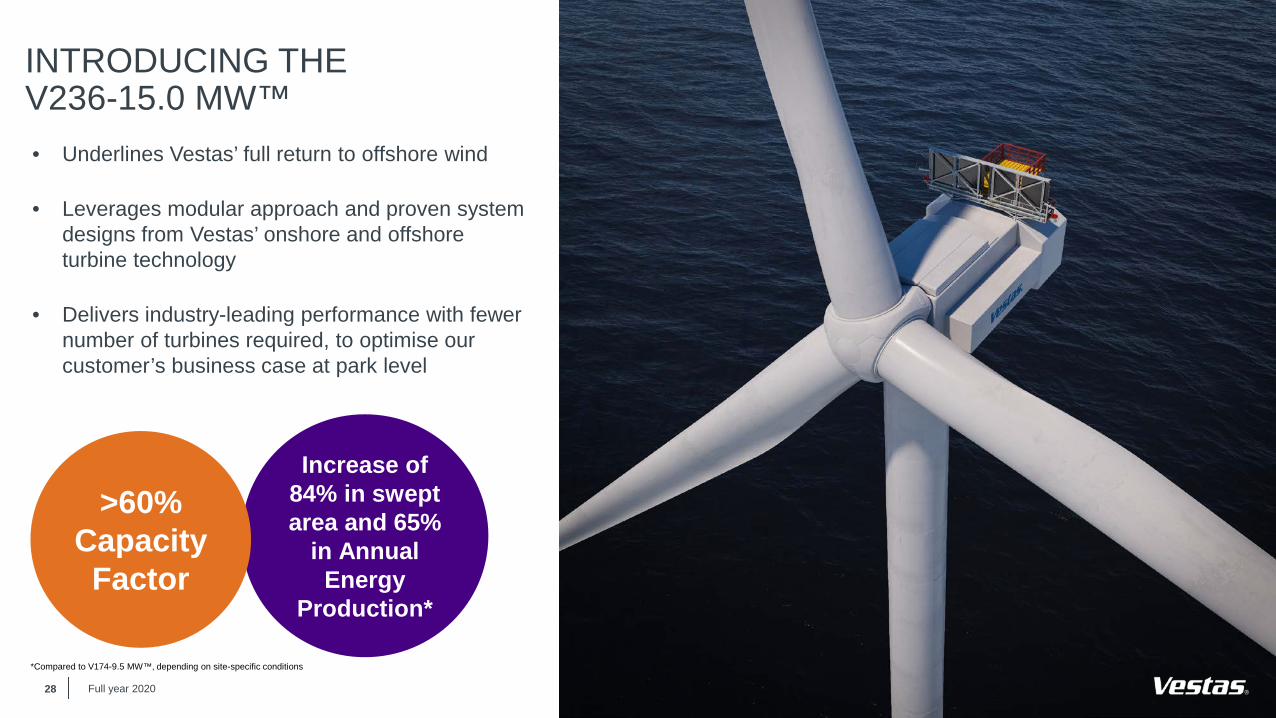
INTRODUCING THE V236-15.0 MW™• Underlines Vestas’ full return to offshore wind
• Leverages modular approach and proven system designs from Vestas’ onshore and offshore turbine technology
• Delivers industry-leading performance with fewer number of turbines required, to optimise our customer’s business case at park level
28
Increase of 84% in swept area and 65%
in Annual Energy
Production*
>60% Capacity Factor
*Compared to V174-9.5 MW™, depending on site-specific conditions
Full year 2020
Classification: Public29
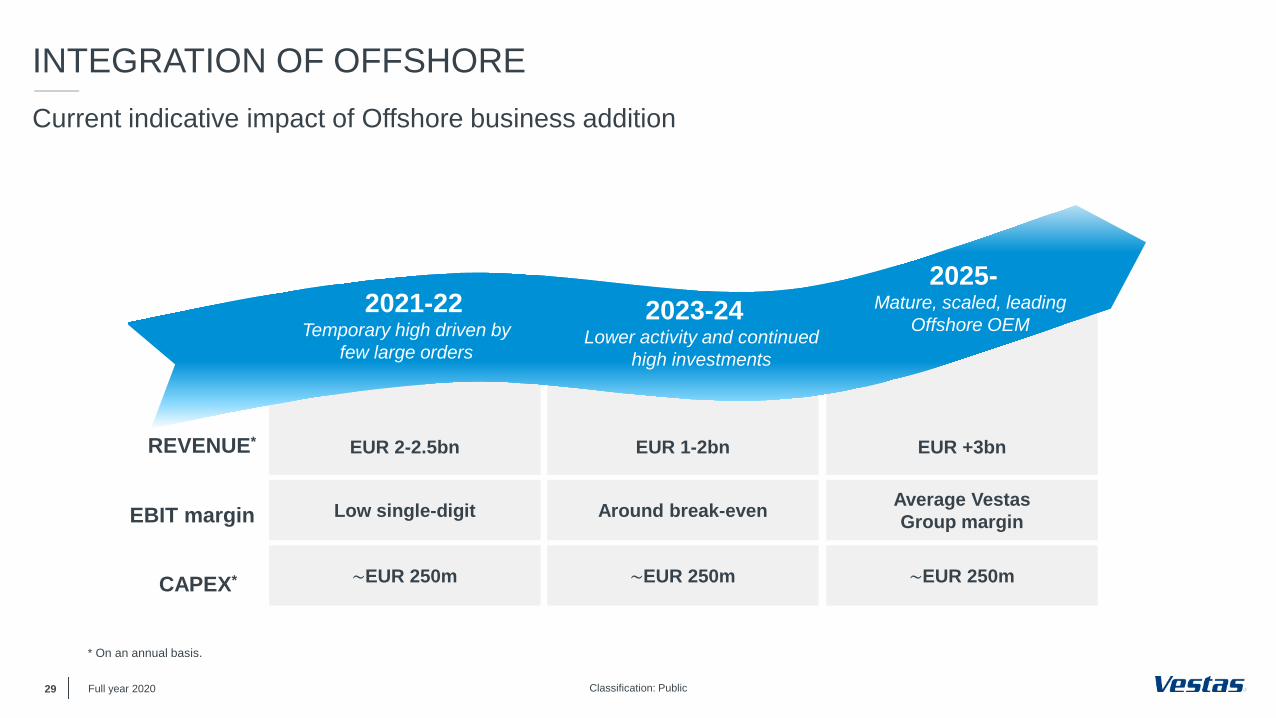
INTEGRATION OF OFFSHORE
Full year 2020
Current indicative impact of Offshore business addition
REVENUE*
EBIT margin
CAPEX*
EUR 2-2.5bn EUR 1-2bn EUR +3bn
Low single-digit Around break-even Average Vestas Group margin
~EUR 250m ~EUR 250m ~EUR 250m
2021-22Temporary high driven by
few large orders
2023-24Lower activity and continued
high investments
2025-Mature, scaled, leading
Offshore OEM
* On an annual basis.
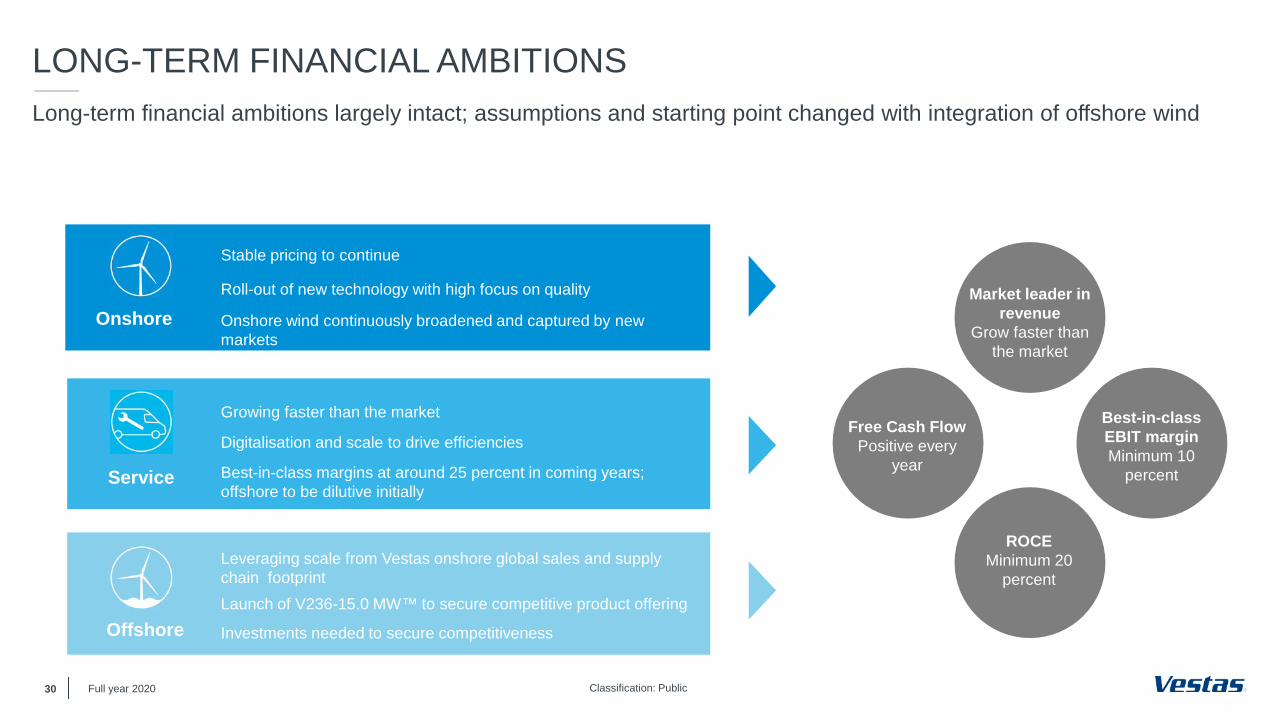
Classification: Public30
LONG-TERM FINANCIAL AMBITIONSLong-term financial ambitions largely intact; assumptions and starting point changed with integration of offshore wind
Full year 2020
Onshore
Service
Offshore
Stable pricing to continue
Roll-out of new technology with high focus on quality
Onshore wind continuously broadened and captured by new markets
Growing faster than the market
Digitalisation and scale to drive efficiencies
Best-in-class margins at around 25 percent in coming years; offshore to be dilutive initially
Leveraging scale from Vestas onshore global sales and supply chain footprintLaunch of V236-15.0 MW™ to secure competitive product offering
Investments needed to secure competitiveness
Long-term financial ambitions
Free Cash Flow
EBIT margin
ROCE
Market leader in revenue
Grow faster than the market
Best-in-classEBIT marginMinimum 10
percent
Free Cash FlowPositive every
year
ROCEMinimum 20
percent
Classification: PublicFull year 202031
Orders and markets
Financials
Strategy and market outlook
AGENDA
Outlook & Q&A
Classification: Public32
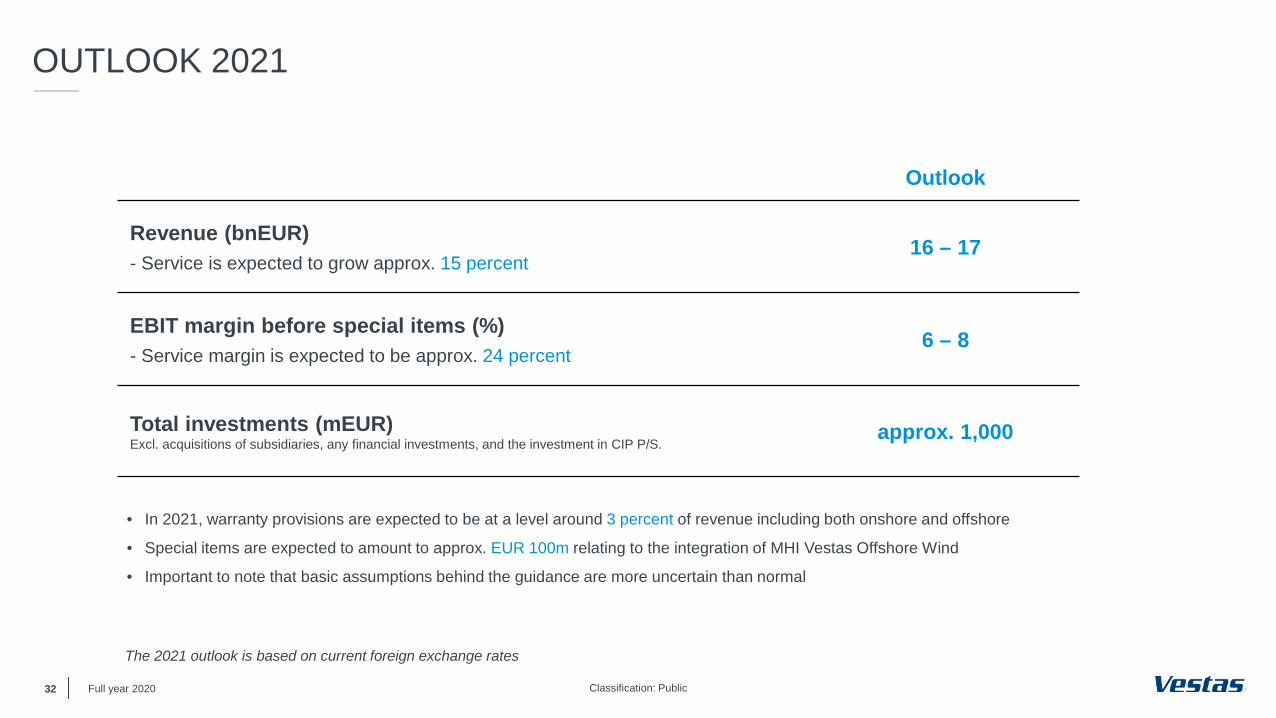
OUTLOOK 2021
Outlook
Revenue (bnEUR)- Service is expected to grow approx. 15 percent
16 – 17
EBIT margin before special items (%)- Service margin is expected to be approx. 24 percent
6 – 8
Total investments (mEUR)Excl. acquisitions of subsidiaries, any financial investments, and the investment in CIP P/S.
approx. 1,000
Full year 2020
The 2021 outlook is based on current foreign exchange rates
• In 2021, warranty provisions are expected to be at a level around 3 percent of revenue including both onshore and offshore
• Special items are expected to amount to approx. EUR 100m relating to the integration of MHI Vestas Offshore Wind
• Important to note that basic assumptions behind the guidance are more uncertain than normal
Classification: Public33
Q&AFinancial calendar 2021:
• Annual General Meeting 2021 (8 April)
• Disclosure of Q1 2021 (5 May)
• Disclosure of Q2 2021 (11 August)
• Disclosure of Q3 2021 (3 November)
Full year 2020
Copyright NoticeThe documents are created by Vestas Wind Systems A/S and contain copyrighted material, trademarks, and other proprietary information. All rights reserved. No part of the documents may be reproduced or copied in any form or by any means - such as graphic, electronic, or mechanical, including photocopying, taping, or information storage and retrieval systems without the prior written permission of Vestas Wind Systems A/S. The use of these documents by you, or anyone else authorized by you, is prohibited unless specifically permitted by Vestas Wind Systems A/S. You may not alter or remove any trademark, copyright or other notice from the documents. The documents are provided “as is" and Vestas Wind Systems A/S shall not have any responsibility or liability whatsoever for the results of use of the documents by you.
THANK YOU FOR YOUR ATTENTION