Embed Size (px)
Citation preview
Presented and delivered by UGL Copyright © 2016 All rights reserved
Monday, 22 August 2016
Full Year 2016 Results Presentation
2
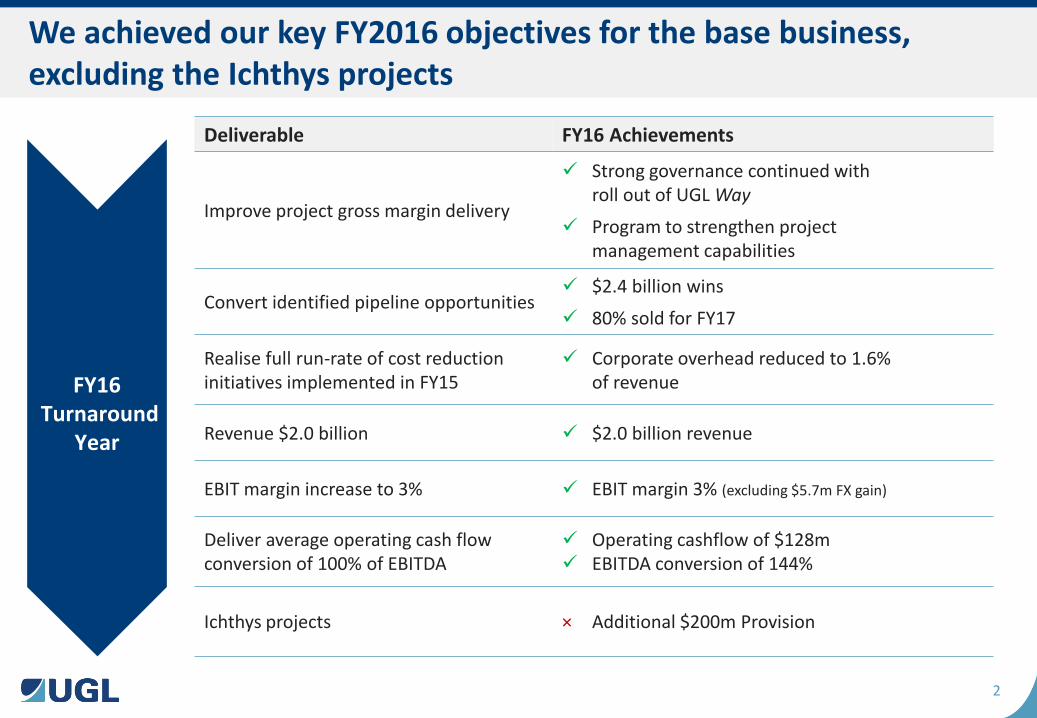
We achieved our key FY2016 objectives for the base business, excluding the Ichthys projects
FY16
Turnaround Year
Deliverable FY16 Achievements
Improve project gross margin delivery
Strong governance continued with roll out of UGL Way
Program to strengthen project management capabilities
Convert identified pipeline opportunities $2.4 billion wins
80% sold for FY17
Realise full run-rate of cost reduction initiatives implemented in FY15
Corporate overhead reduced to 1.6% of revenue
Revenue $2.0 billion $2.0 billion revenue
EBIT margin increase to 3% EBIT margin 3% (excluding $5.7m FX gain)
Deliver average operating cash flow conversion of 100% of EBITDA
Operating cashflow of $128m EBITDA conversion of 144%
Ichthys projects × Additional $200m Provision
3
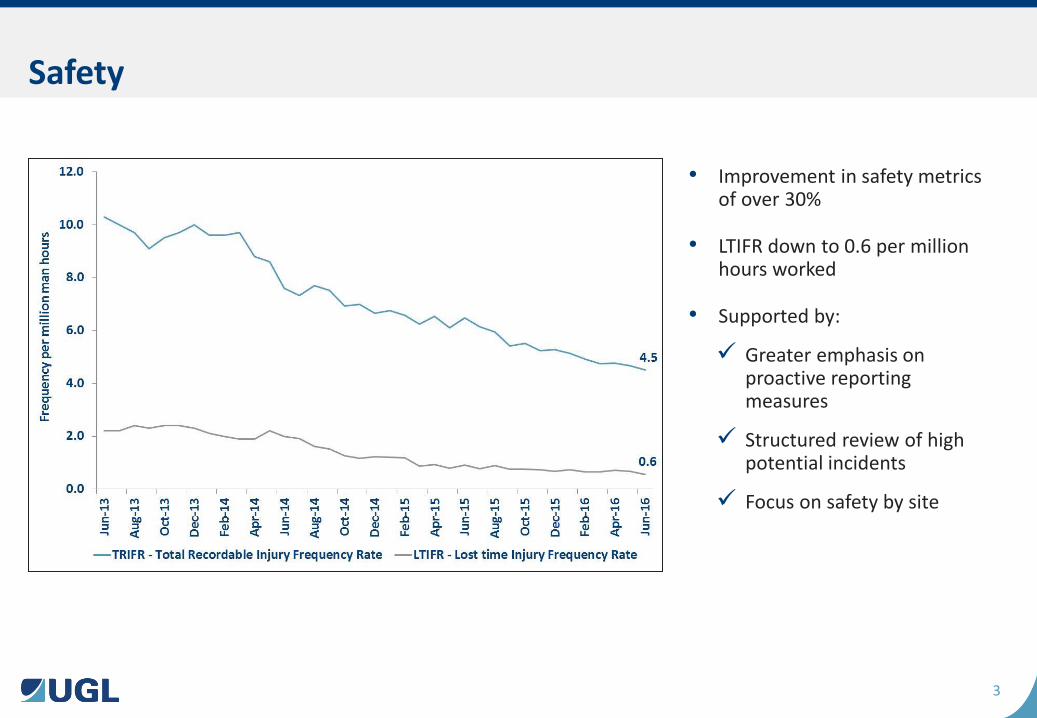
Safety
• Improvement in safety metrics of over 30%
• LTIFR down to 0.6 per million hours worked
• Supported by:
Greater emphasis on proactive reporting measures
Structured review of high potential incidents
Focus on safety by site
4
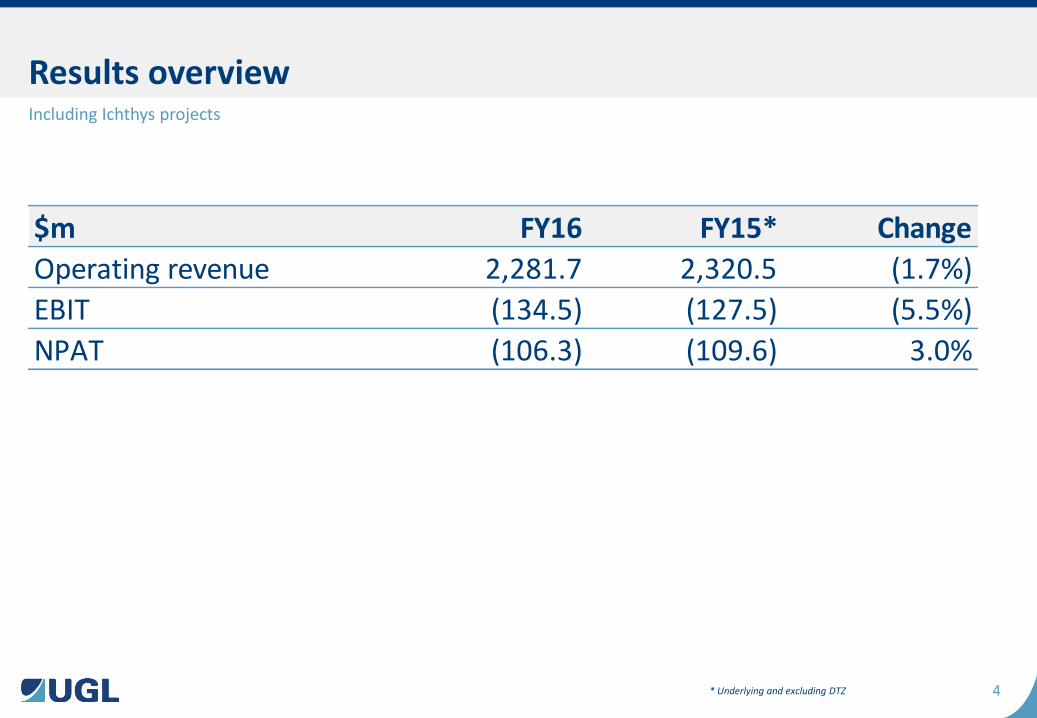
Results overview
* Underlying and excluding DTZ
Including Ichthys projects
$m FY16 FY15* Change
Operating revenue 2,281.7 2,320.5 (1.7%)
EBIT (134.5) (127.5) (5.5%)
NPAT (106.3) (109.6) 3.0%
5
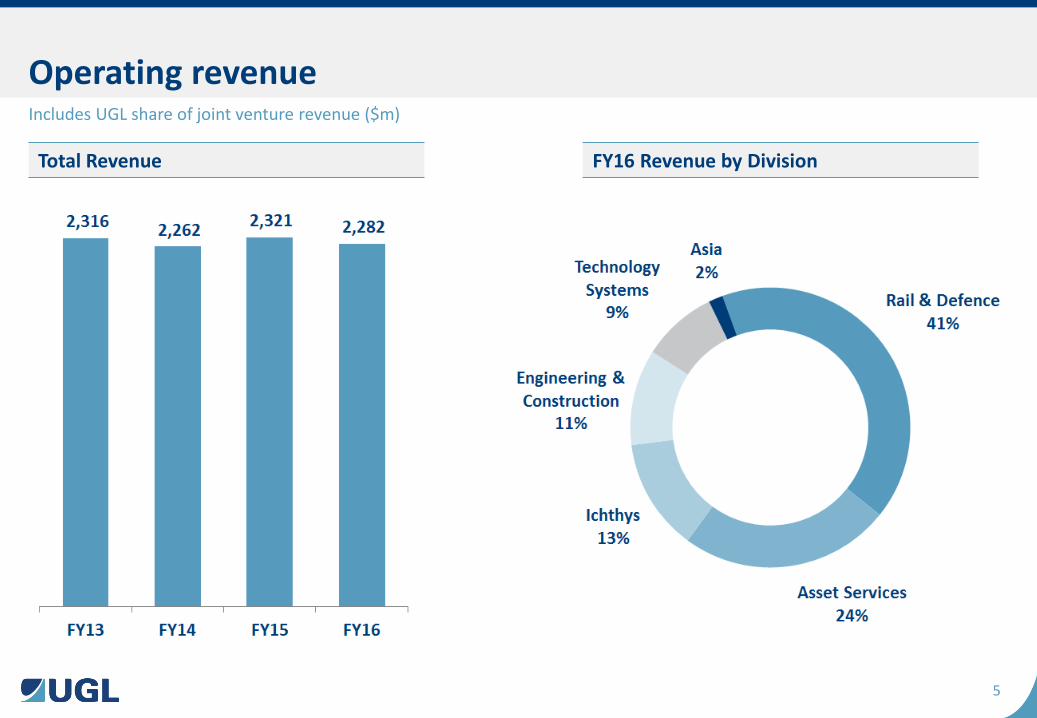
Operating revenue Includes UGL share of joint venture revenue ($m)
Total Revenue FY16 Revenue by Division

6
Update on Ichthys SMP and CCPP Projects
Ross Taylor
7
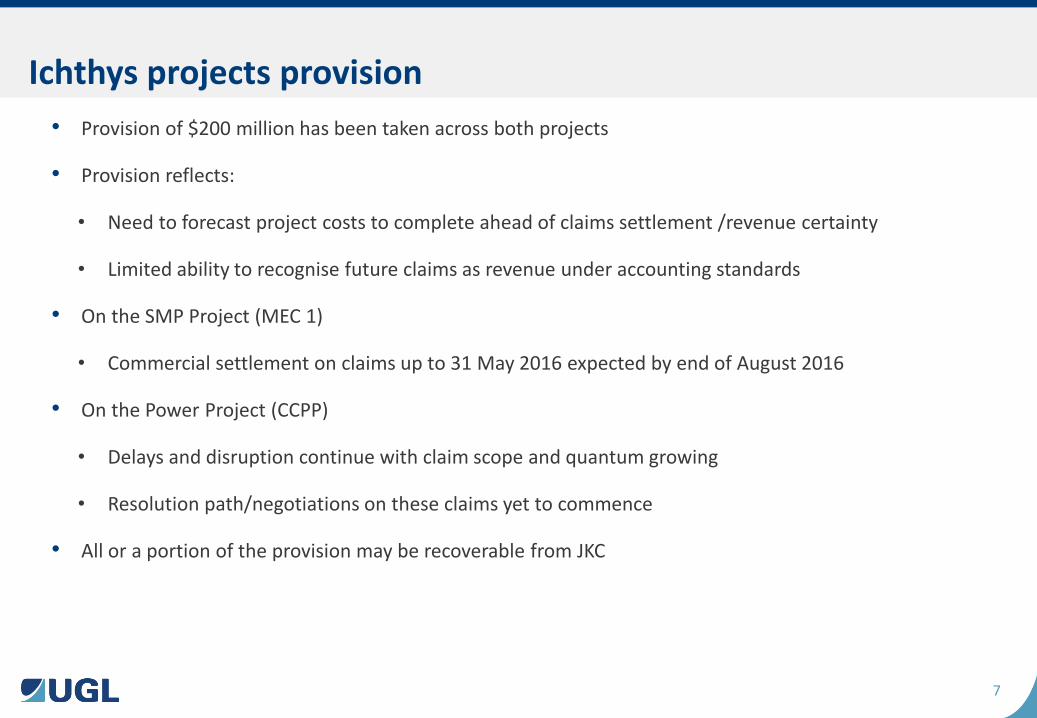
• Provision of $200 million has been taken across both projects
• Provision reflects:
• Need to forecast project costs to complete ahead of claims settlement /revenue certainty
• Limited ability to recognise future claims as revenue under accounting standards
• On the SMP Project (MEC 1)
• Commercial settlement on claims up to 31 May 2016 expected by end of August 2016
• On the Power Project (CCPP)
• Delays and disruption continue with claim scope and quantum growing
• Resolution path/negotiations on these claims yet to commence
• All or a portion of the provision may be recoverable from JKC
Ichthys projects provision
8
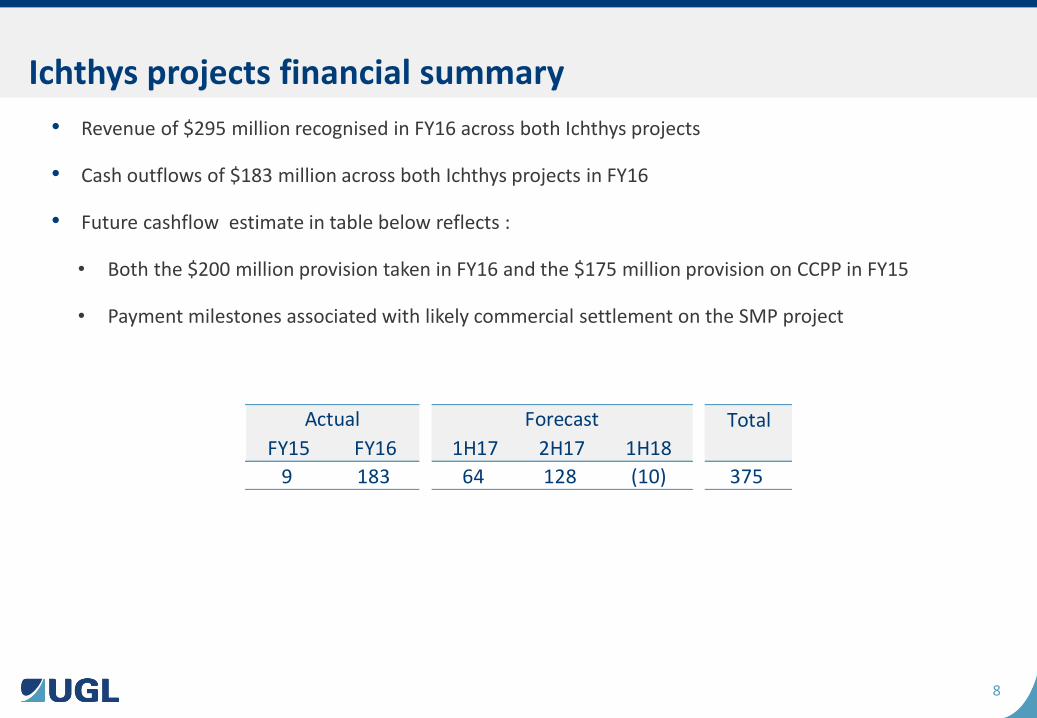
• Revenue of $295 million recognised in FY16 across both Ichthys projects
• Cash outflows of $183 million across both Ichthys projects in FY16
• Future cashflow estimate in table below reflects :
• Both the $200 million provision taken in FY16 and the $175 million provision on CCPP in FY15
• Payment milestones associated with likely commercial settlement on the SMP project
Ichthys projects financial summary
Total
FY15 FY16 1H17 2H17 1H18
9 183 64 128 (10) 375
Actual Forecast
9
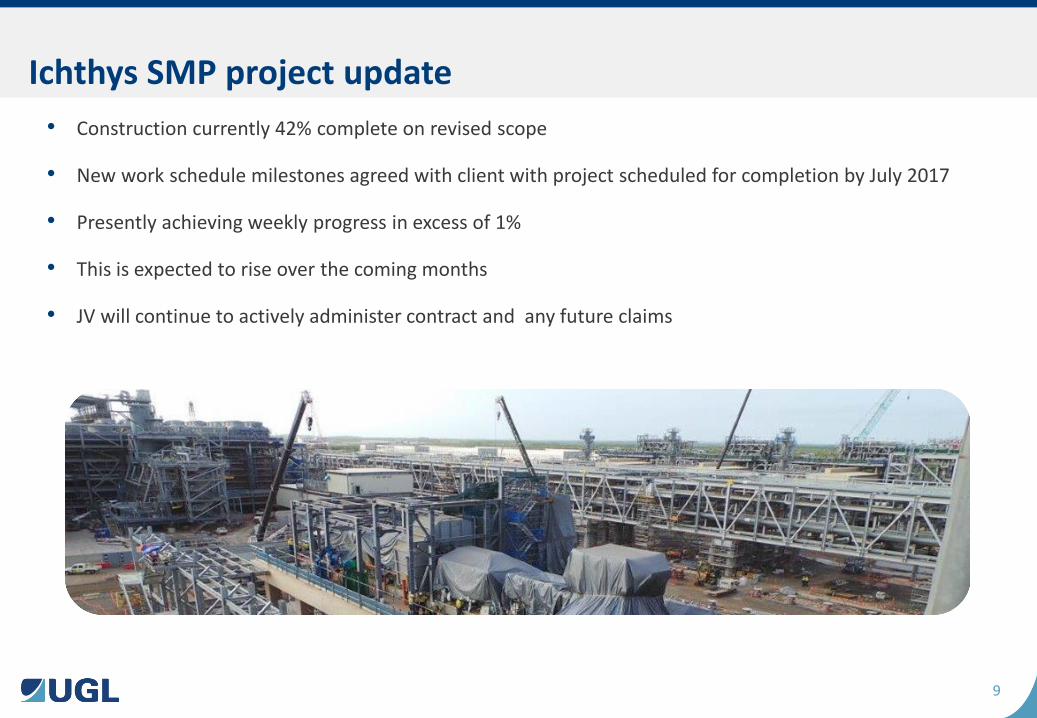
• Construction currently 42% complete on revised scope
• New work schedule milestones agreed with client with project scheduled for completion by July 2017
• Presently achieving weekly progress in excess of 1%
• This is expected to rise over the coming months
• JV will continue to actively administer contract and any future claims
Ichthys SMP project update
10
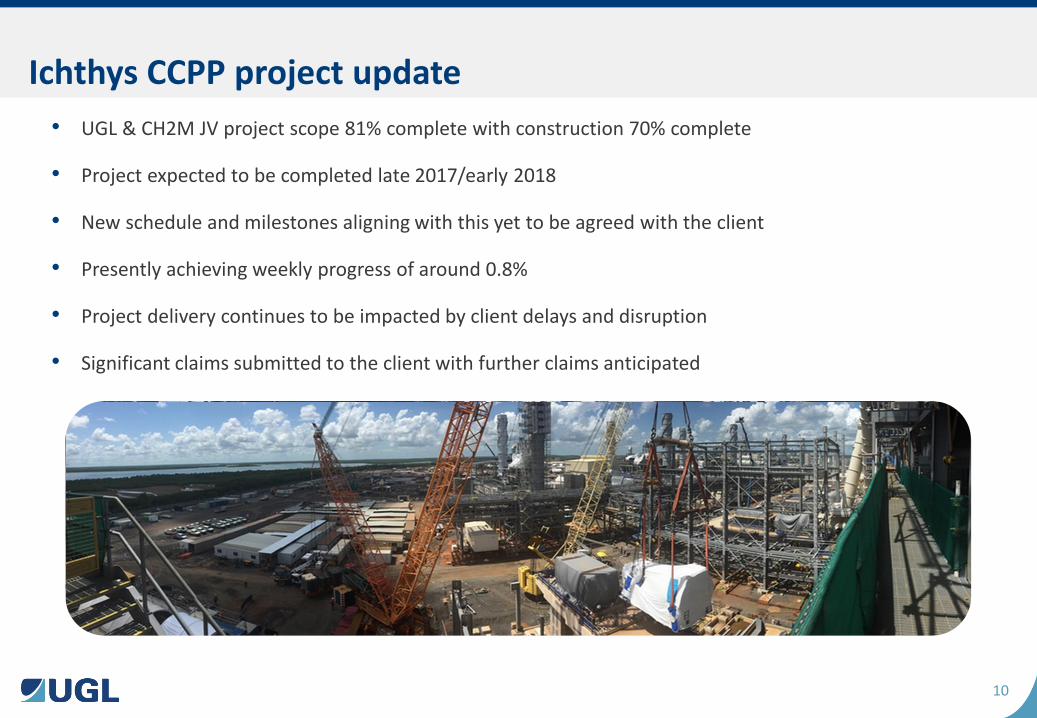
• UGL & CH2M JV project scope 81% complete with construction 70% complete
• Project expected to be completed late 2017/early 2018
• New schedule and milestones aligning with this yet to be agreed with the client
• Presently achieving weekly progress of around 0.8%
• Project delivery continues to be impacted by client delays and disruption
• Significant claims submitted to the client with further claims anticipated
Ichthys CCPP project update
11
FY2016 Results
Ross Taylor
12
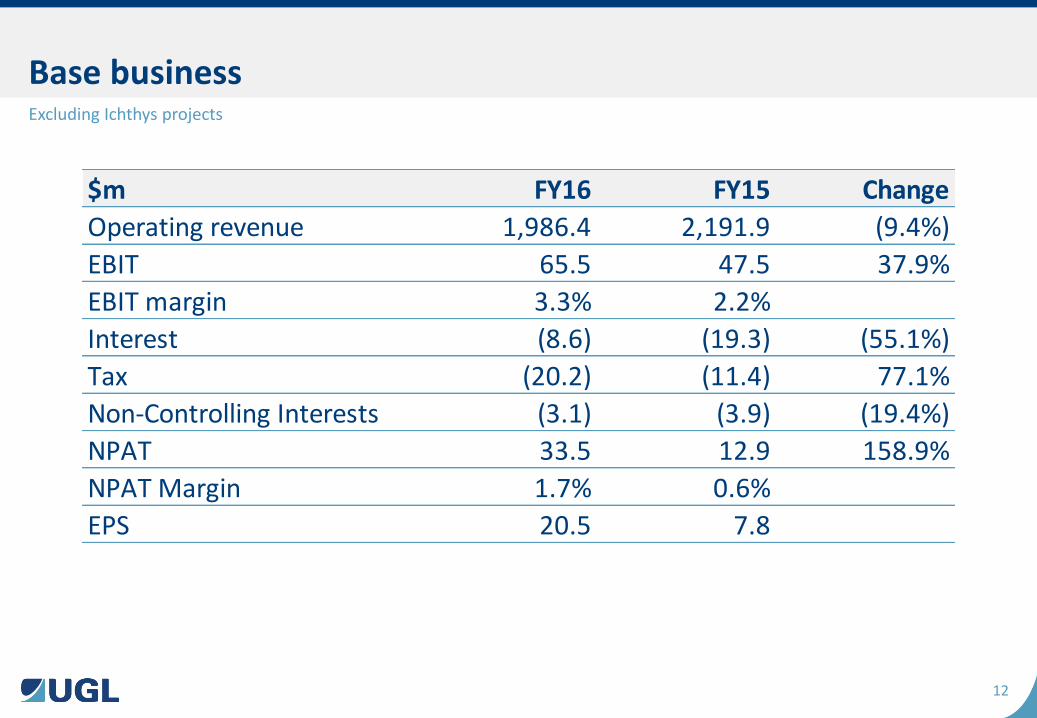
Base business Excluding Ichthys projects
$m FY16 FY15 Change
Operating revenue 1,986.4 2,191.9 (9.4%)
EBIT 65.5 47.5 37.9%
EBIT margin 3.3% 2.2%
Interest (8.6) (19.3) (55.1%)
Tax (20.2) (11.4) 77.1%
Non-Controlling Interests (3.1) (3.9) (19.4%)
NPAT 33.5 12.9 158.9%
NPAT Margin 1.7% 0.6%
EPS 20.5 7.8
13
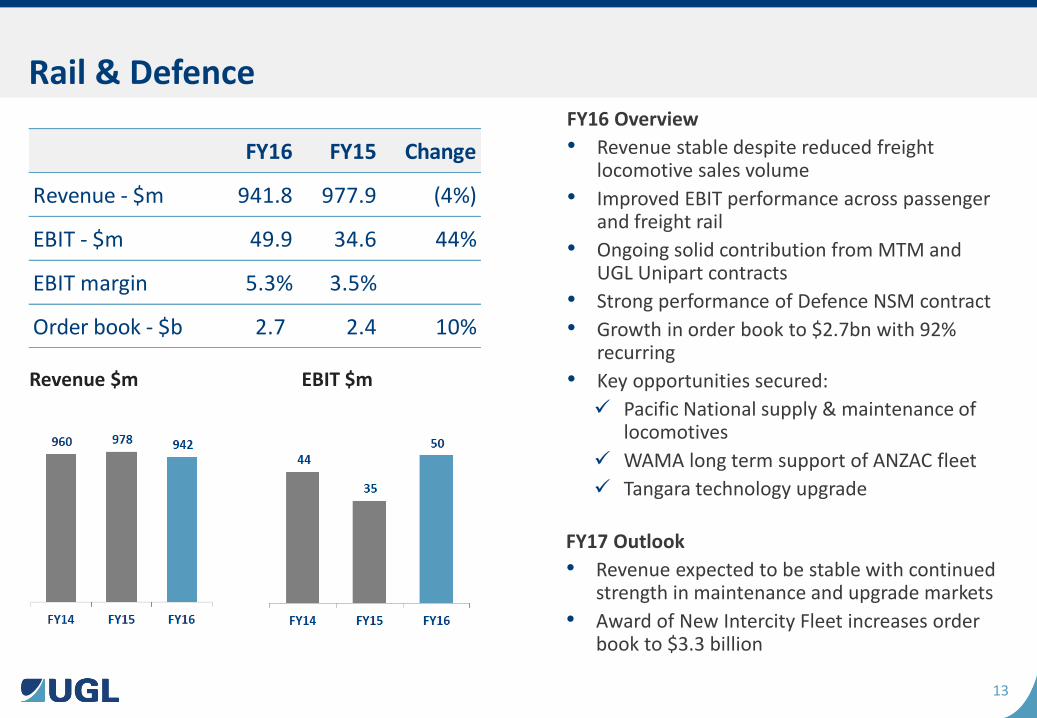
Rail & Defence FY16 Overview
• Revenue stable despite reduced freight locomotive sales volume
• Improved EBIT performance across passenger and freight rail
• Ongoing solid contribution from MTM and UGL Unipart contracts
• Strong performance of Defence NSM contract
• Growth in order book to $2.7bn with 92% recurring
• Key opportunities secured:
Pacific National supply & maintenance of locomotives
WAMA long term support of ANZAC fleet
Tangara technology upgrade
FY17 Outlook
• Revenue expected to be stable with continued strength in maintenance and upgrade markets
• Award of New Intercity Fleet increases order book to $3.3 billion
Revenue $m EBIT $m
FY16 FY15 Change
Revenue - $m 941.8 977.9 (4%)
EBIT - $m 49.9 34.6 44%
EBIT margin 5.3% 3.5%
Order book - $b 2.7 2.4 10%
14
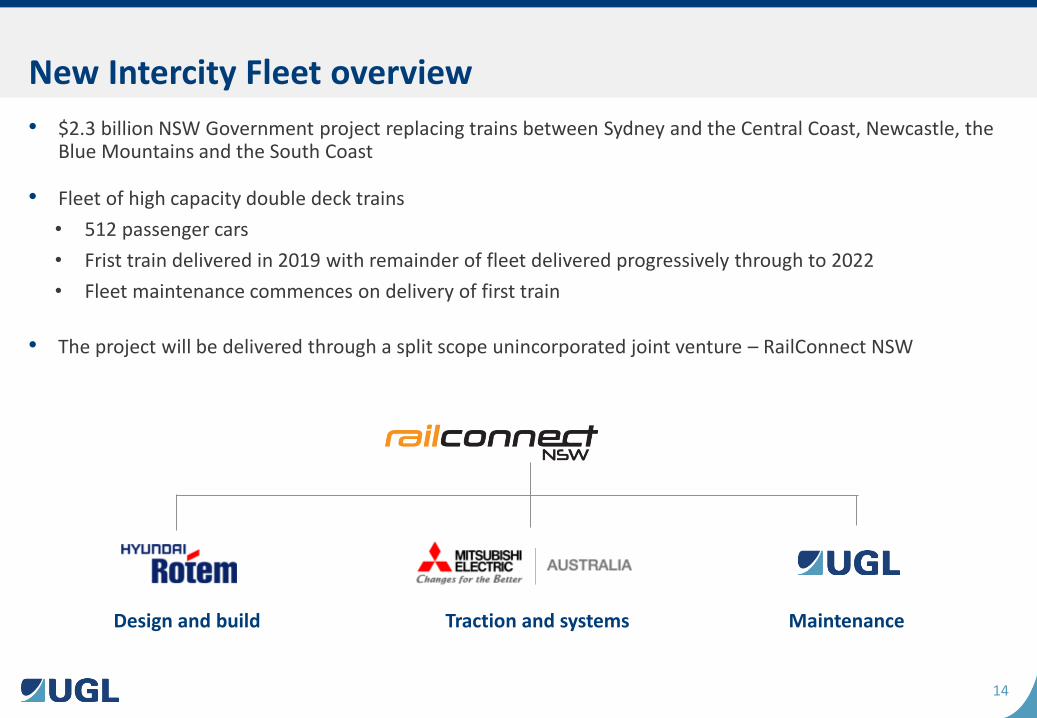
• $2.3 billion NSW Government project replacing trains between Sydney and the Central Coast, Newcastle, the Blue Mountains and the South Coast
• Fleet of high capacity double deck trains
• 512 passenger cars
• Frist train delivered in 2019 with remainder of fleet delivered progressively through to 2022
• Fleet maintenance commences on delivery of first train
• The project will be delivered through a split scope unincorporated joint venture – RailConnect NSW
New Intercity Fleet overview
Design and build Traction and systems Maintenance
15
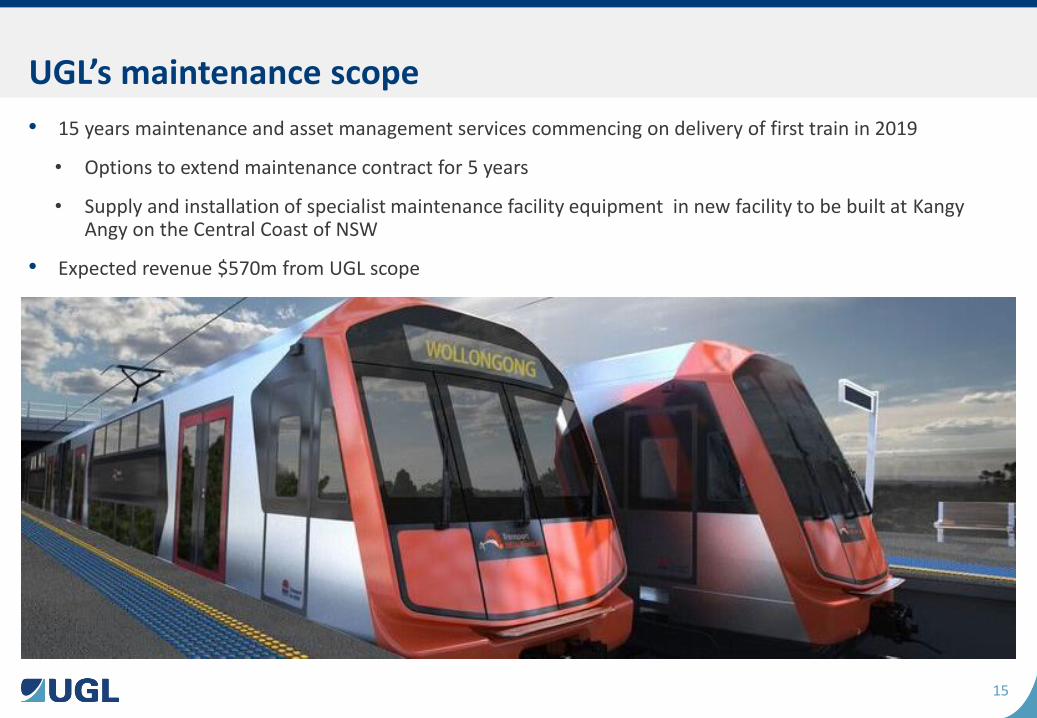
• 15 years maintenance and asset management services commencing on delivery of first train in 2019
• Options to extend maintenance contract for 5 years
• Supply and installation of specialist maintenance facility equipment in new facility to be built at Kangy Angy on the Central Coast of NSW
• Expected revenue $570m from UGL scope
UGL’s maintenance scope
16
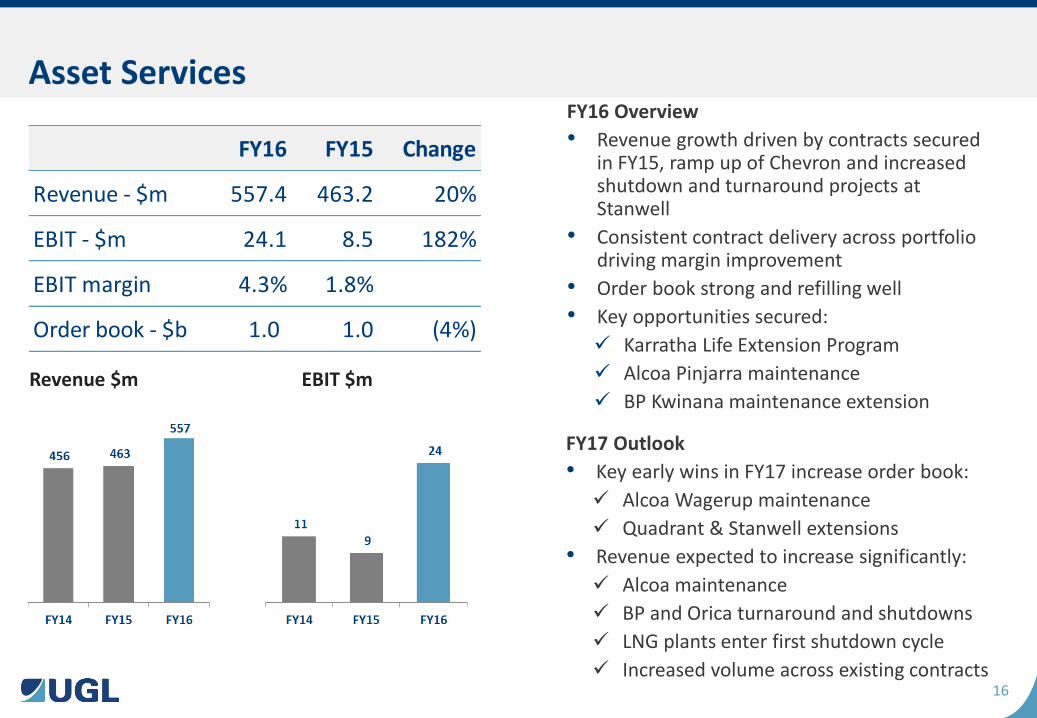
Asset Services FY16 Overview
• Revenue growth driven by contracts secured in FY15, ramp up of Chevron and increased shutdown and turnaround projects at Stanwell
• Consistent contract delivery across portfolio driving margin improvement
• Order book strong and refilling well
• Key opportunities secured:
Karratha Life Extension Program
Alcoa Pinjarra maintenance
BP Kwinana maintenance extension
FY17 Outlook
• Key early wins in FY17 increase order book:
Alcoa Wagerup maintenance
Quadrant & Stanwell extensions
• Revenue expected to increase significantly:
Alcoa maintenance
BP and Orica turnaround and shutdowns
LNG plants enter first shutdown cycle
Increased volume across existing contracts
Revenue $m EBIT $m
FY16 FY15 Change
Revenue - $m 557.4 463.2 20%
EBIT - $m 24.1 8.5 182%
EBIT margin 4.3% 1.8%
Order book - $b 1.0 1.0 (4%)
17
Technology Systems
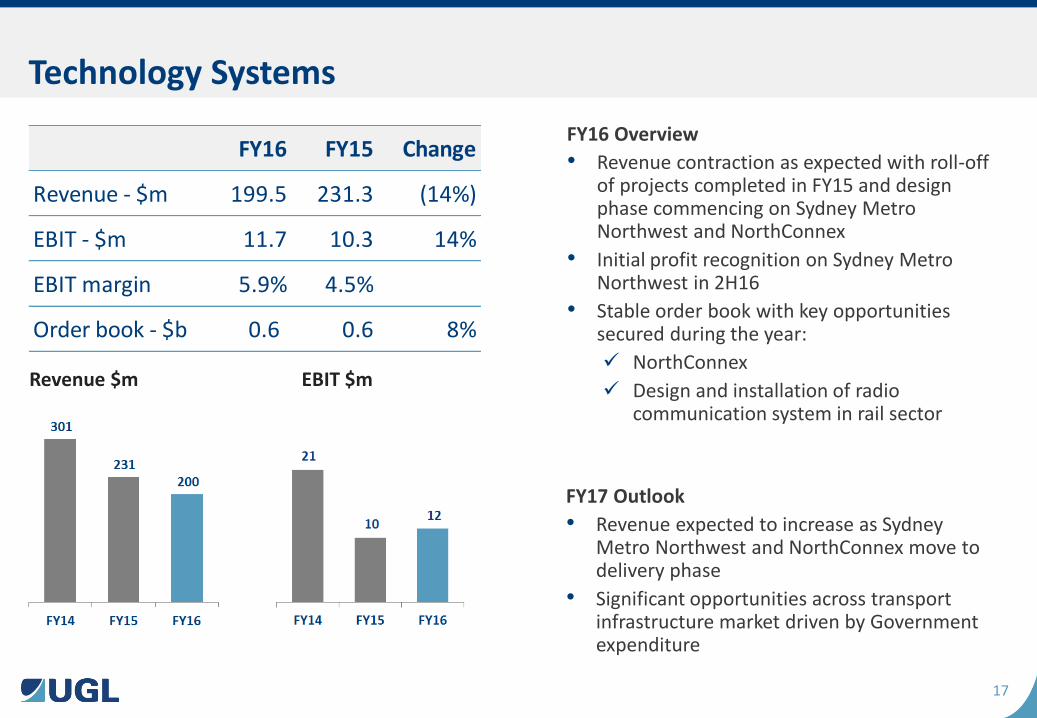
FY16 Overview
• Revenue contraction as expected with roll-off of projects completed in FY15 and design phase commencing on Sydney Metro Northwest and NorthConnex
• Initial profit recognition on Sydney Metro Northwest in 2H16
• Stable order book with key opportunities secured during the year:
NorthConnex
Design and installation of radio communication system in rail sector
FY17 Outlook
• Revenue expected to increase as Sydney Metro Northwest and NorthConnex move to delivery phase
• Significant opportunities across transport infrastructure market driven by Government expenditure
Revenue $m EBIT $m
FY16 FY15 Change
Revenue - $m 199.5 231.3 (14%)
EBIT - $m 11.7 10.3 14%
EBIT margin 5.9% 4.5%
Order book - $b 0.6 0.6 8%
18
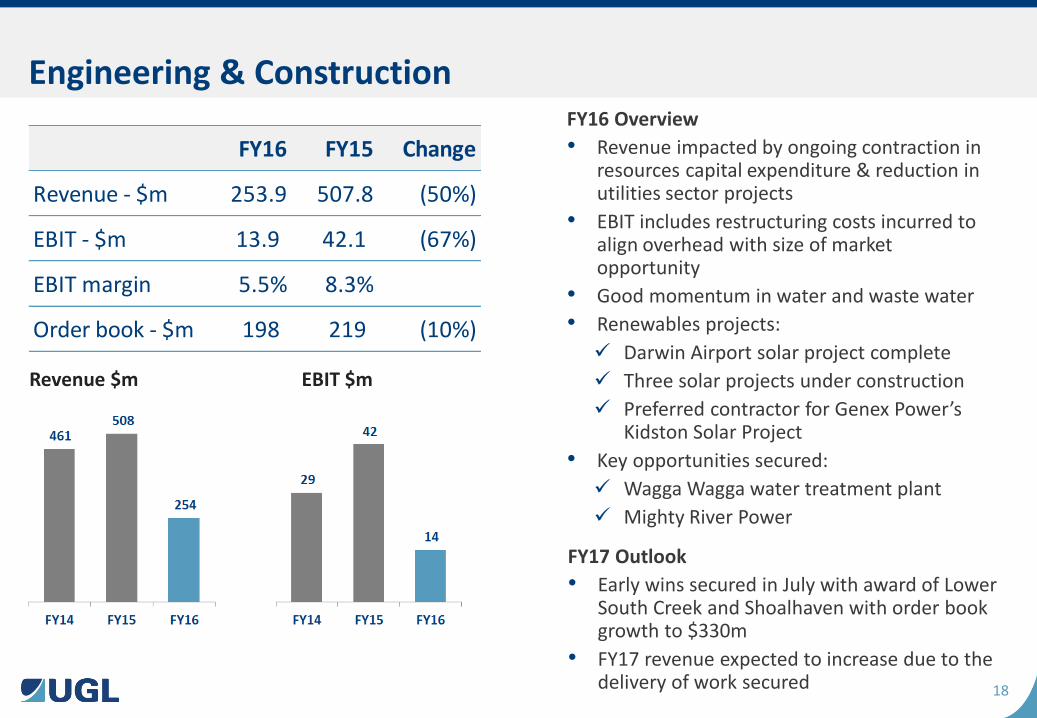
Engineering & Construction FY16 Overview
• Revenue impacted by ongoing contraction in resources capital expenditure & reduction in utilities sector projects
• EBIT includes restructuring costs incurred to align overhead with size of market opportunity
• Good momentum in water and waste water
• Renewables projects:
Darwin Airport solar project complete
Three solar projects under construction
Preferred contractor for Genex Power’s Kidston Solar Project
• Key opportunities secured:
Wagga Wagga water treatment plant
Mighty River Power
FY17 Outlook
• Early wins secured in July with award of Lower South Creek and Shoalhaven with order book growth to $330m
• FY17 revenue expected to increase due to the delivery of work secured
Revenue $m EBIT $m
FY16 FY15 Change
Revenue - $m 253.9 507.8 (50%)
EBIT - $m 13.9 42.1 (67%)
EBIT margin 5.5% 8.3%
Order book - $m 198 219 (10%)
19
Asia
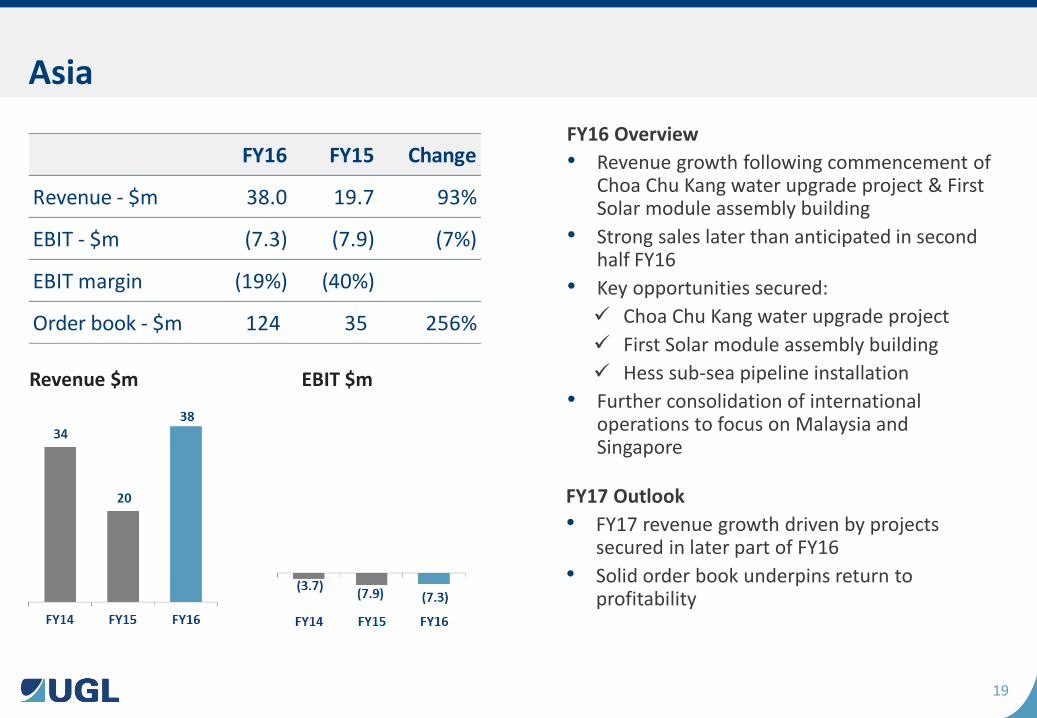
FY16 Overview
• Revenue growth following commencement of Choa Chu Kang water upgrade project & First Solar module assembly building
• Strong sales later than anticipated in second half FY16
• Key opportunities secured:
Choa Chu Kang water upgrade project
First Solar module assembly building
Hess sub-sea pipeline installation
• Further consolidation of international operations to focus on Malaysia and Singapore
FY17 Outlook
• FY17 revenue growth driven by projects secured in later part of FY16
• Solid order book underpins return to profitability
Revenue $m EBIT $m
FY16 FY15 Change
Revenue - $m 38.0 19.7 93%
EBIT - $m (7.3) (7.9) (7%)
EBIT margin (19%) (40%)
Order book - $m 124 35 256%
20
Financial Analysis
Ray Church
21
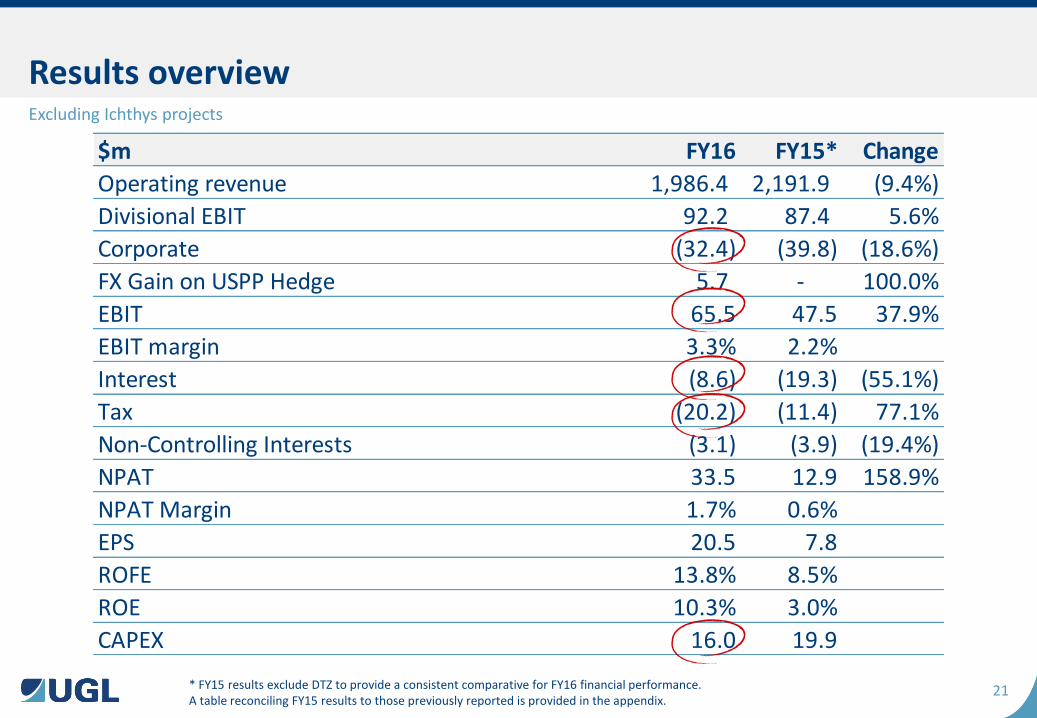
$m FY16 FY15* Change
Operating revenue 1,986.4 2,191.9 (9.4%)
Divisional EBIT 92.2 87.4 5.6%
Corporate (32.4) (39.8) (18.6%)
FX Gain on USPP Hedge 5.7 - 100.0%
EBIT 65.5 47.5 37.9%
EBIT margin 3.3% 2.2%
Interest (8.6) (19.3) (55.1%)
Tax (20.2) (11.4) 77.1%
Non-Controlling Interests (3.1) (3.9) (19.4%)
NPAT 33.5 12.9 158.9%
NPAT Margin 1.7% 0.6%
EPS 20.5 7.8
ROFE 13.8% 8.5%
ROE 10.3% 3.0%
CAPEX 16.0 19.9
Results overview Excluding Ichthys projects
* FY15 results exclude DTZ to provide a consistent comparative for FY16 financial performance. A table reconciling FY15 results to those previously reported is provided in the appendix.
22
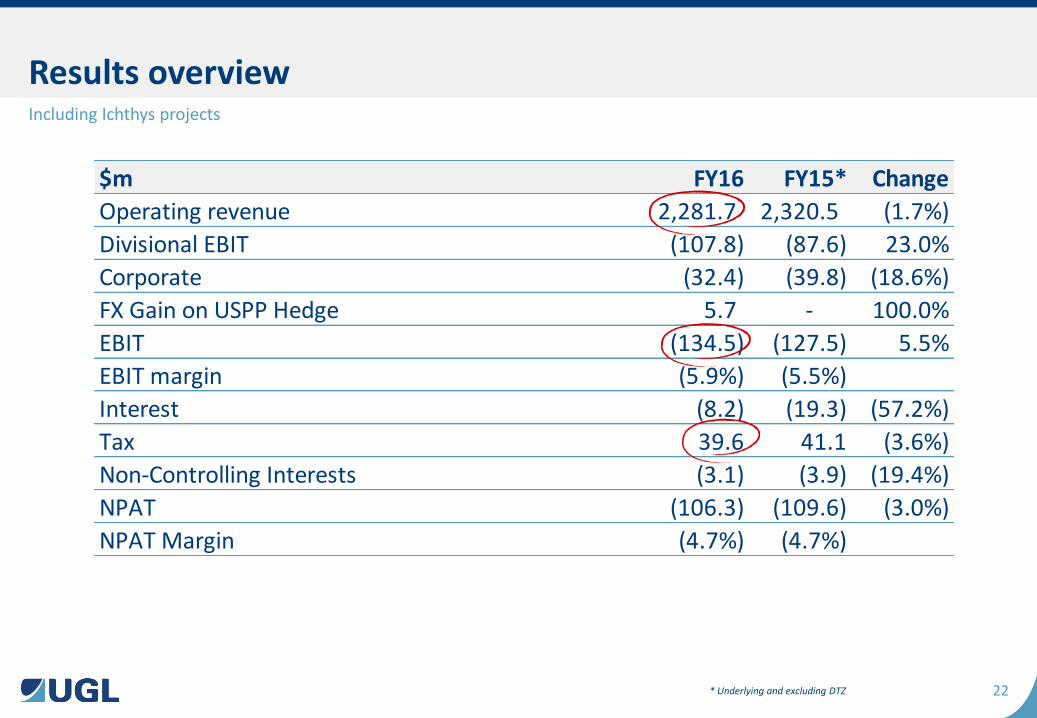
$m FY16 FY15* Change
Operating revenue 2,281.7 2,320.5 (1.7%)
Divisional EBIT (107.8) (87.6) 23.0%
Corporate (32.4) (39.8) (18.6%)
FX Gain on USPP Hedge 5.7 - 100.0%
EBIT (134.5) (127.5) 5.5%
EBIT margin (5.9%) (5.5%)
Interest (8.2) (19.3) (57.2%)
Tax 39.6 41.1 (3.6%)
Non-Controlling Interests (3.1) (3.9) (19.4%)
NPAT (106.3) (109.6) (3.0%)
NPAT Margin (4.7%) (4.7%)
Results overview
* Underlying and excluding DTZ
Including Ichthys projects
23
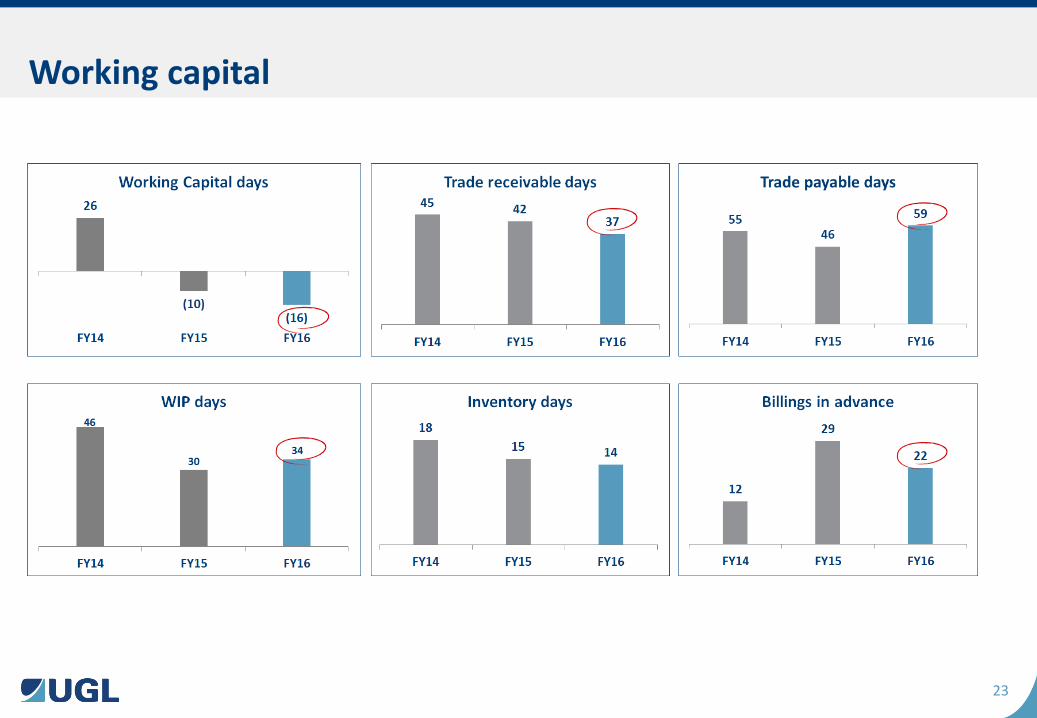
Working capital
24
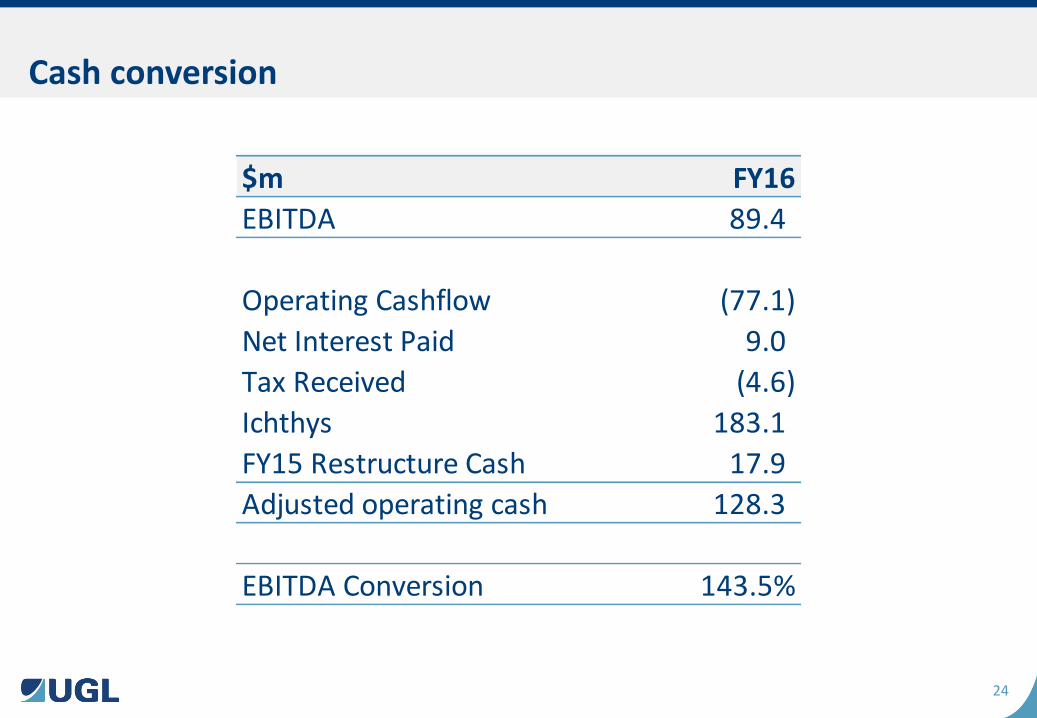
Cash conversion
$m FY16
EBITDA 89.4
Operating Cashflow (77.1)
Net Interest Paid 9.0
Tax Received (4.6)
Ichthys 183.1
FY15 Restructure Cash 17.9
Adjusted operating cash 128.3
EBITDA Conversion 143.5%

25
Net debt
26
• Net debt expected to peak at $175m-$215m around June 2017
$65m Net debt at commencement of FY2017
Base business average operating cash flow conversion 100% of EBITDA
Expected interest , capex & FY15 restructure cost outflows ~$50m
$192m Cash outflows on Ichthys projects during FY2017
• Net debt will decline during FY2018
Continued cash generation from base business
Ichthys projects completed and in commissioning
Base business cash flows more than sufficient to cover Ichthys project requirements
Debt and liquidity outlook
27
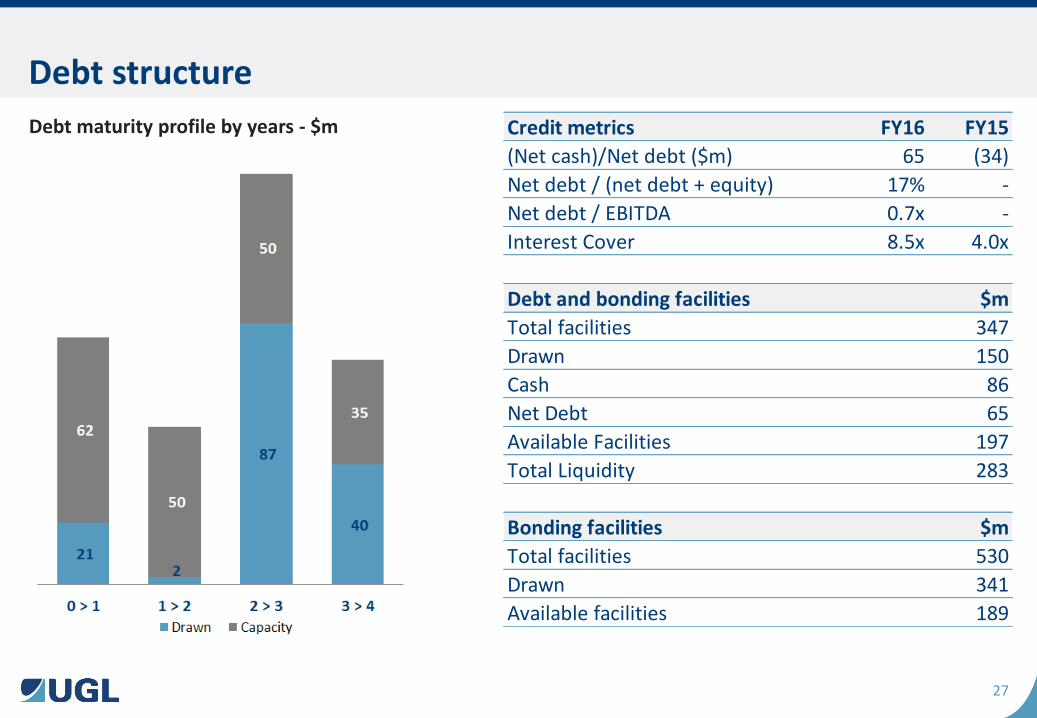
Debt structure
Debt maturity profile by years - $m Credit metrics FY16 FY15
(Net cash)/Net debt ($m) 65 (34)
Net debt / (net debt + equity) 17% -
Net debt / EBITDA 0.7x -
Interest Cover 8.5x 4.0x
Debt and bonding facilities $m
Total facilities 347
Drawn 150
Cash 86
Net Debt 65
Available Facilities 197
Total Liquidity 283
Bonding facilities $m
Total facilities 530
Drawn 341
Available facilities 189
28
• Complete UGL Way rollout and drive complete compliance across all front end disciplines
• Further embed and expand functionality of SAP for project/maintenance operations with greater site mobility
• Expand and systemise working capital forecast disciplines
• Create feedback loops from delivery to estimating disciplines
• Benchmark shared services and move towards first quartile performance
• Continue “corporatising” divisions for self management of Balance Sheets and delivery disciplines
Focus areas for FY17 – Complete the transition

29
Order Book & Pipeline
Ross Taylor
30
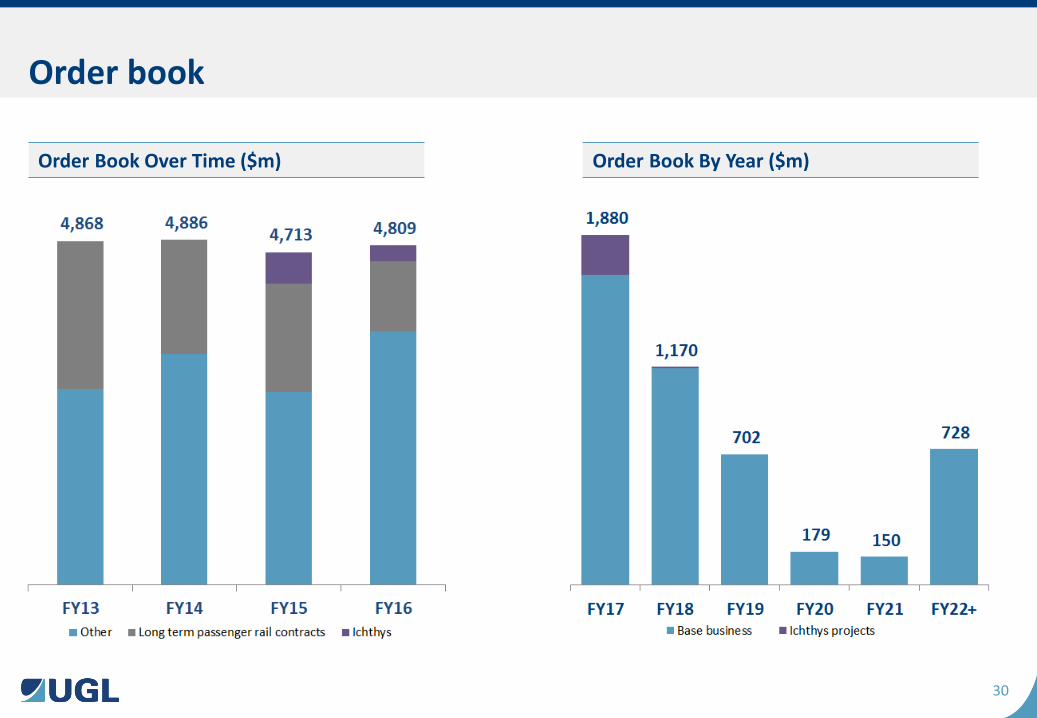
Order book
Order Book Over Time ($m) Order Book By Year ($m)
31
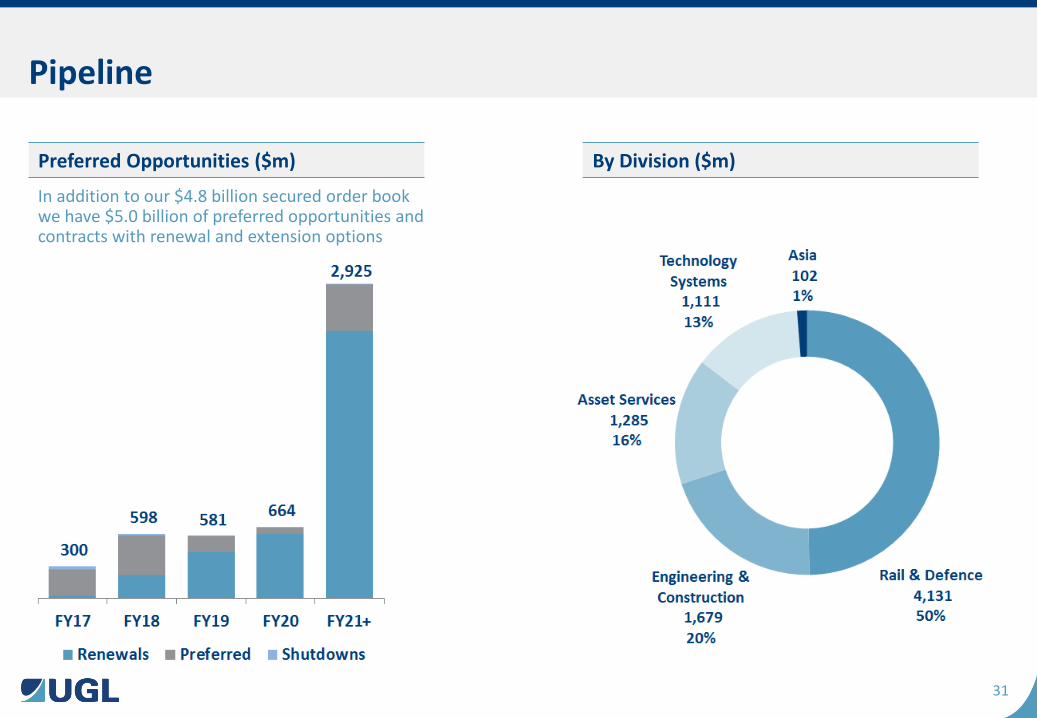
Pipeline
Preferred Opportunities ($m) By Division ($m)
In addition to our $4.8 billion secured order book we have $5.0 billion of preferred opportunities and contracts with renewal and extension options

Presented and delivered by UGL Copyright © 2016 All rights reserved
Outlook
Ross Taylor
33
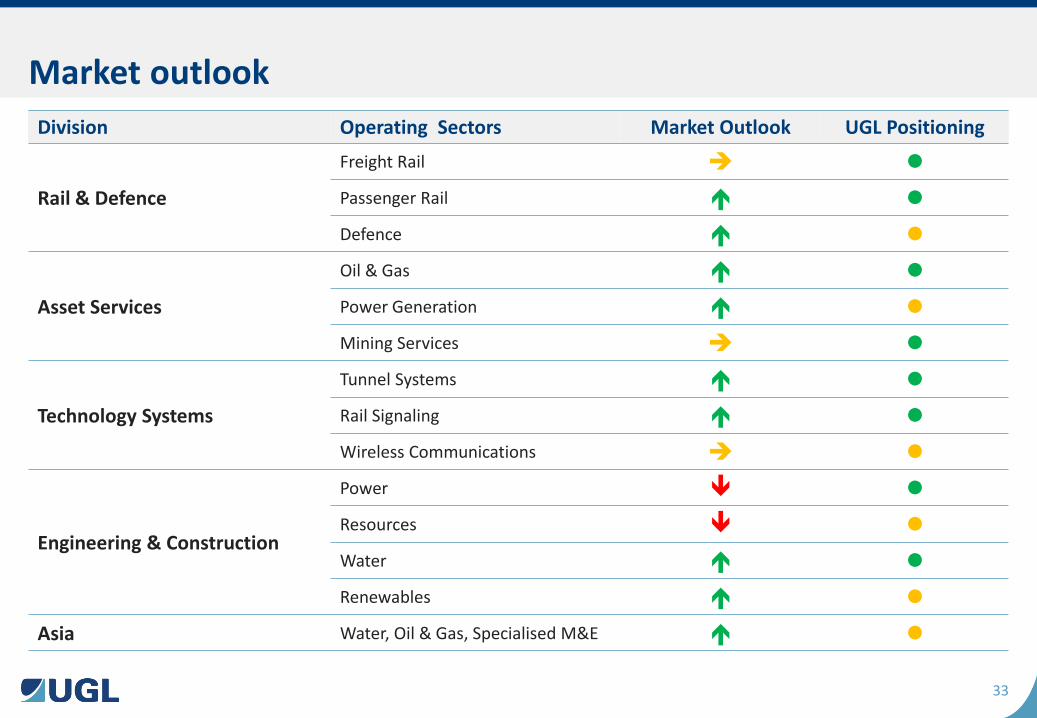
Market outlook
Division Operating Sectors Market Outlook UGL Positioning
Rail & Defence
Freight Rail
Passenger Rail
Defence
Asset Services
Oil & Gas
Power Generation
Mining Services
Technology Systems
Tunnel Systems
Rail Signaling
Wireless Communications
Engineering & Construction
Power
Resources
Water
Renewables
Asia Water, Oil & Gas, Specialised M&E
34
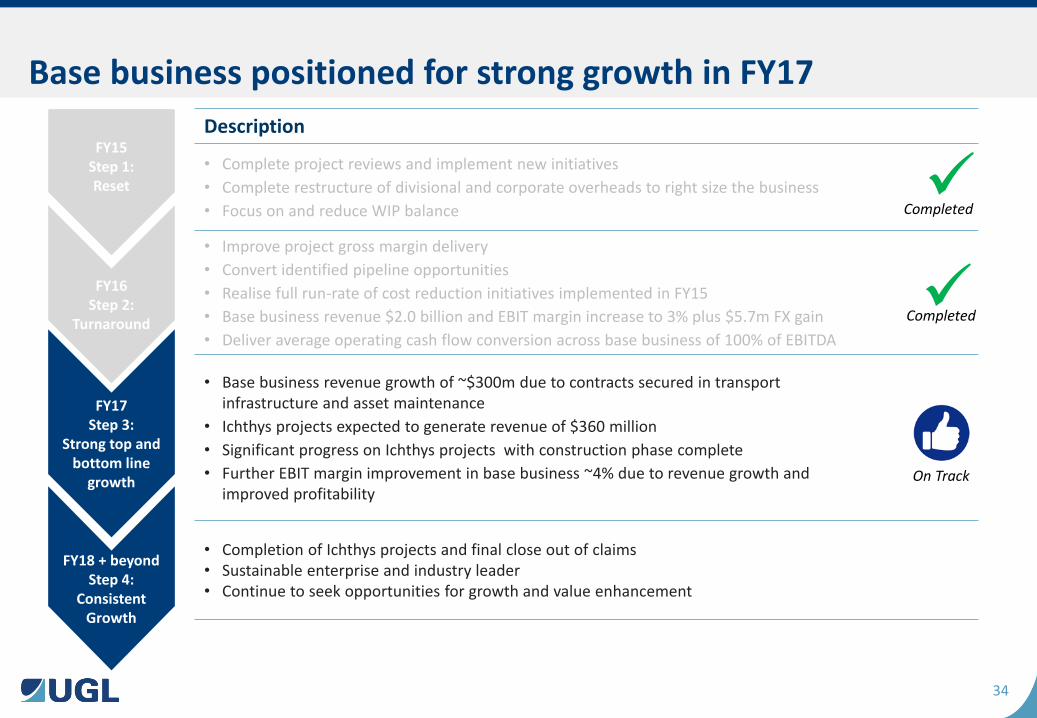
Base business positioned for strong growth in FY17
Description
• Complete project reviews and implement new initiatives
• Complete restructure of divisional and corporate overheads to right size the business
• Focus on and reduce WIP balance
• Improve project gross margin delivery
• Convert identified pipeline opportunities
• Realise full run-rate of cost reduction initiatives implemented in FY15
• Base business revenue $2.0 billion and EBIT margin increase to 3% plus $5.7m FX gain
• Deliver average operating cash flow conversion across base business of 100% of EBITDA
• Base business revenue growth of ~$300m due to contracts secured in transport infrastructure and asset maintenance
• Ichthys projects expected to generate revenue of $360 million
• Significant progress on Ichthys projects with construction phase complete
• Further EBIT margin improvement in base business ~4% due to revenue growth and improved profitability
• Completion of Ichthys projects and final close out of claims • Sustainable enterprise and industry leader • Continue to seek opportunities for growth and value enhancement
FY16
Step 2: Turnaround
FY17
Step 3: Strong top and
bottom line growth
FY18 + beyond
Step 4: Consistent
Growth
FY15 Step 1: Reset
Completed
On Track
Completed
35
Presented and delivered by UGL Copyright © 2016 All rights reserved
Appendices
37
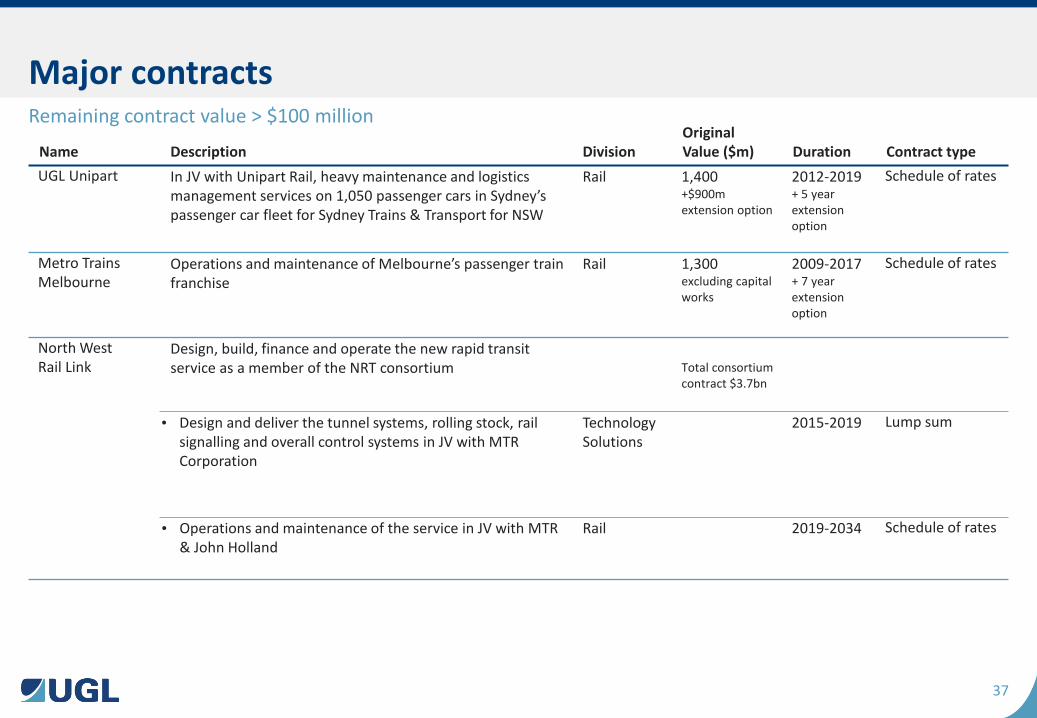
Name Description Division Original Value ($m) Duration Contract type
UGL Unipart In JV with Unipart Rail, heavy maintenance and logistics management services on 1,050 passenger cars in Sydney’s passenger car fleet for Sydney Trains & Transport for NSW
Rail 1,400 +$900m extension option
2012-2019 + 5 year extension option
Schedule of rates
Metro Trains Melbourne
Operations and maintenance of Melbourne’s passenger train franchise
Rail 1,300 excluding capital works
2009-2017 + 7 year extension option
Schedule of rates
North West Rail Link
Design, build, finance and operate the new rapid transit service as a member of the NRT consortium Total consortium
contract $3.7bn
• Design and deliver the tunnel systems, rolling stock, rail signalling and overall control systems in JV with MTR Corporation
Technology Solutions
2015-2019 Lump sum
• Operations and maintenance of the service in JV with MTR & John Holland
Rail 2019-2034 Schedule of rates
Major contracts Remaining contract value > $100 million
38
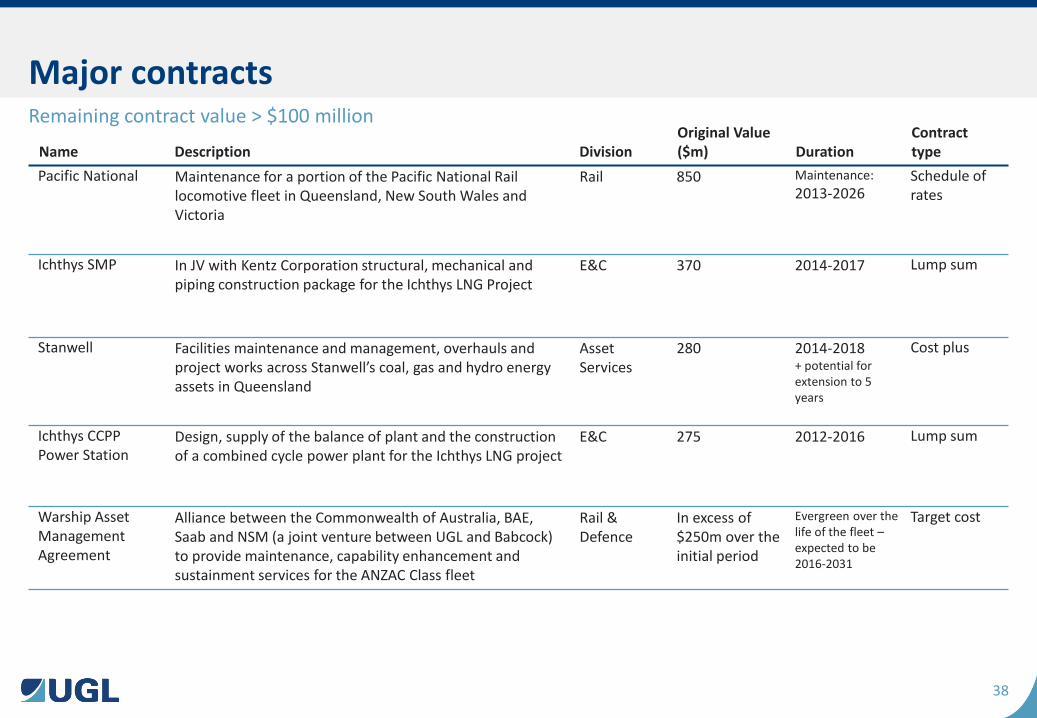
Name Description Division Original Value ($m) Duration
Contract type
Pacific National Maintenance for a portion of the Pacific National Rail locomotive fleet in Queensland, New South Wales and Victoria
Rail 850 Maintenance:
2013-2026 Schedule of rates
Ichthys SMP In JV with Kentz Corporation structural, mechanical and piping construction package for the Ichthys LNG Project
E&C 370 2014-2017 Lump sum
Stanwell Facilities maintenance and management, overhauls and project works across Stanwell’s coal, gas and hydro energy assets in Queensland
Asset Services
280 2014-2018 + potential for extension to 5 years
Cost plus
Ichthys CCPP Power Station
Design, supply of the balance of plant and the construction of a combined cycle power plant for the Ichthys LNG project
E&C 275 2012-2016 Lump sum
Warship Asset Management Agreement
Alliance between the Commonwealth of Australia, BAE, Saab and NSM (a joint venture between UGL and Babcock) to provide maintenance, capability enhancement and sustainment services for the ANZAC Class fleet
Rail & Defence
In excess of $250m over the initial period
Evergreen over the life of the fleet – expected to be 2016-2031
Target cost
Major contracts Remaining contract value > $100 million
39
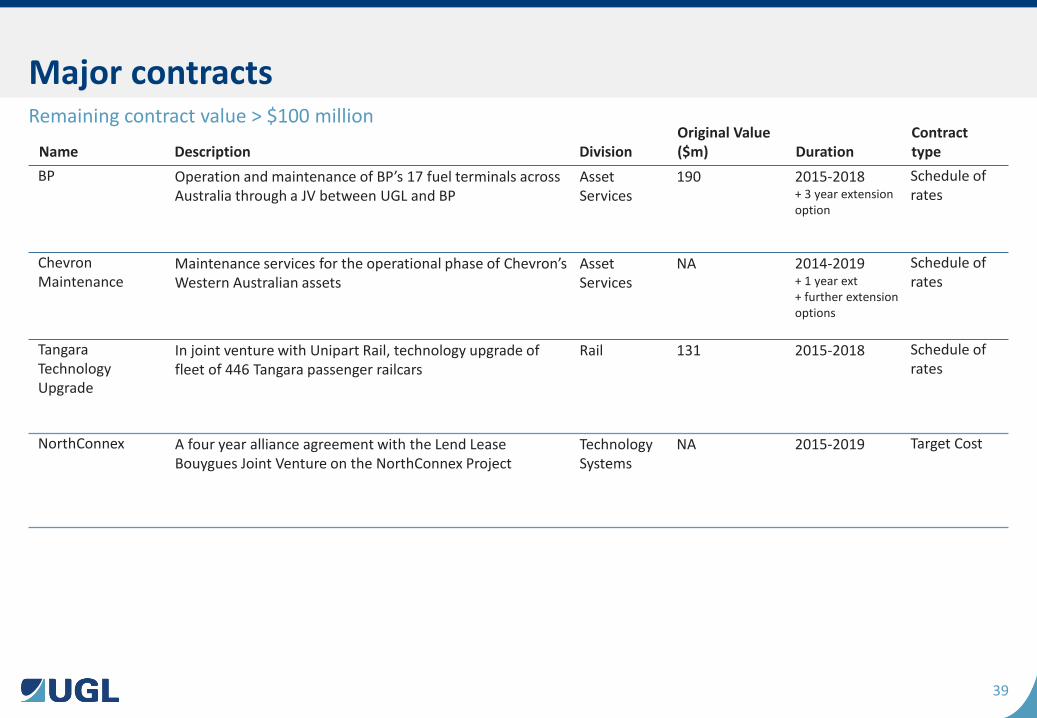
Name Description Division Original Value ($m) Duration
Contract type
BP Operation and maintenance of BP’s 17 fuel terminals across Australia through a JV between UGL and BP
Asset Services
190 2015-2018 + 3 year extension option
Schedule of rates
Chevron Maintenance
Maintenance services for the operational phase of Chevron’s Western Australian assets
Asset Services
NA 2014-2019 + 1 year ext + further extension options
Schedule of rates
Tangara Technology Upgrade
In joint venture with Unipart Rail, technology upgrade of fleet of 446 Tangara passenger railcars
Rail 131 2015-2018 Schedule of rates
NorthConnex A four year alliance agreement with the Lend Lease Bouygues Joint Venture on the NorthConnex Project
Technology Systems
NA 2015-2019 Target Cost
Major contracts Remaining contract value > $100 million
40
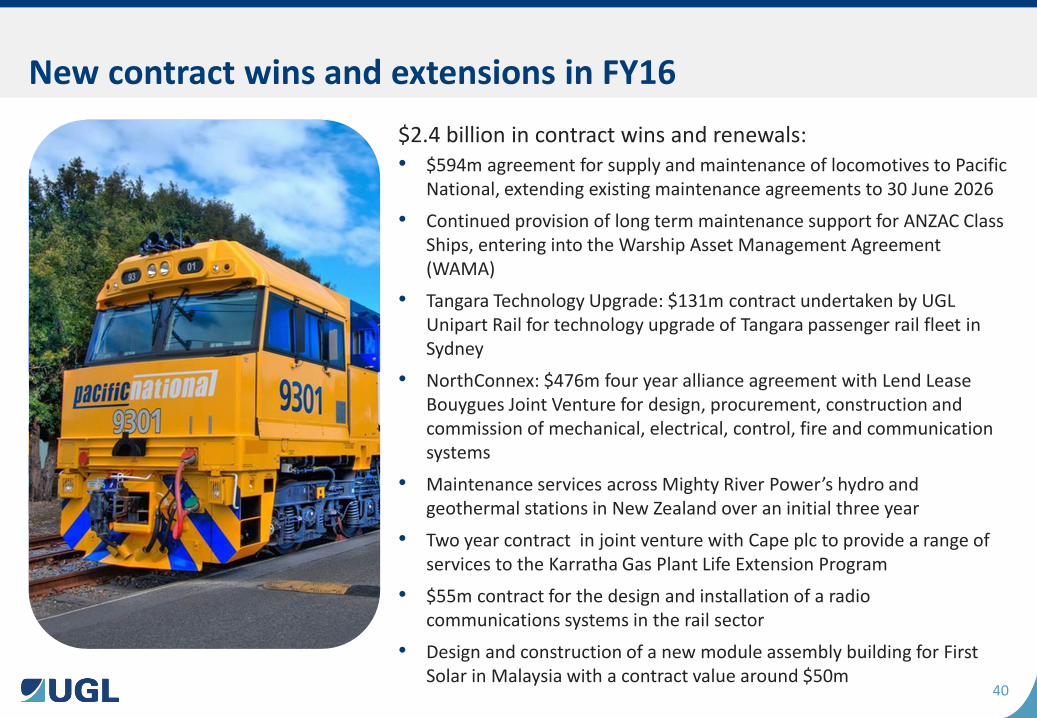
$2.4 billion in contract wins and renewals: • $594m agreement for supply and maintenance of locomotives to Pacific
National, extending existing maintenance agreements to 30 June 2026
• Continued provision of long term maintenance support for ANZAC Class Ships, entering into the Warship Asset Management Agreement (WAMA)
• Tangara Technology Upgrade: $131m contract undertaken by UGL Unipart Rail for technology upgrade of Tangara passenger rail fleet in Sydney
• NorthConnex: $476m four year alliance agreement with Lend Lease Bouygues Joint Venture for design, procurement, construction and commission of mechanical, electrical, control, fire and communication systems
• Maintenance services across Mighty River Power’s hydro and geothermal stations in New Zealand over an initial three year
• Two year contract in joint venture with Cape plc to provide a range of services to the Karratha Gas Plant Life Extension Program
• $55m contract for the design and installation of a radio communications systems in the rail sector
• Design and construction of a new module assembly building for First Solar in Malaysia with a contract value around $50m
New contract wins and extensions in FY16
41
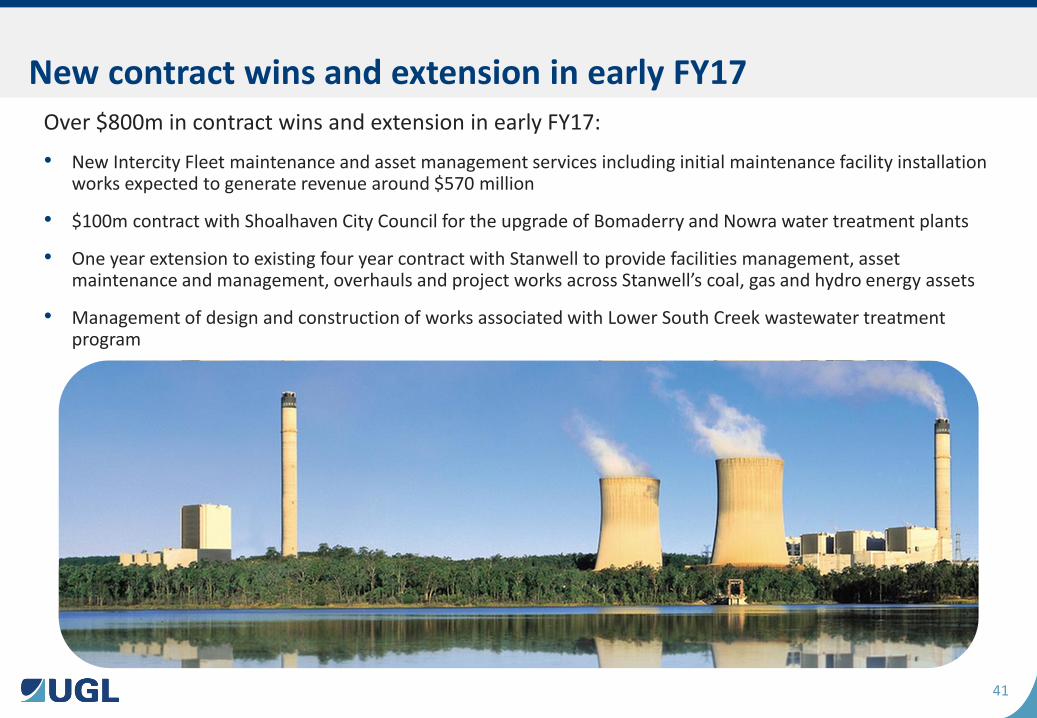
Over $800m in contract wins and extension in early FY17:
• New Intercity Fleet maintenance and asset management services including initial maintenance facility installation works expected to generate revenue around $570 million
• $100m contract with Shoalhaven City Council for the upgrade of Bomaderry and Nowra water treatment plants
• One year extension to existing four year contract with Stanwell to provide facilities management, asset maintenance and management, overhauls and project works across Stanwell’s coal, gas and hydro energy assets
• Management of design and construction of works associated with Lower South Creek wastewater treatment program
New contract wins and extension in early FY17
42
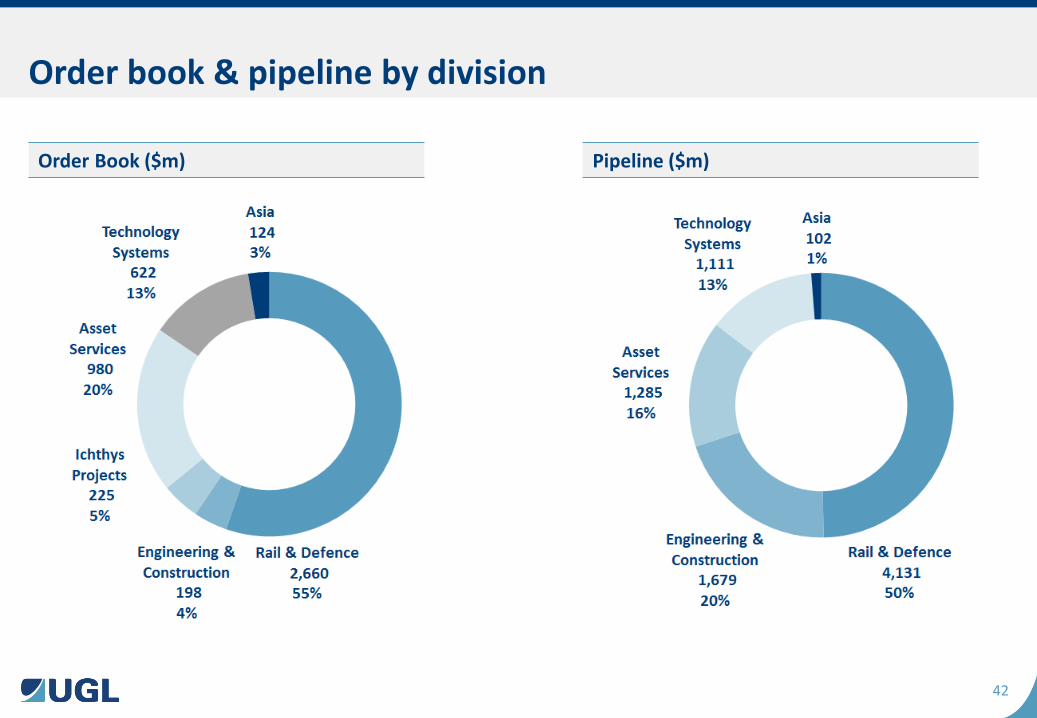
Order book & pipeline by division
Order Book ($m) Pipeline ($m)
43
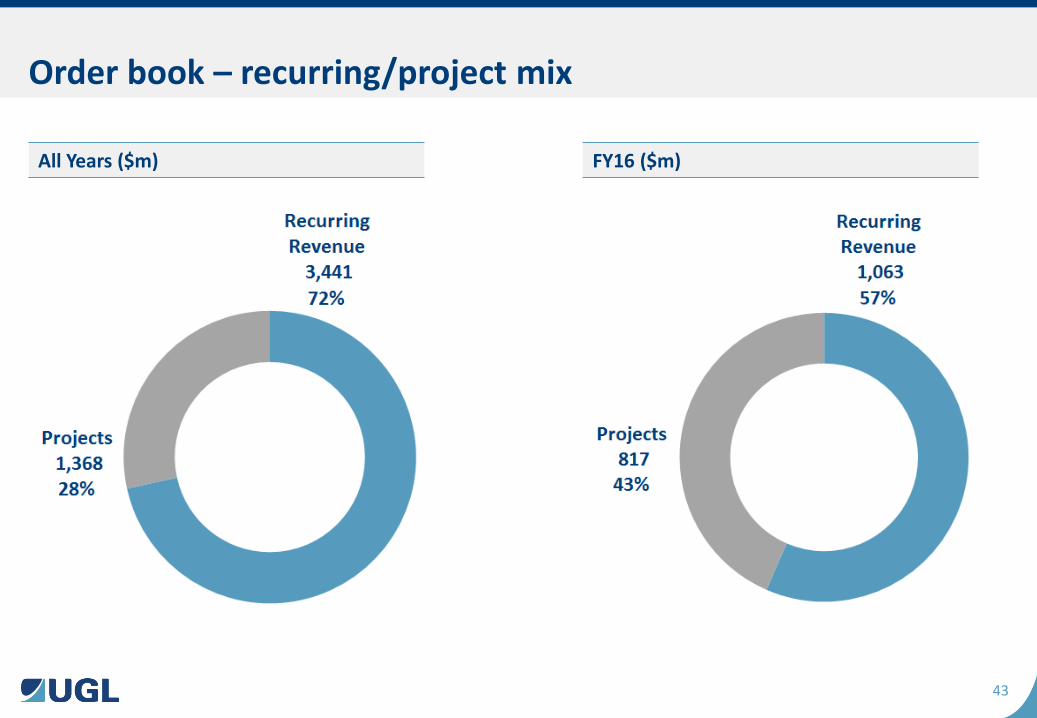
Order book – recurring/project mix
All Years ($m) FY16 ($m)
44
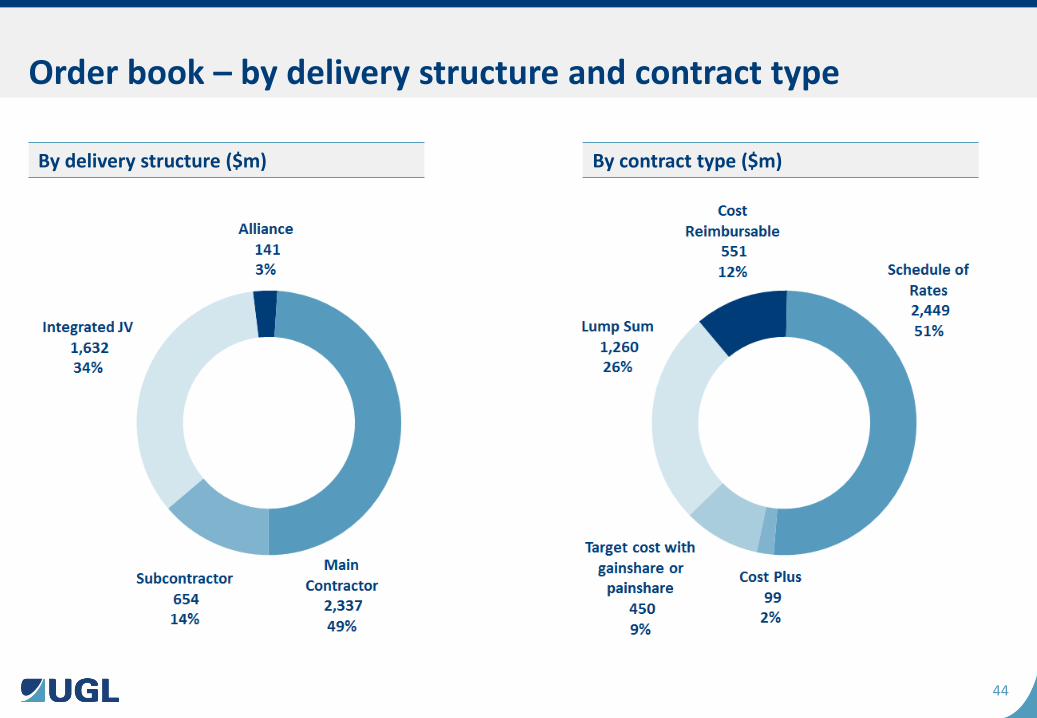
Order book – by delivery structure and contract type
By delivery structure ($m) By contract type ($m)
45
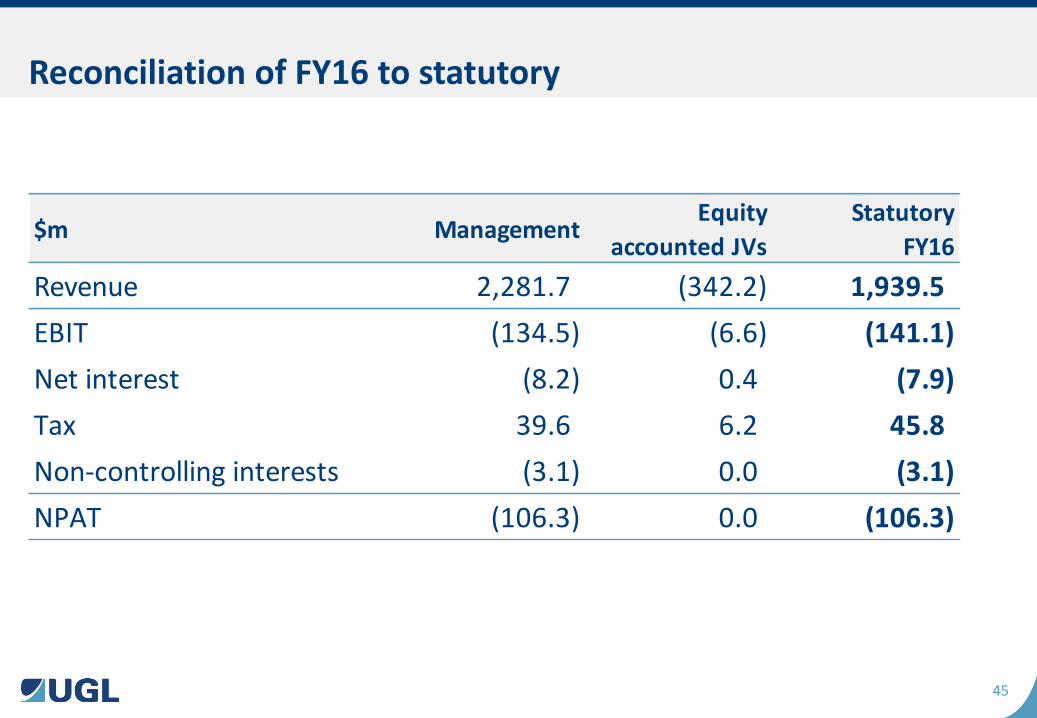
Reconciliation of FY16 to statutory
$m ManagementEquity
accounted JVs
Statutory
FY16
Revenue 2,281.7 (342.2) 1,939.5
EBIT (134.5) (6.6) (141.1)
Net interest (8.2) 0.4 (7.9)
Tax 39.6 6.2 45.8
Non-controlling interests (3.1) 0.0 (3.1)
NPAT (106.3) 0.0 (106.3)
46
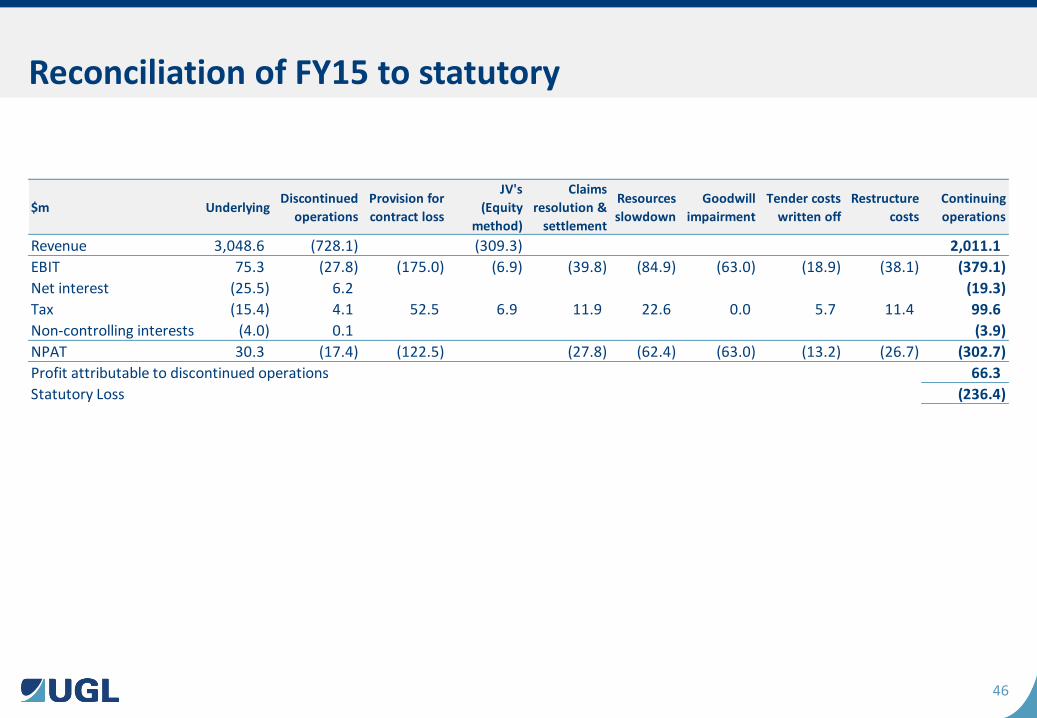
Reconciliation of FY15 to statutory
$m UnderlyingDiscontinued
operations
Provision for
contract loss
JV's
(Equity
method)
Claims
resolution &
settlement
Resources
slowdown
Goodwill
impairment
Tender costs
written off
Restructure
costs
Continuing
operations
Revenue 3,048.6 (728.1) (309.3) 2,011.1
EBIT 75.3 (27.8) (175.0) (6.9) (39.8) (84.9) (63.0) (18.9) (38.1) (379.1)
Net interest (25.5) 6.2 (19.3)
Tax (15.4) 4.1 52.5 6.9 11.9 22.6 0.0 5.7 11.4 99.6
Non-controlling interests (4.0) 0.1 (3.9)
NPAT 30.3 (17.4) (122.5) (27.8) (62.4) (63.0) (13.2) (26.7) (302.7)
Profit attributable to discontinued operations 66.3
Statutory Loss (236.4)
47
Important notice This presentation and any oral presentation accompanying it: • is not an offer, invitation, inducement or recommendation to purchase or subscribe for any securities in UGL Limited (“UGL”) or to retain
any securities currently held;
• is for information purposes only, is in summary form and does not purport to be complete;
• is not intended to be relied upon as advice to investors or potential investors and does not take into account the investment objectives, financial situation or needs of any particular investor, potential investor or any other person. Such persons should consider seeking independent financial advice depending on their specific investment objectives, financial situation or needs when deciding if an investment is appropriate or varying any investment;
• may contain forward looking statements. Any forward looking statements are not guarantees of future performance. Any forward looking statements have been prepared on the basis of a number of assumptions which may prove to be incorrect or involve known and unknown risks, uncertainties and other factors, many of which are beyond the control of UGL, which may cause actual results, performance or achievements to differ materially from those expressed or implied in such statements. There can be no assurance that actual outcomes will not differ materially from these statements. Any forward looking statement reflects views held only as of the date of this presentation. Subject to any continuing obligations under applicable law or any relevant stock exchange listing rules, UGL does not undertake any obligation to publicly update or revise any of the forward looking statements or any change in events, conditions or circumstances on which any such statement is based.
No representation or warranty, express or implied, is made as to the fairness, accuracy, completeness or correctness of the information, opinions and conclusions contained in this presentation and any oral presentation accompanying it. To the maximum extent permitted by law, UGL and its related bodies corporate, and their respective directors, officers, employees, agents and advisers, disclaim and exclude all liability (including, without limitation, any liability arising from fault or negligence) for any loss, damage, claim, demand, cost and expense of whatever nature arising in any way out of or in connection with this presentation and any oral presentation accompanying it, including any error or omission therefrom, or otherwise arising in connection with any reliance by any person on any part of this presentation and any oral presentation accompanying it.