Embed Size (px)
Citation preview
A research project
Conducted by the Council of Michigan Foundations,Blueprint Research & Design, Public Policy Associates,and Williams Group
Principal investigator: Lucy Bernholz, Ph.D.
Funded by The Aspen Institute Nonprofit SectorResearch Fund and the Charles Stewart Mott Foundation
Part One Narrative 3
Part Two Survey findings 30
Part Three Appendices 54
August 2005
Regional alliances and small community foundation sustainability
B E T T E R together
F U L L R E P O R T :
B E T T E R together
An important topic, a timely study.
Community foundations are the most robustform of local philanthropy today. Over the past 20years, they have increased in number, size andreach. As a field, they have developed sharedtools, new business models and standards ofperformance. The community foundation field,however, includes a very large number ofrelatively small organizations that are challengedto achieve high expectations amid increasedcompetition.
This research project finds that regional alliancestake multiple forms and, despite inherentchallenges and potential pitfalls, are a valuablevehicle for community foundations seeking tominimize operating costs and enhance servicequality. In particular, regional alliances can bemission-enhancing investments for smallcommunity foundations, strengthening them asindividual organizations and, by extension,boosting the impact of the entire communityfoundation field.
Introduction 4
External context 5
Research question and hypothesis 7
Methodology 7
Relevant research and approach 9
A qualitative difference 10
Southwest Michigan Alliance 11
Community Foundation of the Upper Peninsula (Michigan) 14
Community Foundation Alliance (Indiana) 16
Humboldt Area Foundation (California) 18
New Hampshire Charitable Foundation 20
Site study findings 22
Balancing mission and costs 27
Success factors 27
Areas for further research 28
Conclusion 28
Part One: Narrative
This section provides a complete narrative for the context,
approach, and findings of a research project undertaken to
address this question: What role do regional alliances play in
helping community foundations, especially those with under
$20 million in assets, achieve greater financial sustainability?
B E T T E R together
4
Better Together: Regional Alliances and Small Community Foundation Sustainability Part One: Narrative
1,900
1,800
1,700
1,600
1,500
1,400
1,300
1,200
1,100
1,000
900
800
700
600
500
400
300
200
100
0
Source: The Columbus Foundation, Community Foundation Survey 2003
Assets:$MM
Number of Percent of totalU.S. community U.S. communityfoundations foundation assets
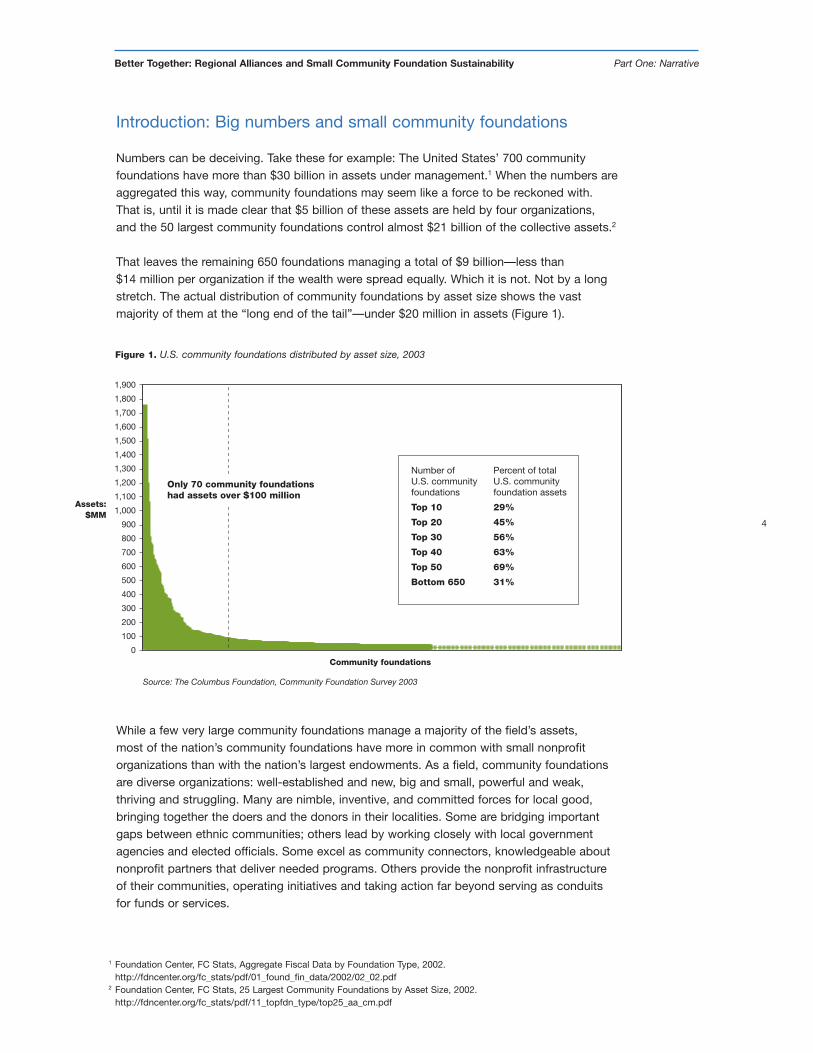
Top 10 29%
Top 20 45%
Top 30 56%
Top 40 63%
Top 50 69%
Bottom 650 31%
Community foundations
Only 70 community foundationshad assets over $100 million
Introduction: Big numbers and small community foundations
Numbers can be deceiving. Take these for example: The United States’ 700 communityfoundations have more than $30 billion in assets under management.1 When the numbers areaggregated this way, community foundations may seem like a force to be reckoned with.That is, until it is made clear that $5 billion of these assets are held by four organizations,and the 50 largest community foundations control almost $21 billion of the collective assets.2
That leaves the remaining 650 foundations managing a total of $9 billion—less than$14 million per organization if the wealth were spread equally. Which it is not. Not by a longstretch. The actual distribution of community foundations by asset size shows the vastmajority of them at the “long end of the tail”—under $20 million in assets (Figure 1).
While a few very large community foundations manage a majority of the field’s assets,most of the nation’s community foundations have more in common with small nonprofitorganizations than with the nation’s largest endowments. As a field, community foundationsare diverse organizations: well-established and new, big and small, powerful and weak,thriving and struggling. Many are nimble, inventive, and committed forces for local good,bringing together the doers and the donors in their localities. Some are bridging importantgaps between ethnic communities; others lead by working closely with local governmentagencies and elected officials. Some excel as community connectors, knowledgeable aboutnonprofit partners that deliver needed programs. Others provide the nonprofit infrastructureof their communities, operating initiatives and taking action far beyond serving as conduitsfor funds or services.
Figure 1. U.S. community foundations distributed by asset size, 2003
1 Foundation Center, FC Stats, Aggregate Fiscal Data by Foundation Type, 2002.http://fdncenter.org/fc_stats/pdf/01_found_fin_data/2002/02_02.pdf
2 Foundation Center, FC Stats, 25 Largest Community Foundations by Asset Size, 2002.http://fdncenter.org/fc_stats/pdf/11_topfdn_type/top25_aa_cm.pdf
5
Better Together: Regional Alliances and Small Community Foundation Sustainability Part One: Narrative
Community foundations are as varied as the communities they serve. Many are established,strong, sustainable organizations with the ability to lead at local, national and internationallevels. Many more are engaged in a process of adapting old structures to new realities—seeking relevance and pursuing their potential to represent the highest hopes and futureaspirations of their communities.
External context
Two decades of intense change
As the first community foundation in the United States approaches its 100th birthday,3 thefield has undergone enormous growth, seismic shifts in the services they deliver and thecompetitors they face, and significant alignment around national standards, joint marketing,and a sense of connectedness. For community foundations, the last 20 years stand out interms of intensity of activity, rate of growth, public awareness, and extent of joint action.Though a great deal of this collaborative work emerged as a response to the perceivedcommon threat of commercial gift funds, community foundations, in fact, have a robusttradition of cooperation.
Several factors make collaboration among community foundations both an appealing andpotentially perilous endeavor. The last decade of the twentieth century saw the advent andproliferation of commercial gift funds as international, well-capitalized, highly marketedalternative sources of donor advised funds. Technological innovation brought about a periodof intense creation and destruction of online giving sites, new nonprofit data sources, andinstant access to information that was previously limited to the purview of philanthropicprofessionals. These developments, both successes and failures, left only the fittest playerssurviving and an expectation among donors and community members that direct access torelevant information was available to them without a need for intermediaries.
The community foundation field did not stand idly by and watch the world change around it.The same decade brought an increase in financial rigor and analysis from within the field,assisted by experts from the business world. Commercial management consulting firmsintroduced new practices. The field itself invested in a significant benchmarking study ofproduct costs.4
Furthermore, the field of community foundations moved to formalize relationships among itsindividual members in the 1990s. The decade saw the creation of the Community FoundationLeadership Team (CFLT) at the Council on Foundations, as well as the launch of CommunityFoundations of America (CFA), an effort to create a “buyers’ cooperative” for communityfoundation technology and financial services to provide individual organizations with a criticalmass of bargaining and design power. These two organizations formed a formal workingalliance of their own in early 2004, with CFA retaining core services in technology and finance.The Leadership Team now focuses on areas with profound influence on the joint work ofindividual community foundations, including the National Marketing Action Team (NMAT) andthe development of national standards.
3 The Cleveland Foundation was founded in 1914.4 McKinsey & Company, Bain & Company (through BridgeSpan) and The Monitor Group, three of the nation’s largest
commercial consulting firms, expanded their foundation and nonprofit practice areas in the 1990s. In addition,Foundation Strategy Group, LLC, established by experts from the Harvard Business School, conducted a study ofproduct costs described in the report, “Strengthening Community Foundations.”
6
Better Together: Regional Alliances and Small Community Foundation Sustainability Part One: Narrative
National standards
The development of national standards for community foundations has a long and complexhistory. Key moments in that history are highly significant to this study. In 2003, as the studywas being designed, the first set of national standards was being finalized and the processof implementing them was beginning to unfold. By mid-2004, at the height of research for thisproject, 471 of the 700 eligible community foundations in the United States had submittedletters to the Council on Foundations expressing intent to comply with national standards,and a review process was underway. In addition to an immediate, broad acceptance of thesestandards nationally, community foundations in several states—including Wisconsin,Michigan, California, Maryland, and Indiana—have adopted standards at a state level andhave implemented statewide support systems or incentives for participation.
As the research team set out to examine regional alliances, this national movement drew attention for two reasons. First, since a set of common standards for practice existed,individual community foundations could use the standards as benchmarks for improving their own practices. Second, the field as a whole, at a national and state level, was delivering a clear message that there were acceptable baseline practices for operating acommunity foundation. These developments, and particularly the peer-led process forcreating the standards and the review process for implementing them, were unmistakablepronouncements that the business of one community foundation is the business of others.
While community foundations have operated from their inception as collegial and generouspeers, the standards process took that informal set of relationships and cemented it. The fieldof community foundations was in essence saying to its members, “We care what you do andhow you do it. We’re going to check on your practices, help you improve, and hold youaccountable.” The ties had switched from informal relationships with loose, trust-basedconnections to formal systems and expectations of accountability. It is far too early to knowhow the standards movement itself will play out, but recognizing this shift is important tounderstanding the operational successes and strategies of the alliances studied, as well asthe broad interest in the subject of regional alliances.
The research project that informed this paper arose out of an interest in how and whycommunity foundations work together. Several studies over the last two decades havedocumented various types of joint work, collaboration, or alliances.5 More recently, analysishas honed in on the costs of joint work6 and the multiplication of new and complementaryaffiliations, networks, or membership organizations now serving philanthropy and communityfoundations.7 There are a growing number of opportunities for foundations to work together.With these opportunities come a complex set of concerns and responses to increasedcompetition, a need for scale, and an effort to set and achieve common standards todistinguish community foundations from other players. These conditions called for a closerexamination of when and why community foundations, particularly small ones, worktogether—and of just what makes these alliances work.
5 Includes 2002 “Rural Service Structures and Characteristics” by Community Strategies Group, The Aspen Institute,as well as work by Jennifer Leonard.
6 Foundation Strategy Group cost analysis described in “Strengthening Community Foundations.”7 See, for example, “New Landscape for Philanthropic Giving,” New Ventures in Philanthropy, The Forum of
Regional Associations, Washington, DC, http://www.givingforum.org/newventures/givinglandscape.htmland the research on Funders Networks conducted by Grantmakers for Effective Organizations, 2004,http://www.geofunders.org/index.cfm?fuseaction=Page.viewPage&pageID=103.
7
Better Together: Regional Alliances and Small Community Foundation Sustainability Part One: Narrative
Research question and hypothesis
The research team8 responsible for this study was particularly interested in answering thefollowing question: What role do regional alliances play in helping community foundations,especially those with under $20 million in assets, achieve financial sustainability?
This question is framed by the hypothesis being tested through this project: Smallcommunity foundations can improve their practices and services, as well as potentiallylower costs and/or expand their assets, by teaming up with proximal peers to build sharedoperational, management or governance structures.
Methodology
Case studies
With these parameters set, the research team identified five cases to investigate deeply,through site visits, financial data analysis and interviews. Keeping in mind the variabilityand regional specificity that defines community philanthropy, the team selected a set ofcommunity foundation collaborations that represented diverse U.S. locales, purposes, ages,and levels of formality.
The team was particularly interested in assessing multiple structures, and succeeded ingaining access to various models—including three sites (two in Michigan, one in Indiana) thatinclude independent community foundations allying around common work, one (based inCalifornia) involving a single community foundation extending its support for communityphilanthropy to neighboring counties, and one (in New Hampshire) involving a singlecommunity foundation that created regional divisions with local identities and connections.9
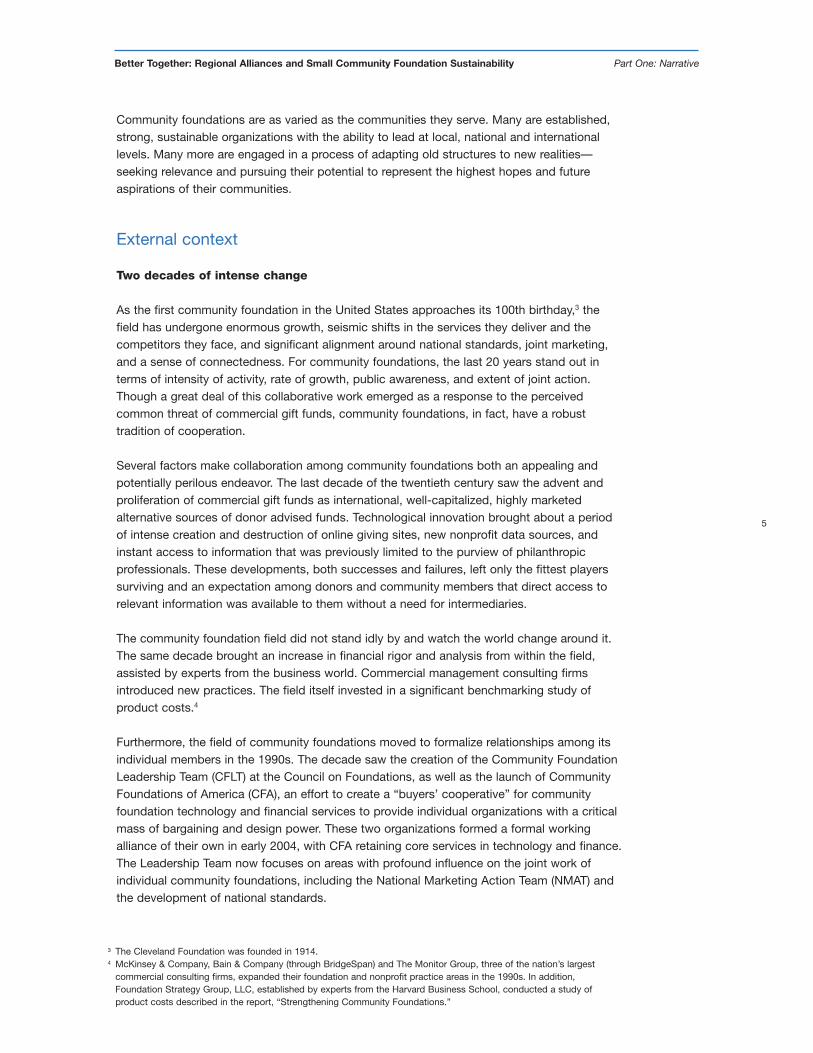
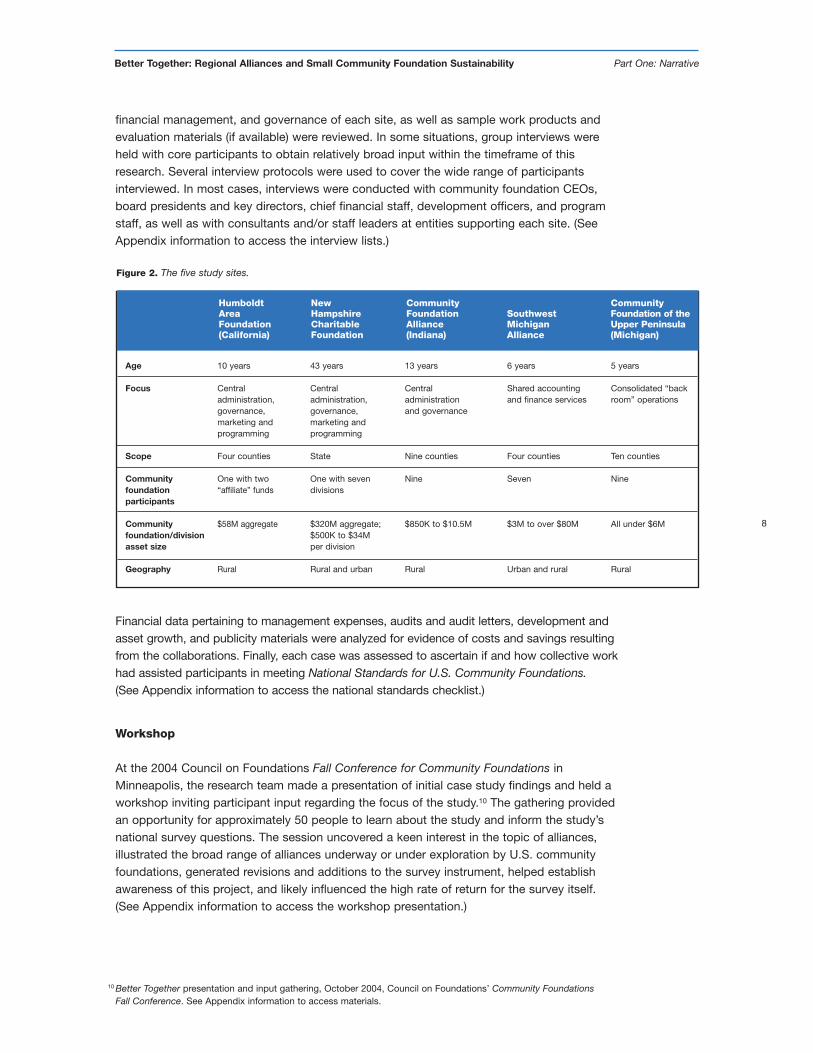
The five cases studied and their overarching characteristics are represented in Figure 2(next page).
Each of these sites was visited by at least one member of the research team for a two- tothree-day period. Site visits were completed between July and August, 2004. Interviewswere conducted with key board and staff leaders of participating community foundationsand organizations. Background documentation on the formation, functional operations,
8 Lucy Bernholz, Blueprint R&D, was the project lead. The core team also included Tina Joh of Blueprint R&D;Patrick Babcock and Le’Ann Duran of Public Policy Associates; Robert Collier and Donnell Mersereau of Council ofMichigan Foundations; and Bob Tobin and Mark Sedway of Williams Group.
9 The research team was aware of newer regional collaborations in Southern states, including activities informed bythe Southeastern Council of Foundations. These alliances were deemed to be too nascent to yield data comparableto the sites selected.
Operational definition of “alliance”:The commitment of individual community foundation financial resources to collectivecommunity foundation activity that is expected to generate benefits, on both an individual andcollective scale. For purposes of this research project, the broad group of alliances werenarrowed to focus on regional alliances—those made up of community foundationsgeographically adjacent to one another.
8
Better Together: Regional Alliances and Small Community Foundation Sustainability Part One: Narrative
financial management, and governance of each site, as well as sample work products andevaluation materials (if available) were reviewed. In some situations, group interviews wereheld with core participants to obtain relatively broad input within the timeframe of thisresearch. Several interview protocols were used to cover the wide range of participantsinterviewed. In most cases, interviews were conducted with community foundation CEOs,board presidents and key directors, chief financial staff, development officers, and programstaff, as well as with consultants and/or staff leaders at entities supporting each site. (SeeAppendix information to access the interview lists.)
Financial data pertaining to management expenses, audits and audit letters, development andasset growth, and publicity materials were analyzed for evidence of costs and savings resultingfrom the collaborations. Finally, each case was assessed to ascertain if and how collective workhad assisted participants in meeting National Standards for U.S. Community Foundations.(See Appendix information to access the national standards checklist.)
Workshop
At the 2004 Council on Foundations Fall Conference for Community Foundations inMinneapolis, the research team made a presentation of initial case study findings and held aworkshop inviting participant input regarding the focus of the study.10 The gathering providedan opportunity for approximately 50 people to learn about the study and inform the study’snational survey questions. The session uncovered a keen interest in the topic of alliances,illustrated the broad range of alliances underway or under exploration by U.S. communityfoundations, generated revisions and additions to the survey instrument, helped establishawareness of this project, and likely influenced the high rate of return for the survey itself. (See Appendix information to access the workshop presentation.)
10 Better Together presentation and input gathering, October 2004, Council on Foundations’ Community FoundationsFall Conference. See Appendix information to access materials.
Age
Focus
Scope
Communityfoundationparticipants
Communityfoundation/divisionasset size
Geography
10 years
Centraladministration,governance,marketing andprogramming
Four counties
One with two“affiliate” funds
$58M aggregate
Rural
43 years
Centraladministration,governance,marketing andprogramming
State
One with sevendivisions
$320M aggregate;$500K to $34Mper division
Rural and urban
Humboldt New Community CommunityArea Hampshire Foundation Southwest Foundation of theFoundation Charitable Alliance Michigan Upper Peninsula(California) Foundation (Indiana) Alliance (Michigan)
13 years
Centraladministrationand governance
Nine counties
Nine
$850K to $10.5M
Rural
6 years
Shared accountingand finance services
Four counties
Seven
$3M to over $80M
Urban and rural
5 years
Consolidated “backroom” operations
Ten counties
Nine
All under $6M
Rural
Figure 2. The five study sites.
9
Better Together: Regional Alliances and Small Community Foundation Sustainability Part One: Narrative
Survey
A survey was sent in November 2004 to all community foundation members of the Councilon Foundations. Out of 524 recipients, 210 responded, yielding a response rate of 40%. Surveyquestions were developed primarily based on case study findings. The purpose of the surveywas to provide a national context for site-specific findings. (See Appendix information to accesssurvey instrument.)
Analysis
The entire team reviewed case study findings prior to the Community Foundations FallConference workshop in October 2004 and in preparation for the November survey. Surveymanagement, data collection and data analysis was led by Public Policy Associates and tookplace from January to April 2005, with consultation from all team members.
Relevant research and approach
An initial expectation informing the design of this research project was that it would makeuse of two new, pervasive benchmarks—national standards and existing cost analysis11
to examine any costs, savings and benefits of these alliances. The research team quicklylearned that the community foundations in the sample were, for the most part, many stepsaway from benchmarking their costs or revenue against emerging baselines developed byFoundation Strategy Group (FSG). The New Hampshire Charitable Foundation (one of thestudy sites) participated in the original FSG research. While this community foundation didhave the financial tools in place to undergo cost analysis, the findings that resulted fromFSG’s work determined the Foundation’s model to be one of high costs. This analysis, whileaccurate in terms of the products and structure the community foundation uses, does notaccount for the appropriateness of the model to the political and cultural climate of the state,the historical reasons behind the existing structure, or the community goodwill engendered bythe community foundation’s regional division structure.
Recognizing limitations on using FSG findings as relevant study benchmarks, the researchteam turned its attention to relationships between the alliances and national standards. Allparticipating community foundations were checked against the list of national standards, andthe developmental analysis of each alliance was considered with specific regard to its impacton helping participating foundations meet or exceed those standards.
The most commonly used measure of community foundations is the size of the assets theymanage. This paper deliberately began with such a quantitative overview for two reasons.First, the range of individual foundation assets is enormous. The second purpose was toconnect with readers by using the most familiar indicator of community foundation capacity.
11 Foundation Strategy Group (FSG) conducted this cost analysis, reporting on it in “Strengthening Community Foundations.”
A qualitative difference
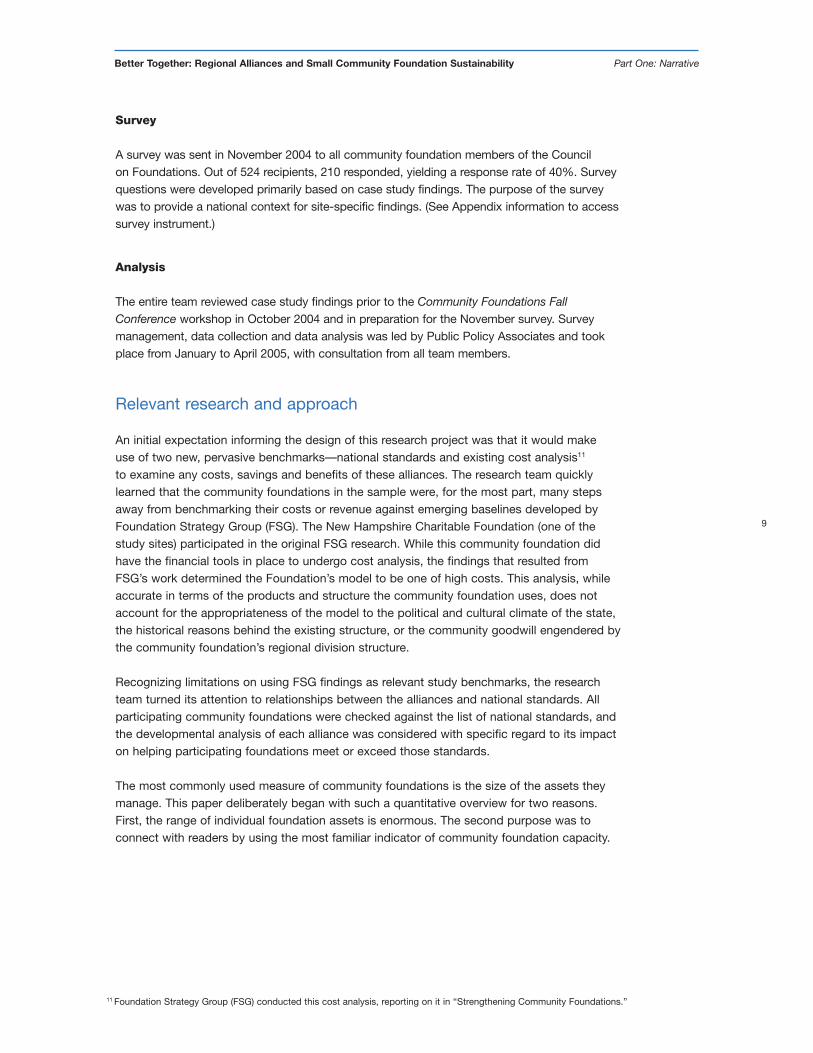
The most significant learning from this study is that an overarching purpose of the modelsexamined is qualitative improvement. In other words, the predominant goal for many is to bebetter, not bigger. This finding was demonstrated through the site studies, and was reinforcedthrough survey responses. In the five sites examined, participants focused on sharedoperational services as a means of both lowering costs and increasing quality—expandingcapacity and aligning with the field’s movement to consistent standards of performance.Improvement and/or expansion of service was a focal point in all five cases, and served asthe primary focal point in four of these cases.
The next section provides more detail on the five sites studied.
10
Better Together: Regional Alliances and Small Community Foundation Sustainability Part One: Narrative
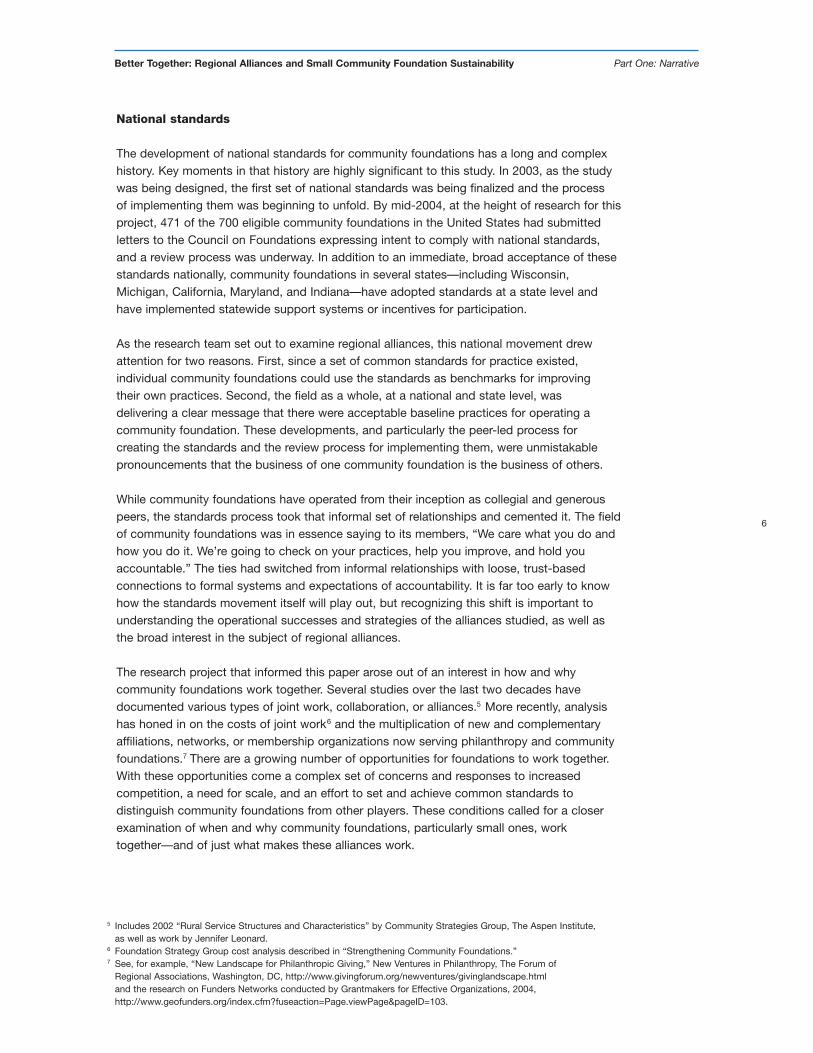
Figure 3. Summary of results for participants in five sites studied.
Site Services Savings Capacity Evidence of Othershared experienced expanded standards met benefits
SouthwestMichiganAlliance
CommunityFoundationof the UpperPeninsula(Michigan)
CommunityFoundationAlliance(Indiana)
Humboldt AreaFoundation(California)
New HampshireCharitableFoundation
Accounting,investing, auditing,FIMS (FinancialInformationManagementSystem)
Consolidatedback-office,includingaccounting,investing, auditing, FIMS
Centrally managedback-office,marketing,development,grantmakingfunctions
Centraladministration,governance,marketing andprogram support
Centraladministration,governance,marketing andprogram support
Lower audit cost
Lower investment fees
Lower audit expense
Reduced investment fees
Lower operatingexpense
Reducedadministrative costs
Lower audit costs
Reduced investment costs
Low administrative and staff cost
Low or no local office cost
Raised control andquality of services
Achieved common, highlevel of data accuracyand maintenance
Pooled scarce resourcesfor greater back-officefunctionality
Increased time spent bylocal staff on assetgrowth and grantmaking
Improved reportingtimeliness, accuracyand consistency
Enhanced trust anddisclosure
Created higher quality of investment and other services
Expanded philanthropicservices in region
Created localinfrastructure forcommunity philanthropy
Increased time/energy for local asset andcommunity development
Allowed local staff towork on assetdevelopment andspecific local needs
Attracted nationalfunder investment inlocal capacity
Shared templates and standards for quality work
National standards“intent to comply”
Shared protocols and documents
National standards“intent to comply”
National standards“intent to comply”
National standards“intent to comply”
National standards“intent to comply”
Growth in number of local FIMS-trainedprofessionals
Alliance expanding to include and/or servenew communityfoundations in region
Building collective trustand regional mindset
Endowment growthaccelerated
Significant fundsraised in region
A coordinated regional voice attracts outsidefunding
Mentoring of emergingcommunity leadersand organizations
Regional scope andrelationships advanceregional agenda
New local donorsattracted bycommunity-basedaffiliate funds
Rapid growth oflocal funds
Broad engagementand increasednumber of peopleinvolved in communityphilanthropy
11
Better Together: Regional Alliances and Small Community Foundation Sustainability Part One: Narrative
Southwest Michigan Alliance
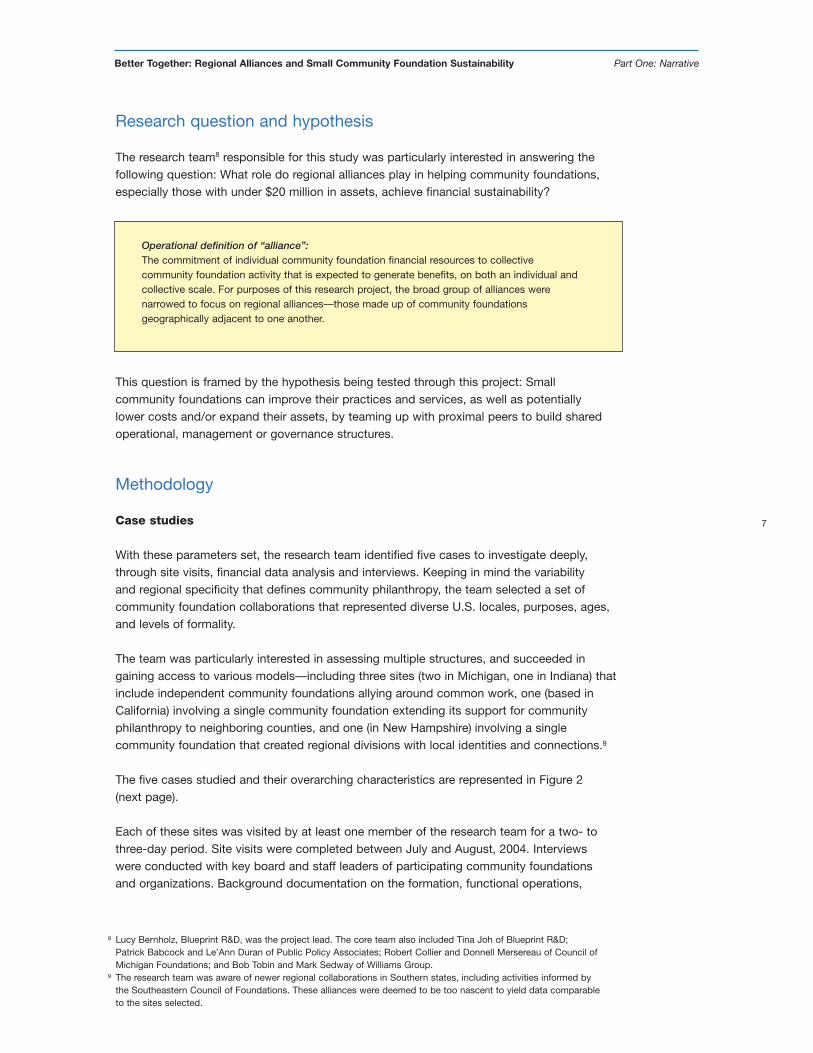
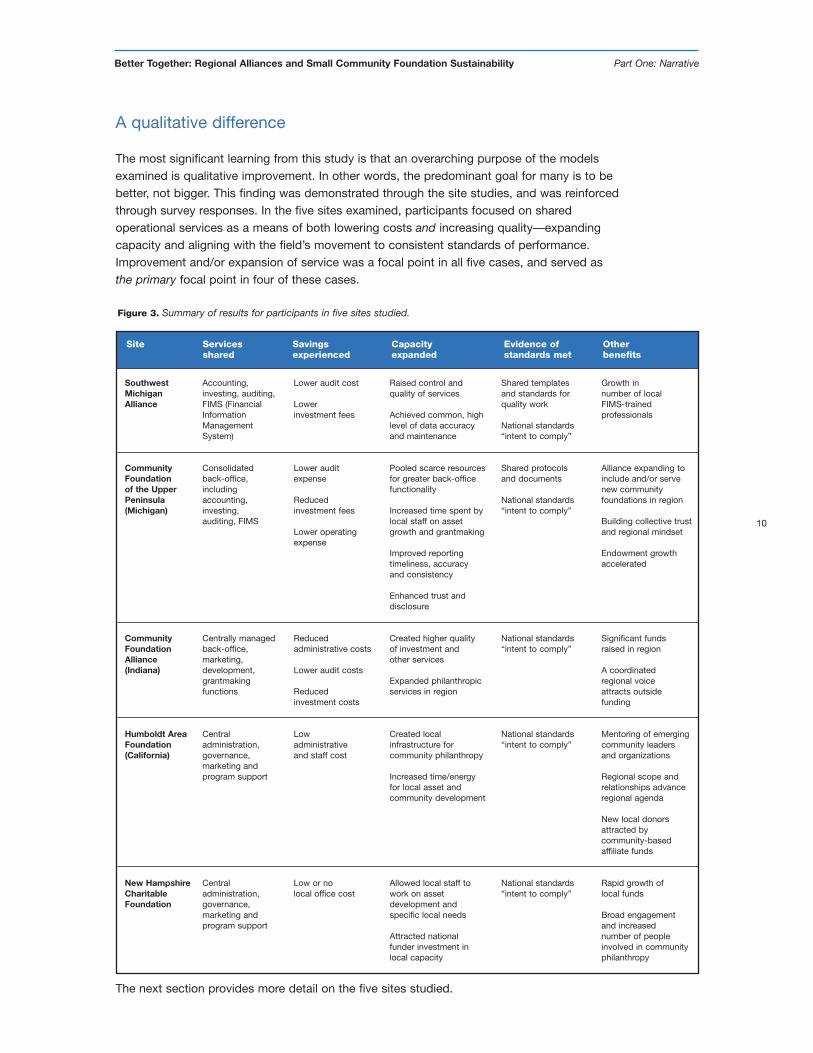
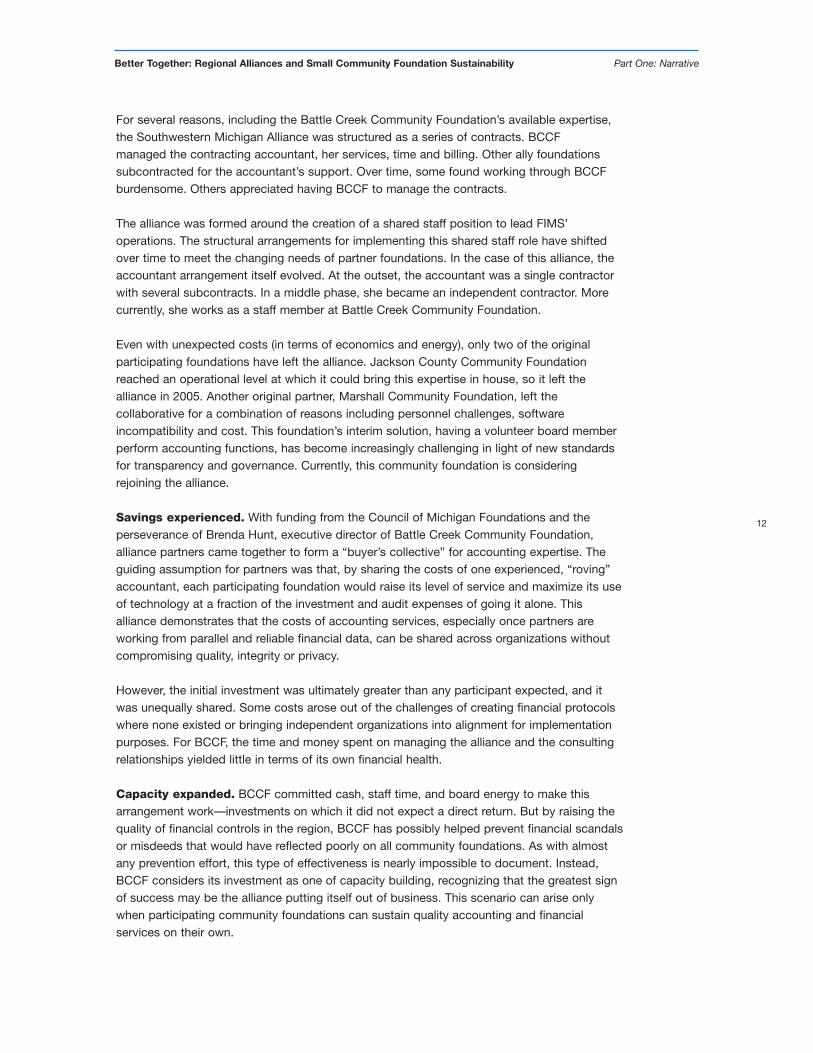
The seven community foundations in this alliance cover four counties in southwest Michigan.They range in asset size from $3 million to over $80 million and span territories that includeboth rural areas and small urban centers. Of the five partners currently participating in theSouthwest Michigan Alliance, the largest is the Battle Creek Community Foundation, withapproximately $82 million in assets under management at the time of this report.
Battle Creek Community Foundation (BCCF) is a vibrant, critical and growing resource in theBattle Creek community. It is important to note, however, that BCCF sits in the shadow of themultibillion dollar W.K. Kellogg Foundation, an international foundation that invests generouslyin its founders’ hometown, Battle Creek. Growing up with the Kellogg Foundation as acommunity partner, leaders of Battle Creek Community Foundation were well aware that theirorganization would never be the area’s biggest pocketbook. Toadd distinct value, the community foundation takes on the work ofbuilding local nonprofit capacity and growing local philanthropy.Not only do these broad purposes define the organization’smission, the community foundation allocates its budget and stafftime toward providing leadership, gathering people around issuesand serving as a catalyst for change. For BCCF, the genesis of analliance was attractive for reasons of mission achievement andcost savings, a duo that surfaced again and again in researchfindings.
With support from the statewide Council of Michigan Foundations,the region’s community foundations had been sharing ideas andinformation for some time. These organizations faced severalparamount challenges: meeting donor requests for reports,keeping pace with changing requirements for fund accounting,and—in some cases—cleaning up inherited financial messes. By 1998, online commercial giftfunds began to offer new levels of immediacy and accuracy in reportings, becoming toughcompetitors. Smaller community foundations, particularly those in rural areas, had historicallystruggled to report donors’ statements on a quarterly basis. Their new competitors providedaccurate information to donors every day, around the clock. Complicating the accounting andreporting challenges for these small community foundations was the scarcity of accountingfirms with expertise in Financial Information Management Systems (FIMS) software, the mostcommon financial management package used in the field. The Southwest Michigan Alliancebegan as an effort to address the Achilles heel of small community foundations—managingand reporting donor fund activity.
Services shared. The initial goal for the alliance, started in 1998, was to find a cost-effectiveway for small community foundations to make use of FIMS. In the six years since then, thealliance has also focused on providing shared accounting, investing, and auditing services toparticipants.
Figure 4. Coverage area for theSouthwest Michigan Alliance.
12
Better Together: Regional Alliances and Small Community Foundation Sustainability Part One: Narrative
For several reasons, including the Battle Creek Community Foundation’s available expertise,the Southwestern Michigan Alliance was structured as a series of contracts. BCCF managed the contracting accountant, her services, time and billing. Other ally foundationssubcontracted for the accountant’s support. Over time, some found working through BCCFburdensome. Others appreciated having BCCF to manage the contracts.
The alliance was formed around the creation of a shared staff position to lead FIMS’operations. The structural arrangements for implementing this shared staff role have shiftedover time to meet the changing needs of partner foundations. In the case of this alliance, theaccountant arrangement itself evolved. At the outset, the accountant was a single contractorwith several subcontracts. In a middle phase, she became an independent contractor. Morecurrently, she works as a staff member at Battle Creek Community Foundation.
Even with unexpected costs (in terms of economics and energy), only two of the originalparticipating foundations have left the alliance. Jackson County Community Foundationreached an operational level at which it could bring this expertise in house, so it left thealliance in 2005. Another original partner, Marshall Community Foundation, left thecollaborative for a combination of reasons including personnel challenges, softwareincompatibility and cost. This foundation’s interim solution, having a volunteer board memberperform accounting functions, has become increasingly challenging in light of new standardsfor transparency and governance. Currently, this community foundation is consideringrejoining the alliance.
Savings experienced. With funding from the Council of Michigan Foundations and theperseverance of Brenda Hunt, executive director of Battle Creek Community Foundation,alliance partners came together to form a “buyer’s collective” for accounting expertise. Theguiding assumption for partners was that, by sharing the costs of one experienced, “roving”accountant, each participating foundation would raise its level of service and maximize its useof technology at a fraction of the investment and audit expenses of going it alone. Thisalliance demonstrates that the costs of accounting services, especially once partners areworking from parallel and reliable financial data, can be shared across organizations withoutcompromising quality, integrity or privacy.
However, the initial investment was ultimately greater than any participant expected, and itwas unequally shared. Some costs arose out of the challenges of creating financial protocolswhere none existed or bringing independent organizations into alignment for implementationpurposes. For BCCF, the time and money spent on managing the alliance and the consultingrelationships yielded little in terms of its own financial health.
Capacity expanded. BCCF committed cash, staff time, and board energy to make thisarrangement work—investments on which it did not expect a direct return. But by raising thequality of financial controls in the region, BCCF has possibly helped prevent financial scandalsor misdeeds that would have reflected poorly on all community foundations. As with almostany prevention effort, this type of effectiveness is nearly impossible to document. Instead,BCCF considers its investment as one of capacity building, recognizing that the greatest signof success may be the alliance putting itself out of business. This scenario can arise onlywhen participating community foundations can sustain quality accounting and financialservices on their own.
13
Better Together: Regional Alliances and Small Community Foundation Sustainability Part One: Narrative
As the accountant “roved,” she found many opportunities to cross-pollinate ideas andlessons learned among partner community foundations. It took longer than expected, andwas more expensive than budgeted, for the roving accountant to lift each communityfoundation to a common, high level of data accuracy and maintenance, to establishcontrols, and boost quality of services. For a few, the costs became too much to bear.
Evidence of standards met. The alliance is now entering its seventh year, and itslifespan has been marked by tremendous success as well as many challenges. The firstseveral years of the arrangement revolved around cleaning up the books and aligningpartner community foundations at the same starting point. In the course of this work,organizations built trust among themselves and shared templates and “standards” forquality work across the alliance. The community foundations involved have indicated theirintent to comply with national standards.
As implementation of national standards begins, it will become easier for newer andsmaller community foundations to get quick access to the type of protocols, processesand reporting functionality now available in southwest Michigan. However, in 1998 theselocal foundation partners needed to borrow from one another—trading everything fromdata codes to reporting forms to fund agreements.
Other benefits. This alliance experience has generated some positive surprises. Forexample, the original problem of scarce talent has begun to be addressed. Over time, asaccountants transitioned, the alliance has had to find and provide FIMS software training tomultiple individuals. The happy result is there are now more local experts than before;BCCF alone has three financial staff skilled with FIMS, and Jackson County CommunityFoundation has hired a FIMS-trained professional.
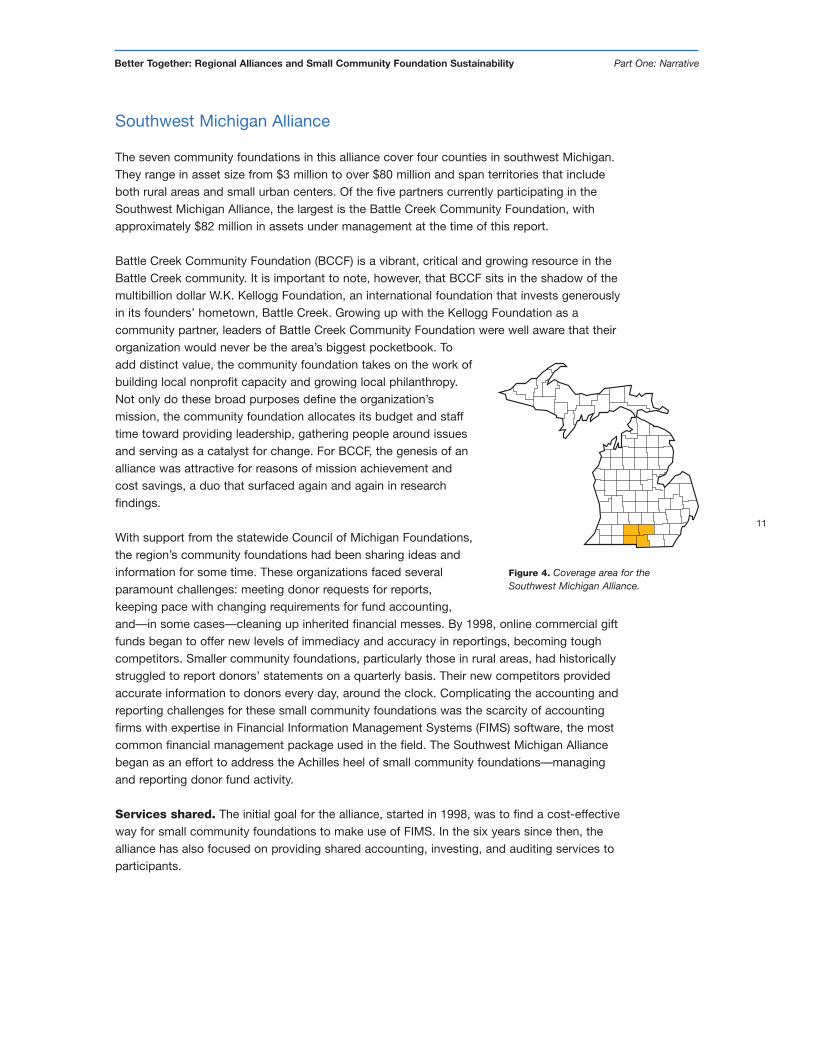
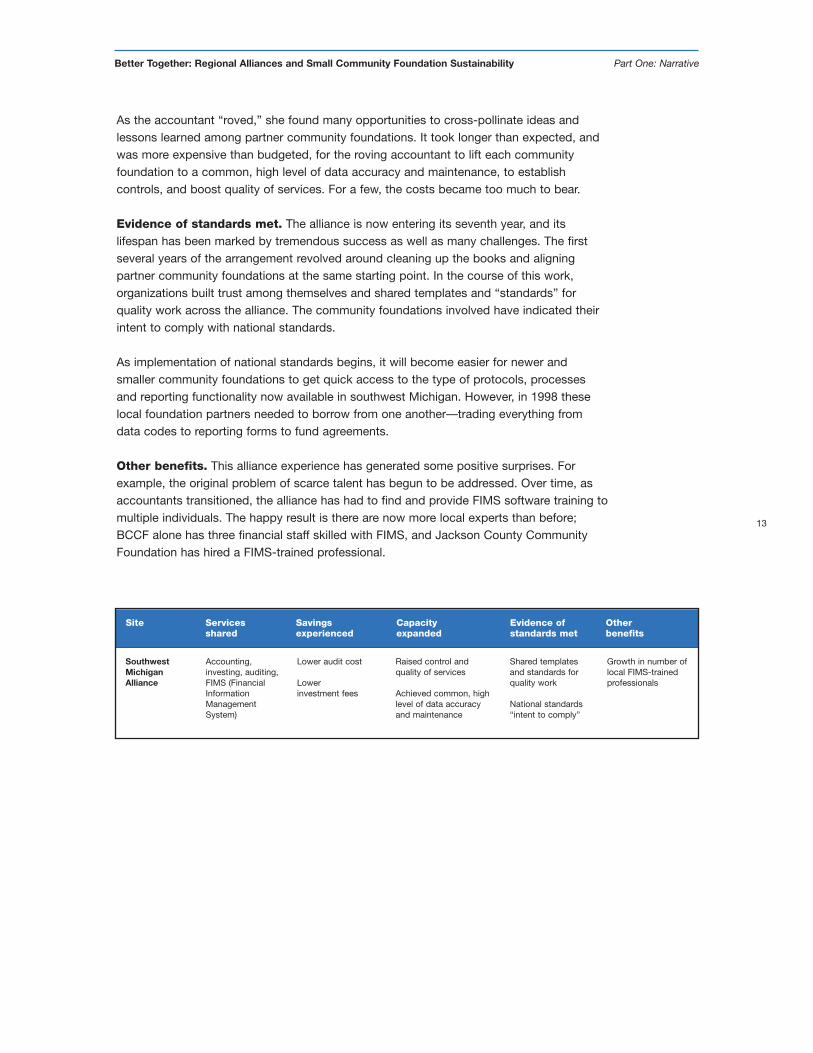
Site Services Savings Capacity Evidence of Othershared experienced expanded standards met benefits
SouthwestMichiganAlliance
Accounting,investing, auditing,FIMS (FinancialInformationManagementSystem)
Lower audit cost
Lower investment fees
Raised control andquality of services
Achieved common, highlevel of data accuracyand maintenance
Shared templates and standards for quality work
National standards“intent to comply”
Growth in number oflocal FIMS-trainedprofessionals
14
Better Together: Regional Alliances and Small Community Foundation Sustainability Part One: Narrative
Community Foundation of the Upper Peninsula (Michigan)
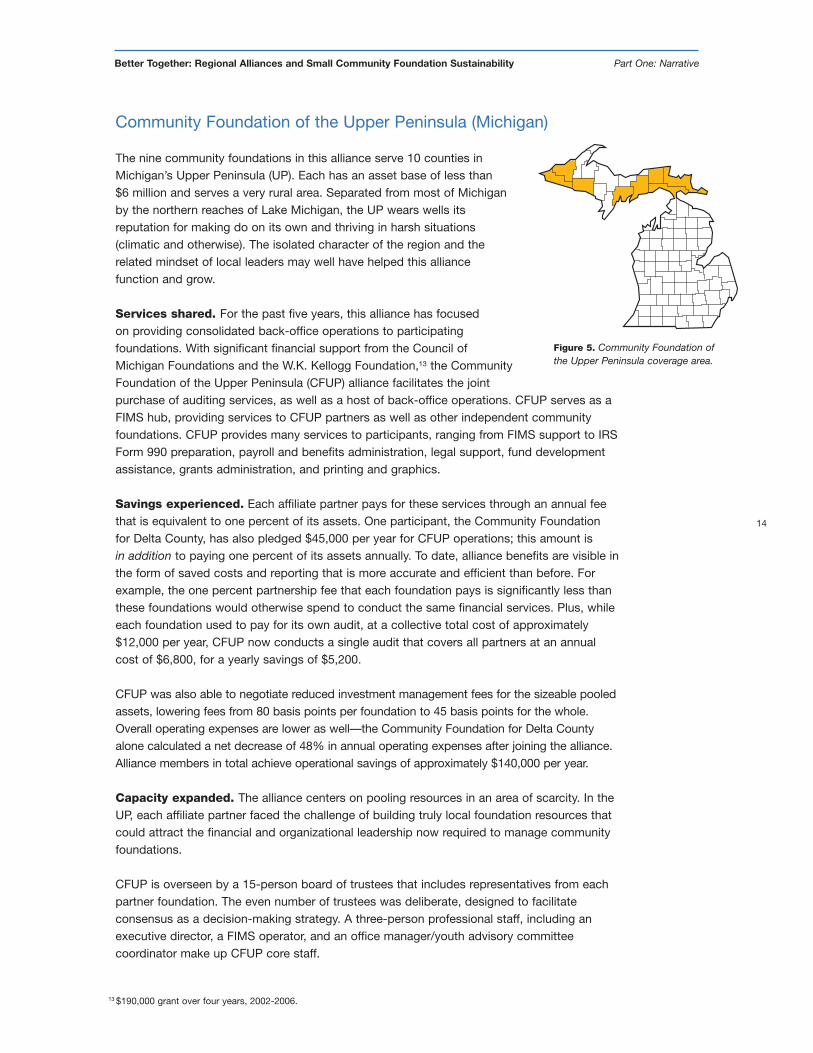
The nine community foundations in this alliance serve 10 counties inMichigan’s Upper Peninsula (UP). Each has an asset base of less than$6 million and serves a very rural area. Separated from most of Michiganby the northern reaches of Lake Michigan, the UP wears wells itsreputation for making do on its own and thriving in harsh situations(climatic and otherwise). The isolated character of the region and therelated mindset of local leaders may well have helped this alliancefunction and grow.
Services shared. For the past five years, this alliance has focusedon providing consolidated back-office operations to participatingfoundations. With significant financial support from the Council ofMichigan Foundations and the W.K. Kellogg Foundation,13 the CommunityFoundation of the Upper Peninsula (CFUP) alliance facilitates the jointpurchase of auditing services, as well as a host of back-office operations. CFUP serves as aFIMS hub, providing services to CFUP partners as well as other independent communityfoundations. CFUP provides many services to participants, ranging from FIMS support to IRSForm 990 preparation, payroll and benefits administration, legal support, fund developmentassistance, grants administration, and printing and graphics.
Savings experienced. Each affiliate partner pays for these services through an annual feethat is equivalent to one percent of its assets. One participant, the Community Foundationfor Delta County, has also pledged $45,000 per year for CFUP operations; this amount isin addition to paying one percent of its assets annually. To date, alliance benefits are visible inthe form of saved costs and reporting that is more accurate and efficient than before. Forexample, the one percent partnership fee that each foundation pays is significantly less thanthese foundations would otherwise spend to conduct the same financial services. Plus, whileeach foundation used to pay for its own audit, at a collective total cost of approximately$12,000 per year, CFUP now conducts a single audit that covers all partners at an annualcost of $6,800, for a yearly savings of $5,200.
CFUP was also able to negotiate reduced investment management fees for the sizeable pooledassets, lowering fees from 80 basis points per foundation to 45 basis points for the whole.Overall operating expenses are lower as well—the Community Foundation for Delta Countyalone calculated a net decrease of 48% in annual operating expenses after joining the alliance.Alliance members in total achieve operational savings of approximately $140,000 per year.
Capacity expanded. The alliance centers on pooling resources in an area of scarcity. In theUP, each affiliate partner faced the challenge of building truly local foundation resources thatcould attract the financial and organizational leadership now required to manage communityfoundations.
CFUP is overseen by a 15-person board of trustees that includes representatives from eachpartner foundation. The even number of trustees was deliberate, designed to facilitateconsensus as a decision-making strategy. A three-person professional staff, including anexecutive director, a FIMS operator, and an office manager/youth advisory committeecoordinator make up CFUP core staff.
13 $190,000 grant over four years, 2002-2006.
Figure 5. Community Foundation ofthe Upper Peninsula coverage area.
15
Better Together: Regional Alliances and Small Community Foundation Sustainability Part One: Narrative
Typical of collaborative efforts, it took time for CFUP to build a culture of open sharingand trust. Because the primary services of the CFUP take place in the “back offices” ofcommunity foundation operations, early stumbling blocks related to full disclosure of financialhealth and concern over whether each partner was “paying the right amount to play.” Today,the key components of trust and full disclosure are in place, and the back office functionalityprovided by CFUP pays off for community foundation participants. Each enjoys reporting withgreater timeliness and accuracy, greater consistency, and more time for staff to work withintheir communities. Foundation directors noted specifically that, because these administrativeduties are completed centrally, more time is available to focus on fund development, donorrelations and grantmaking. In addition, participating foundation board members no longerhave to spend their time developing, implementing, and maintaining administrative systems;they can, instead, focus on work that is more strategic.
Evidence of standards met. Community foundations participating in the CFUP alliancehave now expressed intent to comply with national standards.
Other benefits. The alliance has been so successful in building a central hub for back-officeservices that it has begun to reach out to additional community foundations. Some of thesefoundations may ultimately join as formal partners, while others access these CFUP supportand services:
• Protocols, document formats or other tools• Donor development guidance• FIMS support• Information sharing• Sounding board for ideas
Though nine is given as a baseline number of participating community foundations, thisalliance was adding new partners during the research and reporting reporting of this project.
While some members of the alliance would like to see individual community foundationpartners move to a higher level of joint programming or community action, there is broadunderstanding that such progress rests on the trust built through success of basicadministrative efforts. Given the local pride inherent in each community, alliance work is abalancing act between collaboration for the greater good and maintaining autonomy and
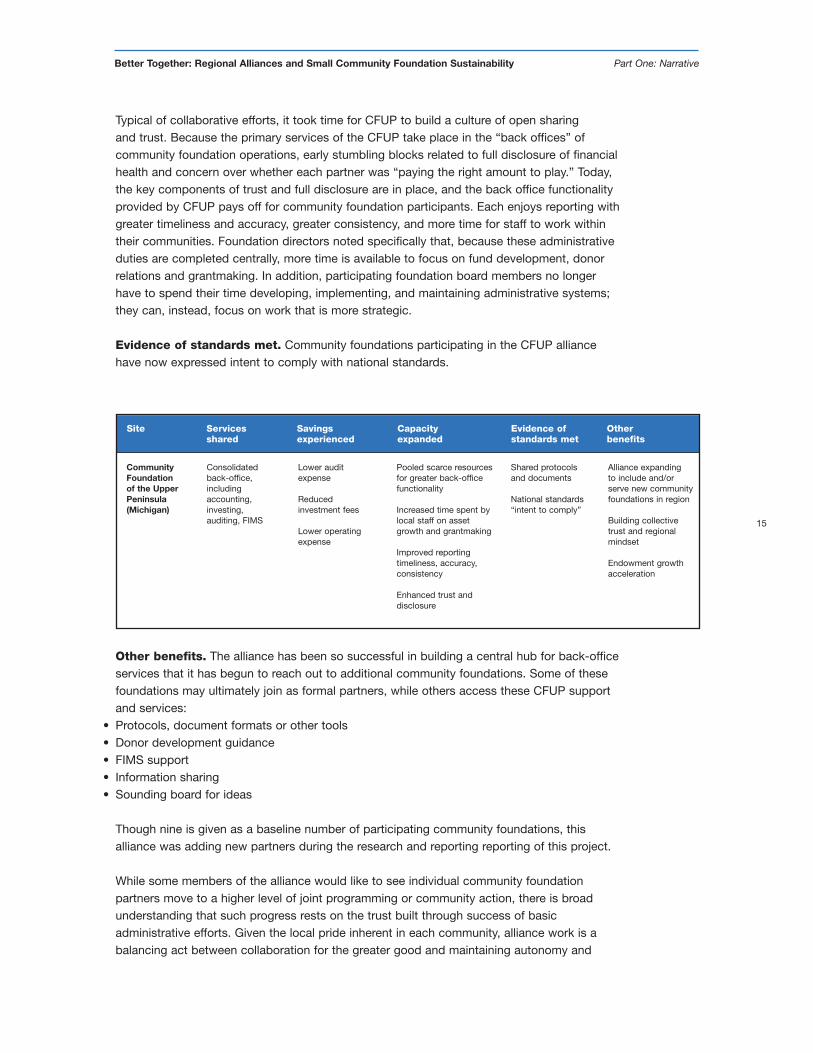
Site Services Savings Capacity Evidence of Othershared experienced expanded standards met benefits
CommunityFoundationof the UpperPeninsula(Michigan)
Consolidatedback-office,includingaccounting,investing, auditing, FIMS
Lower audit expense
Reduced investment fees
Lower operatingexpense
Pooled scarce resourcesfor greater back-officefunctionality
Increased time spent bylocal staff on assetgrowth and grantmaking
Improved reportingtimeliness, accuracy,consistency
Enhanced trust anddisclosure
Shared protocols and documents
National standards“intent to comply”
Alliance expanding to include and/orserve new communityfoundations in region
Building collectivetrust and regionalmindset
Endowment growthacceleration
16
Better Together: Regional Alliances and Small Community Foundation Sustainability Part One: Narrative
traditions of self-sufficiency. The process of sharing staff support has led to sharing costs,which has, in turn, nurtured a spirit of collective investment in the Upper Peninsula. At times,local foundation board or staff members have hesitated to embrace this model, concernedthat collective action would threaten local independence. Yet partner foundations havecontinued to work together over time and have begun to grow in number.
A significant additional benefit is growth in assets—particularly endowed assets. In just 28months, CFUP total endowments nearly tripled—growing from $4.5 million to $12.7 million.
Community Foundation Alliance (Indiana)
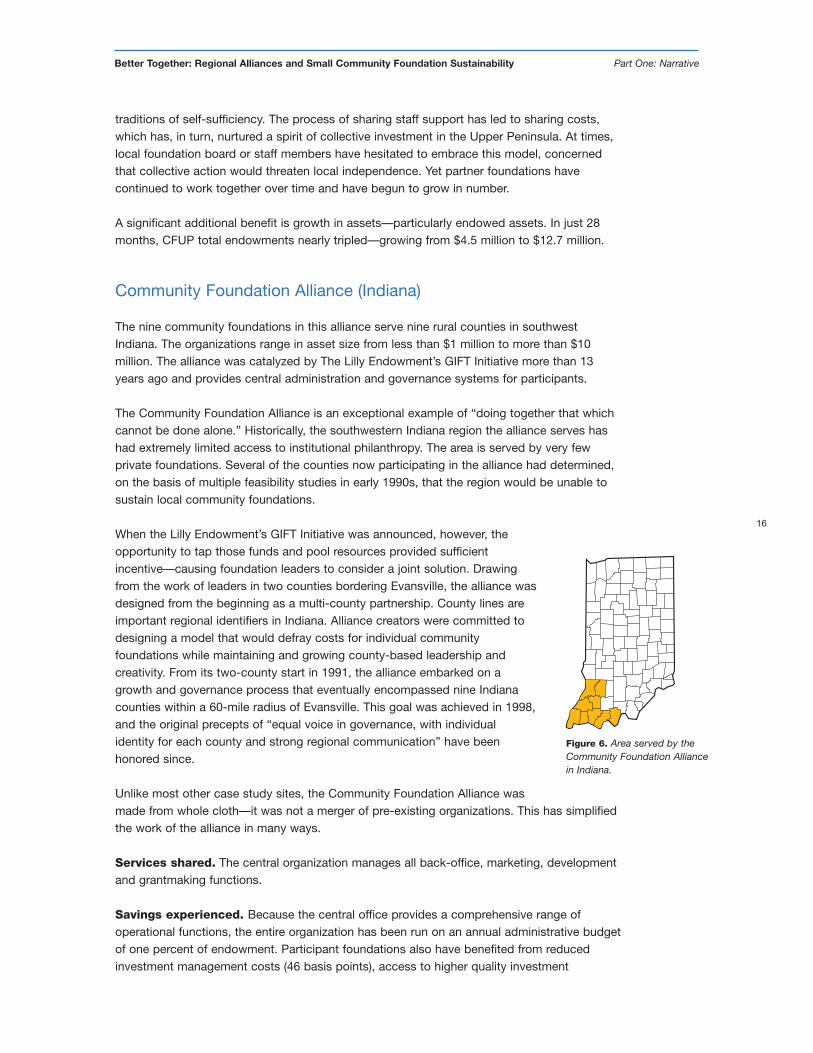
The nine community foundations in this alliance serve nine rural counties in southwestIndiana. The organizations range in asset size from less than $1 million to more than $10million. The alliance was catalyzed by The Lilly Endowment’s GIFT Initiative more than 13years ago and provides central administration and governance systems for participants.
The Community Foundation Alliance is an exceptional example of “doing together that whichcannot be done alone.” Historically, the southwestern Indiana region the alliance serves hashad extremely limited access to institutional philanthropy. The area is served by very fewprivate foundations. Several of the counties now participating in the alliance had determined,on the basis of multiple feasibility studies in early 1990s, that the region would be unable tosustain local community foundations.
When the Lilly Endowment’s GIFT Initiative was announced, however, theopportunity to tap those funds and pool resources provided sufficientincentive—causing foundation leaders to consider a joint solution. Drawingfrom the work of leaders in two counties bordering Evansville, the alliance wasdesigned from the beginning as a multi-county partnership. County lines areimportant regional identifiers in Indiana. Alliance creators were committed todesigning a model that would defray costs for individual communityfoundations while maintaining and growing county-based leadership andcreativity. From its two-county start in 1991, the alliance embarked on agrowth and governance process that eventually encompassed nine Indianacounties within a 60-mile radius of Evansville. This goal was achieved in 1998,and the original precepts of “equal voice in governance, with individualidentity for each county and strong regional communication” have beenhonored since.
Unlike most other case study sites, the Community Foundation Alliance wasmade from whole cloth—it was not a merger of pre-existing organizations. This has simplifiedthe work of the alliance in many ways.
Services shared. The central organization manages all back-office, marketing, developmentand grantmaking functions.
Savings experienced. Because the central office provides a comprehensive range ofoperational functions, the entire organization has been run on an annual administrative budgetof one percent of endowment. Participant foundations also have benefited from reducedinvestment management costs (46 basis points), access to higher quality investment
Figure 6. Area served by theCommunity Foundation Alliancein Indiana.
17
Better Together: Regional Alliances and Small Community Foundation Sustainability Part One: Narrative
managers due to the size of pooled assets, and the cost of a single joint audit. Auditefficiency alone is estimated to save $16,500 by avoiding the expense of nine separateanalyses.
Capacity expanded. None of the participating foundations believes it could individuallybuy the quality of services, such as investment management, it now enjoys through thiscollaborative effort. The equality of representation built into the governance structure and thealliance’s defined geographic focus on county borders have allowed for steady expansion ofalliance services without compromise to the individuality of each participant, or to the valuereceived by participants. Each county is allotted the same number of alliance board membersand receives the same services from a central office.14
Evidence of standards met. Community foundations participating in the CommunityFoundation Alliance have indicated intent to comply with national standards.
Other benefits. Together, alliance partners have raised more than $50 million for the region.As important, the alliance provides a coordinated regional voice to the outside world, recentlyattracting $19 million in philanthropic funds for regional educational initiatives.
Having sidestepped the formidable challenges of building a joint structure from pre-existingentities with distinct histories, programs and capacities, the Community Foundation Alliancefaces the inverse problem of retaining the local leadership, identities and priorities of its ninemember organizations. There is occasional tension between operating as a regional entity(for example, working to bring in funds for regional educational initiatives), and workingclosely and deeply on the independent priorities of each county community foundation. While the central office manages the administrative operations efficiently, the countyfoundation coordinators must serve “two masters” at all times: the local community and the regional alliance entity.
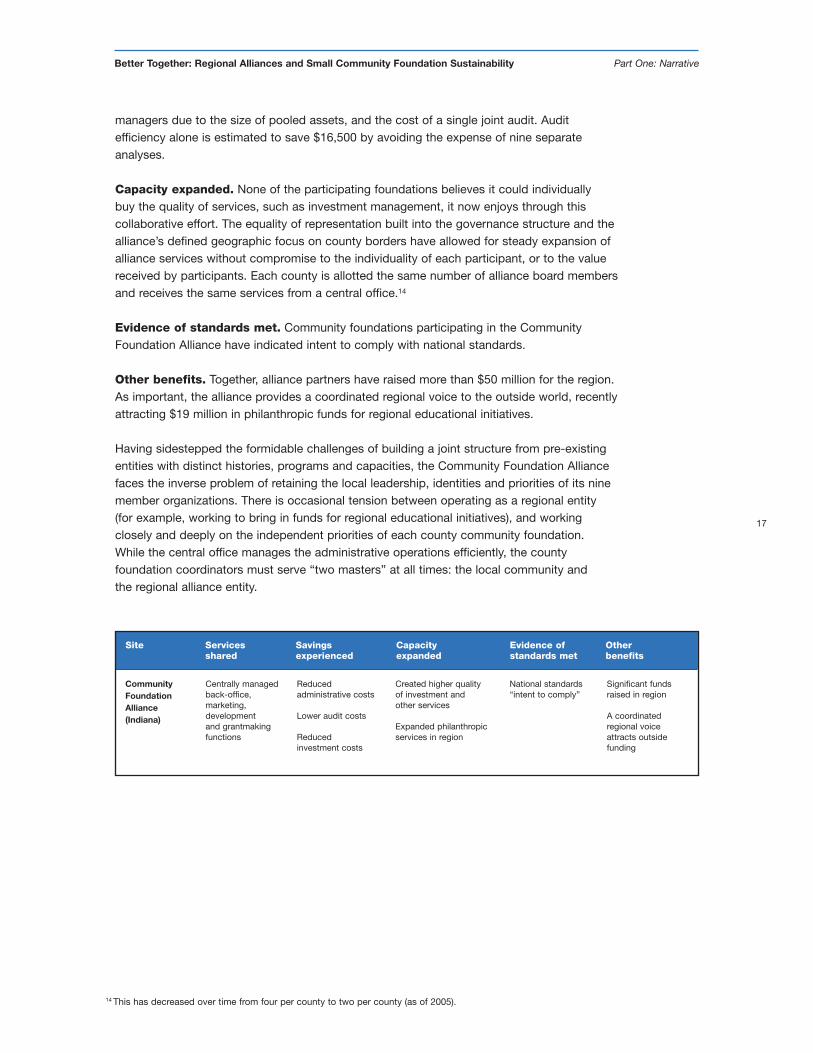
Site Services Savings Capacity Evidence of Othershared experienced expanded standards met benefits
CommunityFoundationAlliance(Indiana)
Centrally managedback-office,marketing,development and grantmakingfunctions
Reducedadministrative costs
Lower audit costs
Reduced investment costs
Created higher quality of investment and other services
Expanded philanthropicservices in region
National standards“intent to comply”
Significant fundsraised in region
A coordinated regional voice attracts outsidefunding
14 This has decreased over time from four per county to two per county (as of 2005).
18
Better Together: Regional Alliances and Small Community Foundation Sustainability Part One: Narrative
Humboldt Area Foundation (California)
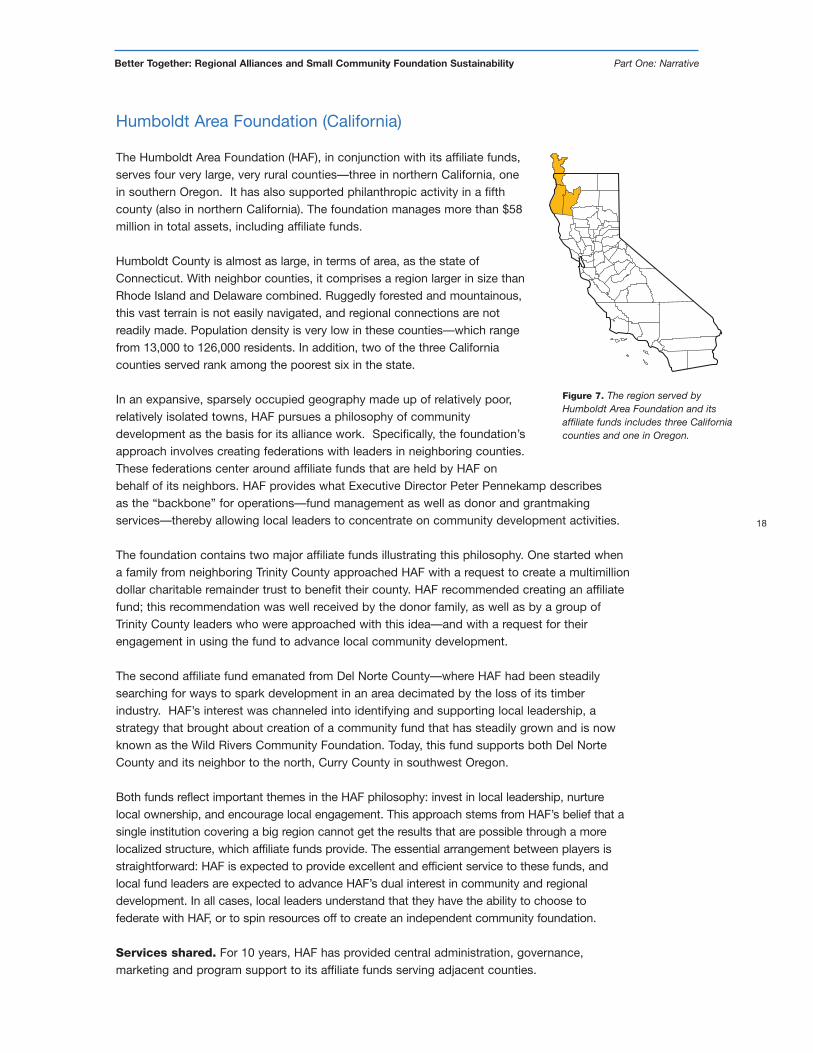
The Humboldt Area Foundation (HAF), in conjunction with its affiliate funds,serves four very large, very rural counties—three in northern California, onein southern Oregon. It has also supported philanthropic activity in a fifthcounty (also in northern California). The foundation manages more than $58million in total assets, including affiliate funds.
Humboldt County is almost as large, in terms of area, as the state ofConnecticut. With neighbor counties, it comprises a region larger in size thanRhode Island and Delaware combined. Ruggedly forested and mountainous,this vast terrain is not easily navigated, and regional connections are notreadily made. Population density is very low in these counties—which rangefrom 13,000 to 126,000 residents. In addition, two of the three Californiacounties served rank among the poorest six in the state.
In an expansive, sparsely occupied geography made up of relatively poor,relatively isolated towns, HAF pursues a philosophy of communitydevelopment as the basis for its alliance work. Specifically, the foundation’sapproach involves creating federations with leaders in neighboring counties.These federations center around affiliate funds that are held by HAF onbehalf of its neighbors. HAF provides what Executive Director Peter Pennekamp describesas the “backbone” for operations—fund management as well as donor and grantmakingservices—thereby allowing local leaders to concentrate on community development activities.
The foundation contains two major affiliate funds illustrating this philosophy. One started whena family from neighboring Trinity County approached HAF with a request to create a multimilliondollar charitable remainder trust to benefit their county. HAF recommended creating an affiliatefund; this recommendation was well received by the donor family, as well as by a group ofTrinity County leaders who were approached with this idea—and with a request for theirengagement in using the fund to advance local community development.
The second affiliate fund emanated from Del Norte County—where HAF had been steadilysearching for ways to spark development in an area decimated by the loss of its timberindustry. HAF’s interest was channeled into identifying and supporting local leadership, astrategy that brought about creation of a community fund that has steadily grown and is nowknown as the Wild Rivers Community Foundation. Today, this fund supports both Del NorteCounty and its neighbor to the north, Curry County in southwest Oregon.
Both funds reflect important themes in the HAF philosophy: invest in local leadership, nurturelocal ownership, and encourage local engagement. This approach stems from HAF’s belief that asingle institution covering a big region cannot get the results that are possible through a morelocalized structure, which affiliate funds provide. The essential arrangement between players isstraightforward: HAF is expected to provide excellent and efficient service to these funds, andlocal fund leaders are expected to advance HAF’s dual interest in community and regionaldevelopment. In all cases, local leaders understand that they have the ability to choose tofederate with HAF, or to spin resources off to create an independent community foundation.
Services shared. For 10 years, HAF has provided central administration, governance,marketing and program support to its affiliate funds serving adjacent counties.
Figure 7. The region served byHumboldt Area Foundation and itsaffiliate funds includes three Californiacounties and one in Oregon.
19
Better Together: Regional Alliances and Small Community Foundation Sustainability Part One: Narrative
Savings experienced. Affiliate assets are held at HAF and managed for a 1.5% (maximum)annual fee that covers all back office and administrative services. Core staff functions areprovided by HAF.
Capacity expanded. HAF provides an infrastructure for community philanthropy in placesthat are too poor to create this infrastructure. HAF’s affiliate fund services are delivered withthe understanding that local leaders are committed to pursuit of community and regionaldevelopment. Advisory boards in Del Norte and Trinity counties make use of HAF’s taxexemption, protocols and decision-making structures as they go about raising additionalfunds, identifying grant opportunities, and even hiring local staff. Those involved share theperspective that HAF is helping its neighboring counties build their futures, and that thesefutures are in local hands. HAF applied this process previously in Mendocino County, helpingto incubate what is now an independent community foundation.
Expectations are widely understood and accepted to the point where trust and handshakesare guiding operational tools. Although written agreements exist, the focus is on makingrelationships work, something that participants feel would be critical “even if we also investedin by-laws and attorney agreements.”15 By helping with administration, HAF frees up boardmembers in Trinity and Del Norte counties to focus on developing their communities—including bringing new donors to the table.
Evidence of standards met. The Humboldt Area Foundation has indicated intent to complywith national standards.
Other benefits. The HAF approach contains distinct wins. First, the foundation plays amentoring role with emerging community leaders and organizations. Second, alignment arounda regional development mindset broadens and deepens regional connectivity—generatingtangible benefits that include creation of a regional health center, establishment of a centerfor regional policy at Humboldt State University, development of a regional entrepreneurs’curriculum in area schools, and attraction of outside philanthropic resources to the region.16
Finally, HAF’s belief that supporting leaders and local fund ownership will generate greaterlocal impact has been proven through the emergence of dozens of new donors and gifts—involving many people of modest financial means—in areas served by affiliate funds.
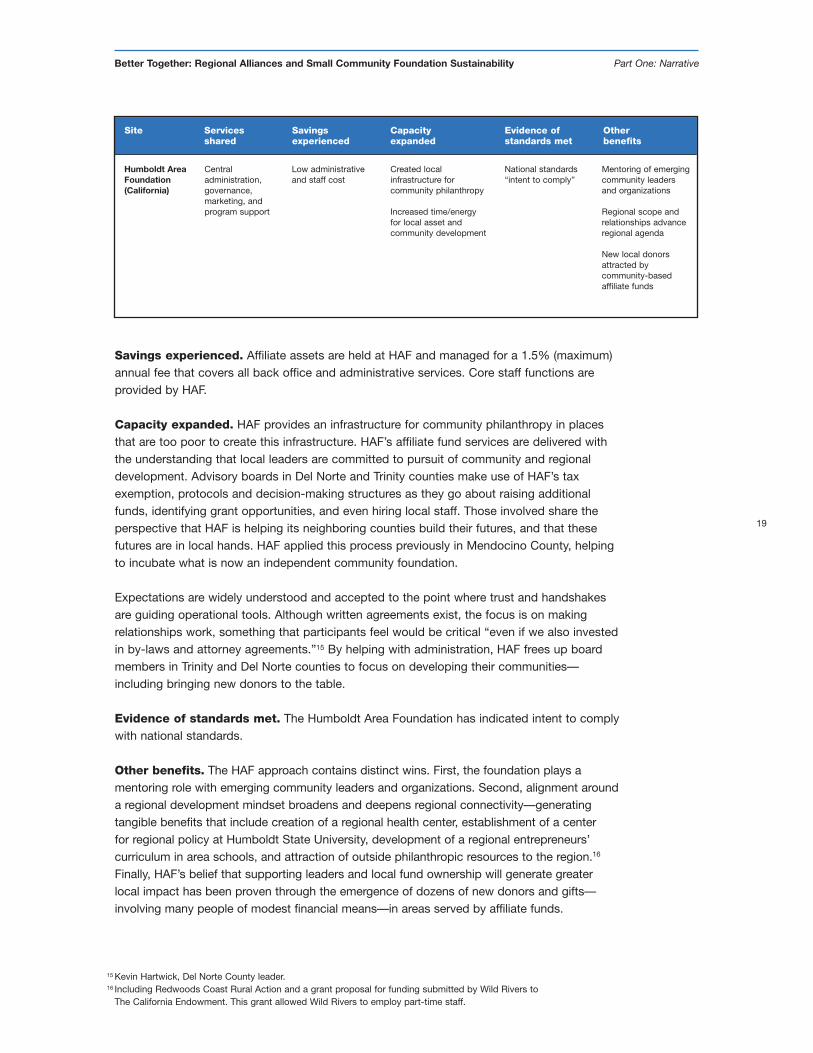
Site Services Savings Capacity Evidence of Othershared experienced expanded standards met benefits
Humboldt AreaFoundation(California)
Centraladministration,governance,marketing, andprogram support
Low administrativeand staff cost
Created localinfrastructure forcommunity philanthropy
Increased time/energy for local asset andcommunity development
National standards“intent to comply”
Mentoring of emergingcommunity leadersand organizations
Regional scope andrelationships advanceregional agenda
New local donorsattracted bycommunity-basedaffiliate funds
15 Kevin Hartwick, Del Norte County leader.16 Including Redwoods Coast Rural Action and a grant proposal for funding submitted by Wild Rivers to
The California Endowment. This grant allowed Wild Rivers to employ part-time staff.
20
Better Together: Regional Alliances and Small Community Foundation Sustainability Part One: Narrative
New Hampshire Charitable Foundation
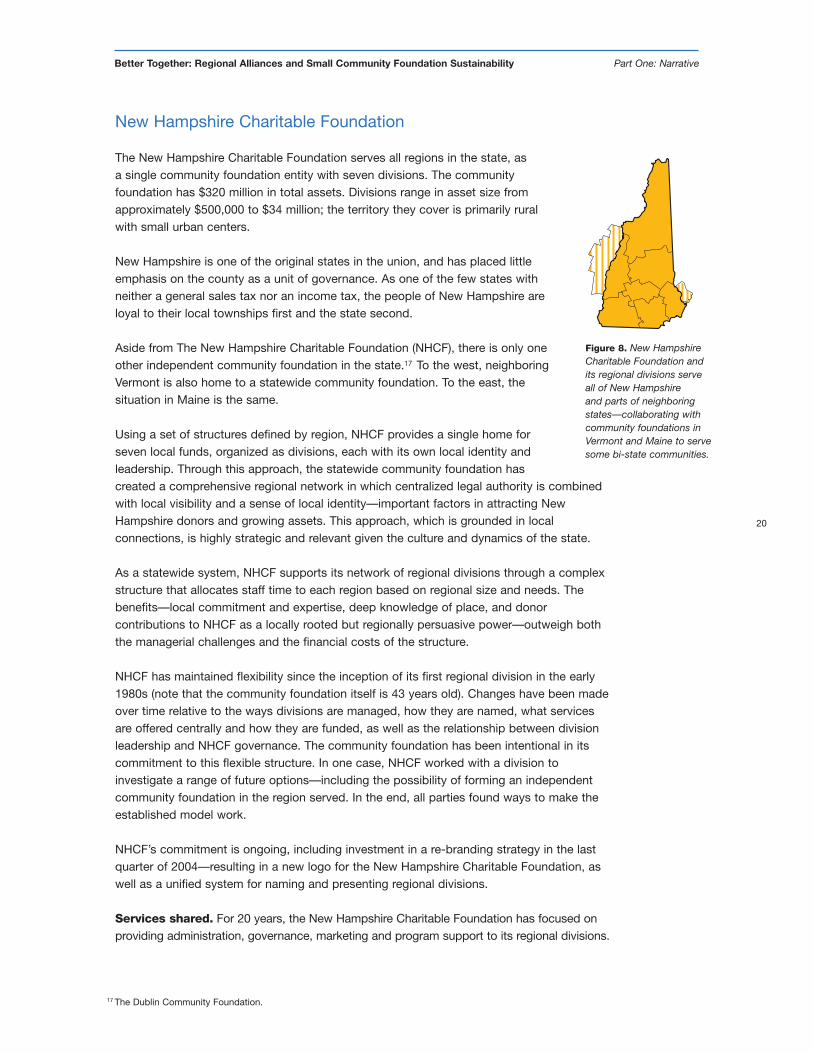
The New Hampshire Charitable Foundation serves all regions in the state, asa single community foundation entity with seven divisions. The communityfoundation has $320 million in total assets. Divisions range in asset size fromapproximately $500,000 to $34 million; the territory they cover is primarily ruralwith small urban centers.
New Hampshire is one of the original states in the union, and has placed littleemphasis on the county as a unit of governance. As one of the few states withneither a general sales tax nor an income tax, the people of New Hampshire areloyal to their local townships first and the state second.
Aside from The New Hampshire Charitable Foundation (NHCF), there is only oneother independent community foundation in the state.17 To the west, neighboringVermont is also home to a statewide community foundation. To the east, thesituation in Maine is the same.
Using a set of structures defined by region, NHCF provides a single home forseven local funds, organized as divisions, each with its own local identity andleadership. Through this approach, the statewide community foundation hascreated a comprehensive regional network in which centralized legal authority is combinedwith local visibility and a sense of local identity—important factors in attracting NewHampshire donors and growing assets. This approach, which is grounded in localconnections, is highly strategic and relevant given the culture and dynamics of the state.
As a statewide system, NHCF supports its network of regional divisions through a complexstructure that allocates staff time to each region based on regional size and needs. Thebenefits—local commitment and expertise, deep knowledge of place, and donorcontributions to NHCF as a locally rooted but regionally persuasive power—outweigh boththe managerial challenges and the financial costs of the structure.
NHCF has maintained flexibility since the inception of its first regional division in the early1980s (note that the community foundation itself is 43 years old). Changes have been madeover time relative to the ways divisions are managed, how they are named, what servicesare offered centrally and how they are funded, as well as the relationship between divisionleadership and NHCF governance. The community foundation has been intentional in itscommitment to this flexible structure. In one case, NHCF worked with a division toinvestigate a range of future options—including the possibility of forming an independentcommunity foundation in the region served. In the end, all parties found ways to make theestablished model work.
NHCF’s commitment is ongoing, including investment in a re-branding strategy in the lastquarter of 2004—resulting in a new logo for the New Hampshire Charitable Foundation, aswell as a unified system for naming and presenting regional divisions.
Services shared. For 20 years, the New Hampshire Charitable Foundation has focused onproviding administration, governance, marketing and program support to its regional divisions.
Figure 8. New HampshireCharitable Foundation andits regional divisions serveall of New Hampshireand parts of neighboringstates—collaborating withcommunity foundations inVermont and Maine to servesome bi-state communities.
17 The Dublin Community Foundation.
21
Better Together: Regional Alliances and Small Community Foundation Sustainability Part One: Narrative
Savings experienced. Each regional division retains the fees generated from all itsfunds. As regions grow and mature, these fees totally offset the charges to regions foradministrative, grantmaking, marketing and accounting support from the New HampshireCharitable Foundation. In a region’s start-up years, these charges are subsidized by thestatewide system. Only two regional divisions maintain separate office locations; the staffof the other five divisions are based in the central office in Concord.
Capacity expanded. Its approach allows the New Hampshire Charitable Foundation to“go deeply” in each region, benefiting from the passion, involvement and expertise of localcommunity leaders—with local staff who are able to concentrate on asset development andaddressing community needs. Each division’s advisory board participates to some extentin grantmaking, program initiatives, and donor cultivation and stewardship. In addition, thissingle legal entity/local division model attracted the interest of several national funders—generating seed money investments in the growth of philanthropic capacity in some regions.
Evidence of standards met. The New Hampshire Charitable Foundation has indicatedintent to comply with national standards.
Other benefits. While differences related to names, marketing and decision makingpersist, the New Hampshire Charitable Foundation approach demonstrates how a centralinvestment in creating services, protocols and systems can support growth in locallygenerated funds. Plus, this decentralized approach brings far more people into the processof community philanthropy—distributing involvement and increasing engagement throughdefined regional structures. For example, more than 90 people participate on regionaladvisory boards.
Site Services Savings Capacity Evidence of Othershared experienced expanded standards met benefits
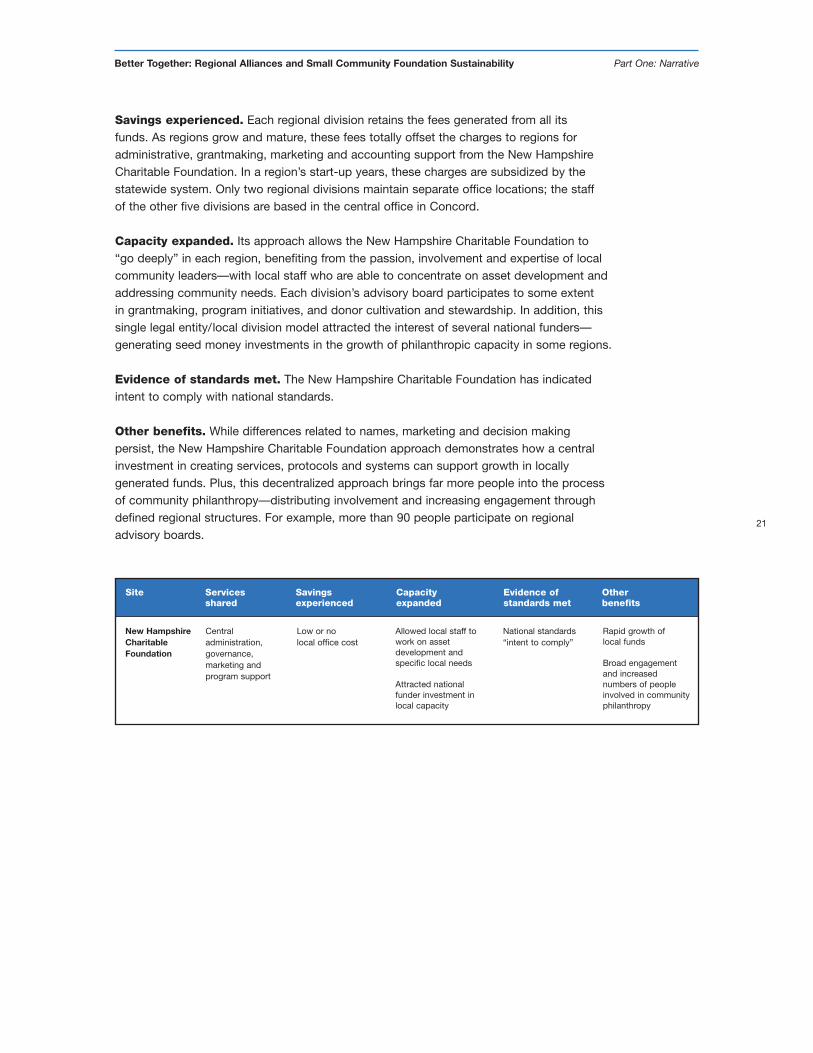
New HampshireCharitableFoundation
Centraladministration,governance,marketing andprogram support
Low or no local office cost
Allowed local staff towork on assetdevelopment andspecific local needs
Attracted nationalfunder investment inlocal capacity
National standards“intent to comply”
Rapid growth oflocal funds
Broad engagementand increasednumbers of peopleinvolved in communityphilanthropy
22
Better Together: Regional Alliances and Small Community Foundation Sustainability Part One: Narrative
Site study findings
Site study findings show a shared focus on providing better quality services, as well as arange of common and individual outcomes. The cases studied differ in size, age, focus andsuccess. Despite these differences, each is an operational model with a core purpose ofimproving community foundation reach (in terms of marketing and communications) and/orstreamlining or raising the quality of internal operations (in terms of accounting and services).
Quality first
First and foremost, participants recognize that “better” means quality first. This becameevident in case study investigations of structures and goals. Survey responses amplified thisfinding, revealing a prevalence of alliances focused on core operational functions such asmarketing, finance and reporting.
Cost sharing supports improvement
The experience of the five sites studied indicates that cost of quality can be shared inthe community foundation field. Consolidating back-office services is a technique usedto improve service quality at shared costs that are lower than many participating communityfoundations (or divisions) could individually afford. In several cases (Southwest Michigan,Humboldt, New Hampshire, Michigan’s Upper Peninsula) a lead entity subsidizes these costsfor others. It should be noted that, because the research team deliberately chose to examinesmaller foundations, the cases it selected had perhaps the greatest potential to demonstrateeconomies of scale and the least capacity to document them.
Asset growth happens
While a primary purpose in each of the five sites studied was to improve services, the HumboldtArea Foundation, New Hampshire Charitable Foundation and Community Foundation of theUpper Peninsula also pursued and gained new gifts and/or accelerated endowment growth.
The pooling of funds within Humboldt Area Foundation allowed local leaders to focus theirtime on outreach and communication. New gifts from local donors were realized within thefirst two years of the alliance’s formation. In addition, with the assistance of HAF leadershipand capacity, significant funds from other California foundations were also raised to addressissues in Trinity, Humboldt and Del Norte counties.
Similar dynamics became evident in New Hampshire. Regional leaders were able to focuson outreach because the time-consuming tasks of fund management, investments, andreporting were handled centrally. This allows these local volunteers to do what they dobest—identify needs, inform their peers, and raise awareness of opportunities available forlocal donors and organizations. The strategy of increasing awareness in the short term as aprerequisite to growing assets over the long term is working in this state.
In Michigan’s Upper Peninsula, the greater presence and credibility of the alliancecontributed to its very rapid growth in endowment funds (from $4.5 million to more than$12.7 million) over the initial 28-month period.
23
Better Together: Regional Alliances and Small Community Foundation Sustainability Part One: Narrative
Opportunistic origins
The models studied were formed around timely needs and situations that drew upon thedynamic, flexible and opportunistic characteristics of participants. They illustrate the ability ofcommunity foundation leaders to strategically assess and respond to organizational andmarketplace needs.
Success factors
In the cases studied, success was accompanied by a set ofkey ingredients: leadership and persistence, flexiblearrangements, and respect for local expertise. Conversely,struggles took place when “border issues” ignited, when keypeople left, or when one partner felt the others no longershared its values.
Reaching higher standards
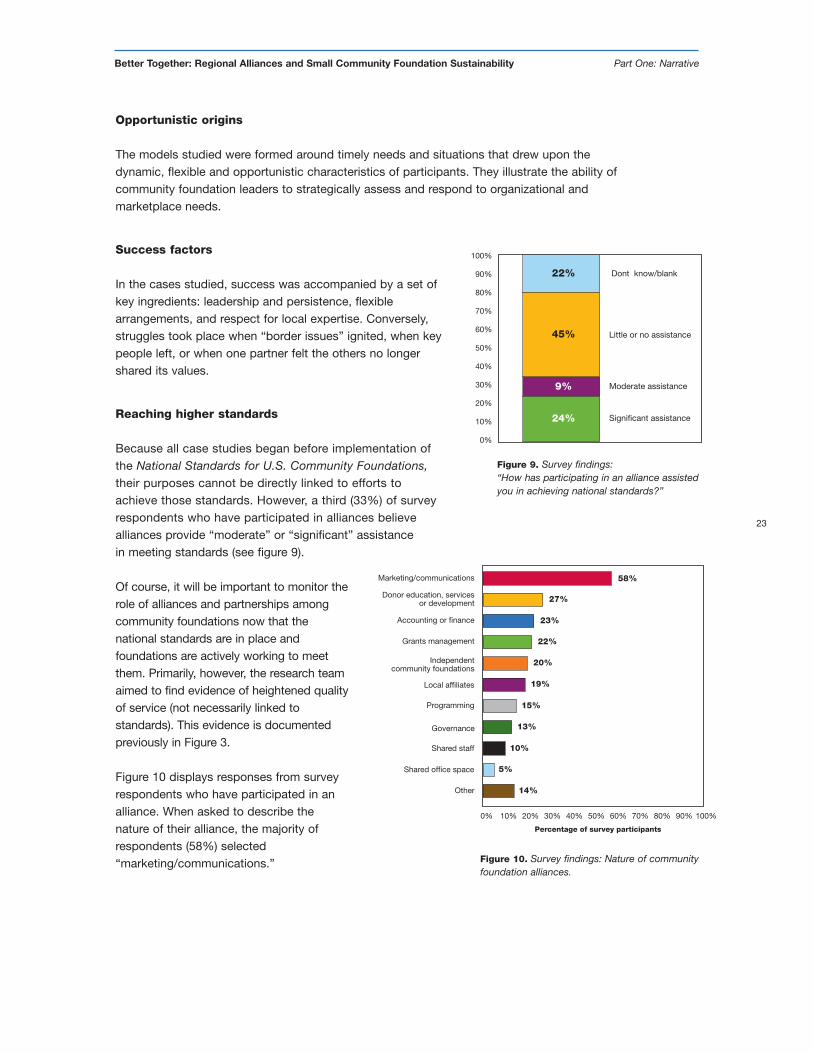
Because all case studies began before implementation ofthe National Standards for U.S. Community Foundations,their purposes cannot be directly linked to efforts toachieve those standards. However, a third (33%) of surveyrespondents who have participated in alliances believealliances provide “moderate” or “significant” assistancein meeting standards (see figure 9).
Of course, it will be important to monitor therole of alliances and partnerships amongcommunity foundations now that thenational standards are in place andfoundations are actively working to meetthem. Primarily, however, the research teamaimed to find evidence of heightened qualityof service (not necessarily linked tostandards). This evidence is documentedpreviously in Figure 3.
Figure 10 displays responses from surveyrespondents who have participated in analliance. When asked to describe thenature of their alliance, the majority ofrespondents (58%) selected“marketing/communications.”
100%
90%
80%
70%
60%
50%
40%
30%
20%
10%
0%
22% Donít know/blank
45% Little or no assistance
9% Moderate assistance
24% Significant assistance
Figure 9. Survey findings:“How has participating in an alliance assistedyou in achieving national standards?”
Marketing/communications
Percentage of survey participants
0% 20% 40% 60% 100%80%
Donor education, servicesor development
Accounting or finance
Independentcommunity foundations
58%
27%
23%
20%
Local affiliates
Grants management 22%
Programming
19%
15%
Governance
Shared staff
Shared office space
Other
13%
10%
5%
14%
10% 30% 50% 70% 90%
Figure 10. Survey findings: Nature of communityfoundation alliances.
24
Better Together: Regional Alliances and Small Community Foundation Sustainability Part One: Narrative
The second most common characteristicof the nature of alliances described bysurvey participants was “donor education,services, or development.” To these surveyrespondents, “better” means improvementsto operations, growth of expertise, andincreased quality of donor services.
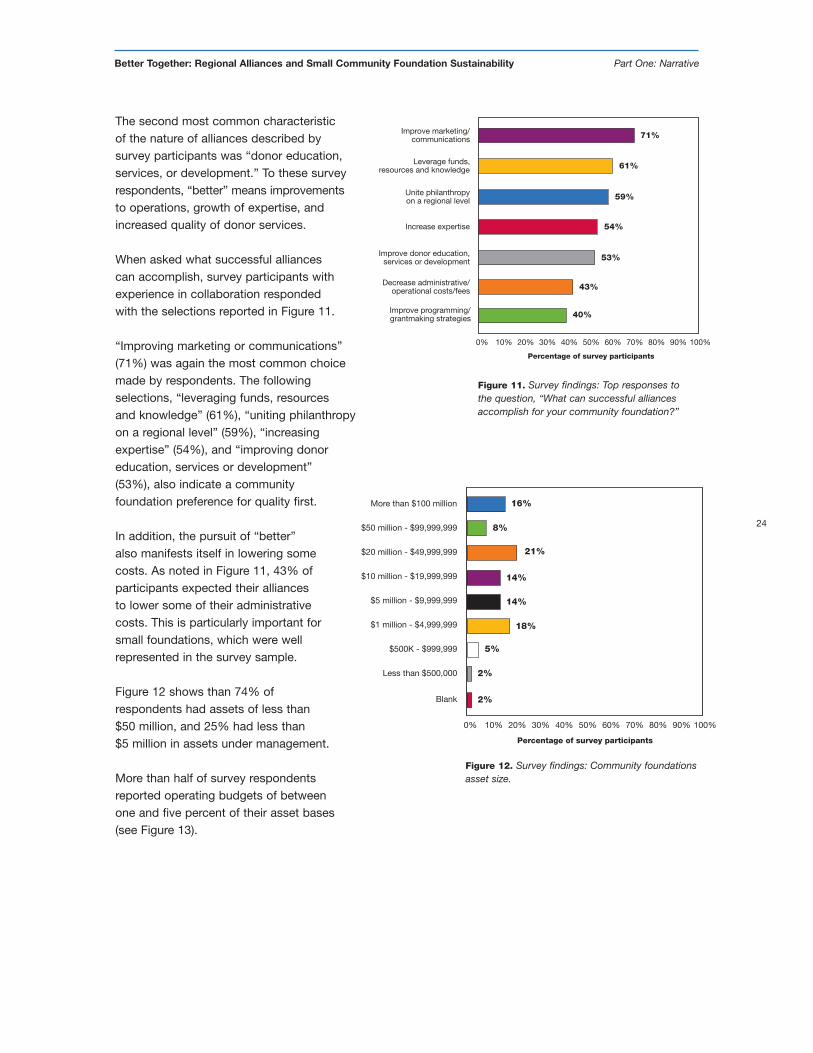
When asked what successful alliancescan accomplish, survey participants withexperience in collaboration respondedwith the selections reported in Figure 11.
“Improving marketing or communications”(71%) was again the most common choicemade by respondents. The followingselections, “leveraging funds, resourcesand knowledge” (61%), “uniting philanthropyon a regional level” (59%), “increasingexpertise” (54%), and “improving donoreducation, services or development”(53%), also indicate a communityfoundation preference for quality first.
In addition, the pursuit of “better”also manifests itself in lowering somecosts. As noted in Figure 11, 43% ofparticipants expected their alliancesto lower some of their administrativecosts. This is particularly important forsmall foundations, which were wellrepresented in the survey sample.
Figure 12 shows than 74% ofrespondents had assets of less than$50 million, and 25% had less than$5 million in assets under management.
More than half of survey respondentsreported operating budgets of betweenone and five percent of their asset bases (see Figure 13).
Improve marketing/communications
Percentage of survey participants
0% 20% 40% 60% 100%80%
Leverage funds,resources and knowledge
Unite philanthropyon a regional level
71%
Improve donor education,services or development
Increase expertise
Decrease administrative/operational costs/fees
59%
61%
54%
53%
43%
Improve programming/grantmaking strategies 40%
10% 30% 50% 70% 90%
Figure 11. Survey findings: Top responses tothe question, “What can successful alliancesaccomplish for your community foundation?”
Blank
0% 20% 40% 60% 100%80%
More than $100 million
$50 million - $99,999,999
$10 million - $19,999,999
2%
$5 million - $9,999,999
$20 million - $49,999,999
$1 million - $4,999,999
10% 30% 50% 70% 90%
16%
$500K - $999,999
Less than $500,000
8%
21%
14%
14%
18%
5%
2%
Percentage of survey participants
Figure 12. Survey findings: Community foundationsasset size.
25
Better Together: Regional Alliances and Small Community Foundation Sustainability Part One: Narrative
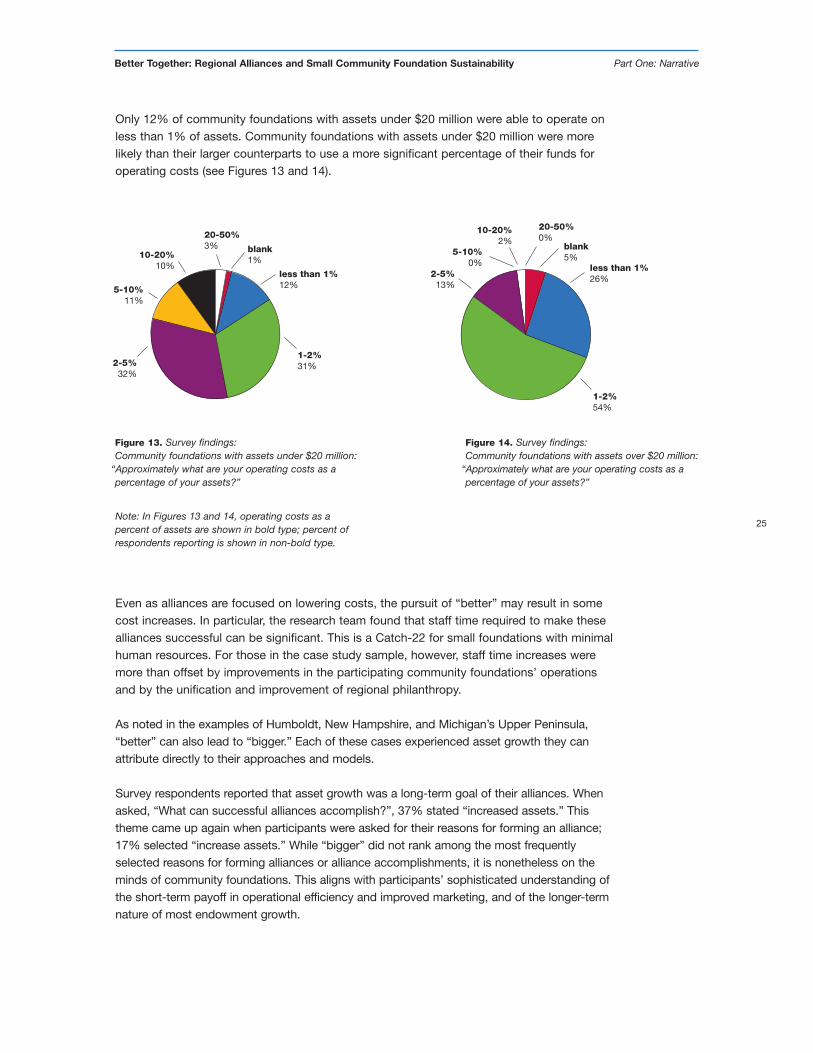
Only 12% of community foundations with assets under $20 million were able to operate onless than 1% of assets. Community foundations with assets under $20 million were morelikely than their larger counterparts to use a more significant percentage of their funds foroperating costs (see Figures 13 and 14).
Even as alliances are focused on lowering costs, the pursuit of “better” may result in somecost increases. In particular, the research team found that staff time required to make thesealliances successful can be significant. This is a Catch-22 for small foundations with minimalhuman resources. For those in the case study sample, however, staff time increases weremore than offset by improvements in the participating community foundations’ operationsand by the unification and improvement of regional philanthropy.
As noted in the examples of Humboldt, New Hampshire, and Michigan’s Upper Peninsula,“better” can also lead to “bigger.” Each of these cases experienced asset growth they canattribute directly to their approaches and models.
Survey respondents reported that asset growth was a long-term goal of their alliances. Whenasked, “What can successful alliances accomplish?”, 37% stated “increased assets.” Thistheme came up again when participants were asked for their reasons for forming an alliance;17% selected “increase assets.” While “bigger” did not rank among the most frequentlyselected reasons for forming alliances or alliance accomplishments, it is nonetheless on theminds of community foundations. This aligns with participants’ sophisticated understanding ofthe short-term payoff in operational efficiency and improved marketing, and of the longer-termnature of most endowment growth.
blank1%
less than 1%12%
1-2%31%2-5%
32%
5-10%11%
10-20%10%
20-50%3%
Figure 13. Survey findings:Community foundations with assets under $20 million:
“Approximately what are your operating costs as apercentage of your assets?”
Figure 14. Survey findings:Community foundations with assets over $20 million:
“Approximately what are your operating costs as apercentage of your assets?”
blank5%
less than 1%26%
1-2%54%
2-5%13%
10-20%2%
5-10%0%
20-50%0%
Note: In Figures 13 and 14, operating costs as apercent of assets are shown in bold type; percent ofrespondents reporting is shown in non-bold type.
26
Better Together: Regional Alliances and Small Community Foundation Sustainability Part One: Narrative
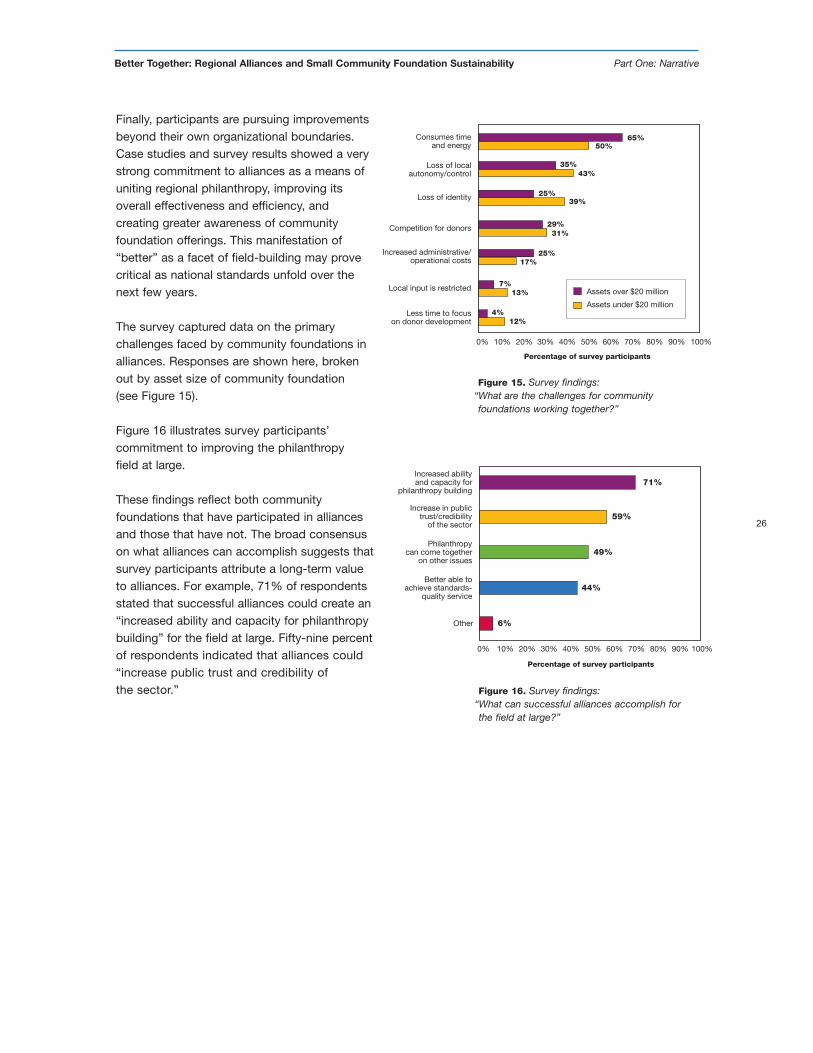
Finally, participants are pursuing improvementsbeyond their own organizational boundaries.Case studies and survey results showed a verystrong commitment to alliances as a means ofuniting regional philanthropy, improving itsoverall effectiveness and efficiency, andcreating greater awareness of communityfoundation offerings. This manifestation of“better” as a facet of field-building may provecritical as national standards unfold over thenext few years.
The survey captured data on the primarychallenges faced by community foundations inalliances. Responses are shown here, brokenout by asset size of community foundation(see Figure 15).
Figure 16 illustrates survey participants’commitment to improving the philanthropyfield at large.
These findings reflect both communityfoundations that have participated in alliancesand those that have not. The broad consensuson what alliances can accomplish suggests thatsurvey participants attribute a long-term valueto alliances. For example, 71% of respondentsstated that successful alliances could create an“increased ability and capacity for philanthropybuilding” for the field at large. Fifty-nine percentof respondents indicated that alliances could“increase public trust and credibility ofthe sector.”
Increased abilityand capacity for
philanthropy building
Percentage of survey participants
0% 20% 40% 60% 100%80%
Increase in publictrust/credibility
of the sector
Philanthropycan come together
on other issues
Better able toachieve standards-
quality service
71%
10% 30% 50% 70% 90%
Other
59%
49%
44%
6%
Figure 16. Survey findings:“What can successful alliances accomplish forthe field at large?”
Consumes timeand energy
Percentage of survey participants
0% 20% 40% 60% 100%80%
Loss of localautonomy/control
65%
Competition for donors
Loss of identity
Increased administrative/operational costs
Local input is restricted
Less time to focuson donor development
10% 30% 50% 70% 90%
Assets under $20 million
Assets over $20 million
50%
35%43%
25%39%
29%31%
25%17%
7%13%
12%4%
Figure 15. Survey findings:“What are the challenges for communityfoundations working together?”
27
Better Together: Regional Alliances and Small Community Foundation Sustainability Part One: Narrative
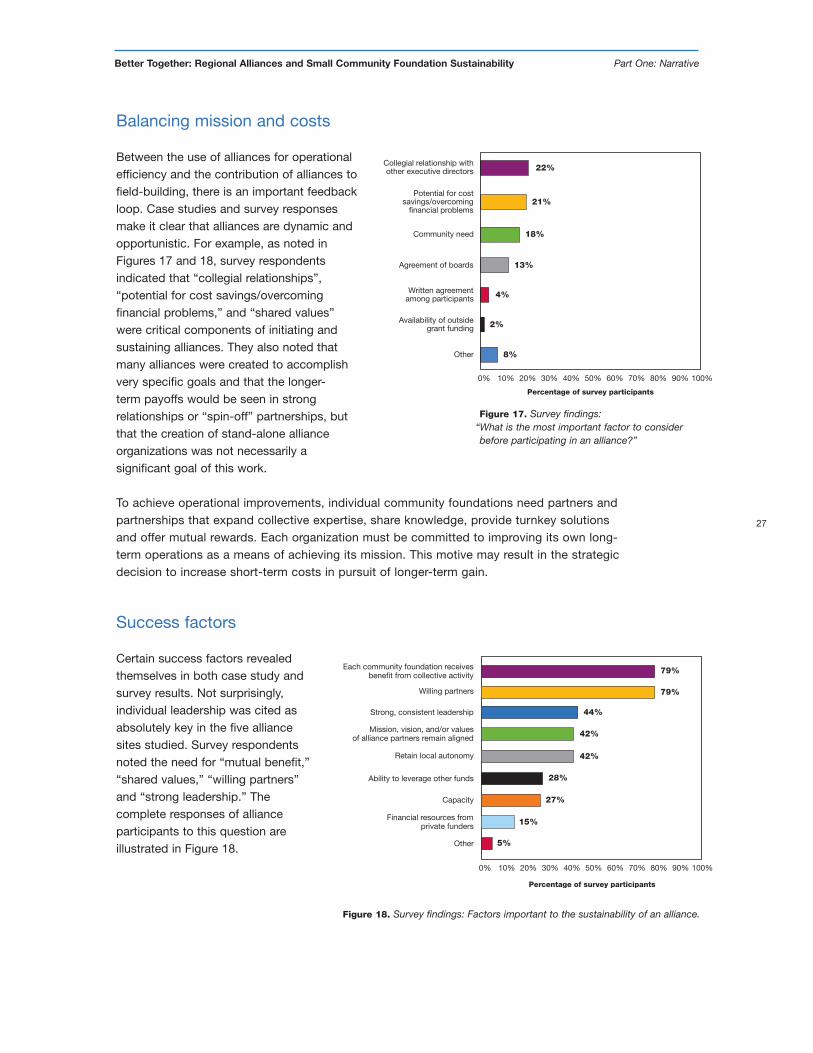
Balancing mission and costs
Between the use of alliances for operationalefficiency and the contribution of alliances tofield-building, there is an important feedbackloop. Case studies and survey responsesmake it clear that alliances are dynamic andopportunistic. For example, as noted inFigures 17 and 18, survey respondentsindicated that “collegial relationships”,“potential for cost savings/overcomingfinancial problems,” and “shared values”were critical components of initiating andsustaining alliances. They also noted thatmany alliances were created to accomplishvery specific goals and that the longer-term payoffs would be seen in strongrelationships or “spin-off” partnerships, butthat the creation of stand-alone allianceorganizations was not necessarily asignificant goal of this work.
To achieve operational improvements, individual community foundations need partners andpartnerships that expand collective expertise, share knowledge, provide turnkey solutionsand offer mutual rewards. Each organization must be committed to improving its own long-term operations as a means of achieving its mission. This motive may result in the strategicdecision to increase short-term costs in pursuit of longer-term gain.
Success factors
Certain success factors revealedthemselves in both case study andsurvey results. Not surprisingly,individual leadership was cited asabsolutely key in the five alliancesites studied. Survey respondentsnoted the need for “mutual benefit,”“shared values,” “willing partners”and “strong leadership.” Thecomplete responses of allianceparticipants to this question areillustrated in Figure 18.
Collegial relationship withother executive directors
Percentage of survey participants
0% 20% 40% 60% 100%80%
Potential for costsavings/overcoming
financial problems
Community need
Availability of outsidegrant funding
22%
10% 30% 50% 70% 90%
Other
Agreement of boards
Written agreementamong participants
21%
18%
13%
4%
2%
8%
Figure 17. Survey findings:“What is the most important factor to considerbefore participating in an alliance?”
Each community foundation receivesbenefit from collective activity
Percentage of survey participants
0% 20% 40% 60% 100%80%
Willing partners
Strong, consistent leadership
79%
Retain local autonomy
Mission, vision, and/or valuesof alliance partners remain aligned
Ability to leverage other funds
Capacity
79%
Financial resources fromprivate funders
Other
10% 30% 50% 70% 90%
44%
42%
42%
28%
27%
15%
5%
Figure 18. Survey findings: Factors important to the sustainability of an alliance.
28
Better Together: Regional Alliances and Small Community Foundation Sustainability Part One: Narrative
As noted prior in this report, flexibility was also a significant factor in the success of thealliances studied or surveyed. Alliances benefited from taking an opportunistic, entrepreneurialapproach. This was facilitated by the commonly held attitude that alliances present primarilyshort-term benefits with the potential for long-term growth. Overall, research participantsindicate a commitment to value for all interested partners, more so than a focus on a rigidstructure for the alliance relationship. These attitudes and approaches may shift as nationalstandards are implemented.
Areas for further research
The research team has identified several new inquiries that merit future exploration. Basedon the timing of this study and the recent implementation of national standards, many ofthese inquiry areas are related to potential relationships between standards, alliances andregionalism. Key questions are noted here:
• How do alliances relate to standards? How do existing alliances shift in the contextof standards?
• What roles do regional associations play in nurturing alliances or meeting standards?• Will national standards shift the scale of alliances, either beyond regions or to other
types of community foundations within regions (i.e., issues- or identity-based communityfoundations)?
• How do boards of directors influence alliances in terms of initiation and maintenance?• How are alliances affected by or dependent on the staffing structures of community
foundations? • What are the most significant long-term benefits for community foundations participating in
alliances? Are there universal characteristics of success?
Conclusion
What role do regional alliances play in helping community foundations, especially those withunder $20 million in assets, achieve financial sustainability?
Simply put, this research shows that alliances have the potential to reduce communityfoundations’ operational costs and increase their organizational capacity, thus strengtheningtheir prospects for sustainability.
The case studies bring these findings to life. The Michigan Upper Peninsula and Indianacases demonstrate that community foundations can achieve significantly reduced audit costs,negotiated investment management fees, and decreased overall operating expenses. Allinvolved in the New Hampshire and Humboldt cases agree that participants in their modelsreceive administrative, grantmaking and donor development services for a fraction of what itwould cost them to manage these functions as independent community foundations. Andwhile community foundations may not necessarily find decreased administrative costs anincentive for collaboration—only 14% of the survey respondents cite this as an importantreason for forming an alliance—43% of survey respondents experienced a decrease inadministrative/operational costs and fees as a result of their alliances.
29
Better Together: Regional Alliances and Small Community Foundation Sustainability Part One: Narrative
All case study participants benefited from strengthened organizational capacities. Asevidenced by the Southwest Michigan case, community foundations can improve theiraccounting systems, overall financial health, and administrative efficiencies throughcollaboration—in addition to removing these responsibilities from overburdened executivedirectors. Another benefit, apparent in both Michigan cases, is more efficient, consistent andaccurate financial reporting. The Humboldt, Indiana and New Hampshire cases also showthat a community foundation can benefit from a shared, central staff and infrastructurecapacity, enabling it to focus its own efforts on developing local leadership. Humboldt andIndiana were able to expand their geographic reach supported by a stronger infrastructure.New Hampshire improved its local reach and impact through organizing its statewide territoryinto seven regional divisions.
Beyond stronger capacities and decreased operational costs, evidence of additional benefitsemerges from this research. A sizable 61% of survey respondents report leveragingcommunity foundation funds, resources and knowledge as a key accomplishment of theiralliances. Wild Rivers Community Foundation reaps this benefit daily as local staff takesadvantage of Humboldt Area Foundation’s operational protocols and institutional knowledge,as well as outside grant support made possible through a shared regional approach.
Research findings also hint at stronger regional voice and policy presence as a potentialbenefit. One of the most reported accomplishments of an alliance, cited by 59% of surveyrespondents with alliance experience, is uniting philanthropy on a regional level. The NewHampshire and Humboldt Area cases exemplify a united regional voice and havedemonstrated regional policy successes as a result of their work.
Community foundations in the United States have experienced a formative two decades.Evidence of a maturing field includes rapid growth in numbers and assets, the developmentof sector-wide support organizations such as Community Foundations of America and theCommunity Foundations Leadership Team of the Council on Foundations, and the globalspread of community foundation concepts and services. The national standards movement isthe latest—and perhaps the most influential—indicator of an industry-wide commitment tooperational excellence and to a robust national presence.
Buried within this broad story, however, are signs of an important shift in assumptions thathave guided the proliferation of community foundations. A core assumption for many wasthat success of the field meant a community foundation in every county. The early experienceof the models studied—the variety of forms they take, and their focus on shared operations,accountability and governance—implies that we are entering an age where the goal is,instead, accessible, effective community philanthropy for every county.
This research highlights the purposes and accomplishments, both near- and long-term, ofregional alliances among community foundations. It also highlights variety: There are as manytypes of alliances as there are reasons to partner or partners to join.
Among study participants, there is broad interest in and use of alliances, accompanied byrecognition that their impetus is often around short-term gain, and that their durability isdependent on flexibility. As the national standards era unfolds, and common measures,systems and data sets emerge, it will be important to note how alliances flex to shapecommunity foundation operating structures, personnel and board decisions, and provision ofquality philanthropic services in local communities.
Geographic distribution of respondents 31
Intent toward standards 32
Experience with alliances 33
Group 1 responses(from respondents with no alliance experience) 35
Group 2 responses(from respondents with alliance experience) 36
Demographics 48
The complete survey research report is available online
from Public Policy Associates, Inc. (www.publicpolicy.com)
Part Two: Survey Findings
This section reports on a survey conducted in late 2004,
involving responses from 210 members of the U.S. community
foundation field to investigate a core research question: What
role do regional alliances play in helping community foundations,
especially those with under $20 million in assets, achieve
greater financial sustainability?
B E T T E R together
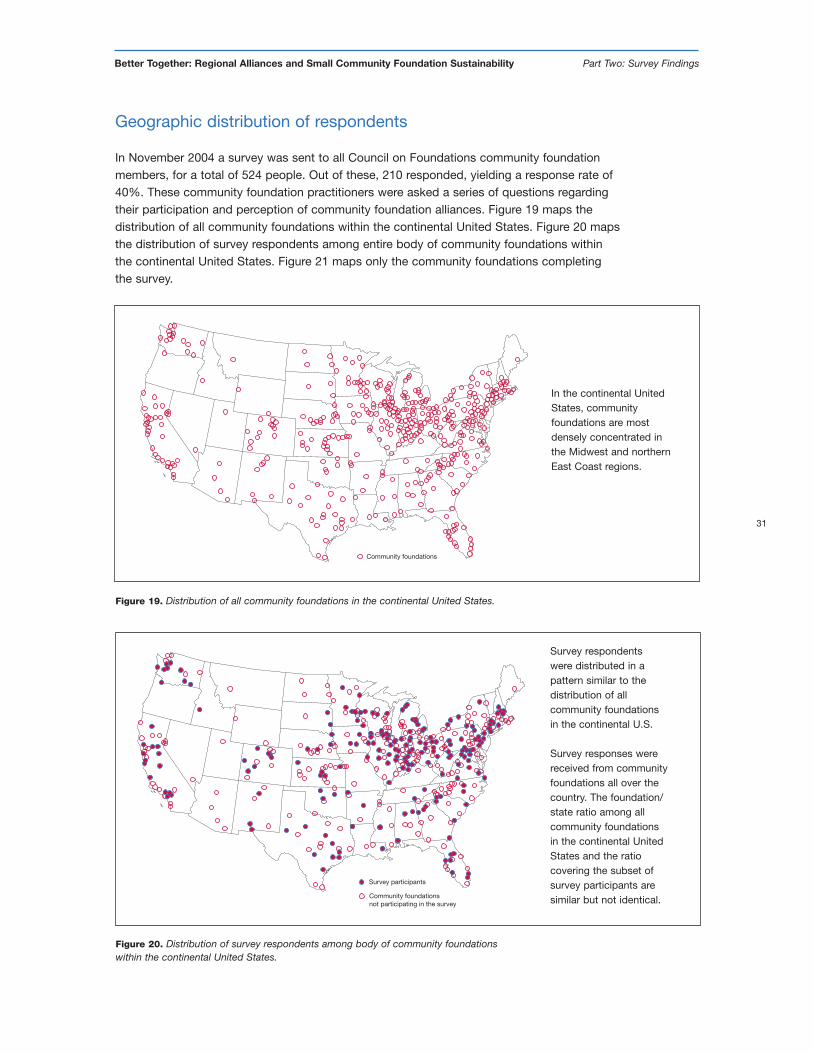
Community foundations
Geographic distribution of respondents
In November 2004 a survey was sent to all Council on Foundations community foundationmembers, for a total of 524 people. Out of these, 210 responded, yielding a response rate of40%. These community foundation practitioners were asked a series of questions regardingtheir participation and perception of community foundation alliances. Figure 19 maps thedistribution of all community foundations within the continental United States. Figure 20 mapsthe distribution of survey respondents among entire body of community foundations withinthe continental United States. Figure 21 maps only the community foundations completingthe survey.
31
Better Together: Regional Alliances and Small Community Foundation Sustainability Part Two: Survey Findings
In the continental UnitedStates, communityfoundations are mostdensely concentrated inthe Midwest and northernEast Coast regions.
Survey respondentswere distributed in apattern similar to thedistribution of allcommunity foundationsin the continental U.S.
Survey responses werereceived from communityfoundations all over thecountry. The foundation/state ratio among allcommunity foundationsin the continental UnitedStates and the ratiocovering the subset ofsurvey participants aresimilar but not identical.
Survey participants
Community foundationsnot participating in the survey
Figure 19. Distribution of all community foundations in the continental United States.
Figure 20. Distribution of survey respondents among body of community foundationswithin the continental United States.
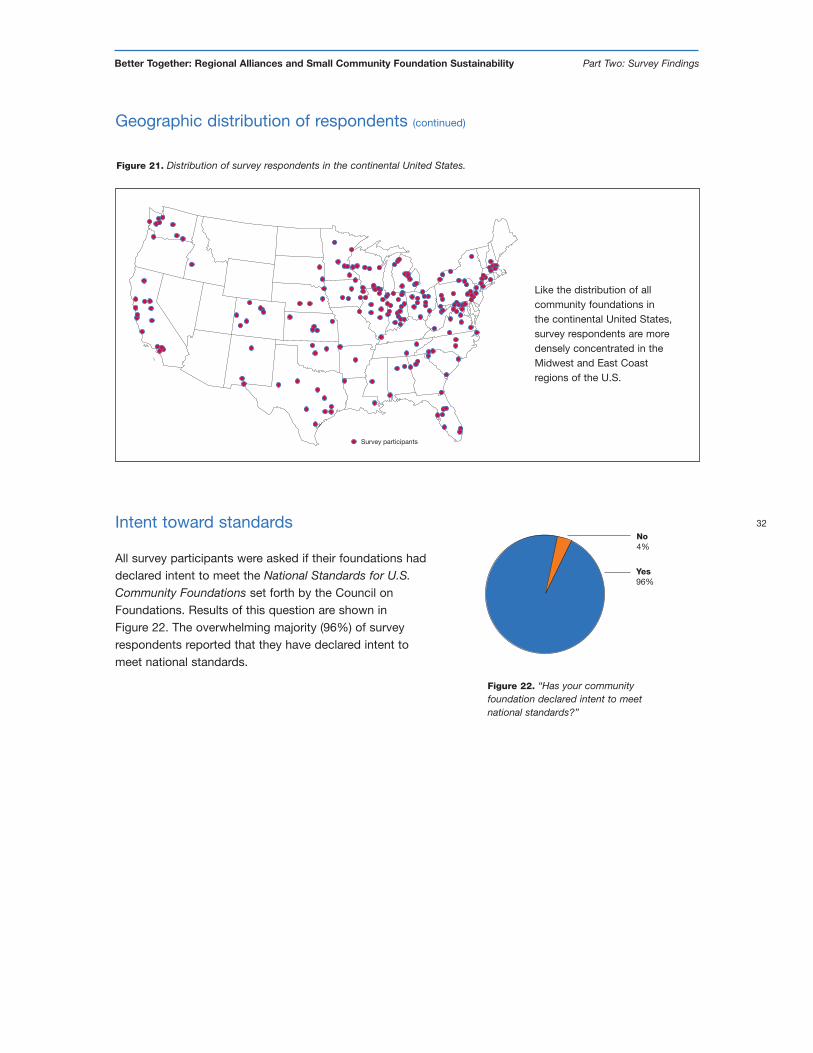
Intent toward standards
All survey participants were asked if their foundations haddeclared intent to meet the National Standards for U.S.Community Foundations set forth by the Council onFoundations. Results of this question are shown inFigure 22. The overwhelming majority (96%) of surveyrespondents reported that they have declared intent tomeet national standards.
32
Better Together: Regional Alliances and Small Community Foundation Sustainability Part Two: Survey Findings
Like the distribution of allcommunity foundations inthe continental United States,survey respondents are moredensely concentrated in theMidwest and East Coastregions of the U.S.
Survey participants
No4%
Yes96%
Figure 22. “Has your communityfoundation declared intent to meetnational standards?”
Figure 21. Distribution of survey respondents in the continental United States.
Geographic distribution of respondents (continued)
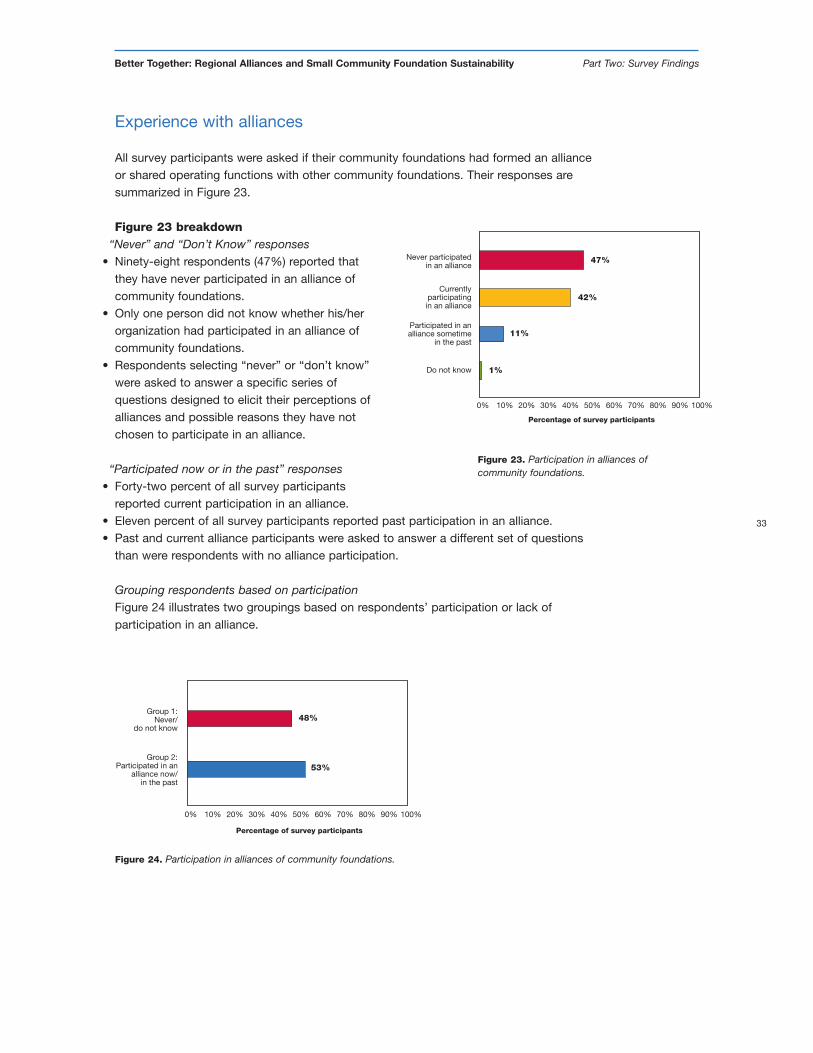
Experience with alliances
All survey participants were asked if their community foundations had formed an allianceor shared operating functions with other community foundations. Their responses aresummarized in Figure 23.
Figure 23 breakdown“Never” and “Don’t Know” responses
• Ninety-eight respondents (47%) reported thatthey have never participated in an alliance ofcommunity foundations.
• Only one person did not know whether his/herorganization had participated in an alliance ofcommunity foundations.
• Respondents selecting “never” or “don’t know”were asked to answer a specific series ofquestions designed to elicit their perceptions ofalliances and possible reasons they have notchosen to participate in an alliance.
“Participated now or in the past” responses• Forty-two percent of all survey participants
reported current participation in an alliance.• Eleven percent of all survey participants reported past participation in an alliance.• Past and current alliance participants were asked to answer a different set of questions
than were respondents with no alliance participation.
Grouping respondents based on participationFigure 24 illustrates two groupings based on respondents’ participation or lack ofparticipation in an alliance.
33
Better Together: Regional Alliances and Small Community Foundation Sustainability Part Two: Survey Findings
Never participatedin an alliance
Percentage of survey participants
0% 20% 40% 60% 100%80%
Currentlyparticipatingin an alliance
Participated in analliance sometime
in the past
Do not know
47%
42%
11%
1%
10% 30% 50% 70% 90%
Figure 23. Participation in alliances ofcommunity foundations.
Group 1:Never/
do not know
Percentage of survey participants
0% 20% 40% 60% 100%80%
Group 2:Participated in an
alliance now/in the past
48%
53%
10% 30% 50% 70% 90%
Figure 24. Participation in alliances of community foundations.
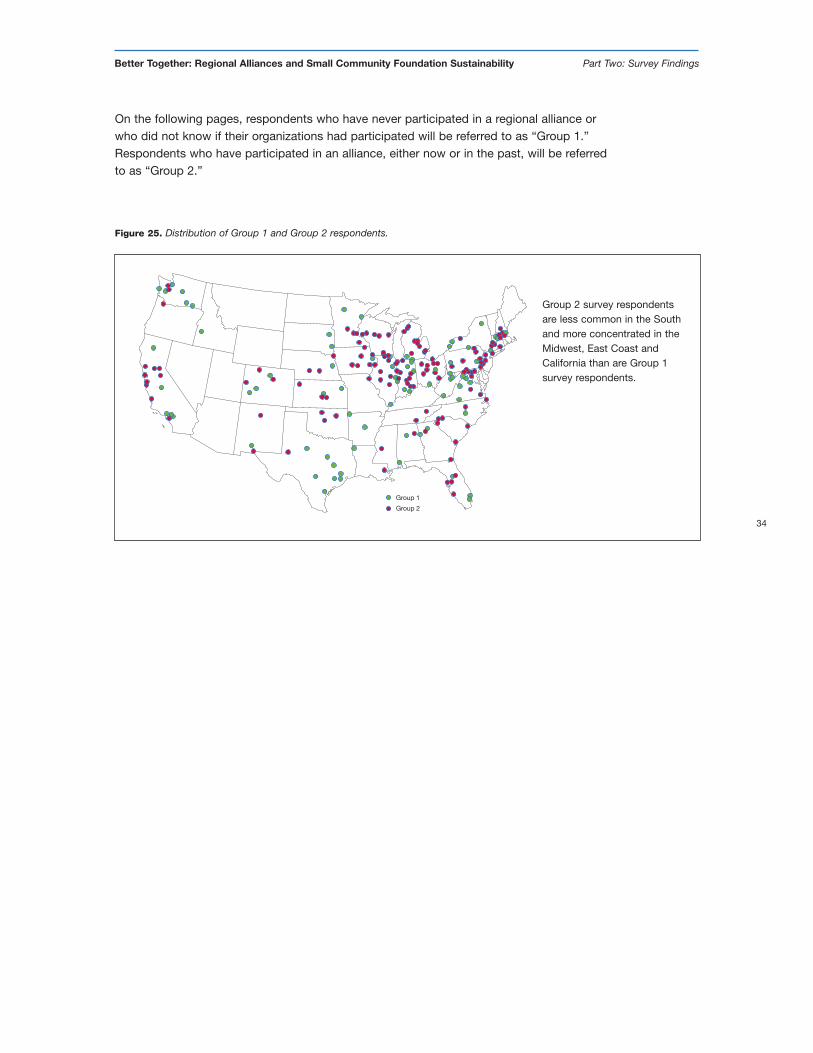
34
Better Together: Regional Alliances and Small Community Foundation Sustainability Part Two: Survey Findings
Group 1
Group 2
Group 2 survey respondentsare less common in the Southand more concentrated in theMidwest, East Coast andCalifornia than are Group 1survey respondents.
Figure 25. Distribution of Group 1 and Group 2 respondents.
On the following pages, respondents who have never participated in a regional alliance orwho did not know if their organizations had participated will be referred to as “Group 1.”Respondents who have participated in an alliance, either now or in the past, will be referredto as “Group 2.”
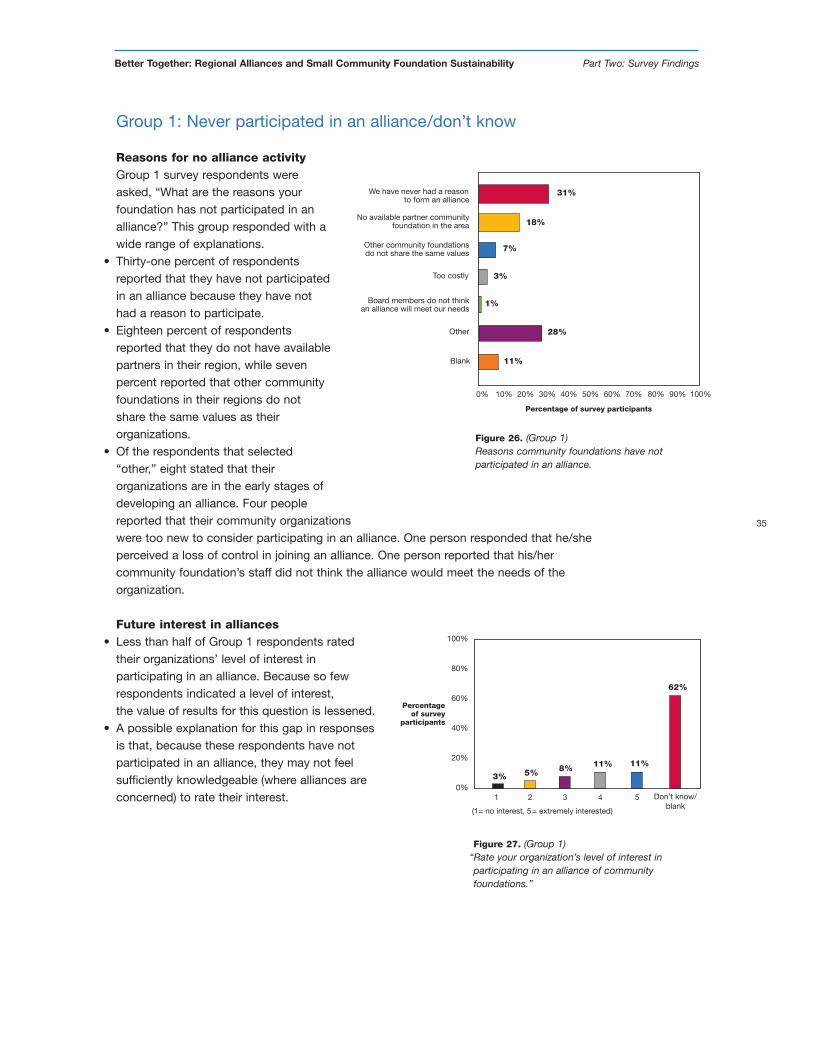
Group 1: Never participated in an alliance/don’t know
Reasons for no alliance activityGroup 1 survey respondents wereasked, “What are the reasons yourfoundation has not participated in analliance?” This group responded with awide range of explanations.
• Thirty-one percent of respondentsreported that they have not participatedin an alliance because they have nothad a reason to participate.
• Eighteen percent of respondentsreported that they do not have availablepartners in their region, while sevenpercent reported that other communityfoundations in their regions do notshare the same values as theirorganizations.
• Of the respondents that selected“other,” eight stated that theirorganizations are in the early stages ofdeveloping an alliance. Four peoplereported that their community organizationswere too new to consider participating in an alliance. One person responded that he/sheperceived a loss of control in joining an alliance. One person reported that his/hercommunity foundation’s staff did not think the alliance would meet the needs of theorganization.
Future interest in alliances• Less than half of Group 1 respondents rated
their organizations’ level of interest inparticipating in an alliance. Because so fewrespondents indicated a level of interest,the value of results for this question is lessened.
• A possible explanation for this gap in responsesis that, because these respondents have notparticipated in an alliance, they may not feelsufficiently knowledgeable (where alliances areconcerned) to rate their interest.
35
Better Together: Regional Alliances and Small Community Foundation Sustainability Part Two: Survey Findings
We have never had a reasonto form an alliance
Percentage of survey participants
0% 20% 40% 60% 100%80%
No available partner communityfoundation in the area
Other community foundationsdo not share the same values
Board members do not thinkan alliance will meet our needs
31%
18%
7%
1%
Other
Too costly 3%
Blank
28%
11%
10% 90%70%50%30%
Figure 26. (Group 1)Reasons community foundations have notparticipated in an alliance.
100%
80%
60%
40%
20%
0%
Percentageof survey
participants
1
62%
2 3 4 5 Don’t know/blank
11%11%8%5%3%
(1= no interest, 5= extremely interested)
Figure 27. (Group 1)“Rate your organization’s level of interest in participating in an alliance of community foundations.”
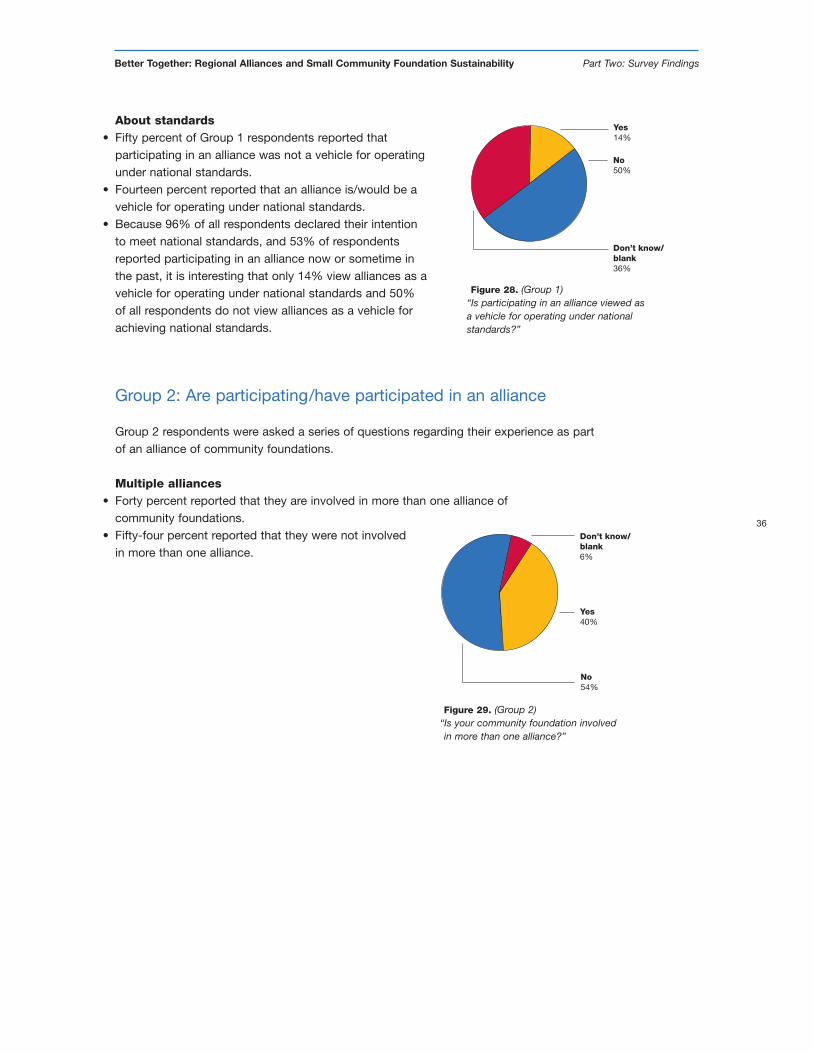
36
Better Together: Regional Alliances and Small Community Foundation Sustainability Part Two: Survey Findings
About standards• Fifty percent of Group 1 respondents reported that
participating in an alliance was not a vehicle for operatingunder national standards.
• Fourteen percent reported that an alliance is/would be avehicle for operating under national standards.
• Because 96% of all respondents declared their intentionto meet national standards, and 53% of respondentsreported participating in an alliance now or sometime inthe past, it is interesting that only 14% view alliances as avehicle for operating under national standards and 50%of all respondents do not view alliances as a vehicle forachieving national standards.
Group 2: Are participating/have participated in an alliance
Group 2 respondents were asked a series of questions regarding their experience as partof an alliance of community foundations.
Multiple alliances• Forty percent reported that they are involved in more than one alliance of
community foundations.• Fifty-four percent reported that they were not involved
in more than one alliance.
No50%
Yes14%
Don’t know/blank36%
Figure 28. (Group 1)“Is participating in an alliance viewed asa vehicle for operating under nationalstandards?”
No54%
Yes40%
Don’t know/blank6%
Figure 29. (Group 2)“Is your community foundation involvedin more than one alliance?”
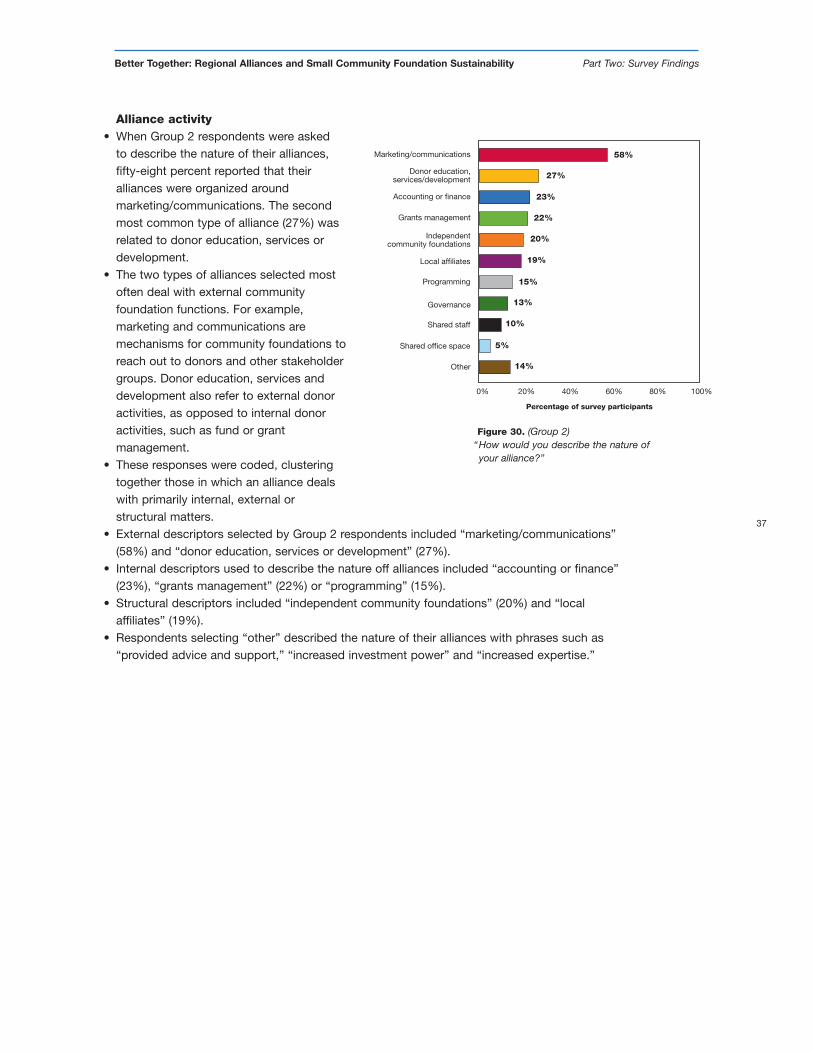
Alliance activity• When Group 2 respondents were asked
to describe the nature of their alliances,fifty-eight percent reported that theiralliances were organized aroundmarketing/communications. The secondmost common type of alliance (27%) wasrelated to donor education, services ordevelopment.
• The two types of alliances selected mostoften deal with external communityfoundation functions. For example,marketing and communications aremechanisms for community foundations toreach out to donors and other stakeholdergroups. Donor education, services anddevelopment also refer to external donoractivities, as opposed to internal donoractivities, such as fund or grantmanagement.
• These responses were coded, clusteringtogether those in which an alliance dealswith primarily internal, external orstructural matters.
• External descriptors selected by Group 2 respondents included “marketing/communications”(58%) and “donor education, services or development” (27%).
• Internal descriptors used to describe the nature off alliances included “accounting or finance”(23%), “grants management” (22%) or “programming” (15%).
• Structural descriptors included “independent community foundations” (20%) and “localaffiliates” (19%).
• Respondents selecting “other” described the nature of their alliances with phrases such as“provided advice and support,” “increased investment power” and “increased expertise.”
37
Better Together: Regional Alliances and Small Community Foundation Sustainability Part Two: Survey Findings
Marketing/communications
Percentage of survey participants
0% 20% 40% 60% 100%80%
Donor education,services/development
Accounting or finance
Independentcommunity foundations
58%
27%
23%
20%
Local affiliates
Grants management 22%
Programming
19%
15%
Governance
Shared staff
Shared office space
Other
13%
10%
5%
14%
Figure 30. (Group 2)“How would you describe the nature of your alliance?”
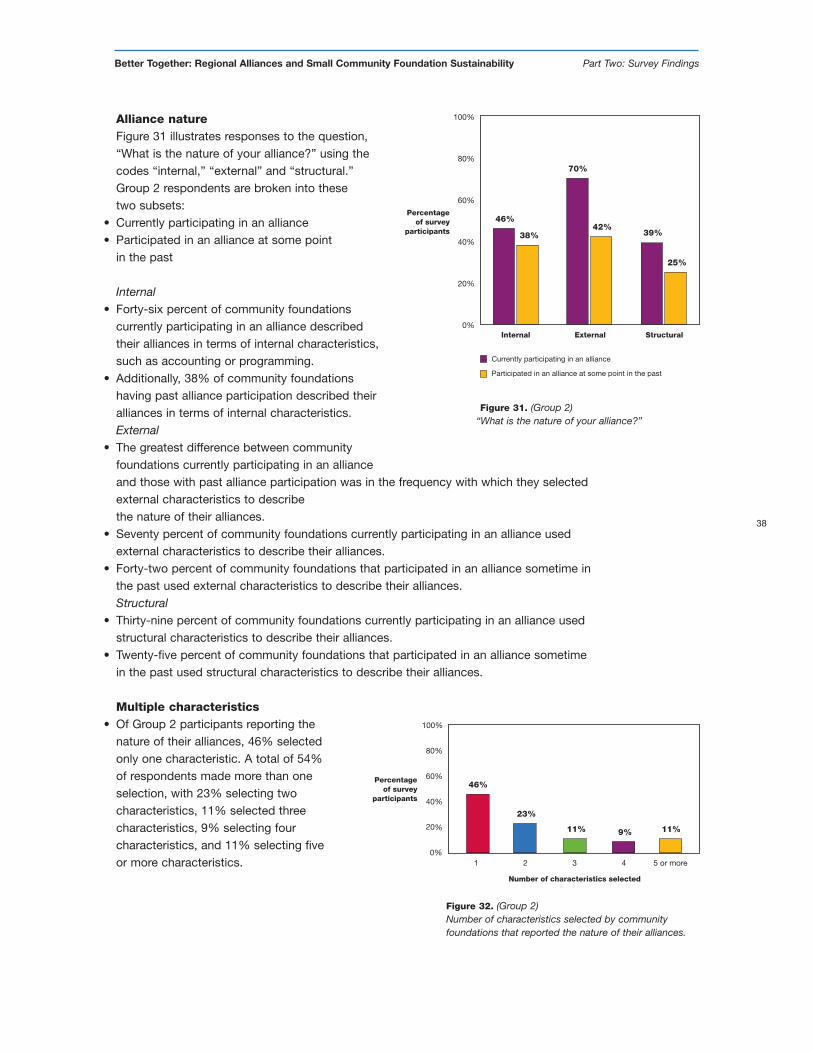
38
Better Together: Regional Alliances and Small Community Foundation Sustainability Part Two: Survey Findings
Alliance natureFigure 31 illustrates responses to the question,“What is the nature of your alliance?” using thecodes “internal,” “external” and “structural.”Group 2 respondents are broken into thesetwo subsets:
• Currently participating in an alliance• Participated in an alliance at some point
in the past
Internal• Forty-six percent of community foundations
currently participating in an alliance describedtheir alliances in terms of internal characteristics,such as accounting or programming.
• Additionally, 38% of community foundationshaving past alliance participation described theiralliances in terms of internal characteristics.External
• The greatest difference between communityfoundations currently participating in an allianceand those with past alliance participation was in the frequency with which they selectedexternal characteristics to describethe nature of their alliances.
• Seventy percent of community foundations currently participating in an alliance usedexternal characteristics to describe their alliances.
• Forty-two percent of community foundations that participated in an alliance sometime inthe past used external characteristics to describe their alliances.Structural
• Thirty-nine percent of community foundations currently participating in an alliance usedstructural characteristics to describe their alliances.
• Twenty-five percent of community foundations that participated in an alliance sometimein the past used structural characteristics to describe their alliances.
Multiple characteristics• Of Group 2 participants reporting the
nature of their alliances, 46% selectedonly one characteristic. A total of 54%of respondents made more than oneselection, with 23% selecting twocharacteristics, 11% selected threecharacteristics, 9% selecting fourcharacteristics, and 11% selecting fiveor more characteristics.
0%
20%
40%
60%
80%
100%
46%Percentage
of surveyparticipants
Internal External Structural
70%
39%38%42%
25%
Currently participating in an alliance
Participated in an alliance at some point in the past
Figure 31. (Group 2)“What is the nature of your alliance?”
1
Percentageof survey
participants
0%
20%
40%
60%
100%
80%
2 3 5 or more
23%
46%
11%
4
9% 11%
Number of characteristics selected
Figure 32. (Group 2)Number of characteristics selected by communityfoundations that reported the nature of their alliances.
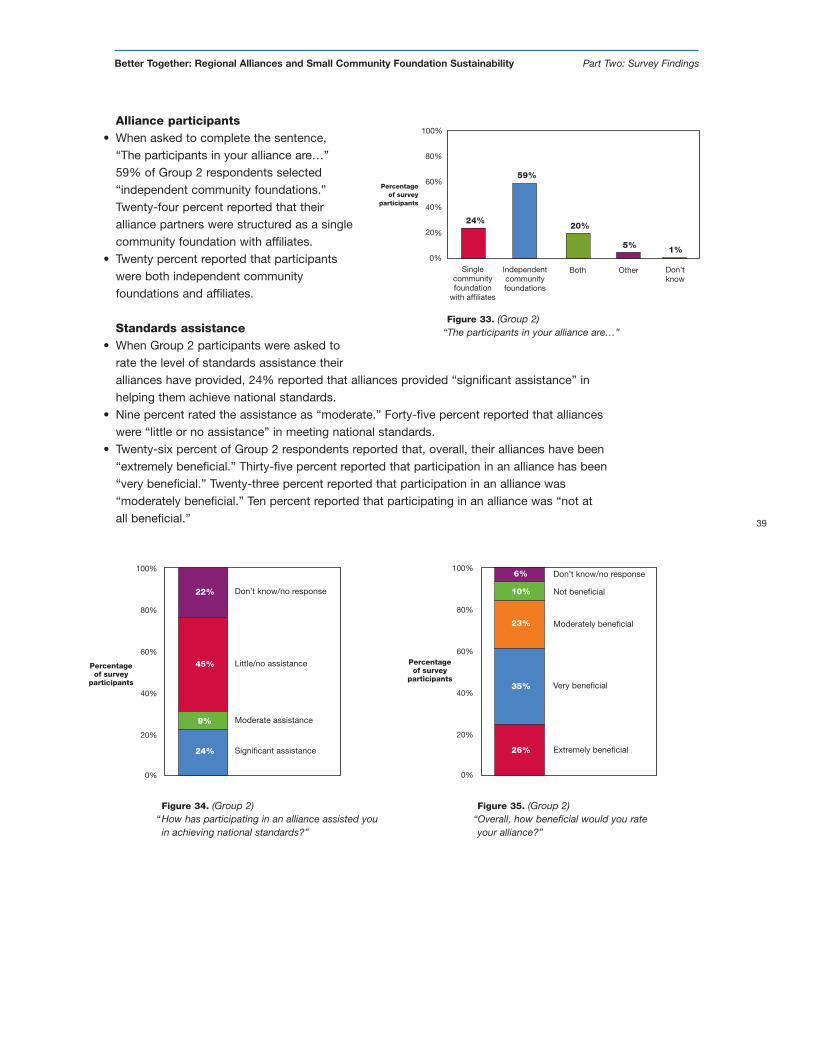
Alliance participants• When asked to complete the sentence,
“The participants in your alliance are…”59% of Group 2 respondents selected“independent community foundations.”Twenty-four percent reported that theiralliance partners were structured as a singlecommunity foundation with affiliates.
• Twenty percent reported that participantswere both independent communityfoundations and affiliates.
Standards assistance• When Group 2 participants were asked to
rate the level of standards assistance theiralliances have provided, 24% reported that alliances provided “significant assistance” inhelping them achieve national standards.
• Nine percent rated the assistance as “moderate.” Forty-five percent reported that allianceswere “little or no assistance” in meeting national standards.
• Twenty-six percent of Group 2 respondents reported that, overall, their alliances have been“extremely beneficial.” Thirty-five percent reported that participation in an alliance has been“very beneficial.” Twenty-three percent reported that participation in an alliance was“moderately beneficial.” Ten percent reported that participating in an alliance was “not atall beneficial.” 39
Better Together: Regional Alliances and Small Community Foundation Sustainability Part Two: Survey Findings
Singlecommunityfoundation
with affiliates
Percentageof survey
participants
0%
20%
40%
60%
100%
80%
Independentcommunityfoundations
Both Don’tknow
59%
24%20%
Other
5% 1%
Figure 33. (Group 2)“The participants in your alliance are…”
Don’t know/no response
Little/no assistance
Moderate assistance
22%
Significant assistance
45%
9%
24%
0%
20%
40%
60%
80%
100%
Percentageof survey
participants
Don’t know/no response
Moderately beneficial
Very beneficial
6%
Extremely beneficial
0%
20%
40%
60%
80%
100%
23%
35%
26%
10% Not beneficial
Percentageof survey
participants
Figure 34. (Group 2)“How has participating in an alliance assisted youin achieving national standards?”
Figure 35. (Group 2)“Overall, how beneficial would you rateyour alliance?”
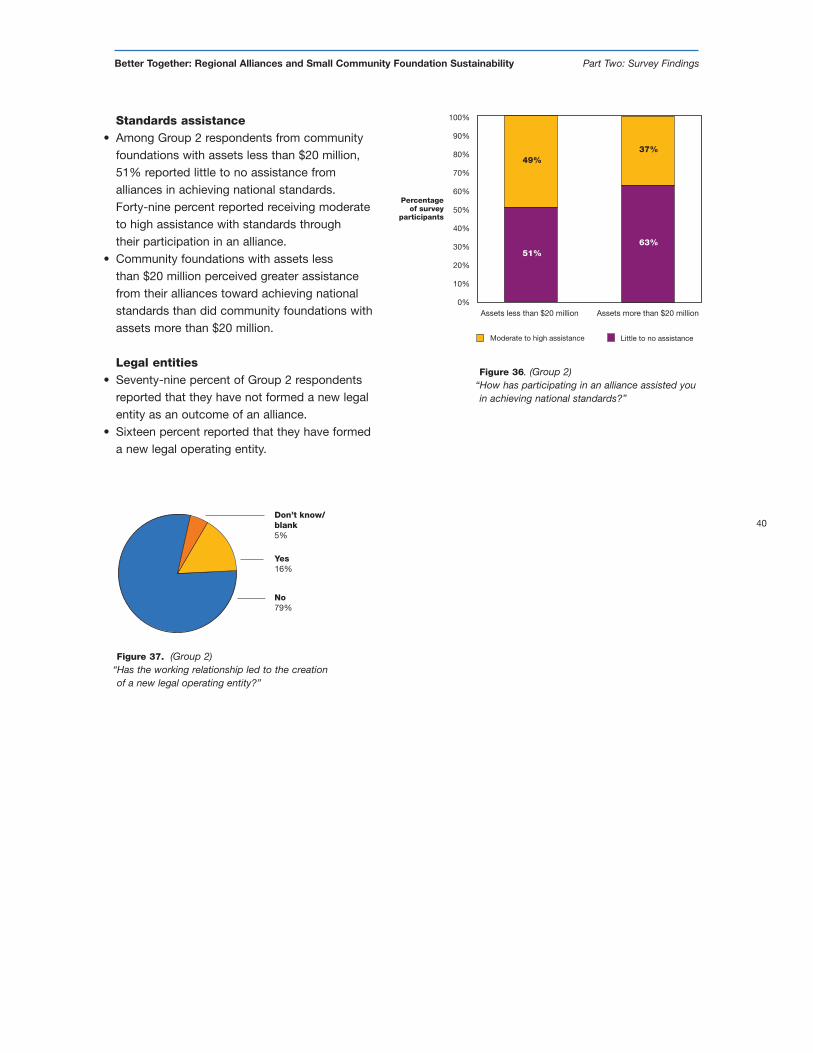
Standards assistance• Among Group 2 respondents from community
foundations with assets less than $20 million,51% reported little to no assistance fromalliances in achieving national standards.Forty-nine percent reported receiving moderateto high assistance with standards throughtheir participation in an alliance.
• Community foundations with assets lessthan $20 million perceived greater assistancefrom their alliances toward achieving nationalstandards than did community foundations withassets more than $20 million.
Legal entities• Seventy-nine percent of Group 2 respondents
reported that they have not formed a new legalentity as an outcome of an alliance.
• Sixteen percent reported that they have formeda new legal operating entity.
40
Better Together: Regional Alliances and Small Community Foundation Sustainability Part Two: Survey Findings
100%
90%
80%
70%
60%
50%
40%
30%
20%
10%
0%
Percentageof survey
participants
Assets less than $20 million Assets more than $20 million
49%
51%
37%
63%
Little to no assistanceModerate to high assistance
Figure 36. (Group 2)“How has participating in an alliance assisted youin achieving national standards?”
Don’t know/blank5%
Yes16%
No79%
Figure 37. (Group 2)“Has the working relationship led to the creationof a new legal operating entity?”
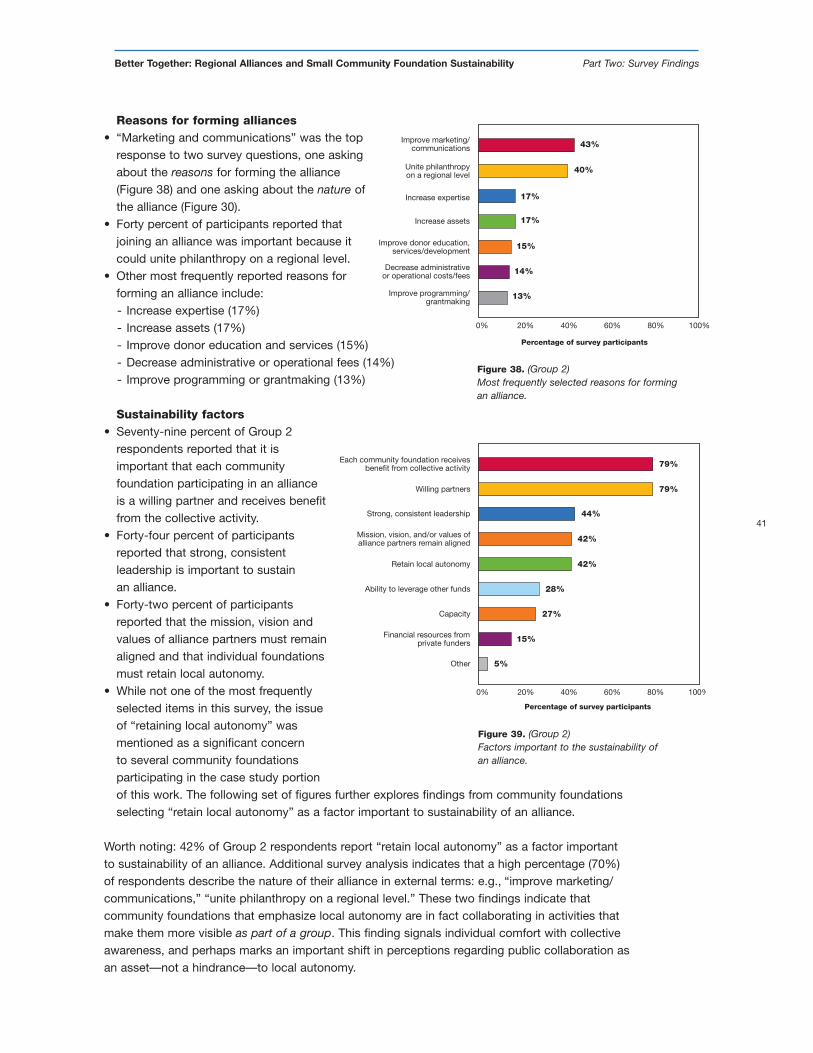
Reasons for forming alliances• “Marketing and communications” was the top
response to two survey questions, one askingabout the reasons for forming the alliance(Figure 38) and one asking about the nature ofthe alliance (Figure 30).
• Forty percent of participants reported thatjoining an alliance was important because itcould unite philanthropy on a regional level.
• Other most frequently reported reasons forforming an alliance include:- Increase expertise (17%)- Increase assets (17%)- Improve donor education and services (15%)- Decrease administrative or operational fees (14%)- Improve programming or grantmaking (13%)
Sustainability factors• Seventy-nine percent of Group 2
respondents reported that it isimportant that each communityfoundation participating in an alliance is a willing partner and receives benefitfrom the collective activity.
• Forty-four percent of participantsreported that strong, consistentleadership is important to sustainan alliance.
• Forty-two percent of participantsreported that the mission, vision andvalues of alliance partners must remainaligned and that individual foundationsmust retain local autonomy.
• While not one of the most frequentlyselected items in this survey, the issueof “retaining local autonomy” wasmentioned as a significant concern to several community foundationsparticipating in the case study portionof this work. The following set of figures further explores findings from community foundationsselecting “retain local autonomy” as a factor important to sustainability of an alliance.
Worth noting: 42% of Group 2 respondents report “retain local autonomy” as a factor importantto sustainability of an alliance. Additional survey analysis indicates that a high percentage (70%)of respondents describe the nature of their alliance in external terms: e.g., “improve marketing/communications,” “unite philanthropy on a regional level.” These two findings indicate thatcommunity foundations that emphasize local autonomy are in fact collaborating in activities thatmake them more visible as part of a group. This finding signals individual comfort with collectiveawareness, and perhaps marks an important shift in perceptions regarding public collaboration asan asset—not a hindrance—to local autonomy.
Each community foundation receivesbenefit from collective activity
Percentage of survey participants
0% 20% 40% 60% 100%80%
Willing partners
Strong, consistent leadership
Retain local autonomy
79%
Ability to leverage other funds
Mission, vision, and/or values ofalliance partners remain aligned
Capacity
44%
Financial resources fromprivate funders
Other
79%
42%
42%
28%
27%
15%
5%
41
Better Together: Regional Alliances and Small Community Foundation Sustainability Part Two: Survey Findings
Figure 39. (Group 2)Factors important to the sustainability ofan alliance.
Improve marketing/communications
Percentage of survey participants
0% 20% 40% 60% 100%80%
Unite philanthropyon a regional level
Increase expertise
Improve donor education,services/development
43%
Decrease administrativeor operational costs/fees
Increase assets
Improve programming/grantmaking
40%
17%
17%
15%
14%
13%
Figure 38. (Group 2)Most frequently selected reasons for formingan alliance.
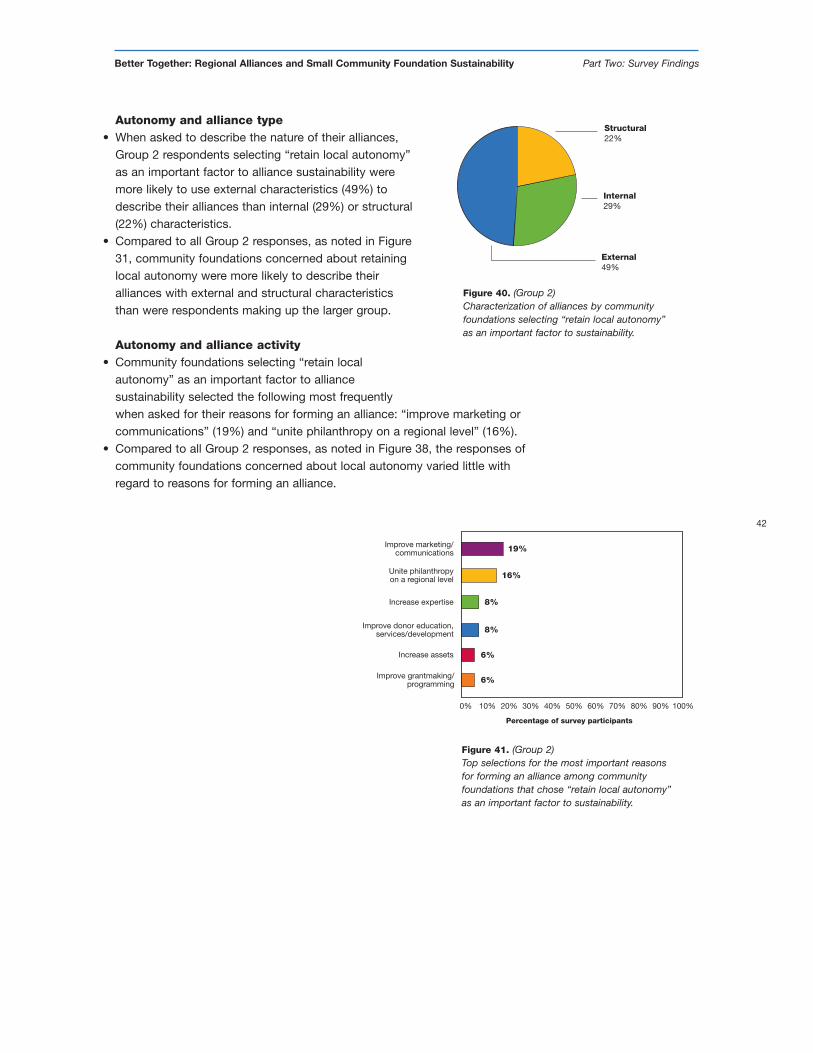
Autonomy and alliance type• When asked to describe the nature of their alliances,
Group 2 respondents selecting “retain local autonomy”as an important factor to alliance sustainability weremore likely to use external characteristics (49%) todescribe their alliances than internal (29%) or structural(22%) characteristics.
• Compared to all Group 2 responses, as noted in Figure31, community foundations concerned about retaininglocal autonomy were more likely to describe theiralliances with external and structural characteristicsthan were respondents making up the larger group.
Autonomy and alliance activity• Community foundations selecting “retain local
autonomy” as an important factor to alliancesustainability selected the following most frequentlywhen asked for their reasons for forming an alliance: “improve marketing orcommunications” (19%) and “unite philanthropy on a regional level” (16%).
• Compared to all Group 2 responses, as noted in Figure 38, the responses ofcommunity foundations concerned about local autonomy varied little withregard to reasons for forming an alliance.
42
Better Together: Regional Alliances and Small Community Foundation Sustainability Part Two: Survey Findings
Percentage of survey participants
0% 20% 40% 60% 100%80%
Improve marketing/communications
Unite philanthropyon a regional level
19%
Improve donor education,services/development
Increase expertise
Increase assets
Improve grantmaking/programming 6%
10% 90%70%50%30%
16%
8%
8%
6%
Figure 41. (Group 2)Top selections for the most important reasonsfor forming an alliance among communityfoundations that chose “retain local autonomy”as an important factor to sustainability.
Structural22%
Internal29%
External49%
Figure 40. (Group 2)Characterization of alliances by communityfoundations selecting “retain local autonomy”as an important factor to sustainability.
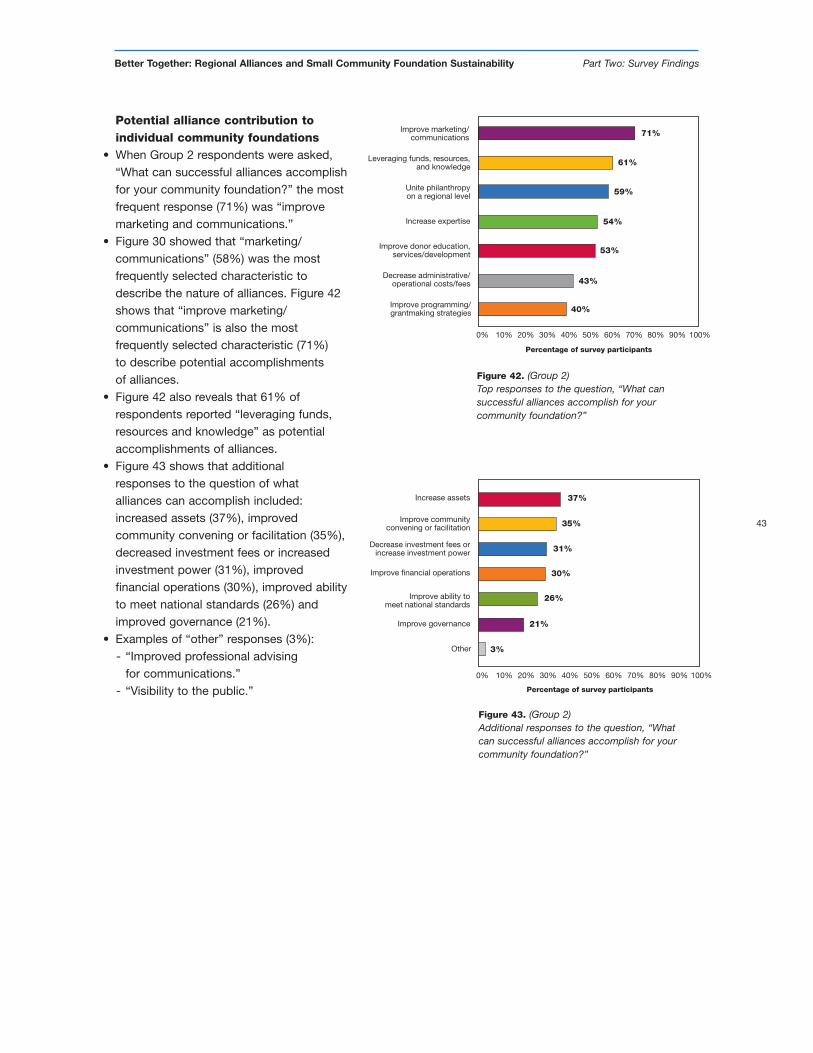
Potential alliance contribution toindividual community foundations
• When Group 2 respondents were asked,“What can successful alliances accomplishfor your community foundation?” the mostfrequent response (71%) was “improvemarketing and communications.”
• Figure 30 showed that “marketing/communications” (58%) was the mostfrequently selected characteristic todescribe the nature of alliances. Figure 42shows that “improve marketing/communications” is also the mostfrequently selected characteristic (71%)to describe potential accomplishmentsof alliances.
• Figure 42 also reveals that 61% ofrespondents reported “leveraging funds,resources and knowledge” as potentialaccomplishments of alliances.
• Figure 43 shows that additionalresponses to the question of whatalliances can accomplish included:increased assets (37%), improvedcommunity convening or facilitation (35%),decreased investment fees or increasedinvestment power (31%), improvedfinancial operations (30%), improved abilityto meet national standards (26%) andimproved governance (21%).
• Examples of “other” responses (3%):- “Improved professional advising
for communications.” - “Visibility to the public.”
43
Better Together: Regional Alliances and Small Community Foundation Sustainability Part Two: Survey Findings
Increase assets
Percentage of survey participants
0% 20% 40% 60% 100%80%
Improve communityconvening or facilitation
Decrease investment fees orincrease investment power
37%
Improve ability tomeet national standards
Improve financial operations
Improve governance
31%
35%
30%
26%
21%
Other 3%
10% 30% 50% 70% 90%
Figure 43. (Group 2)Additional responses to the question, “Whatcan successful alliances accomplish for yourcommunity foundation?”
Percentage of survey participants
0% 20% 40% 60% 100%80%
Leveraging funds, resources,and knowledge
Unite philanthropyon a regional level
71%
Improve donor education,services/development
Increase expertise
Decrease administrative/operational costs/fees
Improve programming/grantmaking strategies
10% 90%70%50%30%
Improve marketing/communications
61%
59%
54%
53%
43%
40%
Figure 42. (Group 2)Top responses to the question, “What cansuccessful alliances accomplish for yourcommunity foundation?”
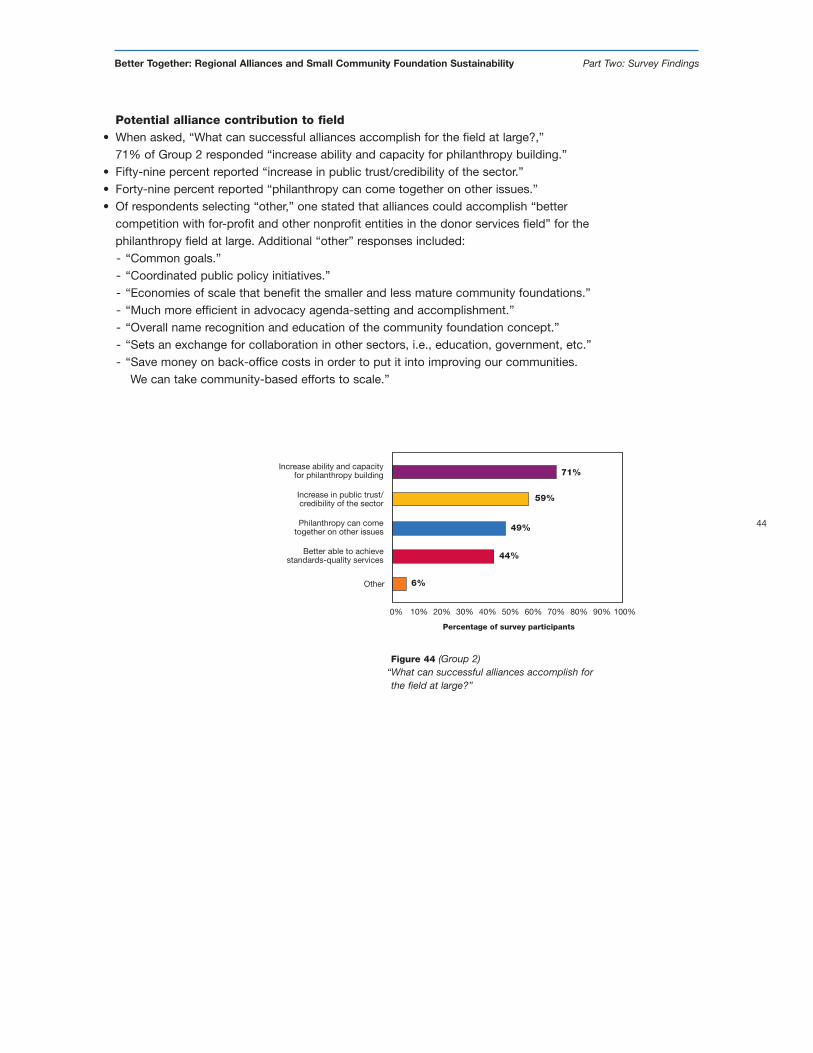
Potential alliance contribution to field• When asked, “What can successful alliances accomplish for the field at large?,”
71% of Group 2 responded “increase ability and capacity for philanthropy building.” • Fifty-nine percent reported “increase in public trust/credibility of the sector.”• Forty-nine percent reported “philanthropy can come together on other issues.” • Of respondents selecting “other,” one stated that alliances could accomplish “better
competition with for-profit and other nonprofit entities in the donor services field” for thephilanthropy field at large. Additional “other” responses included:- “Common goals.”- “Coordinated public policy initiatives.”- “Economies of scale that benefit the smaller and less mature community foundations.”- “Much more efficient in advocacy agenda-setting and accomplishment.”- “Overall name recognition and education of the community foundation concept.”- “Sets an exchange for collaboration in other sectors, i.e., education, government, etc.”- “Save money on back-office costs in order to put it into improving our communities.
We can take community-based efforts to scale.”
44
Better Together: Regional Alliances and Small Community Foundation Sustainability Part Two: Survey Findings
Percentage of survey participants
0% 20% 40% 60% 100%80%
Increase ability and capacityfor philanthropy building 71%
Philanthropy can cometogether on other issues
Increase in public trust/credibility of the sector
Better able to achievestandards-quality services
Other
10% 30% 50% 70% 90%
59%
49%
44%
6%
Figure 44 (Group 2)“What can successful alliances accomplish forthe field at large?”
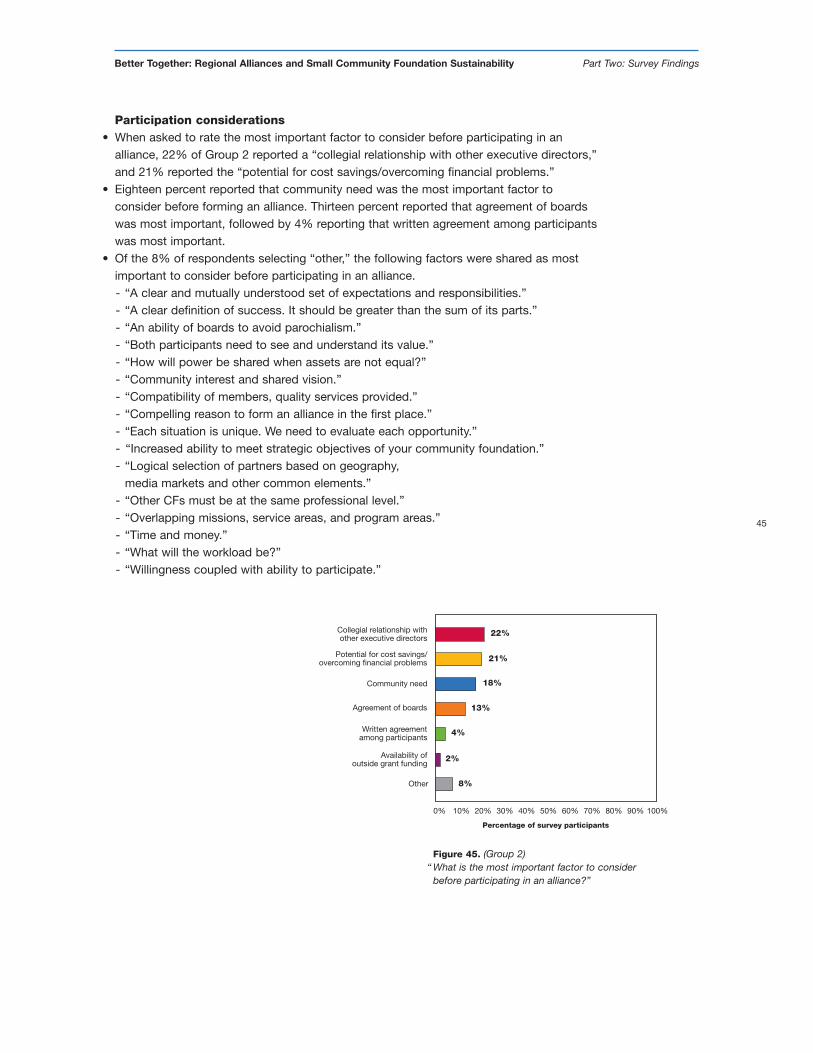
Participation considerations• When asked to rate the most important factor to consider before participating in an
alliance, 22% of Group 2 reported a “collegial relationship with other executive directors,”and 21% reported the “potential for cost savings/overcoming financial problems.”
• Eighteen percent reported that community need was the most important factor toconsider before forming an alliance. Thirteen percent reported that agreement of boardswas most important, followed by 4% reporting that written agreement among participantswas most important.
• Of the 8% of respondents selecting “other,” the following factors were shared as mostimportant to consider before participating in an alliance.- “A clear and mutually understood set of expectations and responsibilities.”- “A clear definition of success. It should be greater than the sum of its parts.”- “An ability of boards to avoid parochialism.”- “Both participants need to see and understand its value.”- “How will power be shared when assets are not equal?”- “Community interest and shared vision.”- “Compatibility of members, quality services provided.”- “Compelling reason to form an alliance in the first place.”- “Each situation is unique. We need to evaluate each opportunity.”- “Increased ability to meet strategic objectives of your community foundation.”- “Logical selection of partners based on geography,
media markets and other common elements.”- “Other CFs must be at the same professional level.”- “Overlapping missions, service areas, and program areas.”- “Time and money.”- “What will the workload be?”- “Willingness coupled with ability to participate.”
45
Better Together: Regional Alliances and Small Community Foundation Sustainability Part Two: Survey Findings
Collegial relationship withother executive directors
Percentage of survey participants
0% 20% 40% 60% 100%80%
Potential for cost savings/overcoming financial problems
Community need
22%
Written agreementamong participants
Agreement of boards
Availability ofoutside grant funding
Other
21%
18%
13%
4%
2%
8%
10% 90%70%50%30%
Figure 45. (Group 2)“ What is the most important factor to consider
before participating in an alliance?”
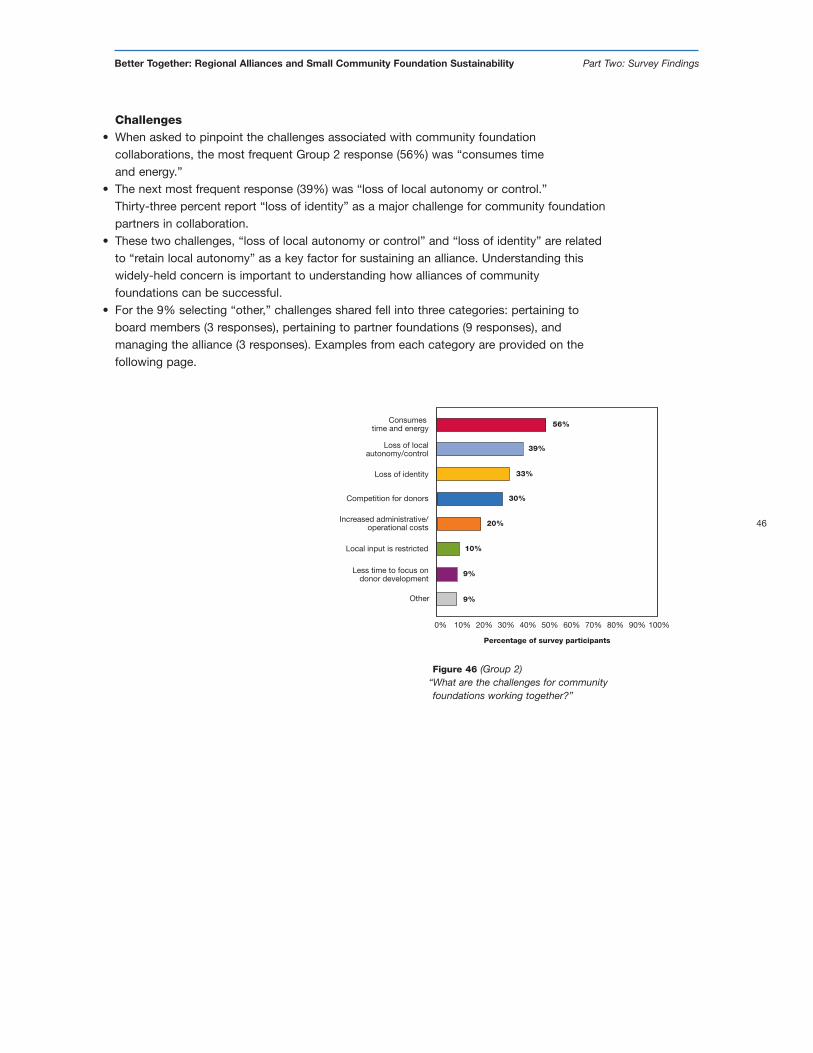
Challenges• When asked to pinpoint the challenges associated with community foundation
collaborations, the most frequent Group 2 response (56%) was “consumes timeand energy.”
• The next most frequent response (39%) was “loss of local autonomy or control.”Thirty-three percent report “loss of identity” as a major challenge for community foundationpartners in collaboration.
• These two challenges, “loss of local autonomy or control” and “loss of identity” are relatedto “retain local autonomy” as a key factor for sustaining an alliance. Understanding thiswidely-held concern is important to understanding how alliances of communityfoundations can be successful.
• For the 9% selecting “other,” challenges shared fell into three categories: pertaining toboard members (3 responses), pertaining to partner foundations (9 responses), andmanaging the alliance (3 responses). Examples from each category are provided on thefollowing page.
46
Better Together: Regional Alliances and Small Community Foundation Sustainability Part Two: Survey Findings
Loss of localautonomy/control
Percentage of survey participants
0% 20% 40% 60% 100%80%
Loss of identity
Competition for donors
39%
Local input is restricted
Increased administrative/operational costs
Less time to focus ondonor development
30%
33%
20%
10%
9%
Other 9%
10% 30% 50% 70% 90%
Consumes time and energy 56%
Figure 46 (Group 2)“What are the challenges for communityfoundations working together?”
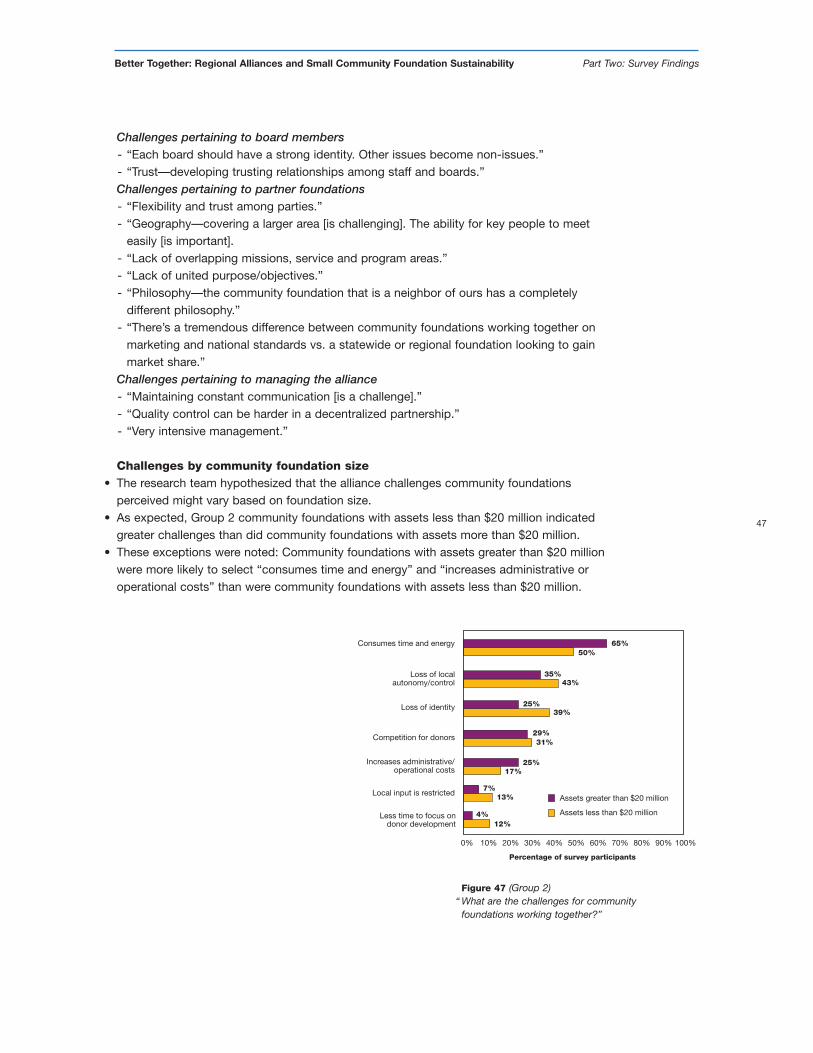
Challenges pertaining to board members- “Each board should have a strong identity. Other issues become non-issues.”- “Trust—developing trusting relationships among staff and boards.”Challenges pertaining to partner foundations- “Flexibility and trust among parties.”- “Geography—covering a larger area [is challenging]. The ability for key people to meet
easily [is important].- “Lack of overlapping missions, service and program areas.”- “Lack of united purpose/objectives.”- “Philosophy—the community foundation that is a neighbor of ours has a completely
different philosophy.”- “There’s a tremendous difference between community foundations working together on
marketing and national standards vs. a statewide or regional foundation looking to gainmarket share.”
Challenges pertaining to managing the alliance- “Maintaining constant communication [is a challenge].”- “Quality control can be harder in a decentralized partnership.”- “Very intensive management.”
Challenges by community foundation size• The research team hypothesized that the alliance challenges community foundations
perceived might vary based on foundation size. • As expected, Group 2 community foundations with assets less than $20 million indicated
greater challenges than did community foundations with assets more than $20 million.• These exceptions were noted: Community foundations with assets greater than $20 million
were more likely to select “consumes time and energy” and “increases administrative oroperational costs” than were community foundations with assets less than $20 million.
47
Better Together: Regional Alliances and Small Community Foundation Sustainability Part Two: Survey Findings
Consumes time and energy
Percentage of survey participants
0% 20% 40% 60% 100%80%
Loss of localautonomy/control
Loss of identity
65%
Increases administrative/operational costs
Competition for donors
Local input is restricted
Less time to focus ondonor development
10% 30% 50% 70% 90%
50%
35%43%
39%
13%7%
17%
25%
25%
31%
4%12%
29%
Assets greater than $20 million
Assets less than $20 million
Figure 47 (Group 2)“ What are the challenges for community
foundations working together?”
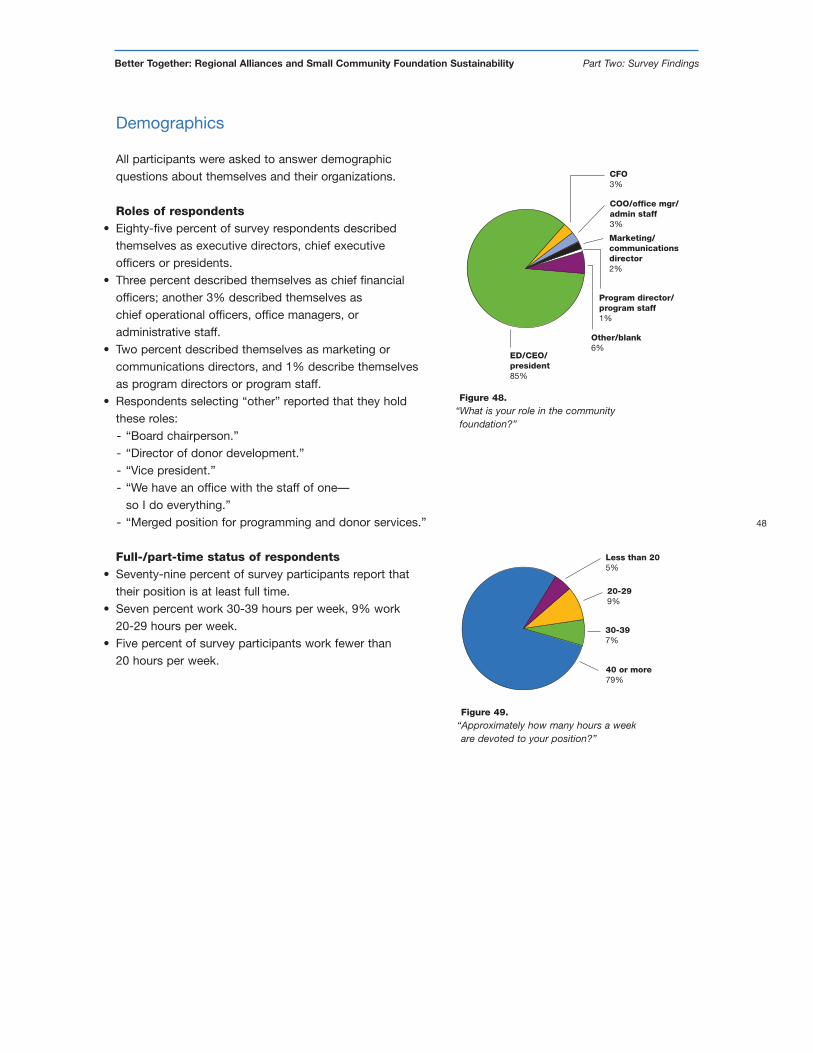
48
Better Together: Regional Alliances and Small Community Foundation Sustainability Part Two: Survey Findings
Demographics
All participants were asked to answer demographicquestions about themselves and their organizations.
Roles of respondents• Eighty-five percent of survey respondents described
themselves as executive directors, chief executiveofficers or presidents.
• Three percent described themselves as chief financialofficers; another 3% described themselves aschief operational officers, office managers, oradministrative staff.
• Two percent described themselves as marketing orcommunications directors, and 1% describe themselvesas program directors or program staff.
• Respondents selecting “other” reported that they holdthese roles:- “Board chairperson.”- “Director of donor development.”- “Vice president.”- “We have an office with the staff of one—
so I do everything.”- “Merged position for programming and donor services.”
Full-/part-time status of respondents• Seventy-nine percent of survey participants report that
their position is at least full time.• Seven percent work 30-39 hours per week, 9% work
20-29 hours per week. • Five percent of survey participants work fewer than
20 hours per week.
Less than 205%
20-299%
30-397%
40 or more79%
Figure 49.“Approximately how many hours a weekare devoted to your position?”
CFO3%
COO/office mgr/admin staff3%
Marketing/communicationsdirector2%
Program director/program staff1%
Other/blank6%
ED/CEO/president85%
Figure 48.“What is your role in the communityfoundation?”
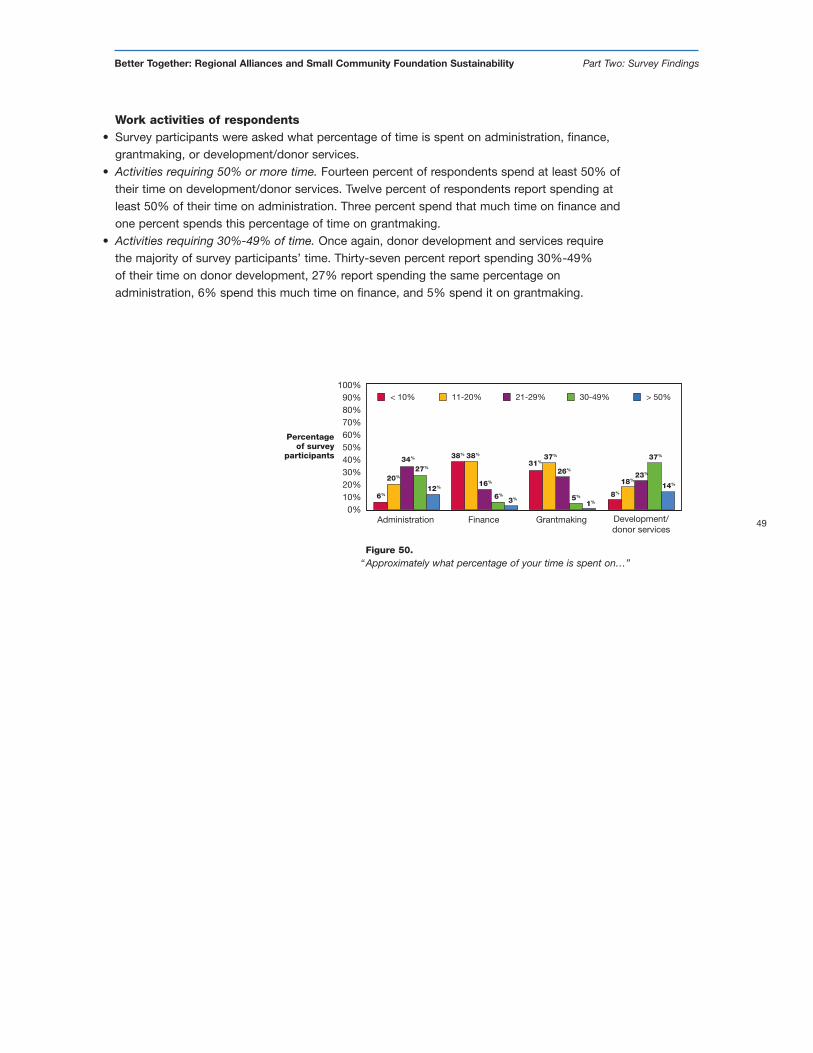
49
Better Together: Regional Alliances and Small Community Foundation Sustainability Part Two: Survey Findings
Percentageof survey
participants
Administration
6%
100%90%80%70%60%50%40%30%20%10%
0%Finance Grantmaking Development/
donor services
20%
34%
27%
12%
38% 38%
16%
6%
3%
31%37%
26%
5%
1%
8%
18%23%
37%
14%
< 10% 11-20% 21-29% 30-49% > 50%
Figure 50.“Approximately what percentage of your time is spent on…”
Work activities of respondents• Survey participants were asked what percentage of time is spent on administration, finance,
grantmaking, or development/donor services.• Activities requiring 50% or more time. Fourteen percent of respondents spend at least 50% of
their time on development/donor services. Twelve percent of respondents report spending atleast 50% of their time on administration. Three percent spend that much time on finance andone percent spends this percentage of time on grantmaking.
• Activities requiring 30%-49% of time. Once again, donor development and services requirethe majority of survey participants’ time. Thirty-seven percent report spending 30%-49%of their time on donor development, 27% report spending the same percentage onadministration, 6% spend this much time on finance, and 5% spend it on grantmaking.
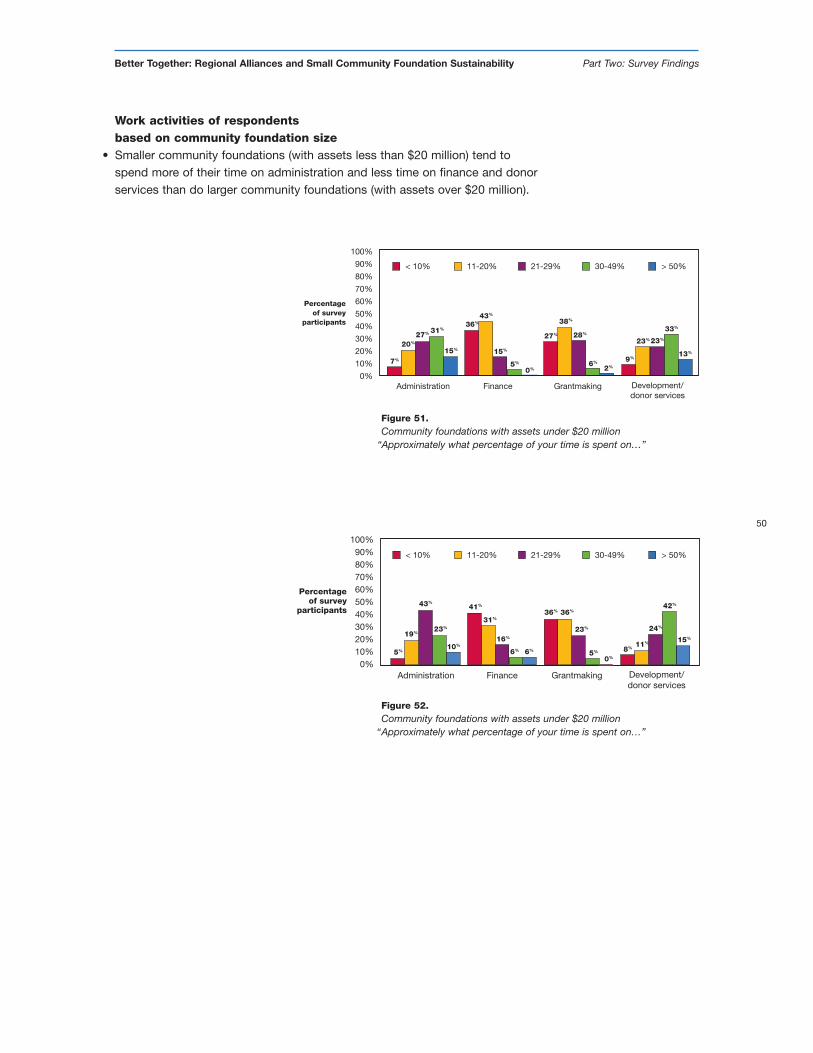
50
Better Together: Regional Alliances and Small Community Foundation Sustainability Part Two: Survey Findings
Percentageof survey
participants
Administration
100%
90%
80%
70%
60%
50%
40%
30%
20%
10%
0%Finance Grantmaking Development/
donor services
7%
20%
27% 31%
15%
36%43%
15%
5%
0%
27%
38%
28%
6%
2%
9%
23%23%
33%
13%
< 10% 11-20% 21-29% 30-49% > 50%
Percentageof survey
participants
Administration
100%90%80%70%60%50%40%30%20%10%
0%Finance Grantmaking Development/
donor services
5%
19%
43%
23%
10%
41%
31%
16%
6% 6%
36% 36%
23%
5% 8% 11%
24%
42%
15%
0%
< 10% 11-20% 21-29% 30-49% > 50%
Figure 51.Community foundations with assets under $20 million
“Approximately what percentage of your time is spent on…”
Figure 52.Community foundations with assets under $20 million
“Approximately what percentage of your time is spent on…”
Work activities of respondentsbased on community foundation size
• Smaller community foundations (with assets less than $20 million) tend tospend more of their time on administration and less time on finance and donorservices than do larger community foundations (with assets over $20 million).
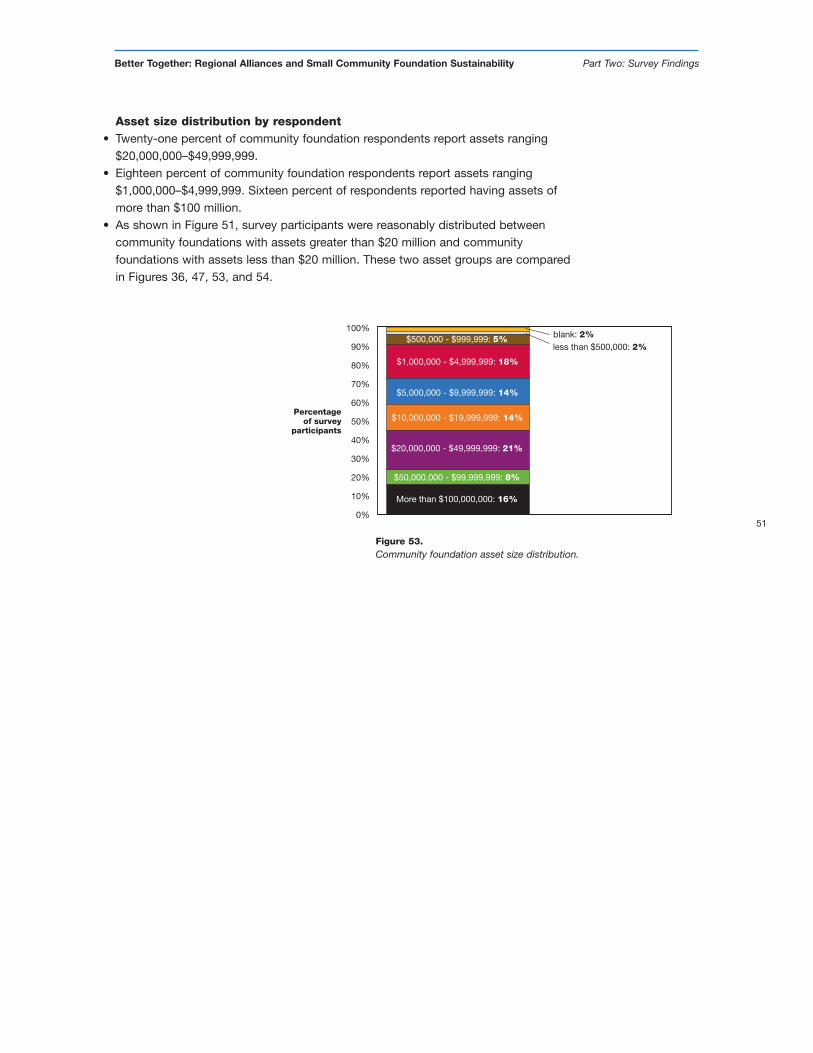
51
Better Together: Regional Alliances and Small Community Foundation Sustainability Part Two: Survey Findings
Percentageof survey
participants
100%
90%
80%
70%
60%
50%
40%
30%
20%
10%
0%
less than $500,000: 2%blank: 2%$500,000 - $999,999: 5%
$1,000,000 - $4,999,999: 18%
$5,000,000 - $9,999,999: 14%
$20,000,000 - $49,999,999: 21%
More than $100,000,000: 16%
$50,000,000 - $99,999,999: 8%
$10,000,000 - $19,999,999: 14%
Figure 53.Community foundation asset size distribution.
Asset size distribution by respondent• Twenty-one percent of community foundation respondents report assets ranging
$20,000,000–$49,999,999. • Eighteen percent of community foundation respondents report assets ranging
$1,000,000–$4,999,999. Sixteen percent of respondents reported having assets ofmore than $100 million.
• As shown in Figure 51, survey participants were reasonably distributed betweencommunity foundations with assets greater than $20 million and communityfoundations with assets less than $20 million. These two asset groups are comparedin Figures 36, 47, 53, and 54.
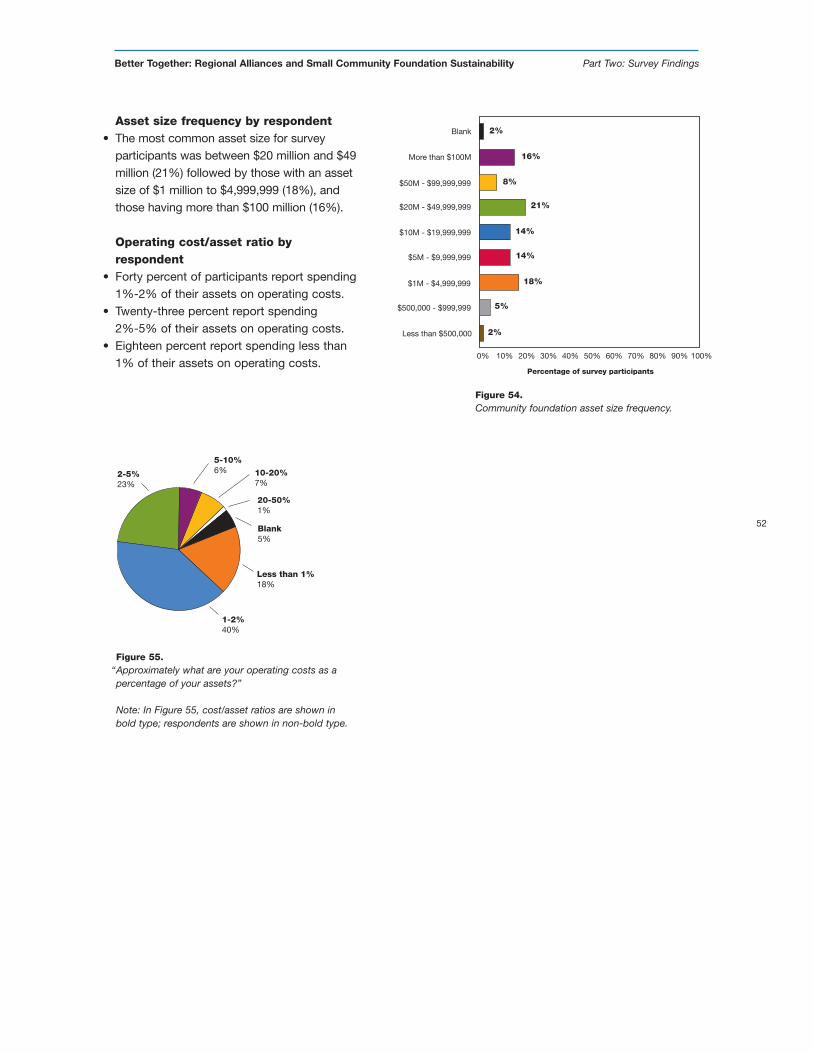
Asset size frequency by respondent• The most common asset size for survey
participants was between $20 million and $49million (21%) followed by those with an assetsize of $1 million to $4,999,999 (18%), andthose having more than $100 million (16%).
Operating cost/asset ratio byrespondent
• Forty percent of participants report spending1%-2% of their assets on operating costs.
• Twenty-three percent report spending2%-5% of their assets on operating costs.
• Eighteen percent report spending less than1% of their assets on operating costs.
52
Better Together: Regional Alliances and Small Community Foundation Sustainability Part Two: Survey Findings
$50M - $99,999,999
Percentage of survey participants
0% 20% 40% 60% 100%80%
$20M - $49,999,999
$10M - $19,999,999
2%
$1M - $4,999,999
$5M - $9,999,999
$500,000 - $999,999
Less than $500,000
10% 30% 50% 70% 90%
More than $100M
Blank
16%
8%
21%
14%
14%
18%
5%
2%
5-10%6% 10-20%
7%
Blank5%
Less than 1%18%
20-50%1%
1-2%40%
2-5%23%
Figure 55.“Approximately what are your operating costs as apercentage of your assets?”
Note: In Figure 55, cost/asset ratios are shown inbold type; respondents are shown in non-bold type.
Figure 54.Community foundation asset size frequency.
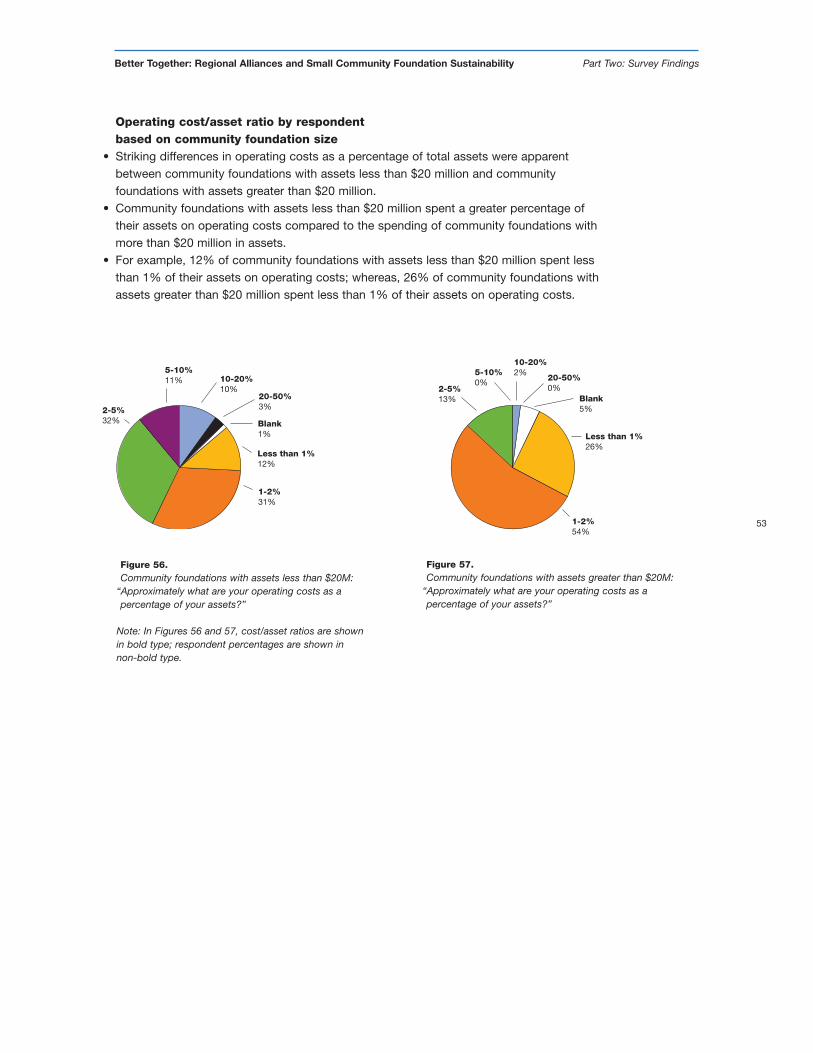
53
Better Together: Regional Alliances and Small Community Foundation Sustainability Part Two: Survey Findings
10-20%10%
20-50%3%
Less than 1%12%
1-2%31%
Blank1%
2-5%32%
5-10%11%
10-20%2%
20-50%0%
Blank5%
Less than 1%26%
5-10%0%
1-2%54%
2-5%13%
Figure 56.Community foundations with assets less than $20M:
“Approximately what are your operating costs as apercentage of your assets?”
Note: In Figures 56 and 57, cost/asset ratios are shownin bold type; respondent percentages are shown innon-bold type.
Figure 57.Community foundations with assets greater than $20M:
“Approximately what are your operating costs as apercentage of your assets?”
Operating cost/asset ratio by respondentbased on community foundation size
• Striking differences in operating costs as a percentage of total assets were apparentbetween community foundations with assets less than $20 million and communityfoundations with assets greater than $20 million.
• Community foundations with assets less than $20 million spent a greater percentage oftheir assets on operating costs compared to the spending of community foundations withmore than $20 million in assets.
• For example, 12% of community foundations with assets less than $20 million spent lessthan 1% of their assets on operating costs; whereas, 26% of community foundations withassets greater than $20 million spent less than 1% of their assets on operating costs.
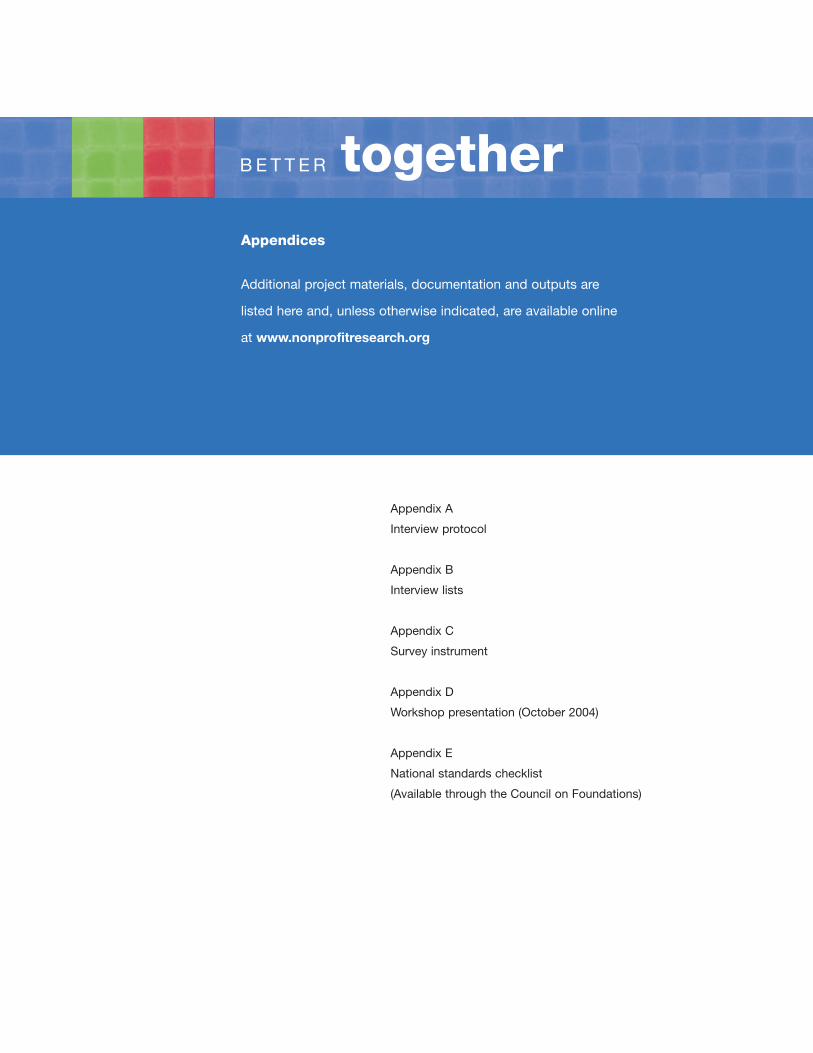
Appendix A
Interview protocol
Appendix B
Interview lists
Appendix C
Survey instrument
Appendix D
Workshop presentation (October 2004)
Appendix E
National standards checklist
(Available through the Council on Foundations)
Appendices
Additional project materials, documentation and outputs are
listed here and, unless otherwise indicated, are available online
at www.nonprofitresearch.org
B E T T E R together
Regional alliances and small community foundation sustainability
B E T T E R together
© 2005 Council of Michigan Foundations
A research project conducted by