Embed Size (px)
Citation preview
Fuel Cell/Micro-Turbine Combined Cycle
Final ReportAugust 1998 – December 1999
ByLarry J. ChaneyMike R. TharpTom W. WolfTim A. Fuller
Joe J. Hartvigson
December 1999
DOE Contract: DE-AC26-98FT40454
McDermott Technology, Inc.1562 Beeson StreetAlliance, OH 44601
Northern Research and Engineering Corporation32 Exeter Street
Portsmouth, NH 03801

Disclaimer
This report was prepared as an account of work sponsored by an agency of the UnitedStates Government. Neither the United States Government nor any agency thereof, norany of their employees, nor contractor nor any subcontractor thereunder, makes anywarranty, express or implied, or assumes any legal liability or responsibility, for theaccuracy, completeness, or usefulness of any information, apparatus, product, or processdisclosed, or represents that its use would not infringe privately owned rights. Referenceherein to any specific commercial product, process, or service by trade name, trademark,manufacturer, or otherwise does not necessarily constitute or imply its endorsement,recommendation, or favoring by the United States Government or any agency thereof.The views and opinions of authors expressed herein do not necessarily state or reflectthose of the United States Government or any agency thereof.

ABSTRACT
A wide variety of conceptual design studies have been conducted that describe ultra-highefficiency fossil power plant cycles. The most promising of these ultra-high efficiencycycles incorporate high temperature fuel cells with a gas turbine. Combining fuel cellswith a gas turbine increases overall cycle efficiency while reducing per kilowattemissions. This study has demonstrated that the unique approach taken to combining afuel cell and gas turbine has both technical and economic merit. The approach used inthis study eliminates most of the gas turbine integration problems associated with hybridfuel cell turbine systems. By using a micro-turbine, and a non-pressurized fuel cell thetotal system size (kW) and complexity has been reduced substantially from thosepresented in other studies, while maintaining over 70% efficiency. The reduced systemsize can be particularly attractive in the deregulated electrical generation/distributionenvironment where the market may not demand multi-megawatt central stations systems.The small size also opens up the niche markets to this high efficiency, low emissionelectrical generation option.

i
Table of Contents
List of Acronyms and Abbreviations .......................................................................1Executive Summary.................................................................................................2
1.0 Introduction..............................................................................................................32.0 Results and Discussion.............................................................................................5
2.1.1 Process Description...................................................................................52.1.2 Engine/Fuel Cell Integration Concepts ...................................................102.1.3 Design Assumptions................................................................................212.1.4 Major Equipment.....................................................................................232.1.5 Input Data and Heat and Material Balance .............................................282.1.6 Modeling Approach and Methodology...................................................292.2 Process/Equipment Uncertainties and Development Requirements .......362.2.1 Fuel Cell Issues .......................................................................................362.3 System Capital Costs...............................................................................422.4 Annual Operating Costs..........................................................................432.5 Opportunities for Improvement and Suggested Work ............................432.5.1 Proof of Concept Demonstration - 200 kW System................................43
3.0 Conclusions ............................................................................................................484.0 References ..............................................................................................................495.0 Appendixes.............................................................................................................50
ii
List of Figures
Figure 1 - Cpn 4 Stack Module ............................................................................................5Figure 2 - Fuel Cell Micro Turbine Combined Cycle ..........................................................7Figure 3 - Concept A, Isometric View...............................................................................12Figure 4 - Concept A, Plan View.......................................................................................13Figure 5 - Concept A, Elevation View...............................................................................14Figure 6 - Concept B, Isometric View ...............................................................................15Figure 7 - Concept B, Isometric View ...............................................................................16Figure 8 - Concept B, Plan View .......................................................................................17Figure 9 - Concept B, Elevation View...............................................................................18Figure 10 - Recuperator Arrangement ...............................................................................21Figure 11 - Exhaust Temperature.......................................................................................32Figure 12 - Compressor Flow.............................................................................................32Figure 13 - Engine Electrical Power Output ......................................................................33Figure 14 - Hot Side Recuperator Inlet Temperature.........................................................33Figure 15 - Compressor Pressure Ratio..............................................................................34Figure 16 - Compressor Flow.............................................................................................34Figure 17 - Compressor Efficiency....................................................................................35Figure 18 - Overall Expansion Efficiency..........................................................................35Figure 19 - PSOFC Performance Map ...............................................................................41Figure 20 – 180 kW PSOFC/MicroTurbine System..........................................................45
iii
List of Tables
Table 1 - State Parameters for 700 kW Fuel Cell/Micro-Turbine Combined Cycle............6Table 2 - Design Parameters for 700 kW Fuel Cell/Micro-Turbine Combined Cycle ........8Table 3 - Performance Study for 700 kW Fuel Cell/Micro-Turbine Combined Cycle........8Table 4 - Component Duty Summary for 700 kW fuel Cell/Micro-Turbine Combined
Cycle ....................................................................................................................9Table 5 - Hybrid Recuperator Options ...............................................................................21Table 6 - Key System Parameters for 700 kW Fuel Cell/Micro-Turbine Combined
Cycle ..................................................................................................................22Table 7 - Comparison of Transmission Efficiencies.........................................................27Table 8 - Component Pressure Losses..............................................................................30Table 9 - PSOFC/Microturbine Capital Costs ..................................................................42Table 10 - State Parameters for 180 kW Fuel Cell/Micro-Turbine Combined Cycle .......46Table 11 - Design Parameters for 180 kW Fuel Cell/Micro-Turbine Combined Cycle ....46Table 12 - Performance Summary for 180 kW Fuel Cell/Micro-Turbine Combined
Cycle ..................................................................................................................47Table 13 - Component Duty Summary for 180 kW Fuel Cell/Micro-Turbine Combined
Cycle ..................................................................................................................47

1
List of Acronyms and Abbreviations
AC Alternating CurrentAES Advanced Energy SystemASR Area Specific Resistance (O*cm2)BOP Balance of Plantcfm Cubic feet per minuteCOE Cost of ElectricityCpnTM Co-planar, n-stackDC Direct CurrentDOE United States Department of EnergyGRI Gas Research InstituteHEFPP High Efficiency Fossil Power PlantHHV Higher Heating ValueHT High TemperaturekW Kilowatt (1000 W)kWe Kilowatt Electric (1000 W)LHV Lower Heating ValueMM Btu Million British Thermal UnitsMTI McDermott Technology, Inc.MW Megawatt (1,000,000 W)NREC Northern Research and EngineeringODS Oxide Dispersion StrengthenedOEM Original Equipment ManufacturerPLC Programmable Logic ControllerPM2000 Advanced metallic material from Plansee GmbH, GermanyPowerWorks™ NREC’s micro turbinePSOFC Planar Solid Oxide Fuel CellSI SI is an abbreviation for “Le Systeme Internationale d’Unites.”SOFCo Solid Oxide Fuel Cell Company
Research and Development Limited Partnership with MTI andCeramatec
TIT Turbine Inlet TemperatureTCE Coefficient of thermal expansionVHT High Temperature

2
EXECUTIVE SUMMARY
A wide variety of conceptual design studies have been conducted that describe ultra-highefficiency fossil power plant cycles. The most promising of these ultra-high efficiencycycles incorporate high temperature fuel cells with a gas turbine. Combining fuel cellswith a gas turbine increases overall cycle efficiency while reducing per kilowattemissions. Fuel cells are widely recognized as one of the most promising family oftechnologies to meet future power generation requirements. Since fuel cells directlyconvert fuel and an oxidant into electricity through an electrochemical process, they canachieve operating efficiencies approaching 70% - nearly twice the efficiency ofconventional internal combustion engines. Fuel cells produce very low levels ofpollutant emissions (NOx, SOx, and CO2). They are also amenable to high-volumeproduction as standardized power modules.
This conceptual study has demonstrated that the unique approach taken to combining afuel cell and gas turbine has both technical and economic merit. By using a micro-turbine, and a non-pressurized fuel cell the total system size (kW) has been reducedsubstantially from those presented in other studies, while maintaining over 70%efficiency. The approach used in this study eliminates most of the gas turbine integrationproblems associated with hybrid fuel cell turbine systems. The reduced system size canbe particularly attractive in the deregulated electrical generation/distribution environmentwhere the market may not demand multi-megawatt central stations systems. The smallsize also opens up the niche markets to this high efficiency, low emission electricalgeneration option.
While the study has discovered no technical obstacles to success, a sub-scale technologydemonstration would reduce the risk of performance and enable a full-scale commercialoffering. Demonstrating a full size micro-turbine, with a single fuel cell module wouldprove the concept as well as the major components and balance of plant that would beneeded in a full-scale system.
3
1 INTRODUCTION
Global demands for additional power generation over the next twenty years are about 2million megawatts, of which 490,000 megawatts are projected to be powered by naturalgas (McDermott internal study). As a result of utility deregulation in the U.S., concernswith real and perceived health issues, and capital costs associated with the distributionand transmission of electricity, approximately 30% of this additional natural gas capacitywill consist of modular power plants located close to the user. Fuel cells combined witha micro-turbine are a logical candidate to meet this need. They offer modularity,increased fuel efficiency, and low emissions. Major gas and electric utilities have shownan interest in investing in both fuel cells and micro-turbines (McDermott confidentialcommunications).
A wide variety of conceptual design studies have been conducted that describe ultra-highefficiency fossil power plant cycles. The most promising of these ultra-high efficiencycycles incorporate high temperature fuel cells with a gas turbine. Combining fuel cellswith a gas turbine increases overall cycle efficiency while reducing per kilowattemissions. Fuel cells are widely recognized as one of the most promising family oftechnologies to meet future power generation requirements. Since fuel cells directlyconvert fuel and an oxidant into electricity through an electrochemical process, they canachieve operating efficiencies approaching 70% - nearly twice the efficiency ofconventional internal combustion engines. Fuel cells produce very low levels ofpollutant emissions (NOx, SOx, and CO2). They are also amenable to high-volumeproduction as standardized power modules.
The operating characteristics of a fuel cell/micro-turbine power plant have severalimportant ramifications to the energy service industry. Successful development andcommercialization of dispersed fuel cell/micro-turbine power generators will allow:
• Siting flexibility with environmentally friendly energy systems,• Improved quality of energy services at a reduced cost,• Ability to rapidly respond to customer needs with modular energy systems,• Improved utilization of clean natural gas, of which the nation has an abundant
domestic supply, and• Facilitate implementation of clean air policies
This report documents the results of a conceptual technical and economic evaluation ofan innovative and unique integration of high temperature fuel cells with a gas turbine.The technical approach described in this program focuses on a planar solid oxide fuel cell(PSOFC) combined with a micro-turbine. PSOFCs have the potential for low costmanufacturability. McDermott Technology Inc. (MTI) has a development program inprogress to address various methods of low cost, high volume manufacturing of PSOFCsand stacks. A low cost PSOFC combined with a sub-megawatt gas turbine creates ahighly attractive product for the deregulated power market. Other studies have focusedon a pressurized fuel cell gas turbine system. This study presents a unique, non-

4
pressurized approach to combining PSOFCs with gas turbines. One of the key issuesaddressed in this study is that of system economics versus efficiency. The objective is tooptimize the economic viability associated with the development of PSOFC/micro-turbine systems while balancing the need for operating efficiency and low emissions.Part of this economic analysis will include an economic analysis of the PSOFC stackoperating point.
Based upon previous analyses by MTI and other solid oxide fuel cell related companies,PSOFC/turbine systems have been shown to be capable of operating at efficienciesgreater than 70%. Overall, the HEFPP program goals of developing a fuel cell / turbinepower plant concept of 20 MW with a net efficiency of greater than 70% have been met.The goals have been exceeded in that the efficiency target of 70% has been met at a sub-megawatt plant size. The smaller plant size gives more flexibility in responding tomarket demands.
5
2 RESULTS AND DISCUSSION
2.1 Fuel Cell / Micro-turbine system analysis
The analysis of the fuel cell micro turbine combined cycle is described below. Theoverall process is described first followed by engine fuel cell integration concepts, designassumptions, a description of the major equipment, input data, a heat and materialbalance and then the modeling approach and methodology.
2.1.1 Process Description
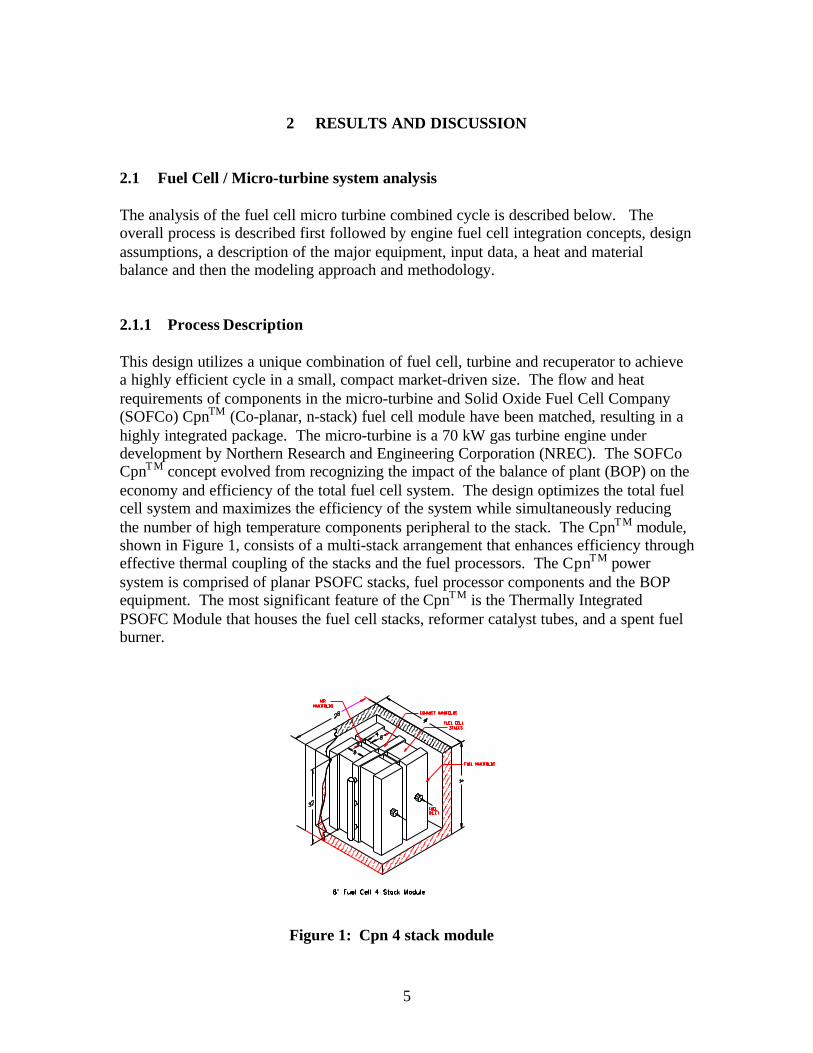
This design utilizes a unique combination of fuel cell, turbine and recuperator to achievea highly efficient cycle in a small, compact market-driven size. The flow and heatrequirements of components in the micro-turbine and Solid Oxide Fuel Cell Company(SOFCo) CpnTM (Co-planar, n-stack) fuel cell module have been matched, resulting in ahighly integrated package. The micro-turbine is a 70 kW gas turbine engine underdevelopment by Northern Research and Engineering Corporation (NREC). The SOFCoCpnTM concept evolved from recognizing the impact of the balance of plant (BOP) on theeconomy and efficiency of the total fuel cell system. The design optimizes the total fuelcell system and maximizes the efficiency of the system while simultaneously reducingthe number of high temperature components peripheral to the stack. The CpnTM module,shown in Figure 1, consists of a multi-stack arrangement that enhances efficiency througheffective thermal coupling of the stacks and the fuel processors. The CpnTM powersystem is comprised of planar PSOFC stacks, fuel processor components and the BOPequipment. The most significant feature of the CpnTM is the Thermally IntegratedPSOFC Module that houses the fuel cell stacks, reformer catalyst tubes, and a spent fuelburner.
Figure 1: Cpn 4 stack module
6
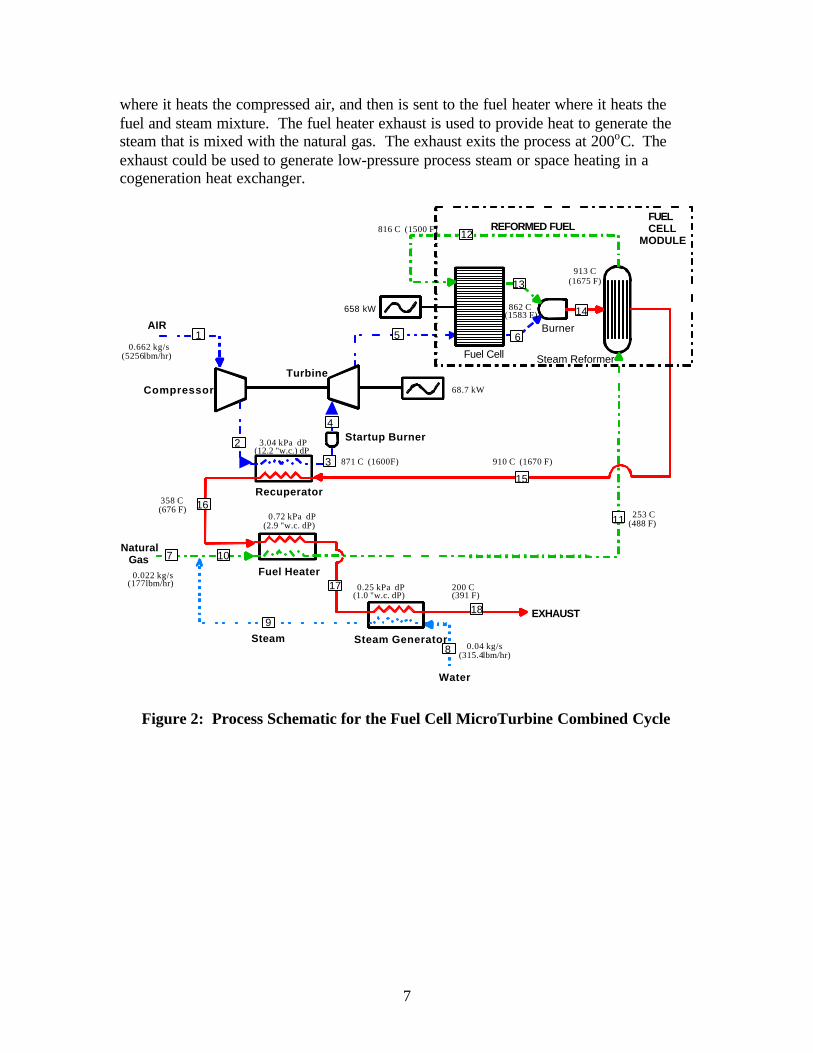
A process schematic for the fuel cell/micro-turbine combined cycle is shown in Figure 2.The state parameters for the system are listed in Table 1, and the design parameters usedin the system analysis are listed in Table 2. The air is first compressed in the compressorat a 3:1 pressure ratio. The air is then heated to 1600oF in a high temperature recuperatorby utilizing exhaust gas from the CpnTM module. The hot, high-pressure air is then
expanded through the turbine providing power for the compressor and electricalgeneration. The turbine produces 68.8 kWe of net electrical power or 9.5% of the total.The air is then sent to the fuel cell.
Natural gas is mixed with steam that was generated in the steam generator coil, and themixture is then heated further in the fuel heater. The heated fuel/steam mixture is thensent to the steam reformer. In the steam reformer, the fuel-steam mixture passes oversteam reforming catalyst and is processed into hydrogen rich reformate and sent to thefuel cell. The hydrogen and carbon monoxide in the fuel are electrochemically oxidizedin the fuel cell producing electrical power. The fuel cell produces 657.6 kW of electricalpower or 90.5% of the total. The unreacted fuel exiting the fuel cell is burned with thefuel cell cooling air in the fuel cell module enclosure, further boosting the exhausttemperature and providing heat to drive the steam reforming reactions in the steamreformer. The hot gas leaving the CpnTM is then sent to the high temperature recuperator
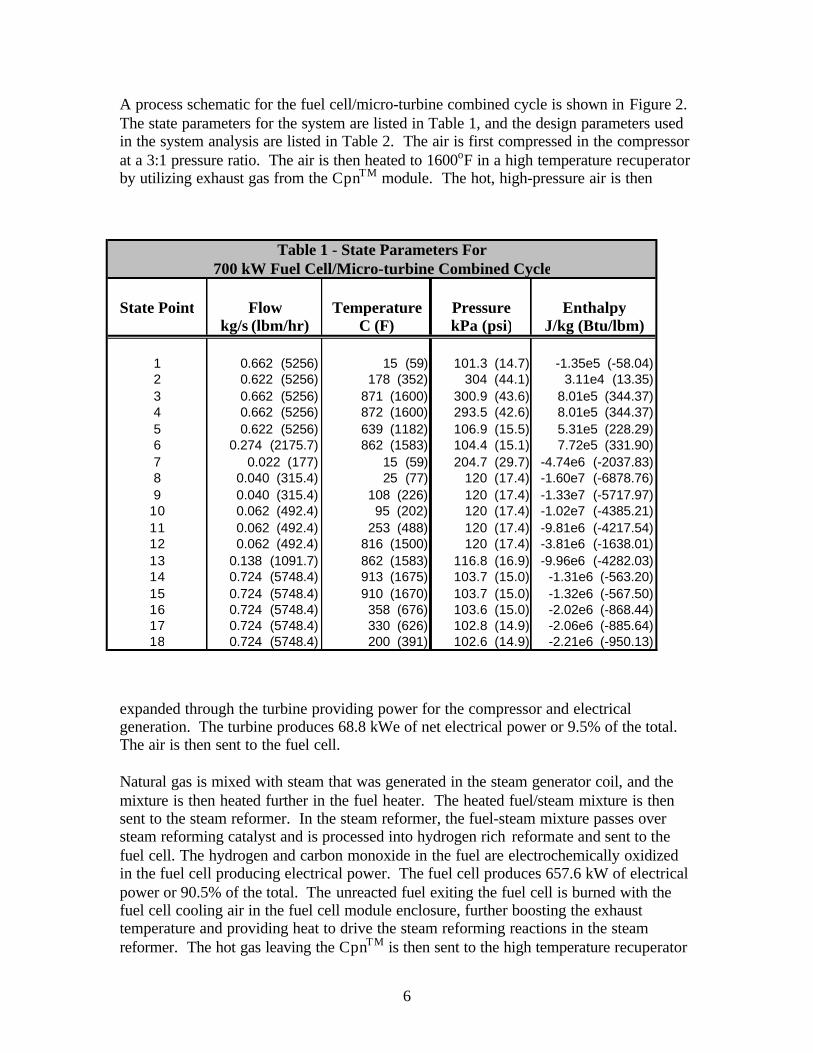
State Point Flow Temperature Pressure Enthalpykg/s (lbm/hr) C (F) kPa (psi) J/kg (Btu/lbm)
1 0.662 (5256) 15 (59) 101.3 (14.7) -1.35e5 (-58.04)2 0.622 (5256) 178 (352) 304 (44.1) 3.11e4 (13.35)3 0.662 (5256) 871 (1600) 300.9 (43.6) 8.01e5 (344.37)4 0.662 (5256) 872 (1600) 293.5 (42.6) 8.01e5 (344.37)5 0.622 (5256) 639 (1182) 106.9 (15.5) 5.31e5 (228.29)6 0.274 (2175.7) 862 (1583) 104.4 (15.1) 7.72e5 (331.90)7 0.022 (177) 15 (59) 204.7 (29.7) -4.74e6 (-2037.83)8 0.040 (315.4) 25 (77) 120 (17.4) -1.60e7 (-6878.76)9 0.040 (315.4) 108 (226) 120 (17.4) -1.33e7 (-5717.97)
10 0.062 (492.4) 95 (202) 120 (17.4) -1.02e7 (-4385.21)11 0.062 (492.4) 253 (488) 120 (17.4) -9.81e6 (-4217.54)12 0.062 (492.4) 816 (1500) 120 (17.4) -3.81e6 (-1638.01)13 0.138 (1091.7) 862 (1583) 116.8 (16.9) -9.96e6 (-4282.03)14 0.724 (5748.4) 913 (1675) 103.7 (15.0) -1.31e6 (-563.20)15 0.724 (5748.4) 910 (1670) 103.7 (15.0) -1.32e6 (-567.50)16 0.724 (5748.4) 358 (676) 103.6 (15.0) -2.02e6 (-868.44)17 0.724 (5748.4) 330 (626) 102.8 (14.9) -2.06e6 (-885.64)18 0.724 (5748.4) 200 (391) 102.6 (14.9) -2.21e6 (-950.13)
Table 1 - State Parameters For700 kW Fuel Cell/Micro-turbine Combined Cycle
7
where it heats the compressed air, and then is sent to the fuel heater where it heats thefuel and steam mixture. The fuel heater exhaust is used to provide heat to generate thesteam that is mixed with the natural gas. The exhaust exits the process at 200oC. Theexhaust could be used to generate low-pressure process steam or space heating in acogeneration heat exchanger.
Figure 2: Process Schematic for the Fuel Cell MicroTurbine Combined Cycle
Water
NaturalGas
AIR
REFORMED FUEL
EXHAUST
Fuel Cell
Burner
Steam Reformer
Compressor
Turbine
Fuel Heater
Recuperator
(1583 F)
(177 lbm/hr)
1
2
3
4
6
7 10
11
12
13
15
16
658 kW
68.7 kW
(5256 lbm/hr)0.662 kg/s
(12.2 "w.c.) dP3.04 kPa dP
871 C (1600F)
862 C
816 C (1500 F)
(1675 F)913 C
910 C (1670 F)
(676 F)358 C
18
8 (315.4 lbm/hr)0.04 kg/s
Steam Generator
9Steam
0.022 kg/s
(2.9 "w.c. dP)0.72 kPa dP
(488 F)253 C
17(391 F)200 C
(1.0 "w.c. dP)0.25 kPa dP
5
Startup Burner
FUELCELL
MODULE
14
8
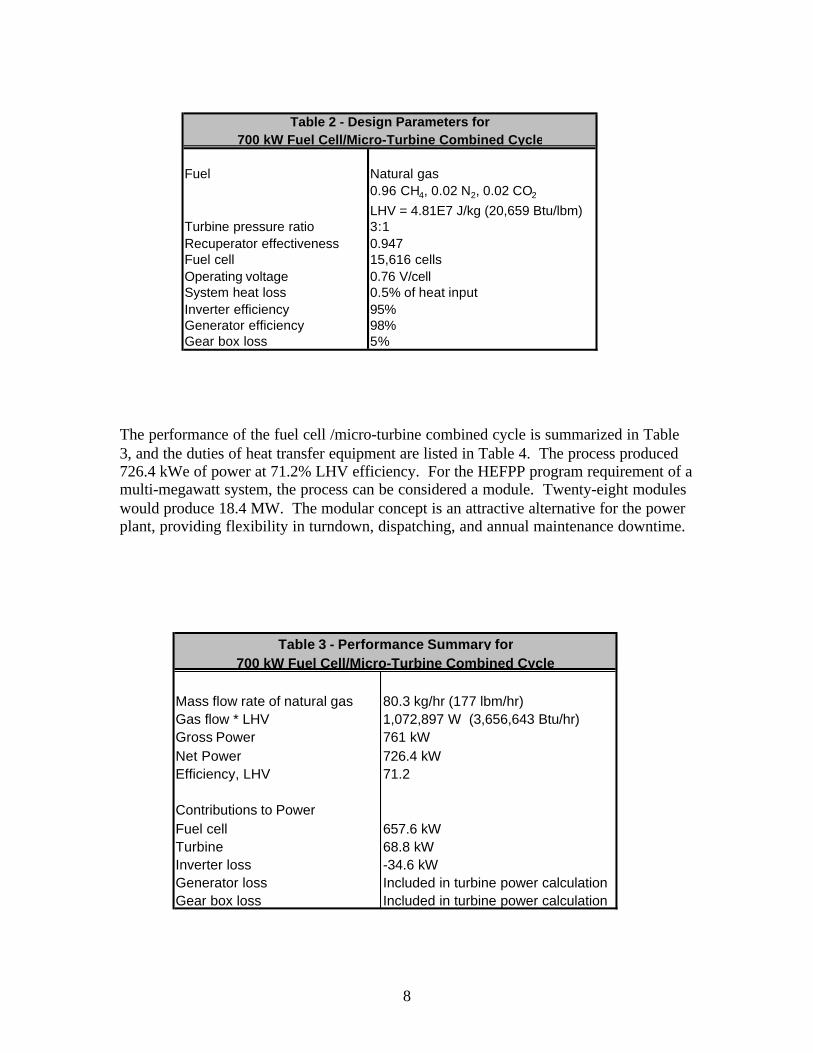
The performance of the fuel cell /micro-turbine combined cycle is summarized in Table3, and the duties of heat transfer equipment are listed in Table 4. The process produced726.4 kWe of power at 71.2% LHV efficiency. For the HEFPP program requirement of amulti-megawatt system, the process can be considered a module. Twenty-eight moduleswould produce 18.4 MW. The modular concept is an attractive alternative for the powerplant, providing flexibility in turndown, dispatching, and annual maintenance downtime.
Fuel Natural gas0.96 CH4, 0.02 N2, 0.02 CO2
LHV = 4.81E7 J/kg (20,659 Btu/lbm)Turbine pressure ratio 3:1Recuperator effectiveness 0.947Fuel cell 15,616 cellsOperating voltage 0.76 V/cellSystem heat loss 0.5% of heat inputInverter efficiency 95%Generator efficiency 98%Gear box loss 5%
Table 2 - Design Parameters for700 kW Fuel Cell/Micro-Turbine Combined Cycle
Mass flow rate of natural gas 80.3 kg/hr (177 lbm/hr)Gas flow * LHV 1,072,897 W (3,656,643 Btu/hr)Gross Power 761 kWNet Power 726.4 kWEfficiency, LHV 71.2
Contributions to PowerFuel cell 657.6 kWTurbine 68.8 kWInverter loss -34.6 kWGenerator loss Included in turbine power calculationGear box loss Included in turbine power calculation
Table 3 - Performance Summary for700 kW Fuel Cell/Micro-Turbine Combined Cycle
9
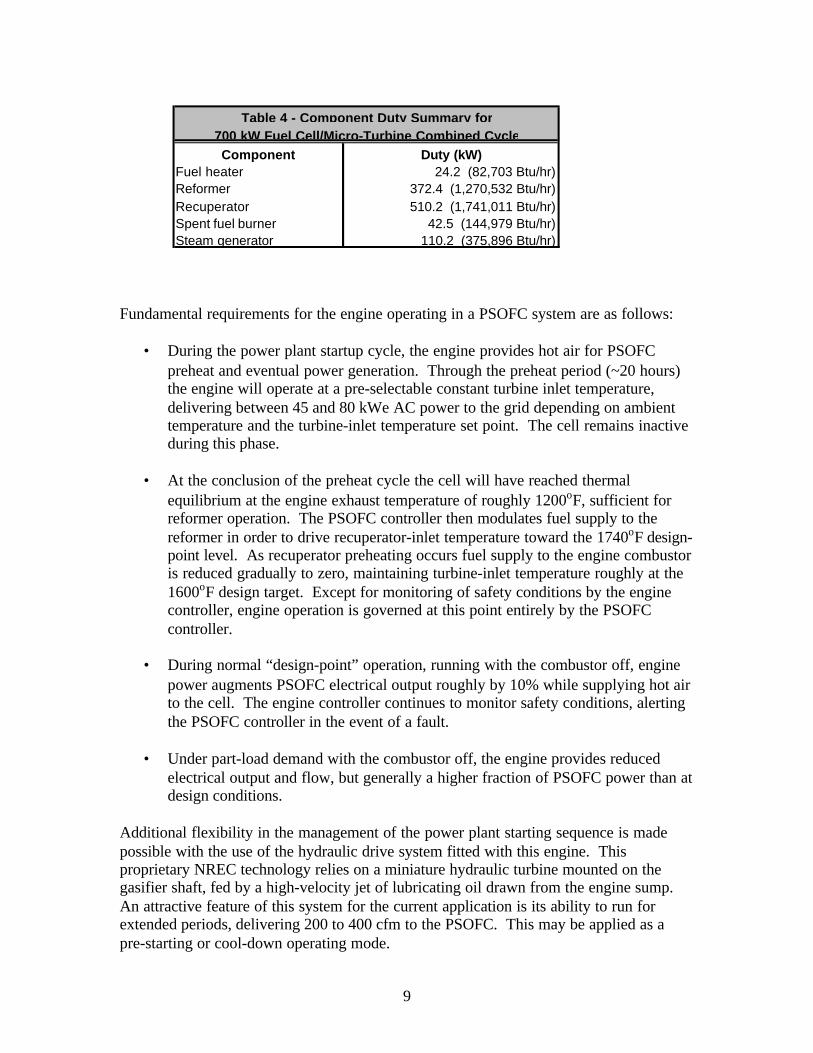
Fundamental requirements for the engine operating in a PSOFC system are as follows:
• During the power plant startup cycle, the engine provides hot air for PSOFCpreheat and eventual power generation. Through the preheat period (~20 hours)the engine will operate at a pre-selectable constant turbine inlet temperature,delivering between 45 and 80 kWe AC power to the grid depending on ambienttemperature and the turbine-inlet temperature set point. The cell remains inactiveduring this phase.
• At the conclusion of the preheat cycle the cell will have reached thermal
equilibrium at the engine exhaust temperature of roughly 1200oF, sufficient forreformer operation. The PSOFC controller then modulates fuel supply to thereformer in order to drive recuperator-inlet temperature toward the 1740oF design-point level. As recuperator preheating occurs fuel supply to the engine combustoris reduced gradually to zero, maintaining turbine-inlet temperature roughly at the1600oF design target. Except for monitoring of safety conditions by the enginecontroller, engine operation is governed at this point entirely by the PSOFCcontroller.
• During normal “design-point” operation, running with the combustor off, enginepower augments PSOFC electrical output roughly by 10% while supplying hot airto the cell. The engine controller continues to monitor safety conditions, alertingthe PSOFC controller in the event of a fault.
• Under part-load demand with the combustor off, the engine provides reduced
electrical output and flow, but generally a higher fraction of PSOFC power than atdesign conditions.
Additional flexibility in the management of the power plant starting sequence is madepossible with the use of the hydraulic drive system fitted with this engine. Thisproprietary NREC technology relies on a miniature hydraulic turbine mounted on thegasifier shaft, fed by a high-velocity jet of lubricating oil drawn from the engine sump.An attractive feature of this system for the current application is its ability to run forextended periods, delivering 200 to 400 cfm to the PSOFC. This may be applied as apre-starting or cool-down operating mode.
Component Duty (kW)Fuel heater 24.2 (82,703 Btu/hr)Reformer 372.4 (1,270,532 Btu/hr)Recuperator 510.2 (1,741,011 Btu/hr)Spent fuel burner 42.5 (144,979 Btu/hr)Steam generator 110.2 (375,896 Btu/hr)
Table 4 - Component Duty Summary for700 kW Fuel Cell/Micro-Turbine Combined Cycle

10
During normal power plant operation the combustor is not fired. The engine power andflow under these circumstances depends entirely on turbine-inlet temperature andambient conditions, the former dependent chiefly on recuperator-inlet temperature. Thegenerator remains synchronized to the utility grid in all conditions. An attribute of thissystem is that turbine-inlet temperature will not drop substantially during power plantturndown, hence the engine will continue to run at high efficiency. At low PSOFCcurrent density, with flow roughly at the design value, oxidant utilization will be low,boosting PSOFC efficiency.
2.1.2 Engine/Fuel cell Integration Concepts
The critical engine/fuel cell integration challenge is the development of a recuperatorcapable of accepting gas-inlet temperatures in excess of 1740oF, well beyond thecapability of superalloys in this service. The design concepts developed in this study relyon the use of the advanced material PM2000 (Plansee GmbH, Germany), a so-calledoxide-dispersion-strengthened (ODS) powdered-metal alloy. Although some questionsremain regarding formability of this material in our manufacturing process, provided theproblems can be overcome (and we expect that they can) a recuperator very similar indesign to that of our current unit will be suitable. This greatly simplifies the job ofbuilding the recuperator and of packaging it in our engine.
Despite our optimism that PM2000 can be made to work, we’ve allowed in our costprojections for a more proven alternative solution in the form of a “hybrid” recuperator.This is the concept put forth in our original proposal, which makes use of a high-temperature tube-shell unit inserted in series with a recuperator similar to our currentdesign. Compared to the single-recuperator approach this concept carries a substantialcost penalty, mostly from the high cost of the tube-shell unit, but also from costsassociated with modifying the existing recuperator case and supports. The hybridapproach also carries a performance penalty in the form of additional pressure loss for thesame thermodynamic effectiveness.
The hybrid concept has been evaluated to the extent that rough cost projections can bemade, but explicit design layouts have been developed only for the single high-temperature recuperator approach. In part this reflects our view as to the superiority ofthe latter concept, and our optimism that it can be made to work.
The remaining integration challenges are largely associated with ducting hot gases withacceptable pressure and heat losses.
The engine modeled in this study is based on NREC’s PowerWorks™ engine. ThePowerWorks™ engine was originally developed in the early 1980s under GRIsponsorship. It is now in it’s fourth generation of development. It incorporates a single-spool gasifier and a low-speed power turbine. A single-stage gear box reduces the 44,000RPM power turbine to 3600 RPM so that a conventional generator can be used. As astand-alone machine the PowerWorks engine is tightly packaged to achieve these
11
objectives, and significant re-orientation of components is needed to allow for ductingtransitions to the fuel cell. The following existing engine systems will require substantialrework:
ü chassisü compressor-recuperator ductü recuperator inlet plenum/headerü exhaust plenumü lubrication-system piping
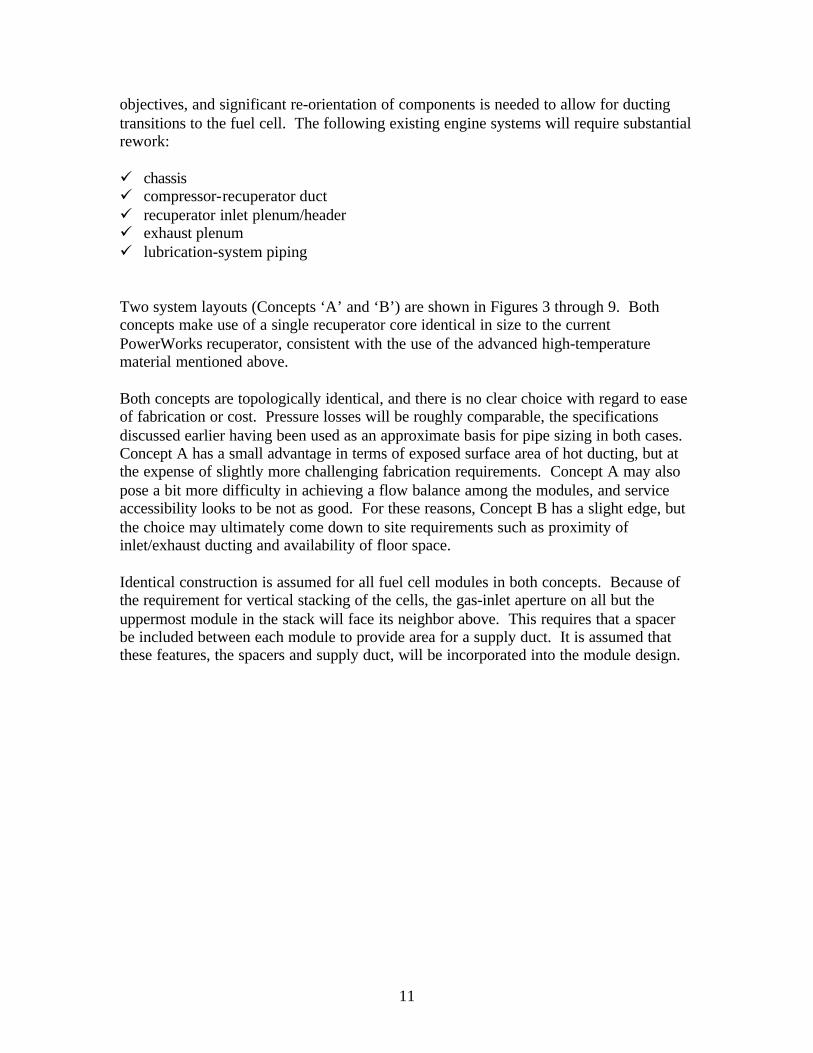
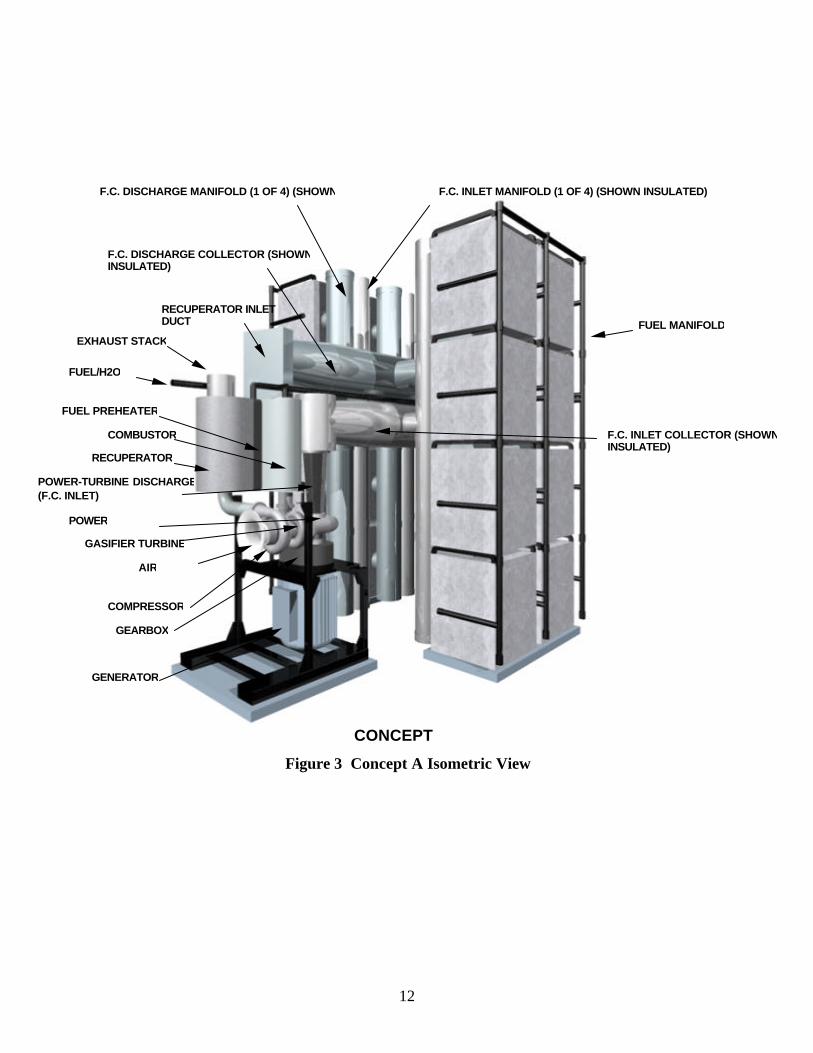
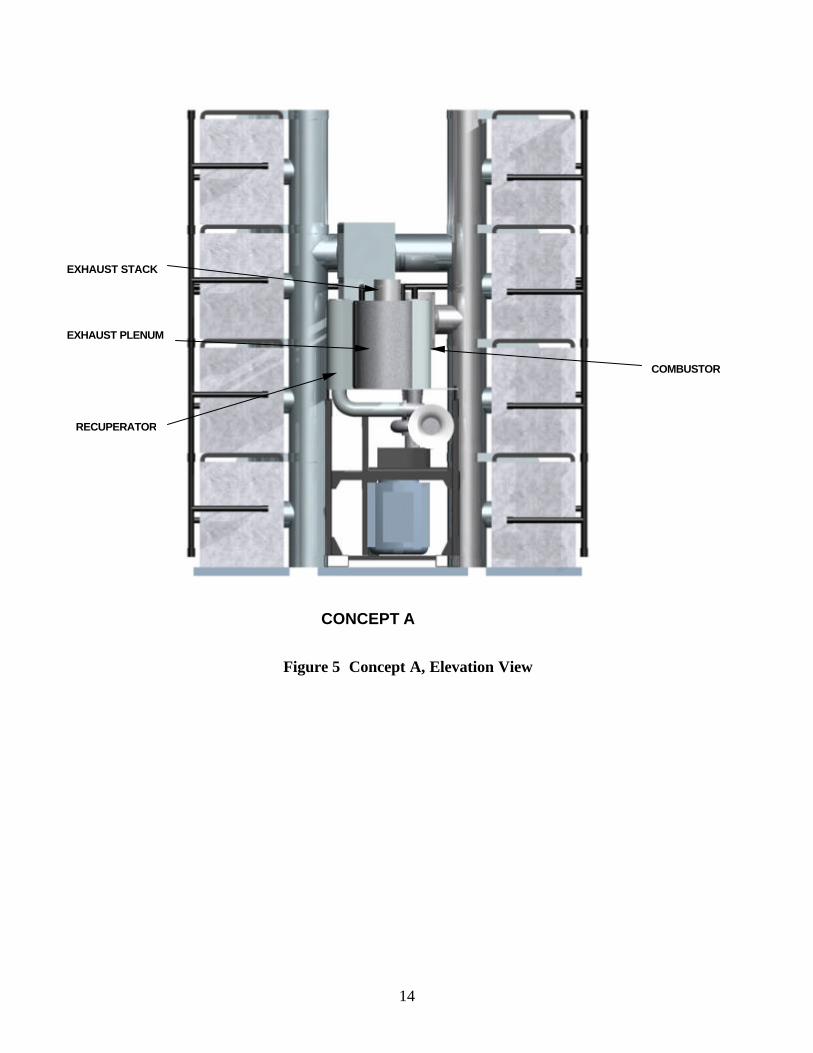
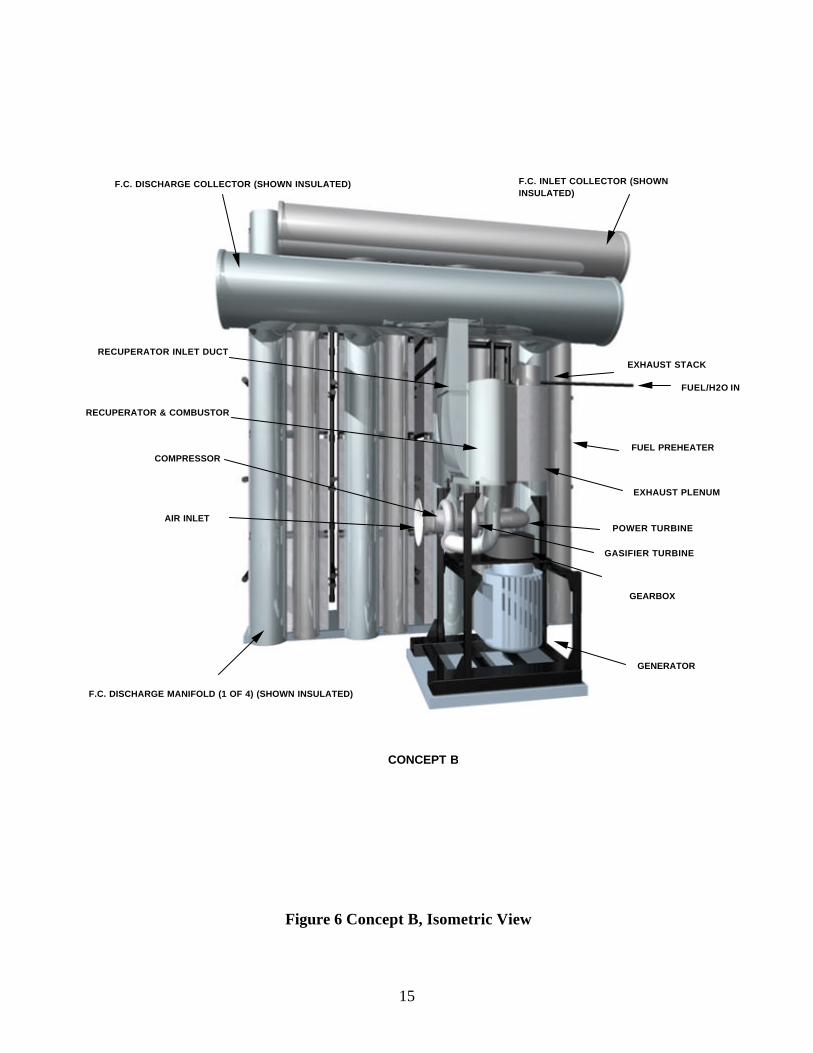
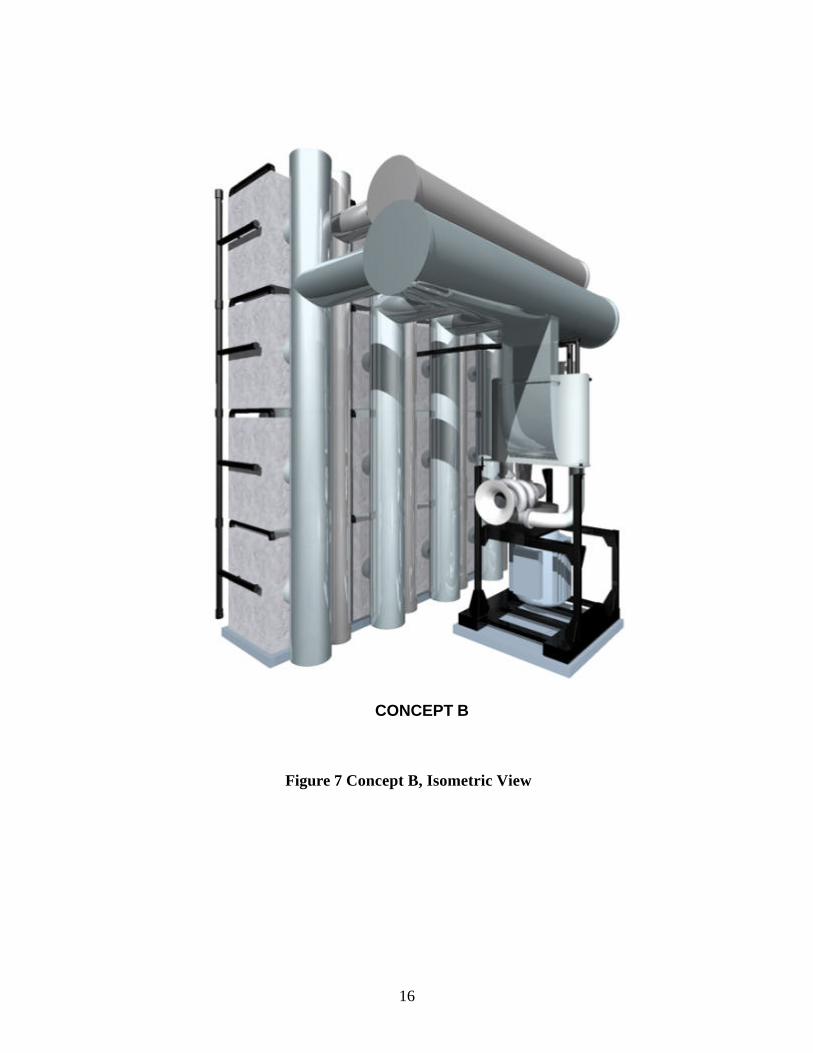
Two system layouts (Concepts ‘A’ and ‘B’) are shown in Figures 3 through 9. Bothconcepts make use of a single recuperator core identical in size to the currentPowerWorks recuperator, consistent with the use of the advanced high-temperaturematerial mentioned above.
Both concepts are topologically identical, and there is no clear choice with regard to easeof fabrication or cost. Pressure losses will be roughly comparable, the specificationsdiscussed earlier having been used as an approximate basis for pipe sizing in both cases.Concept A has a small advantage in terms of exposed surface area of hot ducting, but atthe expense of slightly more challenging fabrication requirements. Concept A may alsopose a bit more difficulty in achieving a flow balance among the modules, and serviceaccessibility looks to be not as good. For these reasons, Concept B has a slight edge, butthe choice may ultimately come down to site requirements such as proximity ofinlet/exhaust ducting and availability of floor space.
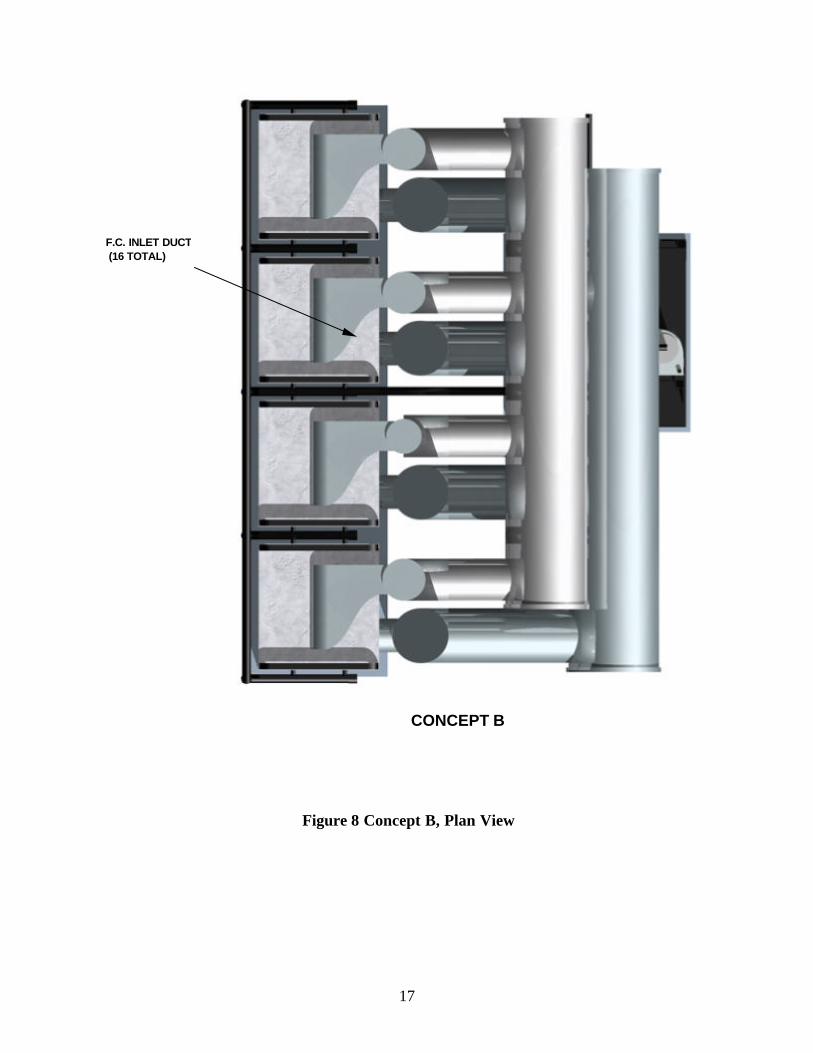
Identical construction is assumed for all fuel cell modules in both concepts. Because ofthe requirement for vertical stacking of the cells, the gas-inlet aperture on all but theuppermost module in the stack will face its neighbor above. This requires that a spacerbe included between each module to provide area for a supply duct. It is assumed thatthese features, the spacers and supply duct, will be incorporated into the module design.
12
Figure 3 Concept A Isometric View
F.C. DISCHARGE COLLECTOR (SHOWNINSULATED)
RECUPERATOR INLETDUCT
RECUPERATOR
COMPRESSOR
AIRINLET
F.C. DISCHARGE MANIFOLD (1 OF 4) (SHOWNINSULATED)
F.C. INLET COLLECTOR (SHOWNINSULATED)
EXHAUST STACK
FUEL/H2OIN
FUEL PREHEATER
POWERTURBINE
GASIFIER TURBINE
GEARBOX
GENERATOR
CONCEPT
COMBUSTOR
F.C. INLET MANIFOLD (1 OF 4) (SHOWN INSULATED)
FUEL MANIFOLD
POWER-TURBINE DISCHARGE(F.C. INLET)
13
Figure 4 Concept A, Plan View
F.C. INLET DUCT(16 TOTAL)
CONCEPT A
14
Figure 5 Concept A, Elevation View
CONCEPT A
RECUPERATOR
EXHAUST PLENUM
COMBUSTOR
EXHAUST STACK
15
Figure 6 Concept B, Isometric View
CONCEPT B
FUEL/H2O IN
F.C. DISCHARGE COLLECTOR (SHOWN INSULATED) F.C. INLET COLLECTOR (SHOWNINSULATED)
F.C. DISCHARGE MANIFOLD (1 OF 4) (SHOWN INSULATED)
GENERATOR
GEARBOX
POWER TURBINE
FUEL PREHEATER
EXHAUST PLENUM
EXHAUST STACK
GASIFIER TURBINE
COMPRESSOR
AIR INLET
RECUPERATOR & COMBUSTOR
RECUPERATOR INLET DUCT
16
Figure 7 Concept B, Isometric View
CONCEPT B
17
Figure 8 Concept B, Plan View
F.C. INLET DUCT (16 TOTAL)
CONCEPT B
18
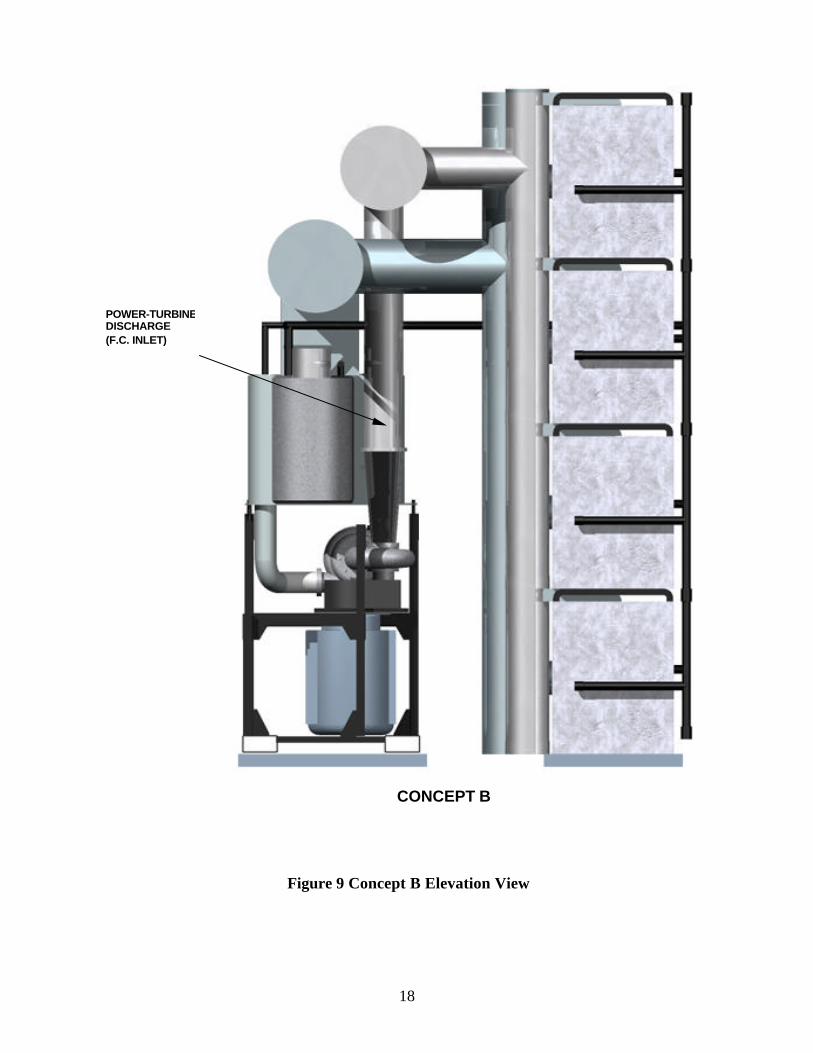
Figure 9 Concept B Elevation View
CONCEPT B
POWER-TURBINEDISCHARGE(F.C. INLET)
19
Manifold Systems
The manifold systems comprise large horizontal-running ducts from the engine andvertical ducts at each stack of fuel-cell modules. Ducts have been sized to limit flowvelocity to 60 fps (feet per second), consistent with the pressure-loss specifications citedearlier and in an effort to promote uniform flow distribution. Three inches of insulationwill limit outer-wall temperatures below 240°F.
Manifolds would be constructed from light-gauge superalloy sleeves wrapped withinsulation and surrounded by heavier-gauge low-grade Stainless Steel. The .035-inch1
thick inner sleeves are segmented, allowing relative sliding to accommodate thermalgrowth. This choice of wall thickness is based on a 10,000-hr life target based on a .010-inch margin. This construction minimizes the weight of expensive materials and avoidsuse of metal bellows. The strong outer casing also makes for a straightforward approachto supporting heavy piping, although for clarity the structural framework has beenomitted from the figures.
Single-Recuperator Approach
This is the preferred option as discussed earlier, provided that the advanced materialPM2000 can be successfully utilized. Strength, oxidation resistance, and thermalconductivity are ample at 1740oF based on published data. The material is currentlyavailable from Plansee in the appropriate gauge thicknesses.
Successful manufacture of a PM2000 recuperator requires that it be brazable, and that itbe amenable to intricate forming in our fin-folding process. Current experience with themanufacture of honeycomb turbine seals proves brazeability, and tentatively indicatesthat formability will be acceptable. This latter question cannot yet be answereddefinitively, however. Samples have been sent to a die vendor for further examination ofthis question.
Cost of PM2000 remains a pressing issue for small quantities, but would be expected tobecome manageable for production quantities. For preliminary budgeting purposes aspeculative cost of $200 per lb. was used. Even at this premium price, for prototypedevelopment the single-recuperator approach maintains a compelling cost advantage overthe tandem concept.
To explore producibility issues and to obtain operational experience, a partial heat-exchanger core should be built and rig-tested prior to moving forward with constructionof a full unit. This approach was taken during the development phase of our currentrecuperator, enabling the transition to volume production with low risk. A recuperatorcore comprising ten cells is envisioned. Experience gained while preparing the testarticle would likely suggest modifications to the manufacturing process. Testing would 1 The Aerospace Structural Metals Handbook indicates .002-inch loss of material in IN625 after800 hours in 1,800°F air.
20
include coupon burst-tests to establish strength of the brazed structure, and partial-coreburst tests to measure the strength of the heat exchanger. A rig similar to that shown inFigure 10 would be constructed using high-temperature materials, and thermal-cyclingand endurance testing carried out. Partial-core testing is envisioned as a separate task andis not budgeted under the current program.
Tandem-Recuperator Approach
The tandem-recuperator approach represents a compromise that can hopefully beavoided, but investigation remains worthwhile in the event that the single-recuperatorstrategy is unsuccessful.
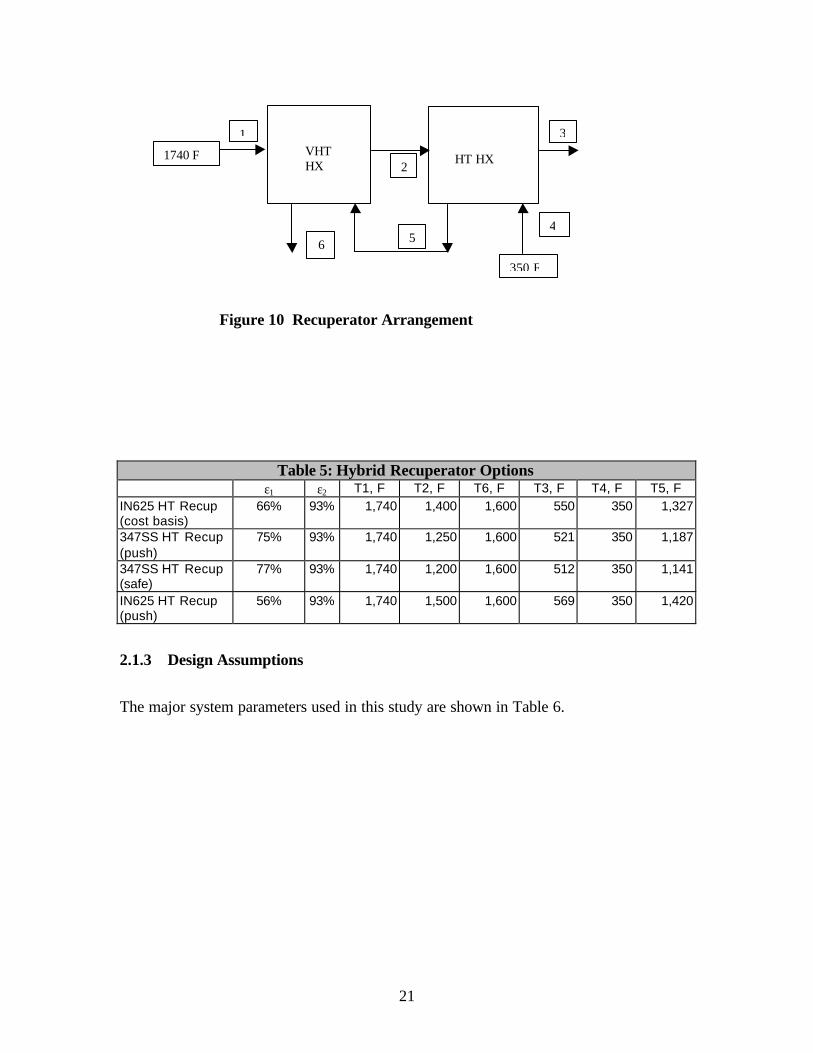
The strategy is to make use of a recuperator whose construction would resemble ourcurrent design, but likely made from a higher-temperature alloy; this is termed the high-temperature (HT) recuperator in what follows. In series with the HT recuperator is acommercial tube-shell unit capable of withstanding the full 1740oF requirement; this isthe very-high-temperature (VHT) recuperator. Construction of the HT recuperator wouldbe a very straightforward application of our current manufacturing technology, andcarries very low risk. The VHT recuperator is the more serious design challenge.
Ceramics would appear to be an obvious choice for this application in view of their high-temperature capability and low thermal expansion. Tube-shell ceramic heat exchangersare under current development by United Technologies Corporation and CHXEngineering, with units having been successfully tested at temperatures up to 2000°F.For the proposed application the most compelling disadvantage of these units is theirlarge size compared to a compact plate-fin design, which carries a penalty in terms of thecost of the unit and in terms of integration with the PSOFC power plant.
A cost tradeoff exists between the thermodynamic effectiveness of the two recuperators.For a constant overall effectiveness of the pair, increased effectiveness of the VHT unitreduces the inlet temperature to the HT unit, increasing the size and cost of the formerwhile enabling the latter to be fabricated from lower-cost materials.
It is preferable from an cost perspective to find the temperature limit of the HT heatexchanger, as the VHT unit is expected to dominate the cost. Based on a roughpreliminary study of this issue (see table attached), we settled on an effectiveness near66% as a rough optimum for the VHT unit. For the HT unit this corresponds to an inlettemperature of 1400oF at PSOFC design conditions, although it is unclear at this pointwhether an IN625 HT heat exchanger will have a satisfactory life at this temperaturedifferential and pressure loading (∆T=1150oF, ∆p=38 psi). A test program would beneeded to confirm acceptability.
21
Table 5: Hybrid Recuperator Optionsε1 ε2 T1, F T2, F T6, F T3, F T4, F T5, F
IN625 HT Recup(cost basis)
66% 93% 1,740 1,400 1,600 550 350 1,327
347SS HT Recup(push)
75% 93% 1,740 1,250 1,600 521 350 1,187
347SS HT Recup(safe)
77% 93% 1,740 1,200 1,600 512 350 1,141
IN625 HT Recup(push)
56% 93% 1,740 1,500 1,600 569 350 1,420
2.1.3 Design Assumptions
The major system parameters used in this study are shown in Table 6.
1740 F
350 F
1
2
3
456
VHTHX HT HX
Figure 10 Recuperator Arrangement
22
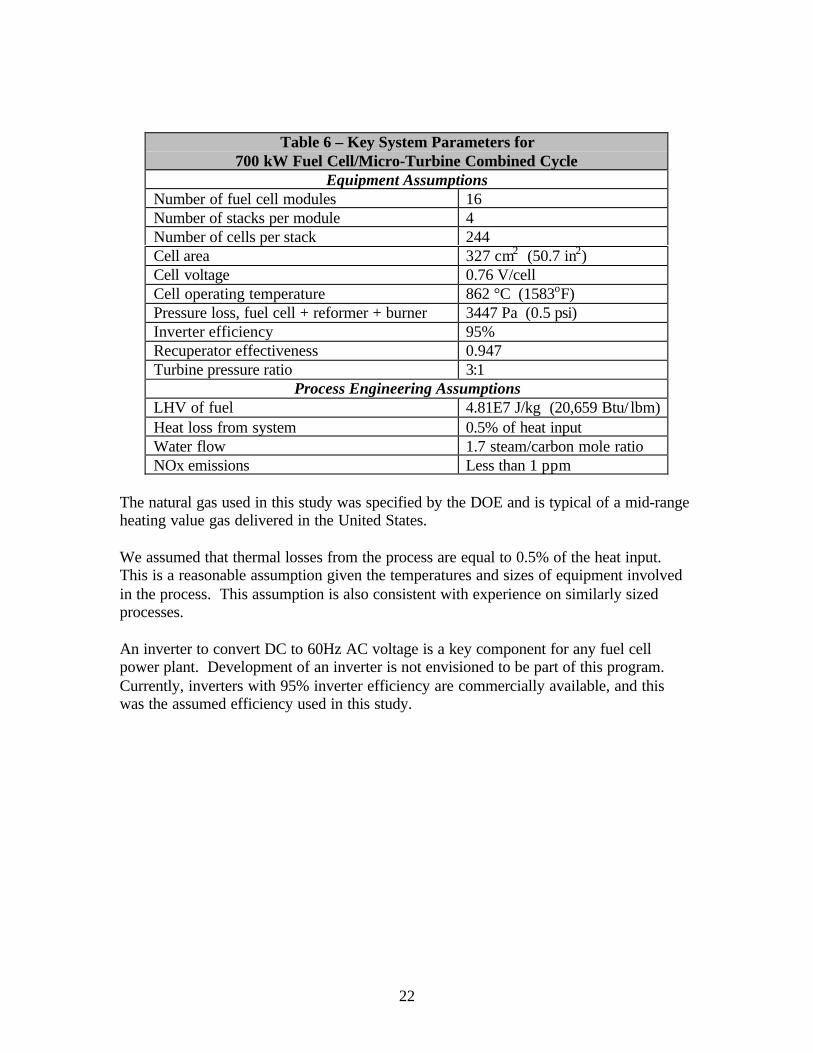
Table 6 – Key System Parameters for700 kW Fuel Cell/Micro-Turbine Combined Cycle
Equipment AssumptionsNumber of fuel cell modules 16Number of stacks per module 4Number of cells per stack 244Cell area 327 cm2 (50.7 in2)Cell voltage 0.76 V/cellCell operating temperature 862 °C (1583oF)Pressure loss, fuel cell + reformer + burner 3447 Pa (0.5 psi)Inverter efficiency 95%Recuperator effectiveness 0.947Turbine pressure ratio 3:1
Process Engineering AssumptionsLHV of fuel 4.81E7 J/kg (20,659 Btu/ lbm)Heat loss from system 0.5% of heat inputWater flow 1.7 steam/carbon mole ratioNOx emissions Less than 1 ppm
The natural gas used in this study was specified by the DOE and is typical of a mid-rangeheating value gas delivered in the United States.
We assumed that thermal losses from the process are equal to 0.5% of the heat input.This is a reasonable assumption given the temperatures and sizes of equipment involvedin the process. This assumption is also consistent with experience on similarly sizedprocesses.
An inverter to convert DC to 60Hz AC voltage is a key component for any fuel cellpower plant. Development of an inverter is not envisioned to be part of this program.Currently, inverters with 95% inverter efficiency are commercially available, and thiswas the assumed efficiency used in this study.
23
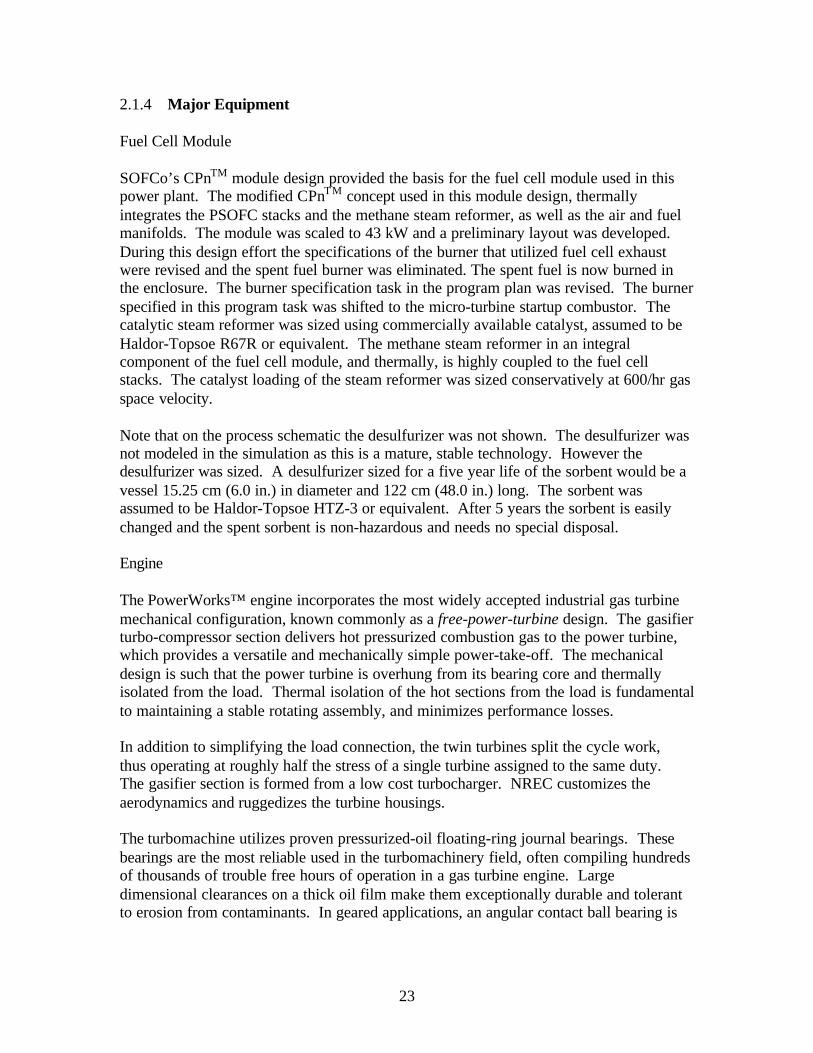
2.1.4 Major Equipment
Fuel Cell Module
SOFCo’s CPnTM module design provided the basis for the fuel cell module used in thispower plant. The modified CPnTM concept used in this module design, thermallyintegrates the PSOFC stacks and the methane steam reformer, as well as the air and fuelmanifolds. The module was scaled to 43 kW and a preliminary layout was developed.During this design effort the specifications of the burner that utilized fuel cell exhaustwere revised and the spent fuel burner was eliminated. The spent fuel is now burned inthe enclosure. The burner specification task in the program plan was revised. The burnerspecified in this program task was shifted to the micro-turbine startup combustor. Thecatalytic steam reformer was sized using commercially available catalyst, assumed to beHaldor-Topsoe R67R or equivalent. The methane steam reformer in an integralcomponent of the fuel cell module, and thermally, is highly coupled to the fuel cellstacks. The catalyst loading of the steam reformer was sized conservatively at 600/hr gasspace velocity.
Note that on the process schematic the desulfurizer was not shown. The desulfurizer wasnot modeled in the simulation as this is a mature, stable technology. However thedesulfurizer was sized. A desulfurizer sized for a five year life of the sorbent would be avessel 15.25 cm (6.0 in.) in diameter and 122 cm (48.0 in.) long. The sorbent wasassumed to be Haldor-Topsoe HTZ-3 or equivalent. After 5 years the sorbent is easilychanged and the spent sorbent is non-hazardous and needs no special disposal.
Engine
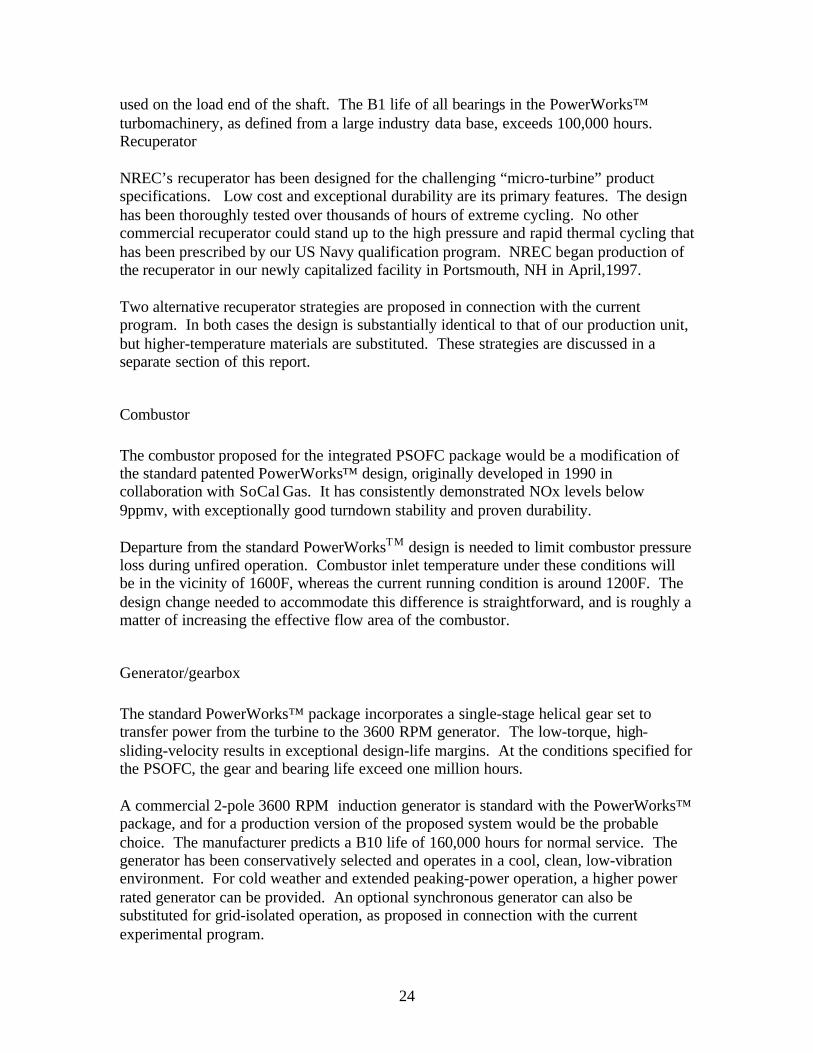
The PowerWorks™ engine incorporates the most widely accepted industrial gas turbinemechanical configuration, known commonly as a free-power-turbine design. The gasifierturbo-compressor section delivers hot pressurized combustion gas to the power turbine,which provides a versatile and mechanically simple power-take-off. The mechanicaldesign is such that the power turbine is overhung from its bearing core and thermallyisolated from the load. Thermal isolation of the hot sections from the load is fundamentalto maintaining a stable rotating assembly, and minimizes performance losses.
In addition to simplifying the load connection, the twin turbines split the cycle work,thus operating at roughly half the stress of a single turbine assigned to the same duty.The gasifier section is formed from a low cost turbocharger. NREC customizes theaerodynamics and ruggedizes the turbine housings.
The turbomachine utilizes proven pressurized-oil floating-ring journal bearings. Thesebearings are the most reliable used in the turbomachinery field, often compiling hundredsof thousands of trouble free hours of operation in a gas turbine engine. Largedimensional clearances on a thick oil film make them exceptionally durable and tolerantto erosion from contaminants. In geared applications, an angular contact ball bearing is
24
used on the load end of the shaft. The B1 life of all bearings in the PowerWorks™turbomachinery, as defined from a large industry data base, exceeds 100,000 hours.Recuperator
NREC’s recuperator has been designed for the challenging “micro-turbine” productspecifications. Low cost and exceptional durability are its primary features. The designhas been thoroughly tested over thousands of hours of extreme cycling. No othercommercial recuperator could stand up to the high pressure and rapid thermal cycling thathas been prescribed by our US Navy qualification program. NREC began production ofthe recuperator in our newly capitalized facility in Portsmouth, NH in April,1997.
Two alternative recuperator strategies are proposed in connection with the currentprogram. In both cases the design is substantially identical to that of our production unit,but higher-temperature materials are substituted. These strategies are discussed in aseparate section of this report.
Combustor
The combustor proposed for the integrated PSOFC package would be a modification ofthe standard patented PowerWorks™ design, originally developed in 1990 incollaboration with SoCal Gas. It has consistently demonstrated NOx levels below9ppmv, with exceptionally good turndown stability and proven durability.
Departure from the standard PowerWorksTM design is needed to limit combustor pressureloss during unfired operation. Combustor inlet temperature under these conditions willbe in the vicinity of 1600F, whereas the current running condition is around 1200F. Thedesign change needed to accommodate this difference is straightforward, and is roughly amatter of increasing the effective flow area of the combustor.
Generator/gearbox
The standard PowerWorks™ package incorporates a single-stage helical gear set totransfer power from the turbine to the 3600 RPM generator. The low-torque, high-sliding-velocity results in exceptional design-life margins. At the conditions specified forthe PSOFC, the gear and bearing life exceed one million hours.
A commercial 2-pole 3600 RPM induction generator is standard with the PowerWorks™package, and for a production version of the proposed system would be the probablechoice. The manufacturer predicts a B10 life of 160,000 hours for normal service. Thegenerator has been conservatively selected and operates in a cool, clean, low-vibrationenvironment. For cold weather and extended peaking-power operation, a higher powerrated generator can be provided. An optional synchronous generator can also besubstituted for grid-isolated operation, as proposed in connection with the currentexperimental program.

25
Controls and starting
The PowerWorks™ engine is currently controlled by an industrial programmable logiccontroller (PLC) while undergoing laboratory testing. The production version of theproduct will incorporate Ingersoll-Rand’s standard Intellesys™ micro-processor basedcontroller. The PLC is well suited for the initial PSOFC/GT demonstration unit becauseof its versatility, allowing basic engine control and safety functions to be integratedreadily with those of the PSOFC. During start-up, the controller monitors the power-turbine speed as it accelerates toward synchronous operation, at which point the inductiongenerator is latched to the grid and remains at a fixed 3600 rpm. During the PSOFCpreheat period, the controller governs engine fuel throttle to maintain the prescribedturbine-inlet temperature set-point.
The engine is started by activating the hydraulic starter, a miniature turbine locatedbetween the bearings of the gasifier turbocompressor. This can drive the gasifier tomodest speeds for indefinite periods without harming the engine or components.Depending upon the capacity and set-point of the PowerWorks oil pump, the enginecentrifugal compressor delivers 15 to 25% of the rated flow through the system. Afterstarting (igniting) the engine the oil pump drops back to a low speed-setting as itcontinues to feed lubricant to the bearings.
Natural gas boosting system
NREC provides a special-duty natural-gas booster package built from a mature Ingersoll-Rand oil-free compressor product. It is capable of delivering between 10 and 60 icfm toabout 60 icfm (inlet cubic feet per minute). For the proposed application the boosterwould operate at roughly 25 icfm with a parasitic electrical power consumption of about2 kW.
Alternative Turbomachinery concepts evaluated
Over the course of the PowerWorks™ development, trades were evaluated in a numberof areas relevant to this project. Significant results and conclusions are discussed in thefollowing paragraphs.
Single-shaft vs. twin-shaft turbomachines
Several attempts have been made to integrate a shaft-speed alternator into the singlespool turbo-compressor. Locating the alternator between the bearings with an over-hungturbine and compressor is a common mechanical arrangement, implemented in the AES50 kWe cogeneration project by Allied Signal (1984-1990) and the Chrysler Patriot bySatCon and NREC (1994-1996). One of the attractions of this arrangement is that itaffords a clear aerodynamic path for the inlet and exit flows from a radial turbine andcentrifugal compressor. The primary challenge in this design is the cooling system

26
associated with the alternator and bearings. The high power-density of the high-speedalternator, with combined electrical and windage losses of nominally 10%, coupled withthe close proximity of the turbine section, demands large quantities of liquid cooling.Neither of the two programs cited above resolved the interrelated cooling, stress, anddynamics issues associated with this configuration.
Relocation of the high-speed alternator to the inlet of the compressor avoids many of theproblems encountered with the alternator cooling. The disadvantages are increasedbearing-system cost, and performance losses. To support the dynamic system, usuallythree rather than two high-speed bearings are required. This results in tight-tolerancemanufacturing methods typical of the aerospace industry. Avoidance of thismanufacturing operation is a primary distinction between high cost aerospaceturbocompressors and the common industrial turbocharger.
The performance compromises associated with the compressor-end shaft speedalternators stem from heating of compressor-inlet air, inlet pressure drop, and mechanicallosses. The Brayton cycle’s sensitivity to temperature ratio makes the first effectpredominant. The inlet-cooled alternator and bearings would liberate approximately 10%to 12% of the shaft power as electrical and windage losses, raising inlet temperature byan amount sufficient to decrease engine efficiency by 1 to 2 percentage points and powerby 4 to 8%, depending on operating conditions. Combined with an inlet pressure dropestimated at roughly 1%, the net effect would be to reduce power by 7% and efficiencyby 6% at nominal PSOFC design conditions.
Alternator selection: high-speed permanent magnetic vs. commercial low-speed generator
The versatile PowerWorks™ power take-off has been designed to adapt to either high-speed or 3600 rpm loads. The power-take-off shaft is in a cool region and supported byrugged conventional bearings. Either a shaft-speed permanent magnet alternator or alow-speed generator are adaptable to the PowerWorks™ engine. For high quality ACapplications, the standard 2-pole commercial generator is the preferred choice. Lowercost and proven reliability are the dominating factors in grid-compatible AC powergeneration applications.
Compared to the rare-earth magnet alternators, the PowerWorks™ system with low-speed generator is more efficient on a total system basis. Table 7 compares electricalconversion efficiencies for the candidates.
27
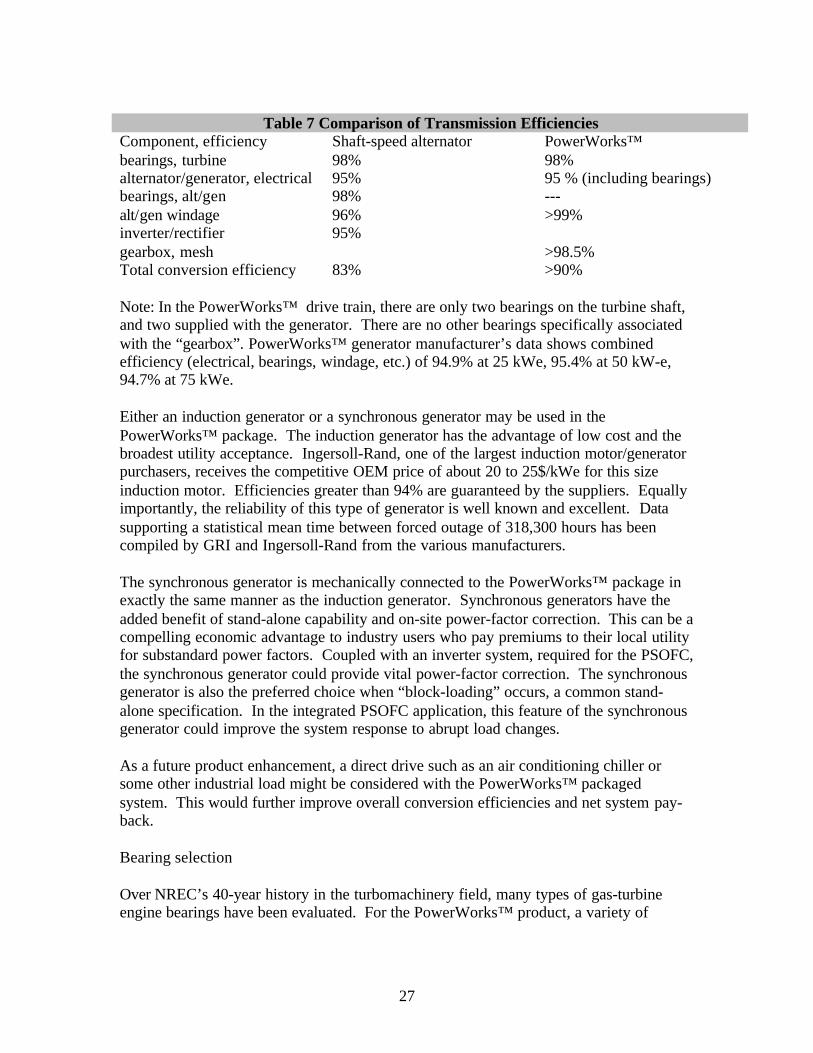
Table 7 Comparison of Transmission EfficienciesComponent, efficiency Shaft-speed alternator PowerWorks™bearings, turbine 98% 98%alternator/generator, electrical 95% 95 % (including bearings)bearings, alt/gen 98% ---alt/gen windage 96% >99%inverter/rectifier 95%gearbox, mesh >98.5%Total conversion efficiency 83% >90%
Note: In the PowerWorks™ drive train, there are only two bearings on the turbine shaft,and two supplied with the generator. There are no other bearings specifically associatedwith the “gearbox”. PowerWorks™ generator manufacturer’s data shows combinedefficiency (electrical, bearings, windage, etc.) of 94.9% at 25 kWe, 95.4% at 50 kW-e,94.7% at 75 kWe.
Either an induction generator or a synchronous generator may be used in thePowerWorks™ package. The induction generator has the advantage of low cost and thebroadest utility acceptance. Ingersoll-Rand, one of the largest induction motor/generatorpurchasers, receives the competitive OEM price of about 20 to 25$/kWe for this sizeinduction motor. Efficiencies greater than 94% are guaranteed by the suppliers. Equallyimportantly, the reliability of this type of generator is well known and excellent. Datasupporting a statistical mean time between forced outage of 318,300 hours has beencompiled by GRI and Ingersoll-Rand from the various manufacturers.
The synchronous generator is mechanically connected to the PowerWorks™ package inexactly the same manner as the induction generator. Synchronous generators have theadded benefit of stand-alone capability and on-site power-factor correction. This can be acompelling economic advantage to industry users who pay premiums to their local utilityfor substandard power factors. Coupled with an inverter system, required for the PSOFC,the synchronous generator could provide vital power-factor correction. The synchronousgenerator is also the preferred choice when “block-loading” occurs, a common stand-alone specification. In the integrated PSOFC application, this feature of the synchronousgenerator could improve the system response to abrupt load changes.
As a future product enhancement, a direct drive such as an air conditioning chiller orsome other industrial load might be considered with the PowerWorks™ packagedsystem. This would further improve overall conversion efficiencies and net system pay-back.
Bearing selection
Over NREC’s 40-year history in the turbomachinery field, many types of gas-turbineengine bearings have been evaluated. For the PowerWorks™ product, a variety of

28
bearing configurations were analyzed including rolling contact, and journals employingair, refrigerant vapor, water, and oil.
Anti-friction rolling contact bearings are the most efficient, provided the DN (diameter xspeed) rating is maintained at appropriate levels. Losses are 1/10th to 1/5th that ofjournal bearings. They have been reliably used for many years in gas turbines. With thematurity of a large well-developed statistical data base, the bearing life is accuratelypredicted. At the design conditions of the PowerWorks™ power turbine, angular contactball bearings are the best choice, providing a life in excess of 80,000 hours at the extremepower condition of 105 kW (cold day).
Air journal bearings, not yet used in the gas turbine field, are best suited for ultra-cleanenvironments within tightly-controlled temperatures. Other than some experimental gasturbines, their experience has been in cool environments on aircraft air-cycle machines.Air journal bearings also have the added limitations of higher windage losses and greaterparasitic cooling losses as compared to oil journals. Their tighter tolerance componentsmake these bearings more expensive than most other bearings.
Several types of oil journal bearings are used in the turbomachinery field. The principalattraction is the “zero wear” experienced as metal contact is isolated by a film oflubricant. Pre-lubrication from either the pump or a bladder-type accumulator minimizesstarting wear. The floating-sleeve type, selected for the PowerWorks™, uses a free-floating ring between the static and rotating bearing surfaces. This modern bearing haslower losses than conventional sleeve-type bearings and provides improved stability.These bearings have become the standard on low cost turbochargers, costing only a fewdollars to manufacture.
2.1.5 Input Data and Heat and Material Balance
We modeled our fuel cell/micro-turbine combined cycle process using the commerciallyavailable ASPEN Plus process simulation software package. The process flowsheetshown in Figure 1 along with the design criteria shown in Tables 2 and 5 were used tobuild the ASPEN simulation. ASPEN does not contain a standard unit operation for solidoxide fuel cells. MTI in collaboration with SOFCo had previously developed aproprietary model based on SOFCo FORTRAN subroutines. The proprietary model wasfully integrated into the ASPEN simulation. The physical and thermodynamic propertydata used in our study came from ASPEN’s extensive and widely-recognized propertydatabase.
Detailed heat and material balances were performed on the completed process model.For ease of reference, we have summarized the ASPEN heat and mass balance results inAppendix A. The results are organized around the major components of the system.

29
2.1.6 Modeling Approach and Methodology
The overall approach used in this study was to use accepted chemical process engineeringmethodology. The overall process was modeled by using the commercially availableASPEN Plus process simulation software package. Major components were modeledrigorously. The fuel cell stacks were modeled within ASPEN using a rigorousFORTRAN model. The gas turbine (compressor and turbine) was modeled rigorouslyusing the software package GATE/CYCLE. The results from the rigorous model werecompiled into a curve fit, and the curve fit was incorporated into the ASPEN processsimulation. The recuperator and fuel heater were also modeled separately, and the resultsincorporated into the simulation.
A simplified process flow diagram was generated for this report, as shown in Figure 2.Also included is a simplified stream summary in Table 1, and a component dutysummary in Table 4.
A performance map was constructed using the method developed in Reference 4 to aid inanalyzing the PSOFCs. Detailed stack models have been used to predict PSOFCresponse to changes in operating conditions. Integrated into a process model, the resultsyield accurate predictions of system performance. Results from a number of cases maybe assembled to construct performance maps. While these models provide detailedresolution of processes and conditions, they are complex and cumbersome for operatingpoint analysis and optimization. Since the performance of the system is highly dependenton the performance of the fuel cell stacks, a more useful approach is to definerelationships that govern stack performance. These relationships are then combined tocreate a closed form parametric model suitable for application in the construction ofperformance maps and operating point optimization and analysis. The governingperformance parameters for PSOFC stacks are fuel flow, area specific resistance, andoperating voltage. The functional form of the model and the boundaries of the operatingenvelope provide useful insight into PSOFC operating characteristics and an improvedmeans of guiding the selection of economically viable operating conditions. Theperformance map is discussed in Section 2.2.1.
Modeling of Engine Performance
Prediction of detailed engine performance has been carried out using the GateCycle codedeveloped by Enter Software (Menlo Park, CA) in conjunction with NREC performancemodels. This approach relies on turbomachinery performance maps whose broadcharacteristics are simulated using NREC software, but which have been calibrated indetail based on component test data. One exception is the power turbine whoseperformance is entirely based on a model simulation, given that this component is to beredesigned and no test data are available.
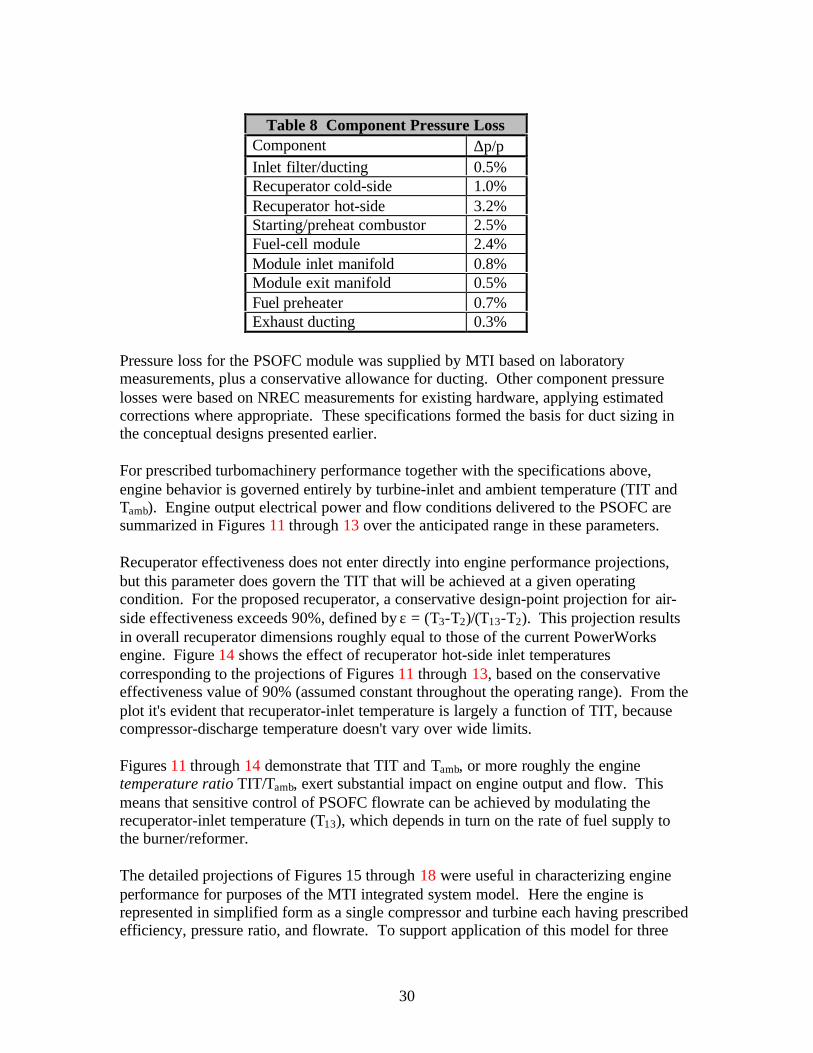
Pressure losses at nominal design conditions are shown in Table 8, with approximatecorrections applied at off-design flow conditions.
30
Table 8 Component Pressure LossComponent ∆p/pInlet filter/ducting 0.5%Recuperator cold-side 1.0%Recuperator hot-side 3.2%Starting/preheat combustor 2.5%Fuel-cell module 2.4%Module inlet manifold 0.8%Module exit manifold 0.5%Fuel preheater 0.7%Exhaust ducting 0.3%
Pressure loss for the PSOFC module was supplied by MTI based on laboratorymeasurements, plus a conservative allowance for ducting. Other component pressurelosses were based on NREC measurements for existing hardware, applying estimatedcorrections where appropriate. These specifications formed the basis for duct sizing inthe conceptual designs presented earlier.
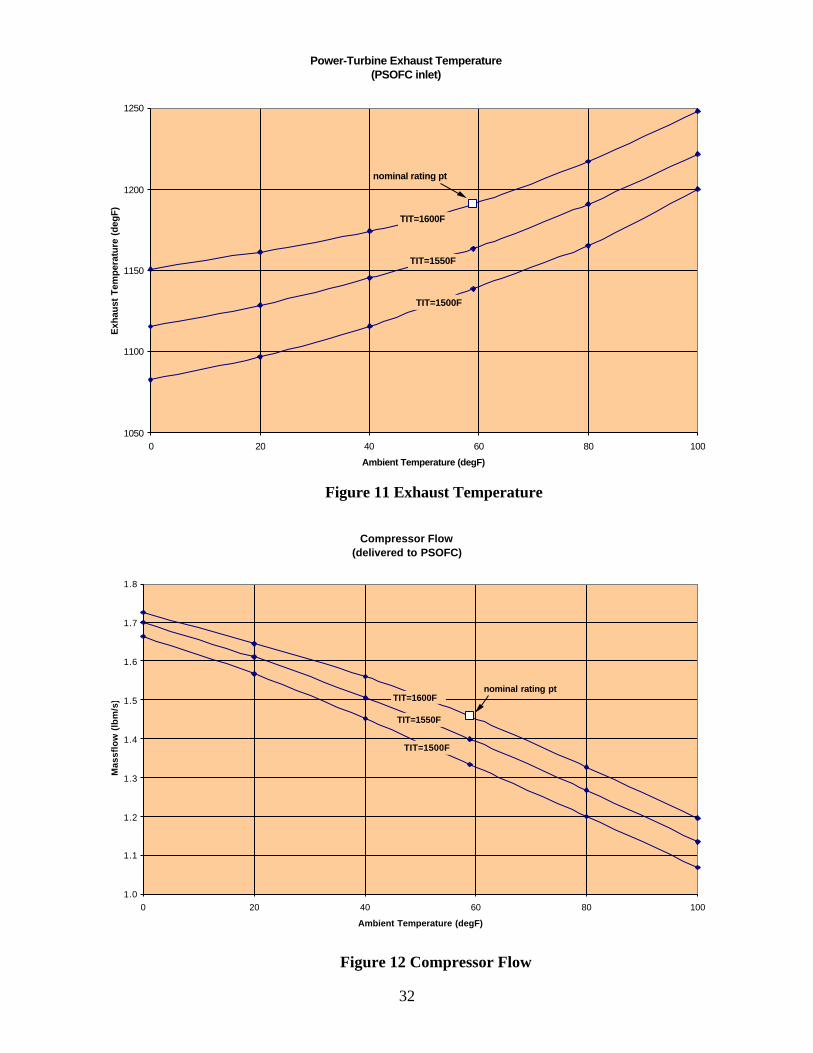
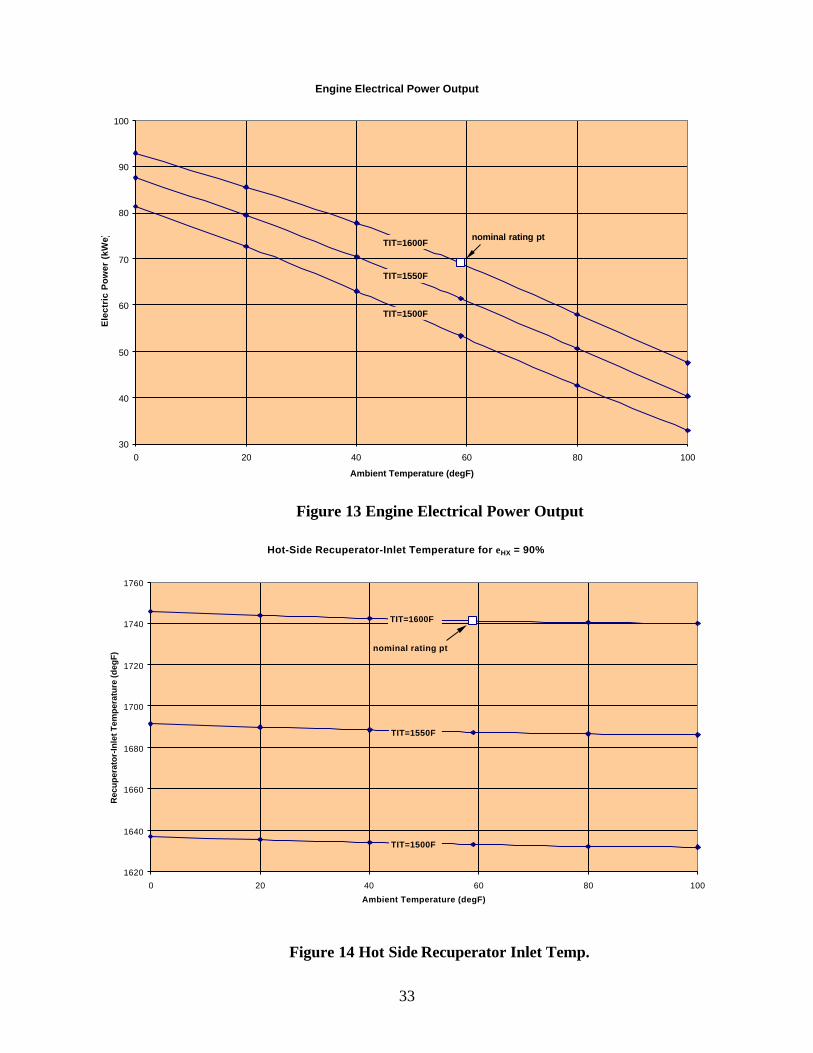
For prescribed turbomachinery performance together with the specifications above,engine behavior is governed entirely by turbine-inlet and ambient temperature (TIT andTamb). Engine output electrical power and flow conditions delivered to the PSOFC aresummarized in Figures 11 through 13 over the anticipated range in these parameters.
Recuperator effectiveness does not enter directly into engine performance projections,but this parameter does govern the TIT that will be achieved at a given operatingcondition. For the proposed recuperator, a conservative design-point projection for air-side effectiveness exceeds 90%, defined by ε = (T3-T2)/(T13-T2). This projection resultsin overall recuperator dimensions roughly equal to those of the current PowerWorksengine. Figure 14 shows the effect of recuperator hot-side inlet temperaturescorresponding to the projections of Figures 11 through 13, based on the conservativeeffectiveness value of 90% (assumed constant throughout the operating range). From theplot it's evident that recuperator-inlet temperature is largely a function of TIT, becausecompressor-discharge temperature doesn't vary over wide limits.
Figures 11 through 14 demonstrate that TIT and Tamb, or more roughly the enginetemperature ratio TIT/Tamb, exert substantial impact on engine output and flow. Thismeans that sensitive control of PSOFC flowrate can be achieved by modulating therecuperator-inlet temperature (T13), which depends in turn on the rate of fuel supply tothe burner/reformer.
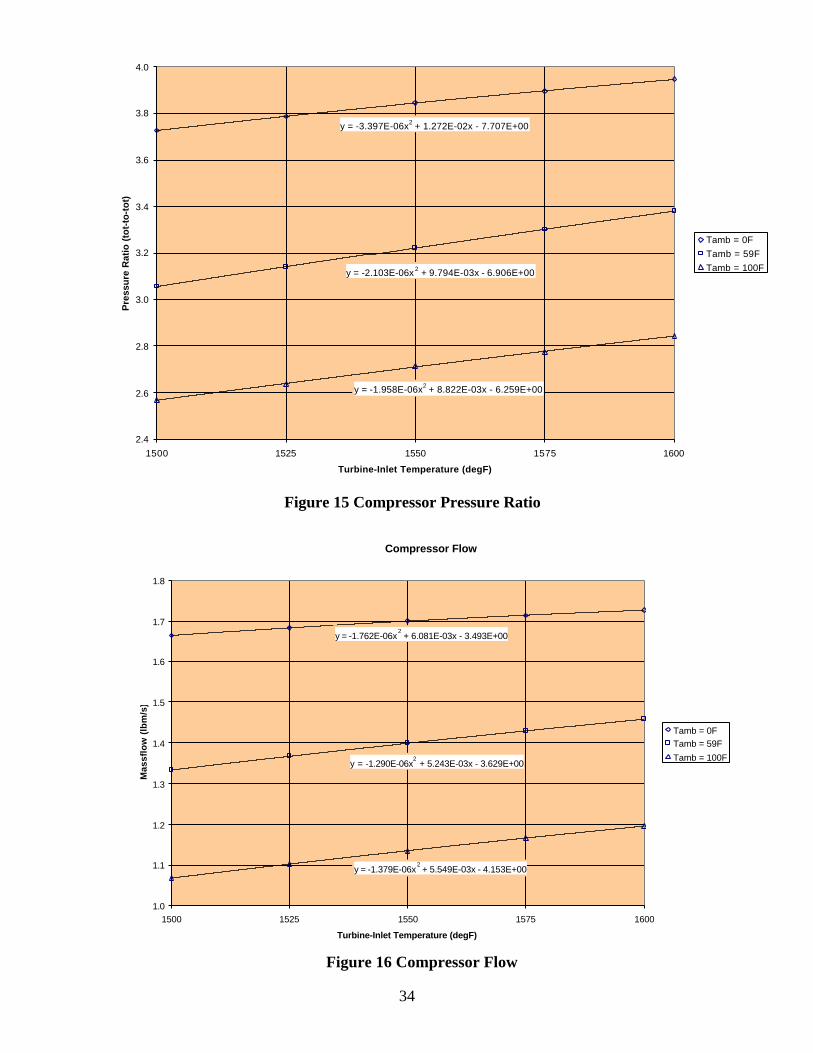
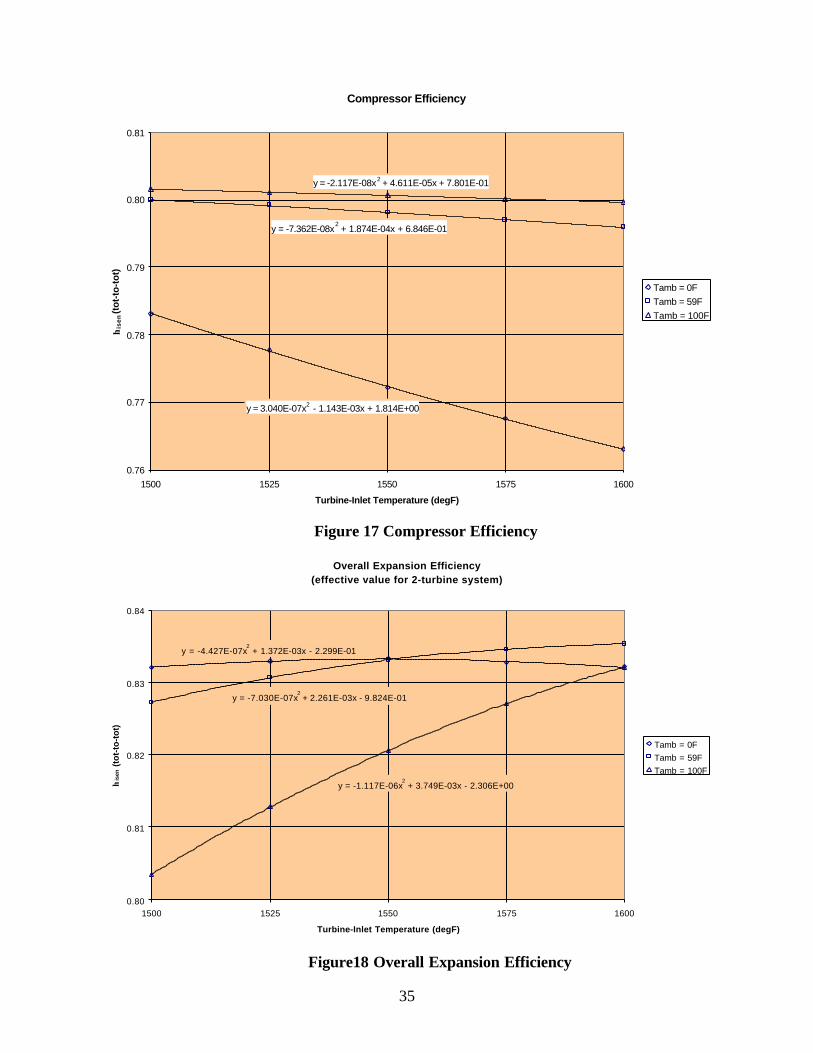
The detailed projections of Figures 15 through 18 were useful in characterizing engineperformance for purposes of the MTI integrated system model. Here the engine isrepresented in simplified form as a single compressor and turbine each having prescribedefficiency, pressure ratio, and flowrate. To support application of this model for three

31
values of Tamb spanning the projected operating range (0F, 59F, 100F), the requiredinputs were generated as functions of TIT by performing detailed off-design simulations,yielding the results of Figures 15 through 18. The curve fits shown were thenincorporated into the integrated system model.
Some minor simplifications were made in carrying out this procedure. A constantmechanical loss equal to 2% of overall turbine power, and a generator shaft-to-electricalefficiency of 94% were assumed. Although more accurate prescriptions are made in thefull GATE/CYCLE off-design model, discrepancies are very small. A further modelingdifference is that a single overall expansion efficiency was used for the two-turbinesystem, but this introduces no error with respect to the thermodynamic variablespresented to the PSOFC system.
32
Compressor Flow(delivered to PSOFC)
1.0
1.1
1.2
1.3
1.4
1.5
1.6
1.7
1.8
0 20 40 60 80 100
Ambient Temperature (degF)
Mas
sflo
w (
lbm
/s)
TIT=1500F
TIT=1550F
TIT=1600Fnominal rating pt
Power-Turbine Exhaust Temperature(PSOFC inlet)
1050
1100
1150
1200
1250
0 20 40 60 80 100
Ambient Temperature (degF)
Exh
aust
Tem
pera
ture
(de
gF)
TIT=1500F
TIT=1550F
TIT=1600F
nominal rating pt
Figure 12 Compressor Flow
Figure 11 Exhaust Temperature
33
Engine Electrical Power Output
30
40
50
60
70
80
90
100
0 20 40 60 80 100
Ambient Temperature (degF)
Ele
ctri
c P
ow
er (
kWe) nominal rating pt
TIT=1500F
TIT=1550F
TIT=1600F
Hot-Side Recuperator-Inlet Temperature for εHX = 90%
1620
1640
1660
1680
1700
1720
1740
1760
0 20 40 60 80 100
Ambient Temperature (degF)
Rec
up
erat
or-
Inle
t Tem
per
atu
re (d
egF
)
TIT=1500F
TIT=1550F
TIT=1600F
nominal rating pt
Figure 14 Hot Side Recuperator Inlet Temp.
Figure 13 Engine Electrical Power Output
34
Compressor Flow
y = -1.762E-06x2 + 6.081E-03x - 3.493E+00
y = -1.290E-06x2 + 5.243E-03x - 3.629E+00
y = -1.379E-06x2 + 5.549E-03x - 4.153E+00
1.0
1.1
1.2
1.3
1.4
1.5
1.6
1.7
1.8
1500 1525 1550 1575 1600
Turbine-Inlet Temperature (degF)
Mas
sflo
w (
lbm
/s)
Tamb = 0FTamb = 59F
Tamb = 100F
y = -3.397E-06x2 + 1.272E-02x - 7.707E+00
y = -2.103E-06x 2 + 9.794E-03x - 6.906E+00
y = -1.958E-06x2 + 8.822E-03x - 6.259E+00
2.4
2.6
2.8
3.0
3.2
3.4
3.6
3.8
4.0
1500 1525 1550 1575 1600
Turbine-Inlet Temperature (degF)
Pre
ssu
re R
atio
(to
t-to
-to
t)
Tamb = 0FTamb = 59FTamb = 100F
Figure 16 Compressor Flow
Figure 15 Compressor Pressure Ratio
35
Compressor Efficiency
y = 3.040E-07x2 - 1.143E-03x + 1.814E+00
y = -7.362E-08x2 + 1.874E-04x + 6.846E-01
y = -2.117E-08x2 + 4.611E-05x + 7.801E-01
0.76
0.77
0.78
0.79
0.80
0.81
1500 1525 1550 1575 1600
Turbine-Inlet Temperature (degF)
ηis
en (
tot-
to-t
ot)
Tamb = 0FTamb = 59FTamb = 100F
Overall Expansion Efficiency(effective value for 2-turbine system)
y = -4.427E-07x2 + 1.372E-03x - 2.299E-01
y = -7.030E-07x2 + 2.261E-03x - 9.824E-01
y = -1.117E-06x2 + 3.749E-03x - 2.306E+00
0.80
0.81
0.82
0.83
0.84
1500 1525 1550 1575 1600
Turbine-Inlet Temperature (degF)
ηis
en (t
ot-
to-t
ot)
Tamb = 0FTamb = 59FTamb = 100F
Figure18 Overall Expansion Efficiency
Figure 17 Compressor Efficiency

36
2.2 Process/Equipment Uncertainties and Development Requirements
Having chosen the design flow conditions for the PSOFC power plant that correspondwith the capacity of the PowerWorks™ 70kW engine, most production enginecomponents can be used directly. In particular, no changes are anticipated for thecompressor or high-pressure turbine and associated ducting. Starting, lubrication, andfuel-delivery systems will also remain unchanged. Redesign of the combustor and waste-heat recovery system (now fuel preheater) will be relatively minor, with the overalldimensions and packaging for these components unaffected (see below).
The power turbine is the single exception to the application of production hardware.Although the turbine rotor can be used without modification, the stationary housing willrequire rework in order to accommodate the increased pressure loss introduced by thePSOFC system. The impact of this pressure loss would be reduced pressure-ratio acrossthe gasifier turbine, limiting engine power and flow especially on hot days. The changeto the power turbine housing will increase the power-turbine flow capacity.
Redesign of the combustor is dictated by the need to minimize pressure loss at designconditions, where the combustor is switched off and represents a parasitic loss.Combustor inlet temperature is approximately 1200F at nominal PowerWorks™ designconditions, but for the proposed application this value increases to 1600F. Relativelystraightforward design changes should make it possible to hold pressure loss within the2.5% design specification, which is required for stable combustor performance duringstarting and preheat. Cold-flow testing of the redesigned combustor is planned in orderto meet these objectives.
Adaptation of the current PowerWorks™ heat-recovery system to meet fuel preheatingdemands is largely a matter of substituting a redesigned heat-exchanger core for thecurrent commercial finned-tube unit. The present device supplies hot water at a constanttemperature, as achieved by pivoting the core out of the flow path under thermostaticcontrol. For the proposed application this pivoting feature is probably unnecessary,because the fuel demand does not vary widely and precise control of the deliverytemperature is less critical.
2.2.1 Fuel Cell Issues
The power and efficiency realized by operation of Solid Oxide Fuel Cell (PSOFC)systems are determined not only by the stack characteristics, but also by the operatingconditions. The choice of operating conditions enable a wide range of delivered powerand efficiency from a particular PSOFC device. Operating parameters may be selected tomaximize power while constraining efficiency, maximize efficiency while constrainingpower, or optimization of a function of both variables such as cost of electricity. Whiledetailed stack models may be used to predict PSOFC response at a specific operatingpoint, these complex models are unnecessarily cumbersome for operating point analysisand optimization. Relationships between fuel flow, area specific resistance, andoperating voltage were defined to develop a closed form parametric model. This model
37
was applied to construct a performance map for operating point analysis and economicoptimization. The functional form of the model and the boundaries of the operatingenvelope provide useful insight into PSOFC operating characteristics and a simple meansof selecting operating conditions.
The choice of stack temperature, fuel flow, and operating voltage enable a wide range ofdelivered power and efficiency from a particular PSOFC device. Thus, the challenge offormulating a relationship between PSOFC power and efficiency in terms of controllableoperating parameters is undertaken. It has been shown that the stack efficiency can beexpressed simply in terms of operating voltage, fuel utilization, and thermoneutralvoltage (Reference 1).
tnE
UopVstack =η (1)
=stackη fuel cell stack efficiency
=opV operating voltage
=U fuel utilization
=tnE thermoneutral voltage
Of these three factors, operating voltage is the only independent variable.
Thermoneutral voltage is a property of the fuel defined as the heating value ofthe fuel divided by the number of Faradays of charge resulting from completeelectrochemical oxidation of the fuel.
nFH
thE∆
= (2)
where:∆H = molar heating value of the fuel (LHV) for methane 890.347 kJ/g - mole n = number of electrons transferred per molecule of fuel to completely oxidize the fuel, 8 for methane F = Faraday's number, 96,487 Coulombs per g - mole
Utilization, defined as the ratio of delivered current to stoichiometric current, is anoutcome which is dependent on stack resistance, operating voltage and fuel flow rate.
nFnI
U&
= (3)
where:I = delivered currentn& = fuel flow raten = number of electrons transferred per molecule of fuel to completely oxidize the fuel,
38
8 for methaneF = Faraday's number, 96,487 Coulombs per g - mole
For a given stack resistance and fuel composition, the only independent variablesavailable to effect changes in power and efficiency are operating voltage and fuel flowrate. Stack resistance is of course a function of operating temperature. However,operating temperature is not considered as an independent variable here as it is assumedthat to minimize resistance, the stack is operated at the highest temperature consistentwith stack life and system balance of plant constraints.
It would appear from equation [1] that a high operating voltage is required for highefficiency. At a fixed fuel flow rate however, utilization declines with increasingoperating voltage. Power also decreases as operating voltage is raised from themaximum power voltage which in common experience is slightly less than half the opencircuit voltage (OCV). The greatest efficiency at any given fuel flow is obtained at theoperating voltage which results in the highest power output.
Detailed system models were used in this program to predict overall system performancefor a range of parameters. While these models provide detailed resolution of processesand conditions in the stack or balance of plant, they are unnecessarily complex andcumbersome for operating point analysis and optimization. A more useful approach is todefine relationships between fuel flow, area specific resistance, and operating voltage.These relationships can then be combined to create a closed form parametric modelsuitable for application in the construction of performance maps and operating pointoptimization and analysis. The functional form of the model and the boundaries of theoperating envelope, provide useful insight into PSOFC operating characteristics and animproved means of selecting operating conditions. Since the PSOFC is the highestefficiency and highest cost components the results of the PSOFC performance maptranslate to performance for the entire system.
A useful metric is derived by casting fuel flow rate as an electrochemical term whichrepresents the average current density required for 100% fuel utilization.
AnFn
fj&
= (4)
=fj average current required for 100% fuel utilization divided by cell area
A = cell area
The driving voltage, or difference between the reversible potential and operating voltage(Etn - Vop ), required to sustain the full utilization current density can then be calculatedusing the stack area specific resistance (ASR, or R" ).
"RfjfV =∆ (5)
39
fV∆ = driving voltage
fj = average current required for 100% fuel utilization divided by cell area
"R = Area Specific Resistance or ASR, (Ω - cm2)
Combining equation 4 with equation 5 gives
AnFRn
fV"&
=∆ (6)
fV∆ = driving voltage
n& = fuel flow raten = number of electrons transferred per molecule of fuel to completely oxidize the fuel, 8 for methaneF = Faraday's number, 96,487 Coulombs per g - moleR" = Area Specific Resistance or ASR, (Ω - cm2)A = cell area (cm2)
Assuming that ASR is constant for a particular stack or set of stacks, and that n is aconstant for a particular fuel, then the driving voltage is dependant on fuel flow rate andthe number of cells (or cell area). Further details of the operating point model may befound in Reference 4.
The performance map will show that optimizing for maximum efficiency will lead to alarge stack size and thus a large capital investment. In practice, objectives may dictateselection of an operating point designed to maximize power while constrainingefficiency, maximize efficiency while constraining power, or optimize a function of bothpower and efficiency such as cost of electricity (COE). The relative priorities ofefficiency, power, and COE establish the appropriate objectives and constraints.
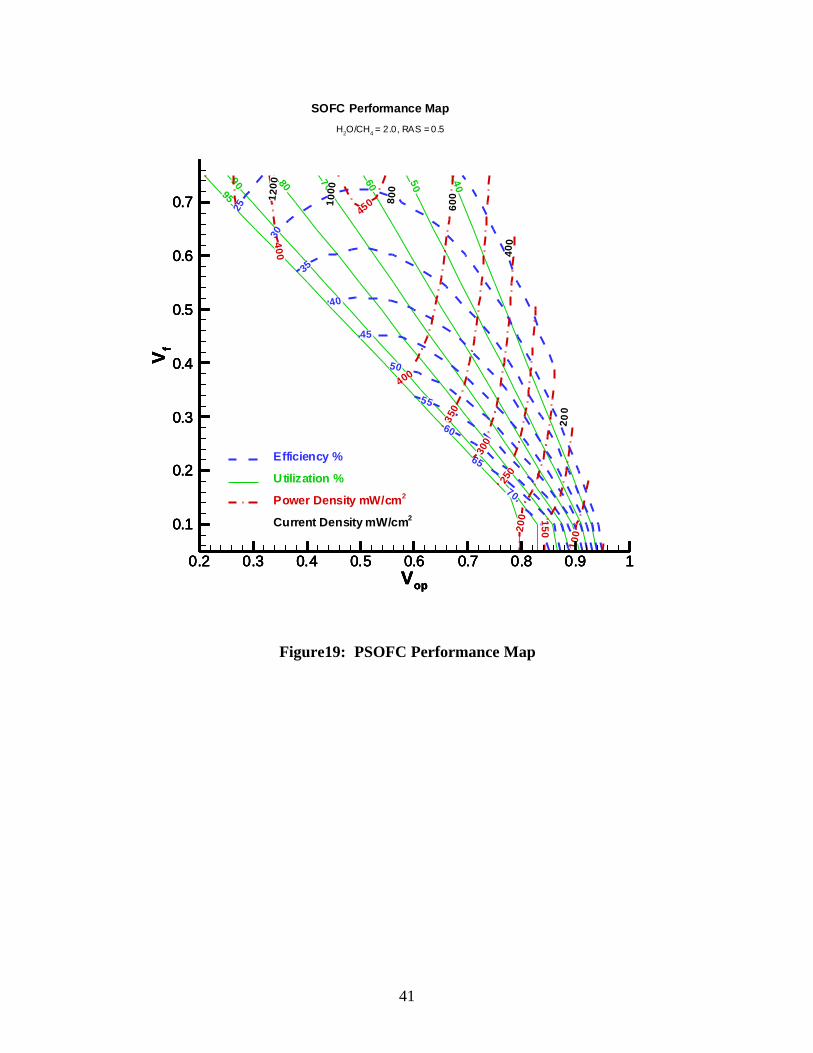
A map of PSOFC performance in ( Vop , ∆Vf) space was created using the approachdeveloped in Reference 4. These results are for a plug flow PSOFC configuration (e.g.,cross flow or counter flow) under isothermal conditions at 800 °C. Inlet fuelcomposition was methane with 2.0 steam to carbon ratio. The RAS was specified at 0.5Σ-cm2. The utilization parameter was varied from 0.3 to 0.98, while the ∆Vf parameter(representative of fuel flow and cell area) varied from 0.095 to 0.7 volts. The map ofefficiency, power density, current density and utilization in the Vop , ∆Vf plane is shownin Figure. The domain is bounded to the right (high operating voltage) by utilizationfalling below 30% and to the left (low operating voltage) by utilization exceeding 98%.
Several interesting observations can be made by a thorough examination of this mapping.There are two operating regimes demarked by the kink in the high utilization boundary.At values of ∆Vf less than about 0.2 volts, power is fuel flow limited, while above 0.2

40
volts ∆Vf, power is resistance limited. The location of the transition is a function of ASR.Power drops by about half from the point of maximum power to the point of maximumefficiency. Efficiency drops by a similar ratio between the high efficiency and high powerpoints. At a constant fuel flow (lines of constant ∆Vf), the operating voltage formaximum efficiency and maximum power coincide. Along a line of constant efficiency,maximum power is achieved at the greatest fuel flow (∆Vf ) possible.
For the PSOFC/Micro-Turbine combined cycle with a net system efficiency of greaterthan 70%, the operating point for the fuel cell is at an efficiency of 68%. As is shown inFigure, this shifts the operating point to the extreme lower right corner of theperformance map. The lower right corner of the performance map corresponds to a highVop and a low ∆Vf . Operating at high Vop results in low power density for a given stack.For a given fuel flow and stack ASR, operating at low ∆Vf, requires a large stack area, asis shown by inspection of Equation 6. A large stack area requires many fuel cells andfuel cell stacks. Until PSOFCs become the low cost component in the PSOFC/Micro-Turbine cycle, optimizing the system economically will result in a system that has lessfuel cell area than the system that is optimized on efficiency. The 18 MW systemdescribed above, would require over 18,000 square meters of cell area. Clearly for aneconomically viable market introduction, the cell area must be reduced.
A judiciously selected operating point is essential to extracting the most value from aPSOFC installation. The closed form parametric model presented in Reference 4 wasused to create a performance map to aid the process of understanding economicaloperating point selection. The form of the model and the boundaries of the performancemaps also provide insight valuable in the selection process. A commonly stated goal ofhigh operating voltage (e.g., 0.7-0.8V) is not expected to be the highest efficiency pointexcept at relatively low fuel flows and high cell area. It can be shown, by inspection ofFigure 15, that curves of efficiency are highest in the lower right corner, and curves ofpower density are highest in the upper left corner. Therefore, commonly quoted goals forhigh efficiencies and high power densities are not likely to be achieved simultaneously.
41
Figure19: PSOFC Performance Map
0.2 0.3 0.4 0.5 0.6 0.7 0.8 0.9 1Vop
0.1
0.2
0.3
0.4
0.5
0.6
0.7
Vf
90 80 70 60 50 40
95
Utilization %
Efficiency %
Current Density mW/cm2
Power Density mW/cm2
0.2 0.3 0.4 0.5 0.6 0.7 0.8 0.9 1Vop
0.1
0.2
0.3
0.4
0.5
0.6
0.7
Vf
25
3035
40
45
50
55
60
65
70
0.2 0.3 0.4 0.5 0.6 0.7 0.8 0.9 1Vop
0.1
0.2
0.3
0.4
0.5
0.6
0.7
Vf
400
450
400
350
300
250
200 150
1 00
0.2 0.3 0.4 0.5 0.6 0.7 0.8 0.9 1Vop
0.1
0.2
0.3
0.4
0.5
0.6
0.7
Vf
2 00
400
6008 0
0
1 00 0
1 20 0
H2O/CH4 = 2.0, RAS = 0.5
SOFC Performance Map
42
2.3 System Capital Costs – Nth of a Kind Projections
Based upon a 727kW sized system described in Section 2, two primary subsystemswere analyzed with regard to both existing and nth of a kind cost estimates. Using 50units as the nth of a kind volume for both the microturbine subsystem and for the fuel cellrelated subsystem, estimates include capital costs, variable operating costs andreplacement costs.
Using MTI’s proprietary “Upgrades and Enhancements Financial EvaluationProgram” software and incorporating a industry recognized standards for Cost ofElectricity (COE) calculation, a wide variety of plant equipment, operations, and variablecost simulations were conducted to evaluate different scenarios for system configuration.Using the system described within Section 2, component costs were compiled and nth ofa kind costs were estimated based upon; volume manufacturing cost reductions,technology innovations leading to lower material, process and manufacturing costs, andperformance enhancement to component and system operations leading to lower costcomponents.
Initial installation nth of a kind capital costs (including a 10% installation charge)were $454,850 for the 727kW system leading to a $625/kW capital cost. Nth of a kindmicroturbine subsystem costs were $85,000 and fuel cell subsystem costs accounted forthe remaining $328,500 (excluding the 10% installation charges in both cases).
In addition to the initial capital costs, a conservative approach to one-time fixedcosts (assuming non-depreciable capital costs) was utilized to replace both subsystems (intheir entirety) at the end of each subsystems assumed lifetime (multiple times over the 25year plant life). Using an 80,000 hour lifetime for the microturbine subsystem and a40,000 hour assumed lifetime for the fuel cell subsystem, the following fixed cost capitalreplacement schedule represents overall capital costs over the 25 year plant life.
Table 9 PSOFC/Microturbine Capital CostsITEM YEAR COST
Initial Capital Cost (Fuel Cell/ Microturbine)Subsystems with 10% Installation Factor
1998 $454,850
Fuel Cell System Replacement 2003 $361,350Fuel Cell System Replacement & MicroturbineSystem Replacement
2008 $454,850
Fuel Cell System Replacement 2013 $361,350Fuel Cell System Replacement & MicroturbineSystem Replacement
2018 $682,275*
*Includes pro-rated capital costs for subsystems whose lifetimes do not exactly fit into the 25 year plant life period assumed in the case.
43
2.4 ANNUAL OPERATING COSTS
A number of different assumptions were employed to estimate nth of a kindoperating costs for the system. These include:
• 70% efficiency for the system,• Capacity Factor: 50/52 Week Operating @ 92% Capacity = 88.4% overall
capacity (with 56.33MWh/Year electric generation),• Cost of Capital at 15%,• Cost Basis of mid-1998 U.S. Dollars,• COE Evaluation Method using Constant Dollars,• Cost of Natural Gas at $3.00 MM Btu (HHV),• 1/3 man year of operator labor (at a total cost of $93,951/year),• $36,000/year maintenance,• Water usage costs of $1.54/day.
Using the MTI’s “Upgrades and Enhancements Financial Evaluation Program”software to determine COE, a total COE (including Levelized Capital, Variable Cost andFixed Cost is 5824 mills/kWh or 5.824 ¢/kWh.
2.5 OPPORTUNITIES FOR IMPROVEMENT AND SUGGESTED WORK
The key to successful development of this technology is reduced component costsand higher fuel cell power output. Reducing the component cost and increasing cellpower output is the objective of the SOFCo fuel cell development program. Other keyissues to be resolved involve the integration of the major components and their controlsinto a functional package. We believe the best way to demonstrate the technology whileminimizing costs and reducing uncertainty is to develop a proof of conceptdemonstration.
2.5.1 Proof of Concept Demonstration – 180 kW System
A proof of concept that includes all components of the full-scale system can bedemonstrated at 180 kW. The demonstration would include a full-scale engine. Therecuperator would be slightly smaller than full scale as the recuperator hot side inlettemperature is higher. The fuel heater would also be slightly smaller than full scale as thefuel side flows are lower. Both the recuperator and fuel heater would require a moderateincrease in surface area to achieve full scale. The major departure from full scale is thatonly one fuel cell module would be included. The module can be demonstrated at fullscale size, or if full scale stacks are not available for demonstration, the stacks could alsobe simulated. At the successful conclusion of the proof of concept demonstration, all thatwould be needed to field a full-scale system would be the inclusion of additional fuel cellmodules and ducting.
The process description of the 180 kW proof of concept demonstration, shown inFigure 23, is similar to the full-scale system described in section 2.1.1. The air is

44
compressed in the compressor at a 3:1 pressure ratio. The air is then heated to 1600oF ina high temperature recuperator by utilizing exhaust gas from the CpnTM module. The hot,high-pressure air is then expanded through the turbine providing power for thecompressor and electrical generation. The turbine produces 69.1 kWe of net electricalpower or 39% of the total. The air is then sent to the fuel cell.
Natural gas is mixed with steam that was generated in the steam generator coil,the mixture is then heated further in the fuel heater. The heated fuel/steam mixture isthen sent to the steam reformer. In the steam reformer, the fuel-steam mixture passesover steam reforming catalyst and is processed into hydrogen rich reformate and sent tothe fuel cell.
The hydrogen and carbon monoxide in the reformate is electrochemicallyoxidized in the fuel cell producing electrical power. The fuel cell produces 109 kW ofelectrical power or 61.2% of the total. The unreacted fuel is burned with the fuel cellcooling air in the fuel cell module enclosure, further boosting the exhaust temperatureand providing heat to drive the steam reforming reactions in the steam reformer. The hotgas leaving the CpnTM is then sent to the high temperature recuperator where it heats thecompressed air, and then is sent to the fuel heater where it heats the fuel and steammixture. The fuel heater exhaust is used to generate steam to that is mixed with thenatural gas. The exhaust exits the process at 259oC. The exhaust could be used togenerate low-pressure process steam or space heating in a cogeneration heat exchanger.
The state parameters for the streams shown in 180 kW process schematic arelisted in Table10. The 180 kW system design parameters are listed in Table11, and thecomponent duties are summarized in Table 13. The performance for the 180 kW systemis listed in Table 12.
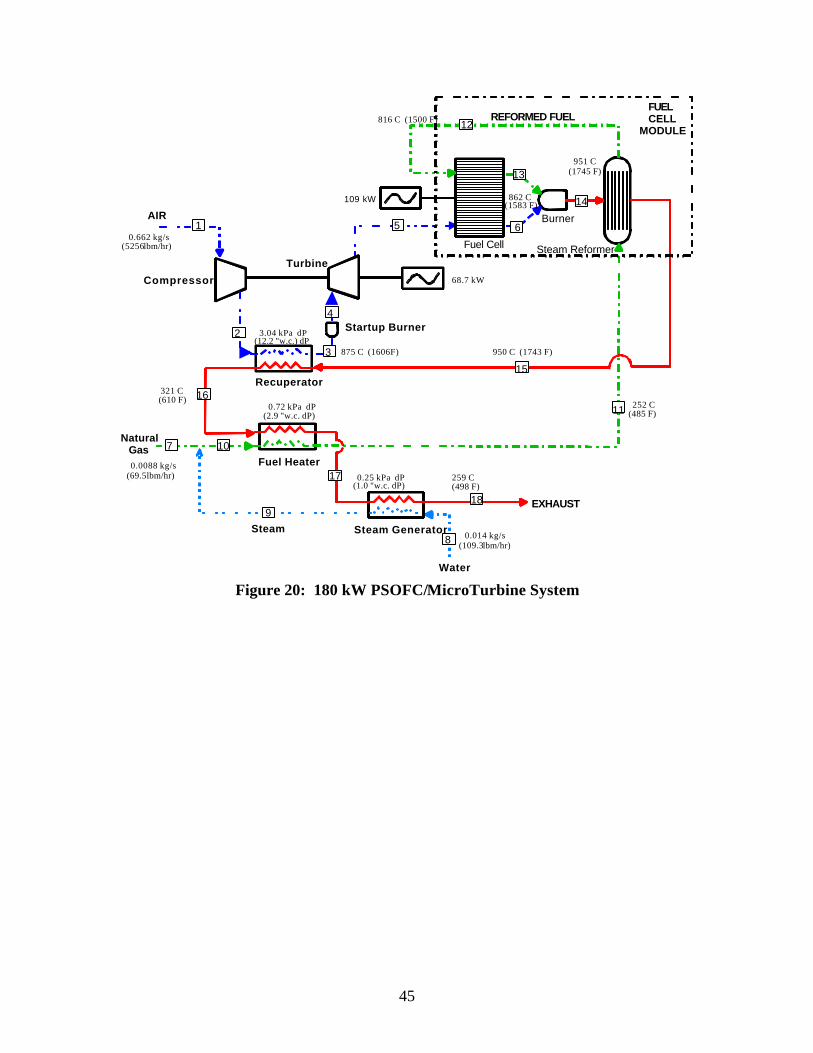
45
Water
NaturalGas
AIR
REFORMED FUEL
EXHAUST
Fuel Cell
Burner
Steam Reformer
Compressor
Turbine
Fuel Heater
Recuperator
(1583 F)
(69.5 lbm/hr)
1
2
3
4
6
7 10
11
12
13
15
16
109 kW
68.7 kW
(5256 lbm/hr)0.662 kg/s
(12.2 "w.c.) dP3.04 kPa dP
875 C (1606F)
862 C
816 C (1500 F)
(1745 F)951 C
950 C (1743 F)
(610 F)321 C
18
8 (109.3 lbm/hr)0.014 kg/sSteam Generator
9Steam
0.0088 kg/s
(2.9 "w.c. dP)0.72 kPa dP
(485 F)252 C
17(498 F)259 C
(1.0 "w.c. dP)0.25 kPa dP
5
Startup Burner
FUELCELL
MODULE
14
Figure 20: 180 kW PSOFC/MicroTurbine System
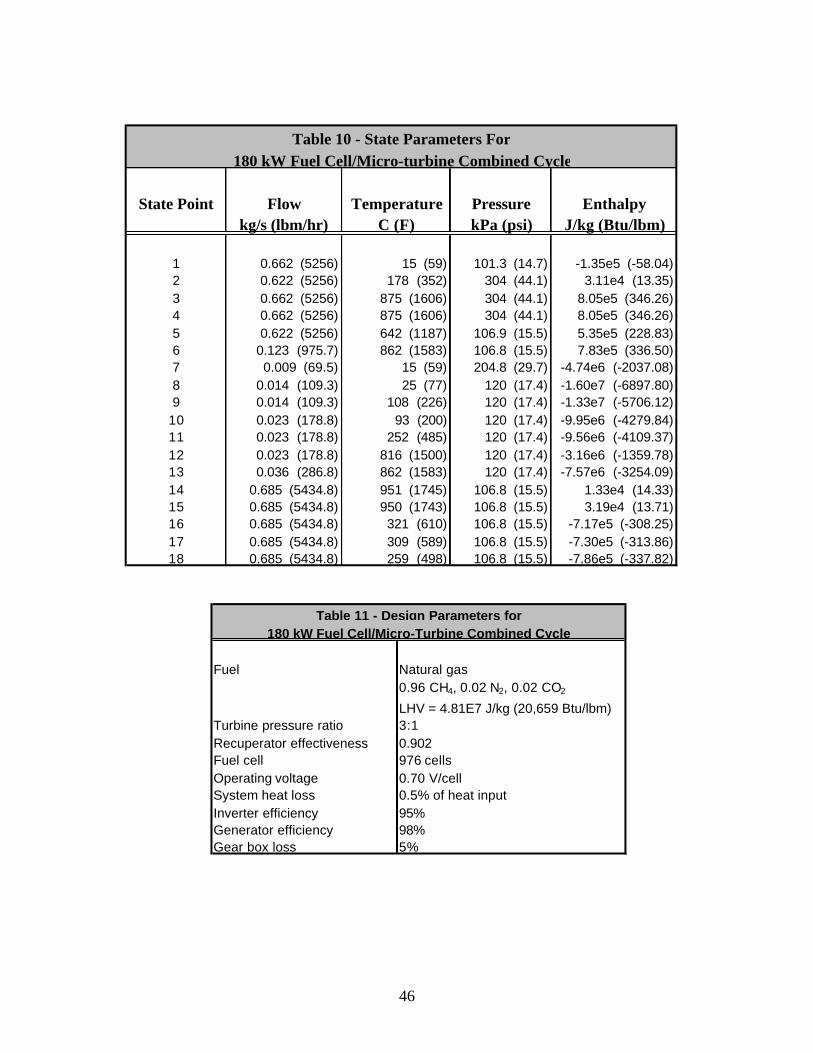
46
State Point Flow Temperature Pressure Enthalpykg/s (lbm/hr) C (F) kPa (psi) J/kg (Btu/lbm)
1 0.662 (5256) 15 (59) 101.3 (14.7) -1.35e5 (-58.04)2 0.622 (5256) 178 (352) 304 (44.1) 3.11e4 (13.35)3 0.662 (5256) 875 (1606) 304 (44.1) 8.05e5 (346.26)4 0.662 (5256) 875 (1606) 304 (44.1) 8.05e5 (346.26)5 0.622 (5256) 642 (1187) 106.9 (15.5) 5.35e5 (228.83)6 0.123 (975.7) 862 (1583) 106.8 (15.5) 7.83e5 (336.50)7 0.009 (69.5) 15 (59) 204.8 (29.7) -4.74e6 (-2037.08)8 0.014 (109.3) 25 (77) 120 (17.4) -1.60e7 (-6897.80)9 0.014 (109.3) 108 (226) 120 (17.4) -1.33e7 (-5706.12)
10 0.023 (178.8) 93 (200) 120 (17.4) -9.95e6 (-4279.84)11 0.023 (178.8) 252 (485) 120 (17.4) -9.56e6 (-4109.37)12 0.023 (178.8) 816 (1500) 120 (17.4) -3.16e6 (-1359.78)13 0.036 (286.8) 862 (1583) 120 (17.4) -7.57e6 (-3254.09)14 0.685 (5434.8) 951 (1745) 106.8 (15.5) 1.33e4 (14.33)15 0.685 (5434.8) 950 (1743) 106.8 (15.5) 3.19e4 (13.71)16 0.685 (5434.8) 321 (610) 106.8 (15.5) -7.17e5 (-308.25)17 0.685 (5434.8) 309 (589) 106.8 (15.5) -7.30e5 (-313.86)18 0.685 (5434.8) 259 (498) 106.8 (15.5) -7.86e5 (-337.82)
Table 10 - State Parameters For180 kW Fuel Cell/Micro-turbine Combined Cycle
Fuel Natural gas0.96 CH4, 0.02 N2, 0.02 CO2
LHV = 4.81E7 J/kg (20,659 Btu/lbm)Turbine pressure ratio 3:1Recuperator effectiveness 0.902Fuel cell 976 cellsOperating voltage 0.70 V/cellSystem heat loss 0.5% of heat inputInverter efficiency 95%Generator efficiency 98%Gear box loss 5%
Table 11 - Design Parameters for180 kW Fuel Cell/Micro-Turbine Combined Cycle
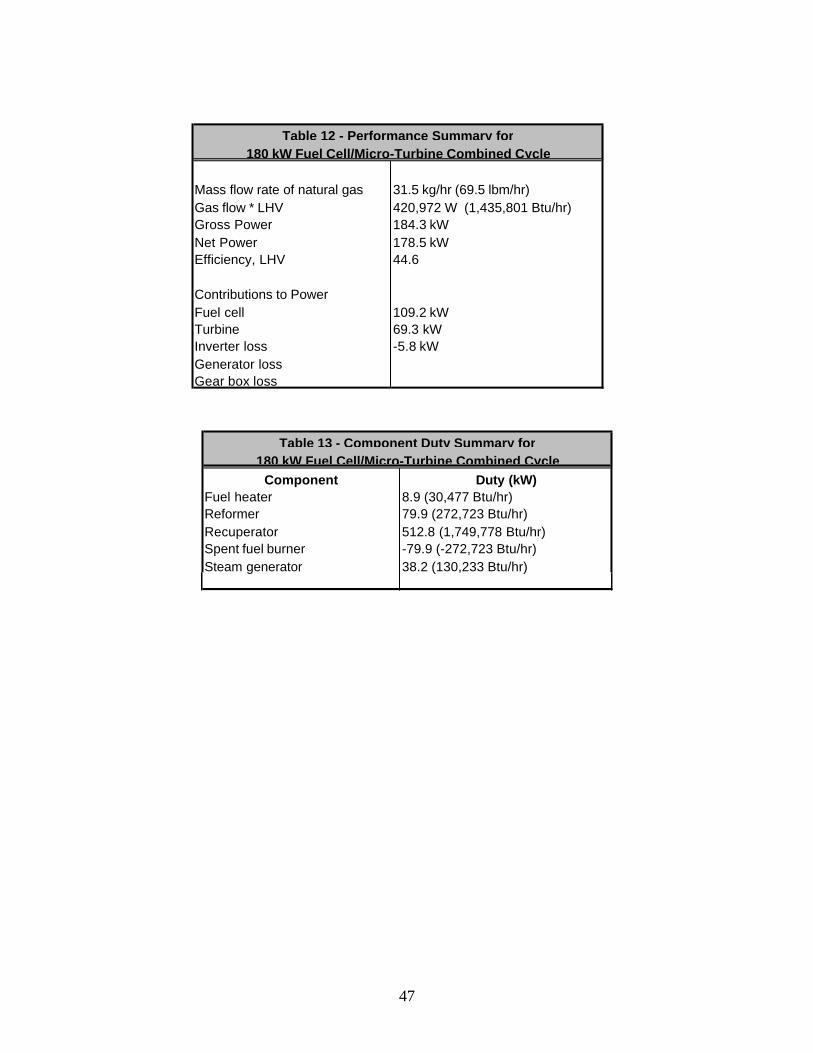
47
Mass flow rate of natural gas 31.5 kg/hr (69.5 lbm/hr)Gas flow * LHV 420,972 W (1,435,801 Btu/hr)Gross Power 184.3 kWNet Power 178.5 kWEfficiency, LHV 44.6
Contributions to PowerFuel cell 109.2 kWTurbine 69.3 kWInverter loss -5.8 kWGenerator lossGear box loss
Table 12 - Performance Summary for180 kW Fuel Cell/Micro-Turbine Combined Cycle
Component Duty (kW)Fuel heater 8.9 (30,477 Btu/hr)Reformer 79.9 (272,723 Btu/hr)Recuperator 512.8 (1,749,778 Btu/hr)Spent fuel burner -79.9 (-272,723 Btu/hr)Steam generator 38.2 (130,233 Btu/hr)
Table 13 - Component Duty Summary for180 kW Fuel Cell/Micro-Turbine Combined Cycle

48
3 CONCLUSION
This study has demonstrated that the unique approach taken to combining a fuel celland gas turbine has both technical and economic merit. By using a micro-turbine, and anon-pressurized fuel cell the total system size has been reduced substantially from thosepresented in other studies, while maintaining over 70% efficiency. The reduced systemsize can be particularly attractive in the deregulated electrical generation/distributionenvironment where the market may not demand multi-megawatt central stations systems.The small size also opens up the niche markets to this high efficiency, low emissionelectrical generation option.
While the study has discovered no technical obstacles to success, a sub-scaletechnology demonstration would reduce the risk of performance and enable a full-scalecommercial offering. Demonstrating a full size micro-turbine, with a single fuel cellmodule would prove the concept as well as the major components and BOP that would beneeded in a full-scale system.
The major hurdle to the commercialization of the technology is economics. Thecosts of major components must be reduced from the present levels. For somecomponents, such as the micro-turbine, volume production may be enough to reducecosts. For the fuel cells, low cost manufacturing, as well as volume production are needto achieve cost projections.

49
4 REFERENCES
1. J. Hartvigsen, S. Elangovan and A. Khandkar, in Solid Oxide Fuel Cells, S. C.Singhal and H. Iwahara, Editors, PV 93-4, p. 878, The ElectrochemicalSociety Proceedings Series, Pennington, NJ (1993).
2. J. Hartvigsen, S. Elangovan and A. Khandkar, in Science and Technology ofZirconia V, S. P. S. Badwal, M. J. Bannister, R. H. J. Hannink, Editors, p. 682,Technomic Publishing Company Inc., Lancaster, PA (1993).
3. R. Herbin, J. M. Fiard and J. R. Ferguson, in First European Solid Oxide FuelCell Forum Proceedings, U. Bossel Editor, p317, Lucerne, Switzerland(1994).
4. J. Hartvigsen, S. Elangovan and A. Khandkar, in Third European Solid OxideFuel Cell Forum Proceedings, P. Stevens Editor, p517, Nantes, France (1998).

50
5 APPENDICES
A. ECONOMIC ANALYSIS
Babcock & Wilcox Upgrades and Enhancements Financial Evaluation Programa McDermott company
1. PROJECT INFORMATION SUMMARY
Project Title DOE PSOFC/MIDROTURBINE COMBINED CYCLE (727 kW)
Case No.
Customer Data:
Company:
Plant Name:
Unit No(s).:
Contact Name:
Contact Phone:
Contact Fax:
Contact Electronic Mail Address:
Contact Mailing Address and Other Information:
Description The analysis is for a 727 kW PSOFC/Microturbine combined Cycle Power Plant that utilizes approximately 650kW of PSOFCs and 70 kW of Microturbine generation to achieve a 70% efficiency rating. Plant operations assume a 50/52 week operation ( with a planned 2 week service outage and a 92% capacity factor. Capacity factor input into the B&W analysis model utilizes a compound capacity factor rate (50/52*92) to achieve an overall capacity rate of 88.46% A 25 year total plant live includes stack replacement every 5 years and microturbine replacemnt every 8.33 years. Ancillary equipment replacemnet is included in O&M costs.
Prepared by Date
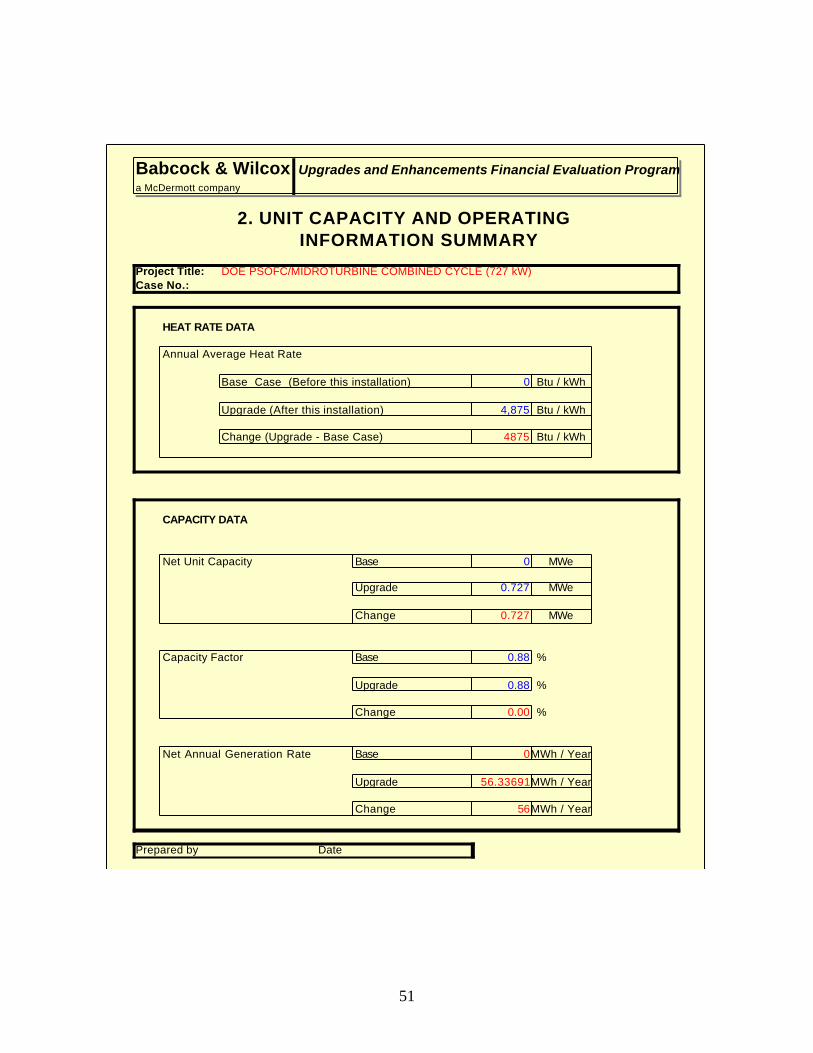
51
Babcock & Wilcox Upgrades and Enhancements Financial Evaluation Programa McDermott company
2. UNIT CAPACITY AND OPERATING INFORMATION SUMMARY
Project Title: DOE PSOFC/MIDROTURBINE COMBINED CYCLE (727 kW)Case No.:
HEAT RATE DATA
Annual Average Heat Rate
Base Case (Before this installation) 0 Btu / kWh
Upgrade (After this installation) 4,875 Btu / kWh
Change (Upgrade - Base Case) 4875 Btu / kWh
CAPACITY DATA
Net Unit Capacity Base 0 MWe
Upgrade 0.727 MWe
Change 0.727 MWe
Capacity Factor Base 0.88 %
Upgrade 0.88 %
Change 0.00 %
Net Annual Generation Rate Base 0MWh / Year
Upgrade 56.33691MWh / Year
Change 56MWh / Year
Prepared by Date
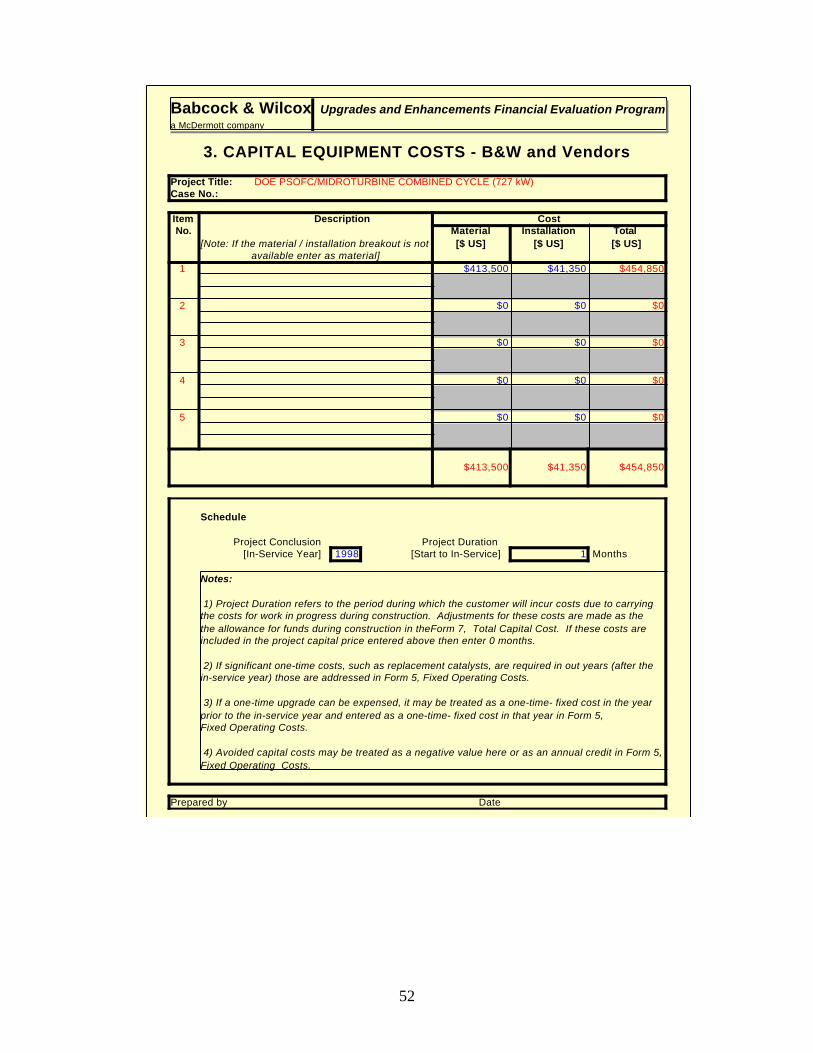
52
Babcock & Wilcox Upgrades and Enhancements Financial Evaluation Programa McDermott company
3. CAPITAL EQUIPMENT COSTS - B&W and Vendors
Project Title: DOE PSOFC/MIDROTURBINE COMBINED CYCLE (727 kW)Case No.:
Item Description CostNo. Material Installation Total
[Note: If the material / installation breakout is not [$ US] [$ US] [$ US]available enter as material]
1 $413,500 $41,350 $454,850
2 $0 $0 $0
3 $0 $0 $0
4 $0 $0 $0
5 $0 $0 $0
$413,500 $41,350 $454,850
Schedule
Project Conclusion Project Duration [In-Service Year] 1998 [Start to In-Service] 1 Months
Notes:
1) Project Duration refers to the period during which the customer will incur costs due to carryingthe costs for work in progress during construction. Adjustments for these costs are made as thethe allowance for funds during construction in theForm 7, Total Capital Cost. If these costs are included in the project capital price entered above then enter 0 months.
2) If significant one-time costs, such as replacement catalysts, are required in out years (after thein-service year) those are addressed in Form 5, Fixed Operating Costs.
3) If a one-time upgrade can be expensed, it may be treated as a one-time- fixed cost in the yearprior to the in-service year and entered as a one-time- fixed cost in that year in Form 5,Fixed Operating Costs.
4) Avoided capital costs may be treated as a negative value here or as an annual credit in Form 5, Fixed Operating Costs.
Prepared by Date
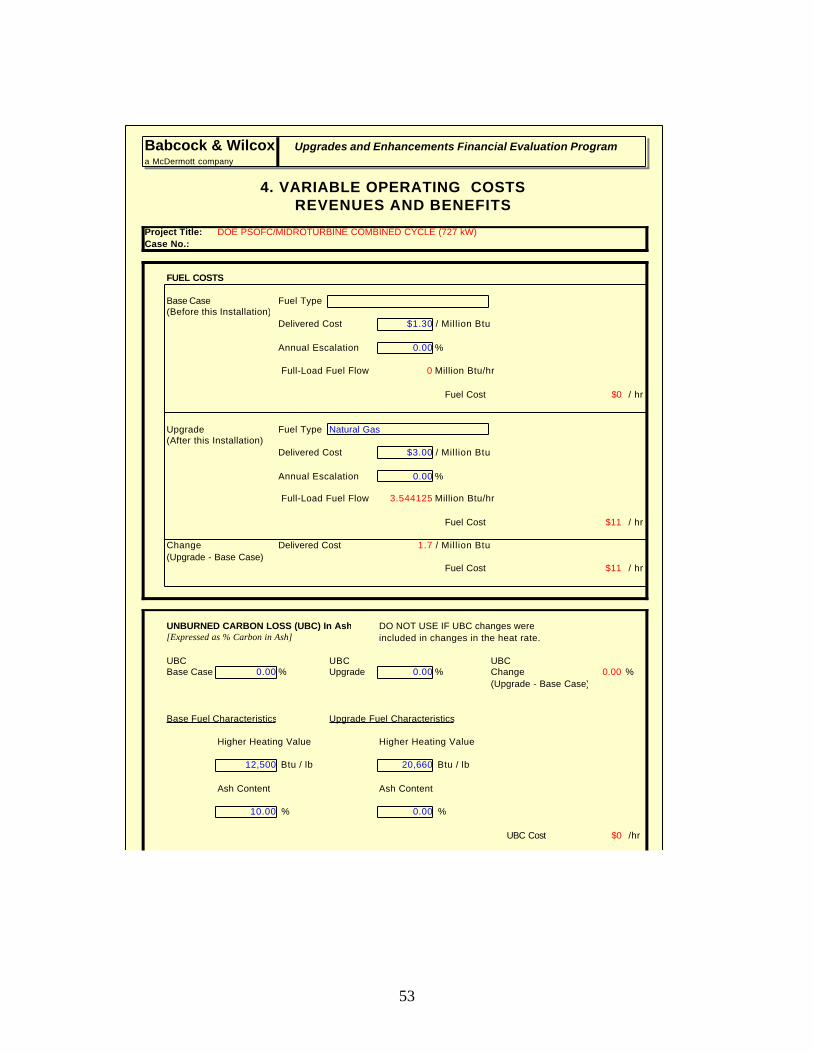
53
Babcock & Wilcox Upgrades and Enhancements Financial Evaluation Programa McDermott company
4. VARIABLE OPERATING COSTS REVENUES AND BENEFITS
Project Title: DOE PSOFC/MIDROTURBINE COMBINED CYCLE (727 kW)Case No.:
FUEL COSTS
Base Case Fuel Type (Before this Installation)
Delivered Cost $1.30 / Million Btu
Annual Escalation 0.00 %
Full-Load Fuel Flow 0 Million Btu/hr
Fuel Cost $0 / hr
Upgrade Fuel Type Natural Gas(After this Installation)
Delivered Cost $3.00 / Million Btu
Annual Escalation 0.00 %
Full-Load Fuel Flow 3.544125 Million Btu/hr
Fuel Cost $11 / hr
Change Delivered Cost 1.7 / Million Btu(Upgrade - Base Case)
Fuel Cost $11 / hr
UNBURNED CARBON LOSS (UBC) In Ash DO NOT USE IF UBC changes were[Expressed as % Carbon in Ash] included in changes in the heat rate.
UBC UBC UBCBase Case 0.00 % Upgrade 0.00 % Change 0.00 %
(Upgrade - Base Case)
Base Fuel Characteristics Upgrade Fuel Characteristics
Higher Heating Value Higher Heating Value
12,500 Btu / lb 20,660 Btu / lb
Ash Content Ash Content
10.00 % 0.00 %
UBC Cost $0 /hr
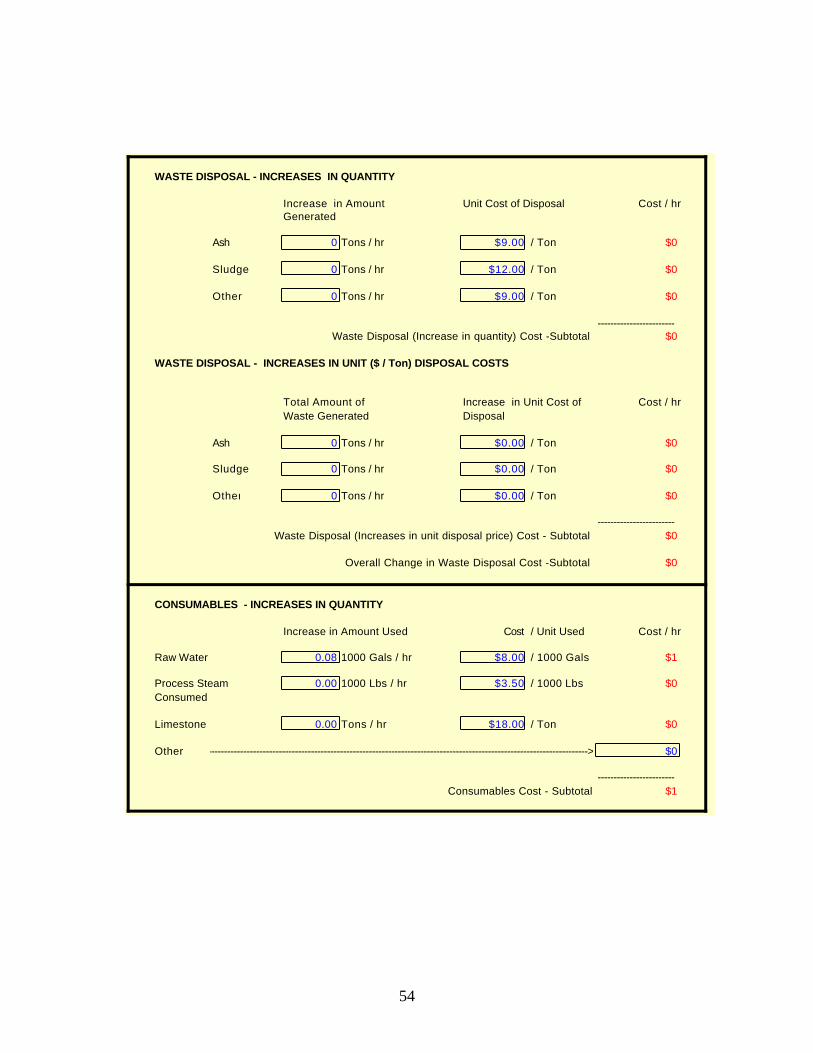
54
WASTE DISPOSAL - INCREASES IN QUANTITY
Increase in Amount Unit Cost of Disposal Cost / hrGenerated
Ash 0 Tons / hr $9.00 / Ton $0
Sludge 0 Tons / hr $12.00 / Ton $0
Other 0 Tons / hr $9.00 / Ton $0
------------------------Waste Disposal (Increase in quantity) Cost -Subtotal $0
WASTE DISPOSAL - INCREASES IN UNIT ($ / Ton) DISPOSAL COSTS
Total Amount of Increase in Unit Cost of Cost / hrWaste Generated Disposal
Ash 0 Tons / hr $0.00 / Ton $0
Sludge 0 Tons / hr $0.00 / Ton $0
Other 0 Tons / hr $0.00 / Ton $0
------------------------Waste Disposal (Increases in unit disposal price) Cost - Subtotal $0
Overall Change in Waste Disposal Cost -Subtotal $0
CONSUMABLES - INCREASES IN QUANTITY
Increase in Amount Used Cost / Unit Used Cost / hr
Raw Water 0.08 1000 Gals / hr $8.00 / 1000 Gals $1
Process Steam 0.00 1000 Lbs / hr $3.50 / 1000 Lbs $0Consumed
Limestone 0.00 Tons / hr $18.00 / Ton $0
Other-----------------------------------------------------------------------------------------------------------------------------------------> $0
------------------------Consumables Cost - Subtotal $1

55
CREDITS FOR BYPRODUCTS
Increase in Amount Produced Credit / Unit Credit $/ hr
Steam 0.00 1000 Lbs / hr $0.00 / 1000 Lbs $0
Ash 0.00 Tons / hr $0.00 Tons $0
Gypsum 0.00 Tons / hr $0.00 Tons $0
Other--------------------------------------------------------------------------------------------------------------> $0
------------------------Total Byproducts Credits $0
[Negative cost]
ELECTRICITY PRICING
Electric Power Price $0.0000 / kWhr
Annual Escalation of Base Price 0.00 %
Incremental Price (Power Price -(Fuel Cost / kWh x Variable $0.0000 / kWhCost Factor))
Variable Cost Factor 0.00 %(Non-fuel variable cost shown as percentage of fuel cost)
NET INCREMENTAL REVENUE- Excluding Fuel Cost (Credit From Incremental Net Power Produced)
Incremental 0.727 MW Net Incremental Revenue $0 /hrPower Except Fuel [Negative cost]
Incremental power produced is automatically calculated from changes in capacity entered in the Unit Capacity and Operating Information. Increased production due tocapacity factor changes are also included in the total Variable Operating Costs used inthe Cash Flow and Revenue Requirements.
NET VARIABLE COSTS LESS BENEFITS AND LESS INCREMENTAL REVENUE[Note that incremental revenue considered here is limited to that due to capacity increases only]
Net Variable Costs $12 /hr
NET VARIABLE COSTS (COST LESS BENEFITS) EXCLUDING FUEL COSTSAND INCREMENTAL REVENUE
[Note that UBC & DGL costs and cost arising from changes in superheater and reheatertemperatures and attemperator flow rates are treated under fuel cost considerations andare not included here]
Net Variable Costs (with adjustments noted above) $1 /hr
Prepared by Date
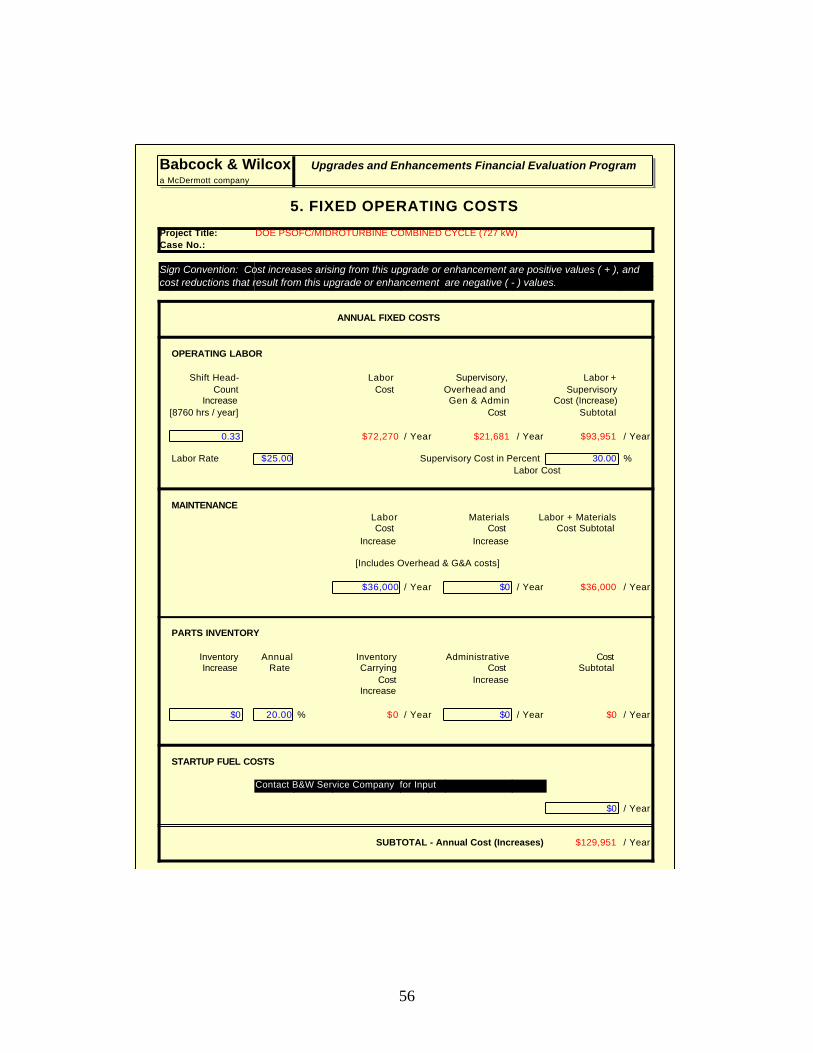
56
Babcock & Wilcox Upgrades and Enhancements Financial Evaluation Programa McDermott company
5. FIXED OPERATING COSTS
Project Title: DOE PSOFC/MIDROTURBINE COMBINED CYCLE (727 kW)Case No.:
Sign Convention: Cost increases arising from this upgrade or enhancement are positive values ( + ), and cost reductions that result from this upgrade or enhancement are negative ( - ) values.
ANNUAL FIXED COSTS
OPERATING LABOR
Shift Head- Labor Supervisory, Labor +Count Cost Overhead and Supervisory
Increase Gen & Admin Cost (Increase)[8760 hrs / year] Cost Subtotal
0.33 $72,270 / Year $21,681 / Year $93,951 / Year
Labor Rate $25.00 Supervisory Cost in Percent 30.00 %Labor Cost
MAINTENANCELabor Materials Labor + MaterialsCost Cost Cost Subtotal
Increase Increase
[Includes Overhead & G&A costs]
$36,000 / Year $0 / Year $36,000 / Year
PARTS INVENTORY
Inventory Annual Inventory Administrative CostIncrease Rate Carrying Cost Subtotal
Cost IncreaseIncrease
$0 20.00 % $0 / Year $0 / Year $0 / Year
STARTUP FUEL COSTS
Contact B&W Service Company for Input
$0 / Year
SUBTOTAL - Annual Cost (Increases) $129,951 / Year

57
ONE-TIME (Non-Depreciable) FIXED COSTS - At time of performance
Sign Convention: One-time fixed costs related to this upgrade orenhancement are positive values ( + ),
Replacement Power Cost During Outage for Installation of Upgrade or Enhancement Net of Fuel Fuel Cost from VOC = $ 0 /Hr form VOC
Outage Replacement Capacity Load CostDuration Power Factor
Cost
0 days $0.060 /kWhr. 0 MW 80 % $0
OTHER ONE-TIME FIXED COSTS ( Expensed Items that are not Depreciated - Example catalystsreplacement) Note: these can be initial project expenses that are not capital expenses. If so, the yearshould be "year 0" -- the year preceding the "in-service year."
Item Description Year Cost
1 2003 $361,350 Stack Replacement
2 2008 $454,850 Stack Replacement/Microturbine Replacement
3 2013 $361,350 Stack Replacement
4 2018 $682,275 Stack Replacement/Microturbine Replacement
Sign Convention: Added revenues arising from this upgrade or enhancementare positive values ( + ), and reduced revenues that result from thisupgrade or enhancement are negative ( - ) values.
ANNUAL CREDITS for Premuium on Power Sales and Other Benefits
Contact B&W Service Company for Input
System $0 / Year
Plant $0 / Year
SUBTOTAL $0 / Year

58
TOTAL OF ANNUAL FIXED COST INCREASES Less ANNUAL CREDITS
Does not include "AVOIDED CAPITAL COST CREDIT SHOW BELOW."
TOTAL $129,951 / Year
AVOIDED CAPITAL COST CREDIT
NOTE: Avoided capital costs may also be treated as a negative capital cost in Form 3. DO NOT APPLY THIS CREDIT IF A NEGATIVE COST WAS USED FOR THE SAME AVOIDED COST IN FORM 3.
USE CREDIT IN THIS SHEET? ENTER "Y" for yes or "N" for no, here---> N
Incremental Capacity Avoided Capital Cost Capital LevelizationFactor
1 MWe $350 /kW 0.2381
ANNUAL CREDIT $0 / Year
Prepared by Date
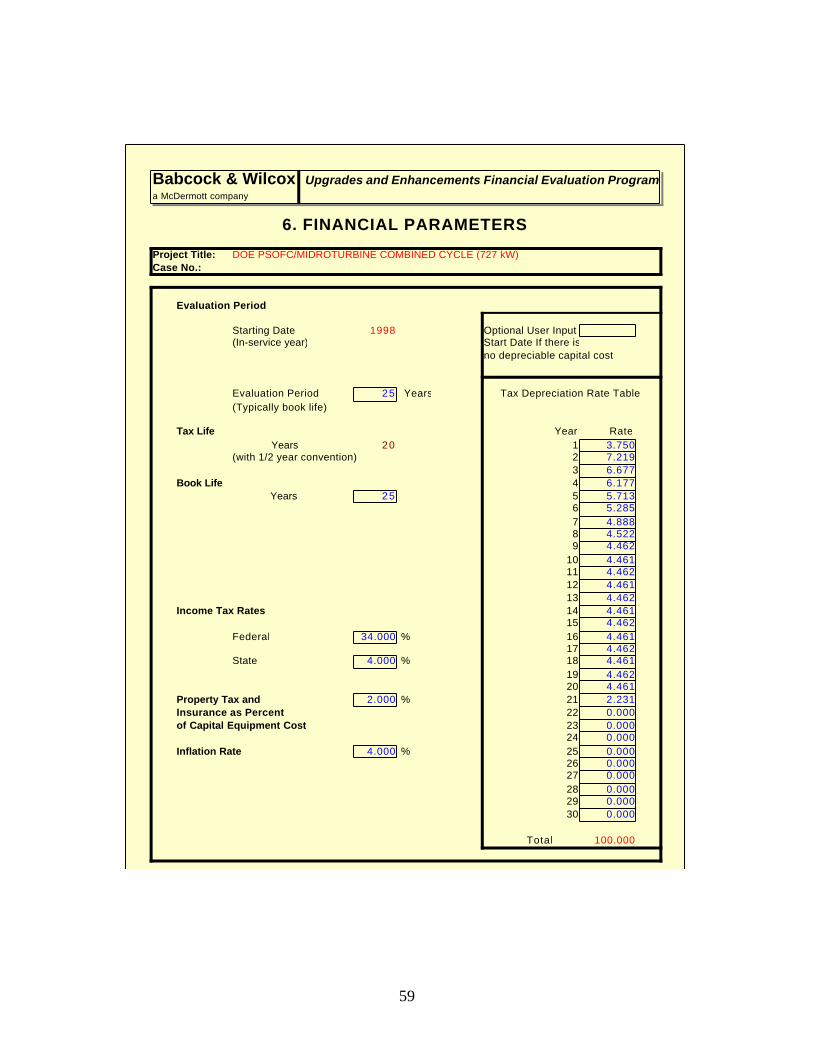
59
Babcock & Wilcox Upgrades and Enhancements Financial Evaluation Programa McDermott company
6. FINANCIAL PARAMETERS
Project Title: DOE PSOFC/MIDROTURBINE COMBINED CYCLE (727 kW)Case No.:
Evaluation Period
Starting Date 1998 Optional User Input (In-service year) Start Date If there is
no depreciable capital cost
Evaluation Period 25 Years Tax Depreciation Rate Table(Typically book life)
Tax Life Year RateYears 20 1 3.750
(with 1/2 year convention) 2 7.2193 6.677
Book Life 4 6.177Years 25 5 5.713
6 5.285 7 4.888
8 4.522 9 4.462
10 4.46111 4.46212 4.46113 4.462
Income Tax Rates 14 4.46115 4.462
Federal 34.000 % 16 4.46117 4.462
State 4.000 % 18 4.46119 4.46220 4.461
Property Tax and 2.000 % 21 2.231Insurance as Percent 22 0.000of Capital Equipment Cost 23 0.000
24 0.000Inflation Rate 4.000 % 25 0.000
26 0.00027 0.00028 0.00029 0.000
30 0.000
Total 100.000
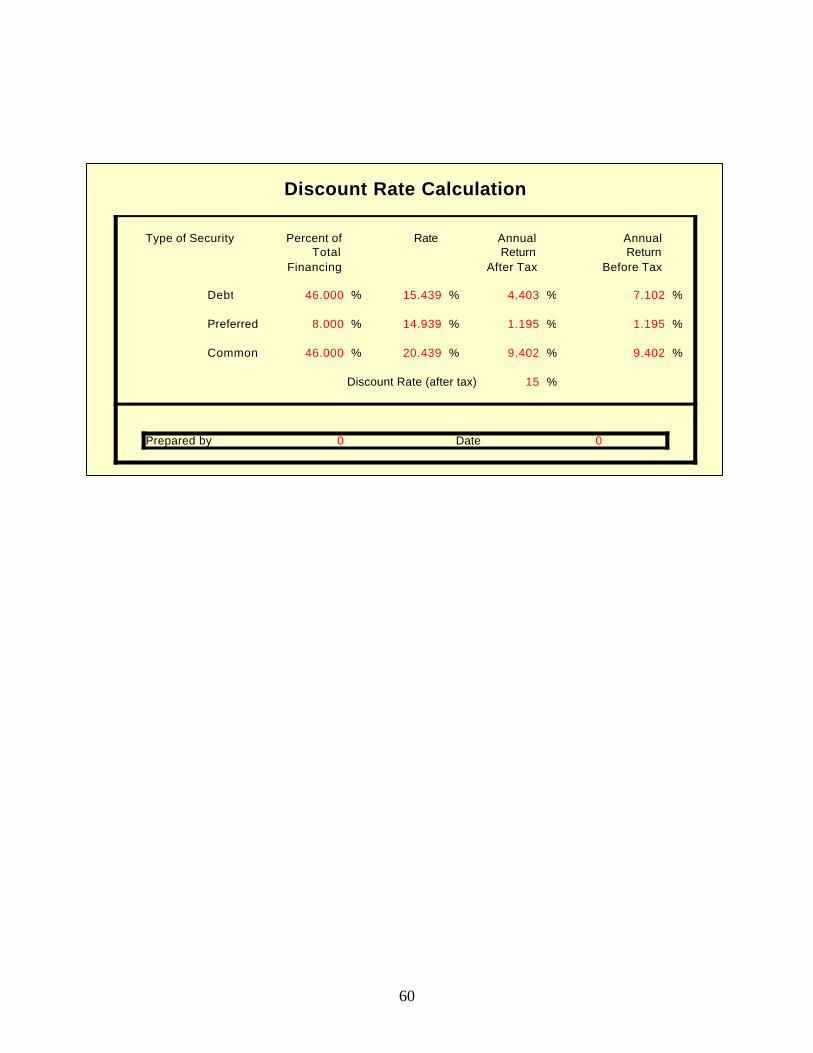
60
Discount Rate Calculation
Type of Security Percent of Rate Annual AnnualTotal Return Return
Financing After Tax Before Tax
Debt 46.000 % 15.439 % 4.403 % 7.102 %
Preferred 8.000 % 14.939 % 1.195 % 1.195 %
Common 46.000 % 20.439 % 9.402 % 9.402 %
Discount Rate (after tax) 15 %
Prepared by 0 Date 0
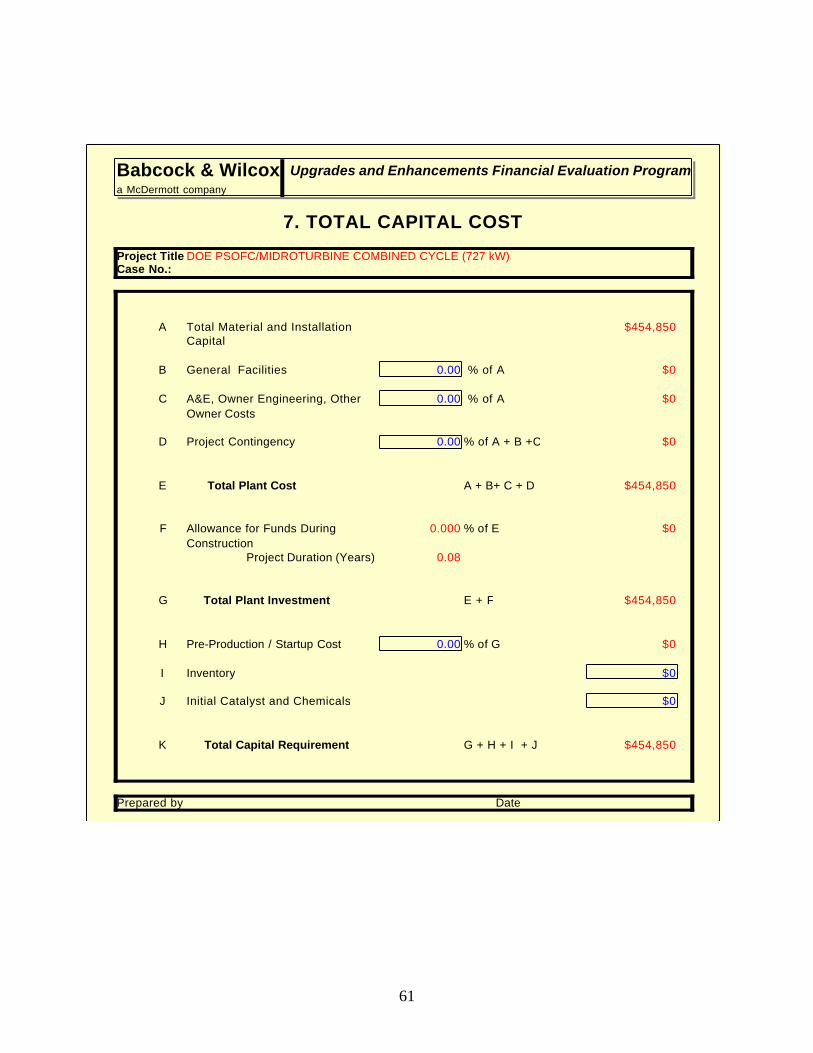
61
Babcock & Wilcox Upgrades and Enhancements Financial Evaluation Programa McDermott company
7. TOTAL CAPITAL COST
Project Title: DOE PSOFC/MIDROTURBINE COMBINED CYCLE (727 kW)Case No.:
A Total Material and Installation $454,850Capital
B General Facilities 0.00 % of A $0
C A&E, Owner Engineering, Other 0.00 % of A $0Owner Costs
D Project Contingency 0.00 % of A + B +C $0
E Total Plant Cost A + B+ C + D $454,850
F Allowance for Funds During 0.000 % of E $0Construction
Project Duration (Years) 0.08
G Total Plant Investment E + F $454,850
H Pre-Production / Startup Cost 0.00 % of G $0
I Inventory $0
J Initial Catalyst and Chemicals $0
K Total Capital Requirement G + H + I + J $454,850
Prepared by Date
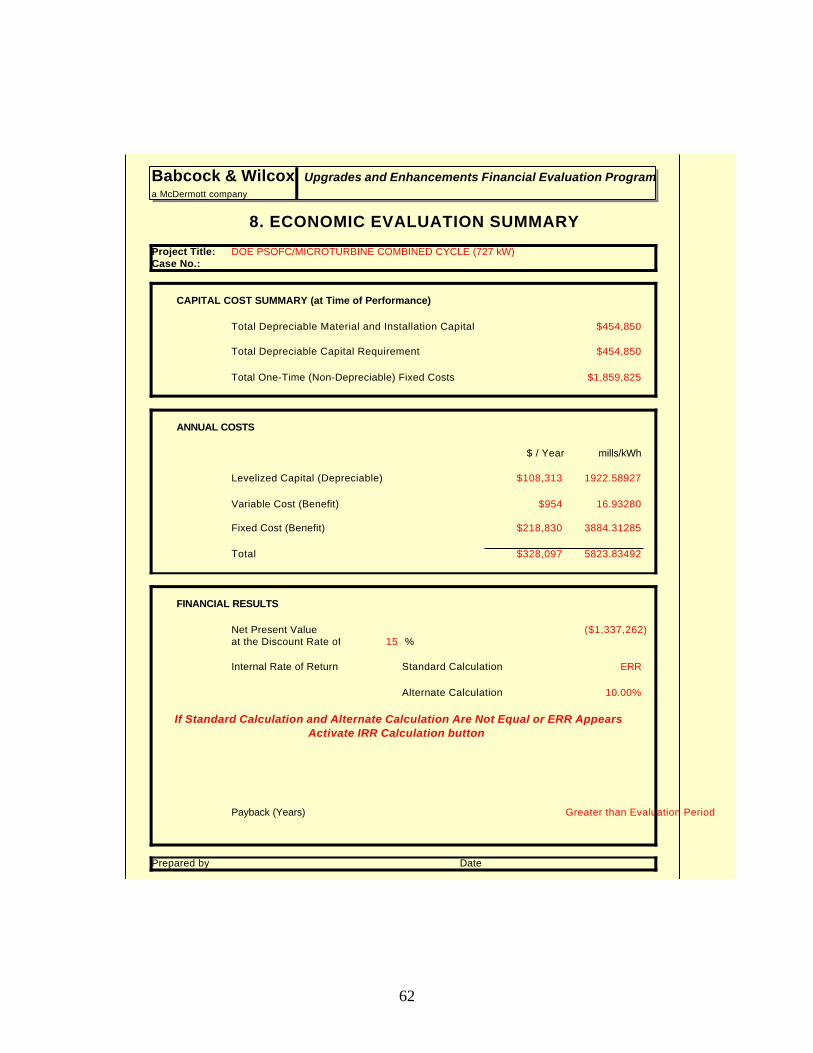
62
Babcock & Wilcox Upgrades and Enhancements Financial Evaluation Programa McDermott company
8. ECONOMIC EVALUATION SUMMARY
Project Title: DOE PSOFC/MICROTURBINE COMBINED CYCLE (727 kW)Case No.:
CAPITAL COST SUMMARY (at Time of Performance)
Total Depreciable Material and Installation Capital $454,850
Total Depreciable Capital Requirement $454,850
Total One-Time (Non-Depreciable) Fixed Costs $1,859,825
ANNUAL COSTS
$ / Year mills/kWh
Levelized Capital (Depreciable) $108,313 1922.58927
Variable Cost (Benefit) $954 16.93280
Fixed Cost (Benefit) $218,830 3884.31285
Total $328,097 5823.83492
FINANCIAL RESULTS
Net Present Value ($1,337,262)at the Discount Rate of 15 %
Internal Rate of Return Standard Calculation ERR
Alternate Calculation 10.00%
If Standard Calculation and Alternate Calculation Are Not Equal or ERR Appears Activate IRR Calculation button
Payback (Years) Greater than Evaluation Period
Prepared by Date
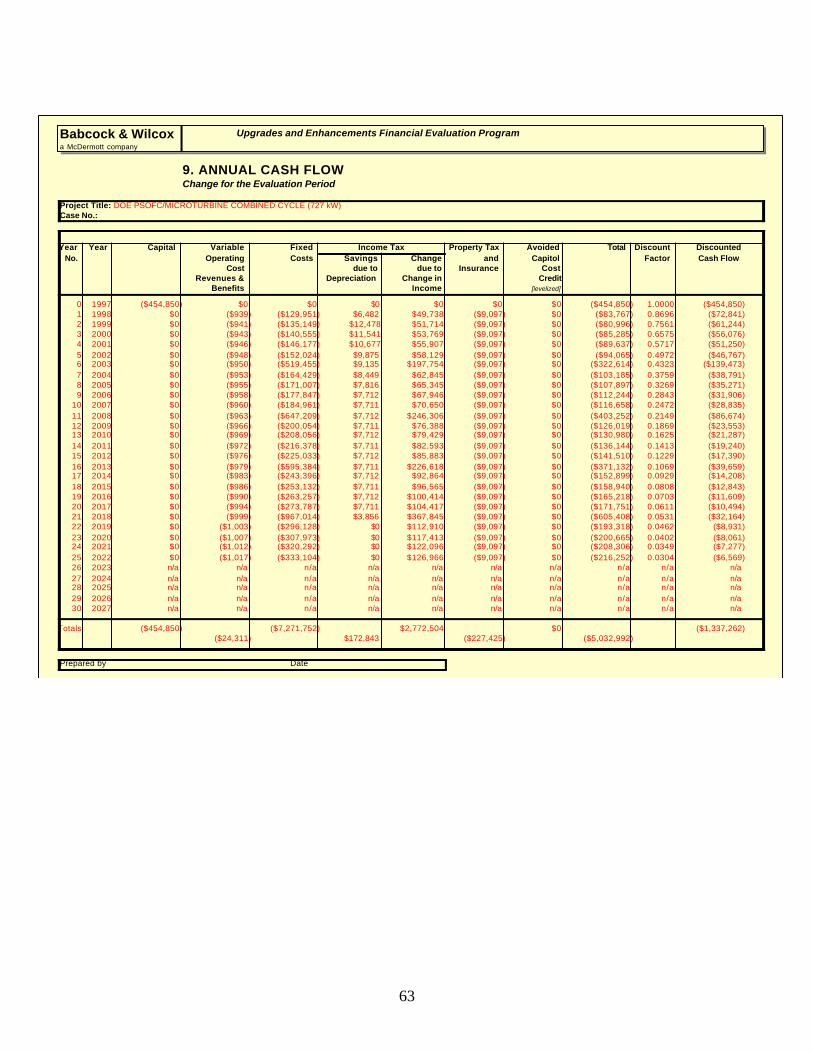
63
Babcock & Wilcox Upgrades and Enhancements Financial Evaluation Programa McDermott company
9. ANNUAL CASH FLOWChange for the Evaluation Period
Project Title: DOE PSOFC/MICROTURBINE COMBINED CYCLE (727 kW)Case No.:
Year Year Capital Variable Fixed Income Tax Property Tax Avoided Total Discount DiscountedNo. Operating Costs Savings Change and Capitol Factor Cash Flow
Cost due to due to Insurance CostRevenues & Depreciation Change in Credit
Benefits Income [levelized]
0 1997 ($454,850) $0 $0 $0 $0 $0 $0 ($454,850) 1.0000 ($454,850)1 1998 $0 ($939) ($129,951) $6,482 $49,738 ($9,097) $0 ($83,767) 0.8696 ($72,841)2 1999 $0 ($941) ($135,149) $12,478 $51,714 ($9,097) $0 ($80,996) 0.7561 ($61,244)3 2000 $0 ($943) ($140,555) $11,541 $53,769 ($9,097) $0 ($85,285) 0.6575 ($56,076)4 2001 $0 ($946) ($146,177) $10,677 $55,907 ($9,097) $0 ($89,637) 0.5717 ($51,250)5 2002 $0 ($948) ($152,024) $9,875 $58,129 ($9,097) $0 ($94,065) 0.4972 ($46,767)6 2003 $0 ($950) ($519,455) $9,135 $197,754 ($9,097) $0 ($322,614) 0.4323 ($139,473)7 2004 $0 ($953) ($164,429) $8,449 $62,845 ($9,097) $0 ($103,185) 0.3759 ($38,791)8 2005 $0 ($955) ($171,007) $7,816 $65,345 ($9,097) $0 ($107,897) 0.3269 ($35,271)9 2006 $0 ($958) ($177,847) $7,712 $67,946 ($9,097) $0 ($112,244) 0.2843 ($31,906)
10 2007 $0 ($960) ($184,961) $7,711 $70,650 ($9,097) $0 ($116,658) 0.2472 ($28,835)11 2008 $0 ($963) ($647,209) $7,712 $246,306 ($9,097) $0 ($403,252) 0.2149 ($86,674)12 2009 $0 ($966) ($200,054) $7,711 $76,388 ($9,097) $0 ($126,019) 0.1869 ($23,553)13 2010 $0 ($969) ($208,056) $7,712 $79,429 ($9,097) $0 ($130,980) 0.1625 ($21,287)14 2011 $0 ($972) ($216,378) $7,711 $82,593 ($9,097) $0 ($136,144) 0.1413 ($19,240)15 2012 $0 ($976) ($225,033) $7,712 $85,883 ($9,097) $0 ($141,510) 0.1229 ($17,390)16 2013 $0 ($979) ($595,384) $7,711 $226,618 ($9,097) $0 ($371,132) 0.1069 ($39,659)17 2014 $0 ($983) ($243,396) $7,712 $92,864 ($9,097) $0 ($152,899) 0.0929 ($14,208)18 2015 $0 ($986) ($253,132) $7,711 $96,565 ($9,097) $0 ($158,940) 0.0808 ($12,843)19 2016 $0 ($990) ($263,257) $7,712 $100,414 ($9,097) $0 ($165,218) 0.0703 ($11,609)20 2017 $0 ($994) ($273,787) $7,711 $104,417 ($9,097) $0 ($171,751) 0.0611 ($10,494)21 2018 $0 ($999) ($967,014) $3,856 $367,845 ($9,097) $0 ($605,408) 0.0531 ($32,164)22 2019 $0 ($1,003) ($296,128) $0 $112,910 ($9,097) $0 ($193,318) 0.0462 ($8,931)23 2020 $0 ($1,007) ($307,973) $0 $117,413 ($9,097) $0 ($200,665) 0.0402 ($8,061)24 2021 $0 ($1,012) ($320,292) $0 $122,096 ($9,097) $0 ($208,306) 0.0349 ($7,277)25 2022 $0 ($1,017) ($333,104) $0 $126,966 ($9,097) $0 ($216,252) 0.0304 ($6,569)26 2023 n/a n/a n/a n/a n/a n/a n/a n/a n/a n/a27 2024 n/a n/a n/a n/a n/a n/a n/a n/a n/a n/a28 2025 n/a n/a n/a n/a n/a n/a n/a n/a n/a n/a29 2026 n/a n/a n/a n/a n/a n/a n/a n/a n/a n/a30 2027 n/a n/a n/a n/a n/a n/a n/a n/a n/a n/a
Totals ($454,850) ($7,271,752) $2,772,504 $0 ($1,337,262)($24,311) $172,843 ($227,425) ($5,032,992)
Prepared by Date
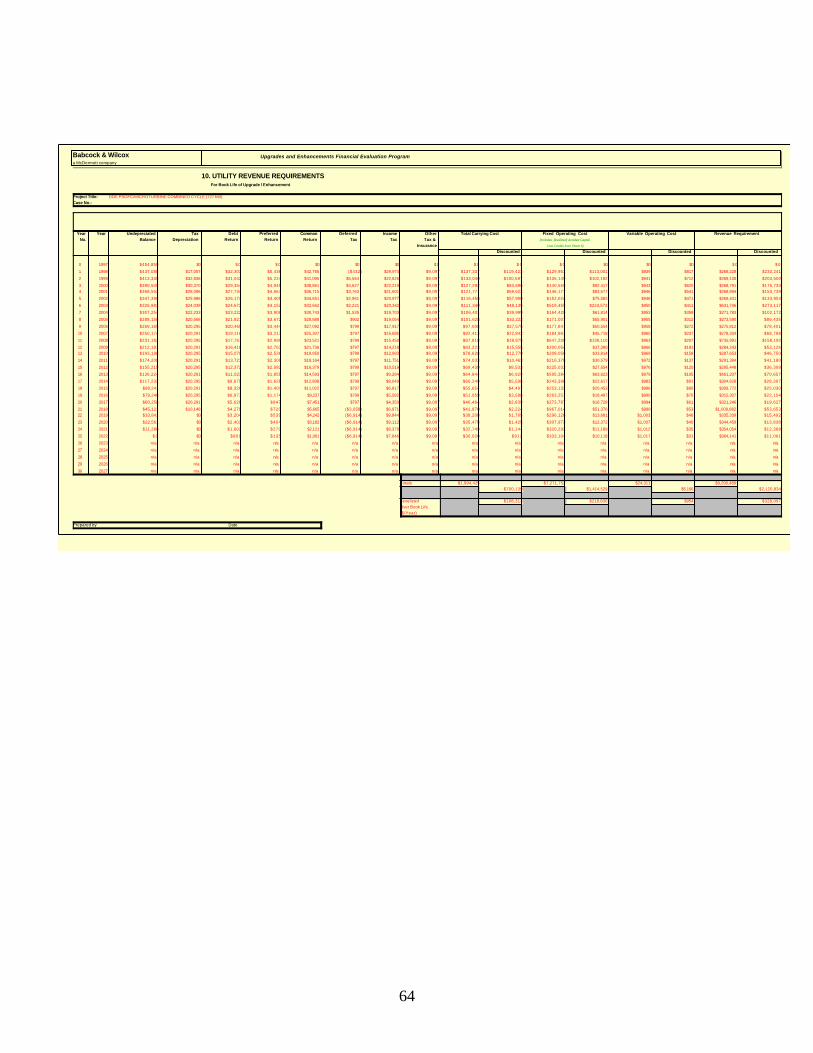
64
Babcock & Wilcox Upgrades and Enhancements Financial Evaluation Programa McDermott company
10. UTILITY REVENUE REQUIREMENTS For Book Life of Upgrade / Enhancement
Project Title: DOE PSOFC/MICROTURBINE COMBINED CYCLE (727 kW) Case No.:
Year Year Undepreciated Tax Debt Preferred Common Deferred Income Other Total Carrying Cost Fixed Operating Cost Variable Operating Cost Revenue Requirement No. Balance Depreciation Return Return Return Tax Tax Tax & (Includes: [levelized] Avoided Capital
Insurance Cost Credits from Sheet 5)
Discounted Discounted Discounted Discounted
0 1997 $454,850 $0 $ 0 $ 0 $0 $0 $0 $ 0 $ 0 $ 0 $ 0 $0 $0 $0 $ 0 $ 0
1 1998 $437,088 $17,057 $32,303 $5,436 $42,765 ($432) $29,974 $9,097 $137,337 $119,423 $129,951 $113,001 $939 $817 $268,228 $233,241
2 1999 $413,330 $32,836 $31,042 $5,224 $41,095 $5,564 $22,825 $9,097 $133,040 $100,597 $135,149 $102,192 $941 $712 $269,130 $203,500
3 2000 $390,509 $30,370 $29,354 $4,940 $38,861 $4,627 $22,219 $9,097 $127,292 $83,696 $140,555 $92,417 $943 $620 $268,791 $176,7334 2001 $368,552 $28,096 $27,734 $4,667 $36,715 $3,763 $21,601 $9,097 $121,771 $69,622 $146,177 $83,577 $946 $541 $268,894 $153,739
5 2002 $347,398 $25,986 $26,174 $4,405 $34,651 $2,961 $20,977 $9,097 $116,458 $57,900 $152,024 $75,582 $948 $471 $269,431 $133,953
6 2003 $326,983 $24,039 $24,672 $4,152 $32,662 $2,221 $20,342 $9,097 $111,340 $48,135 $519,455 $224,572 $950 $411 $631,746 $273,117
7 2004 $307,254 $22,233 $23,222 $3,908 $30,743 $1,535 $19,703 $9,097 $106,401 $39,999 $164,429 $61,814 $953 $358 $271,783 $102,172
8 2005 $288,158 $20,568 $21,821 $3,672 $28,888 $902 $19,054 $9,097 $101,628 $33,222 $171,007 $55,901 $955 $312 $273,590 $89,435
9 2006 $269,165 $20,295 $20,465 $3,444 $27,092 $799 $17,917 $9,097 $97,008 $27,575 $177,847 $50,554 $958 $272 $275,812 $78,401
10 2007 $250,174 $20,291 $19,116 $3,217 $25,307 $797 $16,685 $9,097 $92,413 $22,842 $184,961 $45,718 $960 $237 $278,334 $68,798
11 2008 $231,182 $20,295 $17,767 $2,990 $23,521 $799 $15,450 $9,097 $87,818 $18,875 $647,209 $139,110 $963 $207 $735,991 $158,192
12 2009 $212,191 $20,291 $16,418 $2,763 $21,736 $797 $14,218 $9,097 $83,223 $15,555 $200,054 $37,390 $966 $181 $284,243 $53,12613 2010 $193,198 $20,295 $15,070 $2,536 $19,950 $799 $12,983 $9,097 $78,628 $12,779 $208,056 $33,814 $969 $158 $287,653 $46,750
14 2011 $174,208 $20,291 $13,721 $2,309 $18,164 $797 $11,751 $9,097 $74,033 $10,463 $216,378 $30,579 $972 $137 $291,384 $41,180
15 2012 $155,215 $20,295 $12,372 $2,082 $16,379 $799 $10,516 $9,097 $69,439 $8,533 $225,033 $27,654 $976 $120 $295,448 $36,308
16 2013 $136,224 $20,291 $11,023 $1,855 $14,593 $797 $9,284 $9,097 $64,844 $6,929 $595,384 $63,623 $979 $105 $661,207 $70,657
17 2014 $117,232 $20,295 $9,675 $1,628 $12,808 $799 $8,049 $9,097 $60,249 $5,598 $243,396 $22,617 $983 $91 $304,628 $28,307
18 2015 $98,241 $20,291 $8,326 $1,401 $11,022 $797 $6,817 $9,097 $55,654 $4,497 $253,132 $20,453 $986 $80 $309,772 $25,030
19 2016 $79,248 $20,295 $6,977 $1,174 $9,237 $799 $5,582 $9,097 $51,059 $3,588 $263,257 $18,497 $990 $70 $315,307 $22,154
20 2017 $60,258 $20,291 $5,628 $947 $7,451 $797 $4,350 $9,097 $46,464 $2,839 $273,787 $16,728 $994 $61 $321,246 $19,627
21 2018 $45,121 $10,148 $4,279 $720 $5,665 ($3,058) $6,971 $9,097 $41,870 $2,224 $967,014 $51,376 $999 $53 $1,009,882 $53,65322 2019 $33,841 $0 $3,204 $539 $4,242 ($6,914) $9,844 $9,097 $38,208 $1,765 $296,128 $13,681 $1,003 $46 $335,339 $15,492
23 2020 $22,561 $0 $2,403 $404 $3,182 ($6,914) $9,112 $9,097 $35,478 $1,425 $307,973 $12,372 $1,007 $40 $344,459 $13,838
24 2021 $11,280 $0 $1,602 $270 $2,121 ($6,914) $8,379 $9,097 $32,749 $1,144 $320,292 $11,189 $1,012 $35 $354,054 $12,368
25 2022 $ 0 $0 $801 $135 $1,061 ($6,914) $7,646 $9,097 $30,020 $912 $333,104 $10,118 $1,017 $31 $364,141 $11,061
26 2023 n/a n/a n/a n/a n/a n/a n/a n/a n/a n/a n/a n/a n/a n/a n/a n/a
27 2024 n/a n/a n/a n/a n/a n/a n/a n/a n/a n/a n/a n/a n/a n/a n/a n/a
28 2025 n/a n/a n/a n/a n/a n/a n/a n/a n/a n/a n/a n/a n/a n/a n/a n/a
29 2026 n/a n/a n/a n/a n/a n/a n/a n/a n/a n/a n/a n/a n/a n/a n/a n/a
30 2027 n/a n/a n/a n/a n/a n/a n/a n/a n/a n/a n/a n/a n/a n/a n/a n/a
Totals $1,994,425 $7,271,752 $24,311 $9,290,489$700,139 $1,414,529 $6,166 $2,120,834
Levelized $108,313 $218,830 $954 $328,097Over Book Life($/Year)
Prepared by Date