Embed Size (px)
Citation preview
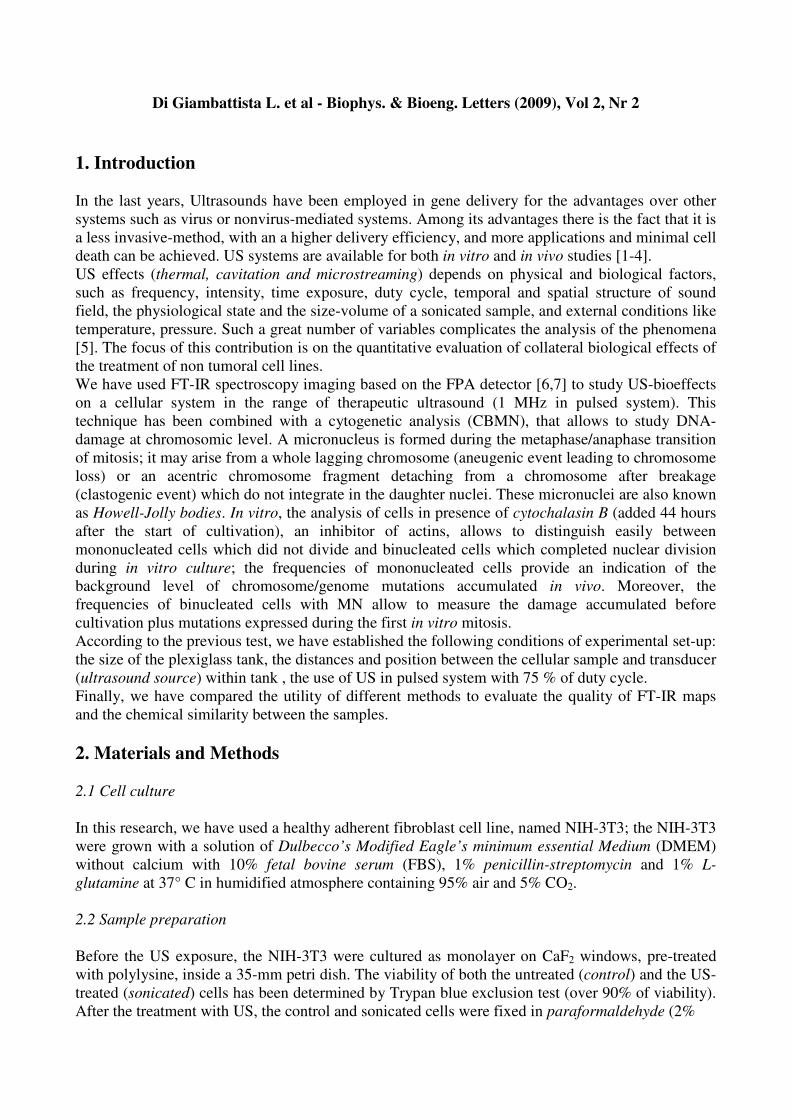
Di Giambattista L. et al - Biophys. & Bioeng. Letters (2009), Vol 2, Nr 2
FTIR spectral imaging as a probe of ultrasound effect on cells in vitro.
L. Di Giambattista(1,2)
, P. Grimaldi(1)
, I. Udroiu(3)
, D. Pozzi(4)
, G. Cinque(5)
, M.D. Frogley(5)
,
A. Giansanti(1)
and A. Congiu Castellano(1)
.
(1)
Physics Department, Sapienza, University of Rome (IT). (2)
CISB (Interdepartmental Research Centre for Models and Information Analysis in Biomedical Systems), Sapienza,
University of Rome (IT). (3)
DIPIA, ISPESL, via Urbana 167, Rome (IT). (4)
Experimental Medicine and Pathology Department, Sapienza, University of Rome (IT). (5)
Diamond Light Source Ltd, Didcot, Oxfordshire (UK).
Keywords: Ultrasound bioeffects – FT-IR Imaging – Cytogenetic effect.
Abstract Safe and efficient intracellular delivery of genes or drugs is critically important in targeted cancer
treatment and gene therapy applications. Ultrasound (US) has been demonstrated to alter the cell
membrane permeability due to a biophysical mechanism (Sonoporation) and exploited as a
promising non-invasive gene transfer method. The sonoporation process could induce the formation
of transient pores without significantly affecting cell viability.
This research is aimed at investigating some bioeffects due to Therapeutic Ultrasound (pulsed-1
MHz) which could allow to enhance drugs or genes delivery in a non tumoral cell line. We have
used the NIH-3T3 cell line as model system and exposed it to US at two different distances from the
source; the effects of this pulsed ultrasonic wave on cells were assessed by Fourier transform
infrared (FT-IR) spectroscopic imaging analysis. This technique combined with a focal plane array
(FPA) detector has been widely used to study the general biochemical changes in vitro; moreover,
the development of FPA detectors and shortening of measurement times specifically for IR
imaging, from several hours to few minutes, have made possible to image the distribution of
molecular species in biological samples. We have also performed a cytokinesis-block micronucleus
(CBMN) assay to reveal the presence or not of micronuclei (named Howell-Jolly bodies) formed
during the cell division due to the DNA damage.
The results of IR analysis combined with the cytogenetic analysis have shown that these
experimental conditions can not cause DNA mutations in the NIH-3T3 cell line. Finally, the
comparison between the spectral parameters of the average spectrum extracted from the spectral
map and those of the set of all spectra from the spectral map could be limited by the presence of bad
pixels inside the map.
List of symbols
A1 Amide I (-C=O stretching), proteins
A2 Amide II (-N-H bending, -C-N stretching), proteins
BNC Binucleated cells
CBMN Cytokinesis-block micronucleus
CTR Control cells (untreated cells)
DAPI 4’-6’-diamidino-2-phenylindole
DMEM Dulbecco’s Modified Eagle’s minimum essential Medium
FBS Fetal serum bovine
FPA Focal plane array
FT-IR Fourier transform infrared
HCA Hierarchical Cluster Analysis
H Inter-spectral distance
h Intra-cluster heterogeneity
hD Distance between petri dish and transducer
NDI Nuclear division index
NIH-3T3 Mouse fibroblast cell line
Nbs Number of bad spectra
MCT Mercury cadmium telluride
MN Micronucleus
MNC Mononucleated cells
PBS Dulbecco's Phosphate Buffer Saline
PCA Principal Component Analysis
PCs Principal components
PC1 First principal component
PC2 Second principal component
R1
I
I
A
A
2
1 intensity ratio
RMS Root Mean Square
SONt_d Sonicated cells (treated cells), t=time and d=distance
S/N Signal-to-Noise ratio
US Ultrasound
Di Giambattista L. et al - Biophys. & Bioeng. Letters (2009), Vol 2, Nr 2
1. Introduction
In the last years, Ultrasounds have been employed in gene delivery for the advantages over other
systems such as virus or nonvirus-mediated systems. Among its advantages there is the fact that it is
a less invasive-method, with an a higher delivery efficiency, and more applications and minimal cell
death can be achieved. US systems are available for both in vitro and in vivo studies [1-4].
US effects (thermal, cavitation and microstreaming) depends on physical and biological factors,
such as frequency, intensity, time exposure, duty cycle, temporal and spatial structure of sound
field, the physiological state and the size-volume of a sonicated sample, and external conditions like
temperature, pressure. Such a great number of variables complicates the analysis of the phenomena
[5]. The focus of this contribution is on the quantitative evaluation of collateral biological effects of
the treatment of non tumoral cell lines.
We have used FT-IR spectroscopy imaging based on the FPA detector [6,7] to study US-bioeffects
on a cellular system in the range of therapeutic ultrasound (1 MHz in pulsed system). This
technique has been combined with a cytogenetic analysis (CBMN), that allows to study DNA-
damage at chromosomic level. A micronucleus is formed during the metaphase/anaphase transition
of mitosis; it may arise from a whole lagging chromosome (aneugenic event leading to chromosome
loss) or an acentric chromosome fragment detaching from a chromosome after breakage
(clastogenic event) which do not integrate in the daughter nuclei. These micronuclei are also known
as Howell-Jolly bodies. In vitro, the analysis of cells in presence of cytochalasin B (added 44 hours
after the start of cultivation), an inhibitor of actins, allows to distinguish easily between
mononucleated cells which did not divide and binucleated cells which completed nuclear division
during in vitro culture; the frequencies of mononucleated cells provide an indication of the
background level of chromosome/genome mutations accumulated in vivo. Moreover, the
frequencies of binucleated cells with MN allow to measure the damage accumulated before
cultivation plus mutations expressed during the first in vitro mitosis.
According to the previous test, we have established the following conditions of experimental set-up:
the size of the plexiglass tank, the distances and position between the cellular sample and transducer
(ultrasound source) within tank , the use of US in pulsed system with 75 % of duty cycle.
Finally, we have compared the utility of different methods to evaluate the quality of FT-IR maps
and the chemical similarity between the samples.
2. Materials and Methods
2.1 Cell culture
In this research, we have used a healthy adherent fibroblast cell line, named NIH-3T3; the NIH-3T3
were grown with a solution of Dulbecco’s Modified Eagle’s minimum essential Medium (DMEM)
without calcium with 10% fetal bovine serum (FBS), 1% penicillin-streptomycin and 1% L-
glutamine at 37° C in humidified atmosphere containing 95% air and 5% CO2.
2.2 Sample preparation
Before the US exposure, the NIH-3T3 were cultured as monolayer on CaF2 windows, pre-treated
with polylysine, inside a 35-mm petri dish. The viability of both the untreated (control) and the US-
treated (sonicated) cells has been determined by Trypan blue exclusion test (over 90% of viability).
After the treatment with US, the control and sonicated cells were fixed in paraformaldehyde (2%
Di Giambattista L. et al - Biophys. & Bioeng. Letters (2009), Vol 2, Nr 2
for 15 min), washed in Dulbecco's Phosphate Buffer Saline (PBS) and in distilled water to remove
PBS residues, and dried in a desiccator.
2.3 Ultrasound exposure set up
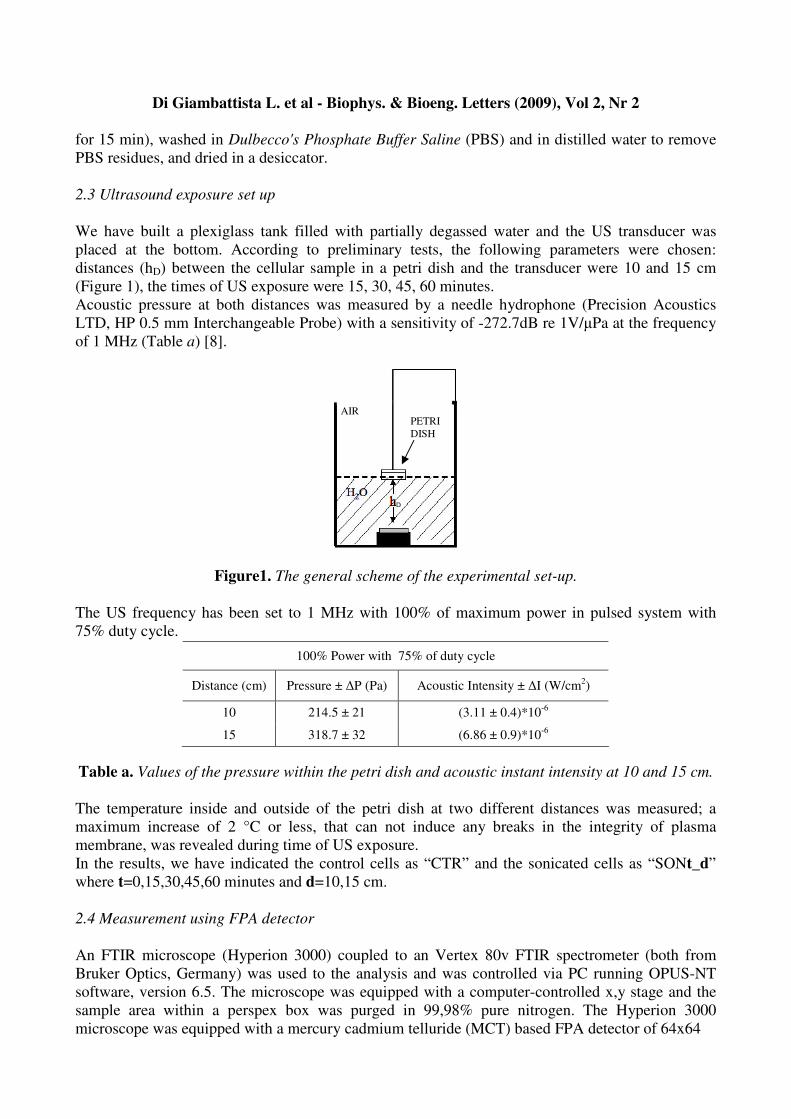
We have built a plexiglass tank filled with partially degassed water and the US transducer was
placed at the bottom. According to preliminary tests, the following parameters were chosen:
distances (hD) between the cellular sample in a petri dish and the transducer were 10 and 15 cm
(Figure 1), the times of US exposure were 15, 30, 45, 60 minutes.
Acoustic pressure at both distances was measured by a needle hydrophone (Precision Acoustics
LTD, HP 0.5 mm Interchangeable Probe) with a sensitivity of -272.7dB re 1V/µPa at the frequency
of 1 MHz (Table a) [8].
Figure1. The general scheme of the experimental set-up.
The US frequency has been set to 1 MHz with 100% of maximum power in pulsed system with
75% duty cycle.
Table a. Values of the pressure within the petri dish and acoustic instant intensity at 10 and 15 cm.
The temperature inside and outside of the petri dish at two different distances was measured; a
maximum increase of 2 °C or less, that can not induce any breaks in the integrity of plasma
membrane, was revealed during time of US exposure.
In the results, we have indicated the control cells as “CTR” and the sonicated cells as “SONt_d”
where t=0,15,30,45,60 minutes and d=10,15 cm.
2.4 Measurement using FPA detector
An FTIR microscope (Hyperion 3000) coupled to an Vertex 80v FTIR spectrometer (both from
Bruker Optics, Germany) was used to the analysis and was controlled via PC running OPUS-NT
software, version 6.5. The microscope was equipped with a computer-controlled x,y stage and the
sample area within a perspex box was purged in 99,98% pure nitrogen. The Hyperion 3000
microscope was equipped with a mercury cadmium telluride (MCT) based FPA detector of 64x64
100% Power with 75% of duty cycle
Distance (cm) Pressure ± ∆P (Pa) Acoustic Intensity ± ∆I (W/cm2)
10 214.5 ± 21 (3.11 ± 0.4)*10-6
15 318.7 ± 32 (6.86 ± 0.9)*10-6
PETRI
DISH
AIR
Di Giambattista L. et al - Biophys. & Bioeng. Letters (2009), Vol 2, Nr 2
pixels where each pixel corresponded to an area of 40x40 µm, so that the visible field corresponded
to an area 170x170 µm2 with 15x magnification objective. Each pixel corresponds to a single
acquired FT-IR spectrum. For IR measurements, the spectrometer was under vacuum to reduce
spectral contributions from water vapour and CO2.
The IR images were continuously acquired with a spectral resolution of 8 cm-1
and by co-adding
512 scans of absorbance spectra were recorded in the range from 4000 to 900 cm-1
. Every cellular
sample was measured on CaF2 window in Trasmission mode and a background spectrum/ image of
a “blank” area on the same CaF2 window was recorded before each cellular sample measurement in
order to account for temporal variations of water vapour and CO2 levels.
Three images were acquired for each CaF2 window, resulting in 30 images with 4096 spectra for the
whole experiment. The acquisition time for each FTIR image was approximately 7 minutes.
To study the chemical map after a pre-processing analysis, the spectral data were processed via the
rubberband method baseline correction (64 baseline points).
The whole spectral region (4000-900 cm-1
) was normalized through vector normalization in the
spectral range of the Amide I (1595-1800 cm-1
) band and we have recorded spectra only in the
spectral region of proteins and nucleic acids regions, from 1800 to 900 cm-1
. The molecular maps
were created from these spectra by plotting different spectral parameters, such as intensities peaks
ratio, as a function of x-y pixel position.
2.5 Data pre-processing for image analysis and statistical analysis
The resulting FT-IR images were pre-processed by different sofwares (OPUS 6.5, OriginPro 8.0,
Mathematica 7.0) and were analysed in proteins and nucleic acids regions (1800-900 cm-1
). To
remove poor quality spectra, the data sets were subjected to a quality test such as Signal-to-Noise
ratio (S/N) and statistical test such as Principal Component Analysis (PCA).
In the (S/N) test, the signal S in each of the 4096 pixels was evaluated as the maximum in the
frequency region of the Amide I band (1595-1800 cm-1
), while the noise N was calculated as the
standard deviation (RMS) in the spectral range 1800-1900 cm-1
.
In order to identify poor quality pixels, those with a Signal-to-Noise ratio S/N smaller than 100
were labeled as bad pixels and the corresponding spectra, bad spectra.
The threshold set at 100 was chosen in accordance to [9]. The number of bad spectra inside a map is
denoted with Nbs. The maps having more than 1000 bad pixels have been discarded. This
acceptance threshold for the number of bad pixels was determined by noting that the dispersion of
the spectroscopic parameter R1 (defined later) around the mean value increased significantly for Nbs
> 1000. In particular, bad spectra tend to populate the low-R1 tail of the distribution, that is thus
significantly skewed towards the left for large values of Nbs. On the contrary, the R1 distribution of
good spectra tends to be Gaussian.
We also show how poor spectra can be singled out using PCA. PCA is a multivariate method
where a complex data set containing P (each spectrum of a single map) different sets of Y variables
(the absorbance at wavenumbers from 1800 to 900 cm-1
) is transformed into a smaller set of new
indipendent variables or principal components (PCs), which maximise the variance of the original
data set and are actually unrelated (whereas the original, untransformed variables may have been
correlated to some extent).
Therefore, the new reference system identified by the PCs is expressed as a linear combination of
the original data set. PCs are computed hierarchically, with the first PC (PC1) accounting for the
maximum amount of variance and the others for the subsequent maximum residual variance. The
coordinates of the spectra in the new reference system are called scores and the coefficients of the
linear combination describing each PC, i.e. the weights of the original variables on each PC, are
called loadings.
Di Giambattista L. et al - Biophys. & Bioeng. Letters (2009), Vol 2, Nr 2
After the data pre-processing on the quality of FT-IR maps, a second statistical test known as
Hierarchical Cluster Analysis (HCA), was introduced to evaluate the chemical similarity between
control and sonicated maps of cellular samples; we have extracted the average spectrum of each
map for control and sonicated cells, and then the average spectrum was processed with a baseline,
smooth and vector normalization at Amide I as described in section 2.4.
To calculate the inter-spectral distance or similarity distance (H) is used the squared euclidean
distance while the intra-cluster heterogeneity or cluster method (h) is assessed by Ward's minimum-
variance (OPUS 6.5 software).
In the analysis of FT-IR spectroscopic data combined with cytogenetic-results, we have introduced
the Fisher statistical test (F-test), which allows to establish if any linear correlation exists between
any two variables of the pool.
Finally, the statistical significance in the CBMN assay was evaluated by Dunnet’s test.
2.6 Cytokinesis-block micronucleus (CBMN) assay
The control and sonicated cellular samples were treated with 6 µg/ml cytochalasin B. The cells were
sampled 24 h after addition of cytochalasin B by centrifugation for 5 min; then, hypotonic treatment
consisted of careful resuspension of the cellular samples in 5 ml hypotonic saline (75 mM KCl).
Immediately after addition of hypotonic solution, the cells were collected and they fixed in
Carnoy's fixative (3:1 methanol / acetic acid).
Finally, the cells were transferred onto pre-cleaned slides and were stained with 10 µg/ml of 4’-6’-
diamidino-2-phenylindole (DAPI) in antifade solution (Vector Laboratories).
For each concentration of a test compound 500 binucleated cells (BNC) were evaluated.
Finally, the Nuclear Division Index (NDI), a parameter of cellular mitogen response and
cytogenetic effect of US, was evaluated for each sample according to Eastmond and Tucker (1989):
N
MMMMNDI
)]4(4)3(3)2(21[ +++=
where M1, M2, M3, M4 indicate the number of mono-, bi-, tri- and quadrinucleate cells and N is the
total number of counted viable cells. For the scoring of micronuclei the following criteria were
adopted from Fenech et al. (2003).
3. Results and Discussion
3.1 Spectra pre-processing
From the results of the S/N quality test, we have established the number of bad spectra and have
evaluated their weight in each data set.
We report, as an example, the distribution of S/N values in two maps, one of the control cells and
one of the sonicated cells (SON45_15), that has shown a larger number of bad spectra (Figure 2).

Di Giambattista L. et al - Biophys. & Bioeng. Letters (2009), Vol 2, Nr 2
Figure 2. Distribution of the S/N ratio vs. Pixel (0-4096): on the left, control cells (4051 good
spectra and 44 bad spectra), and on the right, sonicated cells for 45 minutes at 15 cm (3344 good
spectra and 752 bad spectra).
By Figure 2, we extract a histogram where we also visualize the total number of pixels of the map
for control and sonicated (SON45_15) cells corresponding to the values of S/N ratio.
Figure 3. The total number of Pixels corresponding to S/N values: on the left, control cells and on
the right, sonicated cells for 45 minutes at 15 cm; the good spectra are shown in blue and the bad
spectra are shown in red.
We have not discarded the FT-IR maps with Nbs<1000 to monitor the presence of major number of
empty spaces due to the US that perturbed the spatial cellular distribution on the slide forming the
islands of cellular monolayers.
As shown in Figure 4, we have compared the number of bad spectra vs. time of FT-IR maps
between the control and sonicated cells at two distances from the US source.

Di Giambattista L. et al - Biophys. & Bioeng. Letters (2009), Vol 2, Nr 2
0 10 20 30 40 50 60
0
100
200
300
400
500
600
700
800
900
1000
Time[min]
Nbs
Maps 10cm
0 10 20 30 40 50 60
0
100
200
300
400
500
600
700
800
900
1000
Maps 15cm
Nbs
Time[min]
Figure 4. The number of bad spectra (Nbs) vs. time of US exposure within the maps reported at the
10 and 15 cm from the US source.
Using the PCA statistical tool, large spectral data were reduced into a small number of indipendent
variables known as principal components (PC1, PC2, PC3 etc.); contributions of these components
to a given spectra are called scores.
The score of the principal components is one of the parameters widely used for classification. In
this research, we have employed PCA method to discriminate poor quality spectra from good
quality ones within the FT-IR maps.
The PCA eigenvalue plot (data not reported) has shown that the PCs which have the most
significant information, were only the first and second principal component (PC1, PC2) for all
spectra in the FT-IR maps.
In Figure 5, we have reported an example of PCA results where the information due to the CTR
map and SON45_15 map is compressed in the first and second principal component of PCA (see the
percentages of the variance in the caption of Figure 5).
The PCA analysis of SON45_15 map shows as the majority of the bad spectra (red points) were
distributed towards the negative values of PC2 and were dissimilar from the good spectra (black
points); in the CTR map, the bad spectra (red points) were similar between them and were
distribuited as the good spectra (black points) towards the positive value of PC1.

Di Giambattista L. et al - Biophys. & Bioeng. Letters (2009), Vol 2, Nr 2
Figure 5. The PCA results (black points=good spectra; red points=bad spectra) obtained for CTR
(top) and SON45_15 (bottom) FT-IR map. In the CTR sample, the values of PC1 and PC2 are
69.6% and 16.2%, respectively; in the SON45_15 sample, PCs values are different from CTR
sample (PC1=79.7% and PC2=11.1%).
3.2 CBMN assay
Using the cytogenetic test, we have found that the sonicated cells have reported a micronuclei
frequency higher than the control cells at both distances.
As described in Figure 6, we have observed a statistically significant value (p = 0.045) only for the
sonicated cells for 60 minutes at 15 cm.

Di Giambattista L. et al - Biophys. & Bioeng. Letters (2009), Vol 2, Nr 2
0 10 20 30 40 50 60
0
1
2
3
4
5
6
MN
C/5
00
BN
C
Time[min]
CBMN assay (15cm) *
0 10 20 30 40 50 60
1.56
1.58
1.60
1.62
1.64
1.66
ND
I pa
ram
ete
r
Time[min]
CBMN assay (15cm)
Figure 6. On the left, the histogram describes the value of micronucleated cells (MNC) / 500
binucleated (BNC) cells for control and sonicated cells at 15 cm from the source; significance
compared to controls: *p < 0.045. On the right, the histogram shows the NDI parameter vs. time;
no significant differences are discovered.
Finally, no significant differences between the control and sonicated cells for the values of NDI
parameter were detected for both distances.
3.3 FTIR Spectral Imaging
FTIR spectral imaging enables the determination of the distribution of several molecules of interest;
we have studied the chemical map and the average spectrum due to the FT-IR imaging through the
analysis of a spectroscopic parameter belonging to the proteins and nucleic acids regions (1800-900
cm-1
):
� I
I
A
AR
2
11 =
where AnI (n=1,2) parameters indicate the intensity of Amide I and Amide II peaks respectively and
finally, the R1 parameter indicates the ratio due to the intensity of Amide I and Amide II peaks.
The intensities of IR peaks provide quantitative analysis about sample contents, depending on the
nature of molecular structure, their bonds, and their environment. The Amide I (A1) and Amide II
(A2) bands are centered in the control spectrum at 1653 cm-1
and 1543 cm-1
respectively. The shape
of the Amide I band is influenced by the overall composition in the secondary structure of the
samples; the relative contributions fall in the following spectral regions: α-helix between 1645-1662
cm-1
, β-sheets between 1613-1637 cm-1
, β-turns between 1662-1682 cm-1
and random coil between
1637-1645 cm-1
.
Before showing the R1 parameter analysis, we have applied the Hierarchical Cluster Analysis
method to investigate the relationships among spectra for all samples in the spectral range (1800-
900 cm-1
) at both distances from the US source.
Through this statistical test, the average spectrum extracted from the control and sonicated maps
was classified within their respective type cluster according to biochemical similarities.
As described in Figure 7, the maximum heterogeneity level in the proteins and nucleic acids regions
was H=1.38 at 15 cm distance; while the maximum heterogeneity within clusters was h=0.14 at
both distances.

Di Giambattista L. et al - Biophys. & Bioeng. Letters (2009), Vol 2, Nr 2
Figure 7. HCA results show the cluster members according to the biochemical similarities for
proteins and nucleic acids regions at 10 and 15 cm from the US source.
The spectral comparison through HCA test is consistent with the results of S/N quality test and
PCA analysis obtained from the FT-IR maps; HCA results were also confirmed by the analysis of
R1 parameter for all the average spectra.
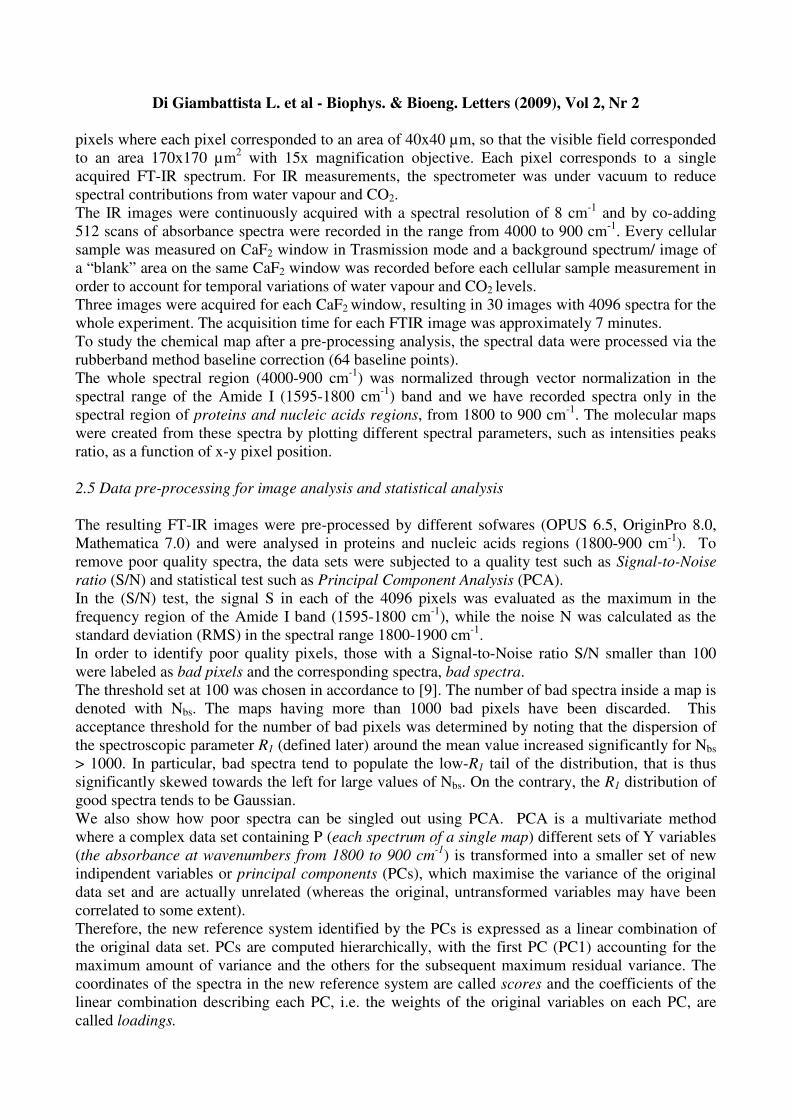
As shown in Figure 8, we have analysed the Amide I / Amide II (parameterI
I
A
AR
2
11 = ) intensity
ratio that represents an indirect measure of DNA content, due to the carbonyl group from the bases
and the spectral changes in the range of 1245-960 cm-1
that suggests conformational changes and/or
rearrangement of existing nucleic acid structures [14].
HCA Proteins and Nucleic Acids Regions 10cm H=0.45, h= 0.14
HCA Proteins and Nucleic Acids Regions 15cm H=1.38, h= 0.14
Di Giambattista L. et al - Biophys. & Bioeng. Letters (2009), Vol 2, Nr 2
0 10 20 30 40 50 60
0.8
1.0
1.2
1.4
1.6
1.8
2.0
2.2
2.4
2.6
2.8
3.0
3.2
3.4
R1
Time[min]
R2 from chemical map at 10 cm
R2 from average spectrum at 10 cm
0 10 20 30 40 50 60
1.0
1.2
1.4
1.6
1.8
2.0
2.2
2.4
2.6
2.8
3.0
3.2
3.4
R1
Time[min]
R1 from chemical map at 15 cm
R1 from average spectrum at 15 cm
Figure 8. Amide I / Amide II intensity ratio vs. time of US exposure at 10 cm (top) and 15 cm
(bottom) from chemical map and average spectrum is reported, showing small differences between
the values of chemical map with those of average spectrum.
The DNA content is detectable by IR spectroscopy mainly when the cells are in the S phase of the
cell cycle because the DNA is so tightly packed in the nucleus in the G1 and G2 phases that it
appears opaque to IR radiation [15-18].
Assuming that the cells are into the S phase, the small spectral changes in R1 ratio, observed in our
experiments and confirmed by HCA for the proteins and nucleic acids regions, could correspond to
a better detection of DNA content.
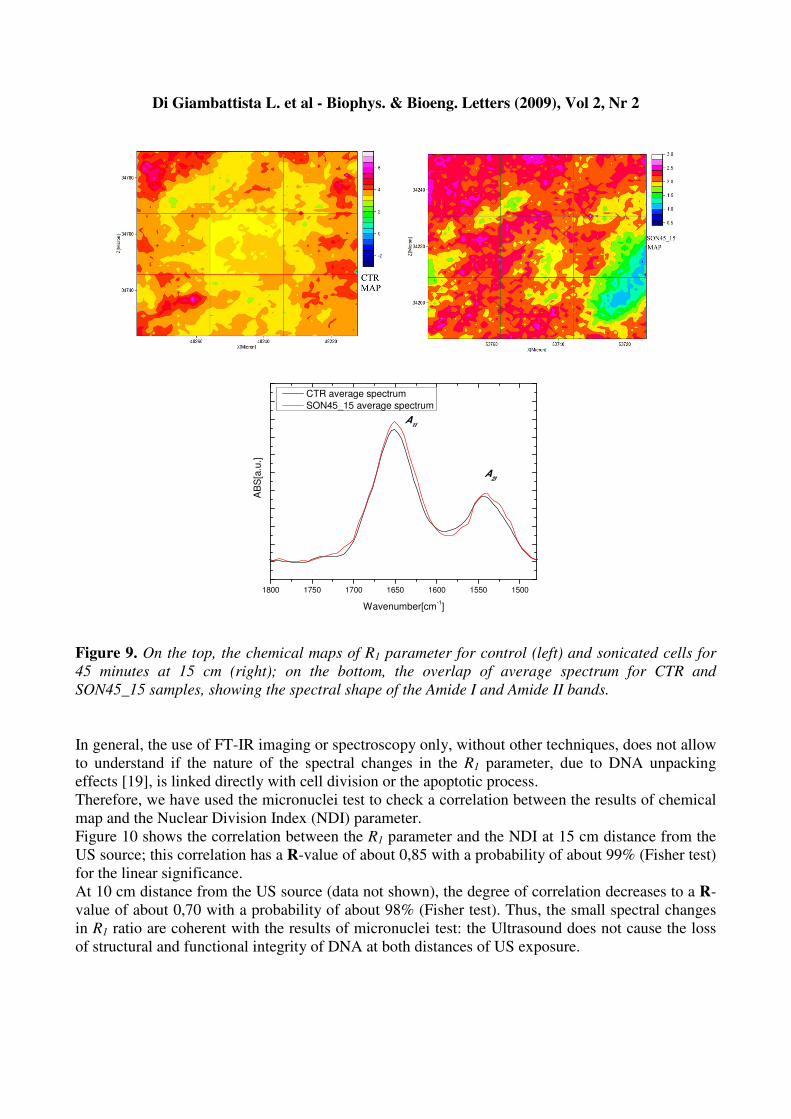
In the following Figure 9, we have reported the comparison between the chemical maps of R1
parameter for CTR and SON45_15 sample, where it is present a considerable difference between the
number of bad spectra; moreover, the spectral profiles of CTR and SON45_15 average spectrum were
compared.
Di Giambattista L. et al - Biophys. & Bioeng. Letters (2009), Vol 2, Nr 2
1800 1750 1700 1650 1600 1550 1500
A2I
AB
S[a
.u.]
Wavenumber[cm-1]
CTR average spectrum
SON45_15 average spectrum
A1I
Figure 9. On the top, the chemical maps of R1 parameter for control (left) and sonicated cells for
45 minutes at 15 cm (right); on the bottom, the overlap of average spectrum for CTR and
SON45_15 samples, showing the spectral shape of the Amide I and Amide II bands.
In general, the use of FT-IR imaging or spectroscopy only, without other techniques, does not allow
to understand if the nature of the spectral changes in the R1 parameter, due to DNA unpacking
effects [19], is linked directly with cell division or the apoptotic process.
Therefore, we have used the micronuclei test to check a correlation between the results of chemical
map and the Nuclear Division Index (NDI) parameter.
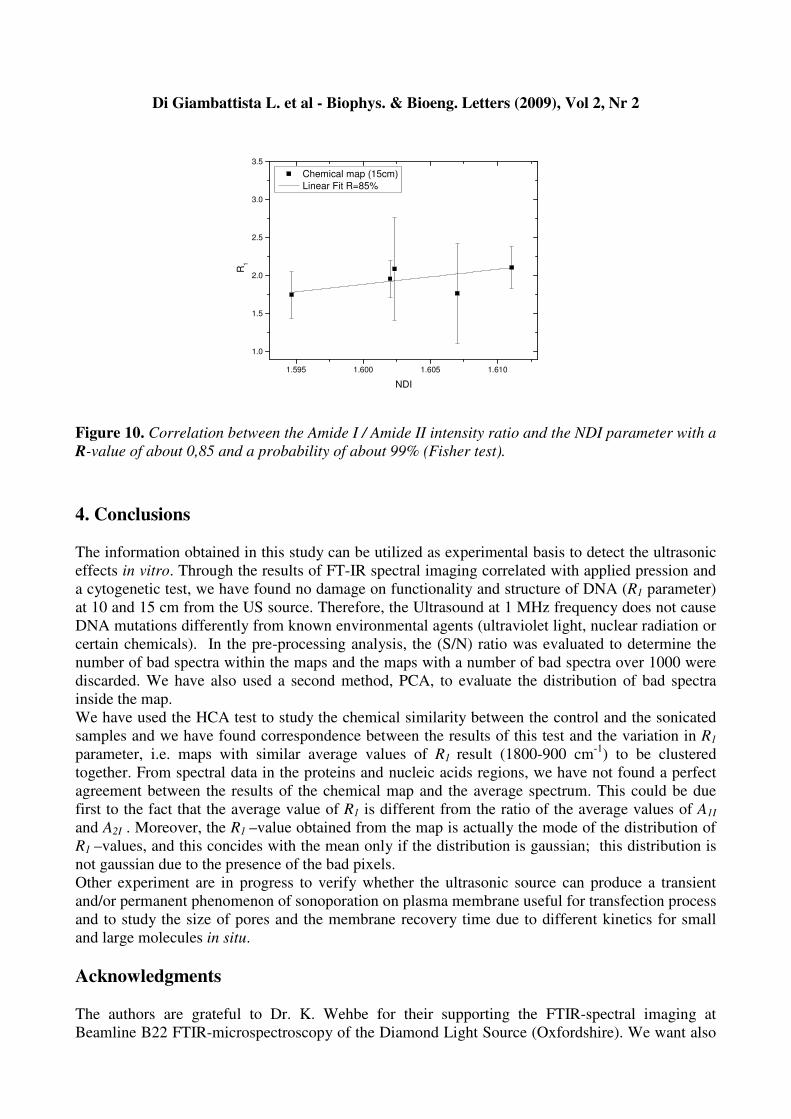
Figure 10 shows the correlation between the R1 parameter and the NDI at 15 cm distance from the
US source; this correlation has a R-value of about 0,85 with a probability of about 99% (Fisher test)
for the linear significance.
At 10 cm distance from the US source (data not shown), the degree of correlation decreases to a R-
value of about 0,70 with a probability of about 98% (Fisher test). Thus, the small spectral changes
in R1 ratio are coherent with the results of micronuclei test: the Ultrasound does not cause the loss
of structural and functional integrity of DNA at both distances of US exposure.
Di Giambattista L. et al - Biophys. & Bioeng. Letters (2009), Vol 2, Nr 2
1.595 1.600 1.605 1.610
1.0
1.5
2.0
2.5
3.0
3.5
Chemical map (15cm)
Linear Fit R=85%
R1
NDI
Figure 10. Correlation between the Amide I / Amide II intensity ratio and the NDI parameter with a
R-value of about 0,85 and a probability of about 99% (Fisher test).
4. Conclusions
The information obtained in this study can be utilized as experimental basis to detect the ultrasonic
effects in vitro. Through the results of FT-IR spectral imaging correlated with applied pression and
a cytogenetic test, we have found no damage on functionality and structure of DNA (R1 parameter)
at 10 and 15 cm from the US source. Therefore, the Ultrasound at 1 MHz frequency does not cause
DNA mutations differently from known environmental agents (ultraviolet light, nuclear radiation or
certain chemicals). In the pre-processing analysis, the (S/N) ratio was evaluated to determine the
number of bad spectra within the maps and the maps with a number of bad spectra over 1000 were
discarded. We have also used a second method, PCA, to evaluate the distribution of bad spectra
inside the map.
We have used the HCA test to study the chemical similarity between the control and the sonicated
samples and we have found correspondence between the results of this test and the variation in R1
parameter, i.e. maps with similar average values of R1 result (1800-900 cm-1
) to be clustered
together. From spectral data in the proteins and nucleic acids regions, we have not found a perfect
agreement between the results of the chemical map and the average spectrum. This could be due
first to the fact that the average value of R1 is different from the ratio of the average values of A1I
and A2I . Moreover, the R1 –value obtained from the map is actually the mode of the distribution of
R1 –values, and this concides with the mean only if the distribution is gaussian; this distribution is
not gaussian due to the presence of the bad pixels.
Other experiment are in progress to verify whether the ultrasonic source can produce a transient
and/or permanent phenomenon of sonoporation on plasma membrane useful for transfection process
and to study the size of pores and the membrane recovery time due to different kinetics for small
and large molecules in situ.
Acknowledgments
The authors are grateful to Dr. K. Wehbe for their supporting the FTIR-spectral imaging at
Beamline B22 FTIR-microspectroscopy of the Diamond Light Source (Oxfordshire). We want also
to thank Dr. S. Gaudenzi, Dr. A. Bedini, Dr. C. Giliberti and Dr. R. Palomba for discussions and
help in the experiments. Finally, we are grateful to Dr. M. Lattanzi for his assistance with
Mathematica software and Dr. S. Belardinelli for his assistance in the laboratory experiments.
REFERENCES
1. Newman C.M., Lawrie A., Brisken A.F., Cumberland D.C. Ultrasound gene therapy: On the road from concept
to reality.
Echocardiography 2001 (18):339–347.
2. Bao S., Thrall B.D., Miller D.L. Transfection of a reporter plasmid into cultured cells by sonoporation in vitro.
Ultrasound Med. Biol., 1997 (23):953–959.
3. Greenleaf W.J., Bolander M.E., Sarkar G., Goldring M.B., Greenleaf J.F., Artificial cavitation nuclei
significantly enhance acoustically induced cell transfection.
Ultrasound Med. Biol., 1998 (24):587–595.
4. Koch S., Pohl P., Cobet U., Rainov N.G., Ultrasound enhancement of liposome-mediated cell transfection is
caused by cavitation effects.
Ultrasound Med. Biol., 2000 (26):897–903.
5. Chun-Yen L., Chia-Hsuan W., Chia-Chun C. and Pai-Chi L., Quantitative realtions of acoustic inertial
caviatation with sonoporation and cell viability.
Ultrasound Med. Biol., 2006 (32):1931–1941.
6. Lasch P., Naumann D., FT-IR microspectroscopic imaging of human carcinoma thin sections based on pattern
recognition techniques.
Cell. Mol. Biol., 1998 (44):189–202.
7. Kohler A. , Bertrand D., Martens H., Hannesson K., Kirschner C., Ofstad R., Multivariate image analysis of a
set of FTIR microspectroscopy images of aged bovine muscle tissue combining image and design information.
Anal. Bioanal. Chem., 2007 (389):1143–1153.
8. Lewin P.A., Lypacewicz G., Bautista R., Devaraju V., Sensitivity of ultrasonic hydrophone probes below 1
MHz.
Ultrasonics, 2000 (38):135–139.
9. Griffiths P.R., De Haseth J.A., Fourier Transform infrared spectrometry, John Wiley and Sons, NY, 1986.
10. Eastmond D.A., Tucker J.D., Identification of aneuploidy-inducing agents using cytokinesis-blocked human
lymphocytes and anti-kinetochore antibody.
Environ. Mol. Mutagen., 1989 (13): 34-43.
11. Fenech M., Chang W.P., Kirsch-Volders M., Holland N., Bonassi S., Zeiger E., HUman MicronNucleus
project. HUMN project: detailed description of the scoring criteria for the cytokinesis-block micronucleus
assay using isolated human lymphocyte cultures.
Mutat. Res., 2003 (534):65-75.
12. Zwaal R. F.A., J. Schroit A., Pathophysiologic implications of membrane phospholipid asymmetry in blood
cells.
Blood, the J. A. Soc. Hemat., 1997 (89):1121-1132.
13. Takashi K., Eiichi K., Effect of Free Radicals Induced by Ultrasonic Cavitation on Cell Killing.
Int. J. Rad. Biol., 1988 (54):475-486.
14. Benedetti E., Bramanti E., Rossi I., Determination of the relative amount of nucleic acids and proteins in
leukemic and normal lymphocytes by means of FT-IR microspectroscopy.
Appl. Spectrosc. 1997 (51):792-797.
15. Conti L., Grimaldi P., Udroiu I., Bedini A., Giliberti C., Palomba R., Congiu Castellano A., Effects induced in
cells by ultrasound revealed by ATR-FTIR spectroscopy.
Vibrat. Spectrosc., 2010 (52):79-84.
16. Diem M. S., Boydston S., Chiriboga L., Infrared spectroscopy of cells and tissues: shining light onto a novel
subject.
Appl. Spectrosc., 1999 (53):148A-161A.
17. Boydston-White S., Gopen T., Houser S., Bargonetti J., Diem M. S., Infrared spectroscopy of human tissue. V.
Infrared spectroscopic studies of myeloid leukemia (ML-1) cells at different phases of the cell cycle.
Biospectroscopy, 1999 (5):219-227.
18. Wang J. S., Shi J. S., Xu Y. Z., Duan X. Y., Zhang L., Wang J., Yang L. M., Weng S. F., Wu J. G., FT-IR
spectroscopic analysis of normal and cancerous tissues of esophagus.
World J. Gastroenterol, 2003 (9):1897-1899.
19. Gasparri F., Muzio M., Monitoring of apoptosis of HL60 cells by Fourier-transform infrared spectroscopy.
Biochem. J., 2003 (369):239-248.