Embed Size (px)
Citation preview
Atmospheric Environment 36 (2002) 5185–5196
FTIR measurements of functional groups and organic mass inaerosol samples over the Caribbean
Steven F. Mariaa, Lynn M. Russella,*, Barbara J. Turpinb, Robert J. Porcjab
aDepartment of Chemical Engineering, Princeton University, Princeton, NJ 08544, USAbDepartment of Environmental Science, Rutgers University, New Brunswick, NJ 08854, USA
Received 1 April 2002; accepted 3 August 2002
Abstract
An aircraft-based aerosol concentrator consisting of three virtual impactors in series has been used to collect particlesfor Fourier transform infrared (FTIR) transmission spectroscopy on stretched Teflon filters. Submicron atmosphericaerosol samples were collected near St. Croix aboard the National Center for Atmospheric Research C-130 aircraftduring the passing efficiency of a low-turbulence inlet project. FTIR identified sulfate, ammonium, silicate, and organicfunctional groups, and a four-solvent rinsing procedure separated these functional groups into fractions of increasinghygroscopicity. The Caribbean aerosols contained 0.01–1:6 mg m!3 of Si, indicative of African mineral dust at allaltitudes, with higher Al/Ca ratios in the boundary layer. Organic compounds were present in high and low dustconditions with estimated total organic mass varying from 0.8–4 mg m!3 during the project. Aliphatic carbon andcarbonyl carbon were quantified at concentrations of up to 4 and 0:8 mg m!3; respectively, and were summed tocalculate organic carbon and organic mass (OM) concentrations. Sequential solvent rinsing with repeated FTIRanalysis revealed that 60–90% of OM in the free troposphere was hygroscopic, with hydrophobic organic compoundsaccounting for 20–50% of OM in the marine boundary layer.r 2002 Elsevier Science Ltd. All rights reserved.
Keywords: Organic aerosol; Particle concentrator; Organic polarity; Organic solubility; Dust aerosol
1. Introduction
Organic vapors and products of their photochemicaloxidation form new particles or may condense onto pre-existing particles. Partly as a result of this vapor-to-particle conversion, the atmosphere contains aerosolparticles composed of complex mixtures of water-soluble inorganic salts, insoluble mineral dust, andcarbonaceous material. This carbonaceous fractionincludes organic compounds ranging from very solubleto insoluble, plus elemental carbon (Jacobson et al.,2000; Saxena and Hildemann, 1997).The solubility of the carbonaceous fraction affects the
hygroscopic growth and deliquescence behavior of
atmospheric particles (Ming and Russell, 2001). Com-monly used thermal organic carbon (OC) measurementsgive none of the information on organic functionalgroup composition that is required to estimate thiseffect. The resulting dearth of information may causegeneral circulation models to underestimate the organicparticles that serve as cloud condensation nuclei, leadingto underpredictions of OC wet deposition by factors of2–7 (Cooke et al., 1999). The calculation of aerosoloptical properties from compositional measurementsalso requires an estimate of OC hygroscopicity, asoptical properties depend on particle size. Uncertaintiesof up to 15% in the derived extinction coefficient and18% in the derived scattering coefficient have beenreported to be caused by the assumption that all OC ishydrophobic (Collins et al., 2000). These uncertaintiescan be particularly large in the free troposphere, where
*Corresponding author.E-mail address: [email protected] (L.M. Russell).
1352-2310/02/$ - see front matter r 2002 Elsevier Science Ltd. All rights reserved.PII: S 1 3 5 2 - 2 3 1 0 ( 0 2 ) 0 0 6 5 4 - 4
recent aircraft-based measurements found OC massfractions from 50–90% (Novakov et al., 1997).OC functional group composition and solubility
can be used to predict thermodynamic equilibriumbased on organic composition (Ming and Russell,2001). This work describes a new technique formeasuring concentrations and solubilities of organicfunctional groups (carbonyl and methyl) and inorganicions ðSO2!
4 ; NHþ4 ; SiO4!
4 Þ in submicron aerosol sam-ples collected from aircraft during the passing efficiencyof the low-turbulence inlet (PELTI) field project.
2. Experimental procedure
During the PELTI experiment in June of 2000,submicron aerosol samples were collected near St. Croixfrom the NCAR C-130 aircraft. A three-stage particleconcentrator (3SPC) consisting of three slit virtualimpactors (Sioutas et al., 1994) in series was used toincrease the concentration of the sample aerosol streamby up to a factor of 19 prior to collection on 37 mmstretched Teflon filters (Teflo 1 mm; Pall Corp., AnnArbor, MI). FTIR and XRF analysis allowed for theidentification of inorganic and organic functional groupsas well as elemental composition.
2.1. Particle concentrator
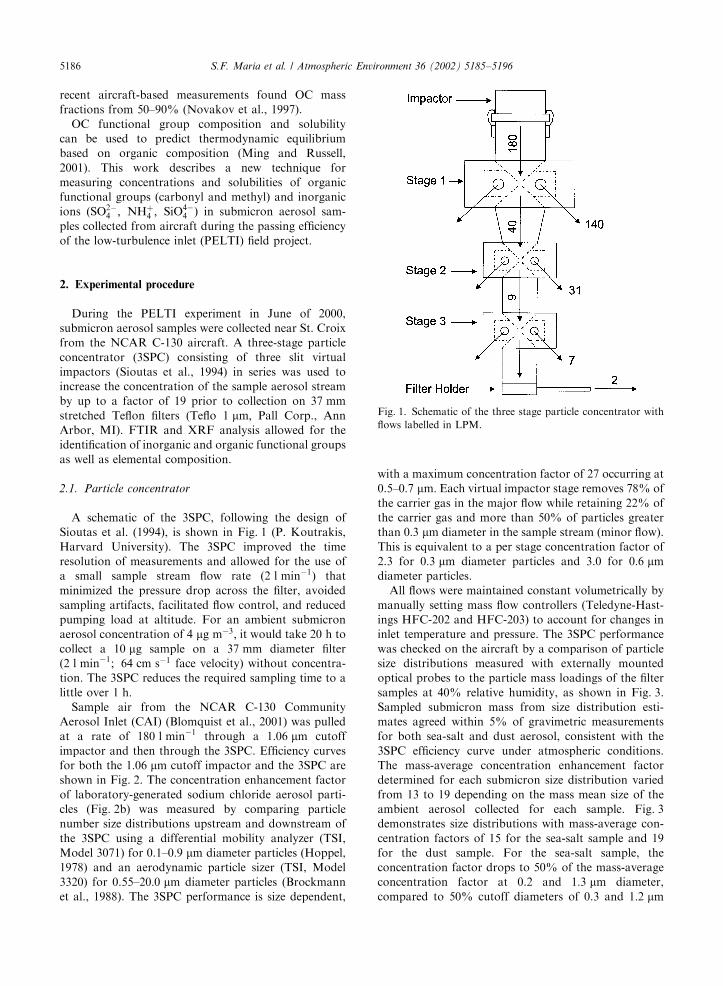
A schematic of the 3SPC, following the design ofSioutas et al. (1994), is shown in Fig. 1 (P. Koutrakis,Harvard University). The 3SPC improved the timeresolution of measurements and allowed for the use ofa small sample stream flow rate ð2 l min!1Þ thatminimized the pressure drop across the filter, avoidedsampling artifacts, facilitated flow control, and reducedpumping load at altitude. For an ambient submicronaerosol concentration of 4 mg m!3; it would take 20 h tocollect a 10 mg sample on a 37 mm diameter filter(2 l min!1; 64 cm s!1 face velocity) without concentra-tion. The 3SPC reduces the required sampling time to alittle over 1 h:Sample air from the NCAR C-130 Community
Aerosol Inlet (CAI) (Blomquist et al., 2001) was pulledat a rate of 180 l min!1 through a 1:06 mm cutoffimpactor and then through the 3SPC. Efficiency curvesfor both the 1:06 mm cutoff impactor and the 3SPC areshown in Fig. 2. The concentration enhancement factorof laboratory-generated sodium chloride aerosol parti-cles (Fig. 2b) was measured by comparing particlenumber size distributions upstream and downstream ofthe 3SPC using a differential mobility analyzer (TSI,Model 3071) for 0.1–0:9 mm diameter particles (Hoppel,1978) and an aerodynamic particle sizer (TSI, Model3320) for 0.55–20:0 mm diameter particles (Brockmannet al., 1988). The 3SPC performance is size dependent,
with a maximum concentration factor of 27 occurring at0.5–0:7 mm: Each virtual impactor stage removes 78% ofthe carrier gas in the major flow while retaining 22% ofthe carrier gas and more than 50% of particles greaterthan 0:3 mm diameter in the sample stream (minor flow).This is equivalent to a per stage concentration factor of2.3 for 0:3 mm diameter particles and 3.0 for 0:6 mmdiameter particles.All flows were maintained constant volumetrically by
manually setting mass flow controllers (Teledyne-Hast-ings HFC-202 and HFC-203) to account for changes ininlet temperature and pressure. The 3SPC performancewas checked on the aircraft by a comparison of particlesize distributions measured with externally mountedoptical probes to the particle mass loadings of the filtersamples at 40% relative humidity, as shown in Fig. 3.Sampled submicron mass from size distribution esti-mates agreed within 5% of gravimetric measurementsfor both sea-salt and dust aerosol, consistent with the3SPC efficiency curve under atmospheric conditions.The mass-average concentration enhancement factordetermined for each submicron size distribution variedfrom 13 to 19 depending on the mass mean size of theambient aerosol collected for each sample. Fig. 3demonstrates size distributions with mass-average con-centration factors of 15 for the sea-salt sample and 19for the dust sample. For the sea-salt sample, theconcentration factor drops to 50% of the mass-averageconcentration factor at 0.2 and 1:3 mm diameter,compared to 50% cutoff diameters of 0.3 and 1:2 mm
Fig. 1. Schematic of the three stage particle concentrator withflows labelled in LPM.
S.F. Maria et al. / Atmospheric Environment 36 (2002) 5185–51965186
for the dust sample. Uncertainties in the CAI inletefficiency and PCASP size distributions (Blomquist et al.,2001; Collins et al., 2000; Liu and Daum, 2000) add anapproximately 15% error to all calculated mass-averageconcentration factors.During the PELTI project, 30 filter samples and 88
blanks were collected for flight legs in the marineboundary layer and in free tropospheric air massesoriginating in Northern Africa. Flight legs ranged inlength from 20 to 145 min: Table 1 shows that nodetectable peaks were observed on any downstreamblanks, consistent with previous studies that did not findsignificant organic artifacts on Teflon filters (Turpinet al., 1994).
2.2. FTIR spectroscopy and rinsing procedure
Field samples were analyzed using a MattsonResearch Series 100 FTIR Spectrometer with a deuter-ated triglycine sulfate (DTGS) detector and a He–Nelaser. FTIR spectra were collected in transmission modefor each filter by averaging 200 absorbance scans atwavenumbers from 400 to 4000 cm!1 with a resolutionof 4 cm!1: Teflon filters were scanned prior to use, andthe resulting spectra were subtracted from scans aftersampling to obtain the absorbance of the sampledaerosol. Filter support rings were etched to ensure thatalignment was maintained during consecutive scans.Ammonium, carbonate, and many organic com-
pounds absorb radiation between 1420 and 1440 cm!1:To differentiate between overlapping peaks and tocharacterize the solubility of organic components, wecarried out sequential rinsing of each sample with
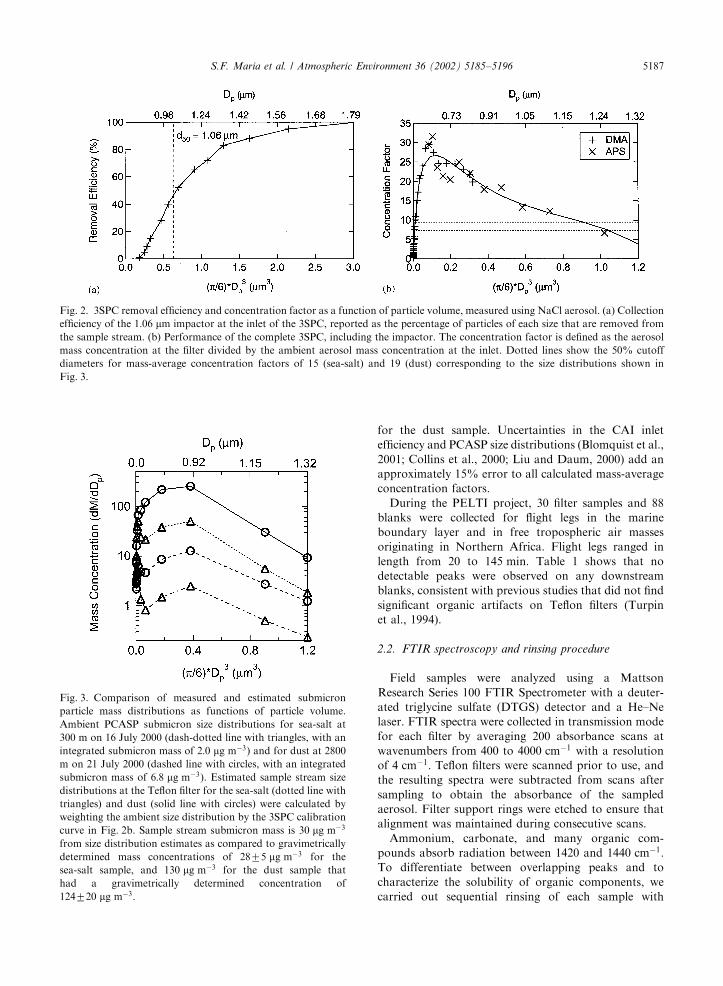
Fig. 2. 3SPC removal efficiency and concentration factor as a function of particle volume, measured using NaCl aerosol. (a) Collectionefficiency of the 1:06 mm impactor at the inlet of the 3SPC, reported as the percentage of particles of each size that are removed fromthe sample stream. (b) Performance of the complete 3SPC, including the impactor. The concentration factor is defined as the aerosolmass concentration at the filter divided by the ambient aerosol mass concentration at the inlet. Dotted lines show the 50% cutoffdiameters for mass-average concentration factors of 15 (sea-salt) and 19 (dust) corresponding to the size distributions shown inFig. 3.
Fig. 3. Comparison of measured and estimated submicronparticle mass distributions as functions of particle volume.Ambient PCASP submicron size distributions for sea-salt at300 m on 16 July 2000 (dash-dotted line with triangles, with anintegrated submicron mass of 2:0 mg m!3) and for dust at 2800m on 21 July 2000 (dashed line with circles, with an integratedsubmicron mass of 6:8 mg m!3). Estimated sample stream sizedistributions at the Teflon filter for the sea-salt (dotted line withtriangles) and dust (solid line with circles) were calculated byweighting the ambient size distribution by the 3SPC calibrationcurve in Fig. 2b. Sample stream submicron mass is 30 mg m!3
from size distribution estimates as compared to gravimetricallydetermined mass concentrations of 2875 mg m!3 for thesea-salt sample, and 130 mg m!3 for the dust sample thathad a gravimetrically determined concentration of124720 mg m!3:
S.F. Maria et al. / Atmospheric Environment 36 (2002) 5185–5196 5187

solvents of increasing polarity: hexane, dichloromethane(DCM), acetone, and water (Blando et al., 1998; Carltonet al., 1999). At 1420–1440 cm!1; the organic fraction isremoved in hexane, DCM or acetone while theammonium fraction is removed in water and the
carbonate fraction remains on the filter after all rinsingis complete.The rinsing method used 1 ml of each of the organic
solvents and 5 ml of water. Gentle vacuum flow wasused to pull the organic solvents across the filter as thesolvents were dropped onto the sample. The sampleswere rinsed with water by placing 5 ml of water on eachsample and allowing the water to sit for 1 min beforebeing poured off. The fractions removed in each stage ofthis solvent-rinsing procedure for laboratory-generatedsamples of magnesium silicate, ammonium sulfate,oxalic acid, citric acid, adipic acid, perinaphthenone, 1-docosanol, n-nonadecane, camphor, and anthracene areshown in Fig. 4.
2.3. XRF analysis
XRF was performed on the sample filters to quantifyelements heavier than sodium, including iron, silicon,sulfur, calcium, chlorine, and vanadium (Chester Lab-Net, Tigard, OR). XRF detection limits reflect thesignal-to-noise ratio for each element, and reportederrors include the detection limit plus a 5% calibrationuncertainty as well as spectral overlap uncertanitieswhen a secondary line from one element overlaps theprimary line from another element.
3. Mass quantification
GRAMS/32 software (Thermo Galactic, Salem, NH)was used to subtract pre-scans from post-scans, tocorrect for the scan-to-scan shift in the baselineabsorbance, and to integrate spectral peaks as shownin Fig. 5. Absorbance peaks associated with sulfate,ammonium, silicate, and aliphatic carbon were identifiedin the majority of samples.Fig. 6 shows spectra taken after each solvent rinse, in
addition to the difference in sequential rinses indicating
Table 1Absorbance of blanks and average project errors
Absorbance per filter FTIR XRF
Clean room Handling Downstream Min. detectable error (%) error (%)blanksa (70)b blanksc (9) blanksd (9) peak
SO2!4 0:07870:138 0:08370:102 0:07370:059 0.04 24713 23711
NHþ4 0:04770:079 0:05470:075 0:05170:040 0.05 26712 —
SiO4!4 0:02170:043 0:01970:032 0:02370:019 0.02 15714 1378
OC 0:18870:318 0:18870:243 0:18370:171 0.17 48720 —
aLoaded and stored in the on-site clean room, with one blank per sample filter and additional blanks for assessing variability.bNumber of each filter type is in parenthesis.cLoaded as samples but with no flow pulled through them.dPlaced behind sample filters during sampling in flight.
Fig. 4. Measured rinse removal characteristics of some typicalorganic and inorganic species in the atmosphere, with resultsfrom (a) pure species, (b) a mixture of ammonium sulfate,magnesium silicate, and nonadecane, and (c) a mixture ofammonium sulfate, oxalic acid, and anthracene. Bars represent(from left to right) the fraction remaining on the filter after allrinsing was completed (black) and the fractions removed inhexane (white), dichloromethane (striped), acetone (checkered),and water (grey). Error bars indicate uncertainty in the FTIRmeasurements. Numbers in parentheses indicate water solubi-lity in M, with the letter i indicating a water solubility of lessthan 5% 10!7 M:
S.F. Maria et al. / Atmospheric Environment 36 (2002) 5185–51965188
the fraction removed in each rinse. The sharp peaks at2850, 2920 and 2960 cm!1 in Fig. 6d and e reveal a clearC–H signature dominated by hydrophobic alkanes thatare removed by hexane. Carbonyl carbon ð1720 cm!1Þwas usually below detection because it was too smallto be clearly distinguished from water interference at1600–1700 cm!1:Ammonium interference was removed from the
aliphatic carbon absorbance measurement by scalingan ammonium sulfate reference spectrum to theammonium absorbance at 3238 cm!1 and then subtract-ing the ammonium reference spectrum before integra-tion of the aliphatic peaks. Up to 80% of the remainingabsorbance was removed in the hexane, DCM, andacetone rinses (with up to 40% removed in hexanealone), showing removal of hydrophobic compoundsthat cannot be attributed to interference from ammo-nium. Teflon interference also was removed from thesulfate peak at 618 cm!1 for each sample spectrumby scaled subtraction of the corresponding blankspectrum. The functional groups that were identifiedafter these corrections, along with their correspondingabsorption frequencies and detection limits, are shownin Table 2.
3.1. Functional group quantification
Linear relationships between mass and infraredabsorbance for ammonium and sulfate on Teflon filtershave been reported previously by McClenny et al.(1985). This technique quantifies moles of bonds fromabsorbance, using the measured absorption per mole of
each component from laboratory-generated standards.With our spectrometer, the absorbance of ammoniumsulfate, citric acid, adipic acid, and magnesium silicatevaried linearly with the number of moles of bonds andmass loading, independent of mixture composition, asshown in Fig. 7. For each standard a linear fit had acorrelation above R2 ¼ 0:88; with slopes in Table 2.Adipic and citric acid were used as model compoundsfor calibration because they are representative of themultifunctional acids that have been measured in
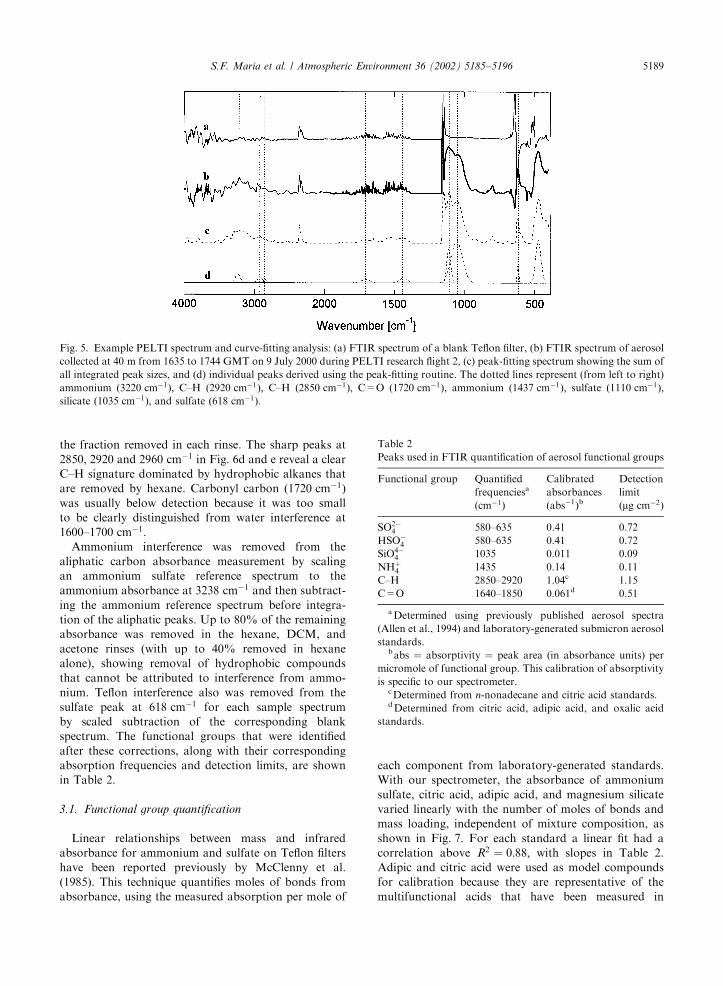
Fig. 5. Example PELTI spectrum and curve-fitting analysis: (a) FTIR spectrum of a blank Teflon filter, (b) FTIR spectrum of aerosolcollected at 40 m from 1635 to 1744 GMT on 9 July 2000 during PELTI research flight 2, (c) peak-fitting spectrum showing the sum ofall integrated peak sizes, and (d) individual peaks derived using the peak-fitting routine. The dotted lines represent (from left to right)ammonium ð3220 cm!1Þ; C–H ð2920 cm!1Þ; C–H ð2850 cm!1Þ; C=O ð1720 cm!1Þ; ammonium ð1437 cm!1Þ; sulfate ð1110 cm!1Þ;silicate ð1035 cm!1Þ; and sulfate ð618 cm!1Þ:
Table 2Peaks used in FTIR quantification of aerosol functional groups
Functional group Quantified Calibrated Detectionfrequenciesa absorbances limitðcm!1Þ ðabs!1Þb ðmg cm!2Þ
SO2!4 580–635 0.41 0.72
HSO!4 580–635 0.41 0.72
SiO4!4 1035 0.011 0.09
NHþ4 1435 0.14 0.11
C–H 2850–2920 1.04c 1.15C=O 1640–1850 0.061d 0.51
aDetermined using previously published aerosol spectra(Allen et al., 1994) and laboratory-generated submicron aerosolstandards.
babs ¼ absorptivity ¼ peak area (in absorbance units) permicromole of functional group. This calibration of absorptivityis specific to our spectrometer.
cDetermined from n-nonadecane and citric acid standards.dDetermined from citric acid, adipic acid, and oxalic acid
standards.
S.F. Maria et al. / Atmospheric Environment 36 (2002) 5185–5196 5189

ambient fine aerosols in marine conditions (Duce et al.,1983). Two multi-component mixtures were alsochecked to see if cross-compound interactions would
cause non-linearities in the absorbance signal. Nochanges in absorptivity were seen in the mixtures asillustrated in Fig. 7.
Fig. 6. Details of PELTI spectra and their changes with rinsing: (a) a sulfate peak at 1100 cm!1 (overlapping with quartz and silicateabsorbances), a silicate peak at 1034 cm!1; and an unidentified peak at 800 cm!1; (b), (c) characteristic C–H absorbances; (d), (e)difference spectra showing the absorbance removed in each solvent rinse. Figs. (a), (b), and (d) are for the 40 m sample of Fig. 5, while(c) and (e) are for a 6000 m free tropospheric sample collected on 23 July 2000 at 1622–1831 GMT: In panels (a)–(c) the original samplespectrum is shown as a bold solid line, the spectra after rinsing with hexane as a thin solid line, dichloromethane as a dotted line,acetone as a dashed line, and water as a dot–dashed line, and the corresponding blank spectrum as a thick dotted line. In panels (b) and(c) the spectrum after correcting for ammonium interference is shown as a bold dash–dotted line. In panels (d) and (e) spectra removedby each solvent are shown (hexane as a thin solid line, dichloromethane as a dotted line, acetone as a dashed line, and water as a dot-dashed line), and the corresponding blank spectrum is shown as a thick dotted line.
S.F. Maria et al. / Atmospheric Environment 36 (2002) 5185–51965190
Two estimates were used to quantify the range anduncertainty for these measurements: (1) twice thestandard deviation of the absorption values associatedwith blank filters, accounting for spectral noise as well ascontamination associated with filter preparation andhandling, and (2) a visual determination of the minimumpeak size that could be distinguished from spectral noise.The larger of the two quantities was used as thedetection limit and error for each functional group, aslisted in Table 1. For 1 h concentrated filter samples,FTIR errors are smaller than 20% for ambient sulfateconcentrations greater than 0:45 mg m!3; for ammoniumloadings greater than 0:07 mg m!3; and for aliphaticcarbon loadings greater than 0:72 mg m!3:FTIR sulfate and XRF S are weakly correlated with
R2 ¼ 0:42: The presence of non-sulfate sulfur containedin organosulfur compounds is indicated by hexane-soluble absorbance peaks at 800 cm!1 (consistent withmethane sulfonic acid (MSA)) that are present in mostof the samples in which the XRF S exceeded the FTIRsulfate S. XRF Si measurements were consistentlyhigher than FTIR silicate Si. To explain this, the 1090and 1010 cm!1 peaks after water rinsing were used to
identify absorbances associated with insoluble quartzand kaolinite species. The resulting total of all Si speciesfrom FTIR correlates weakly with the XRF Si withR2 ¼ 0:44; and the slope of 1.8 indicates that some Si-containing species are present that were not detected byFTIR.The average error in the FTIR data quantified by this
direct calibration was less than that of the ratio method(Cliff and Lorimer, 1972; Blando et al., 2001) by a factorof two, because the error in the ratio method includesthe uncertainties of our calibrated FTIR absorbanceratios and the XRF measurements as well as thecomparability of XRF-measured S or Si with FTIR-measured S or Si. The presence of significant non-sulfate sulfur and non-silicate silicon (in the form ofMSA, quartz, and kaolinite, as discussed above) madeuse of sulfate or silicate as an internal standardinappropriate. The ratio method had errors of 52–93%whereas the FTIR direct calibration method averageerror was 31%.
3.2. Organic mass estimates
OC mass and total organic mass (OM) were estimatedassuming that there were two moles of C–H bonds permole of aliphatic carbon and one mole of CQO bondsper carbonyl carbon:
OC ¼ ð0:5% ½moles C2H( % ½12 g mol!1(Þ
þ ð½moles CQO( % ½12 g mol!1(Þ; ð1Þ
OM ¼ð0:5% ½moles C2H( % ½14 g mol!1(Þ
þ ð½moles CQO( % ½28 g mol!1(Þ: ð2Þ
As defined, OC includes carbon mass only and OMincludes carbon, hydrogen, and oxygen. This definitionis equivalent to a carbon mass to organic compoundmass conversion factor of 1.2 for aliphatic carbon and2.3 for carbonyl carbon. These conversion factors spanthe range suggested by Turpin and Lim (2001).The aliphatic carbon conversion factor assumes that
all C–H is in the form CH2; an assumption with an errorof less than 12% if the average organic molecule size is asaturated carbon chain of four or more carbons. Thisassumption is appropriate for long-chain condensedorganic compounds measured in the atmosphere bychromatography (Matsumoto and Hanya, 1980). Toquantify the maximum error in this assumption, weconsider an extremely polluted organic aerosol in which25% of OC is in the form of oxalic acid (with mass-to-carbon ratio of 3:8 g gC!1) and the remaining 75% ofOC is a more typical urban organic composition (withmass-to-carbon ratio of 1:6 g gC!1), resulting in anactual mass-to-carbon ratio in the mixture of 2:2 g gC!1:The FTIR method using Eq. (2) underestimates OM by17% to give an effective mass-to-carbon ratio of
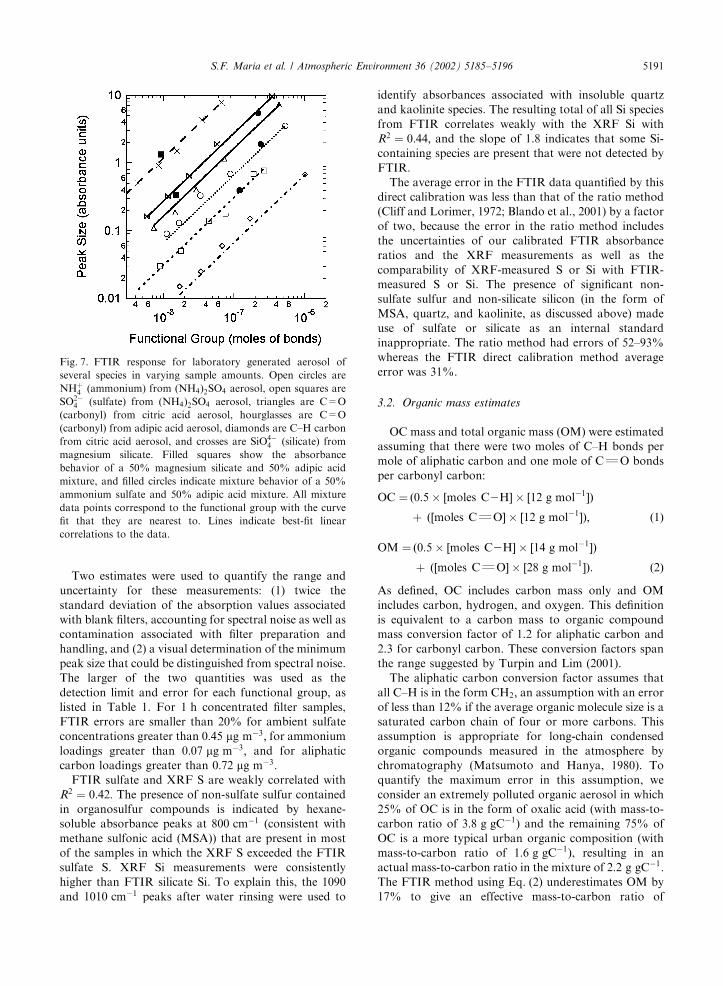
Fig. 7. FTIR response for laboratory generated aerosol ofseveral species in varying sample amounts. Open circles areNHþ
4 (ammonium) from ðNH4Þ2SO4 aerosol, open squares areSO2!
4 (sulfate) from ðNH4Þ2SO4 aerosol, triangles are C=O(carbonyl) from citric acid aerosol, hourglasses are C=O(carbonyl) from adipic acid aerosol, diamonds are C–H carbonfrom citric acid aerosol, and crosses are SiO4!
4 (silicate) frommagnesium silicate. Filled squares show the absorbancebehavior of a 50% magnesium silicate and 50% adipic acidmixture, and filled circles indicate mixture behavior of a 50%ammonium sulfate and 50% adipic acid mixture. All mixturedata points correspond to the functional group with the curvefit that they are nearest to. Lines indicate best-fit linearcorrelations to the data.
S.F. Maria et al. / Atmospheric Environment 36 (2002) 5185–5196 5191
1:8 g gC!1; whereas the ‘‘urban aerosol’’ 1.6 mass-to-carbon ratio of Turpin and Lim (2001) underpredicts by26%.The presence of organonitrates, organosulfates or
alcohols would result in an underestimate of organiccompound mass. However, nitrogen-containing organicfunctional groups were not identified in any PELTIsamples and are not a large component of marineaerosol (Chester and Stoner, 1974). MSA and alcoholsare also minor marine aerosol components, representingo5% of the identified organic carbon. We therefore donot expect any significant OM underestimates for thePELTI project.
4. Discussion
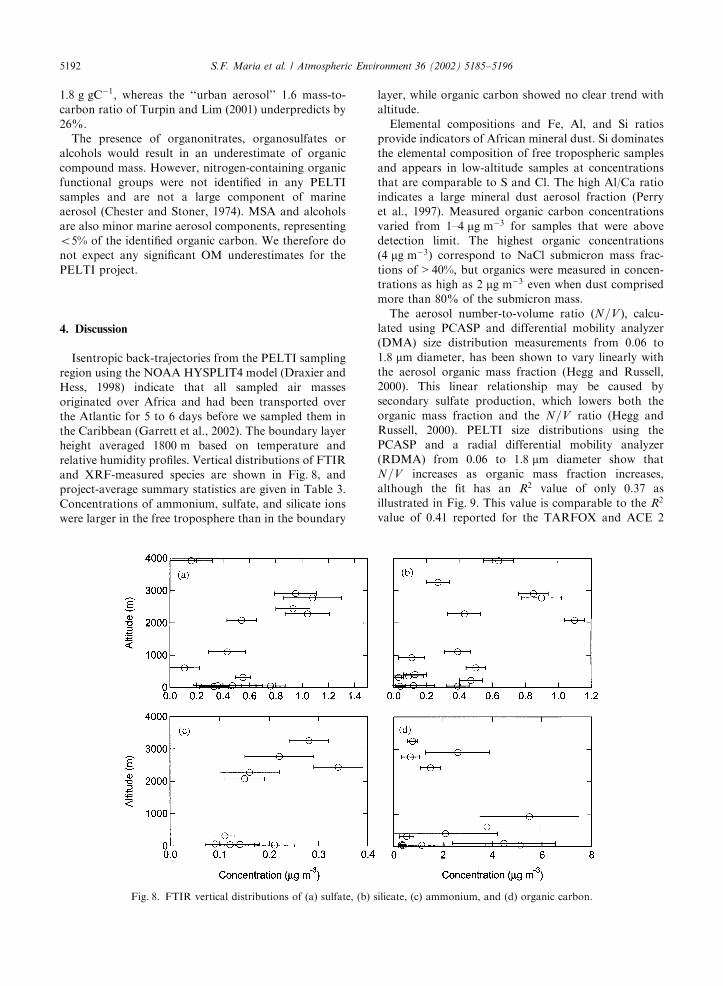
Isentropic back-trajectories from the PELTI samplingregion using the NOAA HYSPLIT4 model (Draxier andHess, 1998) indicate that all sampled air massesoriginated over Africa and had been transported overthe Atlantic for 5 to 6 days before we sampled them inthe Caribbean (Garrett et al., 2002). The boundary layerheight averaged 1800 m based on temperature andrelative humidity profiles. Vertical distributions of FTIRand XRF-measured species are shown in Fig. 8, andproject-average summary statistics are given in Table 3.Concentrations of ammonium, sulfate, and silicate ionswere larger in the free troposphere than in the boundary
layer, while organic carbon showed no clear trend withaltitude.Elemental compositions and Fe, Al, and Si ratios
provide indicators of African mineral dust. Si dominatesthe elemental composition of free tropospheric samplesand appears in low-altitude samples at concentrationsthat are comparable to S and Cl. The high Al/Ca ratioindicates a large mineral dust aerosol fraction (Perryet al., 1997). Measured organic carbon concentrationsvaried from 1–4 mg m!3 for samples that were abovedetection limit. The highest organic concentrationsð4 mg m!3Þ correspond to NaCl submicron mass frac-tions of > 40%; but organics were measured in concen-trations as high as 2 mg m!3 even when dust comprisedmore than 80% of the submicron mass.The aerosol number-to-volume ratio ðN=V Þ; calcu-
lated using PCASP and differential mobility analyzer(DMA) size distribution measurements from 0.06 to1:8 mm diameter, has been shown to vary linearly withthe aerosol organic mass fraction (Hegg and Russell,2000). This linear relationship may be caused bysecondary sulfate production, which lowers both theorganic mass fraction and the N=V ratio (Hegg andRussell, 2000). PELTI size distributions using thePCASP and a radial differential mobility analyzer(RDMA) from 0.06 to 1:8 mm diameter show thatN=V increases as organic mass fraction increases,although the fit has an R2 value of only 0.37 asillustrated in Fig. 9. This value is comparable to the R2
value of 0.41 reported for the TARFOX and ACE 2
Fig. 8. FTIR vertical distributions of (a) sulfate, (b) silicate, (c) ammonium, and (d) organic carbon.
S.F. Maria et al. / Atmospheric Environment 36 (2002) 5185–51965192
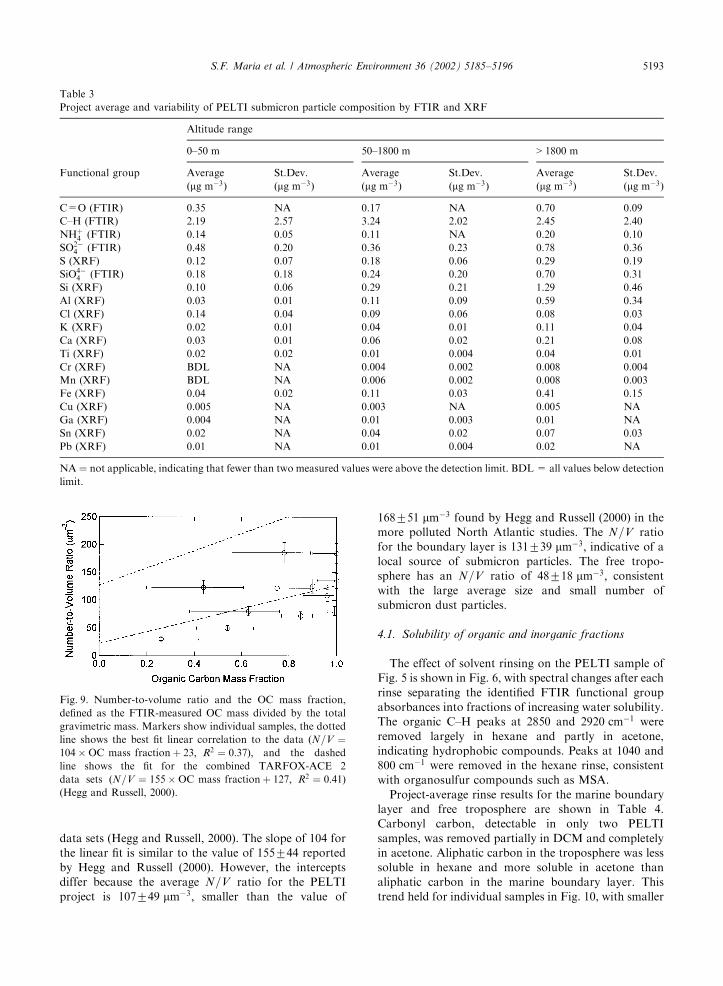
data sets (Hegg and Russell, 2000). The slope of 104 forthe linear fit is similar to the value of 155744 reportedby Hegg and Russell (2000). However, the interceptsdiffer because the average N=V ratio for the PELTIproject is 107749 mm!3; smaller than the value of
168751 mm!3 found by Hegg and Russell (2000) in themore polluted North Atlantic studies. The N=V ratiofor the boundary layer is 131739 mm!3; indicative of alocal source of submicron particles. The free tropo-sphere has an N=V ratio of 48718 mm!3; consistentwith the large average size and small number ofsubmicron dust particles.
4.1. Solubility of organic and inorganic fractions
The effect of solvent rinsing on the PELTI sample ofFig. 5 is shown in Fig. 6, with spectral changes after eachrinse separating the identified FTIR functional groupabsorbances into fractions of increasing water solubility.The organic C–H peaks at 2850 and 2920 cm!1 wereremoved largely in hexane and partly in acetone,indicating hydrophobic compounds. Peaks at 1040 and800 cm!1 were removed in the hexane rinse, consistentwith organosulfur compounds such as MSA.Project-average rinse results for the marine boundary
layer and free troposphere are shown in Table 4.Carbonyl carbon, detectable in only two PELTIsamples, was removed partially in DCM and completelyin acetone. Aliphatic carbon in the troposphere was lesssoluble in hexane and more soluble in acetone thanaliphatic carbon in the marine boundary layer. Thistrend held for individual samples in Fig. 10, with smaller
Table 3Project average and variability of PELTI submicron particle composition by FTIR and XRF
Altitude range
0–50 m 50–1800 m > 1800 m
Functional group Average St.Dev. Average St.Dev. Average St.Dev.ðmg m!3Þ ðmg m!3Þ ðmg m!3Þ ðmg m!3Þ ðmg m!3Þ ðmg m!3Þ
C=O (FTIR) 0.35 NA 0.17 NA 0.70 0.09C–H (FTIR) 2.19 2.57 3.24 2.02 2.45 2.40NHþ
4 (FTIR) 0.14 0.05 0.11 NA 0.20 0.10SO2!
4 (FTIR) 0.48 0.20 0.36 0.23 0.78 0.36S (XRF) 0.12 0.07 0.18 0.06 0.29 0.19SiO4!
4 (FTIR) 0.18 0.18 0.24 0.20 0.70 0.31Si (XRF) 0.10 0.06 0.29 0.21 1.29 0.46Al (XRF) 0.03 0.01 0.11 0.09 0.59 0.34Cl (XRF) 0.14 0.04 0.09 0.06 0.08 0.03K (XRF) 0.02 0.01 0.04 0.01 0.11 0.04Ca (XRF) 0.03 0.01 0.06 0.02 0.21 0.08Ti (XRF) 0.02 0.02 0.01 0.004 0.04 0.01Cr (XRF) BDL NA 0.004 0.002 0.008 0.004Mn (XRF) BDL NA 0.006 0.002 0.008 0.003Fe (XRF) 0.04 0.02 0.11 0.03 0.41 0.15Cu (XRF) 0.005 NA 0.003 NA 0.005 NAGa (XRF) 0.004 NA 0.01 0.003 0.01 NASn (XRF) 0.02 NA 0.04 0.02 0.07 0.03Pb (XRF) 0.01 NA 0.01 0.004 0.02 NA
NA¼ not applicable, indicating that fewer than two measured values were above the detection limit. BDL= all values below detectionlimit.
Fig. 9. Number-to-volume ratio and the OC mass fraction,defined as the FTIR-measured OC mass divided by the totalgravimetric mass. Markers show individual samples, the dottedline shows the best fit linear correlation to the data ðN=V ¼104%OC mass fractionþ 23; R2 ¼ 0:37Þ; and the dashedline shows the fit for the combined TARFOX-ACE 2data sets ðN=V ¼ 155%OC mass fractionþ 127; R2 ¼ 0:41Þ(Hegg and Russell, 2000).
S.F. Maria et al. / Atmospheric Environment 36 (2002) 5185–5196 5193

hexane-soluble C–H fractions above the boundary layer.Below 1800 m; an average of 35% of the identified C–Hwas hydrophobic, with a range of 20–50%. Above1800 m; 2 of 3 samples had no hydrophobic fraction,and 60–90% of C–H was soluble in water. These resultssuggest that the organic carbon in the free troposphere ismore water-soluble, because organic standards removedby hexane have water solubilities of o0:01 M (Fig. 4)and water-soluble standards are removed by eitheracetone or water.In the marine boundary layer, the observed OC
solubility behavior is consistent with a model organicaerosol composition of 30% n-nonadecane, 20% citricacid, and 50% oxalic acid. In the free troposphere , anorganic composition of 0–10% n-nonadecane, 40%adipic acid, and 50–60% oxalic acid would be consistentwith the observed rinsing behavior. These relativelyhygroscopic model compositions provide more accurateestimates of the activation potential of organic aerosol
within a cloud, allowing us to avoid underestimating OCwet deposition (Cooke et al., 1999). The uncertainty inaerosol scattering and extinction coefficients derivedfrom composition measurements can also be reduced byB10% for OM mass fractions of 50–90% (Collins et al.,2000), with the assumption that our measured OMsolubilities and resulting hygroscopic growth factors areaccurate to within B20%:Residual values of sulfate, ammonium, and silicate
show more than 15% of the measured groups remainedafter all four solvent rinses. This result is expected forsilicates as many silicate compounds are insoluble inwater and organic solvents. The large residuals in theammonium and sulfate measurements result from acombination of the compounded error in each post-rinsescan of smaller absolute absorbances (and larger relativeerrors) as well as spectral interference by dust compo-nents with overlapping absorbance peak locations(carbonate at 1433 cm!1 and soil at 550 cm!1).
5. Conclusions
FTIR spectroscopy with an aircraft-based aerosolsampling system showed total identified submicronaerosol functional group concentrations varying from0.4–6:0 mg m!3: Organic carbon was identified in sam-ples composed largely of sea-salt as well as in samplesdominated by dust. A four-solvent rinsing procedureseparated functional groups into fractions based onsolubility, showing larger fractions of water-solubleorganics at high altitudes.The assumption that OC is 100% hydrophobic
(Collins et al., 2000) or 50% hydrophobic (Cookeet al., 1999) neglects important spatial variations inOC properties. Incorporation of measured organichygroscopicity into models will result in larger predictedOC concentrations in cloud droplets. Uncertainties in
Table 4Solubility of chemical components measured by FTIR
Percentage removeda
Boundary layer ðo1800 mÞ Free troposphere ð> 1800 mÞ
Rinse SO2!4 NHþ
4 SiO4!4 C–H SO2!
4 NHþ4 SiO4!
4 C–H
Hexane 273 16720 877 3576 7717 11716 478 1977DCM 679 677 12715 9719 476 13716 8710 375Acetone 071 18712 9711 9719 474 173 072 31718Water 52718 28710 172 34725 57727 36728 26732 40729Residual 37715 29712 7075 1377 26715 35724 62721 775
aPercentages shown are for the entire project data set, and represent the average fraction of each sample that was removed duringeach rinsing stage, as well as the standard deviations.
Fig. 10. Removal characteristics for the C–H absorbance peak,showing the fractions removed in hexane (white), dichloro-methane (striped), acetone (checkered), and water (gray), andthe fraction remaining on the filter after all rinsing wascompleted (black). Each horizontal bar represents one filtersample. Error bars indicate uncertainty in the FTIR measure-ments.
S.F. Maria et al. / Atmospheric Environment 36 (2002) 5185–51965194
scattering and extinction coefficients calculated fromaerosol composition are also reduced.
Acknowledgements
This research was supported by NSF Grants ATM-0002035 and ATM-9732949 and by ONR grantsN00014-97-1-0673 and N00014-98-0565. We gratefullyacknowledge the help of Adam Reff in designing theaerosol generation system we used for collection ofreference compounds. We also appreciate the advice andhelp of Petros Koutrakis, Stephen Ferguson, and IliasKavouras of the Harvard School of Public Health in thedesign and assembly of the 3SPC. We are grateful toKrista Laursen, Barry Huebert, Graeme Christianson,Elizabeth Fetter, and the NCAR Research AviationFacility for their help in the field.
References
Allen, D.T., Palen, E.J., Haimov, M.I., Hering, S.V., Young,J.R., 1994. Fourier transform infrared spectroscopy ofaerosol collected in a low pressure impactor (LPI/FTIR):method development and field calibration. Aerosol Scienceand Technology 21, 325–342.
Blando, J.D., Porcja, R.J., Li, T.H., Bowman, D., Lioy,P.J., Turpin, B.J., 1998. Secondary formation and theSmoky Mountain organic aerosol: an examination ofaerosol polarity and functional group composition duringSEAVS. Environmental Science and Technology 32,604–613.
Blando, J.D., Porcja, R.J., Turpin, B.J., 2001. Issues in thequantitation of functional groups by FTIR spectroscopicanalysis of impactor-collected aerosol samples. AerosolScience and Technology 35, 899–908.
Blomquist, B.W., Huebert, B.J., Howell, S.G., Litchy, M.R.,Twohy, C.H., Schanot, A., Baumgardner, D., Lafleur, B.,Seebauch, R., Laucks, M.L., 2001. An evaluation of thecommunity aerosol inlet for the NCAR C-130 researchaircraft. Journal of Atmospheric and Oceanic Technology32, 1387–1397.
Brockmann, J.E., Yamano, N., Lucero, D., 1988. Calibrationof the aerodynamic particle sizer 3310 (APS-3310) withpolystyrene latex monodisperse spheres and oleic-acidmonodisperse particles. Aerosol Science and Technology8, 279–281.
Carlton, A.G., Turpin, B.J., Johnson, W., Buckley, B.T.,Simcik, M., Eisenreich, S.J., Porcja, R.J., 1999.Microanalysis methods for characterization of personalaerosol exposures. Aerosol Science and Technology 31,66–80.
Chester, R., Stoner, J.H., 1974. The distribution of particulateorganic carbon and nitrogen in some surface waters of theworld ocean. Marine Chemistry 2, 263–275.
Cliff, G., Lorimer, G.W., 1972. Quantitative analysis ofthin metal foils using EMMA-4 (electron microscope-
microanalyzer) ratio technique. Proceedings of theFifth European Congress on Electron Microscopy,pp. 140–141.
Cooke, W.F., Liousse, C., Cachier, H., 1999. Construction of a11% 11 fossil fuel emission data set for carbonaceousaerosol and implementation and radiative impact in theECHAM4 model. Journal of Geophysical Research 104,22137–22162.
Collins, D.R., Jonsson, H.H., Seinfeld, J.H., Flagan, R.C.,Gasso, S., Hegg, D.A., Russell, P.B., Schmid, B., Living-ston, J.M., Ostrom, E., Noone, K.J., Russell, L.M., Putaud,J.P., 2000. In situ aerosol-size distributions and clear-column radiative closure during ACE-2. Tellus, Series B 52,498–525.
Draxier, R.R., Hess, G.D., 1998. An overview of theHYSPLIT4 modelling system for trajectories, dispersionand deposition. Australian Meteorological Magazine 47,295–308.
Duce, R.A., Mohnen, V.A., Zimmerman, P.R., Grosjean, D.,Cautreels, W., Chatfield, R., Jaenicke, R., Ogren, J.A.,Pellizzari, E.D., Wallace, G.T., 1983. Organic material inthe global troposphere. Reviews of Geophysics and SpacePhysics 21, 921–952.
Garrett, T.J., Russell, L.M., Ramaswamy, V., Maria, S.F.,Huebert, B.J., 2002. Microphysical and radiative evolutionof aerosol plumes over the tropical North Atlantic ocean.Journal of Geophysical Research, in press.
Hegg, D.A., Russell, L.M., 2000. An analysis of processesdetermining the number-to-volume relationship for sub-micron aerosol in the Eastern Atlantic. Journal of Geophy-sical Research 105, 15321–15328.
Hoppel, W.A., 1978. Determination of the aerosol sizedistribution from the mobility distribution of thecharged fraction of aerosols. Journal of Aerosol Science 9,41–54.
Jacobson, M.C., Hansson, H.C., Noone, K.J., Charlson, R.J.,2000. Organic atmospheric aerosols: review and state of thescience. Reviews of Geophysics 38, 267–294.
Liu, Y.G., Daum, P.H., 2000. The effect of refractive index onsize distributions and light scattering coefficients derivedfrom optical particle counters. Journal of GeophysicalResearch 31, 945–957.
Matsumoto, G., Hanya, T., 1980. Organic constituents inatmospheric fallout in the Tokyo area. AtmosphericEnvironment 14, 1409–1419.
McClenny, W.A., Childers, J.W., Rohl, R., Palmer, R.A., 1985.FTIR transmission spectroscopy for the nondestructivedetermination of ammonium and sulfate in ambientaerosols collected on Teflon filters. Atmospheric Environ-ment 19, 1891–1898.
Ming, Y., Russell, L.M., 2001. Predicted hygroscopic growth ofsea salt aerosol. Journal of Geophysical Research 106,28259–28274.
Novakov, T., Hegg, D.A., Hobbs, P.V., 1997. Airbornemeasurements of carbonaceous aerosols on the East Coastof the United States. Journal of Geophysical Research 102,30023–30030.
Perry, K.D., Cahill, T.A., Eldred, R.A., Dutcher, D.D., Gill,T.E., 1997. Long-range transport of North African dust tothe eastern United States. Journal of Geophysical Research102, 11225–11238.
S.F. Maria et al. / Atmospheric Environment 36 (2002) 5185–5196 5195

Saxena, P., Hildemann, L.M., 1997. Water absorption byorganics: survey of laboratory evidence and evaluation ofUNIFAC for estimating water activity. EnvironmentalScience and Technology 31, 3318–3324.
Sioutas, C., Koutrakis, P., Burton, R.M., 1994. Developmentof a low cutpoint slit virtual impactor for sampling ambientfine particles. Journal of Aerosol Science 25, 1321–1330.
Turpin, B.J., Huntzicker, J.J., Hering, S.V., 1994. Investigationof organic aerosol sampling artifacts in the Los Angelesbasin. Atmospheric Environment 28, 3061–3071.
Turpin, B.J., Lim, H.J., 2001. Species contributions to PM2.5mass concentrations: Revisiting common assumptions forestimating organic mass. Aerosol Science and Technology35, 602–610.
S.F. Maria et al. / Atmospheric Environment 36 (2002) 5185–51965196