Embed Size (px)
Citation preview
FRUIT GROWERS LABORATORY, INC.
Chad Lessard
Certified Crop Advisor
Director of Agricultural Services
Talking points for interpreting your soil and tissue
analysis reports
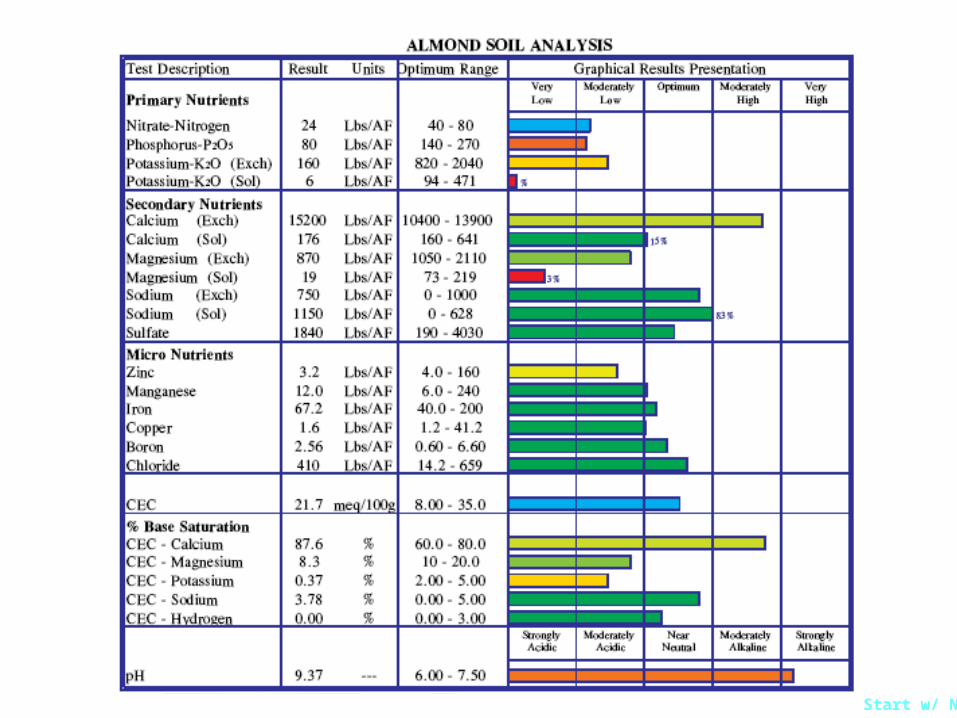
• Primary Nutrients and Macronutrients– N, P, K, Ca, Mg, S
• Secondary Nutrients and Micronutrients– Fe, Zn, Mn, Cu, B, Cl, Mo
• Other Chemical Properties– pH, cation exchange capacity, soil salinity, limestone
• Quality Control
• Database Management SystemsFirst
UnderstandingYour
Soil Analysis Report
Soil Rpt
Start w/ N
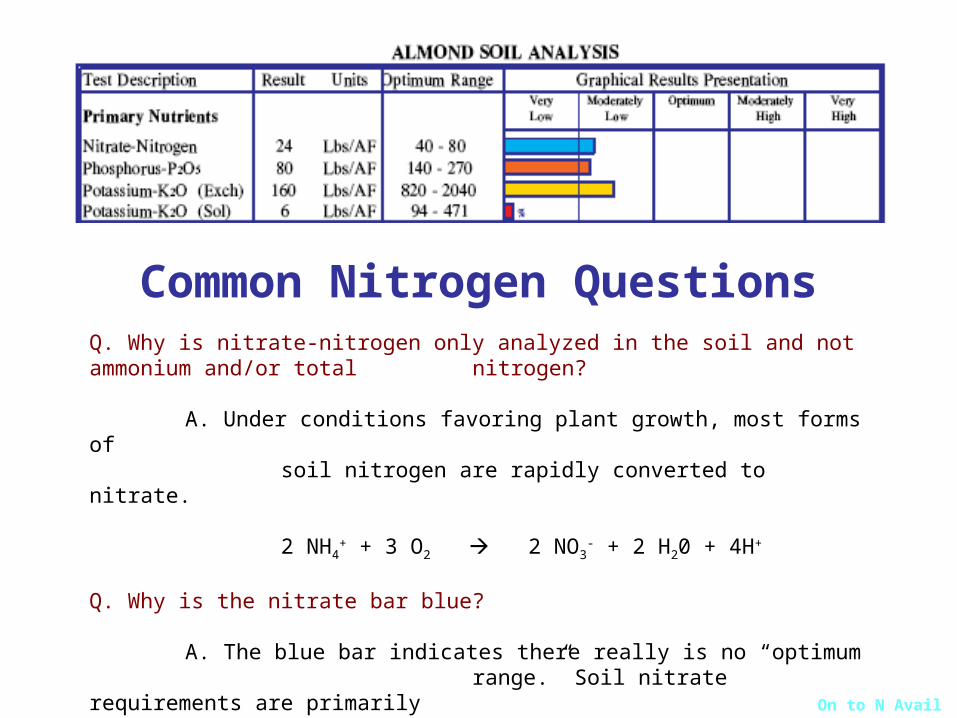
Common Nitrogen QuestionsQ. Why is nitrate-nitrogen only analyzed in the soil and not ammonium and/or total nitrogen?
A. Under conditions favoring plant growth, most forms ofsoil nitrogen are rapidly converted to nitrate.
2 NH4+ + 3 O2 2 NO3
- + 2 H20 + 4H+
Q. Why is the nitrate bar blue?
A. The blue bar indicates there really is no “optimum range.” Soil nitrate requirements are primarily
dependant on the growth stage of your crop and soil temperature.
On to N Avail
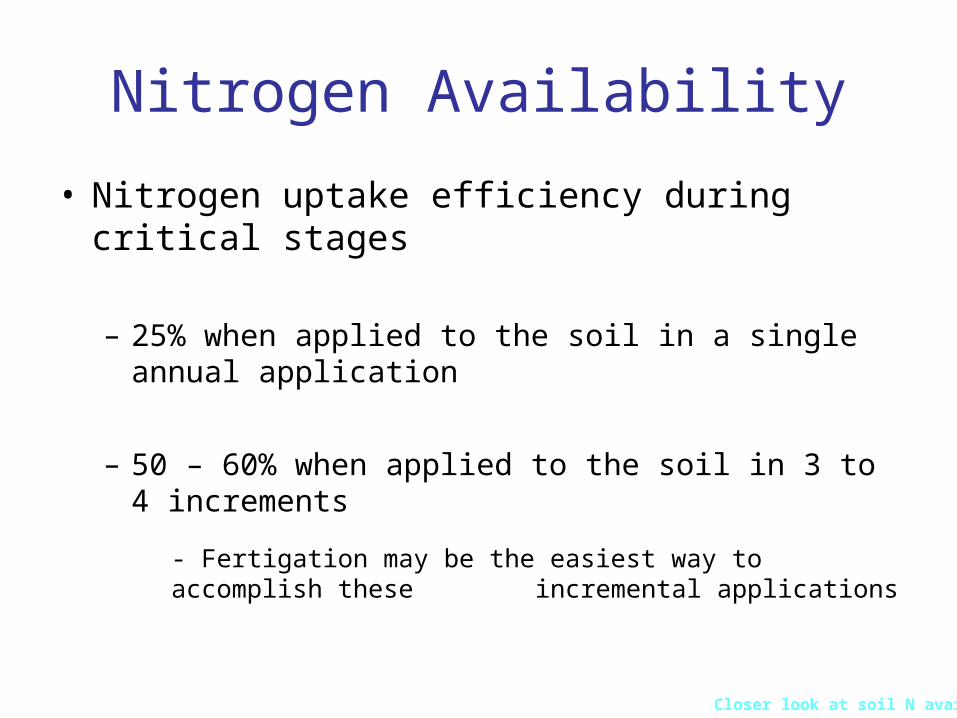
Nitrogen Availability
• Nitrogen uptake efficiency during critical stages
– 25% when applied to the soil in a single annual application
– 50 – 60% when applied to the soil in 3 to 4 increments
- Fertigation may be the easiest way to accomplish these incremental applications
Closer look at soil N avail
Nitrogen Availability
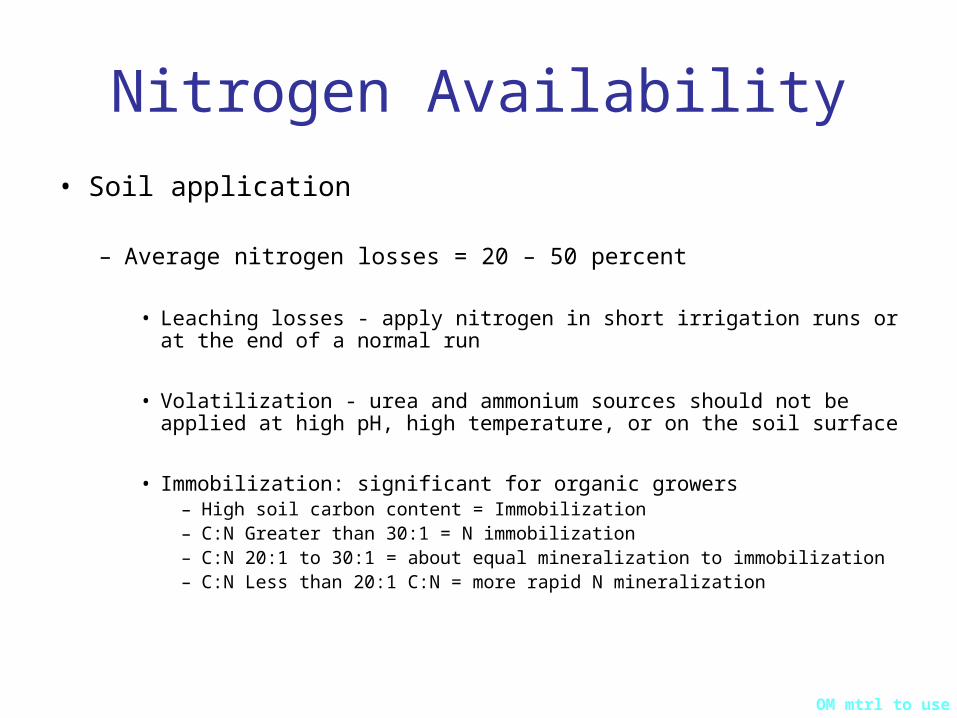
• Soil application
– Average nitrogen losses = 20 – 50 percent
• Leaching losses - apply nitrogen in short irrigation runs or at the end of a normal run
• Volatilization - urea and ammonium sources should not be applied at high pH, high temperature, or on the soil surface
• Immobilization: significant for organic growers– High soil carbon content = Immobilization– C:N Greater than 30:1 = N immobilization– C:N 20:1 to 30:1 = about equal mineralization to immobilization– C:N Less than 20:1 C:N = more rapid N mineralization
OM mtrl to use
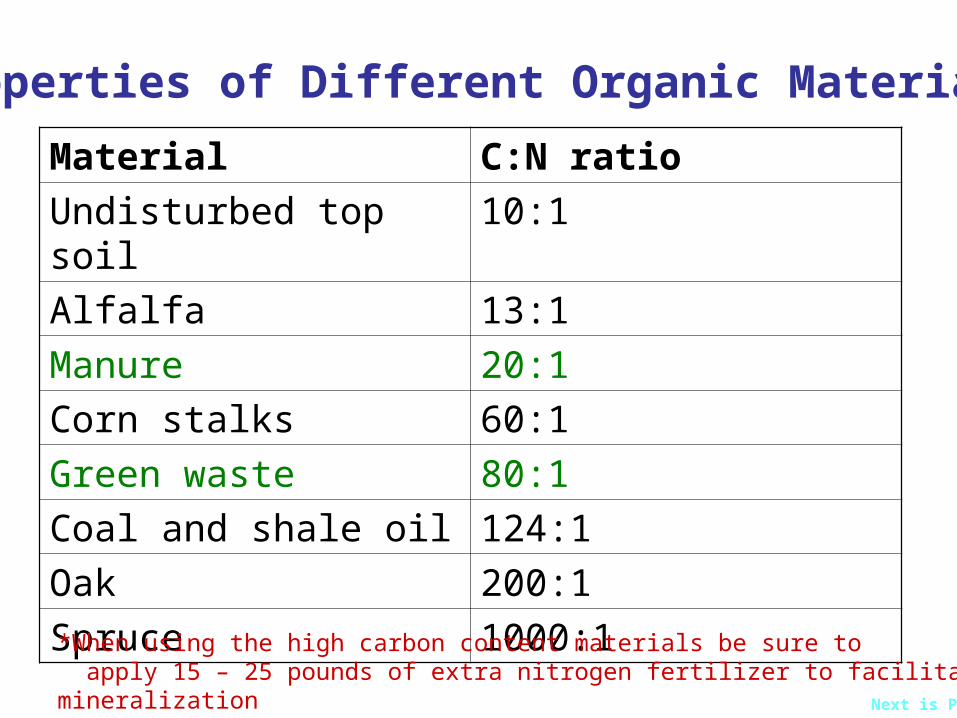
Material C:N ratio
Undisturbed top soil 10:1
Alfalfa 13:1
Manure 20:1
Corn stalks 60:1
Green waste 80:1
Coal and shale oil 124:1
Oak 200:1
Spruce 1000:1
Properties of Different Organic Materials
*When using the high carbon content materials be sure to apply 15 – 25 pounds of extra nitrogen fertilizer to facilitate mineralization
Next is P
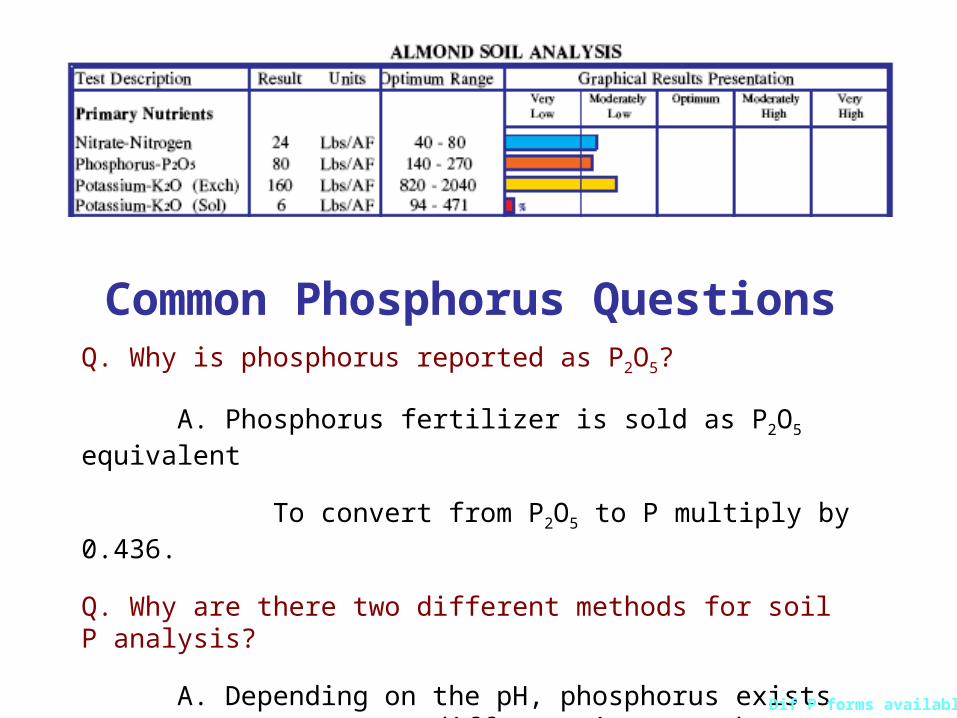
Common Phosphorus QuestionsQ. Why is phosphorus reported as P2O5?
A. Phosphorus fertilizer is sold as P2O5 equivalent
To convert from P2O5 to P multiply by 0.436.
Q. Why are there two different methods for soil P analysis?
A. Depending on the pH, phosphorus exists as two different ions so there are two different extraction
solutions to mimic actual P available to your crop.Dif P forms available
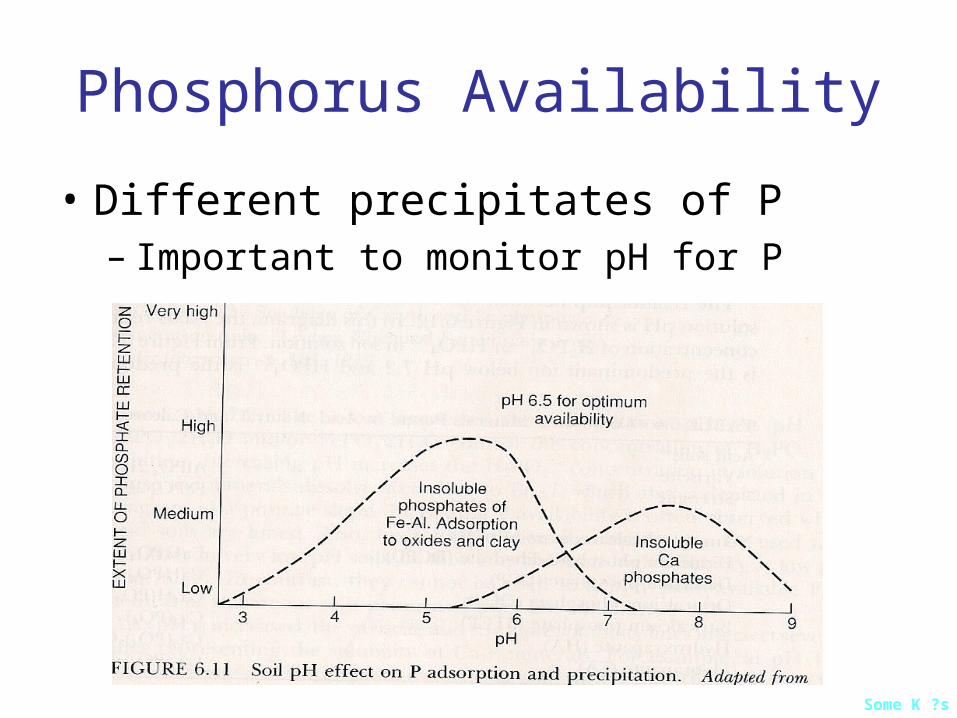
Phosphorus Availability
• Different precipitates of P– Important to monitor pH for P
Some K ?s
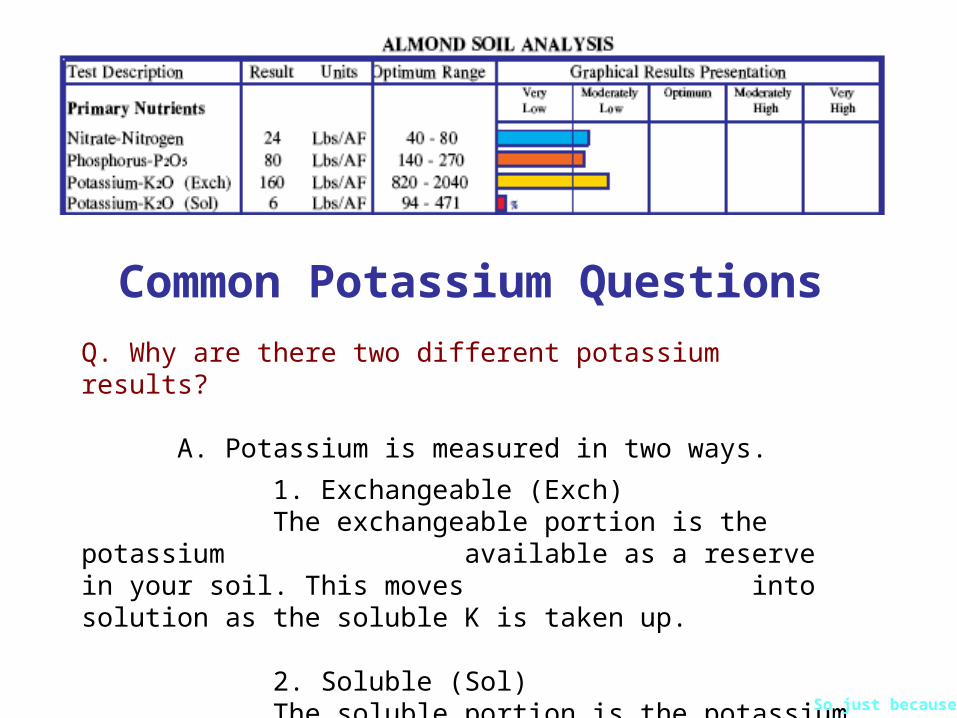
Common Potassium Questions
Q. Why are there two different potassium results?
A. Potassium is measured in two ways.
1. Exchangeable (Exch)The exchangeable portion is the potassium available as a reserve in your soil. This moves into solution as the soluble K is taken up.
2. Soluble (Sol)The soluble portion is the potassium most readily available.
So just because
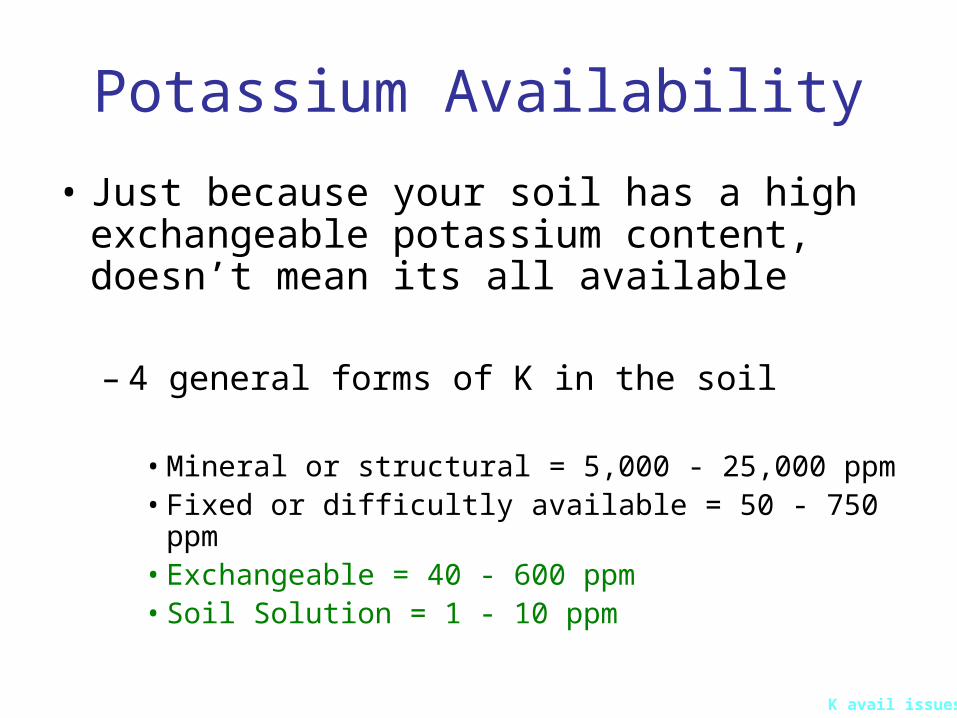
Potassium Availability
• Just because your soil has a high exchangeable potassium content, doesn’t mean its all available
– 4 general forms of K in the soil
• Mineral or structural = 5,000 - 25,000 ppm• Fixed or difficultly available = 50 - 750 ppm• Exchangeable = 40 - 600 ppm• Soil Solution = 1 - 10 ppm
K avail issues
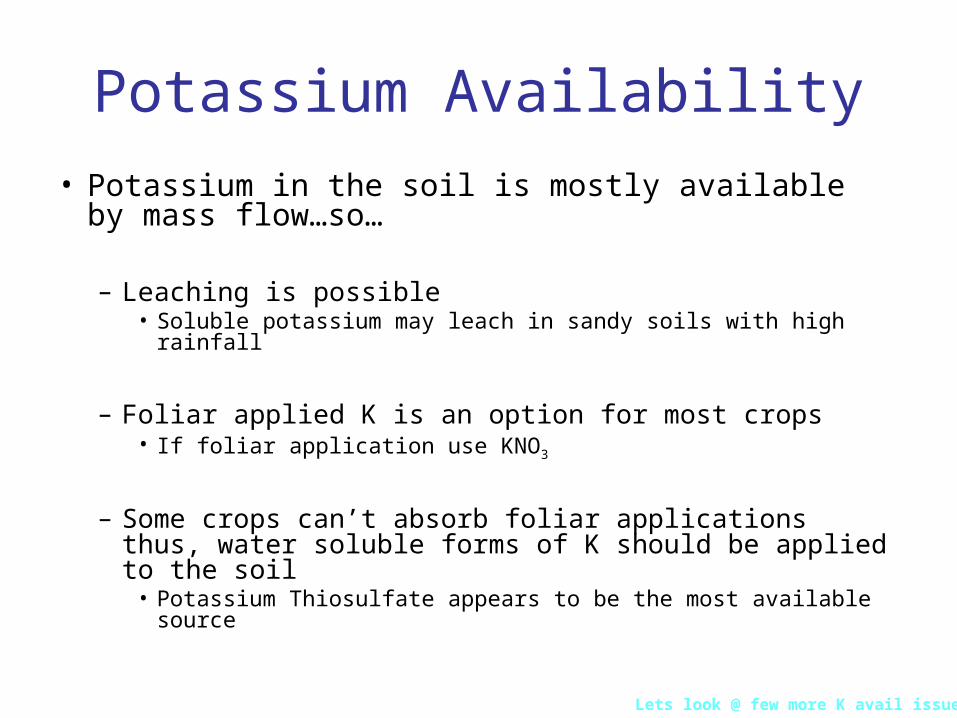
Potassium Availability
• Potassium in the soil is mostly available by mass flow…so…
– Leaching is possible• Soluble potassium may leach in sandy soils with high rainfall
– Foliar applied K is an option for most crops• If foliar application use KNO3
– Some crops can’t absorb foliar applications thus, water soluble forms of K should be applied to the soil
• Potassium Thiosulfate appears to be the most available source
Lets look @ few more K avail issues
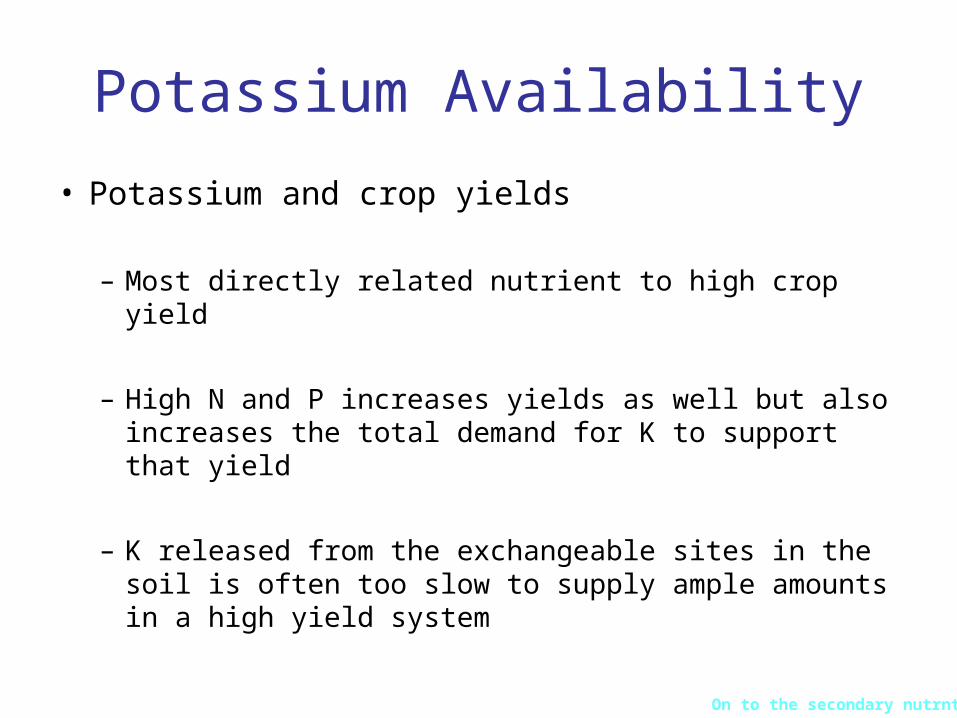
Potassium Availability
• Potassium and crop yields
– Most directly related nutrient to high crop yield
– High N and P increases yields as well but also increases the total demand for K to support that yield
– K released from the exchangeable sites in the soil is often too slow to supply ample amounts in a high yield system
On to the secondary nutrnts
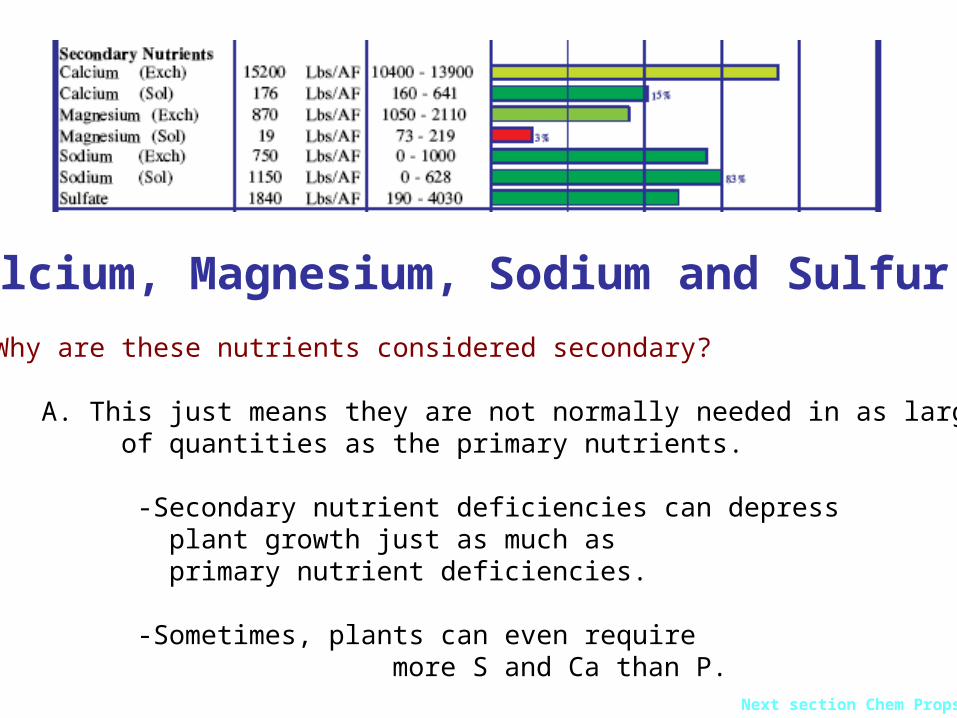
Calcium, Magnesium, Sodium and Sulfur
Q. Why are these nutrients considered secondary?
A. This just means they are not normally needed in as large of of quantities as the primary nutrients.
-Secondary nutrient deficiencies can depress plant growth just as much as primary nutrient deficiencies.
-Sometimes, plants can even require more S and Ca than P.
Next section Chem Props
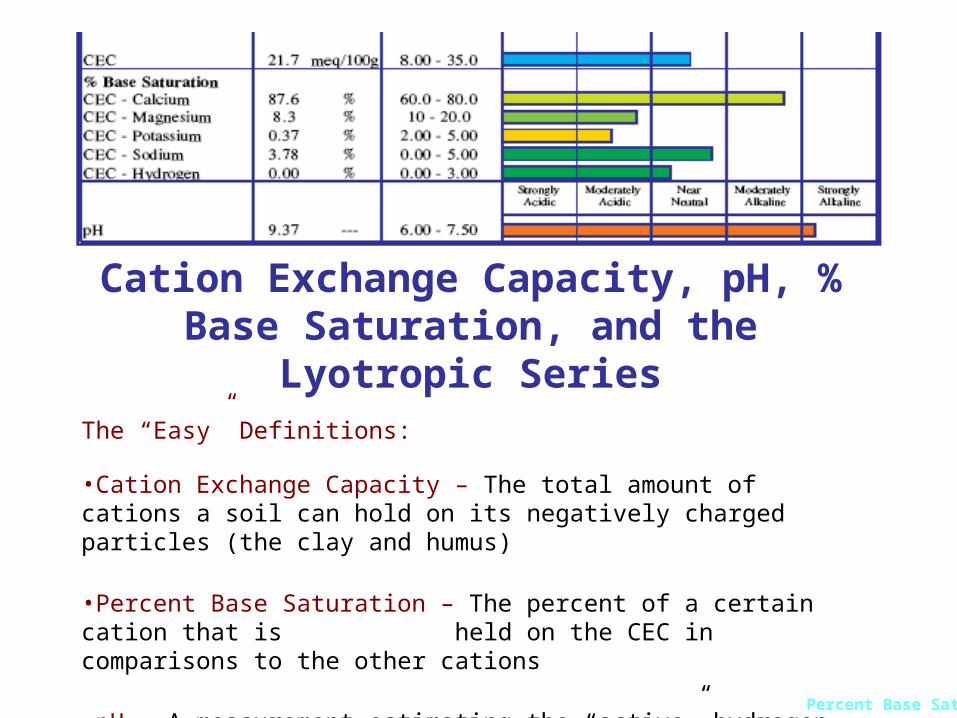
Cation Exchange Capacity, pH, % Base Saturation, and the Lyotropic Series
The “Easy” Definitions:
•Cation Exchange Capacity – The total amount of cations a soil can hold on its negatively charged particles (the clay and humus)
•Percent Base Saturation – The percent of a certain cation that is held on the CEC in comparisons to the other cations
•pH – A measurement estimating the “active” hydrogen ions
•Lyotropic Series – The order in which cations will bond with the negative charges in your soil Al3+ > Ca2+ > Mg2+ > K+ = NH4+ > Na+
Percent Base Sat
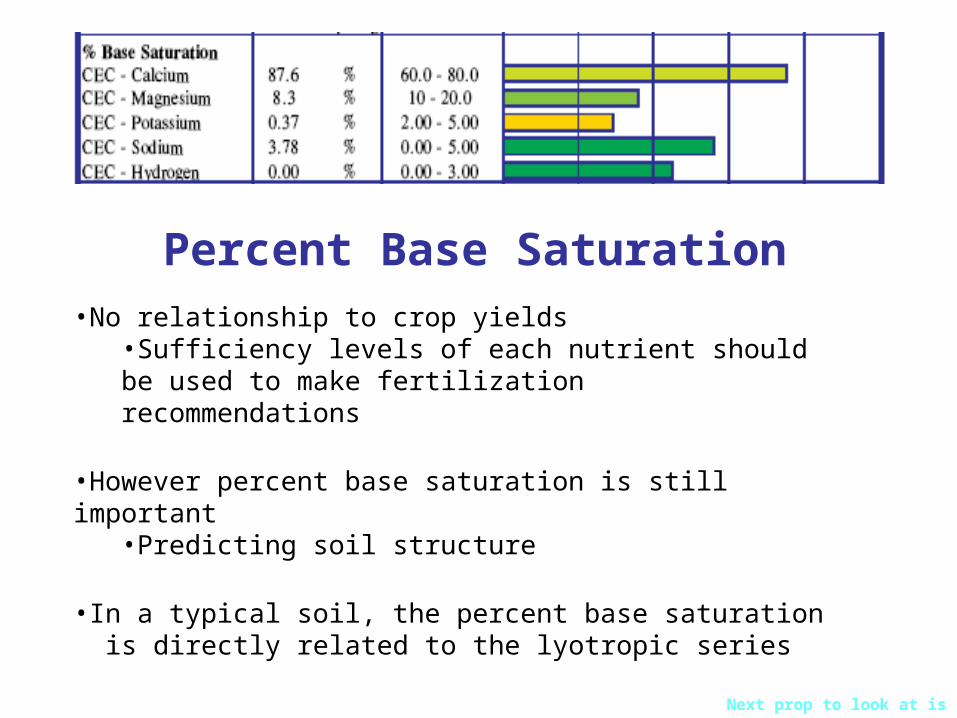
Percent Base Saturation•No relationship to crop yields
•Sufficiency levels of each nutrient should be used to make fertilization recommendations
•However percent base saturation is still important •Predicting soil structure
•In a typical soil, the percent base saturation is directly related to the lyotropic series
Next prop to look at is pH
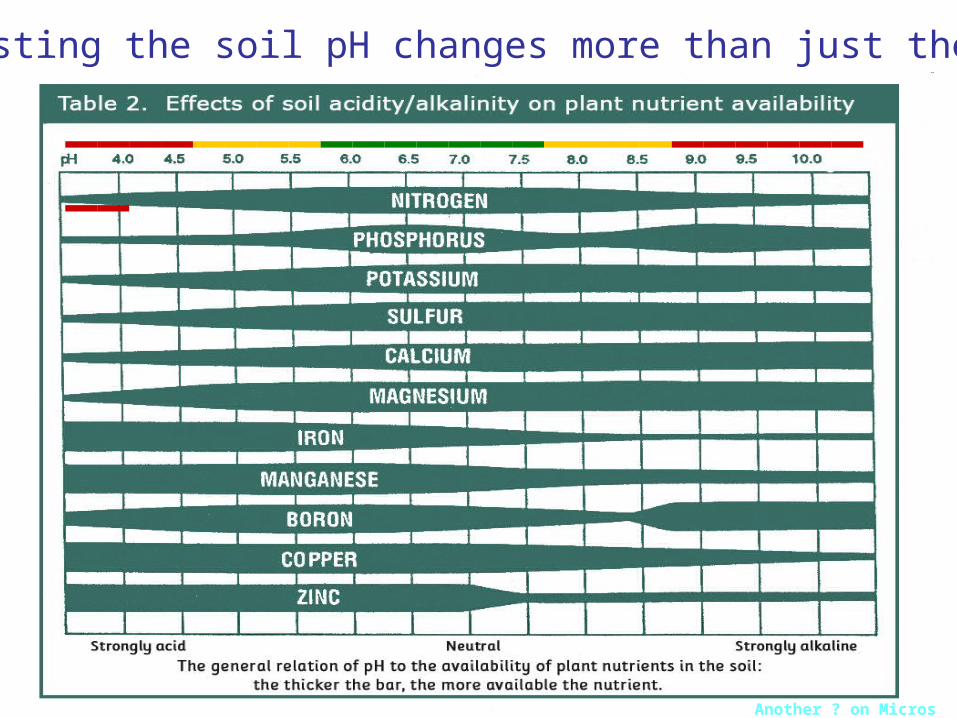
Adjusting the soil pH changes more than just the pH
___________________________
Another ? on Micros
Metal Micronutrient Availability• If my soil pH is between 5.5 and 7 and I still
have micronutrient deficiencies?
– Chelated micronutrients are the way to go for soil applications
– Chelated micronutrients are 6 – 10 times more effective than non-chelated micronutrients
– Chelates prevent micronutrients from precipitating with other ions in the soil and allow them to move with water to the root.
How they work
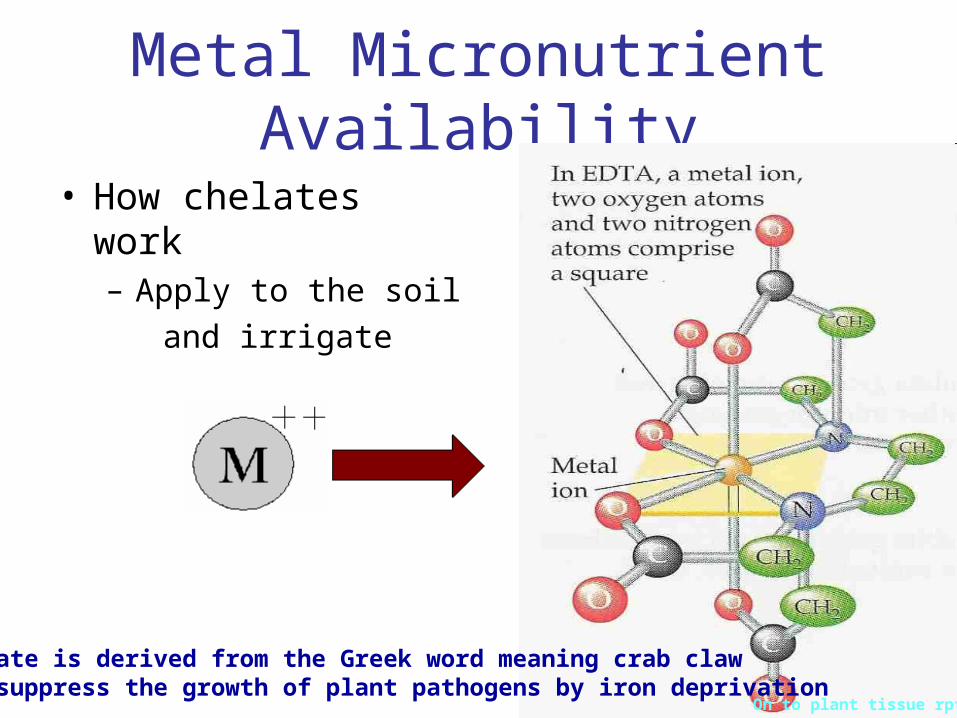
Metal Micronutrient Availability
• How chelates work– Apply to the soil
and irrigate
On to plant tissue rpts
*Chelate is derived from the Greek word meaning crab claw*May suppress the growth of plant pathogens by iron deprivation
Understanding Your
Plant Tissue Analysis Report
Tissue reports show
How to use your tissue analysis report
• A tissue analysis report shows
– The sufficiency of nutrients in your trees
– Indicates the plants ability to extract nutrients from the soil
Tissue exmpl
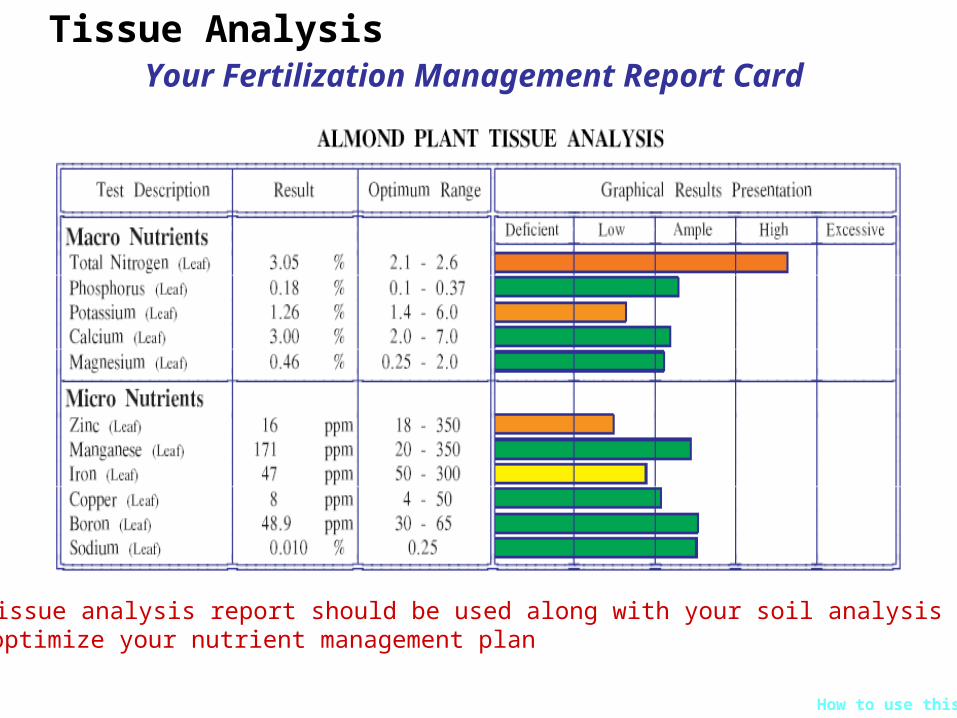
Tissue Analysis Your Fertilization Management Report Card
*Your tissue analysis report should be used along with your soil analysis data to optimize your nutrient management plan
How to use this
How to use your tissue analysis report
• If nutrient levels are optimal, then your nutrient management program is well balanced
• If not, your tissue report will indicate which changes are necessary to your nutrient management program
• Compensation must be made for crop nutrient removal
A freq asked question
How to use your tissue analysis report with your soils report
• A frequently asked question
– Q. Why does my soil report show ample nutrient levels and my leaf tissue report shows deficiencies?
– A. Because crops are not always capable of taking up the necessary amounts of nutrients to support their rate of growth and yield.
Transition to QA / QC
Quality Assurance / Quality Control
• Quality Assurance….is the overall process used to ensure accurate and precise results
• Quality Control…. is the actual steps taken such as blanks, standards, spikes, and duplicates used in the above process
A visual example
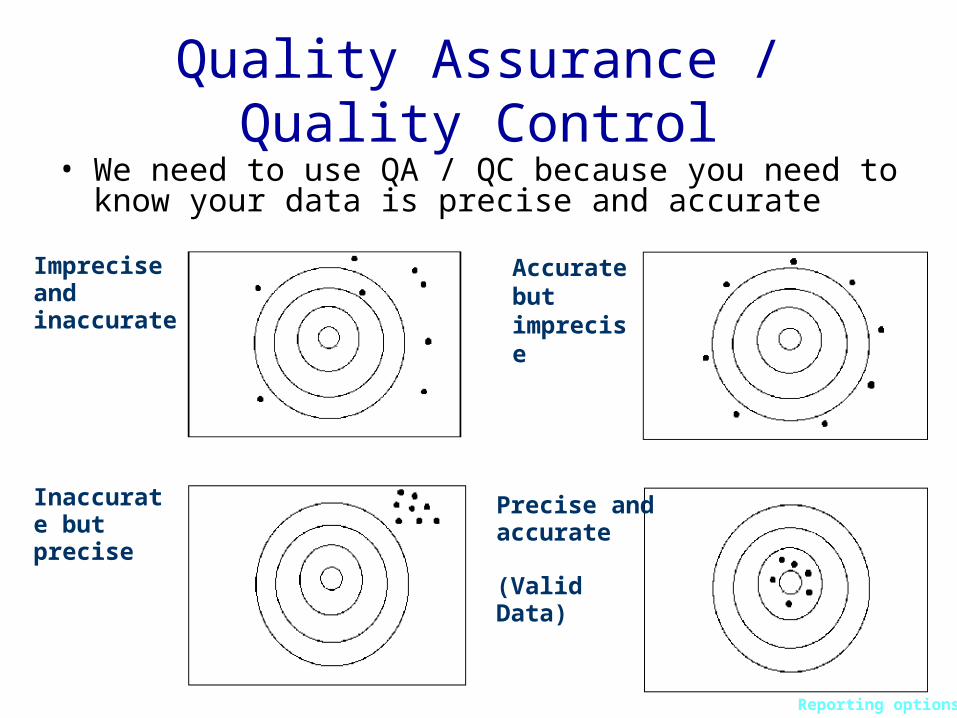
Quality Assurance / Quality Control• We need to use QA / QC because you need to know
your data is precise and accurate
Imprecise and inaccurate
Accurate but imprecise
Inaccurate but precise
Precise and accurate
(Valid Data)
Reporting options
Reporting of Testing Results
• Color graphic reports by mail
• Web reporting on FGL’s password protected website
• Alternatively............
Trans to database mgmt
Database Management Systems
• These systems catalog and organize information making it easily accessible to assist with decisions regarding fertilization and amendment programs
What else?
Database Management Systems
• Provides tools for making comparisons between previous years’ performances, different blocks / properties and
different management practices
• Parameters can be tailored to specific crops, crop growth stages, or even
specific growers
Supported dbms
• SureHarvest
• AgCode
• Most Company Specific Reporting Formats
Fruit Growers Laboratory, Inc. Supports
End
Questions?
For more info:
Chad Lessard
www.fglinc.com
Fruit Growers Laboratory, Inc.