Embed Size (px)
Citation preview
F r t n r t n nd r r d t t d nt nd th p t f th F r t rf ll : dd t n l v d n
R n D. P d tt, n P. J hn n, rn t T. P r ll
J rn l f ll t d nt D v l p nt, V l , N b r 2, r h pr l20 2, pp. 24 266 ( rt l
P bl h d b J hn H p n n v r t PrD : 0. d.20 2.00 2
F r dd t n l nf r t n b t th rt l
Access provided by University of California, Merced (13 Jun 2016 20:22 GMT)
http : .jh . d rt l 46 44
March/April 2012 vol 53 no 2 243
First-Generation Undergraduate Students and the Impacts of the First Year of College: Additional EvidenceRyan D. Padgett Megan P. Johnson Ernest T. Pascarella
Using longitudinal data from the Wabash National Study of Liberal Arts Education, our findings suggest that first-generation students are at a significant disadvantage across cognitive and psychosocial outcomes compared to students whose parents have at least some postsecondary education. Furthermore, we tested for the conditional effects of good practices on first-year outcomes and found that effects of good practices on both cognitive and psychosocial outcomes differed in magnitude, and sometimes in direction, for first-generation versus non-first-generation students.
The enrollment of first-generation students in higher education has been significantly increasing over the past decade (Strayhorn, 2006). Yet the literature examining first-generation students has primarily focused on three distinct outcome measures: (a) college choice decisions and aspirations (e.g., Bui, 2002, 2005; Ceja, 2006; Gibbons & Shoffner, 2004), (b) academic achievement (e.g., Chen & Carroll, 2005; Dennis, Phinney, & Ivey-Chuateco, 2005; Ting, 2003), and (c) persistence and retention (e.g., Duggan, 2001; Harrell & Forney, 2003; Ishitani, 2006; Martin Lohfink & Paulsen, 2005; Rendon, 1995; Somers, Woodhouse, & Cofer, 2004; Warburton & Carroll, 2001). While these studies have added to the over all
literature examining first-generation students, a limited amount of research exists measuring the dimensions of intellectual and personal development of first-generation students versus all other students (Pascarella & Terenzini, 2005). Furthermore, existing research tends to over-look the cumulative impact of intergenerational educational benefits that may accrue to college students whose parents are college educated. Pascarella and Terenzini’s (1991, 2005) review of the literature found evidence that the benefits of college do not just accrue to the individual, but are also passed down to that individual’s own children. We suggest these intergenerational benefits (i.e., cultural and social capital) that can affect cognitive and psychosocial development during college differ between first-generation students and their non-first-generation peers. With a broad contextual framework this study provides empirical evidence on the predictive nature of parental educational level across a broad spectrum of cognitive and psychosocial outcomes. Using a battery of controls and empirically vetted good practices in undergraduate education, we begin to uncover key differences between first-generation students and their non-first-generation peers across four cognitive and two psychosocial outcomes. This study extends recent evidence (Pascarella, Pierson, Wolniak, & Terenzini, 2004) on the
Ryan D. Padgett is the Senior Analyst for Co-Curricular Assessment and Research at Northern Kentucky University; Megan P. Johnson is the Development Outreach Coordinator for the United States Agency for International Development (USAID) in Tanzania; and Ernest T. Pascarella is the Mary Louise Petersen Chair in Higher Education at The University of Iowa. This research was supported by a generous grant from the Center of Inquiry in the Liberal Arts at Wabash College to the Center for Research on Undergraduate Education at The University of Iowa
244 Journal of College Student Development
Padgett, Johnson, & Pascarella
degree to which a first-generation student’s college experience, specifically the cognitive and personal benefits he or she derives, is influenced by parental education. To this end, we analyzed longitudinal data from the first year of the Wabash National Study of Liberal Arts Education (WNSLAE). We were specifically concerned with estimating the effects of parental education in two areas. First, we estimated the net impacts of parental education on a range of first-year outcomes frequently associated with a liberal arts education, particularly cognitive and psychosocial development. Second, we estimated the extent to which the effects of vetted good practices in undergraduate education have a differential impact on first-year outcomes for students whose parents have various levels of education. In all cases we were specifically interested in differences between first-generation (neither parent has any college education) and students whose parents have varying degrees of postsecondary education. Additionally, our analyses also permitted us to examine the extent to which parents with at least some postsecondary education may bestow educational benefits to their children.
RESEARCH ON THE EFFECTS OF PARENTAL EDUCATION AND GOOD PRACTICES
Empirical evidence clearly highlights the disadvantage first-generation students have compared to non-first-generation students in various precollege measures related to cultural and social capital. First-generation students are more likely to come from lower-income families (Bui, 2002; Terenzini, Springer, et al., 1996), spend less time socializing with various social agents in high school (Terenzini, Springer, et al.), have lower standardized test scores (Bui), are less likely to be prepared academically upon entering college (Horn, Nuñez, & Bobbitt,
2000; Terenzini, Springer, et al.), and have lower initial critical thinking abilities compared to their non-first-generation peers (Terenzini, Springer, et al.). Sampling 11,112 first-year students from 28 institutions and controlling for background demographics, high school experiences, and prior academic achievement, Cruce, Kinzie, Williams, Morelon, and Yu (2005) found that students whose parents have no college experience feel less academically prepared compared to their peers. The comparative differences between first-generation students and non-first-generation students continue upon enrollment in college. One area specifically impacted is students’ engagement levels in various college experiences (Hahs-Vaughn, 2004; Pascarella, Pierson, Wolniak, & Terenzini, 2004; Pike & Kuh, 2005; Terenzini, Springer, et al., 1996). Compared to their non-first-generation peers, first-generation students are more likely to live off campus, participate in fewer extracurricular and volunteer activities, maintain lower levels of interactions with peers (Pascarella, Pierson, et al.), study fewer hours per week (Terenzini, Springer, et al.), are frequently less involved in course learning activities and experiences (Lundberg, Schreiner, Hovaguimian, & Miller, 2007), and indicate having fewer resources to aid in the demands of academic rigor (Collier & Morgan, 2008). While first-generation students experience college differently than their non-first-generation peers, the magni-tude, direction, and differences in college outcomes (e.g., reasoning/comprehension skills and critical thinking) are both small and inconsistent (Pascarella, Pierson, et al.). The experiences most beneficial for first-generation students include enhanced academic and classroom experiences, such as the amount of time spent studying and number of unassigned materials read, found to have a positive effect on students’ cognitive development and critical thinking (Pascarella, Pierson, et al.),
March/April 2012 vol 53 no 2 245
First-Generation Undergraduate Students
though recent research has found their level of involvement in these experiences to be low (Lundberg et al.). Additional evidence from a sample of nearly 2,000 students from 6 urban universities who participated in the National Survey of Student Engagement (NSSE) found a positive relationship between first-generation students’ engagement in effective educational practices and cognitive and affective growth (Filkins & Doyle, 2002). A parallel line of inquiry within this study looks at the differences across levels of parental education in exposure to Chickering and Gamson’s (1987, 1991) influential “Seven Principles for Good Practice in Under-graduate Education”: (a) encouraging contact between students and faculty, (b) encouraging cooperation among students, (c) encouraging active learning, (d) providing prompt feed back, (e) emphasizing time on task, (f ) com mu ni-cating high expectations, and (g) respect-ing diverse talents and ways of learning. Researchers incorporating the good practices within a conceptual framework have measured the frequencies in which undergraduates are exposed to the good practices and their effects across various college outcomes (Cruce, Wolniak, Seifert, & Pascarella, 2006; Kuh, Pace, & Vesper, 1997; Kuh & Vesper, 1997; Pascarella et al., 2006; Pascarella, Wolniak, Cruce, & Blaich, 2004; Seifert, Drummond, & Pascarella, 2006). This empirical evidence within the literature supports the predicative validity of the seven good practices, and specific to this analysis, significant positive relationships between the principles, cognitive growth and development in college (Astin, 1993; Cruce et al., 2006; Pascarella & Terenzini, 1991, 2005), and self-reported gains in intellectual development and personal/interpersonal development (Kuh et al.). Chickering and Gamson (1987) consider the relationship between student and faculty both in and out of class to be the most
influential in supporting student involvement, and as such, a substantial amount of research has focused on college teaching and student–faculty interactions (Sorcinelli, 1991). A myriad of evidence supports Sorcinelli’s claim, indicating a prevalent positive influence between student–faculty interaction and student learning and development (e.g., Astin, 1993; Kuh & Hu, 2001; Pascarella & Terenzini, 1991, 2005), gains in cognitive development (Cruce et al., 2006; Terenzini, Pascarella, & Blimling, 1996), and personal and intellectual growth (Astin). Given the overwhelming evidence highlighting the importance of student–faculty contact, it is not simply serendipitous that interpersonal contact with peers is considered the best environmental influence on student development (Astin), acting as academic and personal support networks for students (Tierney, Corwin, & Coylar, 2005). Research supports these assertions, finding peer interactions to be a positive influence on cognitive development (Whitt, Edison, Pascarella, Nora, & Terenzini, 1999), with a number of personal gains (e.g., Kuh, 1995; Kuh et al., 1997; Tierney et al.). While these socialization mechanisms provide valuable assets in creating positive influential outcomes, individualistic mechanisms were also found to have positive influences on cognitive development. In particular, course challenge and high academic expectations have a significant effect on a student’s Positive Attitude Toward Literacy (Cruce et al.).
THEORETICAL PERSPECTIVES
The theoretical perspectives draw from sociol-ogists’ theories on status attainment, cultural capital, and social capital and their impact in an educational context. Status attainment theory holds that the amount of education attained significantly mediates the effects of students’ social origin characteristics on
246 Journal of College Student Development
Padgett, Johnson, & Pascarella
status attainment (Blau & Duncan, 1967). Social origin characteristics, including parents’ education, family income, and socioeconomic status, are largely measures of the financial and human capital that families have to invest in their children’s education (Kuo & Hauser , 1997; Marjoribanks, 1998, 2002; Sewell & Shah, 1968). While family financial stability is a gateway towards investment in higher education, the culture encompassing an individual’s lifestyle is just as valuable as monetary investments. Building off Bourdieu’s (1972/1977) definition of cultural capital, McDonough (1997) extends cultural capital into an educational context referring to the privileges and attitudes that middle-class and upper-class families transmit to their children as a mechanism for preserving their economic status. Within this educational context, parents transmit cultural capital by reinforcing the value and importance of a college education as a means towards maintaining socioeconomic status (McDonough). Although first-generation students have made great gains in accessing postsecondary education, social theories posit that first-generation students have either limited or no access to and use of resources. Students who possess high levels of cultural capital have the added advantage of being provided with additional resources within an educational and social setting. These resources provided students with an inherited advantage over students who possess low levels of cultural capital. From an individualistic perspective, sociologists view habitus as a mechanism by which an individual assesses his or her social environment in an effort to rationalize decision making. Habitus is defined as an internalized system of beliefs, experiences, and values acquired from the social environment, including the family, school, and work environments (Bourdieu, 1972/1977; Paulsen, 2001). Habitus directly complements the notion of cultural capital because the amount of habitus
an individual possesses is directly proportional to the beliefs, experiences, and values provided by the social community. In other words, monetary benefits are not the only advantages available to individuals who possess high levels of cultural capital and habitus. As evident within cultural capital theory and embedded within the concept of habitus, the presence of significant others is also an instrumental construct of social capital theory (Coleman, 1988). Social capital refers to the information, values, norms, standards, and expectations for education as communicated to individuals through the interpersonal relationships they share with others. Further, social capital encompasses the often powerful and influential positive benefits an individual receives from participation within a group (Portes, 1998; Tierney & Venegas, 2006). Individuals who possess high levels of social capital are well trained in interpersonal relationships and have an advantage in an environment, such as higher education, that emphasizes group collaboration and networking. These theoretical perspectives suggest that students whose parents are highly edu-cated have a significant advantage over first-generation students in the fundamental dimensions of cognitive and psychosocial development that accumulate during college. Compared to students with highly educated parents, first-generation students are already at a disadvantage in terms of their experiences, values, and resources before they even step foot on a college campus. Although this deficiency may translate to a comparatively different college experience for first-generation students, and perhaps negatively affect cognitive and psychosocial measures, the inclusion and examination of conditional influences may counter the deficit position often associated with first-generation status. In other words, inclusion of conditional effects within this analysis allow for a more comprehensive
March/April 2012 vol 53 no 2 247
First-Generation Undergraduate Students
examination of the magnitude and direction of various college experiences between first-generation and non-first-generation students (Pascarella & Terenzini, 2005). Though there are a number of hurdles first-generation students must overcome in order to reach postsecondary education (Pascarella, Pierson, et al., 2004), the literature, as stated previously, contains substantial evidence indicating successful entry for first-generation students into postsecondary education. As significant numbers of first-generation students begin to alter the collegiate landscape, estimating the impacts of intergenerational benefits that are often shaped by other measures—such as family income, career aspirations, and college type—emerges as an important area of inquiry (Pascarella & Terenzini, 1991). Thus, it is important that precollege measures often associated with intergenerational benefits (e.g., family income, precollege academic ability, high school involvement measures) are accounted for when exploring the impacts of parental education. Given the differential effects of college experiences between first-generation and non-first-generation students in the literature, the following research questions served as a guide for our analysis:
status on the following first-year outcomes? Need for Cognition, Positive Attitude Toward Literacy, Collegiate Assessment of Academic Proficiency, Defining Issues Test–2 (moral development and character), Miville–Guzman Universality–Diversity Scale (intercultural effectiveness and universal–diverse orientation), and the Ryff Scales of Psychological Well-Being.
exposure to good practices in under gradu-ate education mediate the effects of first-generation status on these outcomes?
first-year outcomes conditional—that is, do the effects differ in magnitude for first-generation students versus non-first-generation students?
RESEARCH METHODSInstitutional Sample
Funded by the Center of Inquiry in the Liberal Arts at Wabash College, the WNSLAE is a large, pretest/posttest longitudinal investiga-tion of the effects of liberal arts colleges and liberal arts experiences on the cognitive and psychosocial outcomes theoretically associated with liberal arts education. The sample in our study consisted of incoming first-year students at 19 four-year and two-year colleges and universities located in 11 different states from the Northeast, Southeast, Midwest, and Pacific Coast regions of the United States that participated in the WNSLAE. These institutions were selected from more than 60 colleges and universities responding to an invitation from WNSLAE. Additionally, these institutions were selected to represent the variety of colleges and universities across the United States, including institutional type and control, size, location, and patterns of student residence. The selection technique overseen by WNSLAE produced a sample with a wide range of academic selectivity and variability in undergraduate enrollment, ranging from public and private institutions with entering classes between 250 and 500 to those with entering classes between 3,000 and 6,000. Because the WNSLAE study was primarily concerned with the impacts of liberal arts colleges and liberal arts experiences, liberal arts colleges were purposefully overrepresented. According to the 2007 Carnegie Classification of Institutions, 3 of the participating institutions were considered research universities, 3 were regional universities that do not grant doctoral
248 Journal of College Student Development
Padgett, Johnson, & Pascarella
degrees, 2 were two-year community colleges, and 11 were liberal arts colleges.
Student SampleThe individuals in the sample were first-year, full-time undergraduate students partici-pating in the WNSLAE from each of the 19 institutions. The initial sample was selected in two distinct approaches. Student samples from each of the larger institutions were randomly selected from the incoming first-year class with those from the largest participating institution randomly selected from the incoming first-year class in the College of Arts and Sciences. Second, for a number of the smallest institu-tions in the study, including all liberal arts colleges, the entire incoming first-year class was sampled. Students in the sample were invited to participate in the WNSLAE study and were informed that they would receive a monetary stipend for their participation in each data collection. Furthermore, student participants were assured in writing that any information they provided would be kept in the strictest confidence and never become part of their institutional records.
Data CollectionThe data collection was conducted in two waves: in Fall 2006 an initial collection measur-ing precollege and demographic characteristics and in Spring 2007 a follow-up assessment measuring college experiences and outcomes. American College Testing (ACT) administered and conducted both the initial and follow-up data collections. The initial data collection comprised of 4,501 students and lasted 90–100 minutes for which each student was paid a stipend of $50 for participating. In addition to measuring precollege and
demographic characteristics and participating in the WNSLAE precollege survey, students also completed a series of instruments that measured dimensions of intellectual and personal development theoretically associated with a liberal arts education. The follow-up administration consisted of two types of data collection and took about 2 hours to complete for which each participating student was paid an additional stipend of $50. The first type of data obtained was based on two complementary questionnaire instruments that collected extensive information on students’ experience of college: the NSSE (Kuh, 2001) and the WNSLAE Student Experiences Survey. All students completed these two instruments prior to any other follow-up data collection. These instruments were specifically designed to capture student engagement in, or exposure to, empirically vetted good practices in undergraduate education (see Pascarella, Wolniak, et al. , 2004; Pascarella et al., 2006). The second type of data collected consisted of posttest scores of the instruments measuring dimensions of intellectual and personal development that were first completed in the initial data collection. Of the original sample of 4,501 students* who participated in the initial data collection, 3,081 participated in the Spring 2007 follow-up data collection, for a response rate of 68.5%. These 3,081 students represented 16.2% of the total population of incoming first-year students at the 19 participating institutions. To adjust for potential response bias by sex, race, academic ability, and institutional type in the sample of students, a weighting algorithm was created in an effort to make the overall sample more similar to the population from which it was drawn. Using data provided by
* Of the 16,570 students who were invited to participate, 4,501 responded, resulting in a 27% response rate. This is a lower bounds estimate because ACT, who was in charge of the data collection, estimates that approximately one third to one half of the overall sample did not receive the invitation to participate.
March/April 2012 vol 53 no 2 249
First-Generation Undergraduate Students
each institution, follow-up participants were weighted up to each institution’s first-year undergraduate population by sex (male or female), race (White, African American / Black, Hispanic/Latino, Asian / Pacific Islander, or other), and ACT composite score (or SAT equivalent score, or COMPASS equivalent score for community college students).
Dependent VariablesOne of the primary strengths of the WNSLAE dataset is the assortment of pretest and posttest measures/outcomes, allowing us to measure total and direct effects of the collegiate experi-ence. Given the unique attributes associated with the population of first-genera tion students, we sought to examine six outcome measures that theoretically account for first-generation student experiences while exploring outcome measures not previously conducted on the first-generation student population. Appendix A thoroughly outlines the operational definition for each variable, including reliability measures. The following is a highlight of each of the six dependent variables, of which four are individual cognitive measures and two are individual psychosocial measures. The first two dependent measures are scaled measurements that represent the inclination to inquire and the desire for life-long learning. The first measure is an 18-item Need for Cognition scale, which refers to a student’s desire to seek and engage in purposeful cognitive activities (Cacioppo, Petty, Feinstein, & Jarvis, 1996). The second measure is a 6-item scale that assesses a student’s Positive Attitude Toward Literacy. This scale is comprised of variables that measure a student’s enjoyment of reading (specifically poetry and scientific and historical texts) and expressing thoughts and ideas in writing activities (Bray, Pascarella, & Pierson, 2004). The third dependent measure is the Collegiate Assessment of Academic Proficiency (CAAP; ACT, 1991), a 32-item instrument developed
by ACT designed to measure a student’s ability to think critically. Fourth, the Defining Issues Test–2 (DIT2; Rest, Narvaez, Thoma, & Bebeau, 1999) measures moral development and character. The DIT2 is a revised version of James Rest’s original Defining Issues Test from 1979 and presents several dilemmas about social problems for the respondent to engage in high order moral reasoning. The fifth measure is the 15-item Miville-Guzman Universality–Diversity Scale (M-GUDS) that measures a student’s intercultural effec-tive ness dimension and universal–diverse orientation, defined as “an attitude of awareness and acceptance of both the similarities and differences among people” (Miville et al., 1999, p. 291; also see Fuertes, Miville, Mohr, Sedlacek, & Gretchen, 2000). The final dependent measure is the Ryff Scales of Psychological Well-Being (RPWB), a 54-item theoretically grounded instrument that specifically focuses on measuring six dimensions of psychological well-being: (a) positive evaluations of oneself, (b) personal sense of continued growth and development, (c) belief in a purposeful and meaningful life, (d) positive relations with others, (e) capacity to effectively manage one’s life and surrounding world, and (f ) autonomy (see Ryff, 1989; Ryff & Keyes, 1995). We averaged the scores on the six scales to create a total composite scale of psychological well-being.
Independent VariablesThe variable of interest in this study was parental education. Prior research has examined parental education as a dichotomous measure: parents who have no college education versus parents who have some college education or college degree(s). Categorizing parental education as such is based on the assumption that students whose parents have minimal levels of college experience will have similar estimates to those whose parents have advanced degrees.
250 Journal of College Student Development
Padgett, Johnson, & Pascarella
Pascarella, Pierson, et al. (2004) categorized parental education into three types: first-generation students, moderate parental college education, and high parental college education. Taking this reasoning one step further, we controlled for a larger portion of variance in parental education and categorized parental education as follows: one or both have some college education but no bachelor’s degree, at least one parent has a bachelor’s degree, both parents have a bachelor’s degree, and at least one parent has a master’s degree or higher. The omitted category was neither parent has any college education (which defines first-generation students for this study). The methodology for this study nearly replicates the analytic model utilized by Pascarella, Pierson, et al. (2004) to accurately estimate the impact of college. This conceptual framework includes taking into account and controlling for: (a) student background characteristics and precollege experiences, (b) institutional type, (c) students’ academic experiences, and (d) students’ nonacademic experiences. The control measures for student background characteristics included gender, race/ethnicity, English as a second language, number of siblings, and parental income. The precollege characteristics included ACT composite score (or equivalent SAT or COMPASS score), worked for pay during high school, volunteered during high school, read for pleasure outside of class, visited a library for research purposes, highest intended academic degree, academic motivation, openness to diversity/challenge, and pretest measures of each outcome variable. Institutional type was controlled for by the inclusion of dummy variables for community colleges, regional colleges, and research universities, with liberal arts colleges being the omitted category. An important purpose of this analysis was to measure first-generation students’ academic and nonacademic college experiences that are
theoretically considered to add to students’ growth on the dependent measures listed above. Using evidence from the body of literature examining good practices linked to personal and intellectual growth in undergraduate education, the WNSLAE team purposefully included items that measured these practices and conducted a factor analysis to create good practices scales. From these good practices scales another factor analysis was conducted to create six global measures of good practices from the WNSLAE study, four of which were incorporated into our analytical model: Academic Challenge and High Expecta tions (31-item scale), Diversity Experiences (9-item scale), Influential Interactions with Peers (9-item scale), and Good Teaching / High-Quality Interactions with Faculty (23-item scale). The good practices measuring Cooperative Learning and Frequency of Interactions with Faculty and Staff were not included in the final analytical model because of the high intercorrelated values between the remaining good practices. While the inclusion of the four scales measured an array of college experiences, five variables not included in these scales but which expose students to good practices are: place of residence, working on campus and off campus, Greek affiliation, member of a sponsored athletic team, and number of liberal arts courses taken.
LIMITATIONS
The WNSLAE study’s primary purpose is to provide data for studying the effects of undergraduate liberal arts experiences on liberal arts colleges. This dataset has three limitations to note when interpreting our findings. First, the dataset is overpopulated with liberal arts colleges, possibly overestimating the effects of the liberal arts experience. Given the analyses are performed on multi-institutional data, it might be preferable to incorporate statistical
March/April 2012 vol 53 no 2 251
First-Generation Undergraduate Students
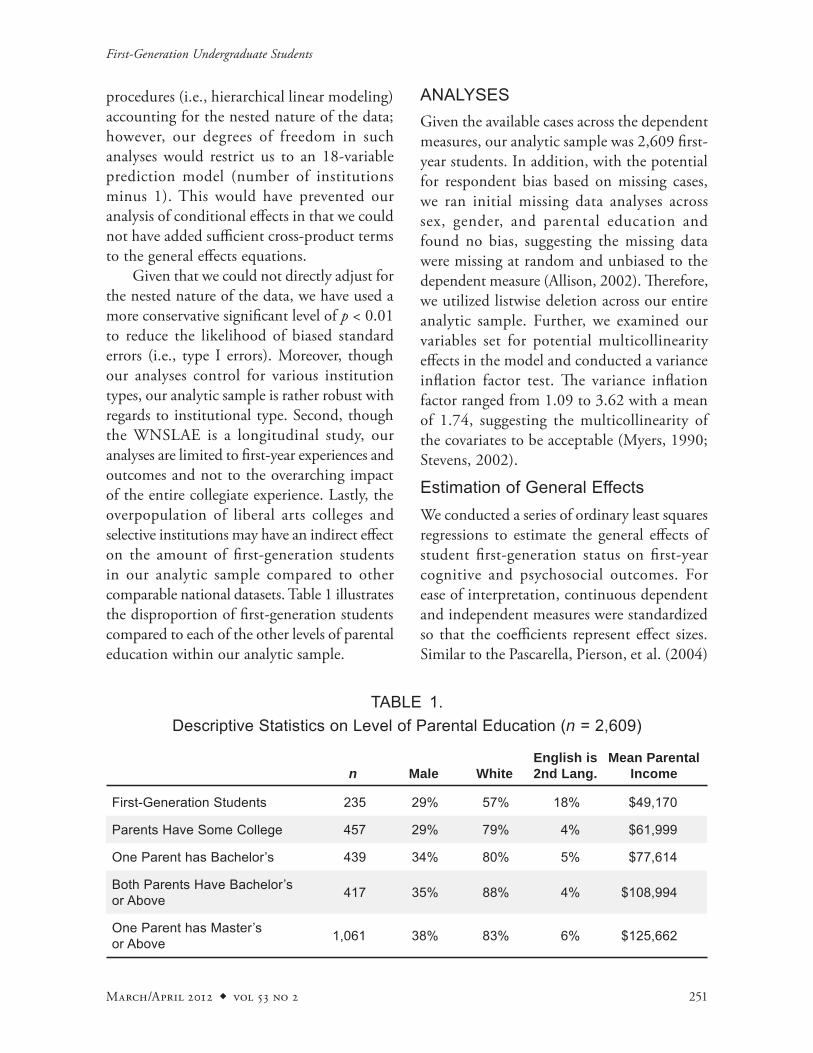
procedures (i.e., hierarchical linear modeling) accounting for the nested nature of the data; however, our degrees of freedom in such analyses would restrict us to an 18-variable prediction model (number of institutions minus 1). This would have prevented our analysis of conditional effects in that we could not have added sufficient cross-product terms to the general effects equations. Given that we could not directly adjust for the nested nature of the data, we have used a more conservative significant level of p < 0.01 to reduce the likelihood of biased standard errors (i.e., type I errors). Moreover, though our analyses control for various institution types, our analytic sample is rather robust with regards to institutional type. Second, though the WNSLAE is a longitudinal study, our analyses are limited to first-year experi ences and outcomes and not to the overarching impact of the entire collegiate experience. Lastly, the overpopulation of liberal arts colleges and selective institutions may have an indirect effect on the amount of first-generation students in our analytic sample compared to other comparable national datasets. Table 1 illustrates the disproportion of first-generation students compared to each of the other levels of parental education within our analytic sample.
ANALYSESGiven the available cases across the dependent measures, our analytic sample was 2,609 first-year students. In addition, with the potential for respondent bias based on missing cases, we ran initial missing data analyses across sex, gender, and parental education and found no bias, suggesting the missing data were missing at random and unbiased to the dependent measure (Allison, 2002). Therefore, we utilized listwise deletion across our entire analytic sample. Further, we examined our variables set for potential multicollinearity effects in the model and conducted a variance inflation factor test. The variance inflation factor ranged from 1.09 to 3.62 with a mean of 1.74, suggesting the multicollinearity of the covariates to be acceptable (Myers, 1990; Stevens, 2002).
Estimation of General EffectsWe conducted a series of ordinary least squares regressions to estimate the general effects of student first-generation status on first-year cognitive and psychosocial outcomes. For ease of interpretation, continuous dependent and independent measures were standardized so that the coefficients represent effect sizes. Similar to the Pascarella, Pierson, et al. (2004)
TABLE 1.Descriptive Statistics on Level of Parental Education (n = 2,609)
n Male WhiteEnglish is 2nd Lang.
Mean Parental Income
First-Generation Students 235 29% 57% 18% $49,170
Parents Have Some College 457 29% 79% 4% $61,999
One Parent has Bachelor’s 439 34% 80% 5% $77,614
Both Parents Have Bachelor’s or Above 417 35% 88% 4% $108,994
One Parent has Master’s or Above 1,061 38% 83% 6% $125,662
252 Journal of College Student Development
Padgett, Johnson, & Pascarella
approach, we conducted our general effects analyses in two stages. In stage one, which we term the Precollege model, each end-of-first-year cognitive and psychosocial outcome was regressed on the four dummy variables representing parental education level (first-generation status being the comparison group) and a battery of precollege and background characteristics (e.g., sex, race/ethnicity, ACT or equivalent composite score, a parallel precollege score on the outcome, high school experiences, and the like). In stage two, which we term the College model, each outcome was regressed on the Precollege model plus the dummy variables representing institutional type and a number of college experience variables, including the good practices scales.
Estimation of Conditional EffectsTo determine if the effects of the good practices scales on first-year cognitive and psycho-social outcomes differed in magnitude for first-generation versus non-first-generation students, a block of cross-product terms was added to the stage two College model. We created four groups of cross-product terms by multiplying each good practices scale by the dummy variables representing four levels of parental education (i.e., parents have some college education, one parent has a bachelor’s degree, both parents have a bachelor’s degree or higher, and one parent has a master’s degree or higher), with first-generation students as the constant comparison group. A significant (p < 0.01) R2 increase associated with the addition of the cross-product terms to the College model indicates the presence of nonchance conditional effects (Cronbach & Snow, 1977; Pascarella & Terenzini, 1991). The regression coefficients for the particular good practices scales in question come from different subpopulations represented within the aggregate sample (Cronbach & Snow). Put another way: it indicates that the estimated
effects of the good practices scales on first-year cognitive and psychosocial outcomes differ in magnitude for first-generation versus non-first-generation students. To illustrate most clearly the nature of each statistically significant conditional effect, we subsequently carried out a procedure suggested by a number of scholars who have estimated conditional effects (e.g., Cronbach & Snow; Pascarella & Terenzini). Specifically, we reran the College model general effects equation separately for the first-generation and the specific non-first-generation group indicated by each significant cross-product term. We then compared the significantly different regression coefficients for the appropriate good practices scale across the respective subsamples.
RESULTSGeneral Effects
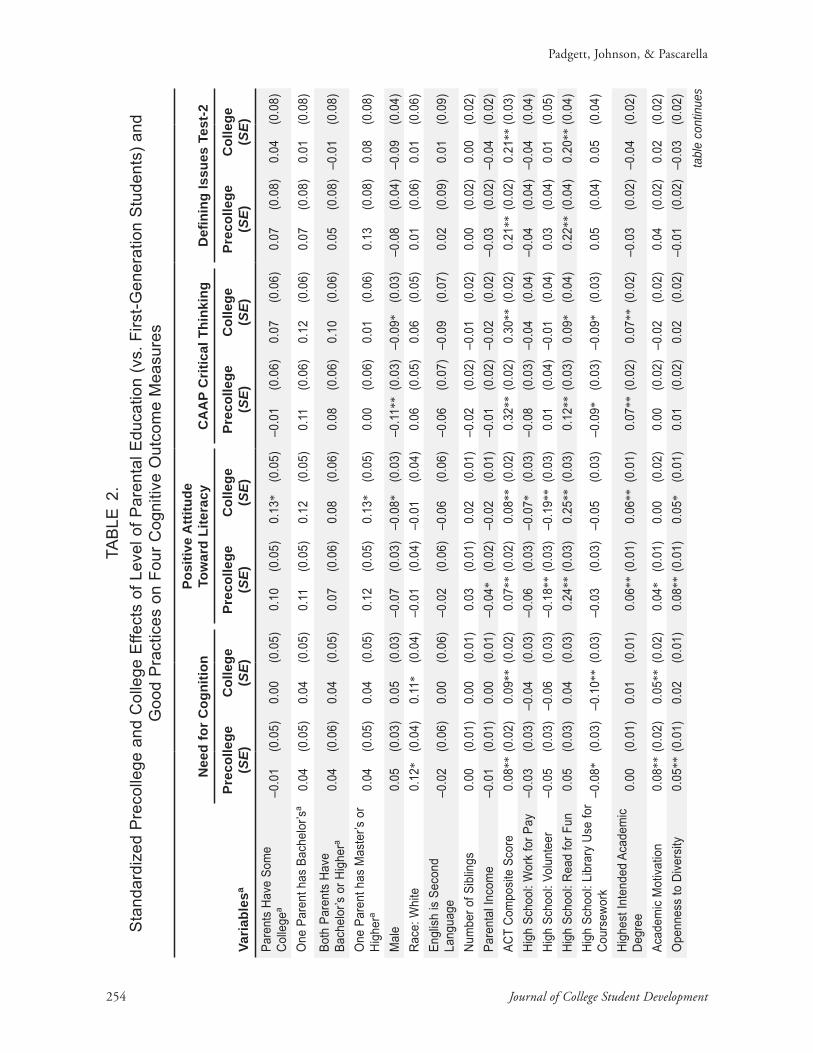
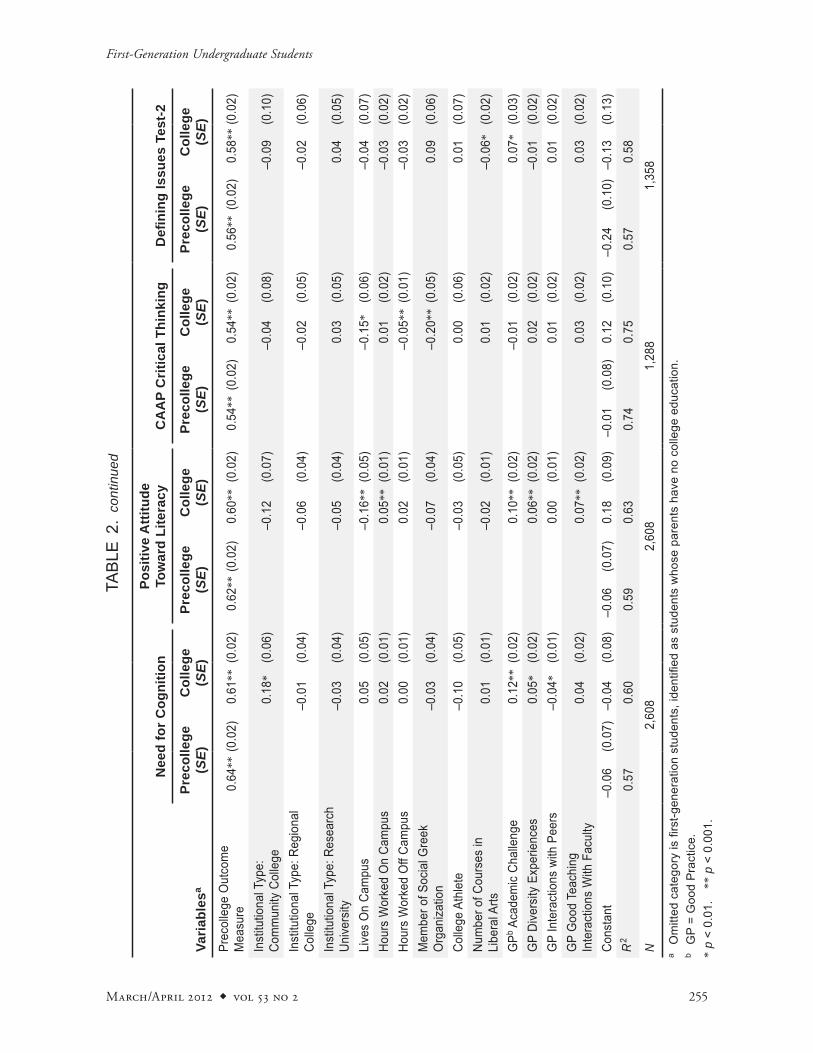
Tables 2 and 3 summarize the standardized precollege and college effects of level of parental education on four cognitive and two psychosocial college outcomes measured after the first year of college. Across three of the six outcome measures, first-generation students are significantly at a disadvantage in cognitive and psychosocial measures compared to students whose parents have higher levels of education. Level of parental education had no significant effect on three cognitive outcomes (Need for Cognition, CAAP Critical Thinking, and DIT2). However, first-generation students are disadvantaged in their development on the Positive Attitude Toward Literacy compared to students whose parents have at least some college education. Within the Precollege model no significant differences existed between non-first-generation students and first-generation students. Once the college experience vari-ables and good practices were introduced, a significant positive effect became prevalent for the dichotomous variables measuring
March/April 2012 vol 53 no 2 253
First-Generation Undergraduate Students
students whose parents have some college and at least one parent has a master’s degree or higher. This suggests that a suppression effect exists, in which the predictive validity of the variables measuring students whose parents have some college and those with at least one parent who has a master’s degree or higher increased once the college-level variables were introduced into the model (see Conger, 1974; MacKinnon, Krull, & Lockwood, 2000). The relationship between parental education and Positive Attitude Toward Literacy becomes more pronounced once college experiences and good practices have been introduced into the College model, suggesting that first-year college experiences enhance the benefits in Positive Attitude Toward Literacy that accrue to those students whose parents have some college and to those students with at least one parent having a master’s degree or higher. Moreover, though these lone significant effects indicate that being a first-generation student has a modestly negative effect across Positive Attitude Toward Literacy, no differences exist across levels of parental education on the other three diverse measures of cognitive development. Conversely, a student’s parental education level is a key predictor of success across both measures of psychosocial development in this analysis. First-generation students continue to be at a disadvantage compared to non-first-generation students across the M-GUDS Total Diversity Scale and the RPWB. After controlling for precollege and background characteristics, being a first-generation student had a significantly moderate, negative effect on both scales. After accounting for college experiences and the good practices within the college model, three of the five negative effects continued to persist for first-generation students. Unlike the results measuring cognitive development, being a first-generation student clearly has a statistically significant negative
effect across psychosocial measures estimating diversity and well-being. As the results indicate, the magnitude of the effects decreased slightly or remained the same from the significant Precollege and College models across all significant cognitive and psychosocial outcomes. These slight decreases are explained by the inclusion of pretest outcome measures and accounting for college experiences and the good practices measures. More importantly, the continuing presence of significant effects across models suggests level of parental education is a key predictor of cognitive and psychosocial outcomes even with strongly predictive covariates.
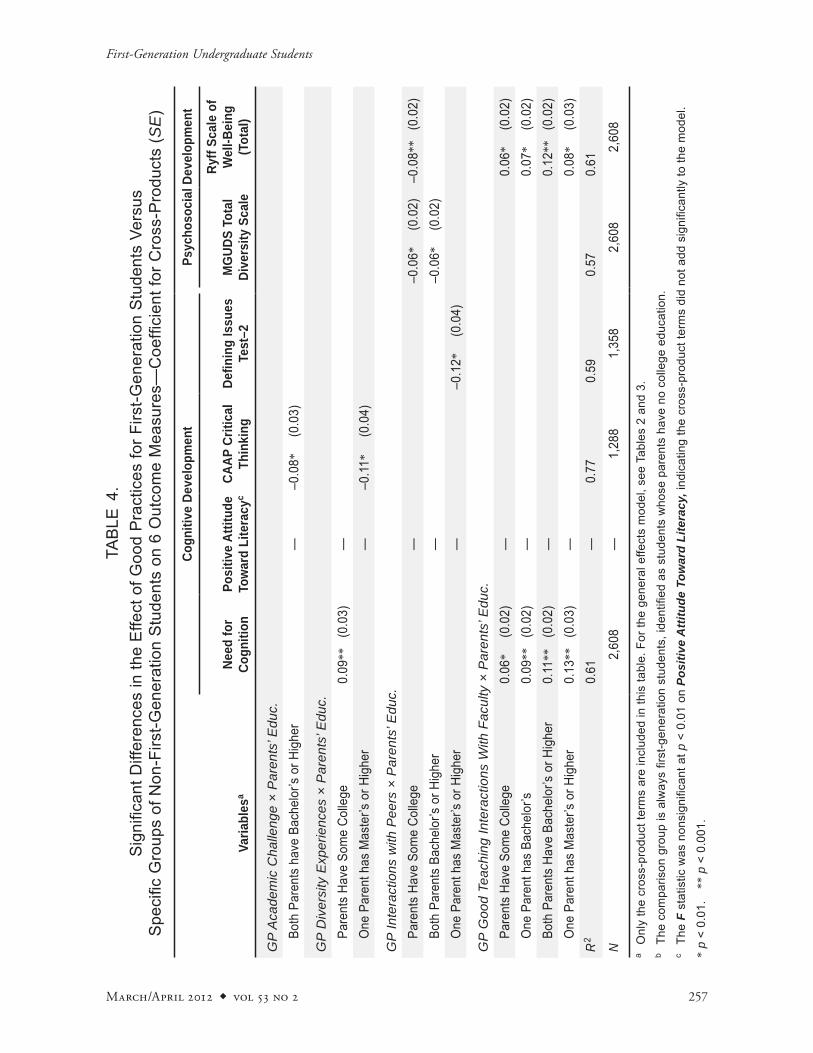
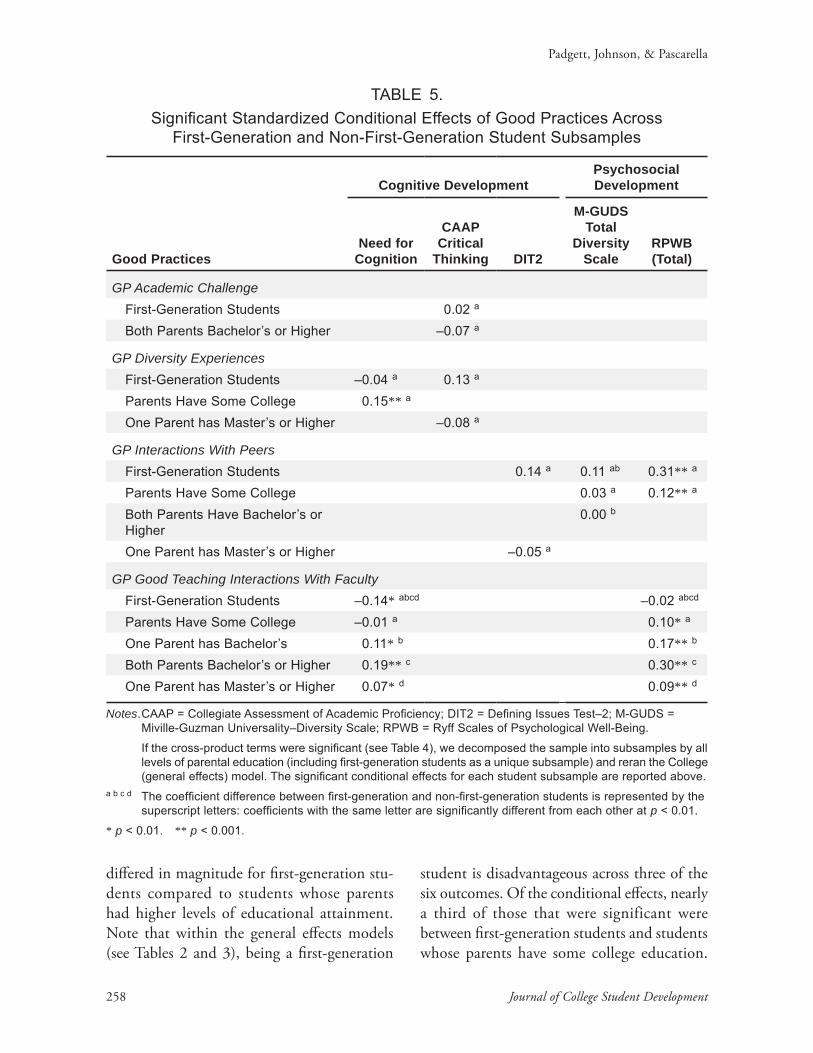
Conditional EffectsAnalyses to determine the presence of condi-tional effects yielded a statistically significant increase in R2 (p < 0.01) across five outcome measures. Table 4 presents those cross-product terms that were statistically significant when added to the general effects (College) model. While computationally possible, it is a somewhat complex undertaking to determine the substantive nature of the conditional effects from the significant cross-product terms shown in Table 4. A clearer picture of the nature of the significant conditional effects we uncovered is presented in Table 5 which summarizes statistically significant differences in the estimated net effects of specific good practices measures on first-year outcomes for first-generation versus non-first-generation students. In all cases, coefficients with the same letter superscript are significantly different in magnitude from each other at p < 0.01. As Table 5 illustrates, we uncovered a moderate number of conditional effects involv ing the good practices scales and level of parental edu cation. Indeed, the good practices scales had effects across nearly every cognitive and psychosocial outcome that
254 Journal of College Student Development
Padgett, Johnson, & Pascarella
TAB
LE 2
.S
tand
ardi
zed
Pre
colle
ge a
nd C
olle
ge E
ffect
s of
Lev
el o
f Par
enta
l Edu
catio
n (v
s. F
irst-G
ener
atio
n S
tude
nts)
and
G
ood
Pra
ctic
es o
n Fo
ur C
ogni
tive
Out
com
e M
easu
res
Nee
d fo
r C
ogni
tion
Posi
tive
Atti
tude
To
war
d Li
tera
cyC
AA
P C
ritic
al T
hink
ing
Defi
ning
Issu
es T
est-2
Varia
bles
aPr
ecol
lege
(S
E)C
olle
ge
(SE)
Pr
ecol
lege
(S
E)C
olle
ge
(SE)
Pr
ecol
lege
(S
E)C
olle
ge
(SE)
Pr
ecol
lege
(S
E)C
olle
ge
(SE)
Pare
nts
Have
Som
e Co
llege
a–0
.01
(0.0
5)0.
00(0
.05)
0.10
(0.0
5)0.
13*
(0.0
5)–0
.01
(0.0
6)0.
07(0
.06)
0.07
(0.0
8)0.
04(0
.08)
One
Par
ent h
as B
ache
lor’s
a0.
04(0
.05)
0.04
(0.0
5)0.
11(0
.05)
0.12
(0.0
5)0.
11(0
.06)
0.12
(0.0
6)0.
07(0
.08)
0.01
(0.0
8)Bo
th P
aren
ts H
ave
Bach
elor
’s or
Hig
hera
0.04
(0.0
6)0.
04(0
.05)
0.07
(0.0
6)0.
08(0
.06)
0.08
(0.0
6)0.
10(0
.06)
0.05
(0.0
8)–0
.01
(0.0
8)
One
Par
ent h
as M
aste
r’s o
r Hi
gher
a0.
04(0
.05)
0.04
(0.0
5)0.
12(0
.05)
0.13
*(0
.05)
0.00
(0.0
6)0.
01(0
.06)
0.13
(0.0
8)0.
08(0
.08)
Mal
e0.
05(0
.03)
0.05
(0.0
3)–0
.07
(0.0
3)–0
.08*
(0.0
3)–0
.11*
*(0
.03)
–0.0
9*(0
.03)
–0.0
8(0
.04)
–0.0
9(0
.04)
Race
: Whi
te0.
12*
(0.0
4)0.
11*
(0.0
4)–0
.01
(0.0
4)–0
.01
(0.0
4)0.
06(0
.05)
0.06
(0.0
5)0.
01(0
.06)
0.01
(0.0
6)En
glish
is S
econ
d La
ngua
ge–0
.02
(0.0
6)0.
00(0
.06)
–0.0
2(0
.06)
–0.0
6(0
.06)
–0.0
6(0
.07)
–0.0
9(0
.07)
0.02
(0.0
9)0.
01(0
.09)
Num
ber o
f Sib
lings
0.00
(0.0
1)0.
00(0
.01)
0.03
(0.0
1)0.
02(0
.01)
–0.0
2(0
.02)
–0.0
1(0
.02)
0.00
(0.0
2)0.
00(0
.02)
Pare
ntal
Inco
me
–0.0
1(0
.01)
0.00
(0.0
1)–0
.04*
(0.0
2)–0
.02
(0.0
1)–0
.01
(0.0
2)–0
.02
(0.0
2)–0
.03
(0.0
2)–0
.04
(0.0
2)AC
T Co
mpo
site
Scor
e0.
08**
(0.0
2)0.
09**
(0.0
2)0.
07**
(0.0
2)0.
08**
(0.0
2)0.
32**
(0.0
2)0.
30**
(0.0
2)0.
21**
(0.0
2)0.
21**
(0.0
3)Hi
gh S
choo
l: W
ork
for P
ay–0
.03
(0.0
3)–0
.04
(0.0
3)–0
.06
(0.0
3)–0
.07*
(0.0
3)–0
.08
(0.0
3)–0
.04
(0.0
4)–0
.04
(0.0
4)–0
.04
(0.0
4)Hi
gh S
choo
l: Vo
lunt
eer
–0.0
5(0
.03)
–0.0
6(0
.03)
–0.1
8**
(0.0
3)–0
.19*
*(0
.03)
0.01
(0.0
4)–0
.01
(0.0
4)0.
03(0
.04)
0.01
(0.0
5)Hi
gh S
choo
l: Re
ad fo
r Fun
0.05
(0.0
3)0.
04(0
.03)
0.24
**(0
.03)
0.25
**(0
.03)
0.12
**(0
.03)
0.09
*(0
.04)
0.22
**(0
.04)
0.20
**(0
.04)
High
Sch
ool:
Libr
ary
Use
for
Cour
sewo
rk–0
.08*
(0.0
3)–0
.10*
*(0
.03)
–0.0
3(0
.03)
–0.0
5(0
.03)
–0.0
9*(0
.03)
–0.0
9*(0
.03)
0.05
(0.0
4)0.
05(0
.04)
High
est I
nten
ded
Acad
emic
Degr
ee0.
00(0
.01)
0.01
(0.0
1)0.
06**
(0.0
1)0.
06**
(0.0
1)0.
07**
(0.0
2)0.
07**
(0.0
2)–0
.03
(0.0
2)–0
.04
(0.0
2)
Acad
emic
Mot
ivatio
n0.
08**
(0.0
2)0.
05**
(0.0
2)0.
04*
(0.0
1)0.
00(0
.02)
0.00
(0.0
2)–0
.02
(0.0
2)0.
04(0
.02)
0.02
(0.0
2)O
penn
ess
to D
ivers
ity0.
05**
(0.0
1)0.
02(0
.01)
0.08
**(0
.01)
0.05
*(0
.01)
0.01
(0.0
2)0.
02(0
.02)
–0.0
1(0
.02)
–0.0
3(0
.02)
tabl
e co
ntin
ues
March/April 2012 vol 53 no 2 255
First-Generation Undergraduate Students
Nee
d fo
r C
ogni
tion
Posi
tive
Atti
tude
To
war
d Li
tera
cyC
AA
P C
ritic
al T
hink
ing
Defi
ning
Issu
es T
est-2
Varia
bles
aPr
ecol
lege
(S
E)C
olle
ge
(SE)
Pr
ecol
lege
(S
E)C
olle
ge
(SE)
Pr
ecol
lege
(S
E)C
olle
ge
(SE)
Pr
ecol
lege
(S
E)C
olle
ge
(SE)
Prec
olle
ge O
utco
me
Mea
sure
0.64
**(0
.02)
0.61
**(0
.02)
0.62
**(0
.02)
0.60
**(0
.02)
0.54
**(0
.02)
0.54
**(0
.02)
0.56
**(0
.02)
0.58
**(0
.02)
Inst
itutio
nal T
ype:
Co
mm
unity
Col
lege
0.18
*(0
.06)
–0.1
2(0
.07)
–0.0
4(0
.08)
–0.0
9(0
.10)
Inst
itutio
nal T
ype:
Reg
iona
l Co
llege
–0.0
1(0
.04)
–0.0
6(0
.04)
–0.0
2(0
.05)
–0.0
2(0
.06)
Inst
itutio
nal T
ype:
Res
earc
h Un
ivers
ity–0
.03
(0.0
4)–0
.05
(0.0
4)0.
03(0
.05)
0.04
(0.0
5)
Live
s O
n Ca
mpu
s0.
05(0
.05)
–0.1
6**
(0.0
5)–0
.15*
(0.0
6)–0
.04
(0.0
7)Ho
urs
Wor
ked
On
Cam
pus
0.02
(0.0
1)0.
05**
(0.0
1)0.
01(0
.02)
–0.0
3(0
.02)
Hour
s W
orke
d O
ff Ca
mpu
s0.
00(0
.01)
0.02
(0.0
1)–0
.05*
*(0
.01)
–0.0
3(0
.02)
Mem
ber o
f Soc
ial G
reek
O
rgan
izatio
n–0
.03
(0.0
4)–0
.07
(0.0
4)–0
.20*
*(0
.05)
0.09
(0.0
6)
Colle
ge A
thle
te–0
.10
(0.0
5)–0
.03
(0.0
5)0.
00(0
.06)
0.01
(0.0
7)Nu
mbe
r of C
ours
es in
Li
bera
l Arts
0.01
(0.0
1)–0
.02
(0.0
1)0.
01(0
.02)
–0.0
6*(0
.02)
GPb A
cade
mic
Chal
leng
e0.
12**
(0.0
2)0.
10**
(0.0
2)–0
.01
(0.0
2)0.
07*
(0.0
3)G
P Di
vers
ity E
xper
ienc
es0.
05*
(0.0
2)0.
06**
(0.0
2)0.
02(0
.02)
–0.0
1(0
.02)
GP
Inte
ract
ions
with
Pee
rs–0
.04*
(0.0
1)0.
00(0
.01)
0.01
(0.0
2)0.
01(0
.02)
GP
Goo
d Te
achi
ng
Inte
ract
ions
With
Fac
ulty
0.04
(0.0
2)0.
07**
(0.0
2)0.
03(0
.02)
0.03
(0.0
2)
Cons
tant
–0.0
6(0
.07)
–0.0
4(0
.08)
–0.0
6(0
.07)
0.18
(0.0
9)–0
.01
(0.0
8)0.
12(0
.10)
–0.2
4(0
.10)
–0.1
3(0
.13)
R2
0.57
0.60
0.59
0.63
0.74
0.75
0.57
0.58
N 2
,608
2,
608
1,
288
1,
358
a O
mitt
ed c
ateg
ory
is fi
rst-g
ener
atio
n st
uden
ts, i
dent
ified
as
stud
ents
who
se p
aren
ts h
ave
no c
olle
ge e
duca
tion.
b G
P =
Goo
d P
ract
ice.
* p
< 0.
01.
** p
< 0
.001
.
TAB
LE 2
. co
ntin
ued
256 Journal of College Student Development
Padgett, Johnson, & Pascarella
TABLE 3.Standardized Precollege and College Effects of Level of Parental Education and
Good Practices on Two Psychosocial Outcome Measures
M-GUDS Total Diversity Scaleb RPWB (Total)c
Variablesa Precollege (SE) College (SE) Precollege (SE) College (SE)
Parents Have Some Collegea 0.15* (0.05) 0.15* (0.05) 0.26** (0.05) 0.23** (0.05)
One Parent has Bachelor’sa 0.07 (0.06) 0.07 (0.05) 0.14* (0.06) 0.10 (0.05)
Both Parents Bachelor’s or Highera 0.09 (0.06) 0.07 (0.06) 0.21** (0.06) 0.17* (0.06)
One Parent has Master’s or Highera 0.11 (0.05) 0.12 (0.05) 0.14* (0.05) 0.10 (0.05)Male 0.00 (0.03) –0.05 (0.03) –0.02 (0.03) –0.05 (0.03)Race: White 0.00 (0.04) –0.04 (0.04) 0.14** (0.04) 0.01 (0.04)English is Second Language 0.00 (0.06) –0.06 (0.06) –0.12 (0.06) –0.13 (0.06)Number of Siblings –0.01 (0.01) –0.02 (0.01) –0.01 (0.01) –0.02 (0.01)Parental Income –0.02 (0.02) 0.00 (0.02) 0.00 (0.02) 0.00 (0.01)ACT Composite Score 0.02 (0.02) 0.01 (0.02) 0.02 (0.02) –0.01 (0.02)High School: Work for Pay 0.01 (0.03) –0.02 (0.03) 0.00 (0.03) –0.02 (0.03)High School: Volunteer –0.07 (0.03) –0.08* (0.03) –0.01 (0.03) –0.03 (0.03)High School: Read for Fun 0.05 (0.03) 0.04 (0.03) –0.01 (0.03) –0.02 (0.03)High School: Library Use for Coursework 0.13** (0.03) 0.10** (0.03) 0.01 (0.03) 0.01 (0.03)
Highest Intended Academic Degree 0.00 (0.02) –0.01 (0.01) –0.03 (0.01) –0.03 (0.01)Academic Motivation –0.02 (0.02) –0.06** (0.02) 0.01 (0.02) –0.03 (0.01)Openness to Diversity 0.17** (0.02) 0.12** (0.02) 0.04* (0.01) 0.01 (0.01)Precollege Outcome Measure 0.56** (0.02) 0.52** (0.02) 0.68** (0.02) 0.59** (0.01)Institutional Type: Comm. College –0.14 (0.07) –0.04 (0.06)Institutional Type: Regional College –0.06 (0.04) 0.00 (0.04)Institutional Type: Research University 0.00 (0.04) 0.11* (0.04)
Lived On Campus –0.16** (0.05) –0.16** (0.05)Hours Worked On Campus 0.01 (0.01) 0.01 (0.01)Hours Worked Off Campus 0.05** (0.01) 0.02 (0.01)Member of Social Greek Organization 0.21** (0.04) 0.06 (0.04)
College Athlete –0.06 (0.05) –0.07 (0.05)Number of Courses in Liberal Arts 0.02 (0.01) 0.03 (0.01)GPd Academic Challenge 0.05* (0.02) 0.09** (0.02)GP Diversity Experiences 0.17** (0.02) –0.01 (0.02)GP Interactions With Peers –0.01 (0.02) 0.20** (0.02)GP Good Teaching Interactions With Faculty 0.11** (0.02) 0.11** (0.02)
Constant –0.16 (0.07) 0.09 (0.09) –0.25** (0.07) 0.06 (0.09)R2 0.50 0.56 0.52 0.60N 2,608 2,608
a Omitted category is first-generation students, identified as students whose parents have no college education.b M-GUDS = Miville-Guzman Universality–Diversity Scale.c RPWB = Ryff Scales of Psychological Well-Being. d GP = Good Practice. * p < 0.01. ** p < 0.001.
March/April 2012 vol 53 no 2 257
First-Generation Undergraduate Students
TAB
LE 4
.S
ignific
ant D
iffer
ence
s in
the
Effe
ct o
f Goo
d P
ract
ices
for F
irst-G
ener
atio
n S
tude
nts
Vers
us
Spe
cific
Gro
ups
of N
on-F
irst-G
ener
atio
n S
tude
nts
on 6
Out
com
e M
easu
res—
Coe
ffici
ent f
or C
ross
-Pro
duct
s (S
E)
Cogn
itive
Dev
elop
men
t Ps
ycho
soci
al D
evel
opm
ent
Varia
bles
aNe
ed fo
r Co
gniti
onPo
sitiv
e At
titud
e To
war
d Li
tera
cyc
CAAP
Crit
ical
Th
inki
ngDe
finin
g Is
sues
Te
st–2
MG
UDS
Tota
l Di
vers
ity S
cale
Ryff
Scal
e of
W
ell-B
eing
(T
otal
)
GP
Aca
dem
ic C
halle
nge
× P
aren
ts’ E
duc.
Bo
th P
aren
ts h
ave
Bach
elor
’s or
Hig
her
—–0
.08*
(0.0
3)
GP
Div
ersi
ty E
xper
ienc
es ×
Par
ents
’ Edu
c.
Pare
nts
Have
Som
e Co
llege
0.09
**(0
.03)
—
One
Par
ent h
as M
aste
r’s o
r Hig
her
—–0
.11*
(0.0
4)
GP
Inte
ract
ions
with
Pee
rs ×
Par
ents
’ Edu
c.
Pare
nts
Have
Som
e Co
llege
—–0
.06*
(0.0
2)–0
.08*
*(0
.02)
Bo
th P
aren
ts B
ache
lor’s
or H
ighe
r—
–0.0
6*(0
.02)
O
ne P
aren
t has
Mas
ter’s
or H
ighe
r—
–0.1
2*(0
.04)
GP
Goo
d Te
achi
ng In
tera
ctio
ns W
ith F
acul
ty ×
Par
ents
’ Edu
c.
Pare
nts
Have
Som
e Co
llege
0.06
*(0
.02)
—0.
06*
(0.0
2)
One
Par
ent h
as B
ache
lor’s
0.09
**(0
.02)
—0.
07*
(0.0
2)
Both
Par
ents
Hav
e Ba
chel
or’s
or H
ighe
r0.
11**
(0.0
2)—
0.12
**(0
.02)
O
ne P
aren
t has
Mas
ter’s
or H
ighe
r0.
13**
(0.0
3)—
0.08
*(0
.03)
R2
0.61
—0.
770.
590.
570.
61
N2,
608
—1,
288
1,35
8
2,60
82,
608
a O
nly
the
cros
s-pr
oduc
t ter
ms
are
incl
uded
in th
is ta
ble.
For
the
gene
ral e
ffect
s m
odel
, see
Tab
les
2 an
d 3.
b Th
e co
mpa
rison
gro
up is
alw
ays fir
st-g
ener
atio
n st
uden
ts, i
dent
ified
as
stud
ents
who
se p
aren
ts h
ave
no c
olle
ge e
duca
tion.
c Th
e F
stat
istic
was
non
sign
ifica
nt a
t p <
0.0
1 on
Pos
itive
Atti
tude
Tow
ard
Lite
racy
, ind
icat
ing
the
cros
s-pr
oduc
t ter
ms
did
not a
dd s
ignific
antly
to th
e m
odel
.
* p
< 0.
01.
** p
< 0
.001
.
258 Journal of College Student Development
Padgett, Johnson, & Pascarella
differed in magnitude for first-generation stu-dents compared to students whose parents had higher levels of educational attainment. Note that within the general effects models (see Tables 2 and 3), being a first-generation
student is disadvantageous across three of the six outcomes. Of the conditional effects, nearly a third of those that were significant were between first-generation students and students whose parents have some college education.
TABLE 5.Significant Standardized Conditional Effects of Good Practices Across
First-Generation and Non-First-Generation Student Subsamples
Cognitive DevelopmentPsychosocial Development
Good PracticesNeed for
Cognition
CAAP Critical
Thinking DIT2
M-GUDS Total
Diversity Scale
RPWB (Total)
GP Academic Challenge First-Generation Students 0.02 a
Both Parents Bachelor’s or Higher –0.07 a
GP Diversity Experiences First-Generation Students –0.04 a 0.13 a
Parents Have Some College 0.15** a
One Parent has Master’s or Higher –0.08 a
GP Interactions With Peers First-Generation Students 0.14 a 0.11 ab 0.31** a
Parents Have Some College 0.03 a 0.12** a
Both Parents Have Bachelor’s or Higher
0.00 b
One Parent has Master’s or Higher –0.05 a
GP Good Teaching Interactions With Faculty First-Generation Students –0.14* abcd –0.02 abcd
Parents Have Some College –0.01 a 0.10* a
One Parent has Bachelor’s 0.11* b 0.17** b
Both Parents Bachelor’s or Higher 0.19** c 0.30** c
One Parent has Master’s or Higher 0.07* d 0.09** d
Notes. CAAP = Collegiate Assessment of Academic Proficiency; DIT2 = Defining Issues Test–2; M-GUDS = Miville-Guzman Universality–Diversity Scale; RPWB = Ryff Scales of Psychological Well-Being.
If the cross-product terms were significant (see Table 4), we decomposed the sample into subsamples by all levels of parental education (including first-generation students as a unique subsample) and reran the College (general effects) model. The significant conditional effects for each student subsample are reported above.
a b c d The coefficient difference between first-generation and non-first-generation students is represented by the superscript letters: coefficients with the same letter are significantly different from each other at p < 0.01.
* p < 0.01. ** p < 0.001.
March/April 2012 vol 53 no 2 259
First-Generation Undergraduate Students
This suggests that even students whose parents have only modest exposure to postsecondary education can have the same experiences as their first-generation peers, but be influenced differently by those experiences. Except for two isolated exceptions, the individual significant conditional effects in Table 5 highlight a rather consistent phenomenon with regard to first-generation students’ involvement in each of the good practices. First-generation students derived greater net cognitive and psychosocial bene-fits from frequent interaction with peers and participation in experiences that were academically challenging than did their non-first-generation peers. Conversely, non-first-generation students appear to derive greater Need for Cognition and psychological well-being benefits from exposure to good teaching and high-quality interactions with faculty than did their first-generation counterparts. Finally, it appeared that participation in diversity experiences had a somewhat contradictory influence on cognitive development for first-generation students: having significantly stronger positive effects on first-year critical thinking for first-generation students than for students with the most educated parents, while having a less positive effect on Need for Cognition for first-generation students than it did for their counterparts whose parents had at least some exposure to college.
DISCUSSION
Pascarella, Pierson, et al.’s (2004) investigation of first-generation students across various cognitive and critical thinking outcomes after the second and third year of college yielded effects that were both isolated and inconsistent. Our analysis contributes additional evidence concerning the effects of the level of parental education on six cognitive and psychosocial outcomes at the end of the first year of postsecondary education.
Net of confounding influences, first-generation students are scoring at a significantly lower level across Positive Attitude Toward Literacy and psychosocial outcomes compared to non-first-generation students. Though these significant differences across levels of parental education existed on three outcomes, an important distinction is the consistency with which students whose parents have some college perform at significantly higher levels across Positive Attitude Toward Literacy, M-GUDS Total Diversity Scale, and the RPWB compared to first-generation students. In other words, students whose parent(s) attended a college or university but did not receive a bachelor’s degree were more likely to score higher across all significant cognitive and psychosocial outcomes com-pared to first-generation students. These findings reinforce sociological theory that even minimal or non-degree-obtaining college experiences by parents may create enough of an understanding of the value and importance of a college education that parents transmit their cultural capital through resources and personal experiences (McDonough, 1997). Furthermore, these finite experiences may be powerful and influential enough that parents’ interpersonal relationships with their children likely reinforced the values, norms, and expectations about the collegiate experience that non-first-generation students use to navigate through the first year in college. By alleviating the mystery and complexities of the first year, non-first-generation students would theoretically be more readily prepared to transfer their efforts in sound educational practices rather than designating effort to navigate blindly through the complex college milieu. Recent research by Attewell and Lavin (2007) examining the effects of the open access initiative at City University of New York in 1970 found that a child’s chance of educational success increases if the mother attended
260 Journal of College Student Development
Padgett, Johnson, & Pascarella
any amount of college. Attewell and Lavin’s findings suggest that even the slightest amount of college attendance has similar value on the transmission of intergenerational benefits as the highest level of education attainment. While the effects of parents’ educational attainment yielded varying significant net differences, students whose parents have some college and students with at least one parent having a master’s degree or above were significantly advantaged over first-generation students on the cognitive measure Positive Attitude Toward Literacy. Indeed, students with parents who had only a minimal exposure to college had the same net advantage over first-generation students in orientation toward literacy as did their counterparts who had at least one parent with a graduate degree. Furthermore, these significant advantages only appeared when other college experiences and the good practices variables were added to the model. This suggests that college experiences act as modest suppressor variables on non-first-generation students’ Positive Attitude Toward Literacy. It is important to note that each of the four cognitive outcomes measure a distinct dimension of cognitive development; therefore, it would be problematic to conclude that first-generation students perform lower in their overall cognitive development than their non-first-generation peers. The inconsistency of significant net differences across levels of parental education may shed light on the distinct aspects of each cognitive outcome that are influenced by level of parental education. At the end of the first year of college, first-generation students report lower levels of enjoyment of literacy activities and writing compared to students whose parents have some college experience and students who have a parent with a master’s degree or higher. This finding supports aspects of cultural capital theory that college-educated parents transmit skills, attitudes, and interests to their
children about the importance of engaging in educationally meaningful activities such as reading and writing. Whereas parents who have no college experience are placed at a disadvantage in transmitting knowledge and expectations about the rigors of the collegiate environment to their children, parents with exposure to postsecondary education are not at such a disadvantage. Two levels of parental exposure to post-secondary education were linked to significant advantages over first-generation students on both psychosocial measures (M-GUDS Total Diversity Scale and RPWB). These, too, highlight the importance of how parental education may enhance a student’s personal and interpersonal development during college. Across the M-GUDS Total Diversity Scale and RPWB, students whose parents were exposed to college, as compared to their first-generation peers, exhibited significantly higher levels of openness to diversity and psychological well-being. Specifically, within the Precollege model estimating a student’s psychological well-being, every level of parental postsecondary education is significantly advantaged over first-generation students. Thus, it would appear that students whose parents have some exposure to college are more able to take social and cultural capital and use it to convert college experiences into greater psychosocial development than are their first-generation peers. The conditional effects we uncovered clearly suggest that good practices often differ significantly in their influence on cognitive and psychosocial development for first-generation students and their non-first-generation peers. For example, first-generation students appear to derive significantly greater cognitive and psychosocial benefits from exposure to academically challenging experiences and from their interactions with peers than do students whose parents have higher levels of postsecondary education; conversely, their
March/April 2012 vol 53 no 2 261
First-Generation Undergraduate Students
interactions with faculty appear to negatively influence several dimensions of development. This latter finding is consistent with some aspects of social capital theory, in that it suggests upon entrance to college first-generation students are not as well equipped as their peers to derive the potential developmental benefits that stem from interactions with an institution’s faculty. Failure to examine conditional effects in this investigation would have masked important differences in the role of exposure to specific good practices on the cognitive and psychosocial development of first-generation and other students. Thus, this study further underscores the importance of testing for conditional effects in diverse student samples. Simply assuming that general effects sufficiently model the dynamic reality of college impact fails to consider how individual differences among students shape the impact of the postsecondary experience.
IMPLICATIONS
The sociological theory underpinning this study supports the assumption that incoming first-generation students are at a disadvantage compared to their non-first-generation peers given the deficit in cultural and social capital transmitted through generations. Though prior research has begun the study of first-generation students’ experience of college (e.g., Filkins & Doyle, 2002; Pascarella, Pierson, et al., 2004), this study more broadly confirms the potential intergenerational benefits of parental exposure to college on the developmental impact that college has on students. In addition, the results reinforce earlier work (Pascarella, Pierson, et al.) that first-generation students and their non-first-generation peers may benefit in different ways from exposure to the same empirically vetted good practices in undergraduate education.
Intuitively, college experiences that have been empirically tested as good practices should theoretically benefit students; however, our findings indicate that the effects of good practices were not a universal benefit for first-generation students. Interacting with faculty was found to negatively affect first-generation students’ Need for Cognition and psychological well-being. Though prior research suggests a positive relationship exists between student–faculty interaction and student learning and cognitive development (Astin, 1993; Cruce et al., 2006; Kuh & Hu, 2001; Pascarella & Terenzini, 1991, 2005; Terenzini, Pascarella, & Blimling, 1996), first-generation students who had good teaching interactions with faculty report lower performance on cognition and psychological well-being compared to their non-first-generation peers. This suggests that first-generation students are underprepared to interact with faculty upon entering college. First-generation students, who theoretically are more likely to maintain lower levels of social capital, may not have been predisposed or encouraged to seek help and consultation from faculty members in high school; thus, these valued experiences from high school are not translated into college for them. When first-generation students begin interacting with faculty within the college classroom, a level of discomfort and intimidation may exist, which can be overwhelming for any student. As students begin to formulate college-going plans early in their high school years (see Hossler, Schmit, & Vesper, 1999), encouraging first-generation students to begin seeking help and formulating academic discussions with high school faculty will prepare them to be less intimidated by interaction with college faculty. First-generation students’ diminished participation in positive peer interactions indicates the importance of emphasizing the utilization of collaborative learning environments and integrating cocurricular acti-
262 Journal of College Student Development
Padgett, Johnson, & Pascarella
vi ties for incoming first-generation students. Prior research indicates the value of peer interactions as academic and personal networks (e.g., Astin, 1993; Tierney et al., 2005), and our findings support similar assertions (e.g., Kuh, 1995; Kuh et al., 1997; Tierney et al.; Whitt et al., 1999) that first-generation students who interact with peers have greater effect sizes on moral development and character, intercultural effectiveness and universal–diverse orientation, and psychological well-being. Given the assumed lower social capital that first-gen-era tion students presumably enter college with compared to their non-first-generation peers, conversations and collaborations with peers appear to bolster these students’ moral develop ment, intercultural effectiveness, and psychological well-being in greater effects. In other words, as first-generation students begin to converse and integrate themselves within the social environment on campus, they begin to develop cognitively and psychosocially at greater rates compared to their non-first-generation peers, who may have already developed these measures through higher levels of cultural and social capital. Although first-generation students should be encouraged to seek out academically challenging experiences, the onus to provide these experiences rests with the college or university. As stated previously, first-generation students enter college with a cultural, social, and academic deficit compared to their non-first-generation peers (Bui, 2002; Cruce et al., 2005; Horn et al., 2000; Terenzini, Springer, et al., 1996). One unique practitioner initiative to aid in the transitional stages of college for first-generation students would be to pair them with a non-first-generation roommate within on-campus housing during the first
year of study. Using institutional student data, student affairs and residential directors could purposefully match a first-generation student with a non-first-generation student who may provide the first-generation student with insight and personal experiences that could alleviate any anxieties or intimidations the first-generation student may have about the college experience. As discussed, our findings suggest that peer interactions propel cognitive and psychosocial development. If practitioners can immediately foster such interaction, first-generation students may more readily navigate the collegiate environment and become accustomed to the college milieu. Our findings suggest that within the first academic year in college, first-generation students begin to lag behind in cognitive and psychosocial development. With projections of first-generation enrollment numbers likely to continue escalating (Strayhorn, 2006), administrators and student affairs practitioners must target first-generation students and acclimate them into college while simultaneously introducing a number of academic and social support networks around campus. Proactively educating the first-generation college-going population about vetted undergraduate good practices, and then engaging them immediately upon entry into college, not only enhances the likelihood of successful student development, but increases the likelihood of their academic success, positive social integration, and retention through college.
Correspondence concerning this article should be addressed to Ryan Padgett, Division of Student Affairs, Northern Kentucky University, UC330-A Nunn Drive, Highland Heights, KY 41076; [email protected]
March/April 2012 vol 53 no 2 263
First-Generation Undergraduate Students
APPENDIX A.Operational Definitions for Dependent and Independent Variables
Dependent Variables
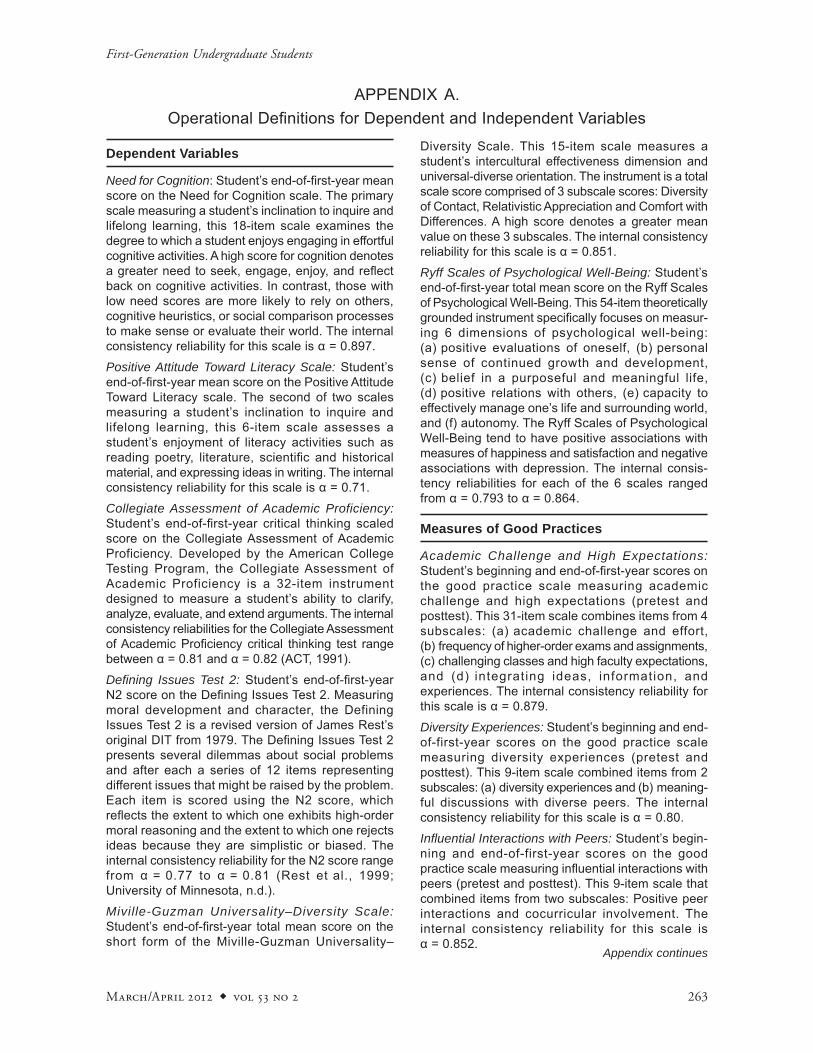
Need for Cognition: Student’s end-of-first-year mean score on the Need for Cognition scale. The primary scale measuring a student’s inclination to inquire and lifelong learning, this 18-item scale examines the degree to which a student enjoys engaging in effortful cognitive activities. A high score for cognition denotes a greater need to seek, engage, enjoy, and reflect back on cognitive activities. In contrast, those with low need scores are more likely to rely on others, cognitive heuristics, or social comparison processes to make sense or evaluate their world. The internal consistency reliability for this scale is α = 0.897.
Positive Attitude Toward Literacy Scale: Student’s end-of-first-year mean score on the Positive Attitude Toward Literacy scale. The second of two scales measuring a student’s inclination to inquire and lifelong learning, this 6-item scale assesses a student’s enjoyment of literacy activities such as reading poetry, literature, scientific and historical material, and expressing ideas in writing. The internal consistency reliability for this scale is α = 0.71.
Collegiate Assessment of Academic Proficiency: Student’s end-of-first-year critical thinking scaled score on the Collegiate Assessment of Academic Proficiency. Developed by the American College Testing Program, the Collegiate Assessment of Academic Proficiency is a 32-item instrument designed to measure a student’s ability to clarify, analyze, evaluate, and extend arguments. The internal consistency reliabilities for the Collegiate Assessment of Academic Proficiency critical thinking test range between α = 0.81 and α = 0.82 (ACT, 1991).
Defining Issues Test 2: Student’s end-of-first-year N2 score on the Defining Issues Test 2. Measuring moral development and character, the Defining Issues Test 2 is a revised version of James Rest’s original DIT from 1979. The Defining Issues Test 2 presents several dilemmas about social problems and after each a series of 12 items representing different issues that might be raised by the problem. Each item is scored using the N2 score, which reflects the extent to which one exhibits high-order moral reasoning and the extent to which one rejects ideas because they are simplistic or biased. The internal consistency reliability for the N2 score range from α = 0.77 to α = 0.81 (Rest et al., 1999; University of Minnesota, n.d.).
Miville-Guzman Universality–Diversity Scale: Student’s end-of-first-year total mean score on the short form of the Miville-Guzman Universality–
Diversity Scale. This 15-item scale measures a student’s intercultural effectiveness dimension and universal-diverse orientation. The instrument is a total scale score comprised of 3 subscale scores: Diversity of Contact, Relativistic Appreciation and Comfort with Differences. A high score denotes a greater mean value on these 3 subscales. The internal consistency reliability for this scale is α = 0.851.
Ryff Scales of Psychological Well-Being: Student’s end-of-first-year total mean score on the Ryff Scales of Psychological Well-Being. This 54-item theoretically grounded instrument specifically focuses on measur-ing 6 dimensions of psychological well-being: (a) positive evaluations of oneself, (b) personal sense of continued growth and devel op ment, (c) belief in a purposeful and meaningful life, (d) positive relations with others, (e) capacity to effectively manage one’s life and surrounding world, and (f) autonomy. The Ryff Scales of Psychological Well-Being tend to have positive associations with measures of happiness and satisfaction and negative associations with depression. The internal consis-tency reliabilities for each of the 6 scales ranged from α = 0.793 to α = 0.864.
Measures of Good Practices
Academic Challenge and High Expectations: Student’s beginning and end-of-first-year scores on the good practice scale measuring academic challenge and high expectations (pretest and posttest). This 31-item scale combines items from 4 subscales: (a) academic challenge and effort, (b) frequency of higher-order exams and assignments, (c) challenging classes and high faculty expectations, and (d) integrating ideas, information, and experiences. The internal consistency reliability for this scale is α = 0.879.
Diversity Experiences: Student’s beginning and end-of-first-year scores on the good practice scale measuring diversity experiences (pretest and posttest). This 9-item scale combined items from 2 subscales: (a) diversity experiences and (b) meaning-ful discussions with diverse peers. The internal consistency reliability for this scale is α = 0.80.
Influential Interactions with Peers: Student’s begin-ning and end-of-first-year scores on the good practice scale measuring influential interactions with peers (pretest and posttest). This 9-item scale that combined items from two subscales: Positive peer interactions and cocurricular involvement. The internal consistency reliability for this scale is α = 0.852.
Appendix continues
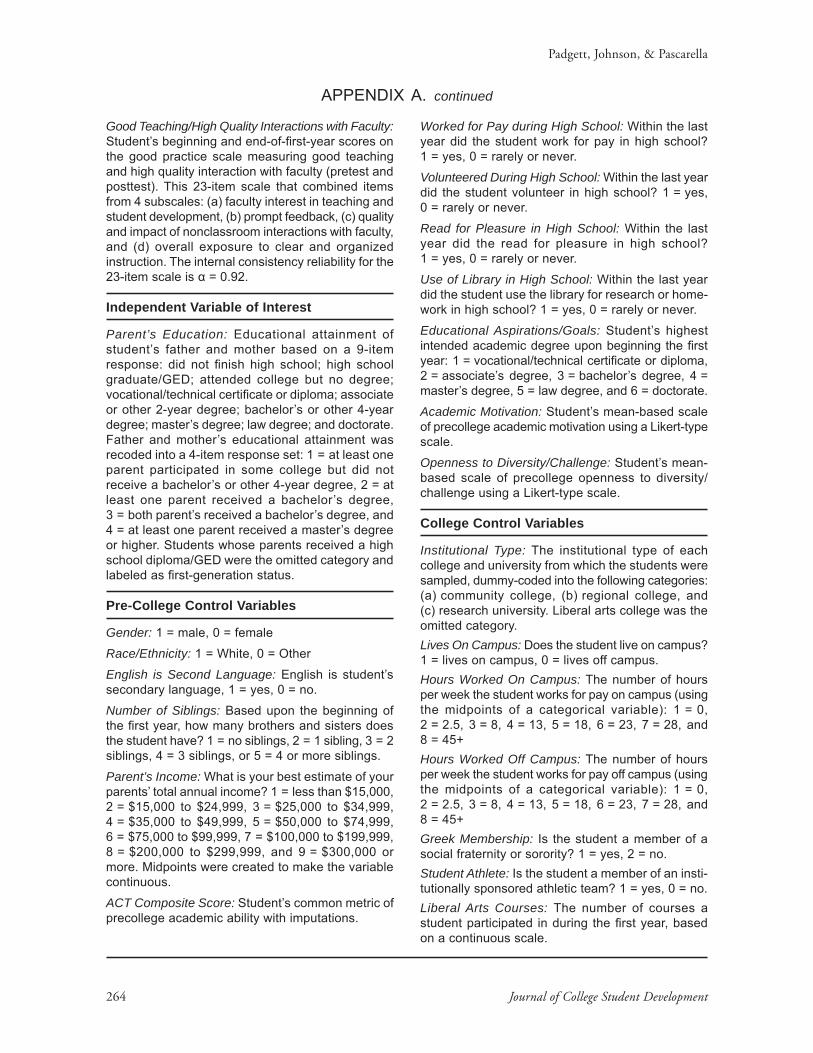
264 Journal of College Student Development
Padgett, Johnson, & Pascarella
Good Teaching/High Quality Interactions with Faculty: Student’s beginning and end-of-first-year scores on the good practice scale measuring good teaching and high quality interaction with faculty (pretest and posttest). This 23-item scale that combined items from 4 subscales: (a) faculty interest in teaching and student development, (b) prompt feedback, (c) quality and impact of nonclassroom interactions with faculty, and (d) overall exposure to clear and organized instruction. The internal consistency reliability for the 23-item scale is α = 0.92.
Independent Variable of Interest
Parent’s Education: Educational attainment of student’s father and mother based on a 9-item response: did not finish high school; high school graduate/GED; attended college but no degree; vocational/technical certificate or diploma; associate or other 2-year degree; bachelor’s or other 4-year degree; master’s degree; law degree; and doctorate. Father and mother’s educational attainment was recoded into a 4-item response set: 1 = at least one parent participated in some college but did not receive a bachelor’s or other 4-year degree, 2 = at least one parent received a bachelor’s degree, 3 = both parent’s received a bachelor’s degree, and 4 = at least one parent received a master’s degree or higher. Students whose parents received a high school diploma/GED were the omitted category and labeled as first-generation status.
Pre-College Control Variables
Gender: 1 = male, 0 = female
Race/Ethnicity: 1 = White, 0 = Other
English is Second Language: English is student’s secondary language, 1 = yes, 0 = no.
Number of Siblings: Based upon the beginning of the first year, how many brothers and sisters does the student have? 1 = no siblings, 2 = 1 sibling, 3 = 2 siblings, 4 = 3 siblings, or 5 = 4 or more siblings.
Parent’s Income: What is your best estimate of your parents’ total annual income? 1 = less than $15,000, 2 = $15,000 to $24,999, 3 = $25,000 to $34,999, 4 = $35,000 to $49,999, 5 = $50,000 to $74,999, 6 = $75,000 to $99,999, 7 = $100,000 to $199,999, 8 = $200,000 to $299,999, and 9 = $300,000 or more. Midpoints were created to make the variable continuous.
ACT Composite Score: Student’s common metric of precollege academic ability with imputations.
Worked for Pay during High School: Within the last year did the student work for pay in high school? 1 = yes, 0 = rarely or never.
Volunteered During High School: Within the last year did the student volunteer in high school? 1 = yes, 0 = rarely or never.
Read for Pleasure in High School: Within the last year did the read for pleasure in high school? 1 = yes, 0 = rarely or never.
Use of Library in High School: Within the last year did the student use the library for research or home-work in high school? 1 = yes, 0 = rarely or never.
Educational Aspirations/Goals: Student’s highest intended academic degree upon beginning the first year: 1 = vocational/technical certificate or diploma, 2 = associate’s degree, 3 = bachelor’s degree, 4 = master’s degree, 5 = law degree, and 6 = doctorate.
Academic Motivation: Student’s mean-based scale of precollege academic motivation using a Likert-type scale.
Openness to Diversity/Challenge: Student’s mean-based scale of precollege openness to diversity/challenge using a Likert-type scale.
College Control Variables
Institutional Type: The institutional type of each college and university from which the students were sampled, dummy-coded into the following categories: (a) community college, (b) regional college, and (c) research university. Liberal arts college was the omitted category.Lives On Campus: Does the student live on campus? 1 = lives on campus, 0 = lives off campus.Hours Worked On Campus: The number of hours per week the student works for pay on campus (using the midpoints of a categorical variable): 1 = 0, 2 = 2.5, 3 = 8, 4 = 13, 5 = 18, 6 = 23, 7 = 28, and 8 = 45+Hours Worked Off Campus: The number of hours per week the student works for pay off campus (using the midpoints of a categorical variable): 1 = 0, 2 = 2.5, 3 = 8, 4 = 13, 5 = 18, 6 = 23, 7 = 28, and 8 = 45+Greek Membership: Is the student a member of a social fraternity or sorority? 1 = yes, 2 = no.Student Athlete: Is the student a member of an insti-tu tion ally sponsored athletic team? 1 = yes, 0 = no.Liberal Arts Courses: The number of courses a student participated in during the first year, based on a continuous scale.
APPENDIX A. continued
March/April 2012 vol 53 no 2 265
First-Generation Undergraduate Students
REFERENCESAllison, P. D. (2002). Missing data. Thousand Oaks, CA:
SAGE.American College Testing Program. (1991). CAAP technical
handbook. Iowa City, IA: Author.Astin, A. W. (1993). What matters in college? Four critical years
revisited. San Francisco, CA: Jossey-Bass.Attewell, P., & Lavin, D. E. (2007). Passing the torch: Does higher
education for the disadvantaged pay off across the generations? New York, NY: Russell Sage Foundation.
Blau, P. M., & Duncan, O. D. (1967). The American occupational structure. New York, NY: Free Press.
Bourdieu, P. (1977). Outline of a theory of practice. (R. Nice, Trans.). Cambridge, UK: Cambridge University Press. (Original work published in 1972)
Bray, G., Pascarella, E. T., & Pierson, C. T. (2004). Postsecondary education and some dimensions of literacy development: An exploration of longitudinal evidence. Reading Research Quarterly, 39, 306-330.
Bui, K. V. T. (2002). First-generation college students at a four-year university: Background characteristics, reasons for pursuing higher education, and first-year experiences. College Student Journal, 36(1), 3-11.
Bui, K. V. T. (2005). Middle school variables that predict college attendance for first-generation students. Education, 126, 203-220.
Cacioppo, J. T., Petty, R. E., Feinstein, J. A., & Jarvis, W. B. G. (1996). Dispositional differences in cognitive motivation: The life and times of individuals varying in need for cognition. Psychological Bulletin, 119, 197-253.
Ceja, M. (2006). Understanding the role of parents and siblings as information sources in the college choice process of Chicana students. Journal of College Student Development, 47, 87-104.
Chen, X., & Carroll, C. D. (2005). First-generation students in postsecondary education: A look at their college transcripts (National Center for Education Statistics Rep. No. 2005-171). Washington, DC: U.S. Department of Education.
Chickering, A. W., & Gamson, Z. F. (1987). Seven principles for good practice in undergraduate education. AAHE Bulletin, 39(7), 3-7.
Chickering, A. W., & Gamson, Z. F., (Eds.). (1991). Applying the seven principles for good practice in higher education (New Directions for Teaching and Learning, No. 47). San Francisco, CA: Jossey-Bass.
Collier, P. J., & Morgan, D. L. (2008). “Is that paper really due today?”: Differences in first-generation and traditional college students’ understandings of faculty expectations. Higher Education, 55, 425-446.
Coleman, J. S. (1988). Social capital in the creation of human capital. American Journal of Sociology, 94, S95-S120.
Conger, A. J. (1974). A revised definition for suppressor variables: A guide to their identification and interpretation. Educational and Psychological Measurement, 34, 35-46.
Cronbach, L. J., & Snow, R. E. (1977). Aptitudes and instructional methods: A handbook for research on interactions. New York, NY: Irvington Publishers.
Cruce, T. M., Kinzie, J. L., Williams, J. M., Morelon, C. L., & Yu, X. (2005). The relationship between first-generation status and academic self-efficacy among entering college students. Unpublished manuscript.
Cruce, T. M., Wolniak, G. C., Seifert, T. A., & Pascarella, E. T. (2006). Impacts of good practices on cognitive development, learning orientations, and graduate degree plans during the first year of college. Journal of College Student Development, 47, 365-383.
Dennis, J. M., Phinney, J. S., & Ivey-Chuateco, L. (2005). The role of motivation, parental support, and peer support in the academic success of ethnic minority first-generation college students. Journal of College Student Development, 46, 223-236.
Duggan, M. (2001). Factors influencing the first-year persistence of first-generation college students. Paper presented at the annual meeting of the North East Association for Institutional Research, Cambridge, MA.
Filkins, J. W., & Doyle, S. K. (2002). First-generation and low-income students: Using the NSSE data to study effective education practices and students’ self-reported gains. Paper presented at the annual forum for the Association for Institutional Research, Toronto, Ontario, Canada.
Fuertes, J., Miville, M., Mohr, J., Sedlacek, W., & Gretchen, D. (2000). Factor structure and short form of the Miville-Guzman Universality–Diversity Scale. Measurement and Evaluation in Counseling and Development, 33, 157-169.
Gibbons, M. M., & Shoffner, M. F. (2004). Prospective first-gen-er a tion college students: Meeting their needs through social cognitive career theory. Professional School Counselors, 8, 91-97.
Hahs-Vaughn, D. (2004). The impact of parents’ education level on college students: An analysis using the Beginning Postsecondary Students Longitudinal Study 1990–92/94. Journal of College Student Development, 45, 483-500.
Harrell, P. E., & Forney, W. S. (2003). Ready or not, here we come: Retaining Hispanic and first-generation students in postsecondary education. Community College Journal of Research and Practice, 27, 147-156.
Horn, L., Nuñez, A. M., & Bobbitt, L. (2000). Mapping the road to college: First-generation students’ math track, planning strategies, and context of support. Statistical analysis report. Washington, DC: U. S. Department of Education, National Center for Education Statistics. (NCES 2000-153)
Hossler, D., Schmit, J., & Vesper, N. (1999). Going to college: How social, economic, and educational factors influence the decisions students make. Baltimore, MD: Johns Hopkins University Press.
Ishitani, T. T. (2006). Studying attrition and degree completion behavior among first-generation college students in the United States. Journal of Higher Education, 77, 861-885.
Kuh, G. D. (1995). The other curriculum: Out-of-class experiences associated with student learning and personal development. Journal of Higher Education, 66, 123-155.
Kuh, G. (2001). Assessing what really matters to student learning: Inside the National Survey of Student Engagement. Change, 33(3), 10-17, 66.
Kuh, G. D., & Hu, S. (2001). The effects of student–faculty inter-action in the 1990s. Review of Higher Education, 24, 309-332.
Kuh, G. D., Pace, C. R., & Vesper, N. (1997). The development of process indicators to estimate student gains associated with good practices in undergraduate education. Research in Higher Education, 38, 435-454.
266 Journal of College Student Development
Padgett, Johnson, & Pascarella
Kuh, G. D., & Vesper, N. (1997). A comparison of student experi-ences with good practices in undergraduate education between 1990 and 1994. Review of Higher Education, 21(1), 43-61.
Kuo, D. H., & Hauser, R. M. (1997). How does size of sibship matter? Family configuration and family effects on educational attainment. Social Science Research, 26, 69-94.
Lundberg, C. A., Schreiner, L. A., Hovaguimian, K. D., & Miller, S. S. (2007). First-generation status and student race/ethnicity as distinct predictors of student involvement and learning. NASPA Journal, 44, 57-83.
MacKinnon, D. P., Krull, J. L., & Lockwood, C. M. (2000). Equivalence of the mediation, confounding, and suppression effect. Prevention Science, 1(4), 173-181.
Marjoribanks, K. (1998). Family background, social and academic capital, and adolescents’ aspirations: A mediational analysis. Social Psychology of Education, 2, 177-197.
Marjoribanks, K. (2002). Family background, individual and environmental influences on adolescents’ aspirations. Educational Studies, 28(1), 33-46.
Martin Lohfink, M., & Paulsen, M. B. (2005). Comparing the determinants of persistence for first-generation and continuing-generation students. Journal of College Student Development, 46, 409-428.
McDonough, P. M. (1997). Choosing college: How social class and schools structure opportunity. Albany, NY: State University of New York Press.
Miville, M., Gelso, C., Pannu, R., Liu, W., Touradji, P., Hol-lo way, P., & Fuertes, J. (1999). Appreciating similarities and valuing differences: The Miville-Guzman Universality–Diver-sity Scale. Journal of Counseling Psychology, 46, 291-307.
Myers, R. (1990). Classical and modern regression with applications (2nd ed.). Boston, MA: Duxbury Press.
Pascarella, E. T., Cruce, T., Umbach, P. D., Wolniak, G. C., Kuh, G. D., Carini, R. M., Hayek, J. C., Gonyea, R. M., & Zhao, C.-M. (2006). Institutional selectivity and good practices in undergraduate education: How strong is the link? Journal of Higher Education, 77, 251-285.
Pascarella, E. T., Pierson, C. T., Wolniak, G. C., & Terenzini, P. T. (2004). First-generation college students: Additional evidence on college experiences and outcomes. Journal of Higher Education, 75, 249-284.
Pascarella, E. T., & Terenzini, P. T. (1991). How college affects students. San Francisco, CA: Jossey-Bass.
Pascarella, E. T., & Terenzini, P. T. (2005). How college affects students: A third decade of research (Vol. 2). San Francisco, CA: Jossey-Bass.
Pascarella, E. T., Wolniak, G. C., Cruce, T. M., & Blaich, C. F. (2004). Do liberal arts colleges really foster good practices in undergraduate education? Journal of College Student Development, 45, 57-74.
Paulsen, M. B. (2001). The economics of human capital and investment in higher education. In M. B. Paulsen & J. C. Smart (Eds.), The finance of higher education: Theory, research, policy & practice (pp. 55-94). New York, NY: Agathon Press.
Pike, G. R., & Kuh, G. D. (2005). First- and second-generation col-lege students: A comparison of their engagement and intel lectual development. Journal of Higher Education, 76, 276-300.
Portes, A. (1998). Social capital: Its origins and applications in modern sociology. Annual Review of Sociology, 24, 1-24.
Rendon, L. I. (1995). Facilitating retention and transfer for first-generation students in community colleges. Paper presented at the New Mexico Institute Rural Community College Initiative, Española, NM.
Rest, J., Narvaez, D., Thoma, S., & Bebeau, M. (1999). DIT2: Devising and testing a revised instrument of moral judgment. Journal of Educational Psychology, 91, 644-659.
Ryff, C. (1989). Happiness is everything, or is it? Explorations on the meaning of psychological well-being. Journal of Personality and Social Psychology, 57, 1069-1081.
Ryff, C., & Keyes, C. (1995). The structure of psychological well-being revisited. Journal of Personality and Social Psychology, 69, 719-727.
Seifert, T. A., Drummond, J., & Pascarella, E. T. (2006). African American students’ experiences of good practices: A comparison of institutional type. Journal of College Student Development, 47, 185-205.
Sewell, W. H., & Shah, V. P. (1968). Social class, parental encouragement, and educational aspirations. American Journal of Sociology, 73, 559-572.
Somers, P., Woodhouse, S., & Cofer, J. (2004). Pushing the boulder uphill: The persistence of first-generation college students. NASPA Journal, 41, 418-435.
Sorcinelli, M. D. (1991). Research findings on the Seven Principles. In A. W. Chickering & Z. Gamson (Eds.), Applying the Seven Principles for Good Practice in Undergraduate Education, pp. 13-25). San Francisco, CA: Jossey-Bass.
Stevens, J. P. (2002). Applied multivariate statistics for the social sciences (4th ed.). Hillsdale, NJ: Erlbaum.
Strayhorn, T. L. (2006). Factors influencing the academic achievement of first-generation college students. NASPA Journal, 43, 82-111.
Terenzini, P. T., Pascarella, E. T., & Blimling, G. S. (1996). Students’ out-of-classroom experiences and their influence on learning and cognitive development: A literature review. Journal of College Student Development, 37, 149-162.
Terenzini, P. T., Springer, L., Yaeger, P. M., Pascarella, E. T., & Nora, A. (1996). First-generation college students: Characteristics, experiences, and cognitive development. Research in Higher Education, 37(1), 1-22.
Tierney, W. G., Corwin, Z. B., & Coylar, J. E. (2005). Preparing for college: Nine elements of effective outreach. Albany, NY: SUNY Press.
Tierney, W. G., & Venegas, K. M. (2006). Fictive kin and social capital: The role of peer groups in applying and paying for college. American Behavioral Scientist, 49, 1687-1702.
Ting, S. M. (2003). A longitudinal study of non-cognitive variables in predicting academic success of first-generation college students. College and University, 78(4), 27-31.
Warburton, E. C., & Carroll, C. D. (2001). Bridging the gap: Academic preparation and postsecondary success of first-generation students (National Center for Education Statistics Rep. No. 2001-153). Washington, DC: U.S. Department of Education.
Whitt, E. J., Edison, M., Pascarella, E. T., Nora, A., & Terenzini, P. T. (1999). Interactions with peers and objective and self-reported cognitive outcomes across three years of college. Journal of College Student Development, 40, 61-78.