Embed Size (px)
Citation preview
Sta
Estimating the content of nitrogen and phosphorus in agricultural products in Sweden Winter wheat, spring barley, oats, crop residues and ley crops
Ylva Andrist Rangel1
Jan Eriksson2
Karin Fägerlind1
Josefine Liew1
Gerda Ländell1
Gunnel Wahlstedt1
1Statistics Sweden2Swedish University of Agricultural Sciences
August 2013
Grant No 40701.2011.003-2011.560
PM RM/L Lantbruksstatistik 2013:1

Table of contents
Acknowledgements....................................................................................3Summary......................................................................................................4Introduction.................................................................................................5Background – nutrient balances, types and purpose....................................6
Methods and Results..................................................................................7
1. N and P contents in grain and straw of winter wheat (Triticum aestivum), spring barley (Hordeum vulgare) oats (Avena sativa) and ley crops.....................................................................................71.1 Approach and data collection..................................................................71.2 Factors effecting N and P content in crops.............................................71.3 Main users and field investigations in Sweden.....................................101.4 Coefficients for N and P in crop and crop residues presently used......131.5 Future revision of SCB coefficients.......................................................16
2. Utilisation of crop residues......................................................................162.1 Approach and data collection................................................................172.2 Results..................................................................................................17
3. Sensitivity analysis..................................................................................173.1 Approach...............................................................................................173.2 Results - N balances.............................................................................18
Recommendations....................................................................................22Conclusions...............................................................................................23References.................................................................................................24Appendix I..................................................................................................27Appendix II.................................................................................................37
2
Estimating the content of nitrogen and phosphorus in agricultural products in Sweden Winter wheat, spring barley, oats, crop residues and ley crops
Ylva Andrist Rangel1
Jan Eriksson2
Karin Fägerlind1
Josefine Liew1
Gerda Ländell1
Gunnel Wahlstedt1
1Statistics Sweden2Swedish University of Agricultural Sciences
August 2013
Grant No 40701.2011.003-2011.560
PM RM/L Lantbruksstatistik 2013:1
AcknowledgementsWe would like to express our appreciation to Eurostat for financial support to enabling this study. We wish also to thank our survey respondents – the people and enterprises in Sweden – with whose cooperation Statistics Sweden is able to provide reliable and timely statistical information meeting the current needs of our modern society.
3
SummaryGross Nutrient Balances (GNB) for nitrogen (N) and phosphorous (P) are key agri-environmental indicators (AEI) within the EU. Resent calls for the harmonisation of coefficients used in the production of official statistics related to plant nutrients and in other reporting systems/bodies, such as the green house gas inventory, have led to the realisation of this action. Statistics Sweden has calculated and published national soil surface nutrient balances intermittently since 1991. In 2003, the method was partly adjusted to follow the one recommended by the OECD and Eurostat to increase comparability between countries. In spite of changes in crop breeding and farm management, the coefficients for N and P content in crops and crop residues have not been revised. The objective of this action is to obtain updated and well-defined coefficients for N and P content in harvested cereals, temporary grasses and crop residues and to estimate the amount of crop residues in Sweden. The N and P concentrations in grain and straw of cereals used in the official Swedish nutrient balances have been compared with concentrations reported in scientific literature for crops grown in Sweden or under conditions similar to those in Sweden as regards climate, soil type, production systems, management practices, etc. Comparisons have also been made with coefficients reported from the Swedish national environmental monitoring programme, and the Swedish variety trials as well as with coefficients used in other calculations, e.g. the OECD/Eurostat GNB, the national greenhouse gas inventory and the data modelling of N and P leaching from Swedish arable soils. N and P concentrations have been determined by analysing samples collected parallel to the Swedish national environmental monitoring programme. For estimation of crop residues removed from the field, a sample survey of 3 000 agricultural holdings was conducted during the autumn/winter 2012/2013. A sensitivity analysis of the effect of using a range of different N and P coefficients for harvested products and crop residues on the Swedish GNB has been conducted. Results from the action show that for grains of the three main cereal crops in Sweden, i.e. winter wheat (Triticum aestivum), spring barley (Hordeum vulgare) and oats (Avena sativa), there are discrepancies in the coefficients used in the Swedish nutrient balances and what is reported and/or used by others. The N and P content in crop residues of these three cereal crops varied considerably. For example, N in straw of winter wheat and oats used in the Swedish nutrient balances were in line with the concentrations used in the
4

OECD/Eurostat GNB and by the Swedish Board of Agriculture. However, they were higher than those used by the Swedish Environmental Protection Agency for the greenhouse gas inventory. The sensitivity analysis provides a basis for decisions on which variables it is worth investing resources in to obtain more precise coefficients and hence a more accurate estimation of the output. The outcome of this action can serve as a basis for recommendations on sound methodologies to obtain better practices in terms of obtaining N and P crop content coefficients, considering factors such as scientific ground, cost-efficiency and practical feasibility. Ideally, harmonised coefficients should be used by all reporting systems within each country. Differences in coefficients between countries should be supported by well-documented and confirmed evidence of differences in crop products in terms of N and P content. Keywords: (not included in the title): Nutrient, Balance, GNB, Element balance, Plant analysis, Nutrient, Concentration, Coefficients Cereal, Grain, Straw, Clover, Leguminous, Temporary grasses, Sensitivity analysis, Sweden
IntroductionStatistics Sweden has calculated and published national soil surface nutrient balances intermittently since 1991. In 2003, the method was partly adjusted to follow the method recommended by the OECD and Eurostat to increase comparability between countries. In spite of changes in crop breeding and farm management, the coefficients for nitrogen (N) and phosphorous (P) content in crops and crop residues have not been revised. Neither have the statistics on the utilisation of crop residues been updated since 1997.The general objective of this action is to obtain updated and well-defined coefficients for N and P content in harvested cereals, temporary grasses and crop residues and to estimate to what extent the crop residues are utilised in Sweden.
The specific objectives of the action are: I. To investigate and describe coefficients for N and P crop content presently used in Sweden by, for example, national authorities, the agricultural advisory service, non-
5

governmental organisations and research institutes, for nutrient balance calculations and data modelling. II. To conduct a literature study of N and P content in harvested products and crop residues for crops grown in Sweden or under conditions similar to those in Sweden in terms of climate, soil type, production systems, management practices etc. III. To analyse available data on N and P content in the three main cereal crops from the Swedish national environmental monitoring programme. IV. To obtain and analyse data on N and P content in samples of temporary grasses collected parallel to the Swedish national environmental monitoring programme. V. To compare the data and information obtained from the specific objective I-IV, with the coefficients for N and P crop content presently used by Statistics Sweden in gross nutrient balance calculations.VI. To quantify the areas (hectares) where crop residues have been and not been removed from the field of main crops in Sweden and, if possible, update currently available coefficients on N and P for crop residues. VII. To conduct a sensitivity analysis of the effect on the Swedish gross nutrient balances of using a range of different N and P coefficients for harvested products and crop residues, respectively. VIII.To make recommendations on sound methodologies for obtaining best practice in terms of obtaining N and P crop content coefficients, considering factors such as scientific ground, cost-efficiency, practical feasibility, etc.
Resent calls for the harmonisation of coefficients used in the production of official statistics related to plant nutrients and in other reporting systems/bodies, such as the green house gas inventory, have led to the realisation of this action. The approach, main results and outcome will be presented in the following sections. A paper (Andrist Rangel et al., 2013) with results from this action has also been submitted to the ICAS VI1.
Background – nutrient balances, types and purposeNutrient balances, i.e. a book-keeping of nutrient inputs and outputs to agricultural land, have in later years become 1 1 Sixth International Conference on Agricultural Statistics, Rio de Janeiro, 23-25 October 2013.
6

increasingly important as an indicator of the environmental performance and leaching potential of farming management on different scales (Oenema et al., 2003). From first being used as a tool to understand nutrient cycling, nutrient balances are now being used as a policy instrument, and to evaluate how well environmental targets are met (Öborn et al., 2003). As agriculture has been estimated to contribute 70-90 percent and 60-80 percent of the total load of anthropogenic diffuse losses of nitrogen (N) and phosphorus (P), respectively, into the Baltic Sea (HELCOM, 2011), there is an increased focus on actions to reduce the losses of nutrients from agricultural land.
There are three basic types of nutrient balances (Oenema et al., 2003; Öborn et al., 2003; Hoang & Alauddin, 2010):(i) Farm gate or black-box balance , which records
nutrients of all kinds of products that enter and leave the farm via the farm gate (note that the “farm gate” can here be the borders of a region or a country).
(ii) Soil surface balance , which counts all nutrients that enter the soil via the surface and leave the soil via crop uptake.
(iii) Soil system balance , which includes all nutrient inputs and outputs, including gains and losses within and from the soil.
The choice of budgeting approach depends on the purpose of the study. Often, the source of data for calculations of nutrient balances are combinations of primary data (i.e. collected and measured), estimates and assumptions, measured at different scales and with different frequencies (Oenema et al., 2003). Gross Nutrient Soil Surface Balances/Budgets (GNB) for nitrogen (N) and phosphorous (P) have been identified as key agri-environmental indicators within the EU (Eurostat, 2011). Nutrient balances are also relevant for one of the indicators for agricultural statistics as defined in the Global Strategy, namely no. 28, “Change in effect of inputs on the environment” (World Bank, FAO and UNSC, 2011). Therefore, there is an increased need to obtain harmonised statistical data related to crop nutrients. Nutrient output via harvested crops often accounts for the largest item on the output side of the balance/budget. Thus the coefficients used to estimate the output items often
7

have a significant effect on the magnitude of any surplus or deficit.
Methods and Results1. N and P contents in grain and straw of winter wheat (Triticum aestivum), spring barley (Hordeum vulgare) oats (Avena sativa) and ley crops
In the calculation of the Swedish official nutrient balances (Statistics Sweden 2011), the N and P contents in crops derive from a reference from 1991 (Claesson & Steineck). The aim of this section/review is to evaluate whether the used nutrient contents in grain and straw of the three most commonly grown cereals in Sweden are still relevant or if there are reasons for a change. Three main issues are addressed: (i) what factors determine the N and P content of cereal crops? (ii) which are the main users and field investigations of N and P coefficients in crop identified in Sweden? iii) what are typical N and P concentrations in grains and straw of winter wheat, spring barley and oats and in ley crops, in particular under Scandinavian or preferentially Swedish conditions?
1.1 Approach and data collection Coefficients for N and P content in crop products from the three main cereal crops in Sweden, i.e., grain and straw of winter wheat (Triticum aestivum), spring barley (Hordeum vulgare) and oats (Avena sativa) as well as ley crops currently available and used in Sweden, were investigated by means of a desk study. In addition, data on N and P content in crop samples of temporary grasses (n=100) collected parallel to the Swedish national environmental monitoring programme was obtained from the Swedish University of Agricultural Sciences (SLU). The samples had been selected to represent five geologically different regions in Sweden. For P, the data was already available, whereas for N, data was obtained after elemental analysis (LECO total nitrogen analyser) of achieved crop samples conducted by a laboratory at the Department of Soil and Environment at SLU.
8

1.2 Factors effecting N and P content in crops1.2.1 CerealsIn most studies, the nutrient content in harvested crops depends on location, year and fertilisation regime (Haak, 1998; Vos & van der Putten, 2000; Mattsson, 2005; Saleque et al., 2006; Wang et al., 2007; Peltonen-Sainio & Jauhiainen, 2010; Neacşu, 2011; Swanston et al., 2012). The following includes both studies on N content as such, and studies on protein content. However, protein content is directly related to N content, and often calculated based on analyses of the N concentration. The conversion factor used in Sweden is for example 5.7 x N=protein content for bread cereals (wheat, rye), and 6.25 x N = protein content for fodder cereals (barley, oats, triticale) (Staffan Larsson, personal communication).Peltonen-Sainio and Jauhiainen (2010) found early or late precipitation to increase N yield of spring cereals, oilseed- and turnip rape in Finland. Drought, very rainy seasons or elevated temperatures during early and late growth stages reduced N uptake. In their study, spanning over 10 years and 12-19 places, they found N uptake potential to be increased in later years, thanks to effective crop breeding.Under Swedish conditions, Mattsson (2005) found the N content of grains of winter wheat to increase with increased N fertilisation up to a certain dose, and then started to level off with higher doses. For spring barley and oats, the effect was not as clear, and the N content increased with increased N fertilisation. Mattsson (2003) also modelled N uptake, with the use of a number of field trials with more than two levels of N fertilisation for winter wheat and spring barley. The main findings were that oilseed crops as previous crop increased N uptake, but the effect were smaller at high doses of N fertilisation. There was little difference in N uptake when comparing different soil types (soils with different clay content), but N uptake were higher in southern than in northern Sweden.High yields of barley resulted in reduced concentration of N, in comparisons of 1083 different fertility experiments carried out in Sweden between 1967 and 2004 (Mattsson, 2006). Especially at low N fertilisation regimes, there were differences between different regions of Sweden, with higher N content in Svealand and Norrland than in Götaland. The differences became smaller at N rates close to and above the officially recommended doses of 80-120 kg
9

N/ha. Also in winter wheat, the grain N contents were higher in Svealand than in Götaland at low N doses (Mattsson, 2004).Chalmers et al. (1998) found grain N concentration to increase by 0.12 percent per 40 kg additional N/ha up to 240 kg N/ha in studies on winter oats in England and Wales, whereas timing of N fertilisation had only a minor effect on grain N content. The protein content were affected by genotype, environmental conditions, availability of nutrients in soil, soil moisture content, timing and rate of N fertilisation and crop rotation in Chinese experiments (Wang et al., 2008). While late applications of N increased protein content, early increased yield. Applications of P did not seem to have an impact on protein content, while deficiency of sulphur (S) could result in lower protein content, in particular reducing those amino-acids containing S. No tillage systems often result in less protein or lower yields due to increase in N immobilisation (Wang et al., 2008). Crop rotations including leguminous or oilseed crops instead increase the protein content. Interestingly, organically grown cabbage and carrots contains more N than their conventionally grown counterparts.Studying 12 soft milling wheat varieties grown under 12 environments at 3 locations for 2 seasons, with and without N fertilisation, Swanston et al. (2012) found grain protein content to vary depending on variety, site, season and N fertilisation. Neacşu (2011) found the grain protein content to differ between 23 Romanian and foreign varieties of winter wheat, most due to differences in yield. High yield often resulted in low protein concentration; a dilution effect also reported by others (e.g. Haak, 1998; Mattsson, 2006). Location was the main factor determining protein content, but there was also an interaction between genotype and environment. In an 18 year no-till experiment in Saskatchewan, Canada, increased N and P fertilisation increased crop yield and N and P uptake (Campell et al., 2011). Crop rotation played a role, with higher grain N- contents of wheat if sown in the stubble of previous crop as compared to grown after fallow. For P, the effect was the opposite, probably because the increased N content in soil if grown after stubble resulted in higher yields, which in turn reduced the concentration of P in the grains.
10

In Sweden, Haak (1998) evaluated an 8 year experiment spanning over two rotations of spring barley – spring oilseed rape – sugar beet – winter wheat in Landskrona, and found N and P uptake to increase with yield. There were significant differences between years and rates of N fertilisation, with more variation between years in the non-fertilised treatments than in those with moderate or high doses of N. While N content increased with increased N fertilisation, the P content decreased in both spring barley and winter wheat.The Swedish environmental monitoring of cereal crops showed high levels of P in grains of winter wheat, spring barley and oats to be more common in northern Götaland and in Svealands slättbygder (Eriksson et al., 2010). There was however, little correlation between P-AL (i.e. easily dissolvable P) in soil and P uptake in plants, so fertilisation may play a central role. Likewise, high yields resulted in reduced P concentrations in the grains. Wang et al. (2007) found yields, N and P uptake and N and P use efficiency of maize to depend on the amount of rain falling during the growing season and the soil water content during sowing in northern China. Also, there were differences between different fertilisation regimes.In two long-term experiments in southern Queensland and north-western New South Wales, Australia, increased N fertilisation decreased the P concentration in the grains, but as N fertilisation also gave higher yields, the crop P removal increased (Lester et al., 2009). As for N, genetic variation, seasonal growing conditions, soil fertility and fertiliser P regime also influenced the P contents of wheat. Saleque et al. (2006) studied the P content in wheat grown at three locations, on three soil types, with two fertiliser doses and several different management practices concerning type and handle of previous crops in Bangladesh. The P content in grain and straw varied with location, year and treatment, with lower P uptake without N fertilisation. In studies in Turkey and Israel, the P concentration in wheat varied depending on the interaction between genotype and environment (Gomez-Becerra et al., 2010). Also in studies of different landraces of Triticum aestivium and T. turgidum in Tenerife, there were considerable differences in P content between different cultivars (Rodrígues et al., 2011).
11
Mattsson (2005) found that N fertilisation had a small influence on the N content of straw, but the relationship is diffuse. The N content in straw of winter wheat was lower than that in spring barley and oats.El-Nashaar et al. (2010) found the P concentration in straw to correlate with the P concentration in soil in an experiment using 20 cultivars of soft winter wheat in the North-west Pacific region of the U.S. Field experiments in Pakistan showed a clear interaction between wheat genotype and level of P fertilisation, determining the P concentration in both grains and straw (Yaseen & Mali, 2009). The P concentration in straw was about 1/10 of that in the grains.In conclusion, N and P concentrations in grain cereals vary due to differences in the environmental conditions between years, locations and fertilisation regime. High N fertilisation rates, or much available N after the previous crops, result in high yields, but reduced N and P content of present crops because of a dilution effect. There is no clear cut relationship between soil content of P and P concentration in plants, and there are differences in N and P content between different genotypes (cultivars/varieties/species).1.2.2 Ley cropsIn Sweden, leys are one of the most commonly grown crops on arable land, with more than 1 million hectares in 2012 (Swedish Board of Agriculture, 2013a). The choice of botanical composition of the ley varies depending on geographic localisation of the farm, whether it is an organic or conventional farming system and the type of live stock (dairy cows, heifers, beef, sheep, goats, horses etc.) the ley will be used for. The most common preserving technique is to ensile the harvest, but hay are still used, in particular as feed for horses. In the north of Sweden, two cuts per season are taken, while it is possible to take four cuts in the south. The common practice is to grow a mixed ley, where legumes and grass species are cultivated together.The content of nitrogen (N) and phosphorus (P) in a ley depend on the botanical composition, at what developmental stage of the plants cuts are made, the dose and timing of N-fertilisation and the age of the ley, as the latter influence the botanical composition. Besides different species having different N and P content, there are also differences between varieties and traits, which affect the resulting N and P content of each cut. In a
12

temperate climate, with harsh winters, where most leys are grown for several years, the susceptibility to frost damage and spring/summer droughts respectively floods, is critical.
1.3 Main users and field investigations in Sweden Apart from the official Swedish nutrient balance calculations, four main uses of the crop N and P coefficients and two main field investigations in Sweden were identified (Table 1).
13
Table 1: Main users and field investigations of N and P coefficients in crops identified in this action. Institution Usage* /field
investigation#Geographic level
Reference Designation in this paper (and colour in Tables 2 and 3)
Statistics Sweden
Official statistics on nutrient balances
National/ Regional (agricultural production areas, catchments)
Haak, 1988 in Claesson and Steineck, 1991
SCB(Light brown)
Swedish Board of Agriculture
*In the agricultural advisory service, for calculation of N, P and K balances, leaching, climate footprint, etc., at farm level
Farm Swedish Board of agriculture, 2013b
STANK in MIND(Grey)
SMED/ Swedish EPA
*Green house gas inventory report to UNFCCC
National Swedish EPA, 2012
GHG(Light blue)
SMED /Swedish EPA
*Modelling of N and P leaching losses from arable land
National/Regional
Johnsson et al. 2008, Blombäck et al. 2011
N and P modelling(Dark blue)
Statistics Sweden
*Calculation of OECD/Eurostat GNB for N and P
National/ Regional (NUTS2)
OECD (2012) OECD/Eurostat(Purple)
SLU #National environmental monitoring of arable soils and cereal crops.
National/Regional
Eriksson et al., 2010
Environmental monitoring(Green)
SLU #Variety trials Larsson, 2011a Variety trials(See Table 5)
1.3.1 The Swedish environmental monitoring of arable soils and cereal cropsThe environmental monitoring of arable soils and cereal crops is funded by the Swedish Environmental Protection Agency and hosted by the Swedish University of Agricultural Sciences. Up until present, two full “rounds” of monitoring have been carried out (Eriksson et al. 1997 and 2010). Samples are taken from locations chosen to be representative for Swedish agriculture. The number of locations in a particular region corresponds to the size of
14

the agricultural area, so that regions with much agricultural land also have many sampling locations. During a round, all locations are sampled once. Samples are taken every second year, meaning that about 25 percent of the locations are sampled during a particular year. Soil and crop samples are taken, the crop if it is winter wheat, spring barley or oats, and analysed for a number of nutrients (including N and P), heavy metals, organic content (in soils), pH etc.The most recent complete round, which was the second one, done in 2001-2007, included 301 samples of wheat, 303 samples of spring barley and 231 samples of oats. The sample locations were guided to fields where some of these crops were grown. This regimented sampling will not be repeated in the coming rounds. If both rounds are counted, there is 1 sampling point per 500 ha (or 1 sampling location per 1300 ha per round). In the first round, wheat samples were only taken in two years (1988, 1995), and barley and oats in only one year each. Data of N and P contents in the cereal crops tested in the second round are presented in Tables 2, 3, 4 and in Appendix I.1.3.2 The Swedish variety trialsThe Swedish variety trials aim at testing marketed and new varieties of crops grown in Sweden, under different conditions at different locations in areas where the crop in question is commonly cultivated (Staffan Larsson, pers. comm.). The objective is to evaluate, for each of the variety, the yield potential, resistance to disease and nutritional and functional qualities, e.g. baking quality, protein content, capacity to withstand harsh winters (for autumn sown cereals) and digestibility. The results are used by the advisory service, breeding companies and the farmers as a decision support tool. The trials for new varieties are funded by the seed and breeding companies, while the variety trials for organically grown crops are financed by the Swedish Board of Agriculture. For varieties that are already available on the market, there is also an opportunity to apply for funding from SLF (Swedish Farmers’ Foundation for Agricultural Research) on a yearly basis. Although the number of locations for experiments has been reduced under a number of years, there is a consensus that the variety trials are needed. With fewer experiments than used today, it will be difficult to get relevant results of e.g. local outbreaks of pests.For winter wheat, new varieties are tested at 10 different locations for 2 years, while those varieties that are already
15

released are tested at 30 locations during its length of life on the market, maybe 5-10 years. All varieties are not tested at all locations, and the number of experiments depends on the economic importance of a particular crop. Spring barley is used in 26 experiments and oats in 22. The variety trials include 51 varieties of winter wheat, 48 of spring barley and 23 of oats at present. At each test site, there are 4 replicates of each variety; 2 of which are treated with fungicides and 2 which are untreated. Fertilisation and weeding are carried out in accordance with the surrounding field on the host farm, meaning that all varieties receive the same amount of plant nutrition. The varieties are mainly Swedish and European varieties from Germany and Denmark, and sometimes include also varieties from England and the Netherlands. At harvest, the N concentration in grains are analysed (together with other parameters, such as baking quality) and converted to protein content, using a factor 5.7 for bread cereals (wheat, rye) and 6.25 for fodder cereals (barley, oats, triticale). The results are presented as averaged over 5 years, since the N content may vary considerably between different years due to environmental conditions during the growing season. A summary of the most recently published results are presented in Tables 2, 3 and 5.
16

1.4 Coefficients for N and P in crop and crop residues presently used The basic books in plant nutrient management and plant physiology report sufficiency range for small grain crops to be around 1.75-3.0 percent N for winter grain crops, 2.0-3.0 percent N for spring grain crops and 0.2-0.5 percent for P (Havlin et al., 1999), or tissue concentrations of 1.5 percent N and 0.2 percent P in dry matter (Taiz & Zeiger, 1998). The span of coefficients found in this action are summarised in Table 2 and 3, where the colours indicate the use/source of the coefficient. For a more detailed presentation, with more references from other countries, see Appendix I for cereals and II for ley crops. Nutrient concentration in the commenting text regarding cereals (sections 1.4.1 and 1.4.2) are stated in percent at 15 percent moisture content (MC) whereas concentrations for ley crops (section 1.4.3) are stated in g per kg dry matter (DM).1.4.1 GrainThe results show that for grains of winter wheat, spring barley and oats, there is a variation in the coefficients that is reported and/or used. The N content of 1.9 percent in winter wheat, used in the Swedish nutrient balance calculations by SCB is higher than reported in the Swedish environmental monitoring (Table 2 and 4) and variety trials (Table 5) but is in level with the coefficients reported for the higher N fertilisation regimes by Mattsson (2004) (Appendix I Table I). The P content in winter wheat used in the SCB nutrient balance calculations is 0.37 percent, which is somewhat higher than shown by others (Table 3). The environmental monitoring (Table 3 and 4) as well as the results by Haak (1998) (Appendix I Table II) indicate a P concentration around 0.32 percent, which is close to the content of 0.31 percent used in the OECD/Eurostat and the STANK in MIND balance calculations (Table 3).The N concentration in spring barley used in the SCB nutrient balance calculations is 1.7 percent; the same as what is used in the SOILND modelling. It is somewhat higher than the contents found in the environmental monitoring and the variety trials with contents of 1.5-1.56 percent (Table 2, 4, 5 and Appendix I Table III)). In the OECD/Eurostat balances, 1.6 percent is used. The P concentration of 0.35 percent used in the SCB nutrient balance calculations for grains of spring barley is well in line with results reported from/used by others (Table 3, 4 and Appendix I Table IV).
17

The N concentration in oats used in the SCB nutrient balance calculations is 1.8 percent, which is in line with the variety trials and the SOILND modelling but higher than both STANK in MIND (1.65 percent) and the environmental monitoring (1.45 percent) (Table 2, 4 and 5). In the OECD/Eurostat balances, 1.7 percent is used in the calculations (Appendix I Table V). The P concentration for oat grains reported by the main users and filed investigation varies between 0.33 and 0.35 percent, where the SCB nutrient balance calculations uses 0.34 percent (Tables 3, 4 and Appendix VI).Hence, there is a tendency that SCB coefficients are in the higher end of the range coefficients for grain, especially in terms of N.1.4.2 StrawThere is a fairly large variation in the compiled concentrations of N in crop residues of the studied crops. For straw of winter wheat and oats, the N concentrations used in the SCB nutrient balances are in line with the concentrations used in the OECD/Eurostat GNB and by the Swedish Board of Agriculture in STANK in MIND, but higher than the ones used by the SMED/Swedish Environmental Protection Agency (EPA) in the calculations for the greenhouse gas inventory (Table 2). The SCB coefficients for winter wheat and oat straw are also higher than the concentrations found in field trials (Appendix I, Table VII ). For spring barley, the SCB coefficients are higher than what is reported and used elsewhere. For P concentrations in straw, only a few experimental results have been found, and the figures reported vary considerably (Appendix I Table VIII) . The P concentrations used in the SCB balances are the same as the ones used by the Swedish Board of Agriculture (Table 3). Compared to these, coefficients used in the OECD/Eurostat balances are considerably higher. 1.4.3 Temporary grassesFor temporary grasses, the presented data in Table 2 and 3 shows the maximum, median and the minimum of the concentrations measured in the samples collected parallel to the environmental monitoring programme. Here, the SCB coefficients are well in line with the median, both for N and for P. There are two “standard references” for feed evaluation, used among farmers, researchers and the advisory service in Sweden: the database available from The Nordic Feed Evaluation System (NorFor, 2012) and the tables included in a report from the Swedish University
18

of Agricultural Sciences (2003). In these, coefficients of N and P for ley crops are reported (Appendix II). As shown in Appendix II , Table I, the mean N content of leguminous species is 33.1 g N/kg DM, and of grass species 20.3 g N/kg DM. However, in the mixed ley crop (Table III-IV), the N content seems to vary little, and is around 21.5 kg N/kg DM for a ley crop with <25 percent leguminous species, and somewhat higher, about 22.5 g N/kg DM for a ley with 25-50 percent legumes. For leys with >50 percent legumes, there are few experimental data reported, and the only one found here suggests a N content around 25 g N/kg DM (Table III). However, there is no further information of e.g. which cut this figure represents, but as shown in Table I, there is no seasonal decrease in N content from early summer to autumn in leguminous species. According to Appendix II, Table IV, there is a difference between northern and southern Sweden, with higher N content in the south. Concerning P, no such geographical pattern is obvious, and the content of leguminous species in the mixed ley does not seem to affect the P level much. Thus, it seems reasonable to assume a P content around 2.7 g P/kg DM for all mixed leys.
19

Table 2: Nitrogen concentrations (%), in grain and straw of winter wheat (Triticum aestivum), spring barley (Hordeum vulgare) and oats (Avena sativa) at 15 percent moisture content and for samples of temporary grasses in dry matter (DM). Range of coefficients among main users and reporters (for references and colour labels see Table 1).
Levels used in the
Nitrogen (%) sensitivity
analysisGrain Straw
Winter wheat
High 1.9 0.7 0.7 Medium 1.8 1.79 0.6 Low I 1.7 0.43 Low II 1.66 0.43 Spring barley
High 1.7 1.7 0.8 Medium 1.6 0.7 0.7 Low 1.5 0.65 Oats High 1.8 1.8 0.7 0.7 0.7 Medium 1.65 0.62 Low 1.45 0.62 Temporary High 3.97* grasses Medium 2.22* 2.4 Low 1.1** Whole crop samples. % DM. Max, median and min for samples of temporary grasses, n=100, collected parallel to the environmental monitoring programme. (Previously unpublished data, see Section 1.1).
Table 3: Phosphorus concentrations (%), in grain and straw of winter wheat (Triticum aestivum), spring barley (Hordeum vulgare) and oats (Avena sativa) at 15 percent moisture content and for samples of temporary grasses in dry matter (DM). Range of coefficients among main users and reporters (for references and colour labels see Table 1).
Levels used in the
Phosphorus (%) sensitivity
analysisGraina Strawa
Winter wheat
High 0.37 0.32 Medium 0.35 0.1 0.1 Low I 0.32 0.1 0.1 Low II 0.31 0.31 0.1 0.1 Spring barley
High 0.35 0.35 0.35 0.32 Medium 0.35 0.35 0.35 0.1 0.1 Low 0.34 0.34 0.1 0.1 Oats High 0.35 0.32 Medium 0.34 0.1 0.1 Low 0.33 0.33 0.33 0.1 0.1 Temporary High 0.48* grasses Medium 0.29* 0.26 Low 0.14*
20

* Whole crop samples. % DM. Max, median and min for samples of temporary grasses, n=100, collected parallel to the environmental monitoring programme. (Previously unpublished data, see Section 1.1).
Table 4. Concentrations of nitrogen (N) and phosphorus (P) in grains of cereals from the Swedish environmental monitoring. Percent of DM (of 15 percent MC given in parenthesis) (Eriksson et al., 2010).
Winter wheat Spring barley OatsN P N P N P
No of samples
301 301 303 303 231 231
Min 1.2 (1.0)
0.19 (0.16)
1.2 (1.0)
0.30 (0.17)
1.0 (0.85)
0.24 (0.20)
Max 3.2 (2.7)
0.56 (0.48)
2.9 (2.5)
0.63 (0.53)
3.0 (2.55)
0.57 (0.48)
Mean 2.0 (1.7)
0.37 (0.31)
1.9 (1.6)
0.41 (0.34)
1.8 (1.53)
0.39 (0.33)
Median* 2.0 (1.7)
0.37 (0.32)
1.8 (1.5)
0.41 (0.35)
1.7 (1.45)
0.39 (0.33)
* According to the authors, the median is more accurate than the mean due to some few very high observations.
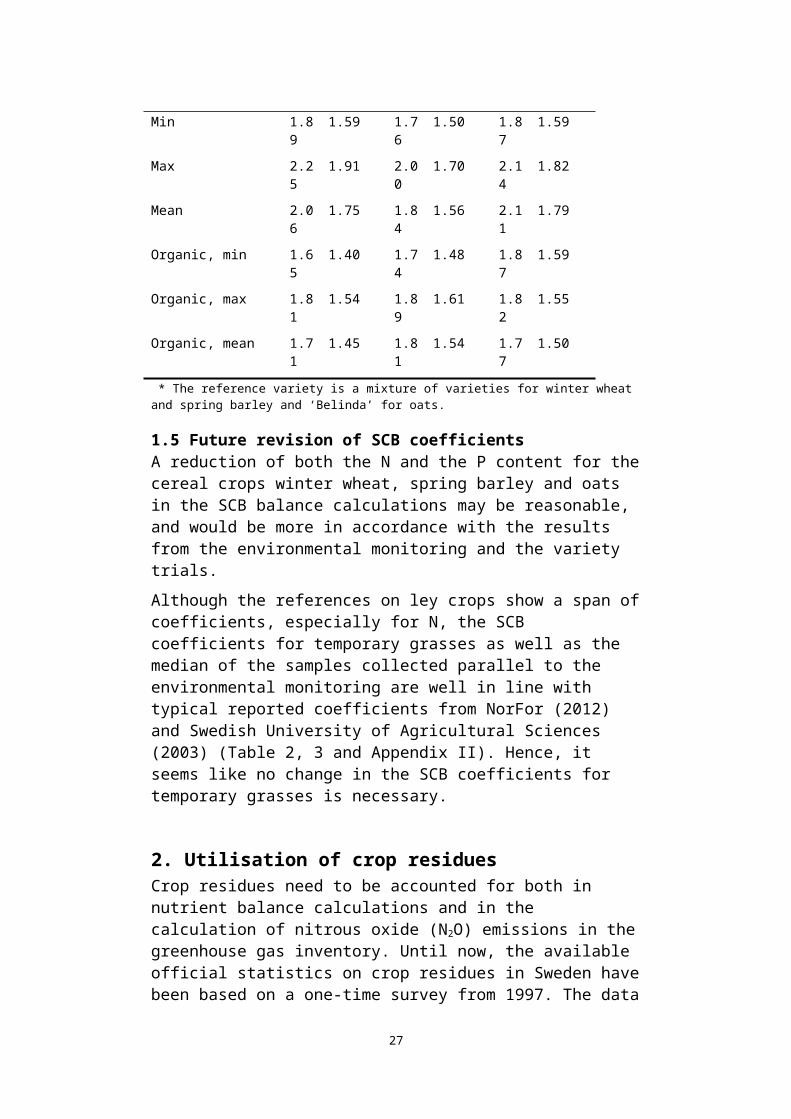
Table 5. Nitrogen (N) content (%) in cereal grains from the variety trials, mean values 2006-2010 for fungicide treated and untreated plants (for oats only treated) (Larsson, 2011a), for organically grown varieties mean values from 2008-2011 (Larsson, 2011b). DM= dry matter, MC= moisture content.
Winter wheat
Spring barley
Oats
DM
15% MC
DM
15% MC
DM
15% MC
“Reference variety” *Min
2.111.89
1.791.59
1.871.76
1.591.50
1.871.87
1.591.59
Max 2.25
1.91 2.00
1.70 2.14
1.82
Mean 2.06
1.75 1.84
1.56 2.11
1.79
Organic, min 1.65
1.40 1.74
1.48 1.87
1.59
Organic, max 1.81
1.54 1.89
1.61 1.82
1.55
Organic, mean 1.7 1.45 1.8 1.54 1.7 1.50
21
1 1 7
* The reference variety is a mixture of varieties for winter wheat and spring barley and ‘Belinda’ for oats.
1.5 Future revision of SCB coefficients A reduction of both the N and the P content for the cereal crops winter wheat, spring barley and oats in the SCB balance calculations may be reasonable, and would be more in accordance with the results from the environmental monitoring and the variety trials. Although the references on ley crops show a span of coefficients, especially for N, the SCB coefficients for temporary grasses as well as the median of the samples collected parallel to the environmental monitoring are well in line with typical reported coefficients from NorFor (2012) and Swedish University of Agricultural Sciences (2003) (Table 2, 3 and Appendix II). Hence, it seems like no change in the SCB coefficients for temporary grasses is necessary.
2. Utilisation of crop residues Crop residues need to be accounted for both in nutrient balance calculations and in the calculation of nitrous oxide (N2O) emissions in the greenhouse gas inventory. Until now, the available official statistics on crop residues in Sweden have been based on a one-time survey from 1997. The data is being used both in the official Swedish nutrient balances (Statistics Sweden, 2011) and the OECD/Eurostat balances (OECD, 2012) as well as in the GHG inventory for Sweden (Swedish EPA, 2012). With increased focus on more efficient use of natural resources parallel to greater demand for energy, it is likely that the use of crop residue has changed since the late 1990s. Therefore a new survey on the utilisation of straw and tops was conducted within the framework of this action.
2.1 Approach and data collectionThe existing sample survey on “Cultivation measures in agriculture” conducted every second year by Statistics Sweden was used to collect information on crop residues for the main crops in Sweden. The survey was carried out on a sample of 3 000 agricultural holdings during the autumn/winter 2012/2013 by adding a number of additional questions on crop residues to the ordinary questionnaire. The data collected included: areas (hectares) from which the crop had been harvested as green fodder; areas in which the crop residues had been incorporated in the soil at
22

tillage; and areas from which crop residues had been removed from the field. The type of usage was also surveyed. Reprinted categories for use were: Fodder for direct use; fodder industry; litter; biogas; energy (heating); and other uses.
2.2 ResultsStraw was removed from the field on 40 percent of the area on which cereals were grown. This is an increase compared to earlier results from 1997. For 73 percent of the cereal area where crop residues had been removed, the straw was used as litter. Use of straw as feed was second most common, with a share of 13 percent. The use of straw for heating had increased compared to earlier results, to comprise about 9 percent of the cereal area where crop residues had been removed from the field. The complete results on crop residues have been published as official statistics together with the other results from the survey (Statistics Sweden, 2013).
3. Sensitivity analysisThe nutrient balances consist of several in- and outputs (Table 6). Hence, the effect of changing the coefficients related only to one of the items in the balances, namely ‘crop products’, is unclear. Sensitivity analysis was chosen as a tool to evaluate this effect.
3.1 Approach Sensitivity analysis was conducted in order to quantify the effect on the Swedish GNB of using a range of different N and P coefficients for winter wheat, spring barley, oats and temporary grasses. The coefficients were allowed to vary both for harvested crop product (grain) and crop residues (straw). All other coefficients were fixed. Data on quantities was the same as that used in the calculations of the official Swedish nutrient balances for 2009 (Statistics Sweden, 2011).
Table 6: In- and outputs for the nitrogen and phosphorus soil surface balances used in the sensitivity analysis. Nutrient inputs Nutrient outputsMineral fertiliser Crop yieldSoil amendments Harvested/removed crop residuesStable- and grazing manureSeed
23

Atmospheric depositionSewage sludgeBiological nitrogen fixation (only applicable for N)
Three different levels of N and P concentrations were set for each of the crops: High, Medium and Low. Coefficients for the respective levels were chosen from the range of concentrations found in the preceding screening (see Section 1.4). The resulting matrices of data, serving as input to the sensitivity analysis, can be seen in Tables 2 and 3 (fixed coefficients not shown). Programming for the sensitivity analysis was performed using the Statistical Analysis Software SAS. The calculation model used in the official Swedish nutrient balances 2009 (Statistics Sweden, 2011) was used to compute each combination of alternatives for winter wheat, spring barley, oats and temporary grasses. Factors other than N and P coefficients for grain and straw were kept unchanged. The results were exported to Excel, where the sensitivity analysis was performed. By compiling pivot tables, the analyst could see the effects on the nutrient balances, both in tables and graphs, by changing the nutrient levels to High, Medium or Low for the crop of interest. Presentations can be made for both national and regional levels. The regional levels are either eight agricultural production areas (PO) (Fig 1) or catchments (eight in total).
3.2 Results - N balances In total, when analysing the sensitivity of the N balances at national level, 108 different combinations of varying N content in winter wheat, spring barley, oats and temporary grasses had been computed (all other factors fixed). Accordingly, 108 different balances were obtained (Figure 2). The span of N balances in kg per ha of agricultural land ranged between 14 and 50 kg N/ha. Hence, all the balances at national level indicate a surplus of N. The surplus consists of ammonia losses, leaching losses, denitrification as well as build-up in the soil. There was a clear pattern with three different groups in the data, with most of the balances around 16, 36 and 48 kg/ha respectively.
24
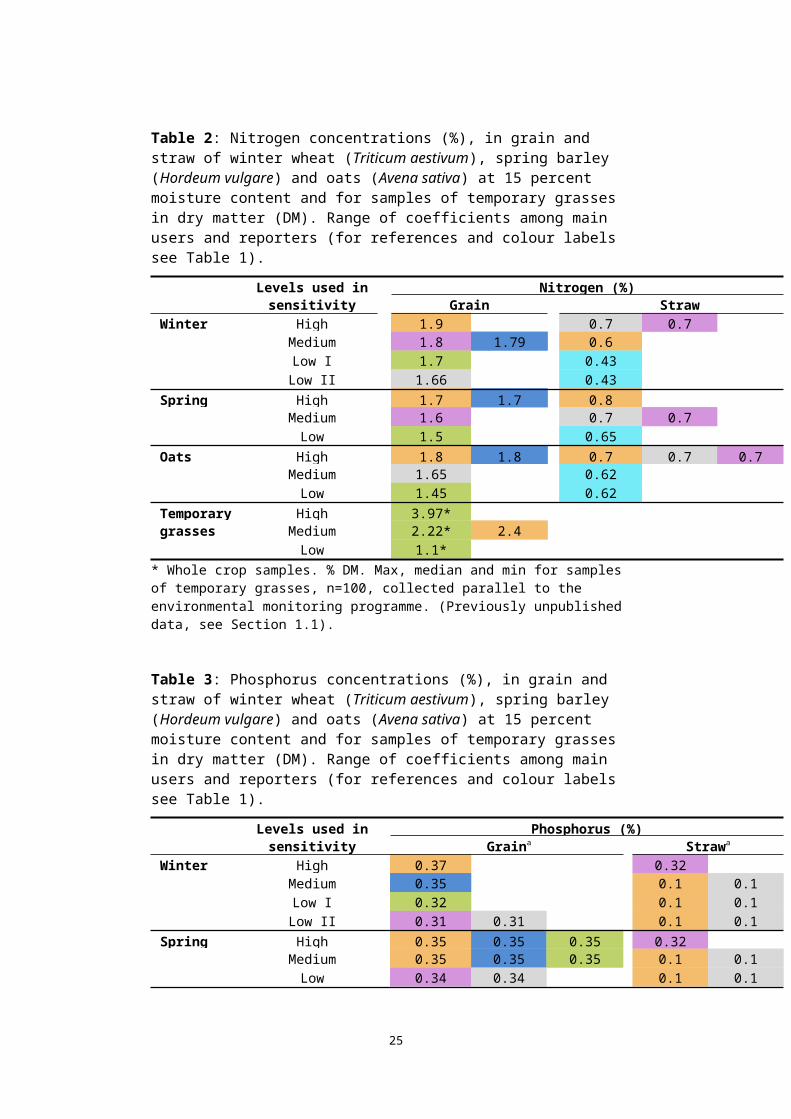
Figure 1: Sweden is divided into eight agricultural production areas (PO).
25
PO 1 Plain districts in Southern Götaland
2 Central districts in Götaland
3 Plain districts in Northern Götaland
4 Plain districts in Svealand
5 Forest districts in Götaland
6 Forest districts in Central Sweden
7 Lower parts of Norrland
8 Upper parts of Norrland

14 15 16 17 18 34 35 36 37 46 47 48 49 500
2
4
6
8
10
12
14
16
Soil surface N balance (kg/ha)
Freq
uenc
y
Figure 2: Soil surface N balances for Sweden 2009, resulting from varying N concentration in grain and straw in winter wheat, spring barley, oats and temporary grasses. All other in- and outputs fixed.
In the next step, only one crop at a time was allowed to vary in terms of N coefficients and the analysis was done at regional level (Figures 3 and 4). The surplus/deficit of the balances varies among the production areas (PO) as well as their sensitivity to the change in the crop N coefficient. For example, the Plain districts in southern Sweden (PO 1) make up the production area that is most sensitive to a change in the coefficient for winter wheat, whereas it is the least sensitive to changes in temporary grasses N content (Figures 3 and 4). This is explained by differences in relative crop areas among the production areas. In PO 1, winter wheat is the dominating crop, whereas it has the smallest area of temporary grasses among all the production areas (Statistics Sweden, 2010). In Lower and Upper parts of Norrland (PO 7 and 8), the areas of winter wheat are insignificant, and hence there is no change in the balances when the corresponding N coefficient is changed. In general, the sensitivity analysis shows rather limited effects on the N balances when only the N content in winter wheat is changed, using the range of concentrations found
26
in the screening (Table 2). For temporary grasses on the other hand, the span in concentrations was much greater. This, in combination with large areas of temporary grasses in several of the production areas, resulted in the sensitivity analysis showing large differences in N balances; from -5 to 60 kg N/ha.
SCB High Medium Low I Low II0
5
10
15
20
25
30
35
40
45
0102030405060708
Soil
surf
ace
N b
alan
ce k
g/ha
Figure 3: Soil surface N balances for agricultural production areas (PO 1-8) in Sweden 2009, resulting from varying N concentrations in grain and straw of winter wheat. All other in- and outputs fixed. The category “SCB” denotes the official Swedish soil surface balances for 2009.
27

SCB High Medium Low-10
0
10
20
30
40
50
60
70
0102030405060708
Soil
surf
ace
N b
alan
ce (k
g/ha
)
Figure 4: Soil surface N balances for agricultural production areas (PO 1-8) in Sweden 2009, resulting from varying N concentrations in temporary grasses. All other in- and outputs fixed. The category “SCB” denotes the official Swedish soil surface balances for 2009.
The strong influence of the temporary grasses on the total balance also explains the outcome of groups of balances in Figure 2. The common factor for the balances in the lowest group (14-18 kg N/ha) is that the coefficients for temporary grasses are at High for all the combinations. Hence, large amounts of N are removed from the field when the temporary grasses are harvested, which results in a small surplus of N in the soil surface balances. In the next group (34-37 kg/ha), the coefficients for temporary grasses are at Medium, and accordingly at a Low level in the last group with balances between 46 and 50 kg N/ha.
28

Recommendations To keep the N and P content in grains and crop residues updated, the main “sample programmes” which would be suitable for benchmarking are the Swedish environmental monitoring of crops and the variety trials. Both these programmes seem to have fairly secure funding in the immediate future, and are carried out on a regular basis. Although the number of samples for wheat, barley and oats taken in the environmental monitoring programme will probably decrease in forthcoming rounds, there will hopefully still be enough samples for capturing the trends of whether the nutrient contents in grain crops are decreasing, increasing or remaining steady. A benefit of using the environmental monitoring programme as the first hand option for benchmarking is that both N and P have been analysed up to the last sampling series. However, in the ongoing sampling series, only P is being analysed due to financial restrictions. Additional funding could enable N analysis to be carried out, as the crop samples are archived. Since the locations for samples are chosen to be representative for Swedish agriculture, due to a complex system of grid sampling (Eriksson et al., 2010), the results are likely to give the best available overall picture of Swedish farming today. Sampling of temporary grasses is not included in the regular programme; hence data on temporary grasses would need to be obtained from an alternative source. The Nordic Feed Evaluation System (NorFor, 2012) database could be one option, where coefficients for different feedstuff for cattle are available for four countries (Denmark, Iceland, Norway and Sweden). The variety trials are carried out every year, and the results are published a few months after harvest. The experimental yields are higher than the officially reported “Standard yields”. This may cause a dilution effect of the N concentration in grain, which, on the other hand, is counteracted if more N fertilisers are applied. A drawback of the variety trials is that no P analyses are performed. However, many varieties are analysed, and mean values are provided for a five-year period, which reduce the effect of weather and wind during a certain year. If used together with the environmental monitoring, the variety trials can contribute valuable information about the current state of crops in terms of N content.
29

The updated official statistics on the utilisation of crop residues for 2012 produced within this action present data on areas. However, to fully make use of this data in the nutrient balances and in the greenhouse gas calculations, the areas need to be converted into quantities. For this, data on crop yields combined with coefficients for the ratio between grain yield and straw and/or other crop residues is needed. Another factor to consider is the stubble height. These factors would also need to be reviewed and revised. This lies outside the scope of this action, but is a forthcoming action to take in order to completely provide updated and harmonised coefficients for crop products in nutrient balances and GHG calculations.In terms of cost efficiency and practical feasibility, the sensitivity analysis is a useful tool to evaluate the effect of changing one or several factors in a model. Here we have demonstrated one way of conducting a sensitivity analysis in order to update crop N and P coefficients in nutrient balances. The analysis provides a basis for decisions on which variables are worth investing resources in to obtain more precise coefficients and hence a more accurate estimation of the output.
Conclusions The outcome of this action can serve as a basis for recommendations on sound methodologies to obtain better practices in terms of obtaining N and P crop content coefficients, considering factors such as, scientific ground, cost-efficiency and practical feasibility. Ideally, harmonised coefficients should be used by all reporting systems within each country. Differences in coefficients between countries should be supported by well-documented and confirmed evidence of differences in crop products in terms of N and P content.
30

ReferencesAndrist Rangel Y, Eriksson J, Fägerlind K, Liew J, Ländell G, Wahlstedt G (2013). Coefficients for N and P content of cereals and temporary grasses for use in the Swedish nutrient balances. Sixth International Conference on Agricultural Statistics, Rio de Janeiro, 23-25 October 2013. (Submitted)Berry PM, Stockdale EA, Sylvester-Bradley R, Philipps L, Smith KA, Lord EI, Watson CA, Fortune S (2003) N, P and K budgets for crop rotations on nine organic farms in the UK. Soil Use and Management 19, 112-118.Blombäck K, Johnsson H, Lindsjö A, Mårtensson K, Persson K, Schmieder F (2011) Läckage av näringsämnen från svensk åkermark för år 2009 beräknat med PLC5-metodik –Beräkningar av normalläckage av kväve och fosfor för 2009, SMED Rapport 57 2011 (in Swedish)Campbell CA, Lafond GP, VandenBygaart AJ, Zentner RP, Lemke R, May WE, Holzapfel CB (2011) Effect of crop rotation, fertilizer and tillage management on spring wheat grain yield an N and P content in a thin black chernozem: a long term study. Canadian Journal of Plant Science 91, 467-483.Chalmers AG, Dyer CJ, Sylvester-Bradley R (1998) Effects of nitrogen fertilizer on the grain yield and quality of winter oats. Journal of Agricultural Science 131, 395-407.Claesson S, Steineck S (1991).Växtnäring hushållning – miljö. Speciella skrifter 41, SLU, Uppsala. (in Swedish)El-Nashaar HM, Banowetz GM, Peterson CJ, Griffith SM (2010) Genetic variability of elemental concentration in winter wheat straw. Energy & Fuels 24, 2020-2027.Eriksson J, Andersson A, Andersson R (1997) Current status of Swedish arable soils. Naturvårdsverket, Rapport 4778. (in Swedish with English summary)Eriksson J, Mattsson L, Söderström M (2010) Current status of Swedish arable soils and cereal crops. Data from the period 2001-2007. Naturvårdsverket, Rapport 6349. (in Swedish with English summary)Eurostat (2011) Analysis of methodologies for calculating greenhouse gas and ammonia emissions and nutrient balances. Eurostat Methodologies and Working papers. ISSN 1977-0375Gomez-Becerra HF, Yazici A, Ozturk L, Budak H, Peleg Z, Morgounov A, Fahima T, Saranga Y, Cakmak I (2010) Genetic variation and environmental stability of grain mineral nutrient concentration in Triticum dicoccoides under five environments. Euphytica 171, 39-52.
31

Haak E (1998) Influence of weather and N-fertilization on DM-yield and nutrient uptake in the fertility experiment R3-9003, 1985-1992. Swedish University of Agricultural Sciences, Department of Soil Sciences, Division of Soil Fertility, Report 200.Hakala K, Keskitalo M, Eriksson C & Pitkänen T (2009) Nutrient uptake and biomass accumulation for eleven different field crops. Agricultrual and Food Science 18, 366-387.Havlin JL, Beaton JD, Tisdale SL, Nelson WL (1999) Soil Fertility and Fertilizers – an Introduction to Nutrient Management, 6th ed. Prentice Hall, New Jersey.HELCOM (2011) The Fifth Baltic Sea Pollution Load Compilation (PLC-5). Balt. Sea Environ. Proc. No. 128Hoang VN, Alauddin M (2010) Assessing the eco-environmental performance of agricultural production in OECD countries: the use of nitrogen flows and balance. Nutrient Cycling in Agroecosystems 87, 353-368.Johnsson H, Larsson M, Lindsjö A, Mårtensson K, Persson K, Torstensson G (2008). Läckage av näringsämnen från svensk åkermark Beräkningar av normalläckage av kväve och fosfor för 1995 och 2005. Naturvårdsverket rapport nr 5823. 152 pp. (in Swedish with English summary)Larsson S (2011a) Sortvalstabeller 2011. Resultat från sortförsök 2006-2010. Sortprovningen, SLU. (in Swedish)Larsson S (2011b) Sortvalstabeller vårsäd 2012. Sortvalstabeller ekologisk odling 2012. Resultat från sortförsök tom 2011. Sortprovningen, SLU. (in Swedish)Lester DW, Birch CJ, Dowling CW (2009) Fertiliser N and P applications on two vertisols in north-eastern Australia. 2. Grain P concentrations and P removal in grain from two long-term experiments. Crop & Pasture Science 60, 218-229.Mattsson L (2003) Nitrogen balance in barley and winter wheat. Swedish University of Agricultural Sciences, Department of Soil Science, Division of Soil Fertility, Raport 206. (in Swedish)Mattsson L (2004) Nitrogen fertilization in winter wheat. Swedish University of Agricultural Sciences, Department of Soil Science, Division of Soil Fertility, Report 209. (in Swedish)Mattsson L (2005) Halmskörden, hur stor är den? Swedish University of Agricultural Sciences, Department of Soil Science, Division of Soil Fertility (in Swedish, not officially published)Mattsson L (2006) Nitrogen intensity in barley – yields and N off-take. Swedish University of Agricultural Sciences, Department of Soil Science, Division of Soil Fertility, Report 212. (in Swedish)Neacşu A (2011) Grain protein concentration and its stability in a set of winter wheat cultivars, grown in diverse environments and
32

management practices. Romanian Agricultural Research 28, 29-36.NorFor (2012) Nordic Feed Evaluation System, search for feedstuff, online: http://feedstuffs.norfor.info/ [2012-05-08]Öborn I, Edwards AC, Witter E, Oenema O, Ivarsson K, Withers PJA, Nilsson SI, Stinzing R (2003) Element balances as a tool for sustainable nutrient management: a critical appraisal of their merits and limitations within an agronomic and environmental context. European Journal of Agriculture 20, 211-225.OECD (2012) Homepage - OECD/Eurostat Gross Nutrient Balance excel spreadsheets. http://stats.oecd.org/viewhtml.aspx?QueryName=516&QueryType=View [2012-10-02]Oenema O, Kros H, de Vries W (2003) Approaches and uncertainties in nutrient budgets: implications for nutrient management and environmental policies. European Journal of Agronomy 20, 3-16.Peltonen-Sainio P & Jauhiainen L (2010) Cultivar improvement and environmental variability in yield removed nitrogen of spring cereals and rapeseed in northern growing conditions according to a long term dataset. Agricultural and Food Science 19, 341-353.Rodrígues RH, Morales DA, Rodrígues ER, Romero CD (2011) Minerals and trace elements in a collection of wheat varieties from the Canary islands. Journal of Food Composition and Analysis 24, 1081-1090.Saleque MA, Timsina J, Panaullah GM, Ishaque M, Pathan ABMBU, Connor DJ, Saha PK, Quayyum MA, Humphreys E, Meisner CA (2006) Nutrient uptake and apparent balances for rice-wheat sequences. II. Phosphorus. Journal of Plant Nutrition 28, 157-172.Statistics Sweden (2011) Nitrogen and phosphorus balances for agricultural land and agricultural sector in 2009. MI 40 SM 1102 (in Swedish with English summary)Statistics Sweden (2013) Cultivation measures in agriculture 2012. Set-aside, ley, spring barley, oats, winter grain and utilisation of straw and tops. MI 1001 SM 1302 (in Swedish with English summary)Swanston JS, Smith PL, Agu RC, Brosnan JM, Bringhurst TA, Jack FR (2012) Variation, across environments within the UK, in grain protein and grain hardness, in wheat varieties of differing distilling quality. Field Crop Research 127, 146-152.Swedish Board of Agriculture (2013a) Use of agricultural land 2012. Final statistics. JO 10 SM 1301. (in Swedish with English summary) Swedish Board of Agriculture (2013b) STANK in MIND product list, updated May 2013.
33

Swedish EPA (2012) National Inventory Report Sweden 2012.Swedish EPA/SMED (2005) A review of Swedish crop residue statistics used in the greenhouse gas inventory. SMED report No 65.Swedish University of Agricultural Sciences (2003). Fodertabeller för idisslare 2003 (ed. R Spörndly). Department of Animal Nutrition and Management, Report 257. (in Swedish)Taiz L, Zeiger E (1998) Plant Physiology, 2nd ed. Sinauer Associates Inc., Publishers, Sunderland, Massachusetts.Vos J, van der Putten PEL (2000) Nutrient cycling in a cropping system with potato, spring wheat, sugar beet, oats and nitrogen catch crops. I. Input and offtake of nitrogen, phosphorus and potassium. Nutrient Cycling in Agroecosystems 56, 87-97.Wang X, Cai D, Hoogmoed WB, Perdok UD, Oenema O (2007) Crop residue, manure and fertilizer in dryland maize under reduced tillage in northern China: I grain yields and nutrient use efficiencies. Nutrient Cycling in Agroecosystems 79, 1-16.Wang ZH, Li SX, Malhi S (2008) Effects of fertilization and other agronomic measures on nutritional quality of crops. Journal of the Science of Food and Agriculture 88, 7-23.World Bank, FAO and UNSC (2011). Global Strategy to Improve Agricultural and Rural Statistics. Report no. 56719‐GLB, World Bank, Washington DC. [www.fao.org/economic/ess/ess-capacity/ess-strategy/en/]Yaseen M, Mali SS (2009) Differential growth performance of 15 wheat genotypes for grain yield and phosphorus uptake on a low phosphorus soil without and with applied phosphorus fertilizer. Journal of Plant Nutrition 32, 1015-1043.
34

Appendix I Coefficients for N and P in grains of winter wheat (Table 1-2), spring barley (Table 3-4), oats (Table 5-6) and in crop residues (Tables 7-8). To simplify comparisons, the concentrations are presented both in dry matter and at 15 percent moisture content. Crop residues, such as straw, are also used as feedstuff, and have consequently been analysed for feed evaluations. The results are presented as content of crude protein, which can be converted to N content by division with 6.25. Such figures are presented, together with other experimental and calculated figures, in Table 7. For full references, see reference list.
Table I. Nitrogen (N) concentration in grains of winter wheat, in percent of dry matter, in percent of grains with 15 percent moisture content, details about location, notes of interest, and the source of reference. DM= dry matter, MC= moisture content. Location Notes % N in
DM% N in 15% MC
Reference
Sweden SCB nutrient balance
2.24 1.9 Haak, 1988 in Claesson & Steineck 1991
Sweden OECD/Eurostat GNB 2.12 1.8 OECD 2012 Indicated source: EUROSTAT
Sweden STANK in MIND (Swedish Board of Agriculture)
2.13a/1.95 b
1.81
a/1.66 bSwedish Board of Agriculture 2013b
Sweden SOILNDB simulation model
2.1 1.79 Johnsson et al. 2008, Blombäck et al. 2011
Sweden Environmental monitoring
2.0 1.7 Eriksson et al. 2010
Sweden Variety trials, mean 2006-2010
2.06 1.75 Larsson 2011a
Sweden Variety trials, organic, mean 2008-2011
1.71 1.45 Larsson 2011b
Sweden 0 kg N/ha 1.59 1.35 Mattsson 2005
Sweden 20-60 kg N/ha 1.76 1.50 Mattsson 2005Sweden 61-120 kg N/ha 2.19 1.86 Mattsson 2005
Sweden >120 kg N/ha 1.94 1.65 Mattsson 2005Sweden, Landskrona
0 kg N/ha 1.57 1.34 Haak 1998
Sweden, Landskrona
100 kg N/ha 1.75 1.49 Haak 1998
Sweden, 150 kg N/ha 1.99 1.60 Haak 1998
35

LandskronaSweden, S Götaland
0 kg N/ha 1.67 1.42 Mattsson 2004
Sweden, S Götaland
40 kg N/ha 1.73 1.47 Mattsson 2004
Sweden, S Götaland
80 kg N/ha 1.87 1.59 Mattsson 2004
Sweden, S Götaland
120 kg N/ha 2.03 1.73 Mattsson 2004
Sweden, S Götaland
160 kg N/ha 2.16 1.84 Mattsson 2004
Sweden, S Götaland
200 kg N/ha 2.21 1.88 Mattsson 2004
Sweden, S Götaland
240 kg N/ha 2.10 1.79 Mattsson 2004
Sweden, N Götaland
0 kg N/ha 1.69 1.44 Mattsson 2004
Sweden, N Götaland
40 kg N/ha 1.71 1.45 Mattsson 2004
Sweden, N Götaland
80 kg N/ha 1.81 1.54 Mattsson 2004
Sweden, N Götaland
120 kg N/ha 1.95 1.66 Mattsson 2004
Sweden, N Götaland
160 kg N/ha 2.09 1.78 Mattsson 2004
Sweden, N Götaland
200 kg N/ha 2.18 1.85 Mattsson 2004
Sweden, N Götaland
240 kg N/ha 2.17 1.84 Mattsson 2004
Sweden, Svealand 0 kg N/ha 1.87 1.59 Mattsson 2004
Sweden, Svealand 40 kg N/ha 1.88 1.60 Mattsson 2004Sweden, Svealand 80 kg N/ha 1.96 1.67 Mattsson 2004
Sweden, Svealand 120 kg N/ha 2.08 1.77 Mattsson 2004Sweden, Svealand 160 kg N/ha 2.20 1.87 Mattsson 2004
Sweden, Svealand 200 kg N/ha 2.30 1.96 Mattsson 2004Sweden, Svealand 240 kg N/ha 2.34 1.99 Mattsson 2004
Finland Variety trials 1988-2008
2.20c 1.87c Peltonen-Saino & Jauhiainen 2010
Canada, Saskatchewan
No tillage, 18 year experiment
2.54c,d 2.16 Campbell et al. 2011
UK Content for nutrient balance calculations, organic farming
1.7d 1.45 Berry et al. 2003
Romania Variety trial 1.97- 1.67-1.94 Neacşu 2011
36

2.28d,e
a) Grain for bread, 12 percent proteinb) Grain for fodder, 11 percent protein.c) Spring wheat; normally somewhat higher N content than in winter wheatd) Not stated if contents are given for DM or fresh material. DM assumed here.e) Protein content stated, conversion factor 5.7 used.
37
Table II. Phosphorus (P) concentration in grains of winter wheat, in percent of dry matter, in percent of grains with 15 percent moisture content, details about location, note about the experiment or the model where the contents are used, and the source of reference. DM= dry matter, MC= moisture content.Location Notes % P in
DM% P in 15% MC
Reference
Sweden SCB nutrient balance 0.44 0.37 Haak 1988 in Claesson and Steineck 1991
Sweden OECD/Eurostat GNB 0.36 0.31 OECD 2012 Indicated source: STANK
Sweden STANK in MIND (Swedish Board of Agriculture)
0.36 0.31 Swedish Board of Agriculture 2013b
Sweden ICECREAMDB model 0.41 0.35 Johnsson et al. 2008, Blombäck et al. 2011
Sweden Environmental monitoring
0.37 0.32 Eriksson et al. 2010
Sweden, Landskrona
0 kg N/ha 0.38 0.32 Haak 1998
Sweden, Landskrona
100 kg N/ha 0.35 0.30 Haak 1998
Sweden, Landskrona
150 kg N/ha 0.34 0.29 Haak 1998
Canada, Saskatchewan
18 year no tillage 0.40a, b 0.34 Campbell et al. 2011
UK Content used for nutrient balance calculations, organic farming
0.30b 0.26 Berry et al. 2003
Australia, Queensland, New South Wales
Long-term study, 0-120 kg N/ha, 0-20 kg P/ha
0.40 0.34 Lester et al. 2009
Turkey, Israel Wild varieties 0.51-0.61b, c
0.43-0.52 Gomez-Becerra et al. 2010
Tenerife One year, no fertilisation, wild varieties
0.28 0.2370d Rodrígues et al. 2011
Bangladesh Three location, three soil types, two fertilisation regimes
0.33-0.37b
0.28-0.31 Saleque et al. 2006
Pakistan Field experiment, 15 cultivars, no P fert.
0.29b 0.25 Yaseen & Malhi 2009
Pakistan Field experiment, 15 cultivars, P added
0.32bi 0.27 Yaseen & Malhi 2009
a) Spring wheatb) Not stated if contents are given for DM or fresh material. DM assumed here.c) Emmer wheatd) “Fresh” weight, percent MC not stated
38

39

Table III. Nitrogen (N) concentration in grains of spring barley, in percent of dry matter, in percent of grains with 15 percent moisture content, details about location, notes about the experiment or the model where the contents are used, and the source of reference. DM= dry matter, MC= moisture content.Location Notes % N in
DM% N in 15% MC
Reference
Sweden SCB nutrient balance
2.0 1.7 Haak, 1988 in Claesson and Steineck 1991
Sweden OECD/Eurostat GNB 1.88 1.6 OECD 2012 Indicated source: EUROSTAT
Sweden STANK in MIND (Swedish Board of Agriculture)
1.93 1.64 Swedish Board of Agriculture 2013b
Sweden SOILNDB simulation model
2.0 1.7 Johnsson et al. 2008, Blombäck et al. 2011
Sweden Environmental monitoring
1.8 1.5 Eriksson et al. 2010
Sweden Variety trials, mean 2006-2010
1.84 1.56 Larsson 2011a
Sweden Variety trials, organic, mean 2008-2011
1.81 1.54 Larsson 2011b
Sweden 0 kg N/ha 1.75 1.49 Mattsson 2005
Sweden 20-60 kg N/ha 1.84 1.56 Mattsson 2005Sweden 61-120 kg N/ha 2.08 1.77 Mattsson 2005
Sweden >120 kg N/ha 2.23 1.90 Mattsson 2005Sweden, Landskrona
0 kg N/ha 1.66 1.41 Haak 1998
Sweden, Landskrona
60 kg N/ha 1.73 1.47 Haak 1998
Sweden, Landskrona
90 kg N/ha 1.81 1.54 Haak 1998
Sweden, S Götaland
0 kg N/ha 1.65 1.40 Mattsson 2006
Sweden, S Götaland
40 kg N/ha 1.72 1.46 Mattsson 2006
Sweden, S Götaland
80 kg N/ha 1.86 1.58 Mattsson 2006
Sweden, S Götaland
120 kg N/ha 2.03 1.73 Mattsson 2006
Sweden, S Götaland
160 kg N/ha 2.20 1.87 Mattsson 2006
Sweden, S Götaland
200 kg N/ha 2.38 2.02 Mattsson 2006
Sweden, S 240 kg N/ha 2.55 2.17 Mattsson 200640

Götaland
Sweden, N Götaland
0 kg N/ha 1.70 1.45 Mattsson 2006
Sweden, N Götaland
40 kg N/ha 1.79 1.52 Mattsson 2006
Sweden, N Götaland
80 kg N/ha 1.90 1.62 Mattsson 2006
Sweden, N Götaland
120 kg N/ha 2.02 1.72 Mattsson 2006
Sweden, N Götaland
160 kg N/ha 2.15 1.83 Mattsson 2006
Sweden, N Götaland
200 kg N/ha 2.27 1.93 Mattsson 2006
Sweden, N Götaland
240 kg N/ha 2.40 2.04 Mattsson 2006
Sweden, Svealand 0 kg N/ha 1.81 1.54 Mattsson 2006Sweden, Svealand 40 kg N/ha 1.87 1.59 Mattsson 2006
Sweden, Svealand 80 kg N/ha 1.96 1.67 Mattsson 2006Sweden, Svealand 120 kg N/ha 2.08 1.77 Mattsson 2006
Sweden, Svealand 160 kg N/ha 2.21 1.88 Mattsson 2006Sweden, Svealand 200 kg N/ha 2.33 1.98 Mattsson 2006
Sweden, Svealand 240 kg N/ha 2.45 2.08 Mattsson 2006Sweden, Norrland 0 kg N/ha 1.83 1.56 Mattsson 2006
Sweden, Norrland 40 kg N/ha 1.86 1.58 Mattsson 2006Sweden, Norrland 80 kg N/ha 1.96 1.67 Mattsson 2006
Sweden, Norrland 120 kg N/ha 2.11 1.79 Mattsson 2006Sweden, Norrland 160 kg N/ha 2.27 1.93 Mattsson 2006
Sweden, Norrland 200 kg N/ha 2.43 2.07 Mattsson 2006Sweden, Norrland 240 kg N/ha 2.59 2.20 Mattsson 2006
Finland Variety trials 1988-2008, six-row barley
2.0 1.7 Peltonen-Saino & Jauhiainen 2010
Finland Variety trials 1988-2008, two-row barley
1.9 1.62 Peltonen-Saino & Jauhiainen 2010
Finland, Jokioinen Pot experiment 1.90 1.62 Hakala et al. 2009UK Content used for
nutrient balance calculations, organic farming
1.3a 1.11 Berry et al. 2003
a) Not stated if contents are given for DM or fresh material. DM assumed here.
41

Table IV. Phosphorus (P) concentration in grains of spring barley, in percent of dry matter, in percent of grains with 15 percent moisture content, details about location, note about the experiment or model where the contents are used and the source of reference. DM= dry matter, MC= moisture content.Location Notes % P in
DM% P in 15% MC
Reference
Sweden SCB nutrient balance 0.41 0.35 Haak, 1988 in Claesson and Steineck 1991
Sweden OECD/Eurostat GNB 0.40 0.34 OECD 2012. Indicated source: STANK
Sweden STANK in MIND (Swedish Board of Agriculture)
0.40 0.34 Swedish Board of Agriculture 2013b
Sweden ICECREAMDB model 0.41 0.35 Johnsson et al. 2008, Blombäck et al. 2011
Sweden Environmental monitoring
0.41 0.35 Eriksson et al. 2010
Sweden, Landskrona
0 kg N/ha 0.41 0.35 Haak 1998
Sweden, Landskrona
60 kg N/ha 0.38 0.32 Haak 1998
Sweden, Landskrona
90 kg N/ha 0.37 0.31 Haak 1998
Finland, Jokioinen Pot experiment 0.49 0.42 Hakala et al. 2009
UK Content used for nutrient balance calculations, organic farming
0.31 0.26 Berry et al. 2003
1) Not stated if contents are given for DM or fresh material. DM assumed here.
42

Table V. Nitrogen (N) concentration in grains of oats, in percent of dry matter, in percent of grains with 15 percent moisture content, details about location, notes about experiments or model where the content is used, and the source of reference. DM= dry matter, MC= moisture content.Location Notes % N in
DM% N in 15% MC
Reference
Sweden SCB nutrient balance 2.12 1.8 Haak, 1988 in Claesson and Steineck 1991
Sweden OECD/Eurostat GNB 2.00 1.7 OECD 2012. Indicated source: EUROSTAT
Sweden STANK in MIND (Swedish Board of Agriculture)
1.94 1.65 Swedish Board of Agriculture 2013b
Sweden SOILNDB simulation model
2.1 1.8 Johnsson et al. 2008, Blombäck et al. 2011
Sweden Environmental monitoring
1.7 1.45 Eriksson et al. 2010
Sweden Variety trials, mean 2006-2010
2.11 1.79 Larsson 2011a
Sweden Variety trials, organic, mean 2008-2011
1.77 1.50 Larsson 2011b
Sweden 0 kg N/ha 1.78 1.51 Mattsson 2005Sweden 20-60 kg N/ha 1.91 1.62 Mattsson 2005
Sweden 61-120 kg N/ha 2.17 1.84 Mattsson 2005Sweden >120 kg N/ha 2.15 1.83 Mattsson 2005
Finland Variety trials 1988-2008 2.1 1.79 Peltonen-Sainio & Jauhiainen 2010
England and Wales
0-240 kg N/ha, 14 experiments in 5 years
1.42-2.381
1.21-2.021 Chalmers et al. 2009
Wageningen, the Netherlands
Nutrient balance experiment 1989-1995
1.78 1.51 Vos & van der Putten 2000
1) Winter oats
43

Table VI. Phosphorus (P) concentration in grains of oats, in percent of dry matter, in percent of grains with 15 percent moisture content, details about location, notes about the experiments or the models where the contents are used, and the source of reference. DM= dry matter, MC= moisture content.Location Notes % P in
DM% P in 15% MC
Reference
Sweden SCB nutrient balance 0.40 0.34 Haak, 1988 in Claesson and Steineck 1991
Sweden OECD/Eurostat GNB 0.39 0.33 OECD 2012. Indicated source: STANK
Sweden STANK in MIND (Swedish Board of Agriculture)
0.39 0.33 Swedish Board of Agriculture 2013b
Sweden ICECREAMDB model 0.41 0.35 Johnsson et al. 2008
Sweden Environmental monitoring
0.39 0.33 Eriksson et al. 2010
UK Content used for nutrient balance calculations, organic farming
0.31 0.26 Berry et al. 2003
Wageningen, the Netherlands
Nutrient balance experiment 1989-1995
0.40 0.34 Vos & van der Putten 2000
44

Table VII. Nitrogen (N) concentration in crop residues of winter wheat, spring barley and oats, and the source of reference. DM= dry matter, MC= moisture content.Location Notes Winter
wheatSpring barley
Oats Reference
DM 15% MC
DM 15% MC
DM 15% MC
Sweden SCB nutrient balance
0.71
0.6 0.94
0.8 0.82
0.7 Haak, 1988 in Claesson and Steineck 1991
Sweden OECD/Eurostat GNB
0.8 0.7 0.8 0.7 0.8 0.7 OECD 2012 Indicated source: EUROSTAT
Sweden STANK in MIND (Swedish Board of Agriculture)
0.8 0.7 0.8 0.7 0.8 0.7 Swedish Board of Agriculture 2013b
Sweden Greenhouse gas inventory
0.51
0.43
0.77
0.65
0.73
0.62
Swedish EPA/SMED 2005, Swedish EPA 2012
Sweden Straw, 0 kg N/ha 0.31
0.26
0.71
0.60
0.55
0.47
Mattsson 2005
Sweden Straw, 20-60 kg N/ha
0.44
0.37
0.67
0.57
0.54
0.46
Mattsson 2005
Sweden Straw, 61-120 kg N/ha
0.56
0.48
0.73
0.62
0.70
0.60
Mattsson 2005
Sweden Straw, >120 kg N/ha
0.49
0.39
0.85
0.72
0.85
0.72
Mattsson 2005
Finland, Jokioinen
Pot experiment - - 0.38
0.32
- - Hakala et al. 2009
UK Content for nutrient balance, straw, organic farming
0.46a
0.39
- - - - Berry et al. 2003
Sweden Straw, cereals 0.64b
0.54
0.64b
0.54
0.64b
0.54
NorFor 2012
Denmark Straw 0.53
0.45
0.64c
0.54
0.59
0.50
NorFor 2012
Norway Straw, cereals 0.61b
0.52
0.61b
0.52
0.61b
0.52
NorFor 2012
Oregon, USA Straw, harvested by combine, 11 cm below flag leaf
0.66
0.56
- - - - El-Nashaar et al. 2010
Oregon, USA Straw, stubble cut 11 cm above soil, below the flag leaf
0.64
0.54
- - - - El-Nashaar et al. 2010
Wageningen, Straw, nutrient - - - - 0.3 0.3 Vos & van der
45

the Netherlands
balance experiment 1989-1995,
6 1 Putten 2000
Wageningen, the Netherlands
Stubbles, nutrient balance experiment 1989-1995
- - - - 0.38
0.32
Vos & van der Putten 2000
a) Not stated if content given for DM or fresh weight, DM assumed here.b) All cereal crops togetherc) Winter barleyTable VIII. Phosphorus (P) concentration in crop residues of winter wheat, spring barley and oats, and the source of reference.Location Notes Winter
wheatSpring barley
Oats Reference
DM 15% MC
DM
15% MC
DM
15% MC
Sweden Content in straw SCB nutrient balance
0.12 0.1 0.12
0.1 0.12
0.1 Haak 1988 in Claesson and Steineck 1991
Sweden OECD/Eurostat 0.38 0.32a
0.38
0.32a
0.38
0.32a
OECD 2012 Indicated source unknown
Sweden STANK in MIND (Swedish Board of Agriculture)
0.12 0.1 0.12
0.1 0.12
0.1 Swedish Board of Agriculture 2013b
Finland, Jokioinen
Pot experiment - - 0.21
0.18 - - Hakala et al. 2009
UK Content used for nutrient balance, straw, organic farming
0.1b 0.09 - - - - Berry et al. 2003
Oregon, USA Straw, combine harvested 11 cm below flag leaf, mean of 8 cultivars
0.031
0.027
- - - - El-Nashaar et al. 2010
Oregon, USA Straw, stubble cut 11 cm above soil, below the flag leaf
0.023
0.019
- - - - El-Nashaar et al. 2010
Pakistan Field experiment, 15 cultivars, no P fertilisation
0.021b
0.018
- - - - Yaseen & Malhi 2009
Pakistan Field experiment, 15 cultivars, with P fert.
0.025b
0.021
- - - - Yaseen & Malhi 2009
Wageningen, the Netherlands
Straw, nutrient balance experiment 1989-1995,
- - - - 0.13
0.11 Vos & van der Putten 2000
Wageningen, Stubbles, nutrient - - - - 0.1 0.13 Vos & van 46
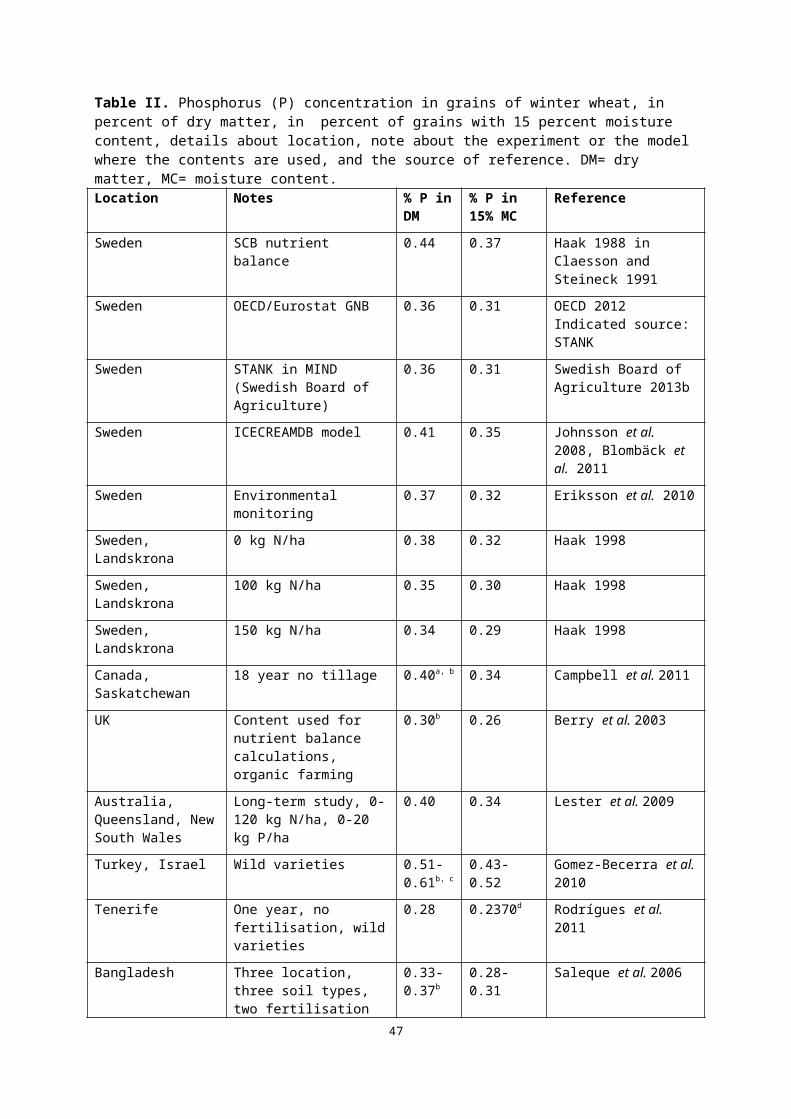
the Netherlands
balance experiment 1989-1995
5 der Putten 2000
a) Not stated if content given for DM or fresh weight, 15 percent MC assumed here.b) Not stated if content given for DM or fresh weight, DM assumed here.
47
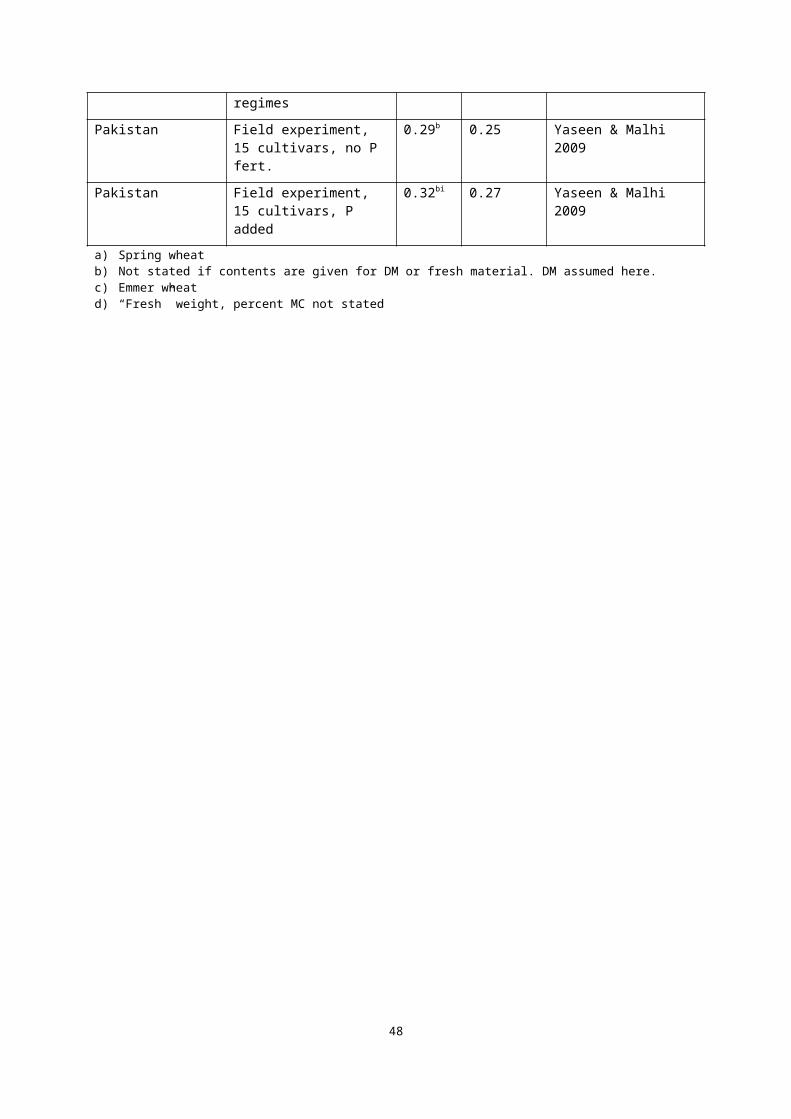
Appendix II Table I. N and P content of leguminous ley crops, depending on which cut and time of cutting. References: SLU=Swedish University of Agricultural Sciences (2003) and NorFor=NorFor (2012). For full references, see reference list.Species Which
cutTime of cutting
N (g/kg DM)
P (g/kg DM)
Reference
Blue lucerne
1st early 39.4 2.8 SLU
34.2 2.8 SLUnormal 32.6 3.0 SLU
29.1 3.0 SLUlate 27.5 3.0 SLU
24.0 3.0 SLUGalega orientalis 34.9 3.0 SLU
Lotus corniculatus 27.8 - NorFor31.4 - SLU
Red clover 1st early 33.3 3.0 NorFor41.1 3.0 SLU
36.0 3.0 SLUnormal 29.1 3.0 NorFor
34.2 3.0 SLU30.9 3.0 SLU
late 30.2 3.0 NorFor27.5 3.0 SLU
24.2 3.0 SLU2nd early 41.1 3.0 NorFor,
SLU36.0 3.0 SLU
normal 34.2 3.0 NorFor, SLU
30.9 3.0 SLUlate 31.7 3.0 NorFor
29.1 3.0 SLU25.8 3.0 SLU
3rd 24.8 3.0 NorForWhite clover
41.4 4.1 NorFor, SLU
1st 36.8 4.1 NorFor
2nd 42.1 4.1 NorFor
48

3rd 42.1 4.1 NorFor
Mean leguminous crops 33.1 3.1
49
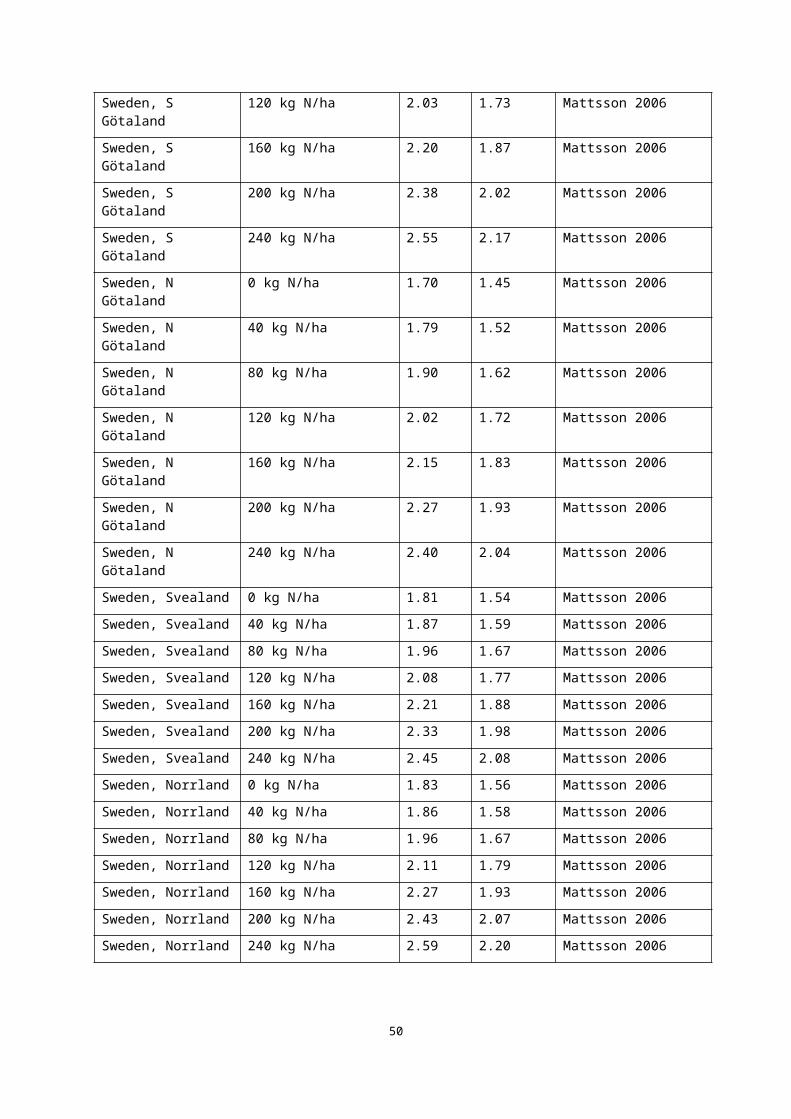
Table II. N and P content of grasses and mixed leys with only grass species, depending on which cut and time of cutting. References: SLU=Swedish University of Agricultural Sciences (2003) and NorFor=NorFor (2012). Species Which
cutTime of cutting
N (g/kg DM)
P (g/kg DM)
Reference
Meadow fescue 1st relatively early
24.2 3.5 NorFor
2nd early 16.3 3.5 NorForRyegrass (English) 1st 20.6 3.5 NorFor
2nd 16.6 3.5 NorForRyegrass (English + hybrid) 1st 19.2 3.5 NorFor
Timothy 1st relatively early
19.0 3.5 NorFor
2nd 16.0 3.5 NorForMixed ley, prognosis 22.4 2.5 NorFor
Mixed ley. timothy, English ryegrass, meadow fescue, Dactylis glomerata
1st early 30.9 3.5 SLU24.0 3.5 SLU
normal 24.0 3.5 SLU17.3 3.5 SLU
late 17.3 3.5 SLU12.2 3.5 SLU
2nd early 30.9 3.5 SLU24.0 3.5 SLU
normal 24.0 3.5 SLU17.3 3.5 SLU
late 17.3 3.5 SLU12.2 3.5 SLU
Mean grass species 20.3 3.5
50

Table III. N and P content of mixed leys, depending on the proportion of leguminous crops in the stand, which cut and time of cutting. References: NorFor=NorFor (2012). Species Which
cutTime of cutting
N (g/kg DM)
P (g/kg DM)
Reference
Mixed ley 1st early 26.2 2.8 NorFor
normal 25.1 2.8 NorForlate 21.0 2.8 NorFor
2nd early 21.0 2.8 NorFornormal 19.7 2.8 NorFor
late 18.6 2.8 NorFor3rd 24.3 2.8 NorFor
1-50% legumes, prognosis
23.2 2.6 NorFor
51-100% legumes, prognosis
24.8 2.6 NorFor
Table IV. N and P content of mixed silage, depending on proportion of leguminous species and location (no information about fertilisation). References: SLU=Swedish University of Agricultural Sciences (2003).% legumes
Location N (g/kg DM)
P (g/kg DM)
<25% Sweden 21.4 (17.0-25.8)
2.7
Northern Sweden
21.1 (17.1-25.1)
2.6
Southern Sweden
21.9 (17.4-26.4)
2.7
25-50% Sweden 22.4 (18.1-26.9)
2.7
Northern Sweden
21.4 (17.4-25.3)
2.6
Southern Sweden
22.7 (18.4-27.2)
2.7
Table V. N and P content of mixed leys, depending on the energy value of the resulting feed. References: SLU=Swedish University of Agricultural Sciences (2003).Energy content (MJ/kg DM)
N (g/kg DM)
P (g/kg DM)
6.0-8.5 17.0 (12.3-21.6)
2.3 (1.8-2.8)
8.5-9.5 19.2 (14.7-23.7)
2.5 (1.9-3.1)
9.5-10.5 21.3 (17.3- 2.7 (2.2-51

25.3) 3.2)10.5-11.5 23.2 (19.4-
27.2)2.8 (2.3-3.3)
11.5-12.0 25.3 (21.1-29.4)
2.8 (2.3-3.3)
52

i