Embed Size (px)
Citation preview
From the Users’ Perspective- The UCSD Libraries User Survey Project
by Dawn E. Talbot, Gerald R. Lowell, and Kerry Martin
The University of California, San Diego Libraries conducted
its first comprehensive user survey in 1996. This article
describes the user-driven survey methodology, its
successes and failures, and conclusions about the survey process. The survey provided valuable benchmark data and
has led to improved services for users.
Dawn E. Jalbot is Information Manager,
Center for Magnetic Recording Research,
University of California, San Diego,
9500 G/man Dr., La /o//a, California
92093-0401 [email protected]>;
Gerald R. Lowell is University Librarian,
University of California, San Diego
Kerry Martin was an independent consultant
at the time of this project.
U ser surveys can provide reliable and valid data for planning ser- vice improvements and for budget
planning. Most often, however, well inten- tioned staff, unskilled in survey design and process, spend extensive time and effort conducting user surveys that lack the methodology required to produce statisti- cally valid findings. As had other institu- tions, the University of California, San Diego (UCSD) Libraries had from time to time conducted surveys to elicit feedback from users regarding services. These ranged from point-of-contact question- naires to surveys of specific groups of library users, but none had been compre- hensive in scope and captured the views of significant representatives from all cam- pus library groups.
Beginning in 1995, following library organizational changes and the adoption of a new mission statement, resources were allocated for an extensive library sur- vey. After months of time-consuming planning, the Library conducted its first comprehensive statistically valid user sur- vey in the spring of 1996. Library staff developed questionnaires with involve- ment from faculty, and graduate and undergraduate students, so that the survey topics were important to these users. This article describes this user-driven survey process, including its successes and fail- ures. Detailed results from the survey are not covered here.’ Rather, the focus of this article is on the methodology used for this comprehensive survey effort that garnered a high response rate.
OVERALLGOALSFOR THE UCSD SURVEY
The decision to conduct a comprehensive user survey followed the introduction of a broad change to the Library’s manage- ment philosophy and organizational struc- ture. During this restructuring process, the Library management team pursued a plan-
ning process outlined by James C. Collins and Jerry I. Porras2 Subsequently, a Vision Statement was adopted that con- tained the following goal: “By 1998, when surveyed, 90% of the UCSD Libraries’ primary users-faculty, staff and stu- dents-will rate the UCSD Libraries’ col- lections, services, programs, staff and facilities as either ‘outstanding’ or ‘excel- lent’ .” Obviously, a survey of some type was implied if the Library truly desired to evaluate its progress toward this goal.
As the process moved forward, it became apparent that the same question- naires and sampling plan would need to be utilized in subsequent surveys. This would allow the measurement of the degree to which change had taken place, the degree to which objectives were met, and the per- ceived value of new programs introduced to meet user needs. This required the sur- vey questionnaires to be designed so that they would “age well” with time and be re-useable with only minor revisions.
The Library was committed to collect- ing information using standard survey research techniques to insure valid and reliable data that could be used in subse- quent planning. Having relied heavily on market research surveys while working in the private sector, the University Librarian had a strong appreciation for the benefit of valid and reliable surveys. There was also a recognized need to gather data that would be accepted by groups outside the library, including campus administration, budget officers, and the Library’s users themselves. The Library also needed benchmarking data, only obtainable through a carefully administered research tool. These data would assess the current level of satisfaction with, awareness of, and expectations for, the Library’s collec- tions, services, programs, staff, and facili- ties.
As noted in the Vision Statement (Appendix A), the Library is a user-cen-
September 1998 357
tered organization. The Library saw the survey as an opportunity to invoke this philosophy in practical terms: it wanted the users to help determine its future direc- tion. Therefore, the Library wanted to hear directly from the users about their needs and concerns, rather than relying on anec- dotal information from library staff. Although more costly to design, such a survey would yield the best results. This desire for user involvement greatly influ- enced the methodology used to develop the questionnaires. User focus groups helped determine the content of the sur- vey.
BACKGROUND To THE UCSD SURVEY
Selling the Concept of the Survey
Many staff members in the organiza- tion did not initially support the concept of a survey. Some questioned why the Library was going to start “from scratch” when there were prior survey results that could be used. Some felt that the Univer- sity Librarian’s comments about the need for a statistically valid survey devalued earlier survey efforts, given the amount of time that had been invested in these earlier projects and the pride with which staff viewed them. To obtain buy-in from the staff, the University Librarian promoted the need for a comprehensive valid survey through small group discussions, starting first with senior library administrators. This incremental buy-in strategy proved successful.
There were two other important issues to address. First, the input from the survey needed to result in tangible change. Since the users were intimately involved in the process, their feedback needed to be not only taken seriously, but also acted upon. If not, the credibility of the organization would be significantly jeopardized. Sec- ond, the staff needed to understand that some of the feedback would be negative. They had to be open to constructive criti- cism.
Planning the Survey: The User Survey Team and the Consultant
During the restructuring of 1995, a new management philosophy was introduced. Called shared decision making (SDM) by the Library, this philosophy is based on self-managed teams, self-directed work groups, and other models emphasizing greater involvement of staff in operational decision-making activities. Consistent with SDM, the Library’s senior leadership felt strongly that a representative team would best lead its user survey efforts. A
call for nominations (including self-nomi- nations) was issued to all library staff; the Library’s senior management group then selected the team members. In July 1995, the University Librarian announced the formation of the first UCSD Libraries’ User Survey Team (UST). The team began with nine members, both librarians and support staff, and represented a cross section of the UCSD Libraries.
The team was fully empowered to launch the survey process. It approved the survey methodology to be employed, drafted the survey, conducted all project administration, and facilitated the presen- tations of findings to library staff and the campus. This environment of full empowerment created a challenging arena for the team and dramatically affected how the group viewed its work, in that each team member approached participation with great seriousness and intensity. Given this level of full empow- erment, all team members exhibited a personal sense of pride. Patience, forti- tude, and dedication were key require- ments for each team member.
“The selection of a particular sample design should attempt
to maximize reliability and external validity, subject to
cost and feasibility constraints.”
Very early in this process the team decided to work with a consultant. The consultant had to be experienced in con- ducting user surveys, but not necessarily within the library community. The deci- sion to work with a consultant from the marketing arena, rather than the library profession, was an attempt to bring a fresh perspective to the study, free of bias which library practitioners may unknowingly introduce. Duke University Library took a similar approach in its 1993 user survey.j
The UST selected the consultant after an exacting and competitive process. The project was not turned over to the consult- ant. Instead, the team worked closely with the consultant during each step of the pro- cess-as the focus groups were con- ducted, as the survey instruments were developed, as pre-testing was done, as sur- vey instruments were refined, as the sur- vey was released into the field, and as results were compiled.
The User Population
The UCSD Libraries primarily serve a research university community of approx- imately 15,000 undergraduates, 3,000 graduates, and 4,000 faculty and research- ers. It is a multi-library system consisting of 11 subject or format-specific libraries dispersed throughout the campus and at two off-site locations. Over 300 library staff members, including 50 professional librarians, serve this user population.
Human Subjects Program and Institutional Review Boards
One unforeseen hurdle that the Library encountered was the perceived jurisdic- tion of the UCSD Human Subjects Com- mittee and Institutional Review Board. Although the jurisdiction of this board would have normally included user sur- veys, the senior administrator overseeing the Human Subjects Committee granted an exception. This exception was based on the view that “research,” as defined by federal regulations governing the use of humans as research subjects, was a “sys- tematic investigation...designed to develop or contribute to generalizable knowledge.” The primary goal of the Library’s survey was to improve the ser- vices of the UCSD Libraries by determin- ing customer preferences. This was deemed not to be “research” to contribute to “generalizable knowledge.”
METHODOLOGY
Survey Objectives
In designing the survey, an attempt was made to overcome some of the known obstacles to user surveys. Doris J. Schlicter and Michael Pemberton4 have identified a number of reasons why librar- ies, specifically, are reluctant to undertake user surveys: a lack of skilled staff to design and implement a large scale sur- vey, survey costs, difficulty of translating data into actionable items, and an inherent distrust of survey research methodology. Of particular concern to our study was that survey data would result in actionable items.
A further objective for the UST was to ensure that library management recog- nized the “tacit contract” between the Library and its users. Once a survey is commissioned, ultimately it will require action by management. In any survey, the respondents need to perceive a return for their invested time. If actions do not occur as a result of a survey, or if actions do occur but no feedback is provided, the desire of users to participate in future sur-
358 The Journal of Academic Librarianship
veys will be seriously jeopardized. It is important to convey to users the changes made as a result of survey feedback and especially important to explain why some requested needs could not be met.
Timeline
The UST began meeting in August, 1995. In the early planning process it was determined that spring quarter 1996 would be the optimal time for going into the field. This was driven primarily by the calendar affecting the undergraduate population. Spring quarter would avoid conflict with final examinations and would provide freshmen with two quarters of familiarity with the Library. Since the Library wanted to conduct the surveys of all populations concurrently, this set the timeline for all survey efforts.
The consultant began working with the team in January, 1996. Knowing that a spring quarter implementation was required, a detailed timeline was devel- oped. This timeline, expressed as a Gantt chart, essentially counts back from the field release date to present time, detailing all the actions that need to be completed in order for that field release date to be real- ized. This timeline would drive the survey process through the field testing period and beyond to the data entry, analysis, and final roll out to library staff and the broader campus community.
Sample Design and Mode of Administration
A major objective for the UCSD Libraries Survey was that it included all primary clientele. Initially, the user popu- lations were defined as faculty and researchers, key administrative staff, grad- uate students, and School of Medicine (SOM) students, and both upper and lower division undergraduate students. After conducting focus groups with key admin- istrative staff, they were dropped from this study, primarily due to budget constraints.
To ensure external valid5 results with- out incurring the time and cost to inter- view all members of the target population researchers have developed protocols for drawing a sample of individuals that ade- quately represents the entire population and from which conclusions about the sample may be drawn with a known level of reliability.6 The simplest of these proto- cols is simple random sampling, a type of probability sampling,’ in which each sub- ject has an equal and known chance of inclusion, and the selection of one case does not influence the selection of another. To have a statistical basis for
making statements about the population based on the sample, one must use a ran- dom sample; one cannot extrapolate to the population using non-random (i.e., non-probability) samples (e.g., conve- nience or accidental sampling of patrons within the library). Variations on random sampling such as cluster sampling (applied in the undergraduate sample design) and stratified sampling (applied in the graduate and faculty sample designs) add flexibility and cost savings, and reduce standard errors. The selection of a particular sample design should attempt to maximize reliability and external validity, subject to cost and feasibility constraints.
Campus mail was the chosen mode of administration for both graduate students and faculty. Stratification8 by department for both the faculty and researcher group, and the graduate and SOM student group, was considered necessary because percep- tions towards the UCSD Libraries were thought likely to differ among different departments. Stratification would also per- mit the various UCSD Libraries to respond to the needs of the specific constituent group that each library served. While in principle stratification should allow one to make reliable statements about the charac- teristics of all individual departments, the relatively small size (and, thus, the number of completed survey questionnaires) in some departments precluded any meaning- ful statements about those departments. The graduate sample included 36 different departments, with departmental sample sizes ranging from 1 to 83 individuals with averages of approximately 16. The faculty sample included 69 different departments with departmental sample sizes ranging from 1 to 93 with an average of approxi- mately 7 individuals.
For undergraduates, in-class adminis- tration was the chosen method. While compliance from the teaching faculty was expected to be difficult to obtain, in prac- tice this was not the case. Only one faculty member refused permission for the survey to be conducted during class time. The in-class method was inexpensive and guaranteed a high response rate. A mailed survey was ruled out for this group because of the high mobility of the under- graduate population, and after discussions with administrators of undergraduate user studies who reported that undergraduates did not respond well to either mail or e-mail questionnaires. Low response rates likely result in self-selection and non-response biases and, consequently, a decrease in the external validity of the
results. Telephone and in-person method- ologies were rejected due to the high costs.
As stated, the UCSD undergraduate population was approximately 15,000. Since the Library wanted to gain informa- tion about non-users as well as users, it could not utilize its in-house database of library patrons. Therefore, the enrolled class (e.g., English 101, Psychology 169) was chosen as the primary sampling unit. With this design a single student may be sampled more than once, if he/she is enrolled in more than one sampled class. This was considered acceptable since the design element of the survey was “class” rather than the “individual student.” In order to stratify the large undergraduate sample, classes were divided into lower and upper division. The groups were fur- ther divided into five broad subject groups-Arts, Engineering, Humanities, Science and Mathematics, or Social Sci- ences. Crossing these two elements resulted in 10 strata. This stratification reduced the standard error9 and allowed conclusions to be drawn about the sub-populations, for example, lower divi- sion engineering students. The final 2000-element sample was selected from the 10 strata by drawing classes randomly with probabilities of selection propor- tional to class enrollment (see Appendix
B). The collected sample deviated in size
from the sample design in some cases. This was mainly due to the fact that classes in the available clusters were of widely varying sizes. In addition, some students were absent from class at the time of the study. The customary manner of dealing with such deviations is weighting lo the data so that they better approximate the intent of the sampling plan. The population weights were designed to adjust the stratum proportions in the sample to the stratum proportions in the undergraduate population. Further analysis revealed that the undergraduate sampling weights had an insignificant impact on the results; hence, the ultimate survey findings were based on the unweighted data.
Development of the Survey Questionnaires
In order to achieve a user centric focus, the UST drew on methodology used in market research. In an effort to avoid library staff biases in the survey question- naires, focus groups were used to shape the issues on the final survey question- naires. A focus group consists of 8-10 ran- domly selected persons with
September 1998 359
homogeneous backgrounds. They usually came together for two hours and were led through a series of relevant survey topics by a trained moderator. Focus groups have been used in library research to garner users’ opinions on services, but in this sce- nario the focus groups helped identify the issues that were important to the UCSD Libraries’ populations-both users and non-users. Vicki Young has prepared a concise outline for conducting library focus groups. ’ ’
tionnaire were written before the final ver- sions were ready for printing.
The Library conducted focus groups for each of the four natural populations identified as primary clientele. Tasks asso- ciated with the focus group design, recruitment, and execution were shared between the UST and the consultant. This allowed for a more efficient deployment of appropriate expertise. The UST was responsible for recruiting participants for the focus groups using a variety of meth- ods suited to the population being recruited. Nominal monetary incentives were used to help recruit participants and these differed according to the population group being studied.
In order to insure a clear, well-designed survey instrument, it is important to pre- test the developing questionnaires. One method used at UCSD was the one-on-one pretest or “think aloud” method. In this pretesting approach, randomly selected individuals from each of the population groups met with the consultant and worked through the draft questionnaire talking out loud their responses. This pro- cess revealed problems that the respon- dent had encountered while completing the survey. Particularly important here was the ability to discern issues which respondents had with the tone of a partic- ular question or the manner in which a question was phrased.
The focus group served not only to shape the issues that would be included in the survey, but also to provide guidance on how the survey could be administered most effectively. Suggestions were also elicited for appropriate incentives to be used with the mailed surveys to achieve high response rates. The incentive used was a raffle ticket to win a $250 gift certif- icate to the University Bookstore. Short written surveys were also conducted within focus groups. Their responses were discussed during the session to understand better how questions were being inter- preted. An important distinction to make between data collected from focus groups and that collected by a survey concerns reliability and external validity. Focus group responses should be seen as a snap- shot or an impression and not as a reliable sample. One cannot extrapolate to the entire population from such data since these respondents represent but a small fraction of the population as a whole.”
“In an effort to avoid library staff biases in the survey
questionnaires, focus groups were used to shape the issues
on the final survey questionnaires.”
For the undergraduate survey an impor- tant “pretest” was to evaluate the in-class mode of administration. Permission was obtained to pretest the questionnaire dur- ing the last week of winter quarter in a class that would not be in the final sam- pling plan. The completed surveys were collected, the data entered, and the results analyzed to determine that the questions were measuring the issues of interest and that the respondents were interpreting the questions as intended.
Final Survey Questionnaires
The development of the actual survey questionnaires (one for each population under study) was interactive. A variety of issues, such as the number of questions, the length of the questionnaire, the clarity of the instructions, the terminology used, and the usefulness of the data each ques- tion would generate, were constantly reviewed to insure that the survey objec- tives were being met. As a result of this tuning, many draft versions of the ques-
The resulting three questionnaires used by the UCSD Libraries to survey their users were the result of discussions with focus group participants, with the consult- ant and the members of the UST, and with Library management. While some may view the lack of involvement by the Library staff as questionable, the UST was a representative group of staff and the Library’s SDM principles were followed.
The faculty/researcher and graduate/ SOM questionnairesI were very similar and, thus, allowed for cross correlation of results. Within the faculty questionnaire was a unique section that evaluated how well the Library met faculty teaching needs with respect to their undergraduate students. Within the graduate/SOM ques-
tionnaire was a section evaluating the study areas in relation to both comfort and availability, in the Library they used most often.
In order to evaluate the Libraries’ mis- sion statement, an overall satisfaction question was included. Design of this question proved difficult. The Libraries’ mission statement used the terms “excel- lent” or “outstanding” but using such terms on a satisfaction scale was problem- atical. Ratings such as excellent or out- standing are too loaded for respondents to be comfortable using them. After much discussion, the scale selected for the over- all rating question was a l-5 point scale with 1 being “very satisfied,” 2 being “sat- isfied,” 3 being “somewhat satisfied,” 4 being “not too satisfied,” and 5 “not at all satisfied.”
The overall satisfaction question was augmented by questions that dealt specifi- cally with user satisfaction or dissatisfac- tion with facilities, staff, collections, and services. A second group of questions dealt with usage of the UCSD Libraries using a frequency-of-use scale. Within this category it was determined how often users went to the Libraries in person or used them remotely, which Libraries were used most often for research or for study- ing, and which collections and services were used most frequently.
Other areas studied were library instruction and service priorities. Various types of instructional programs were listed from which the respondents could indicate their interest. In order to develop future directions for the UCSD Libraries, respon- dents were asked to select their top three choices from a list of services and resources that the Library presently offers. They were then asked to select their top three choices for future programs, again from a list. Items on both lists were derived from focus group discussions as well as from UST input. Respondents could also write in items that were not on the list.
The survey also collected demographic data. For example, questions covered areas such as respondent’s field of study, which primary library was used, fre- quency of library use, respondent’s length of time at UCSD, information about respondent’s computer literacy, and, in the case of faculty, academic position. These data enabled action plans to be tailored to specific user populations. An open-ended question was also included in case the sur- vey questions had not captured all possible
360 The Journal of Academic Librarianship
areas upon which respondents wanted to comment.
The undergraduate questionnaire14 was far simpler in design. This was done for two reasons. First, by necessity, the ques- tionnaire had to be short because it had to be completed within 10 minutes of class time. It was determined in focus groups that undergraduates, particularly lower division, have limited experience with using the Libraries, however, they were eager to appear diligent and responsive and would often answer questions when they had little or no experience with the service or resource in question. In an effort to collect data that could be compared with the other two surveys, the undergrad- uate survey covered in less detail the same five areas*valuation of services, facili- ties, staff and collections; usage; library instruction; existing resources; and future resources.
One area of major interest in the undergraduate survey was the evaluation of the UCSD Libraries with respect to the study facilities and the staff. We were particularly interested in use by under- graduates of the libraries as a place to study as distinct from doing research. Another area of importance to the Library was the interest expressed by undergradu- ate students in library instruction. The questions on these topics followed the same format as used in the other two sur- veys previously described.
Data Collection and Response Rates
As has been mentioned above, in-class administration was used for the under- graduate survey. Seeking permission from faculty was critical to the success of this mode of administration. Once the list of classes to be included in the survey had been selected, the UST assigned one of its members to manage the faculty permis- sions. In only one instance was permission denied.
The basic “in and out in 10 minutes” process had been pre-tested and refined into a set of procedures that the UST implemented in 17 classes (Appendix B). Team members distributed the question- naires while a team member provided ver- bal instructions from a written script to insure uniformity of the process. Most questionnaires were completed within the allotted time. Only a carefully orches- trated action plan with many staff mem- bers on hand to distribute and collect surveys, especially in large classes, would have been successful with the “in and out in 10 minutes” methodology.
The response rate for the undergraduate survey was 77.5%, calculated as 2,861 completed surveys divided by the 3,689 eligible respondents. This should be con- sidered a lower bound on the actual response rate since the enrollment figures used in this calculation (week one of the quarter) are probably an overestimate of the actual enrollment at the time of the sur- vey administration (weeks 2-4). The num- ber of undergraduate-completed surveys yielded a confidence interval of 95 f 1.8%. Ramifications of class enrollees who were not surveyed for reasons of non-atten- dance, late arrival in class, or because their class was excluded from the sample is addressed in Appendix C.
The graduate and faculty question- naires were administered through the UCSD campus mail network. All surveys, with a cover letter from the University Librarian, were mailed during the first week of the 1996 Spring Quarter. The field period for these mailed surveys was 11 weeks. During this time and the three months previous, a moratorium was imposed in the Libraries on any type of user survey. This was instigated to focus attention on the major user survey. During the field period a brief question and answer sheet was distributed to all public service points to help staff answer any questions they might receive from respon- dents. To maximize response rates and reduce the later non-response conversion efforts, a raffle ticket was enclosed with the survey questionnaire. The ticket was to be returned with the completed survey midway through the 1 l-week field period
in order to qualify for a gift certificate for the UCSD Bookstore.
Much effort was put into non-response conversion. Exactly one week after the initial mailing, everyone was sent a post- card thanking him or her for responding and reminding everyone to complete and return the survey if he or she had not already done so. Two weeks later a second letter including a replacement question- naire was mailed. The third and final non-response conversion effort entailed phoning non-respondents and was imple- mented in two stages during the later part of the field period. In stage one, members of departments with response rates below the overall response rate were targets and, in stage two, members of the remaining departments were contacted.
The graduate student response rate was 7 1.06% yielding a confidence interval of 95 +4.8%. The response rate for faculty was 7 1.73%, yielding a confidence inter- val of 95 &5.1%.
KEY FINDINGS
Although it is not our intention to dis- cuss the data collected in detail, since they relate to a specific institution, it might be insightful to consider a few representative examples of both information collected and action plans. Understanding and act- ing on users’ comments and concerns were paramount since the UCSD Library seeks to be a user-centered organization.
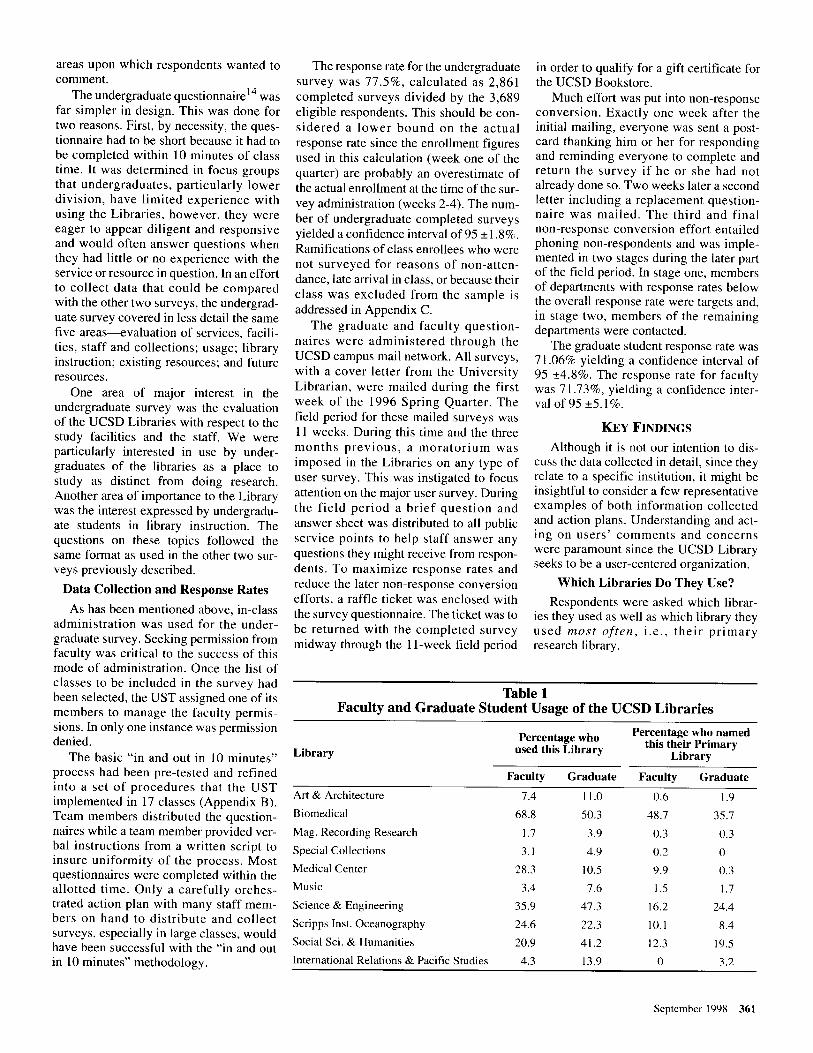
Which Libraries Do They Use?
Respondents were asked which librar- ies they used as well as which library they used most often, i.e., their primary research library.
Table 1 Faculty and Graduate Student Usage of the UCSD Libraries
Library
Percentage who used this Library
Percentage who named this their Primary
Library
Art & Architecture
Biomedical
Mag. Recording Research
Special Collections
Medical Center
Music
Faculty Graduate Faculty Graduate
7.4 11.0 0.6 1.9
68.8 50.3 48.7 35.7
1.7 3.9 0.3 0.3
3.1 4.9 0.2 0
28.3 10.5 9.9 0.3
3.4 7.6 1.5 1.7
Science & Engineering 35.9 47.3 16.2 24.4
Scripps Inst. Oceanography 24.6 22.3 10.1 8.4
Social Sci. & Humanities 20.9 41.2 12.3 19.5
International Relations & Pacific Studies 4.3 13.9 0 3.2
September 1998 361
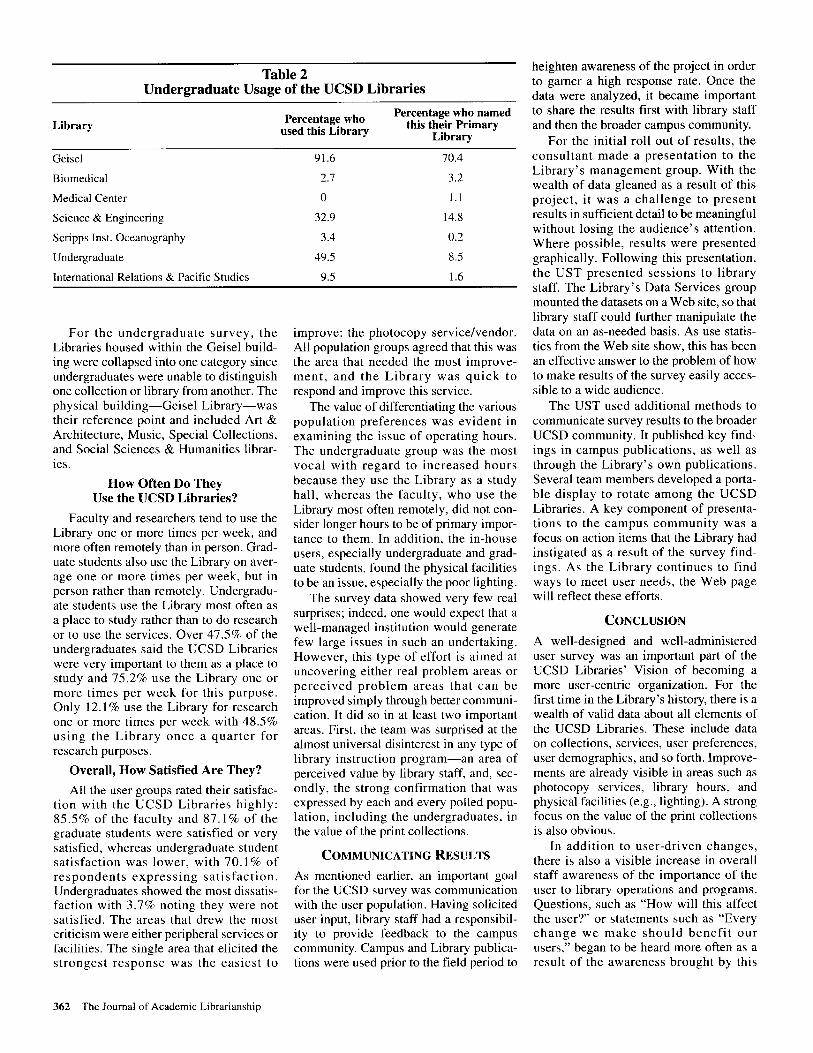
Table 2 Undergraduate Usage of the UCSD Libraries
Library Percentage who
used this Library
Percentage who named this their Primary
Library
Geisel 91.6 70.4
Biomedical 2.7 3.2
Medical Center 0 1.1
Science & Engineering 32.9 14.8
Scripps Inst. Oceanography 3.4 0.2
Undergraduate 49.5 8.5
International Relations & Pacific Studies 9.5 1.6
For the undergraduate survey, the Libraries housed within the Geisel build- ing were collapsed into one category since undergraduates were unable to distinguish one collection or library from another. The physical building-Geisel Library-was their reference point and included Art & Architecture, Music, Special Collections, and Social Sciences & Humanities librar- ies.
How Often Do They Use the UCSD Libraries?
Faculty and researchers tend to use the Library one or more times per week, and more often remotely than in person. Grad- uate students also use the Library on aver- age one or more times per week, but in person rather than remotely. Undergradu- ate students use the Library most often as a place to study rather than to do research or to use the services. Over 47.5% of the undergraduates said the UCSD Libraries were very important to them as a place to study and 75.2% use the Library one or more times per week for this purpose. Only 12.1% use the Library for research one or more times per week with 48.5% using the Library once a quarter for research purposes.
Overall, How Satisfied Are They?
All the user groups rated their satisfac- tion with the UCSD Libraries highly: 85.5% of the faculty and 87.1% of the graduate students were satisfied or very satisfied, whereas undergraduate student satisfaction was lower, with 70.1% of respondents expressing satisfaction. Undergraduates showed the most dissatis- faction with 3.7% noting they were not satisfied. The areas that drew the most criticism were either peripheral services or facilities. The single area that elicited the strongest response was the easiest to
362 The Journal of Academic Librarianship
improve: the photocopy service/vendor. All population groups agreed that this was the area that needed the most improve- ment, and the Library was quick to respond and improve this service.
The value of differentiating the various population preferences was evident in examining the issue of operating hours. The undergraduate group was the most vocal with regard to increased hours because they use the Library as a study hall, whereas the faculty, who use the Library most often remotely, did not con- sider longer hours to be of primary impor- tance to them. In addition, the in-house users, especially undergraduate and grad- uate students, found the physical facilities to be an issue, especially the poor lighting.
The survey data showed very few real surprises; indeed, one would expect that a well-managed institution would generate few large issues in such an undertaking. However, this type of effort is aimed at uncovering either real problem areas or perceived problem areas that can be improved simply through better communi- cation. It did so in at least two important areas. First, the team was surprised at the almost universal disinterest in any type of library instruction program-an area of perceived value by library staff, and, sec- ondly, the strong confirmation that was expressed by each and every polled popu- lation, including the undergraduates, in the value of the print collections.
COMMUNICATING RESULTS
As mentioned earlier, an important goal for the UCSD survey was communication with the user population. Having solicited user input, library staff had a responsibil- ity to provide feedback to the campus community. Campus and Library publica- tions were used prior to the field period to
heighten awareness of the project in order to gamer a high response rate. Once the data were analyzed, it became important to share the results first with library staff and then the broader campus community.
For the initial roll out of results, the consultant made a presentation to the Library’s management group. With the wealth of data gleaned as a result of this project, it was a challenge to present results in sufficient detail to be meaningful without losing the audience’s attention. Where possible, results were presented graphically. Following this presentation, the UST presented sessions to library staff. The Library’s Data Services group mounted the datasets on a Web site, so that library staff could further manipulate the data on an as-needed basis. As use statis- tics from the Web site show, this has been an effective answer to the problem of how to make results of the survey easily acces- sible to a wide audience.
The UST used additional methods to communicate survey results to the broader UCSD community. It published key find- ings in campus publications, as well as through the Library’s own publications. Several team members developed a porta- ble display to rotate among the UCSD Libraries. A key component of presenta- tions to the campus community was a focus on action items that the Library had instigated as a result of the survey find- ings. As the Library continues to find ways to meet user needs, the Web page will reflect these efforts.
CONCLUSION
A well-designed and well-administered user survey was an important part of the UCSD Libraries’ Vision of becoming a more user-centric organization. For the first time in the Library’s history, there is a wealth of valid data about all elements of the UCSD Libraries. These include data on collections, services, user preferences, user demographics, and so forth. Improve- ments are already visible in areas such as photocopy services, library hours, and physical facilities (e.g., lighting). A strong focus on the value of the print collections is also obvious.
In addition to user-driven changes, there is also a visible increase in overall staff awareness of the importance of the user to library operations and programs. Questions, such as “How will this affect the user?” or statements such as “Every change we make should benefit our users, ” began to be heard more often as a result of the awareness brought by this
survey effort. This interesting benefit, gained from the process itself, was not predicted at the beginning of the project. Another unanticipated benefit was that members of the UST became experts at survey administration, and the team leader has taught classes in survey design and implementation as a result of the experi- ence gained. There is also a better under- standing for library staff of the trade-off between meeting user needs and balancing scarce resources. In this transitional period to more electronic content, there is a clearer picture of how this electronic arena is affecting in-person use of the UCSD Libraries.
The survey produced a wealth of find- ings, far more than could be dealt with in the short term. Each individual library is responsible for analyzing and evaluating feedback from the survey and recom- mending changes where appropriate. The Public Services Advisory Committee is also evaluating survey feedback for areas where cross-departmental changes may be required.
Originally, the Library thought that it would survey its user communities annu- ally. After completing this first compre- hensive survey, the Library has revised the timetable and will most likely survey users again after three years. An annual time frame was deemed too short, since there would be insufficient time to effect real, measurable change. Since this is a new and growing process, the Library will be in a better position to determine the time interval between surveys after the second survey.
What will the Library do differently next time it administers the user survey? Although there was satisfaction with the general methodology used, with the ques- tionnaire design, and with the types of data collected, the area of logistics needs some significant improvement. For example, extending the time line from 9 to 12 months to include peripheral but neces- sary tasks, such as publication deadlines, would be useful. More effort needs to be put into working with appropriate campus departments to produce better sampling frames. Also, there should be a better divi- sion of labor for time-consuming tasks, such as obtaining faculty compliance for the in-class administration.
Could the Library have gathered this information through less expensive mech- anisms, given that the out-of-pocket costs of survey administration exceeded $44,000? A survey of this scope was the only means of receiving a comprehensive,
campus-wide view of how well the UCSD Libraries as a system were meeting user needs. The Library will certainly continue to rely on ongoing communication with it users to learn where the Library needs to make improvements, but through a com- prehensive survey process the Library now has a much better understanding of needs, and the intensity of need, from a scientifically valid perspective.
So what about that mission statement goal of 90% of the users ranking the Library as “outstanding” or “excellent?’ As noted earlier, 85.5% of the faculty pro- vided an overall ranking of “satisfied” or better; and 2.8% were dissatisfied. Gradu- ates and School of Medicine students pro- vided an overall ranking of 87.1% for “satisfied” or better, with 1.7% being dis- satisfied. Undergraduates were not as sat- isfied: 70.1% provided rankings of “satisfied’ or better, with 3.7% being dis- satisfied. So, although we have much to be satisfied with, the UCSD Libraries can continue to work towards its mission as a user-centric organization.
“The survey data showed very few real surprises; indeed, one
would expect that a well-managed institution
would generate few large issues in such an undertaking. ”
APPENDIX A
UCSD LIBRARIES
VISION STATEMENT
During the UCSD Libraries’ strategic planning process a four-part Visions State- ment was developed. It contained the orga- nization’s “Values and Beliefs,” “Purpose,” “Mission Statement,” and “Vivid Description.” The measurable and quantifiable mission statement would more typically be termed an institutional goal. The complete UCSD Libraries Vision Statement can be found at: http:// orpheus.ucsd.edu/libnet/mission.html.
Values and Beliefs
We are a user-centered organization- services and patron satisfaction are key.
Our library is not confined--our users seek information from places located throughout the world.
We value access to information with- out censorship as fundamental to higher education and research.
We value convenient access to infor- mation. Our systems, policies, and programs should allow users to find the information they need without staff assistance, and should allow staff to provide assistance for those who need it.
We value an appropriately selected, managed, and preserved collection.
We respect all individuals; their diverse backgrounds, skills, and needs; and their right to privacy.
We value the expertise of our library staff.
Each of us, as library staff, plays an important role and contributes to the success of the organization.
We value training and staff develop- ment.
Open and honest communication within our organization raises morale and promotes efficient teamwork.
Up-to-date technology provides one of the means to reach our goals.
Progress comes with discovery and with experimentation.
Mission
By 1998, when surveyed, 90% of the UCSD Libraries’ primary users-faculty, staff and students-will rate the UCSD Libraries collections, services, programs, staff and facilities as either “outstanding” or “excellent.”
APPENDIX B
THE UNDERGRADUATE SAMPLE DESIGN
The list of eligible classes used for the undergraduate sample was the 1996 Spring quarter enrollment file from the Registrar’s Office. The classes were divided into lower-division undergraduate classes with course numbers l-99 and upper-level undergraduate classes with course numbers 1 OO- 199. The undergrad- uate classes were also assigned to one of five groups-Arts, Engineering, Humani- ties, Science and Mathematics, and Social Sciences.
For each stratum, classes were drawn randomly with probabilities of selection proportional to class enrollment until the class list for that stratum was exhausted. Each consecutive class was incorporated into the sample in the sequence of drawing until the threshold for drawing sufficient
September 1998 363
sample in the respective stratum was satis- fied. For each stratum, that threshold was based on the number of class enrollees representing that stratum’s proportion of class enrollees out of the entire population of class enrollees (e.g., the proportion of the population in the lower-division Sci- ence and Math stratum was approximately l/5, hence, this stratum contained l/5 of the total sample).
APPENDIX C
UNDERGRADUATE DATA COLLECTION AND RESPONSE RATES
The sample included class enrollees from 22 classes with a total enrollment of approximately 4,910 in three distinct groups of individuals: (1) the 2,861 respondents, (2) class enrollees in sample classes to which access was not granted by the class instructors or which were excluded for administrative convenience and (3) class enrollees in sample classes who were not present during the period in which the surveys were administered, who arrived late, or who, though in attendance, did not complete the survey.
Individuals in the second group are unlikely to be different from the respon- dents unless the failure to collect those classes related in some way to the likely responses of the enrollees in that class. The sampling plan assumed that the five classes in group two were outside the sam- ple design. Individuals in the third group were unlikely to have known that the sur- vey was to be administered during their class. Thus, the probability of intentional self-selection seems minimal. However, their non-attendance could be related in less direct ways to the answers they would have given, that is, non-attendees may have different attitudes toward the library. The administration of the survey early in the quarter was intended to reduce such losses through non-attendance. Non-respondents who did not take, or did not complete, the survey because they were late for class, are subject to this same analysis. More problematic are persons who did not complete the survey despite
being in attendance since the reasons could be related in some way to the issues being studied in the survey.
Acknowledgment: Efforts of the User Survey Team, a self-directed, library-wide team established as part of new library management initiatives, is hereby acknowledged. The Team was composed of six library staff members who contrib- uted equally to the success of the UCSD User Survey project. They were: Renata Coates, Martina Cotton, Tami Echavarria, Diane Eells, Beverly Greene, and Lydia Ybarra, in addition to Dawn E. Talbot. The authors are grateful to Robert Molyneaux, Assistant Professor, College of Library and Information Science, Uni- versity of South Carolina, for his review of the manuscript.
NOTES AND REFERENCES
1, The survey, due to its comprehensive nature, has resulted in a copious amount of information. Detailed findings are available at the UCSD Libraries survey Web site: http:// orpheus.ucsd.edu/survey/. 2. James C. Collins & Jerry I. Porras, “Organizational Vision and Visionary Organizations,” California Management Review 34 (1991): 30-52. 3. Kenneth W. Berger & Richard W. Hines, “What Does the User Really Want? The Library User Survey Project at Duke University,” Journal of Academic Librarianship 20 (1994): 306-308. 4. Doris J. Schlicter & Michael Pemberton, “The Emperor’s New Clothes? Problems of the User Survey as a Planning Tool in Academic Libraries,” College & Research Libraries 53 ( 1992): 257-265. 5. External Validity refers to how much the sample estimation differs from the true value of the population parameter being estimated, with repeated iterations of the sampling plan. Validity can be evaluated by looking at the bias of the estimate. Bias is defined as the difference between the population parameter and the sample estimate of that parameter. The only way to avoid bias entirely is to survey the entire population. 6. Reliability refers to how reproducible the sample estimate is over repetitions of the sampling process. The reliability of a sample estimate can be stated in terms of its sampling
variance or standard error. Whenever a random sample is drawn, sampling variability is introduced; the only way to avoid it is to survey the entire population. 7. Probability samples, otherwise known as random samples, are those in which every element has a known, non zero chance of selection and the elements are selected through a random procedure. While elements do not need to have an equal chance of selection, every element must have some chance of being selected and that chance must be known. By fulfilling these two conditions and using the correct statistical formula, values for the entire population can be estimated together with the margin of error for that estimation. 8. Stratified sampling is a sampling method in which a sample is drawn from a population that has been divided into groups or strata of individuals who are intended to be relatively homogeneous on some characteristics related to the study variables to be measured or estimated. 9. Standard error is the most commonly reported measure of a survey’s precision. It is the standard deviation divided by the square root of the sample size. 10. Weighting is a procedure to correct for unequal probabilities of selection of sample members, unequal survey completion rates by demographic subgroup, or other factors related to producing unbiased estimates. See Ronald Czaja & Johnny Blair, Designing Surveys: A Guide to Decisions and Procedures (Thousand Oaks, CA: Pine Forge Press, 1996). I 1. Vicki Young, “Focus on Focus Groups,” College & Research Libraries News 54 (1993): 39 l-394. 12. Richard Widdows, Tia A. Hensler, & Marlaya H. Wyncott, “The Focus Group Interview: A Method for Assessing Users’ Evaluation of Library Service,” College & Research Libraries 52 (1991): 352-359. 13. The faculty/researcher and graduate/ SOM questionnaires used in this study are available on the UCSD Libraries Survey Web site: faculty/researcher questionnaire at: http:llssdc.ucsd.eduIlib_surv/codebooks/ faculty.html; graduate/SOM questionnaire at: http:llssdc.ucsd.eduIlib_surv/codebooks/ graduate.html. 14. The undergraduate questionnaire used in this study is available on the UCSD Libraries Web site: http://ssdc.ucsd.edu/lib_surv/ codebooks.ugrad.html.
364 The Journal of Academic Librarianship