Embed Size (px)
Citation preview
1
Proyecto Fin de Máster
INGENIERÍA INDUSTRIAL
From organizational drivers to employees’ participation:
the key role of systems and social influence
Fernando Ruiz Pérez
San Sebastián, diciembre de 2018

3
Índice general
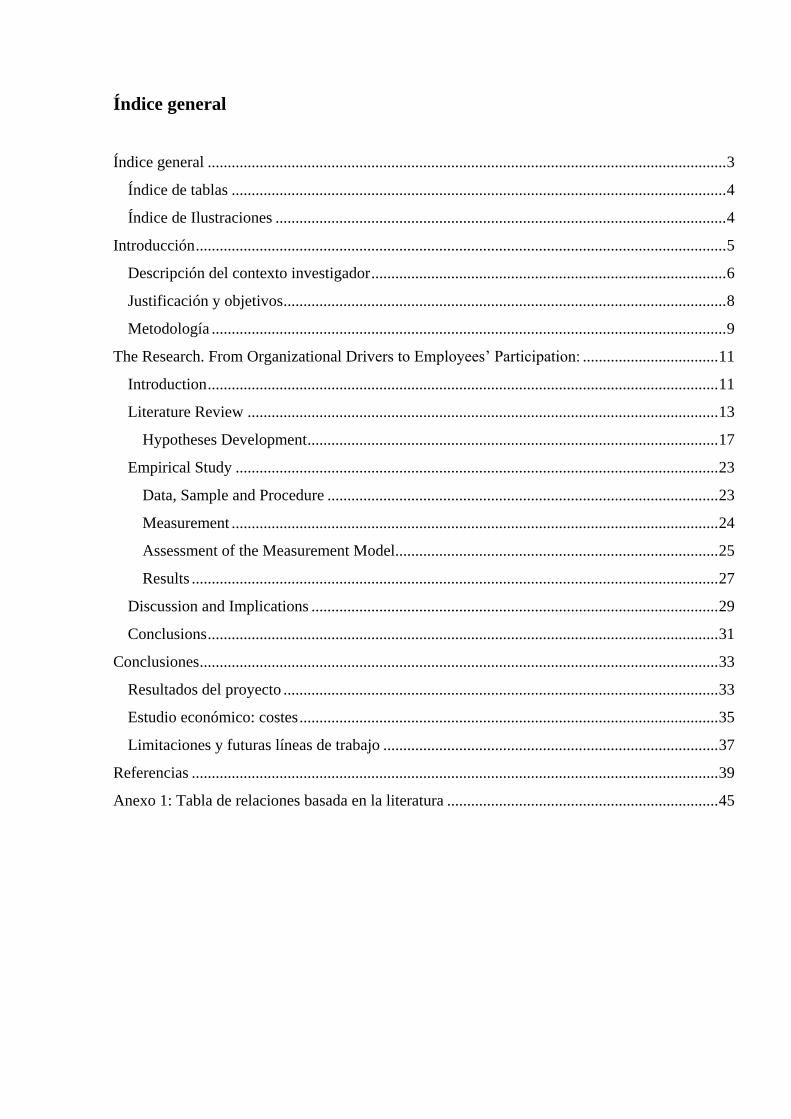
Índice general .................................................................................................................................. 3
Índice de tablas ............................................................................................................................ 4
Índice de Ilustraciones ................................................................................................................. 4
Introducción ..................................................................................................................................... 5
Descripción del contexto investigador ......................................................................................... 6
Justificación y objetivos ............................................................................................................... 8
Metodología ................................................................................................................................. 9
The Research. From Organizational Drivers to Employees’ Participation: .................................. 11
Introduction ................................................................................................................................ 11
Literature Review ...................................................................................................................... 13
Hypotheses Development ....................................................................................................... 17
Empirical Study ......................................................................................................................... 23
Data, Sample and Procedure .................................................................................................. 23
Measurement .......................................................................................................................... 24
Assessment of the Measurement Model................................................................................. 25
Results .................................................................................................................................... 27
Discussion and Implications ...................................................................................................... 29
Conclusions ................................................................................................................................ 31
Conclusiones .................................................................................................................................. 33
Resultados del proyecto ............................................................................................................. 33
Estudio económico: costes ......................................................................................................... 35
Limitaciones y futuras líneas de trabajo .................................................................................... 37
Referencias .................................................................................................................................... 39
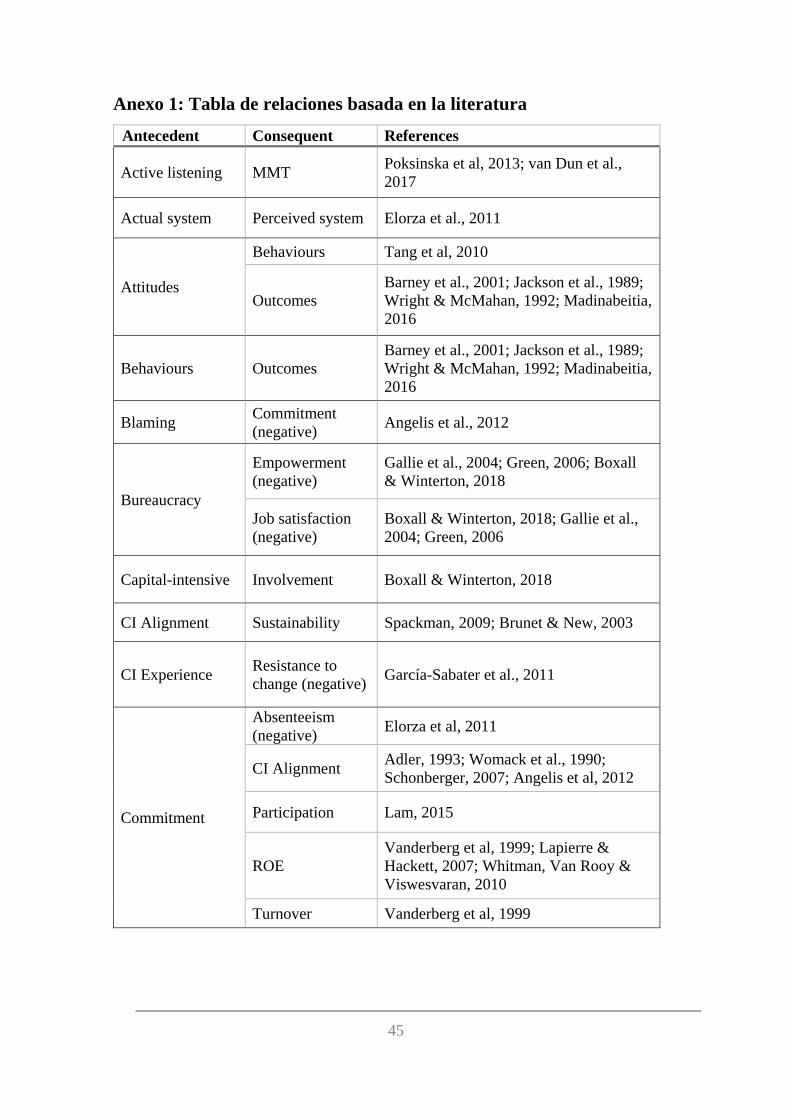
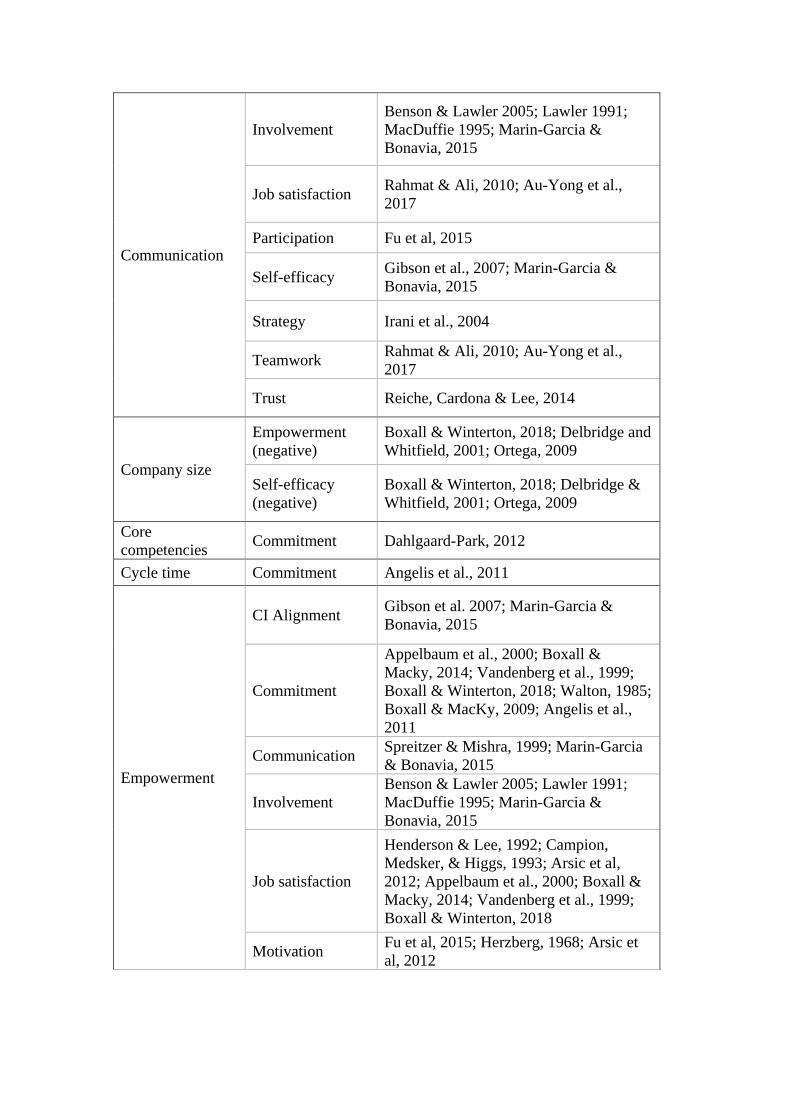
Anexo 1: Tabla de relaciones basada en la literatura .................................................................... 45
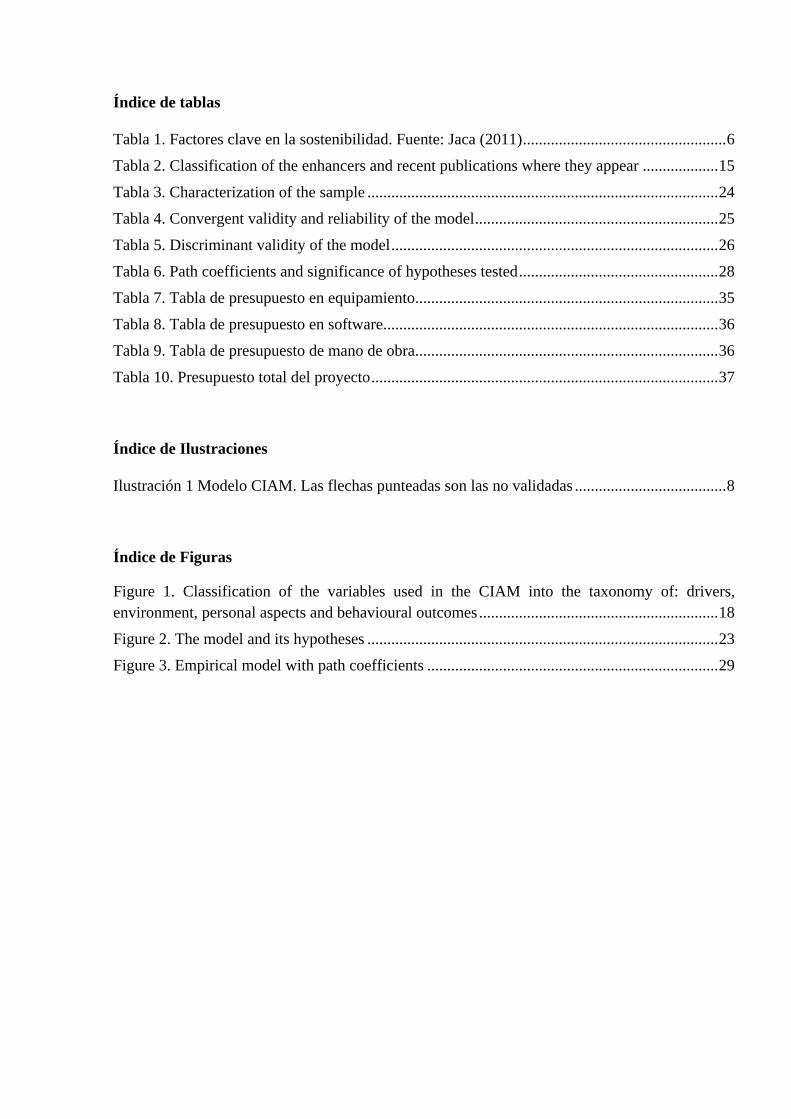
Índice de tablas
Tabla 1. Factores clave en la sostenibilidad. Fuente: Jaca (2011) ................................................... 6
Tabla 2. Classification of the enhancers and recent publications where they appear ................... 15
Tabla 3. Characterization of the sample ........................................................................................ 24
Tabla 4. Convergent validity and reliability of the model ............................................................. 25
Tabla 5. Discriminant validity of the model .................................................................................. 26
Tabla 6. Path coefficients and significance of hypotheses tested .................................................. 28
Tabla 7. Tabla de presupuesto en equipamiento............................................................................ 35
Tabla 8. Tabla de presupuesto en software.................................................................................... 36
Tabla 9. Tabla de presupuesto de mano de obra ............................................................................ 36
Tabla 10. Presupuesto total del proyecto ....................................................................................... 37
Índice de Ilustraciones
Ilustración 1 Modelo CIAM. Las flechas punteadas son las no validadas ...................................... 8
Índice de Figuras
Figure 1. Classification of the variables used in the CIAM into the taxonomy of: drivers,
environment, personal aspects and behavioural outcomes ............................................................ 18
Figure 2. The model and its hypotheses ........................................................................................ 23
Figure 3. Empirical model with path coefficients ......................................................................... 29
5
Introducción
Este proyecto, realizado por el alumno de TECNUN-Escuela de Ingenieros de la
Universidad de Navarra (de aquí en adelante, Tecnun) Fernando Ruiz Pérez, tiene como
objetivo culminar el Máster Universitario en Ingeniería Industrial; siendo presentado a tal
efecto para optar a la asignatura Trabajo Fin de Máster, considerando el estudiante
satisfechas las competencias demandadas por la asignatura.
El trabajo realizado ha sido de investigación científica en el área de la Dirección
de Personas como una ampliación de lo estudiado en el mentado Máster en la asignatura
homónima al área. El proyecto, por tanto, se ha realizado en el Departamento de
Organización Industrial de Tecnun bajo la supervisión del profesor Álvaro Lleó de Nalda,
comenzando en junio del año 2018 y terminándolo en diciembre de ese mismo año.
Al estar enmarcado en el contexto de la investigación, se consideró como objetivo
primordial la culminación del trabajo en una publicación científica que fuera aceptada por
una revista indexada. Es por esto por lo que la parte central del trabajo consiste en dicha
publicación escrita en el idioma inglés, donde se encuentran explicados los aspectos
fundamentales de todo trabajo: estado de la cuestión, metodología, resultados y
conclusiones. El resto de la memoria consiste en una contextualización del trabajo
realizado dentro del trabajo previo investigador en el departamento y de los objetivos del
Proyecto Fin de Máster (primera sección, la presente) y en las conclusiones acerca del
proyecto en sí, así como posibles líneas de trabajo futuras (tercera sección, tras el artículo
enviado a la revista indexada).
Descripción del contexto investigador
Como se ha explicado anteriormente, este proyecto se realizó en el Departamento de
Organización Industrial, siendo su línea de investigación la mejora sostenible. Dicha línea
procura proveer a las empresas de modelos y herramientas para obtener un desarrollo
sostenible a escala global, siendo sus ámbitos: la economía circular, la mejora y
sostenibilidad de los sistemas productivos y la dirección de personas.
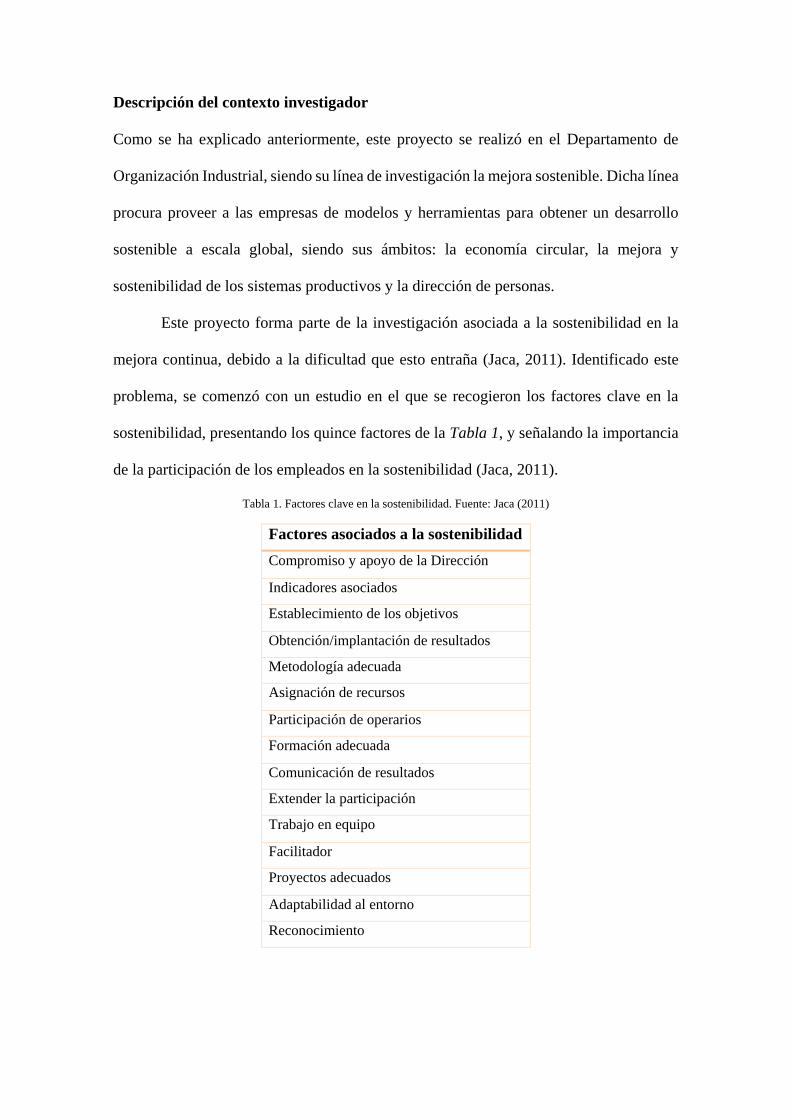
Este proyecto forma parte de la investigación asociada a la sostenibilidad en la
mejora continua, debido a la dificultad que esto entraña (Jaca, 2011). Identificado este
problema, se comenzó con un estudio en el que se recogieron los factores clave en la
sostenibilidad, presentando los quince factores de la Tabla 1, y señalando la importancia
de la participación de los empleados en la sostenibilidad (Jaca, 2011).
Tabla 1. Factores clave en la sostenibilidad. Fuente: Jaca (2011)
Factores asociados a la sostenibilidad
Compromiso y apoyo de la Dirección
Indicadores asociados
Establecimiento de los objetivos
Obtención/implantación de resultados
Metodología adecuada
Asignación de recursos
Participación de operarios
Formación adecuada
Comunicación de resultados
Extender la participación
Trabajo en equipo
Facilitador
Proyectos adecuados
Adaptabilidad al entorno
Reconocimiento
7
Vista la importancia de la participación en la sostenibilidad, dicha línea de investigación
continuó sus pesquisas en la elaboración de una herramienta para fomentarla a través de
las 5Ss (Paipa Galeano, 2013) y en la elaboración de un modelo relacional con el
propósito de comprender el impacto de distintos factores en la participación (Jurburg
Melnik, 2016).
Este último trabajo de Daniel Jurburg, tiene una especial importancia debido a
diversas causas. La primera de ellas es que, considerando la participación un
comportamiento a conseguir (Tang, Chen, & Wu, 2010), introduce el modelo TAM de
comportamiento a través del cual se trata de explicar por qué un empleado decide
participar. La segunda es la validación empírica del modelo relacional con encuestas a
trabajadores, con lo que las relaciones establecidas de manera teórica entre las variables
quedan justificadas. Esto conlleva que el modelo sea útil a las empresas a la hora de
plantear los esfuerzos para obtener la participación. Para la construcción de este modelo
se identificaron en la literatura los factores que afectan a la participación, conduciendo
luego un estudio Delphi en el cual un panel de 21 expertos en sostenibilidad en mejora
continua estableció en rondas de preguntas sucesivas las relaciones que se dan entre los
factores. Se desarrolló un cuestionario para la evaluación de las distintas variables y se
obtuvo una muestra de 308 empleados de una única empresa para la validación por el
método de mínimos cuadrados en ecuaciones estructurales (PLS-SEM).
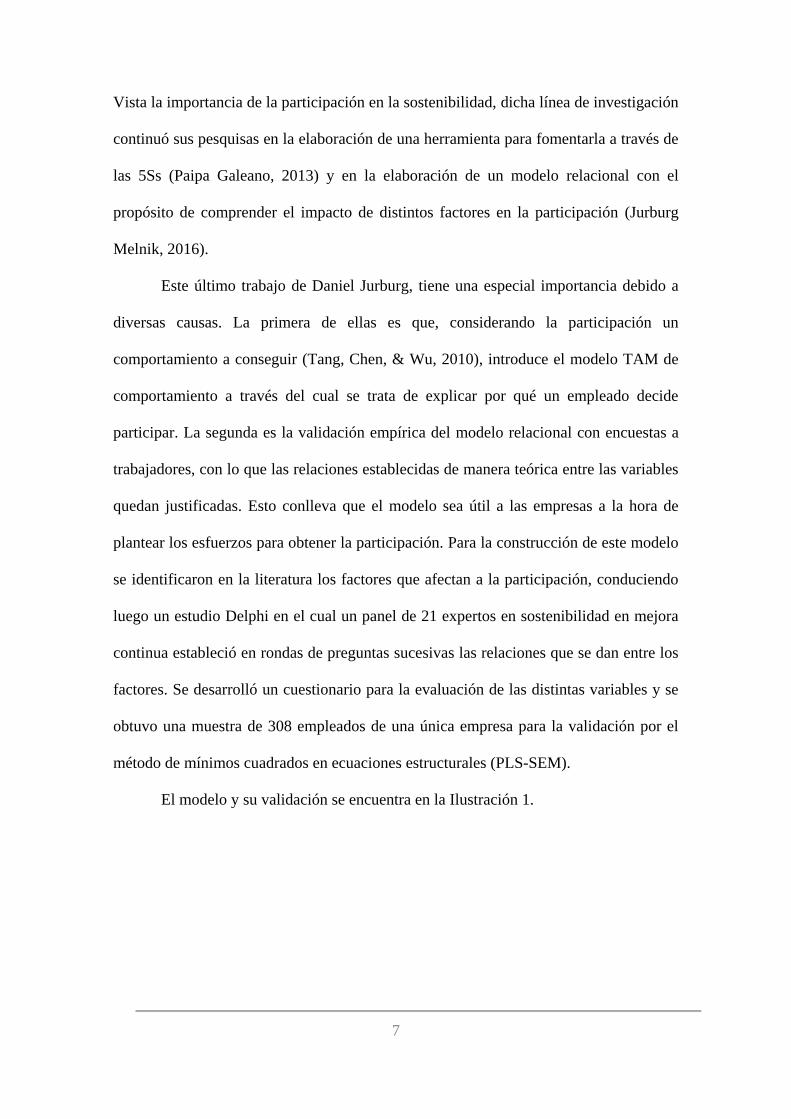
El modelo y su validación se encuentra en la Ilustración 1.
Ilustración 1 Modelo CIAM. Las flechas punteadas son las no validadas
Justificación y objetivos
Sin embargo, este modele modelo adolece de dos aspectos que parecen importantes para
la dirección de personas. Ambas áreas de mejora se encuentran dentro de una de las
aportaciones del modelo CIAM, que es la inclusión de una visión más completa, más
global, del proceso de la elección de un empleado de participar o no. Esta visión global
es conocida en la literatura como holística.
El primer aspecto por mejorar es una cierta confusión a la hora de la presentación
del modelo, ya que no queda claro cómo es la secuencia de relaciones entre las variables.
La única distinción que existe es la que hay entre el modelo “interno” -referido a algunos
aspectos personales- y el “externo” -referido sobre todo a prácticas organizativas.
Asimismo, los facilitadores de la mejora continua indicados tampoco se encuentran
clasificados entre las distintas dimensiones empresariales, dificultando la mentada visión
holística.
La segunda mejora tiene que ver con la aplicación del modelo. Al no haber la
distinción del primer punto, en el CIAM es más complicado saber qué puede ser cambiado
9
por la organización y qué puede ser solamente influido. Si bien la añadidura del modelo
de comportamiento ya consiste en un avance respecto a la literatura anterior, parece que
los impactos de los facilitadores de la mejora continua entre sí no son despreciables a la
hora de generar el correcto entorno que explique el paso de lo organizativo a lo personal.
Este es el motivo último de este proyecto. Añadir una profundización entre cómo
las variables organizativas, que pueden ser cambiadas por la dirección, consiguen generar
la adecuada predisposición del empleado para que participe libremente en las actividades
de mejora continua.
Debido a esto, se presentan como objetivos del trabajo los siguientes tres puntos:
a) Elaboración de un modelo relacional basado en el CIAM que presente las
variables en sus distintas dimensiones de tal manera que se comprenda mejor el
paso de lo organizativo a lo personal.
b) Validación de dicho modelo relacional con las mismas encuestas que se utilizaron
para validar el CIAM.
c) Publicación de esta investigación en una revista indexada.
Metodología
Para cumplir con los objetivos, en este proyecto se han desarrollado cinco pasos:
a) Revisión de la literatura con el objetivo de encontrar las relaciones entre los
facilitadores de la mejora continua y de encontrar otros modelos que incluyan este
paso de lo organizativo a lo personal.
b) Elaboración de un modelo teórico exclusivamente basado en las relaciones
incluidas en la literatura.1
c) Limitación de dicho modelo teórico a las variables presentes en el CIAM2.
d) Aprendizaje de SMART-PLS 3.0 con el ánimo de la validación del modelo y uso
de dicho programa con ese objetivo
e) Redacción y revisiones de la publicación científica
Así, los puntos a, b y c de la metodología cumplen con el objetivo a), el punto d cumple
con el objetivo b) y el punto e de la metodología cumple con el objetivo c).
En la siguiente sección, el cuerpo principal de la memoria, se expone la
publicación científica enviada a la revista Total Quality Management & Business
Excellence, de la editorial Taylor & Francis.
1 Debido a la limitación de espacio impuesta por la revista, ni el modelo teórico ni las relaciones
encontradas en la literatura han podido presentarse en este trabajo, pero en el Anexo 1 puede encontrarse
una tabla de relaciones con sus referencias, obtenida tras dicha revisión
2 Durante la revisión de la literatura se concluyó que el modelo de comportamiento utilizado por Jurburg,
el TAM, no era el más indicado para el comportamiento estudiado por causas que se explican en el cuerpo
de esta memoria. En vez de ello, se seleccionó la Teoría del Comportamiento Planificado, de Ajzen (1991),
por causas también explicadas en el cuerpo de la memoria.
11
The Research. From Organizational Drivers to Employees’
Participation: the Key Role of Systems and Social Influence
Employee participation in continuous improvement activities has been pointed as
a key behaviour for the sustainability of CI programmes. Previous research has
identified different variables that enhance this requested participation, but a holistic
approach is needed to explain the impact that organizational enhancers have on the
personal ones. This article contributes to this holistic approach by introducing a
model which represents how the organizational drivers foster an appropriate
environment that strengthens employees´ participation. Three companies from
Northern Spain were studied, and surveys were processed using Partial Least
Squares. Results shed light on the inner relationships between drivers themselves
and how they influence the organizational environment. Based on the Theory of
Planned Behaviour, it can be explained how these organizational level variables
strengthen personal perceptions fostering employees´ participation can be
explained. This model would allow organizations to understand how to use their
efforts to enhance employees’ participation.
Keywords: continuous improvement, participation, Theory of Planned Behaviour,
PLS, social influence, PIRK
Introduction
Continuous Improvement (CI) systems have been used to face current business
challenges, assuring efficiency, flexibility and quality to survive (García-Arca & Prado-
Prado, 2011; Singh & Singh, 2015). Nevertheless, not all CI implementations finish in
success after 2-3 years (Gonzalez Aleu & Van Aken, 2016), and previous research has
pointed sustainability of CI systems as crucial (Galeazzo, Furlan, & Vinelli, 2017; Rapp
& Eklund, 2007). One key aspect for sustainability is the overall participation in CI
activities (Jurburg, Viles, Tanco, & Mateo, 2017). Because of that, CI systems have been
posed as people-centred (Yan & Makinde, 2011), from which the importance of
deepening into employees’ participation can be derived.
Different authors have identified the main organizational and personal
antecedents of employees´ participation (García-Sabater, Marín-García, & Perello-Marin,
2011; Jaca, Viles, Mateo, & Santos, 2012) and, also, it can be found some models with
the relation between antecedents and participation (García, Maldonado, Alvarado, &
Rivera, 2014; Jurburg, Viles, Mateo, Tanco, & Lleo, in press). However, there is no a
holistic model that explains the complete process from organizational enablers to personal
participation.
Thus, the aim of this paper is to present a holistic model that explains this
complete process. For doing so we are going to use the distinction proposed by Kaye and
Anderson (1999) that differentiate the antecedents between drivers, enablers and
outcomes with the literature of high involvement work practices (HIWP) for
understanding how the drivers are related between them. Moreover, the Theory of
Planned Behaviour (Ajzen, 1991) shed light on the explanation of how the organizational
level variables impact the personal outcomes and the final employee´ participation
The holistic model presented in this paper has been empirically validated with
Partial Least Squares, using a sample of 483 workers from three different companies from
Northern Spain. The results of this study show that the proposed logic is consistent and
provide future investigations in the relationships of drivers, environment and personal
outcomes.
The structure of the article after this introduction is as follows. In the next section,
previous studies are considered, and hypotheses are developed. Later, the methods
followed to achieve the validation of the model are presented, followed by a discussion
of these results. Finally, conclusions and future lines are detailed.
13
Literature Review
Continuous improvement has been used by companies from all over the world because of
the proved benefits that the implementation of CI programs carry to those companies
(Jaca et al., 2012). Nevertheless, some companies fail after two or three years in their
intention of applying CI (Gonzalez Aleu & Van Aken, 2016), and literature indicates
sustainability of Continuous Improvement as one of the most important barriers that have
to be overcome (Jurburg et al., 2017). This obstacle has boosted the number of studies
about sustainability; and authors agree about the key role that employee participation
plays in the long-term settling of continuous improvement in the company (Fu, Chou,
Chen, & Wang, 2015; Lam, O’Donnell, & Robertson, 2015; Marin-Garcia & Bonavia,
2015).
One field of research within employee participation includes the detection of key
managerial practices and individual predispositions that enhance this behaviour (Au-
Yong, Ali, Ahmad, & Chua, 2017; Tang et al., 2010). Those factors cited by literature
will be referred hereafter as enhancers of participation.
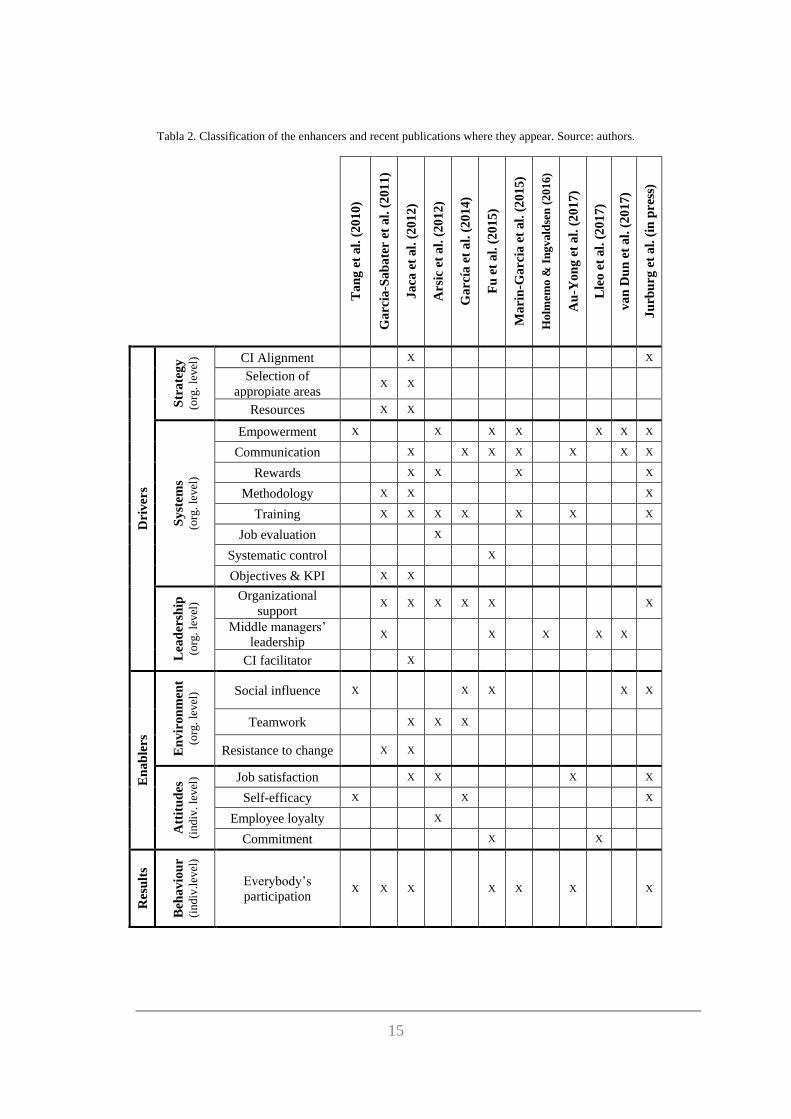
After analysing the last decade literature regarding the enhancers of CI, Figure 1
presents a table with the elements identified by each author.
However, and due to the complex nature of CI, a holistic view approaches better
the overall process, distinguishing between drivers, enablers and results. Kaye and
Anderson (1999) stated drivers as the organizational practices driven by the organization
in order to assure the appropriate context that enhances employees´ participation in
continuous improvement activities. The enablers refer to the variables that facilitate or
not the effects of the drivers on individual outcomes. The driver-enabler distinction would
shed light on the decision-making process, as the drivers are management’s responsibility
that impact on the enablers, which cannot be directly changed by managerial decisions.
Also, in order to better understand the organization-personal fit, it would help to
separate the enhancers into organizational and individual (Tesluk & Vance, 1999). These
individual enhancers would be impacted by the organizational ones through the
perceptions of them (Elorza, Harris, Aritzeta, & Balluerka, 2016). Therefore, Table 2,
referred above, presents also the enhancers with the driver-enabler and organizational-
individual divisions.
Table 2 shows that some models are more focused on the individual level of
participation in continuous improvement (Tang et al., 2010), or identifying the drivers
that enhance some individual attitudes (Arsić, Nikolić, Živković, Urošević, & Mihajlović,
2012) than presenting an holistic view that encompass all the dimensions. Moreover,
some studies are specific research in some dimension, as Holmemo and Ingvaldsen
(2016) studied the effect of middle managers and Fu et al. (2015) assessed the TQM
organizational culture generation.
15
Tabla 2. Classification of the enhancers and recent publications where they appear. Source: authors.
Ta
ng
et
al.
(20
10
)
Ga
rcia
-Sa
ba
ter
et a
l. (
201
1)
Ja
ca e
t a
l. (
201
2)
Ars
ic e
t a
l. (
20
12
)
Ga
rcía
et
al.
(2
014
)
Fu
et
al.
(20
15
)
Ma
rin
-Ga
rcia
et
al.
(2
01
5)
Holm
emo &
In
gvald
sen
(2016)
Au
-Yo
ng
et
al.
(2
01
7)
Lle
o e
t a
l. (
20
17
)
va
n D
un
et
al.
(2
017
)
Ju
rbu
rg e
t a
l. (
in p
ress
)
Dri
ver
s
Str
ate
gy
(o
rg.
level
) CI Alignment X X
Selection of
appropiate areas X X
Resources X X
Sy
stem
s (o
rg.
level
)
Empowerment X X X X X X X
Communication X X X X X X X
Rewards X X X X
Methodology X X X
Training X X X X X X X
Job evaluation X
Systematic control X
Objectives & KPI X X
Lea
der
ship
(o
rg.
level
)
Organizational
support X X X X X X
Middle managers’
leadership X X X X X
CI facilitator X
En
ab
lers
En
vir
on
men
t (o
rg.
level
) Social influence X X X X X
Teamwork X X X
Resistance to change X X
Att
itu
des
(i
ndiv
. le
vel
) Job satisfaction X X X X
Self-efficacy X X X
Employee loyalty X
Commitment X X
Res
ult
s
Beh
avio
ur
(indiv
.lev
el)
Everybody’s
participation X X X X X X X
The work of Jurburg et al. (in press) seems to approach better the organizational-personal
fit because it is the only one with enhancers in all the divisions in reviewed literature.
This publication presents the CIAM model, where appear both organizational variables
and individual attitudes related between themselves in order to enhance employee
participation. However, we think that their work has, at least, three points of
improvement:
(1) Differentiating between strategy, systems, leadership, environment and attitudes
in order to clarify the nature of participation antecedents.
(2) Explaining the relationships between drivers themselves for a better
comprehension of the direct and indirect effect between drivers and environment,
and individual responses
(3) Using a solid behavioural model for further explaining how the organizational
drivers and the organizational environment impact on the personal antecedents of
participation.
These improvements of the CIAM model would help us to shed light on the
organizational-individual fit, and that is the aim of our research. Concretely, our purpose
is to illustrate how a company can manage organizational drivers for creating an
appropriate environment that enhances employees’ participation in continuous
improvement activities.
17
Hypotheses Development
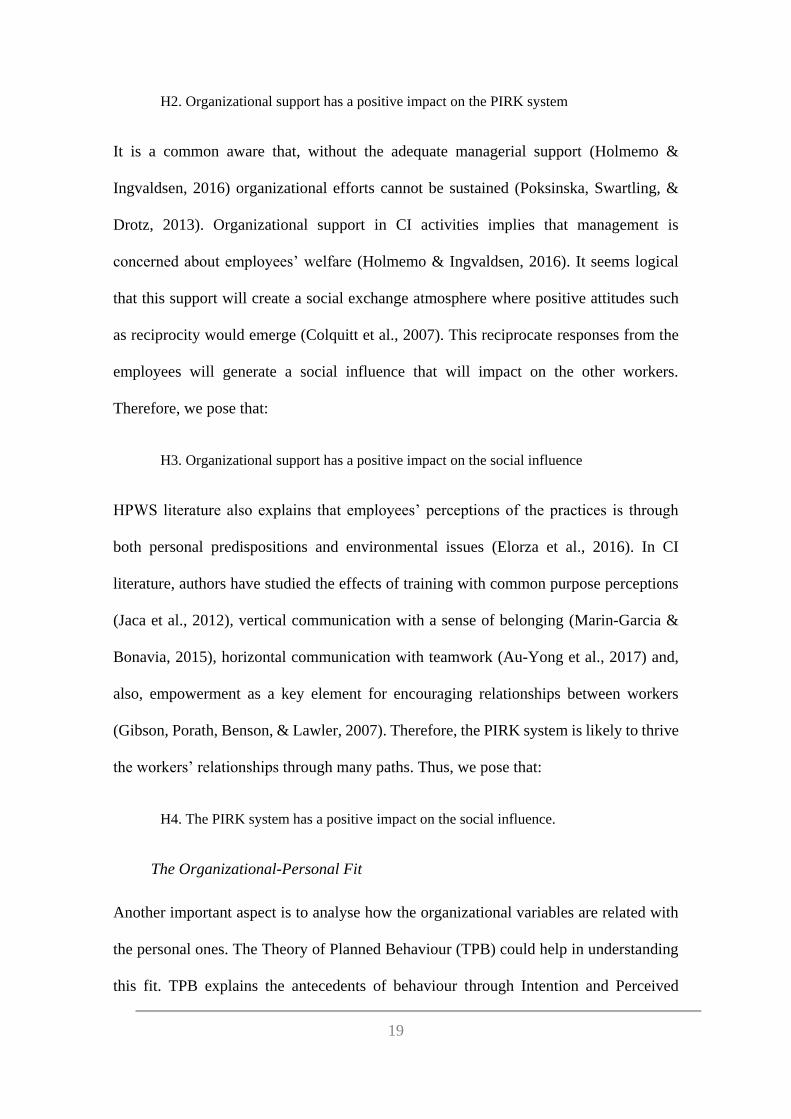
Classification of the Enhancers presented in Jurburg’s work in a more holistic
manner.
From Jurburg’s work, seven drivers could be drawn: one strategic-related (CI alignment),
five system-related (empowerment, communication, rewards, training and methodology)
and one leadership-related (organizational support). In addition, it has one environmental
aspect (social influence) and four attitudes (self-efficacy, job satisfaction, ease of
participation, usefulness of participation).
Although the systems were represented by single variables, the High Performance
Work Systems (HPWS) literature create the PIRK construct with the practices that
provide power, information, rewards and knowledge to employees (Boxall & Winterton,
2018) in order to study how these practices all-together as a hole system enhance
employees’ skills, motivation, commitment, and effort (Elorza et al., 2016). Applying
HPWS to the work of Jurburg et al (in press), we could aggregate into the PIRK second-
order variable the four first-order ones (empowerment, communication, rewards and
training). Taking into account the other variables of Jurburg et al. (in press) work, CI
Alignment and Organizational Support variables could be considered as other
organizational practices that management can drive. Social Influence represents the
environmental variable that will also impact on the individual outcomes. Regarding the
last ones, self-efficacy, job satisfaction and intention to participate could be considered
personal antecedents of participation, which is the behavioural individual outcome.
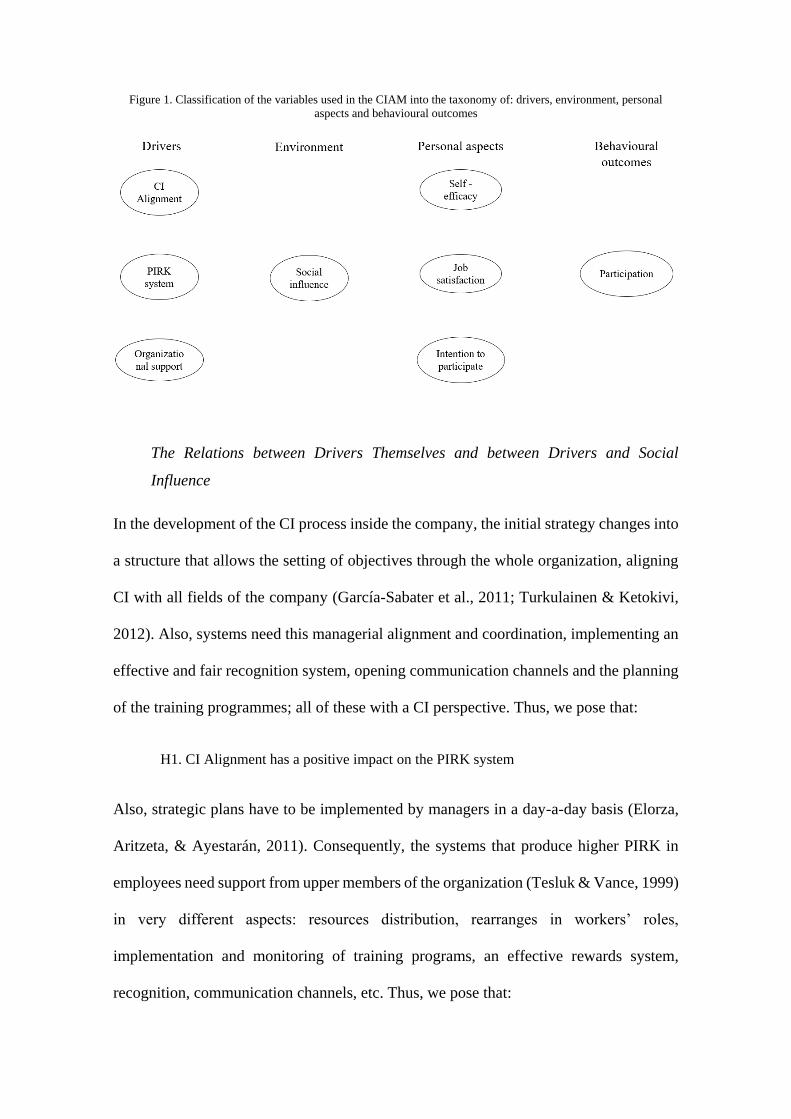
Figure 1. Classification of the variables used in the CIAM into the taxonomy of: drivers, environment, personal
aspects and behavioural outcomes
The Relations between Drivers Themselves and between Drivers and Social
Influence
In the development of the CI process inside the company, the initial strategy changes into
a structure that allows the setting of objectives through the whole organization, aligning
CI with all fields of the company (García-Sabater et al., 2011; Turkulainen & Ketokivi,
2012). Also, systems need this managerial alignment and coordination, implementing an
effective and fair recognition system, opening communication channels and the planning
of the training programmes; all of these with a CI perspective. Thus, we pose that:
H1. CI Alignment has a positive impact on the PIRK system
Also, strategic plans have to be implemented by managers in a day-a-day basis (Elorza,
Aritzeta, & Ayestarán, 2011). Consequently, the systems that produce higher PIRK in
employees need support from upper members of the organization (Tesluk & Vance, 1999)
in very different aspects: resources distribution, rearranges in workers’ roles,
implementation and monitoring of training programs, an effective rewards system,
recognition, communication channels, etc. Thus, we pose that:
19
H2. Organizational support has a positive impact on the PIRK system
It is a common aware that, without the adequate managerial support (Holmemo &
Ingvaldsen, 2016) organizational efforts cannot be sustained (Poksinska, Swartling, &
Drotz, 2013). Organizational support in CI activities implies that management is
concerned about employees’ welfare (Holmemo & Ingvaldsen, 2016). It seems logical
that this support will create a social exchange atmosphere where positive attitudes such
as reciprocity would emerge (Colquitt et al., 2007). This reciprocate responses from the
employees will generate a social influence that will impact on the other workers.
Therefore, we pose that:
H3. Organizational support has a positive impact on the social influence
HPWS literature also explains that employees’ perceptions of the practices is through
both personal predispositions and environmental issues (Elorza et al., 2016). In CI
literature, authors have studied the effects of training with common purpose perceptions
(Jaca et al., 2012), vertical communication with a sense of belonging (Marin-Garcia &
Bonavia, 2015), horizontal communication with teamwork (Au-Yong et al., 2017) and,
also, empowerment as a key element for encouraging relationships between workers
(Gibson, Porath, Benson, & Lawler, 2007). Therefore, the PIRK system is likely to thrive
the workers’ relationships through many paths. Thus, we pose that:
H4. The PIRK system has a positive impact on the social influence.
The Organizational-Personal Fit
Another important aspect is to analyse how the organizational variables are related with
the personal ones. The Theory of Planned Behaviour (TPB) could help in understanding
this fit. TPB explains the antecedents of behaviour through Intention and Perceived
Behavioural Control; and posits that Intention is preceded by Subjective Norm, Attitudes
and Perceived Behavioural Control (Ajzen, 1991; Tang et al., 2010). Those constructs do
not have a specific interpretation, and need particularization in different investigation
contexts (Matiheson, 1991).
In our case, the behaviour investigated will be “participation in continuous
improvement activities” (participation), and intention is “intention to participate in
continuous improvement activities” (intention to participate). Subjective Norm is a
construct that involves the pressures of the overall of the individual relations, including
the work ones (Galeazzo et al., 2017). In our case, the social influence could be used as
this variable. Perceived Behavioural Control can be explained as the perception of
capacity of doing the behaviour (Straatmann, Rothenhöfer, Meier, & Mueller, 2018).
Ajzen (1991) identifies this predictor with self-efficacy, understood as the individual
perception of ability to carry out the specific behaviour. At least, Attitudes are the
individual predispositions of doing the behaviour based on the outcomes expected (Ajzen,
1991). So, if the behaviour is expected to have good outcomes, there would be better
attitudes towards it. Attitudes have a long tradition in continuous improvement and one
of the attitudes that has been frequently used is job satisfaction (Jurburg et al., 2017;
Vandenberg, Richardson, & Eastman, 1999). So, our investigated attitude will be job
satisfaction.
Thus, having compared the individual enhancers of CI with the ones pointed out
by the TPB, we are going to explain how the drivers directly impact on the individual
level.
Dahlgaard-Park (2012) stated that support needed for CI sustainability enhance
employees’ perception of being part of a community, covering social needs and, because
of that, achieving job satisfaction. Moreover, this supporting leadership involve that
21
employees will not fail in their tasks due to a lack of resources, and enhance their
perception of capability (Jurburg et al., 2017). Therefore, it can be supposed that:
H5. Organizational support has a positive impact on employees’ job satisfaction
H6. Organizational support has a positive impact on employees’ self-efficacy.
Continuing with drivers, it has been widely studied the relationship between PIRK
systems and the increase of job satisfaction (Tesluk & Vance, 1999; Vandenberg et al.,
1999). Moreover, in CI, some authors have posed that antecedents of job satisfaction are
empowerment (Arsić et al., 2012), training (Jurburg et al., 2017), communication
(Rahmat & Ali, 2010) and rewards (Jaca et al., 2012). Nevertheless, to the best of our
knowledge, no publication of the Continuous Improvement framework has identified job
satisfaction as the attitudinal variable in a TPB framework. Consistent with literature but
adding this behavioural model, we pose that:
H7. The PIRK system has a positive impact on employees’ job satisfaction
Although self-efficacy has not been widely studied neither in HPWS nor in continuous
improvement, some authors have observed that empowerment and communication are
drivers of this attitude, enhancing it (Marin-Garcia & Bonavia, 2015). Also, Jurburg et al.
(2017) stated that training will elevate employees’ self-efficacy levels due to the increase
capacity of doing the behaviour. Therefore, the practices included in the PIRK are likely
to increase employees’ self-efficacy in many ways as training improve the skills, the
future reward drives the effort -and so, the perception of capability, communication opens
channels to help and empowerment will allow employees to set the tasks they feel
capable.
H8. The PIRK system has a positive impact on employees’ self-efficacy
Some meta-analysis of models based on TPB have pointed out that the relation between
Subjective Norm and Intention is weak or does not impact at all (Armitage & Conner,
2001). Nevertheless, CI literature has given to culture and environment a strong role in
the drive of individual perceptions, specially job satisfaction (Arsić et al., 2012; García-
Arca & Prado-Prado, 2011). It could be implied that doing what peers are doing will
enhance a sense of community, covering social needs and achieving satisfaction for it.
Likewise, supporting relations at work would enhance employees’ perception of being
able to call for help if necessary, improving their perception of capability, and
achievement examples from peers would thrive this feeling of self-efficacy. So,
H9. Social influence has a positive impact on employees’ job satisfaction
H10. Social influence has a positive impact on employees’ self-efficacy
In the relations between attitudes and self-efficacy, TPB literature usually states that there
is a correlation between the three items that impact on intention (Ajzen, 2011).
Nevertheless, job satisfaction is an attitude, defined as the perceived goodness of the
outcome or behaviour. So, if the outcome is perceived as good, as an opportunity to
growth and not a threat, it is expected to drive the effort one is willing to put in the
behaviour (Dweck, 2009). And, the more the effort done, the more the perception of
capacity. Therefore, we pose that:
H11. Employees’ job satisfaction has a positive impact on employees’ self-efficacy
Finally, the antecedents of intention to participate are likely to be both job satisfaction
and self-efficacy as both impact on participation (Au-Yong et al., 2017; Jurburg et al.,
2017), and TPB assumptions state that the path towards a behaviour is preceded by
intention and a direct path from self-efficacy (Tang et al., 2010). Because of that,
23
H12. Employees’ job satisfaction has a positive impact on employees’ intention to
participate in CI activities
H13. Employees’ self-efficacy has a positive impact on employees’ intention to
participate in CI activities
H14. Employees’ self-efficacy has a positive impact on employees’ participation in
CI activities
H15. Employees’ intention to participate in CI activities has a positive impact on
employees’ participation in CI activities
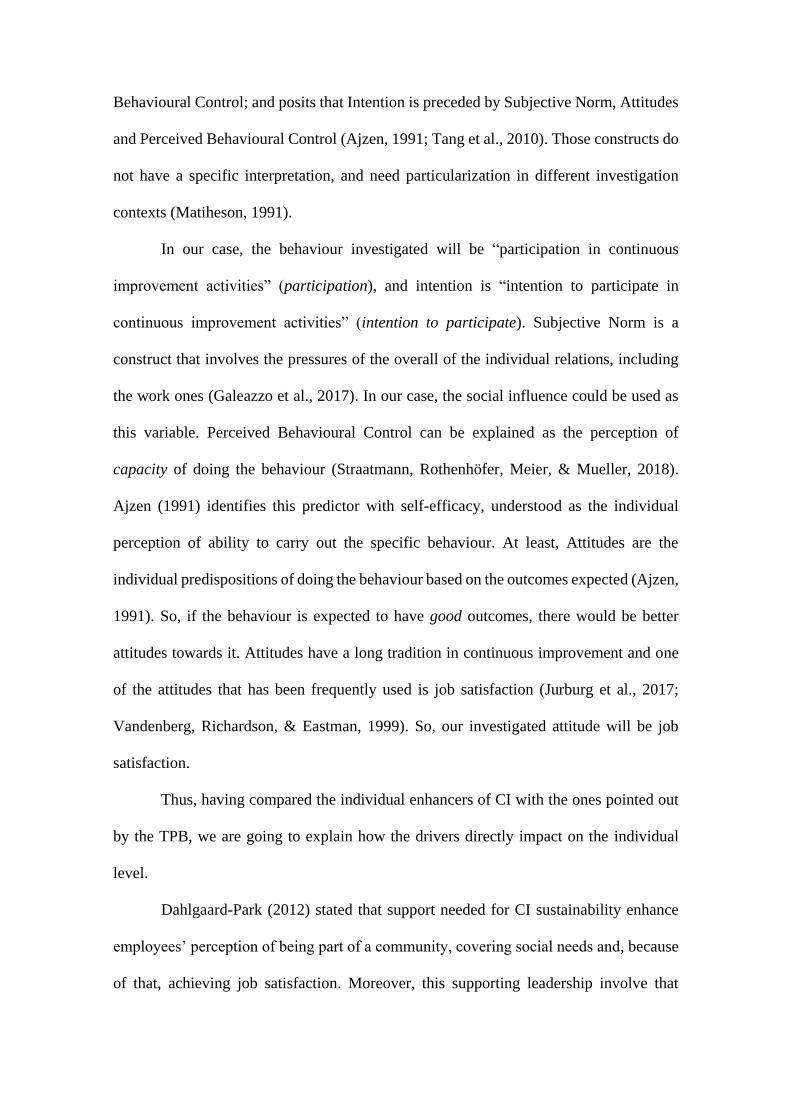
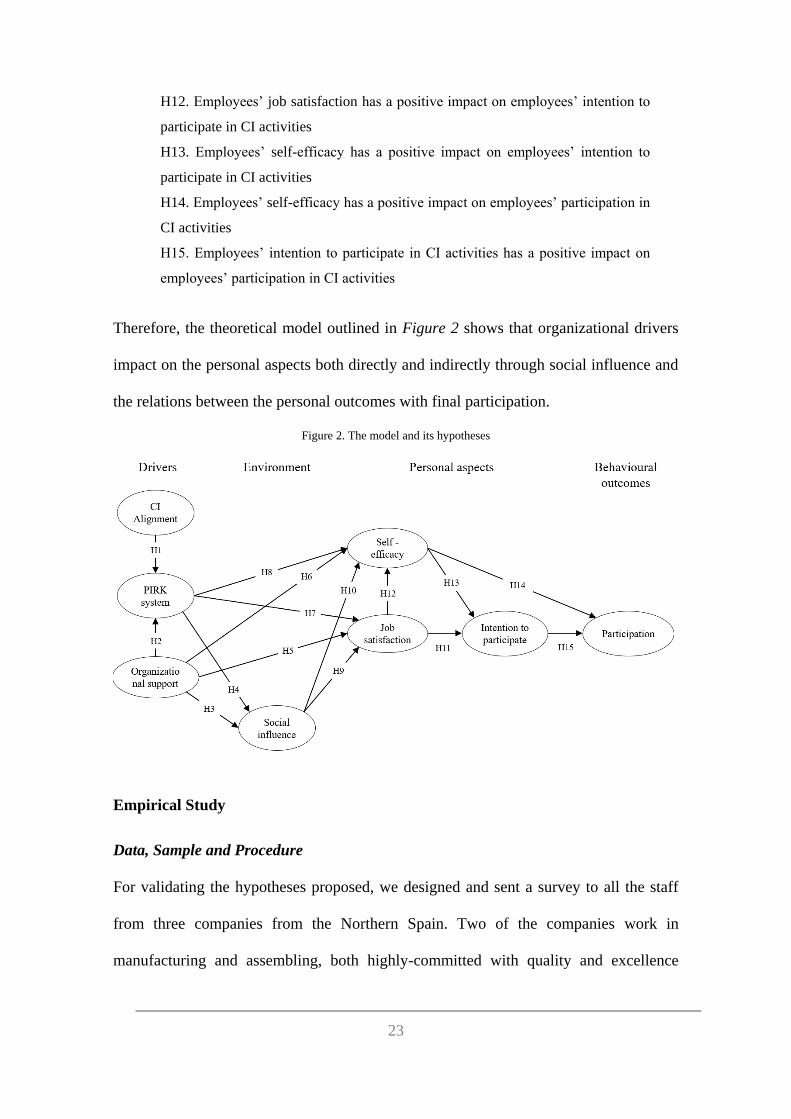
Therefore, the theoretical model outlined in Figure 2 shows that organizational drivers
impact on the personal aspects both directly and indirectly through social influence and
the relations between the personal outcomes with final participation.
Figure 2. The model and its hypotheses
Empirical Study
Data, Sample and Procedure
For validating the hypotheses proposed, we designed and sent a survey to all the staff
from three companies from the Northern Spain. Two of the companies work in
manufacturing and assembling, both highly-committed with quality and excellence
through all the activities. The last one was a public service in a city council. The entire
staff was informed with a communication campaign about the confidentiality and
anonymity of the complementation of the survey, and about the importance of answering
this questionnaire. Then, the survey was conducted in order to obtain managers and
workers opinions from managerial practices and self-valuations of personal aspects and
behaviours. It was conducted for employees in paper, and managers respond to it in paper
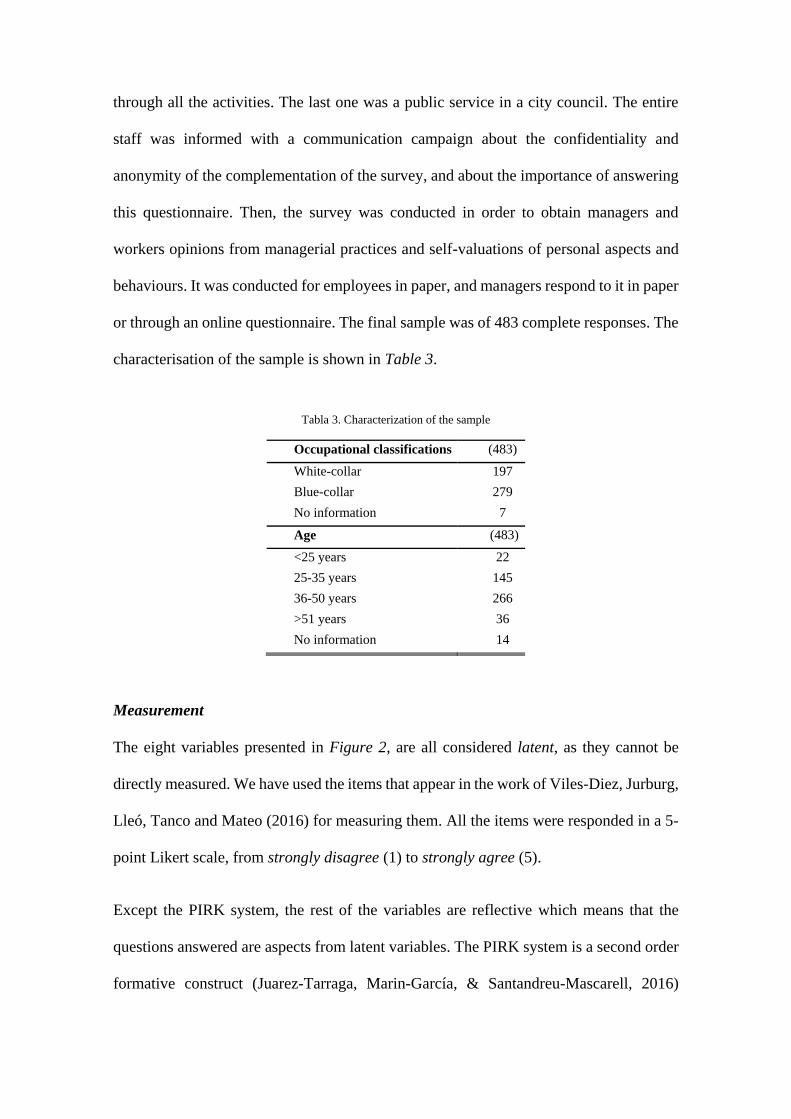
or through an online questionnaire. The final sample was of 483 complete responses. The
characterisation of the sample is shown in Table 3.
Tabla 3. Characterization of the sample
Occupational classifications (483)
White-collar 197
Blue-collar 279
No information 7
Age (483)
<25 years 22
25-35 years 145
36-50 years 266
>51 years 36
No information 14
Measurement
The eight variables presented in Figure 2, are all considered latent, as they cannot be
directly measured. We have used the items that appear in the work of Viles-Diez, Jurburg,
Lleó, Tanco and Mateo (2016) for measuring them. All the items were responded in a 5-
point Likert scale, from strongly disagree (1) to strongly agree (5).
Except the PIRK system, the rest of the variables are reflective which means that the
questions answered are aspects from latent variables. The PIRK system is a second order
formative construct (Juarez-Tarraga, Marin-García, & Santandreu-Mascarell, 2016)
25
created from the first-order variables empowerment, communication, rewards system and
training, which were measured with reflective items. We used the items develop by Viles
et al. (2016) for measuring these variables.
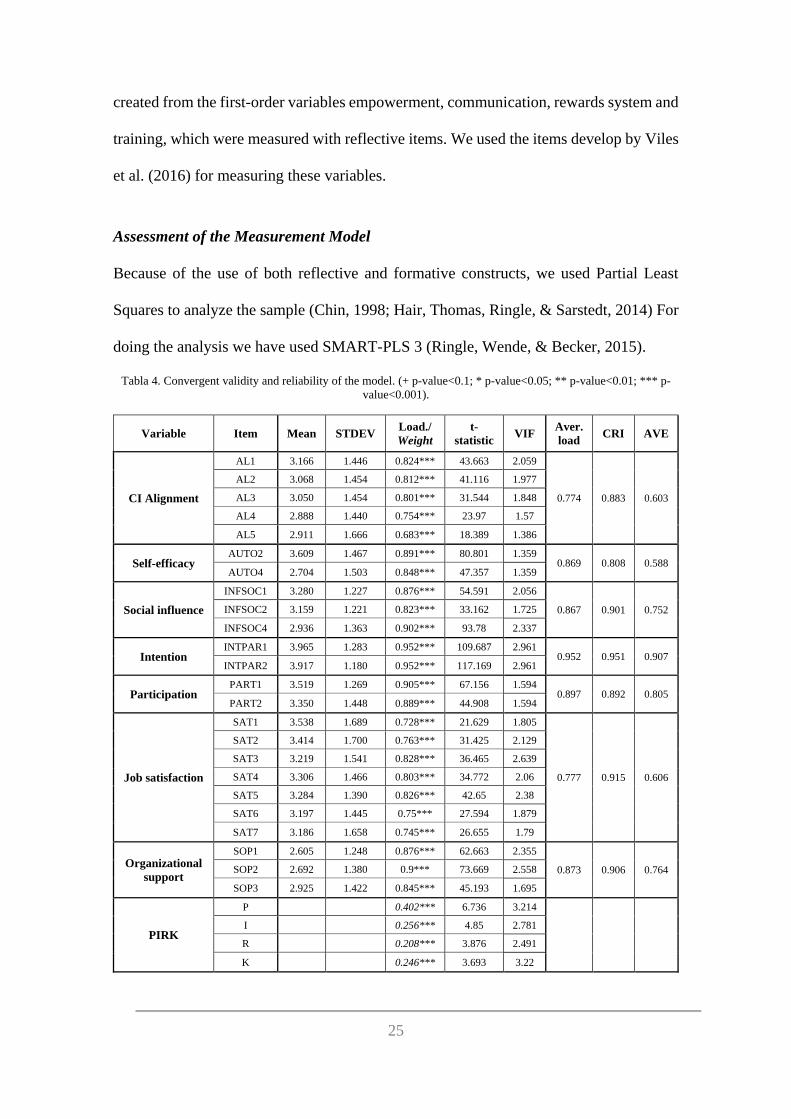
Assessment of the Measurement Model
Because of the use of both reflective and formative constructs, we used Partial Least
Squares to analyze the sample (Chin, 1998; Hair, Thomas, Ringle, & Sarstedt, 2014) For
doing the analysis we have used SMART-PLS 3 (Ringle, Wende, & Becker, 2015).
Tabla 4. Convergent validity and reliability of the model. (+ p-value<0.1; * p-value<0.05; ** p-value<0.01; *** p-
value<0.001).
Variable Item Mean STDEV Load./
Weight
t-
statistic VIF
Aver.
load CRI AVE
CI Alignment
AL1 3.166 1.446 0.824*** 43.663 2.059
0.774 0.883 0.603
AL2 3.068 1.454 0.812*** 41.116 1.977
AL3 3.050 1.454 0.801*** 31.544 1.848
AL4 2.888 1.440 0.754*** 23.97 1.57
AL5 2.911 1.666 0.683*** 18.389 1.386
Self-efficacy AUTO2 3.609 1.467 0.891*** 80.801 1.359
0.869 0.808 0.588 AUTO4 2.704 1.503 0.848*** 47.357 1.359
Social influence
INFSOC1 3.280 1.227 0.876*** 54.591 2.056
0.867 0.901 0.752 INFSOC2 3.159 1.221 0.823*** 33.162 1.725
INFSOC4 2.936 1.363 0.902*** 93.78 2.337
Intention INTPAR1 3.965 1.283 0.952*** 109.687 2.961
0.952 0.951 0.907 INTPAR2 3.917 1.180 0.952*** 117.169 2.961
Participation PART1 3.519 1.269 0.905*** 67.156 1.594
0.897 0.892 0.805 PART2 3.350 1.448 0.889*** 44.908 1.594
Job satisfaction
SAT1 3.538 1.689 0.728*** 21.629 1.805
0.777 0.915 0.606
SAT2 3.414 1.700 0.763*** 31.425 2.129
SAT3 3.219 1.541 0.828*** 36.465 2.639
SAT4 3.306 1.466 0.803*** 34.772 2.06
SAT5 3.284 1.390 0.826*** 42.65 2.38
SAT6 3.197 1.445 0.75*** 27.594 1.879
SAT7 3.186 1.658 0.745*** 26.655 1.79
Organizational
support
SOP1 2.605 1.248 0.876*** 62.663 2.355
0.873 0.906 0.764 SOP2 2.692 1.380 0.9*** 73.669 2.558
SOP3 2.925 1.422 0.845*** 45.193 1.695
PIRK
P 0.402*** 6.736 3.214
I 0.256*** 4.85 2.781
R 0.208*** 3.876 2.491
K 0.246*** 3.693 3.22
To assess the validity and reliability of the reflective measurement variables we measured
four aspects: internal consistency with the Composite Reliability Index (CRI); indicator
reliability; convergent validity with the Average Variance Extracted (AVE) and
discriminant validity with the criterion of Fornell-Larcker (Hair et al., 2014). The first
three are presented in Table 4. All the reflective variables seem to be internally consistent
due to all CRI values are above 0.6 (Nunnally & Bernstein, 1994). The indicator reliability
is measured through the intensity of items loading to the factor, having to be the mean
above 0.7 and no one load below 0.6 (Hair et al., 2014). We can observe that this is true
for all factors. Also, convergent validity of variables is assured given that all variables
have values above 0.5 (Fornell & Larcker, 1981).
Tabla 5. Discriminant validity of the model
CI
Ali
gn
men
t
Inte
nti
on
Job
sati
sfact
ion
Org s
up
port
PIR
K
Parti
cip
ati
on
Sel
f-ef
fica
cy
Soci
al
infl
uen
ce
CI Alignment 0.776
Intention 0.39 0.952
Job satisfaction 0.695 0.513 0.778
Org support 0.71 0.42 0.634 0.874
PIRK 0.764 0.417 0.684 0.814
Participation 0.421 0.626 0.423 0.389 0.458 0.897
Self-efficacy 0.606 0.532 0.678 0.649 0.713 0.457 0.87
Social influence 0.677 0.471 0.778 0.616 0.713 0.441 0.619 0.867
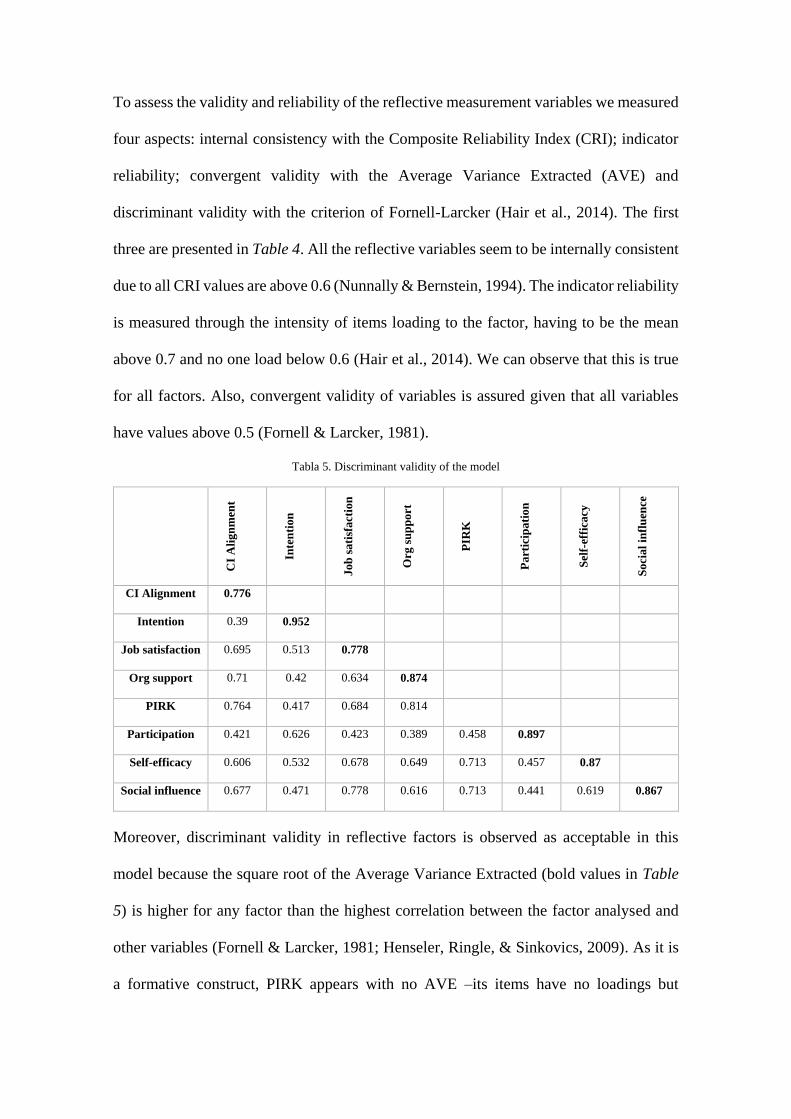
Moreover, discriminant validity in reflective factors is observed as acceptable in this
model because the square root of the Average Variance Extracted (bold values in Table
5) is higher for any factor than the highest correlation between the factor analysed and
other variables (Fornell & Larcker, 1981; Henseler, Ringle, & Sinkovics, 2009). As it is
a formative construct, PIRK appears with no AVE –its items have no loadings but
27
weights.
Validity and reliability of formative constructs are assessed with other instruments
(Hair et al., 2014), Firstly, an assessment for the convergent validity was conducted with
a redundancy analysis, and the resultant coefficient of determination was above 0.81, so
it was validated (Chin, 1998). Collinearity of formative items has to be evaluated with the
Variance Inflator Factor (VIF), because higher collinearity implies higher standard errors,
leading to no-significate weights. Values of this measurement instrument have to be
below 5 (Henseler et al., 2009), and that criterion is proved. Also, significance and
relevance of formative constructs is assessed with the outer weight, obtained by
bootstrapping (Hair et al., 2014). This outer weights –presented in Table 4- should be
lower than 0.5 as indicated by Cenfetelli and Bassellier (2009). So, with the VIF and the
outer weights, we can state that the formative construct appears to be significant and
relevant. Thus, we can say that the measurement instrument used to this model is reliable
and valid.
Results
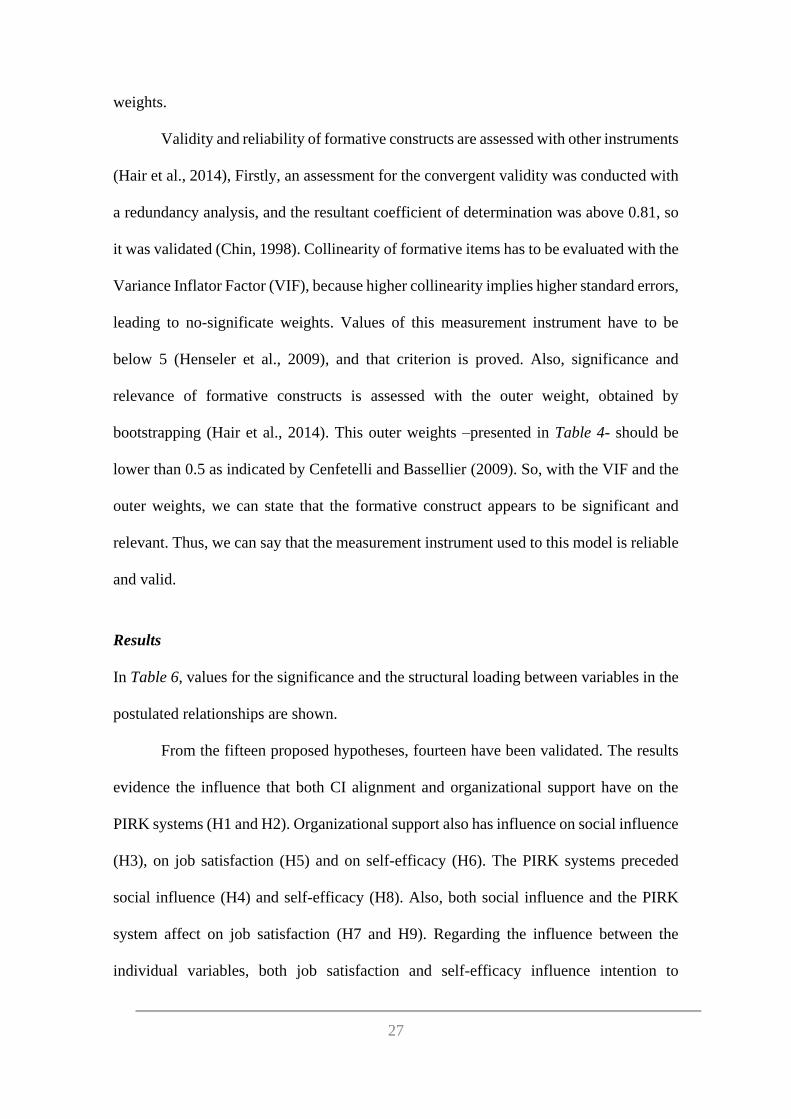
In Table 6, values for the significance and the structural loading between variables in the
postulated relationships are shown.
From the fifteen proposed hypotheses, fourteen have been validated. The results
evidence the influence that both CI alignment and organizational support have on the
PIRK systems (H1 and H2). Organizational support also has influence on social influence
(H3), on job satisfaction (H5) and on self-efficacy (H6). The PIRK systems preceded
social influence (H4) and self-efficacy (H8). Also, both social influence and the PIRK
system affect on job satisfaction (H7 and H9). Regarding the influence between the
individual variables, both job satisfaction and self-efficacy influence intention to
participate (H11 and H13). Finally, the results show that participation is preceded by
intention to participate (H15) and self-efficacy (H14). The only hypothesis that is not
validated is the relation between social influence and self-efficacy.
Tabla 6. Path coefficients and significance of hypotheses tested
Hypothesis Relationship Path Values T-
statistics
H1 CI Alignment -> PIRK 0.378 *** 8.045
H2 Org support -> PIRK 0.546 *** 11.48
H3 Org support -> Social influence 0.102 + 1.939
H4 PIRK -> Social influence 0.631 *** 11.72
H5 Org support -> Job satisfaction 0.167 ** 3.116
H6 Org support -> Self-efficacy 0.123 * 2.216
H7 PIRK -> Job satisfaction 0.141 * 2.154
H8 PIRK -> Self-efficacy 0.371 *** 5.475
H9 Social influence -> Job satisfaction 0.574 *** 10.559
H10 Social influence -> Self-efficacy 0.026 0.406
H11 Job satisfaction -> Self-efficacy 0.326 *** 5.425
H12 Job satisfaction -> Intention 0.285 *** 4.901
H13 Self-efficacy -> Intention 0.337 *** 4.946
H14 Self-efficacy -> Participation 0.171 ** 3.229
H15 Intention -> Participation 0.535 *** 9.961
+ p-value<0.1; * p-value<0.05; ** p-value<0.01; *** p-value<0.001
R2 (Intention) = 0.326; R2 (Job satisfaction) = 0.648; R2 (PIRK) = 0.732;
R2 (Participation) = 0.414; R2 (Self-efficacy) = 0.582; R2 (Social influence) = 0.512
Q2 (Intention) = 0.368; Q2 (Job satisfaction) = 0.354; Q2 (PIRK) = 0.546;
Q2 (Participation) = 0.392; Q2 (Self-efficacy) = 0.352; Q2 (Social influence) = 0.355
The analysis also assures the predictive relevance of the model. The results evidence that
the explained variance (R2) of the dependent factors are above 0.1 (Falk & Miller, (1992).
Moreover, after doing a blindfolding procedure (Hair et al., 2014) with a omission
distance of 5, all the Q2 obtained are above zero evidencing the predictive relevance of
the model (Stone, 1974) assuring that the model is fit in its overall
29
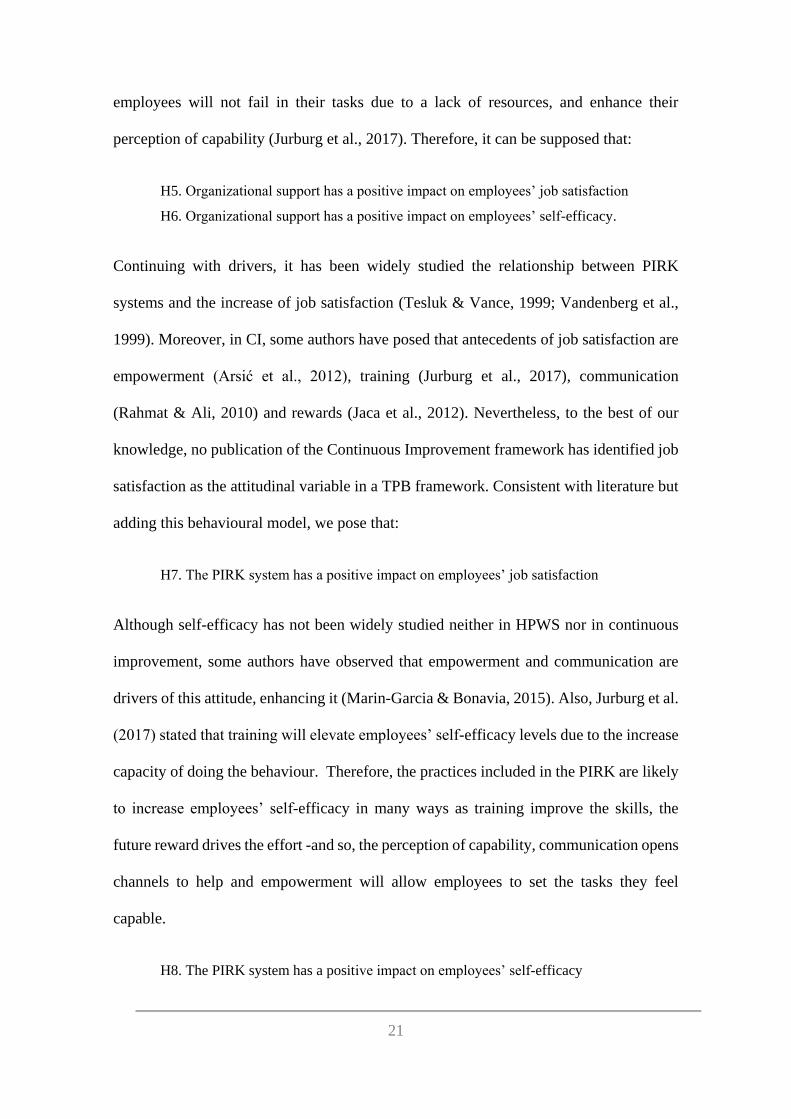
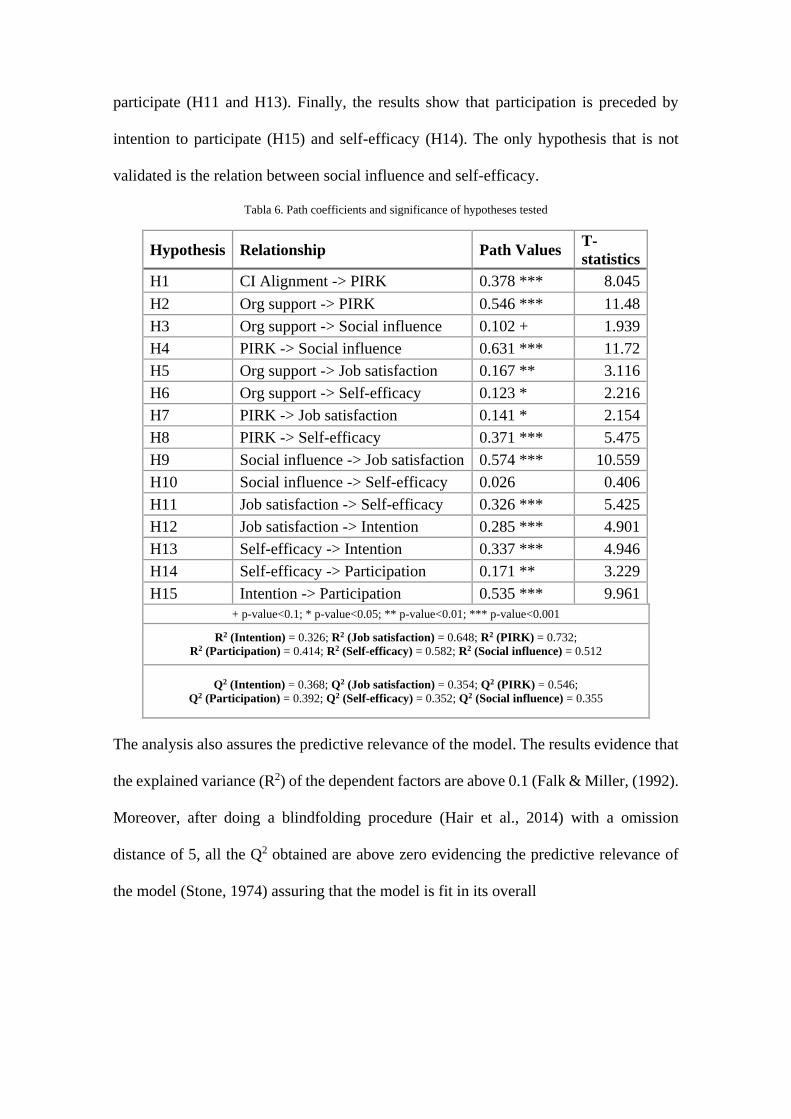
Discussion and Implications
Figure 3. Empirical model with path coefficients (+ p-value<0.1; * p-value<0.05; ** p-value<0.01; *** p-
value<0.001). The dotted arrow is the hypothesis not validated
The model, and the results shown in Figure 8, evidences a more holistic approach that
shows more clearly how the organizational drivers can be managed enhancing an
appropriate environment that promotes individual participation.
This holistic approach shows the relations between drivers themselves, which is
not illustrated in the CIAM. Thanks to the PIRK construct, the systems mediate the effects
that the drivers have on social influence and with personal self-efficacy and job
satisfaction. Although social influence is preceded by organizational support, the
Variance Accounted For (Hair et al., 2014) evidences that the majority of the effect that
organizational support has on social influence is more indirect, through the PIRK systems,
than direct (VAF=77.16%). Thus, this relation is partially mediated by the PIRK system.
The PIRK systems also partially mediates the effect between organizational support and
self-efficacy (VAF=71.98%). The work of Jurburg et al. (2017) recognized the mediation
role of empowerment between organizational support and the attitudes, but it not included
the other recognition, information and knowledge systems. Our results propose, and this
is totally new in CI literature, that there should be a change of the PIRK systems, through
organizational support and alignment, for enhancing social influence and self-efficacy.
Moreover, the use of the TPB framework for understanding the organizational-
individual fit is an improvement with respect the CIAM. Firstly, because the TAM
framework used in the CIAM is a behavioural model used for technology acceptance. As
CI is a people-centred system (Yan & Makinde, 2011), it seems to be reasonable to use a
broader behavioural model. There is abundant research about the TPB for understanding
human behaviour and Mathieson (1991) stated the ability of TPB to be studied in different
contexts. In this research, the model explains 41% of the variance of participation and
32,6% of the variance of the intention to participate. Thus, the TPB fits adequately in the
model. The measuring of Subjective Norm as Social Influence and Attitudes as Job
Satisfaction is likely to be validated also.
The results evidence a direct relation between job satisfaction and self-efficacy.
However, social influence does not affect directly self-efficacy but indirectly through Job
Satisfaction. So, Job Satisfaction is a full mediator between social Influence and Self-
Efficacy. From the best of our knowledge, this is a new vision in the antecedents of
intention to behave in the TPB framework.
Moreover, social influence partially mediated the relation between the PIRK and
job satisfaction. The VAF provides a mediating effect of 62.22% (Hair et al., 2014). The
reflexions of Boxall & Winterton (2018) of the importance of environment in the
implementation of the systems are in line with these results, but they do not propose a
specific mediating effect.
These results evidence, and this is also new in CI literature, the key role that social
influence has for enhancing personal job satisfaction, which is crucial for fostering
individual participation.
31
Managers should take into account the importance of these two variables, PIRK
systems and the social influence, for strengthening employees´ participation. Concretely,
management should be aware of the importance of developing practices that empower,
transmit the information, reward and train well the employees. Also, it should be
interesting to invest time in developing group dynamics that contribute to develop
collaboration, trust and this social influence for promoting employees´ participation
Conclusions
This paper proposed a model integrating the most cited enhancers of continuous
improvement. After distinguish the enhancers between organizational drivers and
environment, and using the Theory of Planned Behaviours for differentiating the personal
aspects, our model links the organizational level with the individual level variables. Our
proposal presents a holistic approach that shows clearly the process of how an
organization can manage the organizational drivers enhancing an appropriate
environment that promotes individual participation.
An empirical study in three different organizations of the north of Spain evidences
this process. Concretely, the implementation of systems that enhance power, information,
rewards and knowledge of employees strengthens a social influence. Both PIRK systems
and social influence foster job satisfaction and self-efficacy and, through these variables
intention and final participation are strengthened. These results evidence the key role of
these two variables, PIRK systems and social influence, for promoting employees´
participation. While the PIRK systems mediates the influence of the drivers both in the
social influence and in the employees’ self-efficacy, managers should focus on the
development of those systems through an appropriate strategy that align the goals and
aims of the whole company with continuous improvement and the organizational support.
Also, managers should focus on promoting actions that enhance an intense social
influence.
Future research is open through this research. Firstly, the empirical study was all
conducted in the north of Spain with high-developed continuous improvement
programmes, but there is no empirical validation for other sectors and countries that could
validate this model as general. Also, due to the distinction of organizational-personal
enhancers multilevel studies should be conducted to prove the validity of these relations
beyond employees’ perceptions. Finally, longitudinal studies should evidence the
relations between the different variables along time and also if there are other variables
that appears to be critical in the process of enhancing employees´ participation towards
continuous improvement.
33
Conclusiones
Ya que las aportaciones teóricas y las implicaciones prácticas se comentaron en la
publicación (sección 2), en esta última parte nos limitaremos a los comentarios relativos
al proyecto en sí y a la consecución o no de los objetivos planteados en la sección 1.
Resultados del proyecto
El objetivo primordial de este proyecto era la profundización teórica y validación del paso
de lo organizativo a lo personal en la participación en mejora continua. Para conseguir
esto, se han clasificado las variables del CIAM en tres divisiones (palancas-drivers,
facilitadores-enablers y resultados-outcomes) y en dos niveles (organizativo e individual).
Esta clasificación resulta de gran importancia debido a que la organización solo puede
cambiar de manera directa las palancas, que a su vez afectan a los facilitadores,
consiguiendo a la vez claridad en el modelo y aplicabilidad, demandadas ambas en la
justificación al CIAM. A la vez, el rol de la influencia social queda determinado por esta
clasificación, ya que pertenece a un contexto organizativo pero es un facilitador (Kaye &
Anderson, 1999), teniendo un papel mediador fundamental entre las palancas y los
antecedentes a la intención a participar.
Por añadidura, las palancas que presentan el CIAM explican ahora cómo se
canalizan los esfuerzos organizativos para generar la apropiada predisposición del
empleado. Esta canalización es a través de los sistemas que potencian el poder,
información, recompensas y conocimiento de los empleados (PIRK), con la aportación
de unificarlas con la literatura de los Sistemas de Trabajo de Alto Rendimiento (HPWS)
a través de un constructo de segundo orden que aprovecha las relaciones internas de estas
prácticas para potenciar sus efectos. Esto se observa en tanto que las relaciones que parten
o llegan al PIRK son de unos valores altos.
Estas prácticas favorecen en un alto grado la influencia social y también la
percepción de capacidad de los empleados. Esto es una novedad con respecto al CIAM,
en el que aparecía la influencia social como un constructo aislado, sin antecedentes;
mientras que nuestra investigación ha demostrado la importancia clave como mediador
que este posee en la generación de las actitudes correctas (es decir, en la satisfacción
laboral).
Los sistemas, a su vez, son potenciados en tanto que la estrategia se corresponda
con una alineación a la mejora continua de todas las áreas y objetivos de la empresa, y
también con el apoyo organizativo. El rol de este apoyo ya se encontraba en el CIAM, al
ser prácticamente el único facilitador de la mejora continua que poseía relaciones con
otros facilitadores organizativos (las demás relaciones del CIAM en el modelo “externo”
son para con la satisfacción en el trabajo), pero el trabajo de Jurburg no validaba la
influencia de la alineación sistemática de objetivos y áreas. En este sentido, se observa
una mejora con respecto al CIAM ya que se explican más variables.
Por último, el cambio de modelo de comportamiento, pasando del TAM al TPB,
queda justificado en tanto que todas las relaciones de las variables que involucran este
modelo están validadas empíricamente -en el CIAM se encuentra una relación no
comprobada estadísticamente- y que, sobre todo, el nivel de varianza explicado de la
intención y de la participación es mayor con el TPB que con el TAM. Ya que el TAM
está centrado en la aceptación de la tecnología (Yen-Tsang, Csillag, & Siegler, 2012) y
el TPB está más orientado al comportamiento humano en general -y así ha sido aplicado
a muy distintos contextos (Conner & Armitage, 2005)-, podría decirse que esta
investigación ha comprobado que la mejora continua no se explica solo con la
implantación de una serie de herramientas y mejoras tecnológicas, sino que está centrado
35
en las personas (Yan & Makinde, 2011) y por ello la necesidad de este modelo más abierto
de comportamiento.
Estudio económico: costes
Presupuesto de inmovilizado
No se realizó compra de inmovilizado durante este proyecto, por lo que no se considerará.
Presupuesto de material fungible
El material fungible utilizado (folios, bolígrafos, etc.) puede considerarse despreciable en
los términos generales de costes en este proyecto.
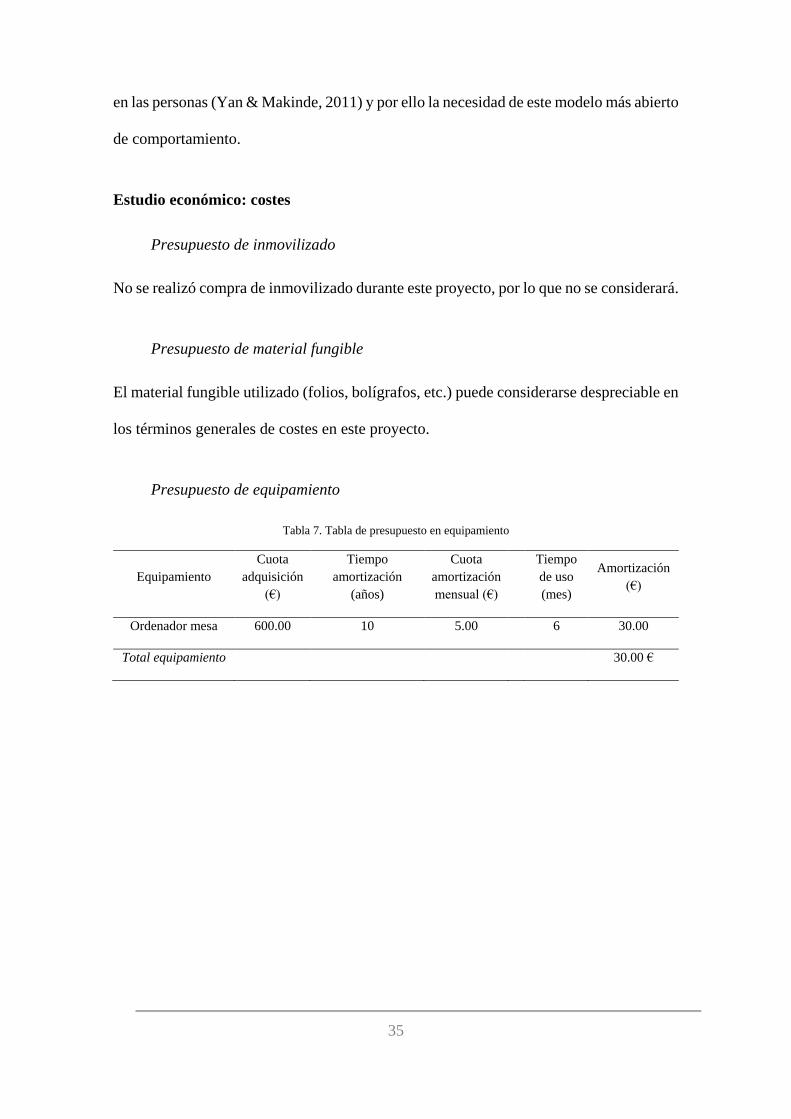
Presupuesto de equipamiento
Tabla 7. Tabla de presupuesto en equipamiento
Equipamiento
Cuota
adquisición
(€)
Tiempo
amortización
(años)
Cuota
amortización
mensual (€)
Tiempo
de uso
(mes)
Amortización
(€)
Ordenador mesa 600.00 10 5.00 6 30.00
Total equipamiento 30.00 €
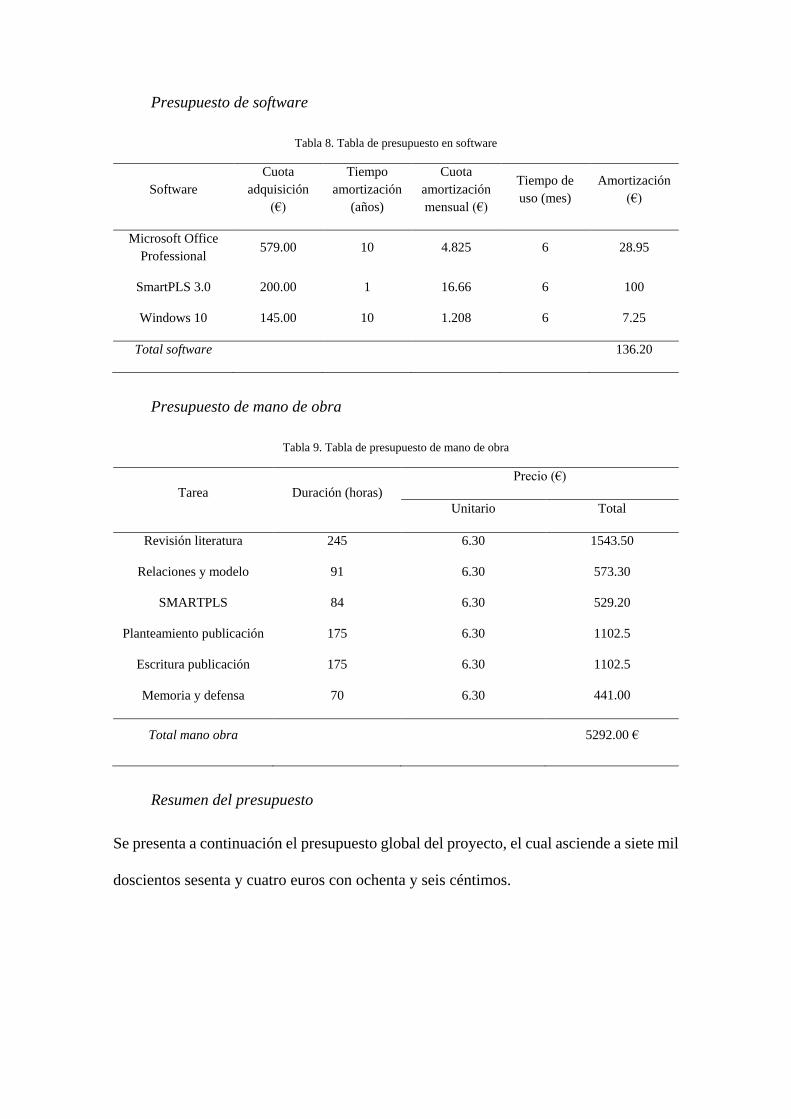
Presupuesto de software
Tabla 8. Tabla de presupuesto en software
Software
Cuota
adquisición
(€)
Tiempo
amortización
(años)
Cuota
amortización
mensual (€)
Tiempo de
uso (mes)
Amortización
(€)
Microsoft Office
Professional 579.00 10 4.825 6 28.95
SmartPLS 3.0 200.00 1 16.66 6 100
Windows 10 145.00 10 1.208 6 7.25
Total software 136.20
Presupuesto de mano de obra
Tabla 9. Tabla de presupuesto de mano de obra
Tarea Duración (horas)
Precio (€)
Unitario Total
Revisión literatura 245 6.30 1543.50
Relaciones y modelo 91 6.30 573.30
SMARTPLS 84 6.30 529.20
Planteamiento publicación 175 6.30 1102.5
Escritura publicación 175 6.30 1102.5
Memoria y defensa 70 6.30 441.00
Total mano obra 5292.00 €
Resumen del presupuesto
Se presenta a continuación el presupuesto global del proyecto, el cual asciende a siete mil
doscientos sesenta y cuatro euros con ochenta y seis céntimos.
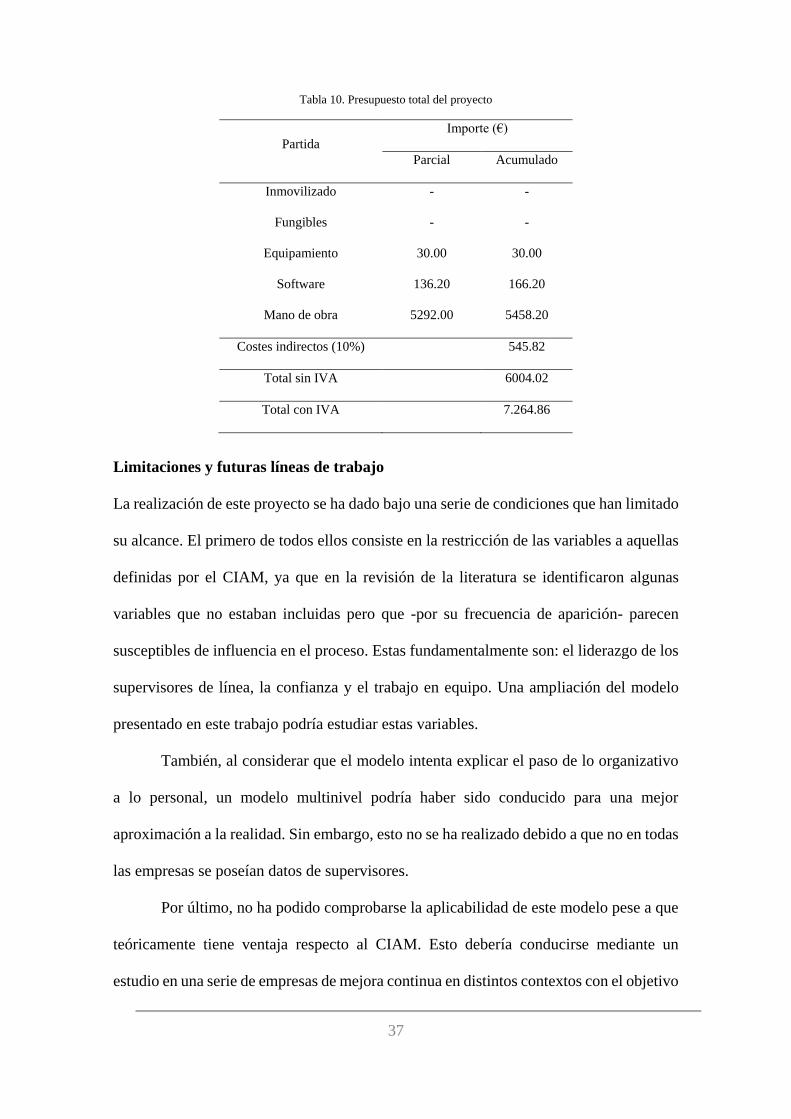
37
Tabla 10. Presupuesto total del proyecto
Partida
Importe (€)
Parcial Acumulado
Inmovilizado - -
Fungibles - -
Equipamiento 30.00 30.00
Software 136.20 166.20
Mano de obra 5292.00 5458.20
Costes indirectos (10%) 545.82
Total sin IVA 6004.02
Total con IVA 7.264.86
Limitaciones y futuras líneas de trabajo
La realización de este proyecto se ha dado bajo una serie de condiciones que han limitado
su alcance. El primero de todos ellos consiste en la restricción de las variables a aquellas
definidas por el CIAM, ya que en la revisión de la literatura se identificaron algunas
variables que no estaban incluidas pero que -por su frecuencia de aparición- parecen
susceptibles de influencia en el proceso. Estas fundamentalmente son: el liderazgo de los
supervisores de línea, la confianza y el trabajo en equipo. Una ampliación del modelo
presentado en este trabajo podría estudiar estas variables.
También, al considerar que el modelo intenta explicar el paso de lo organizativo
a lo personal, un modelo multinivel podría haber sido conducido para una mejor
aproximación a la realidad. Sin embargo, esto no se ha realizado debido a que no en todas
las empresas se poseían datos de supervisores.
Por último, no ha podido comprobarse la aplicabilidad de este modelo pese a que
teóricamente tiene ventaja respecto al CIAM. Esto debería conducirse mediante un
estudio en una serie de empresas de mejora continua en distintos contextos con el objetivo
de comprobar que un análisis en las distintas variables facilita la labor de la gestión de la
empresa y que, pasado el tiempo, produce una mejora y aumento en la participación.
En resumen, puede decirse del proyecto que ha culminado satisfactoriamente sus
objetivos, de manera especial si termina siendo aceptado por la revista Total Quality
Management & Business Excellence. Sin embargo, en el desarrollo de este proyecto han
ido surgiendo nuevas preguntas en las que se podría continuar investigando. Este trabajo
no explica de manera total el paso de lo organizativo a lo personal, pero contribuye a una
mejor comprensión, unificando los términos de la mejora continua, los High Performance
Work Systems y el modelo de comportamiento del TPB.
39
Referencias
Ajzen, I. (1991). The theory of planned behavior. Organizational Behavior and Human
Decision Processes, 50(2), 179–211. https://doi.org/10.1016/0749-5978(91)90020-
T
Ajzen, I. (2011). The theory of planned behaviour: Reactions and reflections. Psychology
and Health, 26(9), 1113–1127. https://doi.org/10.1080/08870446.2011.613995
Armitage, C. J., & Conner, M. (2001). Efficacy of the theory of planned behaviour: A
meta-analytic review. British Journal of Social Psychology, 40(4), 471–499.
https://doi.org/10.1348/014466601164939
Arsić, M., Nikolić, D., Živković, Z. ivan, Urošević, S., & Mihajlović, I. (2012). The effect
of TQM on employee loyalty in transition economy, Serbia. Total Quality
Management and Business Excellence, 23(5–6), 719–729.
https://doi.org/10.1080/14783363.2012.669930
Au-Yong, C. P., Ali, A. S., Ahmad, F., & Chua, S. J. L. (2017). Influences of key
stakeholders’ involvement in maintenance management. Property Management,
35(2), 217–231. https://doi.org/10.1108/PM-01-2016-0004
Boxall, P., & Winterton, J. (2018). Which conditions foster high-involvement work
processes? A synthesis of the literature and agenda for research. Economic and
Industrial Democracy, 39(1), 27–47. https://doi.org/10.1177/0143831X15599584
Cenfetelli, & Bassellier. (2009). Interpretation of Formative Measurement in Information
Systems Research. MIS Quarterly, 33(4), 689–707.
https://doi.org/10.2307/20650323
Chin, W. W. (1998). The partial least squares approach for structural equation modeling.
In G. A. Marcoulides (Ed.), Modern methods for business research (pp. 295–336).
Mahwah, NJ, US: Lawrence Erlbaum Associates Publishers.
https://doi.org/10.1016/j.aap.2008.12.010
Conner, M., & Armitage, C. J. (2005). Theory of planned bahviour and the reasoned
action approach. Predicting Health Behaviour, 1429–1464.
https://doi.org/10.1111/j.1559-1816.1998.tb01685.x
Dahlgaard-park, S. M. (2012). Core values – the entrance to human satisfaction and
commitment. Total Quality Management & Business Excellence, 23(2), 125–140.
https://doi.org/10.1080/14783363.2012.655067
Dweck, C. S. (2009). Mindsets: Developing Talent Through a Growth Mindset. Olympic
Coach, 21(1), 4–7. https://doi.org/10.1186/1479-5868-10-98
Elorza, U., Aritzeta, A., & Ayestarán, S. (2011). Exploring the black box in spanish firms:
The effect of the actual and perceived system on employees’ commitment and
organizational performance. International Journal of Human Resource
Management, 22(7), 1401–1422. https://doi.org/10.1080/09585192.2011.561956
Elorza, U., Harris, C., Aritzeta, A., & Balluerka, N. (2016). The effect of management
and employee perspectives of high-performance work systems on employees’
discretionary behaviour. Personnel Review, 45(1), 121–141.
https://doi.org/10.1108/PR-07-2014-0167
Falk, R., & Miller, N. B. (1992). A Primer for Soft Modeling. Akron, OH, US: University
of Akron Press. https://doi.org/10.2478/v10175-011-0060-8
Fornell, C., & Larcker, D. F. (1981). Evaluating Structural Equation Models with
Unobservable Variables and Measurement Error. Journal of Marketing Research,
18(1), 39–50. https://doi.org/10.2307/3151312
Fu, S.-L., Chou, S.-Y., Chen, C.-K., & Wang, C.-W. (2015). Assessment and cultivation
of total quality management organisational culture – an empirical investigation.
Total Quality Management & Business Excellence, 26(1–2), 123–139.
https://doi.org/10.1080/14783363.2014.970760
Galeazzo, A., Furlan, A., & Vinelli, A. (2017). The organizational infrastructure of
continuous improvement – an empirical analysis. Operations Management
Research, 10(1–2), 33–46. https://doi.org/10.1007/s12063-016-0112-1
García-Arca, J., & Prado-Prado, J. C. (2011). Systematic personnel participation for
logistics improvement: A case study. Human Factors and Ergonomics In
Manufacturing, 21(2), 209–223. https://doi.org/10.1002/hfm.20246
García-Sabater, J., Marín-García, J., & Perello-Marin, R. (2011). Is Implementation of
Continuous Improvement Possible? An Evolutionary Model of Enablers and
Inhibitors. Human Factors and Ergonomics in Manufacturing & Service Industries,
22(2), 99–112. https://doi.org/10.1002/hfm.20262
41
García, J. L., Maldonado, A. a., Alvarado, A., & Rivera, D. G. (2014). Human critical
success factors for kaizen and its impacts in industrial performance. International
Journal of Advanced Manufacturing Technology, 70(9–12), 2187–2198.
https://doi.org/10.1007/s00170-013-5445-4
Gibson, C. B., Porath, C. L., Benson, G. S., & Lawler, E. E. (2007). What Results When
Firms Implement Practices: The Differential Relationship Between Specific
Practices, Firm Financial Performance, Customer Service, and Quality. Journal of
Applied Psychology. https://doi.org/10.1037/0021-9010.92.6.1467
Gonzalez Aleu, F., & Van Aken, E. M. (2016). Systematic literature review of critical
success factors for continuous improvement projects. International Journal of Lean
Six Sigma, 7(3), 214–232. https://doi.org/10.1108/IJLSS-06-2015-0025
Hair, J. F., Thomas, G. M. H., Ringle, C., & Sarstedt, M. (2014). A Primer on Partial
Least Squares Structural Equation Modeling (PLS-SEM). Thousand Oaks: Sage.
https://doi.org/10.1016/j.lrp.2013.01.002
Henseler, J., Ringle, C. M., & Sinkovics, R. R. (2009). The use of partial least squares
path modeling in international marketing. Advances in International Marketing, 20,
277–319. https://doi.org/10.1108/S1474-7979(2009)0000020014
Holmemo, M. D. Q., & Ingvaldsen, J. a. (2016). Bypassing the dinosaurs? – How middle
managers become the missing link in lean implementation. Total Quality
Management and Business Excellence, 27(11–12), 1332–1345.
https://doi.org/10.1080/14783363.2015.1075876
Jaca, C. (2011). Modelo de evaluación para la sostenibilidad de los equipos de mejora.
Universidad de Navarra.
Jaca, C., Viles, E., Mateo, R., & Santos, J. (2012). Components of sustainable
improvement systems: Theory and practice. TQM Journal, 24(2), 142–154.
https://doi.org/10.1108/17542731211215080
Juarez-Tarraga, A., Marin-García, J. A., & Santandreu-Mascarell, C. (2016).
Comprobación de un modelo de medida de High Involvement Work Programs
(HIWP) y de su capacidad predictiva de los resultados percibidos por el mando.
Intangible Capital, 12(5), 1308–1400. Retrieved from
http://www.redalyc.org/articulo.oa?id=54900305
Jurburg, D., Viles, E., Mateo, R., Tanco, M., & Lleo, A. (n.d.). Understanding employees’
participation in continuous improvement: Towards a Continuous Improvement
Acceptance Model. TQM Journal.
Jurburg, D., Viles, E., Tanco, M., & Mateo, R. (2017). What motivates employees to
participate in continuous improvement activities? Total Quality Management and
Business Excellence, 28(13–14), 1469–1488.
https://doi.org/10.1080/14783363.2016.1150170
Jurburg Melnik, D. A. (2016). Continuous Improvement Acceptance Model (CIAM):
Towards understanding employee participation.
Kaye, M., & Anderson, R. (1999). Continuous improvement: The ten essential criteria.
International Journal of Quality and Reliability Management, 16(5), 485–506.
https://doi.org/10.1108/02656719910249801
Lam, M., O’Donnell, M., & Robertson, D. (2015). Achieving employee commitment for
continuous improvement initiatives. International Journal of Operations &
Production Management, 35(2), 201–215. https://doi.org/10.1108/IJOPM-03-2013-
0134
Marin-Garcia, J. A., & Bonavia, T. (2015). Relationship between employee involvement
and lean manufacturing and its effect on performance in a rigid continuous process
industry. International Journal of Production Research, 53(11), 3260–3275.
https://doi.org/10.1080/00207543.2014.975852
Mathieson, K. (1991). Predicting user intentions: Comparing the technology acceptance
model with the theory of planned behavior. Information Systems Research, 2(3),
173–191. https://doi.org/10.1287/isre.2.3.173
Nunnally, J., & Bernstein, I. (1994). Psychometric Theory. New York, NY, US: McGraw-
Hill. https://doi.org/10.1007/978-1-4020-9173-5_8
Paipa Galeano, L. (2013). Diseño y validación de un nuevo programa para impulsar la
mejora continua desde el enfoque científico de las 5Ss. Spain.
Poksinska, B., Swartling, D., & Drotz, E. (2013). The daily work of Lean leaders - lessons
from manufacturing and healthcare. Total Quality Management and Business
Excellence, 24(7–8), 886–898. https://doi.org/10.1080/14783363.2013.791098
43
Rahmat, I., & Ali, A. S. (2010). The involvement of the key participants in the production
of project plans and the planning performance of refurbishment projects. Journal of
Building Appraisal, 5(3), 273–288. https://doi.org/10.1057/jba.2009.34
Rapp, C., & Eklund, J. (2007). Sustainable development of a suggestion system: Factors
influencing improvement activities in a confectionary company. Human Factors and
Ergonomics In Manufacturing, 17(1), 79–94. https://doi.org/10.1002/hfm.20064
Rey, C. (2011). La misión en la empresa.
Ringle, C., Wende, S., & Becker, J. (2015). SmartPLS 3.2.4. Boenningstedt: SmartPLS
Gmbh. https://doi.org/http://www.smartpls.com
Singh, J., & Singh, H. (2015). Continuous improvement philosophy – literature review
and directions. Benchmarking, 22(1), 75–119. https://doi.org/10.1108/BIJ-06-2012-
0038
Stone, M. (1974). Cross-Validatory Choice and Assessment of Statistical Predictions.
Journal of the Royal Statistical Society. Series B (Methodological), 36(2), 111–147.
https://doi.org/10.2307/2984809
Straatmann, T., Rothenhöfer, L. M., Meier, A., & Mueller, K. (2018). A Configurational
Perspective on the Theory of Planned Behaviour to Understand Employees’ Change-
Supportive Intentions. Applied Psychology, 67(1), 91–135.
https://doi.org/10.1111/apps.12120
Tang, Z., Chen, X., & Wu, Z. (2010). Using behavior theory to investigate individual-
level determinants of employee involvement in TQM. Total Quality Management
and Business Excellence, 21(12), 1231–1260.
https://doi.org/10.1080/14783363.2010.530794
Tesluk, P. E., & Vance, R. J. (1999). in the Context of Participative Work Environments.
Group & Organization Management, 24(3), 271–299.
Turkulainen, V., & Ketokivi, M. (2012). Cross-functional integration and performance:
What are the real benefits? International Journal of Operations and Production
Management, 32(4), 447–467. https://doi.org/10.1108/01443571211223095
Vandenberg, R. J., Richardson, H. A., & Eastman, L. J. (1999). The Impact of High
Involvement Work Processes on Organizational Effectiveness. Group &
Organization Management, 24(3), 300–339.
https://doi.org/10.1177/1059601199243004
Viles, E., Jurburg, D., Lleó, A., Tanco, M., & Mateo, R. (2016). Tool for Analyzing
Participation in Continuous Improvement. Dyna (Spain), 31(3), 250.
https://doi.org/10.6036/7903
Yan, B., & Makinde, O. D. (2011). Impact of continuous improvement on new product
development within SMEs in the Western Cape, South Africa. African Journal of
Business Management, 5(6), 2220–2229. https://doi.org/10.5897/AJBM10.728
Yen-Tsang, C., Csillag, J. M., & Siegler, J. (2012). Theory of Reasoned Action for
continuous improvement capabilities: a behavioral approach. Revista de
Administraçao de Empresas.
45
Anexo 1: Tabla de relaciones basada en la literatura
Antecedent Consequent References
Active listening MMT Poksinska et al, 2013; van Dun et al.,
2017
Actual system Perceived system Elorza et al., 2011
Attitudes
Behaviours Tang et al, 2010
Outcomes
Barney et al., 2001; Jackson et al., 1989;
Wright & McMahan, 1992; Madinabeitia,
2016
Behaviours Outcomes
Barney et al., 2001; Jackson et al., 1989;
Wright & McMahan, 1992; Madinabeitia,
2016
Blaming Commitment
(negative) Angelis et al., 2012
Bureaucracy
Empowerment
(negative)
Gallie et al., 2004; Green, 2006; Boxall
& Winterton, 2018
Job satisfaction
(negative)
Boxall & Winterton, 2018; Gallie et al.,
2004; Green, 2006
Capital-intensive Involvement Boxall & Winterton, 2018
CI Alignment Sustainability Spackman, 2009; Brunet & New, 2003
CI Experience Resistance to
change (negative) García-Sabater et al., 2011
Commitment
Absenteeism
(negative) Elorza et al, 2011
CI Alignment Adler, 1993; Womack et al., 1990;
Schonberger, 2007; Angelis et al, 2012
Participation Lam, 2015
ROE
Vanderberg et al, 1999; Lapierre &
Hackett, 2007; Whitman, Van Rooy &
Viswesvaran, 2010
Turnover Vanderberg et al, 1999
Communication
Involvement
Benson & Lawler 2005; Lawler 1991;
MacDuffie 1995; Marin-Garcia &
Bonavia, 2015
Job satisfaction Rahmat & Ali, 2010; Au-Yong et al.,
2017
Participation Fu et al, 2015
Self-efficacy Gibson et al., 2007; Marin-Garcia &
Bonavia, 2015
Strategy Irani et al., 2004
Teamwork Rahmat & Ali, 2010; Au-Yong et al.,
2017
Trust Reiche, Cardona & Lee, 2014
Company size
Empowerment
(negative)
Boxall & Winterton, 2018; Delbridge and
Whitfield, 2001; Ortega, 2009
Self-efficacy
(negative)
Boxall & Winterton, 2018; Delbridge &
Whitfield, 2001; Ortega, 2009
Core
competencies Commitment Dahlgaard-Park, 2012
Cycle time Commitment Angelis et al., 2011
Empowerment
CI Alignment Gibson et al. 2007; Marin-Garcia &
Bonavia, 2015
Commitment
Appelbaum et al., 2000; Boxall &
Macky, 2014; Vandenberg et al., 1999;
Boxall & Winterton, 2018; Walton, 1985;
Boxall & MacKy, 2009; Angelis et al.,
2011
Communication Spreitzer & Mishra, 1999; Marin-Garcia
& Bonavia, 2015
Involvement
Benson & Lawler 2005; Lawler 1991;
MacDuffie 1995; Marin-Garcia &
Bonavia, 2015
Job satisfaction
Henderson & Lee, 1992; Campion,
Medsker, & Higgs, 1993; Arsic et al,
2012; Appelbaum et al., 2000; Boxall &
Macky, 2014; Vandenberg et al., 1999;
Boxall & Winterton, 2018
Motivation Fu et al, 2015; Herzberg, 1968; Arsic et
al, 2012
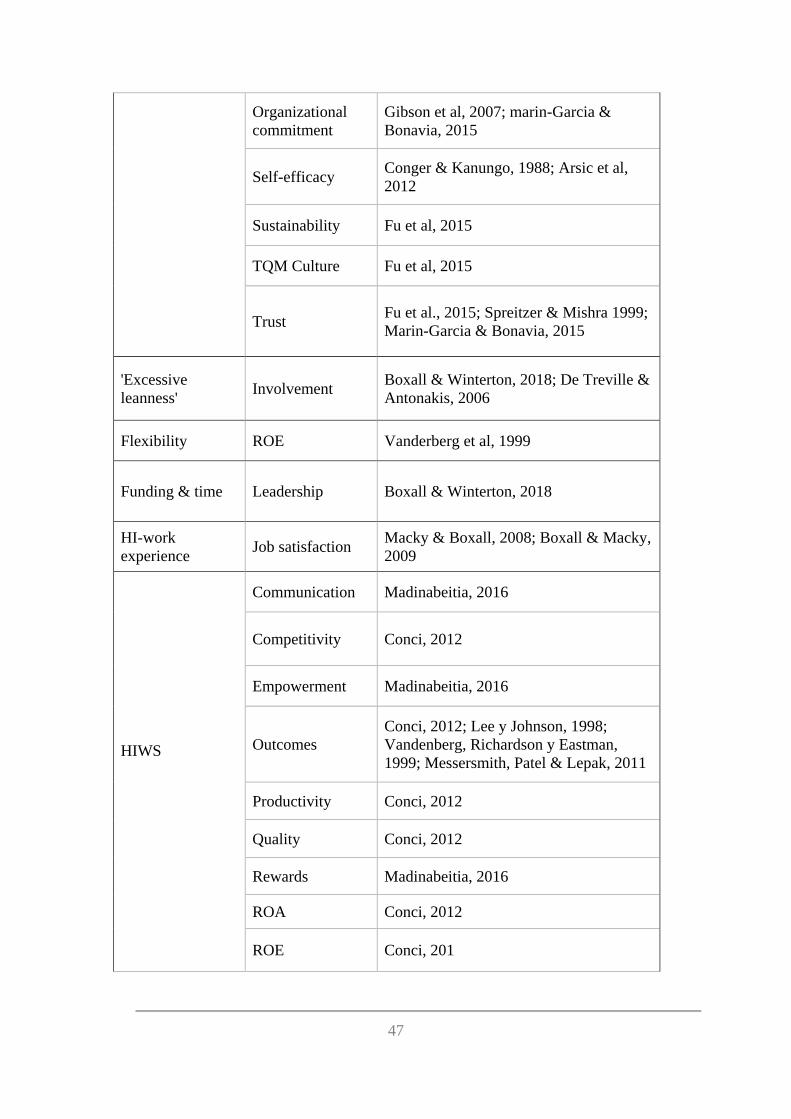
47
Organizational
commitment
Gibson et al, 2007; marin-Garcia &
Bonavia, 2015
Self-efficacy Conger & Kanungo, 1988; Arsic et al,
2012
Sustainability Fu et al, 2015
TQM Culture Fu et al, 2015
Trust Fu et al., 2015; Spreitzer & Mishra 1999;
Marin-Garcia & Bonavia, 2015
'Excessive
leanness' Involvement
Boxall & Winterton, 2018; De Treville &
Antonakis, 2006
Flexibility ROE Vanderberg et al, 1999
Funding & time Leadership Boxall & Winterton, 2018
HI-work
experience Job satisfaction
Macky & Boxall, 2008; Boxall & Macky,
2009
HIWS
Communication Madinabeitia, 2016
Competitivity Conci, 2012
Empowerment Madinabeitia, 2016
Outcomes
Conci, 2012; Lee y Johnson, 1998;
Vandenberg, Richardson y Eastman,
1999; Messersmith, Patel & Lepak, 2011
Productivity Conci, 2012
Quality Conci, 2012
Rewards Madinabeitia, 2016
ROA Conci, 2012
ROE Conci, 201
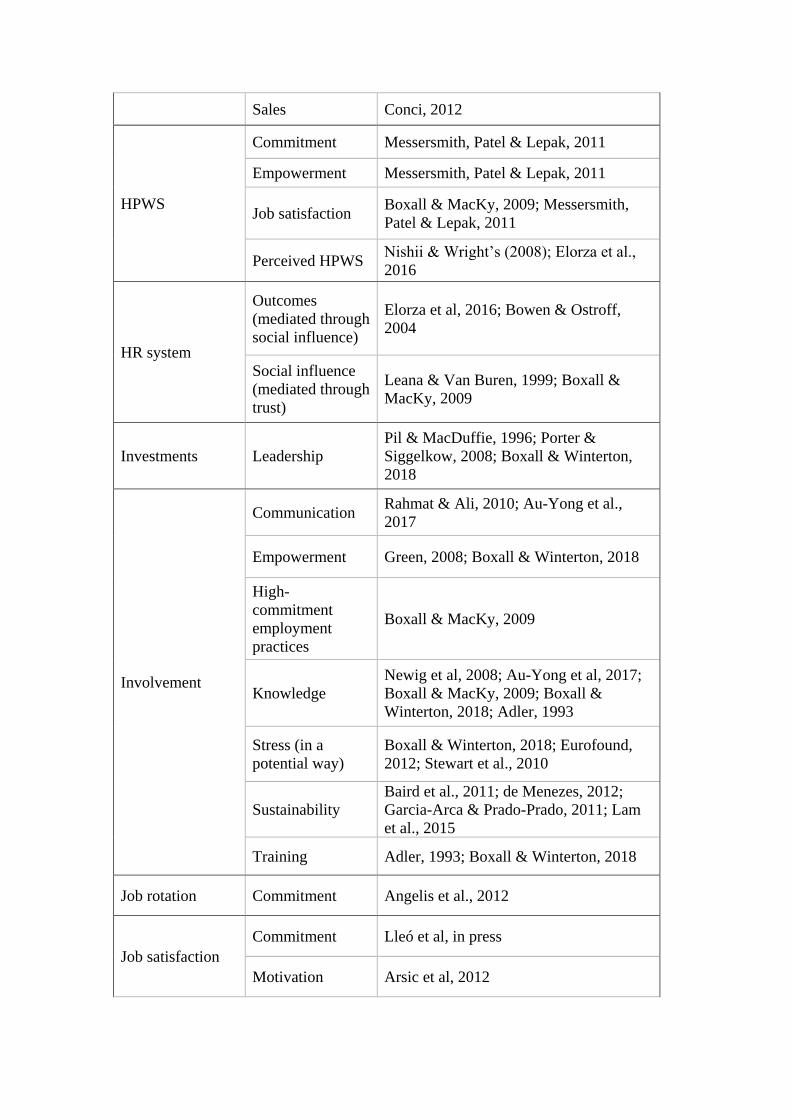
Sales Conci, 2012
HPWS
Commitment Messersmith, Patel & Lepak, 2011
Empowerment Messersmith, Patel & Lepak, 2011
Job satisfaction Boxall & MacKy, 2009; Messersmith,
Patel & Lepak, 2011
Perceived HPWS Nishii & Wright’s (2008); Elorza et al.,
2016
HR system
Outcomes
(mediated through
social influence)
Elorza et al, 2016; Bowen & Ostroff,
2004
Social influence
(mediated through
trust)
Leana & Van Buren, 1999; Boxall &
MacKy, 2009
Investments Leadership
Pil & MacDuffie, 1996; Porter &
Siggelkow, 2008; Boxall & Winterton,
2018
Involvement
Communication Rahmat & Ali, 2010; Au-Yong et al.,
2017
Empowerment Green, 2008; Boxall & Winterton, 2018
High-
commitment
employment
practices
Boxall & MacKy, 2009
Knowledge
Newig et al, 2008; Au-Yong et al, 2017;
Boxall & MacKy, 2009; Boxall &
Winterton, 2018; Adler, 1993
Stress (in a
potential way)
Boxall & Winterton, 2018; Eurofound,
2012; Stewart et al., 2010
Sustainability
Baird et al., 2011; de Menezes, 2012;
Garcia-Arca & Prado-Prado, 2011; Lam
et al., 2015
Training Adler, 1993; Boxall & Winterton, 2018
Job rotation Commitment Angelis et al., 2012
Job satisfaction
Commitment Lleó et al, in press
Motivation Arsic et al, 2012
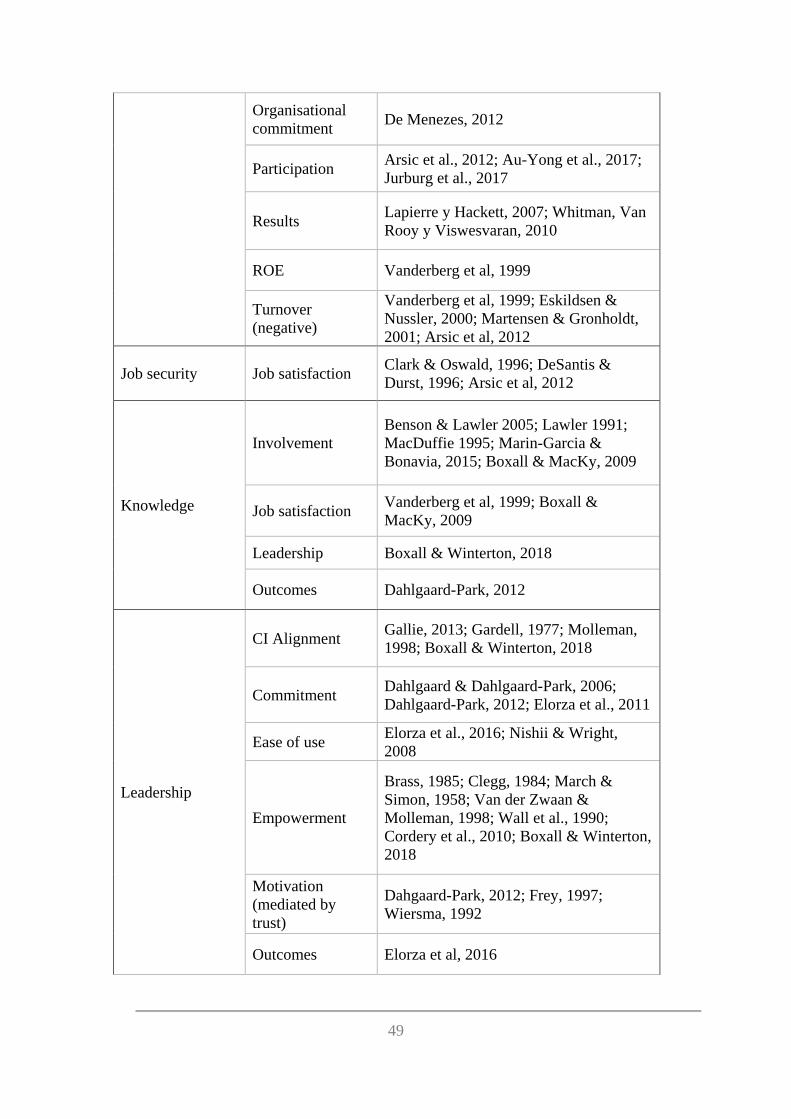
49
Organisational
commitment De Menezes, 2012
Participation Arsic et al., 2012; Au-Yong et al., 2017;
Jurburg et al., 2017
Results Lapierre y Hackett, 2007; Whitman, Van
Rooy y Viswesvaran, 2010
ROE Vanderberg et al, 1999
Turnover
(negative)
Vanderberg et al, 1999; Eskildsen &
Nussler, 2000; Martensen & Gronholdt,
2001; Arsic et al, 2012
Job security Job satisfaction Clark & Oswald, 1996; DeSantis &
Durst, 1996; Arsic et al, 2012
Knowledge
Involvement
Benson & Lawler 2005; Lawler 1991;
MacDuffie 1995; Marin-Garcia &
Bonavia, 2015; Boxall & MacKy, 2009
Job satisfaction Vanderberg et al, 1999; Boxall &
MacKy, 2009
Leadership Boxall & Winterton, 2018
Outcomes Dahlgaard-Park, 2012
Leadership
CI Alignment Gallie, 2013; Gardell, 1977; Molleman,
1998; Boxall & Winterton, 2018
Commitment Dahlgaard & Dahlgaard-Park, 2006;
Dahlgaard-Park, 2012; Elorza et al., 2011
Ease of use Elorza et al., 2016; Nishii & Wright,
2008
Empowerment
Brass, 1985; Clegg, 1984; March &
Simon, 1958; Van der Zwaan &
Molleman, 1998; Wall et al., 1990;
Cordery et al., 2010; Boxall & Winterton,
2018
Motivation
(mediated by
trust)
Dahgaard-Park, 2012; Frey, 1997;
Wiersma, 1992
Outcomes Elorza et al, 2016
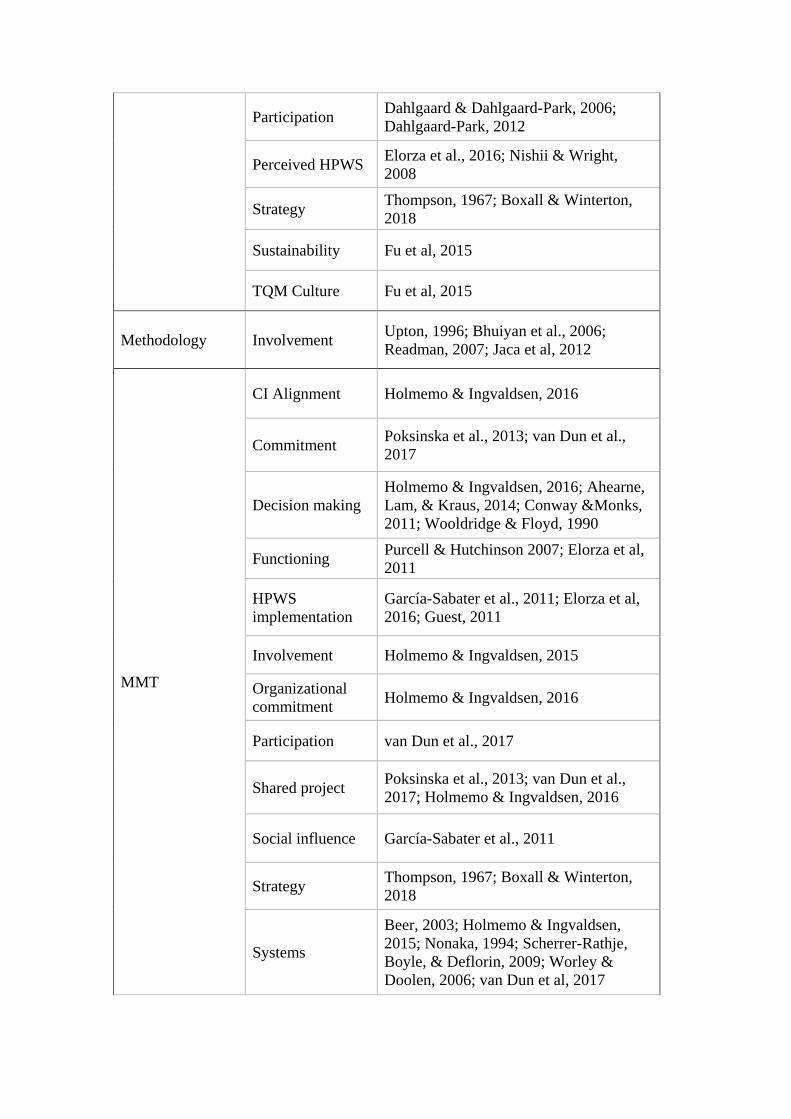
Participation Dahlgaard & Dahlgaard-Park, 2006;
Dahlgaard-Park, 2012
Perceived HPWS Elorza et al., 2016; Nishii & Wright,
2008
Strategy Thompson, 1967; Boxall & Winterton,
2018
Sustainability Fu et al, 2015
TQM Culture Fu et al, 2015
Methodology Involvement Upton, 1996; Bhuiyan et al., 2006;
Readman, 2007; Jaca et al, 2012
MMT
CI Alignment Holmemo & Ingvaldsen, 2016
Commitment Poksinska et al., 2013; van Dun et al.,
2017
Decision making
Holmemo & Ingvaldsen, 2016; Ahearne,
Lam, & Kraus, 2014; Conway &Monks,
2011; Wooldridge & Floyd, 1990
Functioning Purcell & Hutchinson 2007; Elorza et al,
2011
HPWS
implementation
García-Sabater et al., 2011; Elorza et al,
2016; Guest, 2011
Involvement Holmemo & Ingvaldsen, 2015
Organizational
commitment Holmemo & Ingvaldsen, 2016
Participation van Dun et al., 2017
Shared project Poksinska et al., 2013; van Dun et al.,
2017; Holmemo & Ingvaldsen, 2016
Social influence García-Sabater et al., 2011
Strategy Thompson, 1967; Boxall & Winterton,
2018
Systems
Beer, 2003; Holmemo & Ingvaldsen,
2015; Nonaka, 1994; Scherrer-Rathje,
Boyle, & Deflorin, 2009; Worley &
Doolen, 2006; van Dun et al, 2017
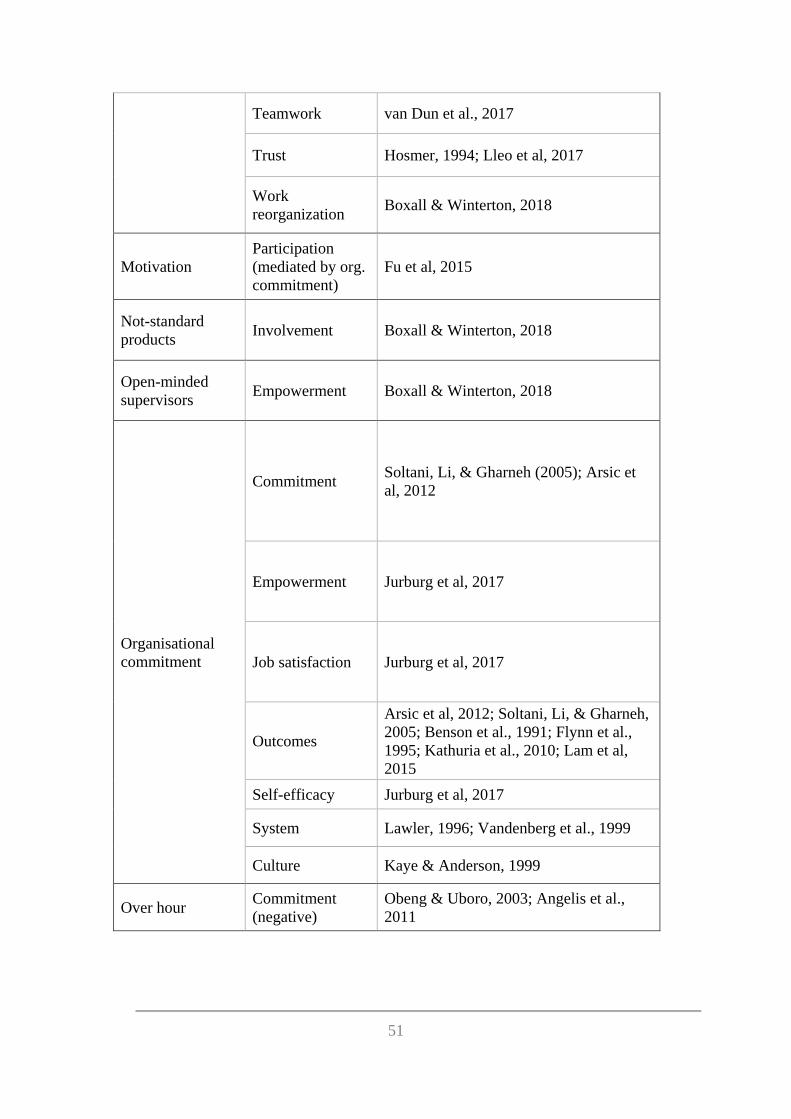
51
Teamwork van Dun et al., 2017
Trust Hosmer, 1994; Lleo et al, 2017
Work
reorganization Boxall & Winterton, 2018
Motivation
Participation
(mediated by org.
commitment)
Fu et al, 2015
Not-standard
products Involvement Boxall & Winterton, 2018
Open-minded
supervisors Empowerment Boxall & Winterton, 2018
Organisational
commitment
Commitment Soltani, Li, & Gharneh (2005); Arsic et
al, 2012
Empowerment Jurburg et al, 2017
Job satisfaction Jurburg et al, 2017
Outcomes
Arsic et al, 2012; Soltani, Li, & Gharneh,
2005; Benson et al., 1991; Flynn et al.,
1995; Kathuria et al., 2010; Lam et al,
2015
Self-efficacy Jurburg et al, 2017
System Lawler, 1996; Vandenberg et al., 1999
Culture Kaye & Anderson, 1999
Over hour Commitment
(negative)
Obeng & Uboro, 2003; Angelis et al.,
2011
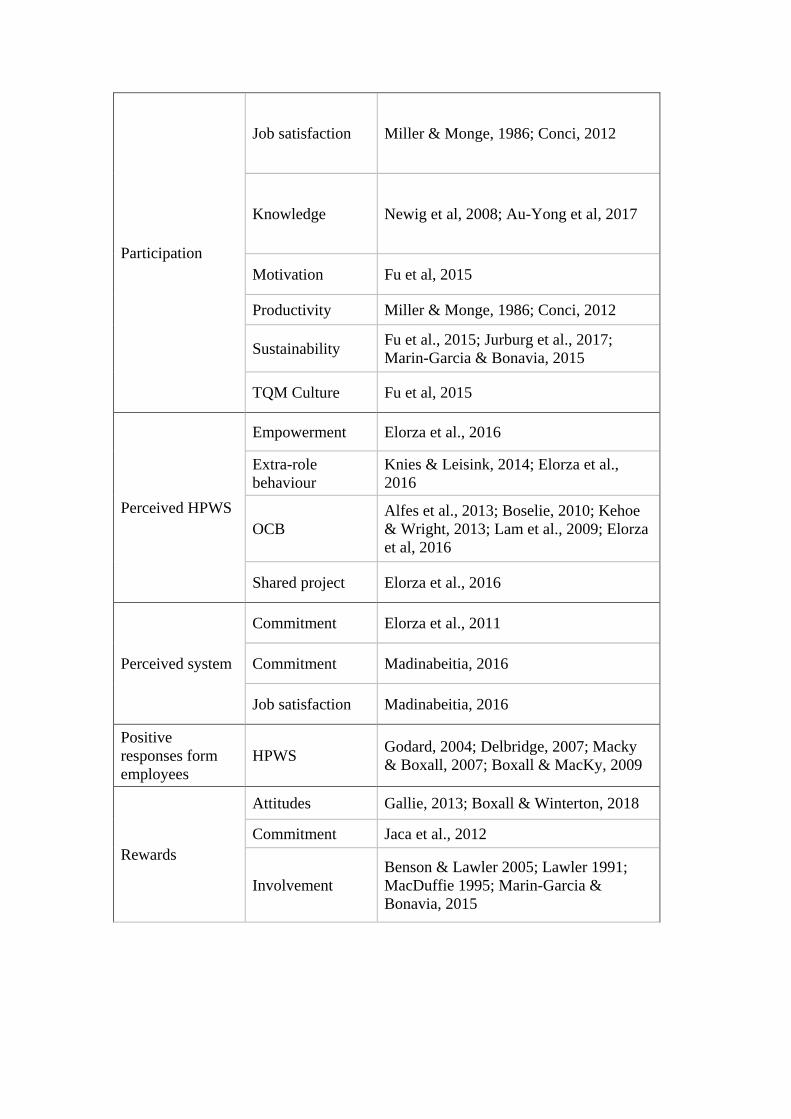
Participation
Job satisfaction Miller & Monge, 1986; Conci, 2012
Knowledge Newig et al, 2008; Au-Yong et al, 2017
Motivation Fu et al, 2015
Productivity Miller & Monge, 1986; Conci, 2012
Sustainability Fu et al., 2015; Jurburg et al., 2017;
Marin-Garcia & Bonavia, 2015
TQM Culture Fu et al, 2015
Perceived HPWS
Empowerment Elorza et al., 2016
Extra-role
behaviour
Knies & Leisink, 2014; Elorza et al.,
2016
OCB
Alfes et al., 2013; Boselie, 2010; Kehoe
& Wright, 2013; Lam et al., 2009; Elorza
et al, 2016
Shared project Elorza et al., 2016
Perceived system
Commitment Elorza et al., 2011
Commitment Madinabeitia, 2016
Job satisfaction Madinabeitia, 2016
Positive
responses form
employees
HPWS Godard, 2004; Delbridge, 2007; Macky
& Boxall, 2007; Boxall & MacKy, 2009
Rewards
Attitudes Gallie, 2013; Boxall & Winterton, 2018
Commitment Jaca et al., 2012
Involvement
Benson & Lawler 2005; Lawler 1991;
MacDuffie 1995; Marin-Garcia &
Bonavia, 2015
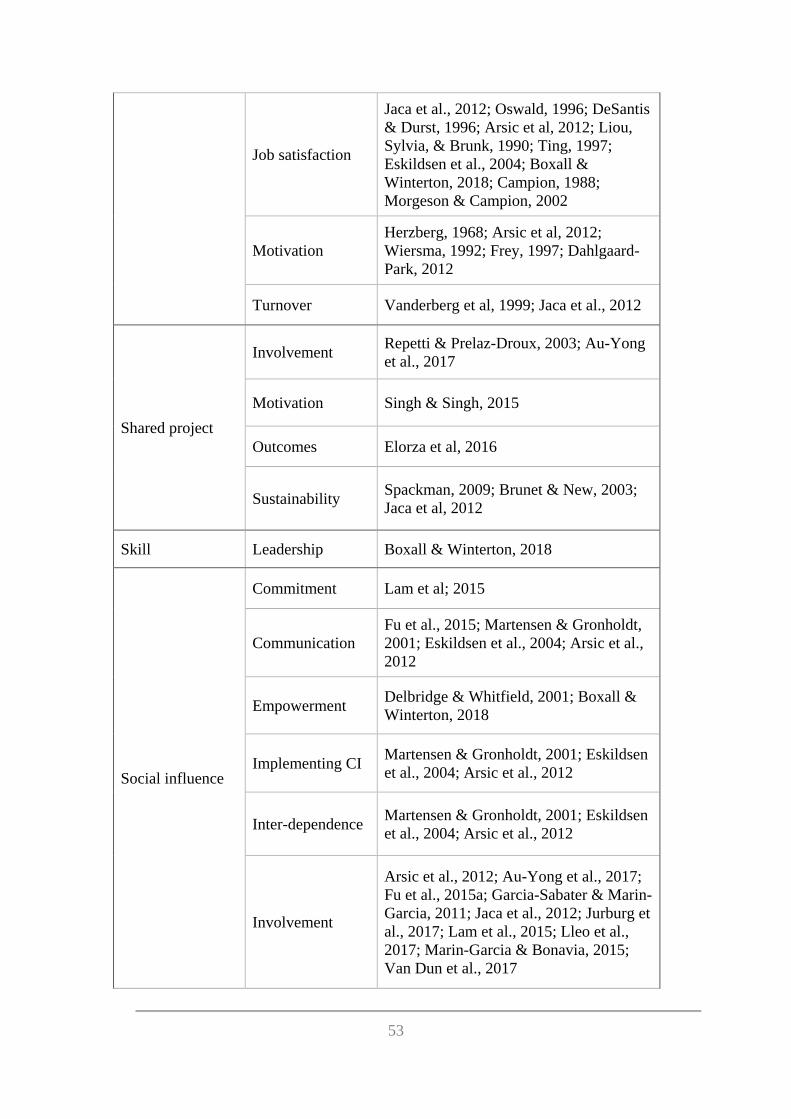
53
Job satisfaction
Jaca et al., 2012; Oswald, 1996; DeSantis
& Durst, 1996; Arsic et al, 2012; Liou,
Sylvia, & Brunk, 1990; Ting, 1997;
Eskildsen et al., 2004; Boxall &
Winterton, 2018; Campion, 1988;
Morgeson & Campion, 2002
Motivation
Herzberg, 1968; Arsic et al, 2012;
Wiersma, 1992; Frey, 1997; Dahlgaard-
Park, 2012
Turnover Vanderberg et al, 1999; Jaca et al., 2012
Shared project
Involvement Repetti & Prelaz-Droux, 2003; Au-Yong
et al., 2017
Motivation Singh & Singh, 2015
Outcomes Elorza et al, 2016
Sustainability Spackman, 2009; Brunet & New, 2003;
Jaca et al, 2012
Skill Leadership Boxall & Winterton, 2018
Social influence
Commitment Lam et al; 2015
Communication
Fu et al., 2015; Martensen & Gronholdt,
2001; Eskildsen et al., 2004; Arsic et al.,
2012
Empowerment Delbridge & Whitfield, 2001; Boxall &
Winterton, 2018
Implementing CI Martensen & Gronholdt, 2001; Eskildsen
et al., 2004; Arsic et al., 2012
Inter-dependence Martensen & Gronholdt, 2001; Eskildsen
et al., 2004; Arsic et al., 2012
Involvement
Arsic et al., 2012; Au-Yong et al., 2017;
Fu et al., 2015a; Garcia-Sabater & Marin-
Garcia, 2011; Jaca et al., 2012; Jurburg et
al., 2017; Lam et al., 2015; Lleo et al.,
2017; Marin-Garcia & Bonavia, 2015;
Van Dun et al., 2017
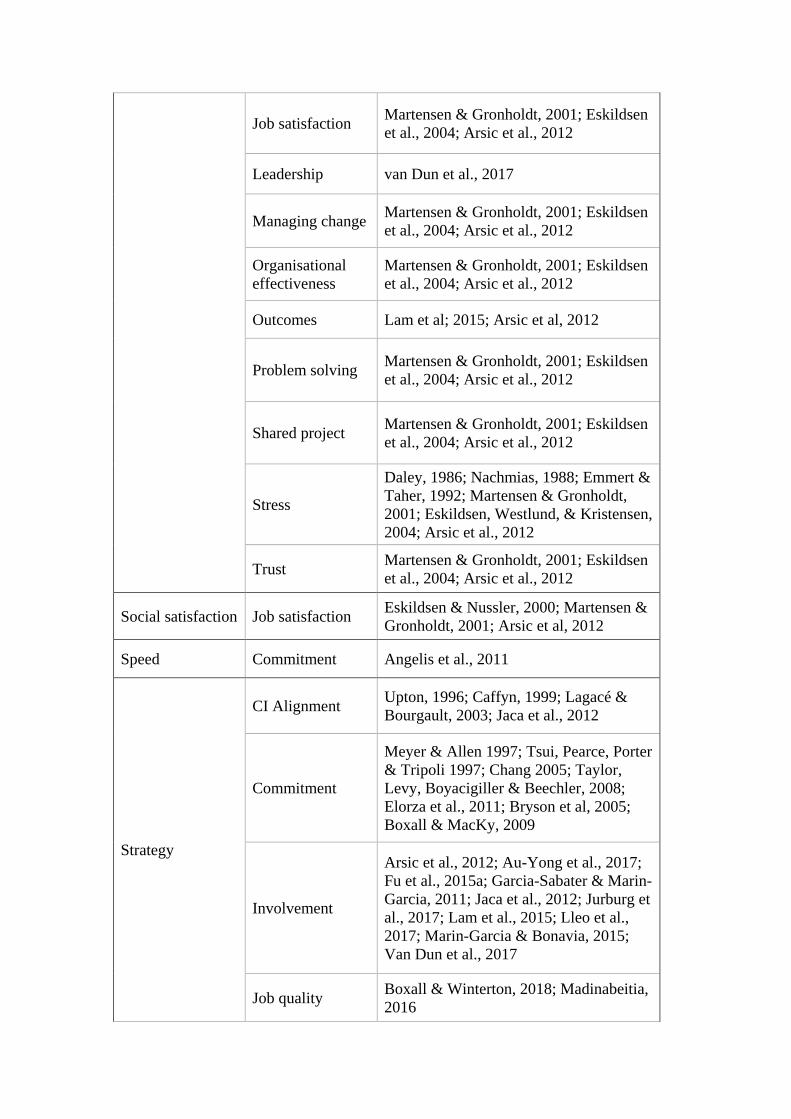
Job satisfaction Martensen & Gronholdt, 2001; Eskildsen
et al., 2004; Arsic et al., 2012
Leadership van Dun et al., 2017
Managing change Martensen & Gronholdt, 2001; Eskildsen
et al., 2004; Arsic et al., 2012
Organisational
effectiveness
Martensen & Gronholdt, 2001; Eskildsen
et al., 2004; Arsic et al., 2012
Outcomes Lam et al; 2015; Arsic et al, 2012
Problem solving Martensen & Gronholdt, 2001; Eskildsen
et al., 2004; Arsic et al., 2012
Shared project Martensen & Gronholdt, 2001; Eskildsen
et al., 2004; Arsic et al., 2012
Stress
Daley, 1986; Nachmias, 1988; Emmert &
Taher, 1992; Martensen & Gronholdt,
2001; Eskildsen, Westlund, & Kristensen,
2004; Arsic et al., 2012
Trust Martensen & Gronholdt, 2001; Eskildsen
et al., 2004; Arsic et al., 2012
Social satisfaction Job satisfaction Eskildsen & Nussler, 2000; Martensen &
Gronholdt, 2001; Arsic et al, 2012
Speed Commitment Angelis et al., 2011
Strategy
CI Alignment Upton, 1996; Caffyn, 1999; Lagacé &
Bourgault, 2003; Jaca et al., 2012
Commitment
Meyer & Allen 1997; Tsui, Pearce, Porter
& Tripoli 1997; Chang 2005; Taylor,
Levy, Boyacigiller & Beechler, 2008;
Elorza et al., 2011; Bryson et al, 2005;
Boxall & MacKy, 2009
Involvement
Arsic et al., 2012; Au-Yong et al., 2017;
Fu et al., 2015a; Garcia-Sabater & Marin-
Garcia, 2011; Jaca et al., 2012; Jurburg et
al., 2017; Lam et al., 2015; Lleo et al.,
2017; Marin-Garcia & Bonavia, 2015;
Van Dun et al., 2017
Job quality Boxall & Winterton, 2018; Madinabeitia,
2016
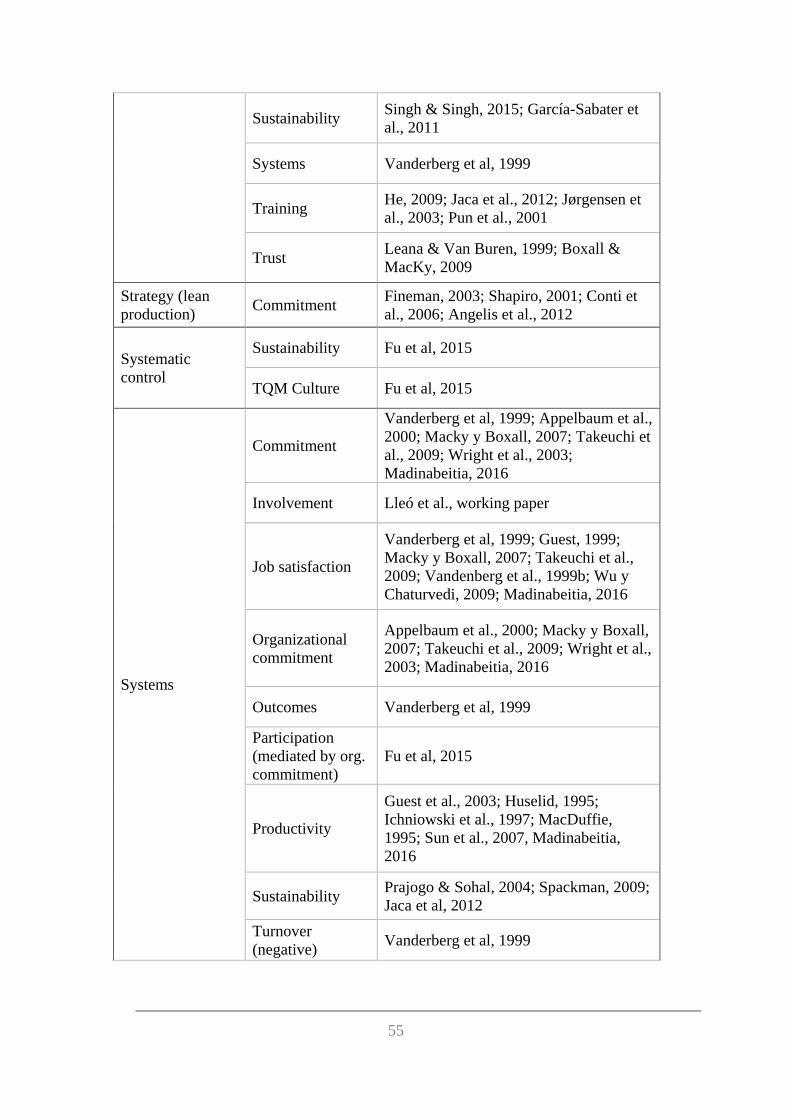
55
Sustainability Singh & Singh, 2015; García-Sabater et
al., 2011
Systems Vanderberg et al, 1999
Training He, 2009; Jaca et al., 2012; Jørgensen et
al., 2003; Pun et al., 2001
Trust Leana & Van Buren, 1999; Boxall &
MacKy, 2009
Strategy (lean
production) Commitment
Fineman, 2003; Shapiro, 2001; Conti et
al., 2006; Angelis et al., 2012
Systematic
control
Sustainability Fu et al, 2015
TQM Culture Fu et al, 2015
Systems
Commitment
Vanderberg et al, 1999; Appelbaum et al.,
2000; Macky y Boxall, 2007; Takeuchi et
al., 2009; Wright et al., 2003;
Madinabeitia, 2016
Involvement Lleó et al., working paper
Job satisfaction
Vanderberg et al, 1999; Guest, 1999;
Macky y Boxall, 2007; Takeuchi et al.,
2009; Vandenberg et al., 1999b; Wu y
Chaturvedi, 2009; Madinabeitia, 2016
Organizational
commitment
Appelbaum et al., 2000; Macky y Boxall,
2007; Takeuchi et al., 2009; Wright et al.,
2003; Madinabeitia, 2016
Outcomes Vanderberg et al, 1999
Participation
(mediated by org.
commitment)
Fu et al, 2015
Productivity
Guest et al., 2003; Huselid, 1995;
Ichniowski et al., 1997; MacDuffie,
1995; Sun et al., 2007, Madinabeitia,
2016
Sustainability Prajogo & Sohal, 2004; Spackman, 2009;
Jaca et al, 2012
Turnover
(negative) Vanderberg et al, 1999
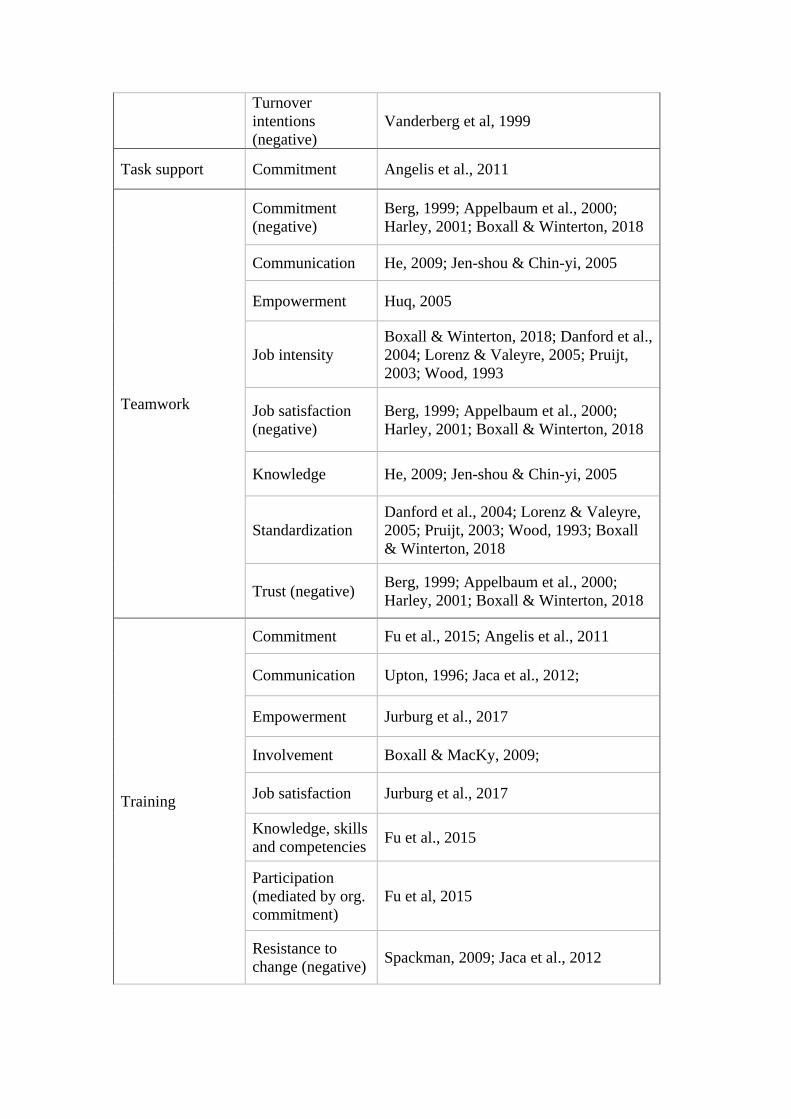
Turnover
intentions
(negative)
Vanderberg et al, 1999
Task support Commitment Angelis et al., 2011
Teamwork
Commitment
(negative)
Berg, 1999; Appelbaum et al., 2000;
Harley, 2001; Boxall & Winterton, 2018
Communication He, 2009; Jen-shou & Chin-yi, 2005
Empowerment Huq, 2005
Job intensity
Boxall & Winterton, 2018; Danford et al.,
2004; Lorenz & Valeyre, 2005; Pruijt,
2003; Wood, 1993
Job satisfaction
(negative)
Berg, 1999; Appelbaum et al., 2000;
Harley, 2001; Boxall & Winterton, 2018
Knowledge He, 2009; Jen-shou & Chin-yi, 2005
Standardization
Danford et al., 2004; Lorenz & Valeyre,
2005; Pruijt, 2003; Wood, 1993; Boxall
& Winterton, 2018
Trust (negative) Berg, 1999; Appelbaum et al., 2000;
Harley, 2001; Boxall & Winterton, 2018
Training
Commitment Fu et al., 2015; Angelis et al., 2011
Communication Upton, 1996; Jaca et al., 2012;
Empowerment Jurburg et al., 2017
Involvement Boxall & MacKy, 2009;
Job satisfaction Jurburg et al., 2017
Knowledge, skills
and competencies Fu et al., 2015
Participation
(mediated by org.
commitment)
Fu et al, 2015
Resistance to
change (negative) Spackman, 2009; Jaca et al., 2012
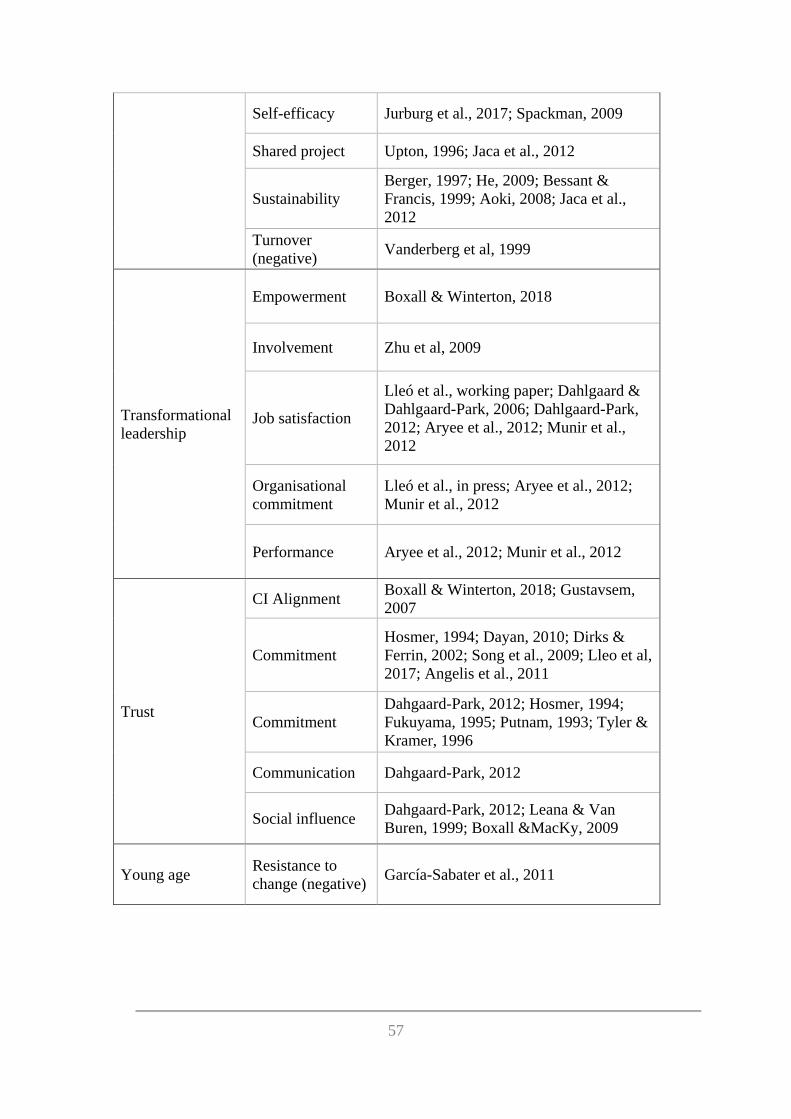
57
Self-efficacy Jurburg et al., 2017; Spackman, 2009
Shared project Upton, 1996; Jaca et al., 2012
Sustainability
Berger, 1997; He, 2009; Bessant &
Francis, 1999; Aoki, 2008; Jaca et al.,
2012
Turnover
(negative) Vanderberg et al, 1999
Transformational
leadership
Empowerment Boxall & Winterton, 2018
Involvement Zhu et al, 2009
Job satisfaction
Lleó et al., working paper; Dahlgaard &
Dahlgaard-Park, 2006; Dahlgaard-Park,
2012; Aryee et al., 2012; Munir et al.,
2012
Organisational
commitment
Lleó et al., in press; Aryee et al., 2012;
Munir et al., 2012
Performance Aryee et al., 2012; Munir et al., 2012
Trust
CI Alignment Boxall & Winterton, 2018; Gustavsem,
2007
Commitment
Hosmer, 1994; Dayan, 2010; Dirks &
Ferrin, 2002; Song et al., 2009; Lleo et al,
2017; Angelis et al., 2011
Commitment
Dahgaard-Park, 2012; Hosmer, 1994;
Fukuyama, 1995; Putnam, 1993; Tyler &
Kramer, 1996
Communication Dahgaard-Park, 2012
Social influence Dahgaard-Park, 2012; Leana & Van
Buren, 1999; Boxall &MacKy, 2009
Young age Resistance to
change (negative) García-Sabater et al., 2011