Embed Size (px)
Citation preview

Dear Friends,
I am happy to share with the readers that we had received overwhelming
response to the PRDC inaugural issue of the newsletter. Encouraging feedbacks
have been received towards the overall content of the newsletter. The second
issue of the PRDC newsletter is in your hands and I thank all who have contributed
directly or indirectly to this issue. During the launch of the PRDC newsletter,
members from the press were eager to know the financial healthiness of the
distribution companies. I thought of sharing my views here.
It is well known fact that maximum cash outflow of any distribution company is in the power purchase.
About 85% of the annual expenses of the distribution company are towards the power purchase, while the
balance is for other charges like establishment (salary/wages), administrative & general expenses, O&M,
depreciation & interest charges. The distribution companies should plan their long term energy
requirement through proper load forecasting techniques and lineup with the generation companies to
meet this demand to reduce their power purchase cost. At least 95% of the energy requirement should be
met by long term power purchase agreements. To account for the un-certainties in the load forecast and
shortfall due to un-expected breakdown in the power plants, balance 5% of the energy can be bought
through short term purchases. Let us understand the problem through an illustration. As we all know, the
street vegetable vendor borrows say, Rs. 100 in the morning from the money lender and ends up paying
Rs. 110 at the end of the day, the whooping interest rate of 3650% per annum!!!. A petty shop owner
borrows say, Rs. 100 in the beginning of the month and ends up paying Rs. 110 at the end of the month.
Interest rate works out to 120% per annum. A shrewd businessman borrows say, Rs. 100 in the beginning
of the year and ends up paying Rs. 110 at the year end, an acceptable interest rate of 10% per annum. This
clearly illustrates that the short term power purchase is always expensive. Proper demand forecasting and
planning the energy requirement is lacking in most of the distribution companies in India. This results in
short term power purchase at higher rates or installation of expensive diesel or barge mounted generator
sets. Some of the steps to be taken up by the distribution companies to improve the financial healthiness
are:
• Conducting load forecasting studies to determine the peak power and the energy requirement of
the company, year on year for next 10 years.
• To determine the demand and supply gap year on year, based on committed power purchase
agreements and to fill the gap with the help of long term power purchases.
• To prepare the business plan in line with the demand requirement which includes the system
augmentation plan and the capital investment to meet the increasing demand.
• To arrive at short term and long term network improvement schemes and prioritizing the
investment based on techno-economic feasibility studies.
PRDC has already extended its services to distribution companies in these aspects and further would like
to associate as and when required.
I wish all the readers, their families and friends season’s greetings and happy and prosperous New Year
2012.
Dr. R. Nagaraja
Managing Director
Inside This Issue
From MD’s Desk
Consultancy Services Rendered
Discussion Paper
Events
Technical Paper
Events and Achievements
Our Expertise in Training
Our Products
PDU – Phase Detection Unit
Editorial Board
Advisor:
Dr. R. Nagaraja
Editor:
M. M. Babu Narayanan
Members:
Venkatesh H. R.
Sandhya R. J.
Ch. Vijay Krishna Rao
Rakesha H. S.
Pranati Mohanty
From MD’s Desk

PRDC News Page 2
Puri is one of the international tourist
places in India. Lakhs of pilgrims across the
country and abroad visit Puri every day.
The inflow to Puri city is increasing day by
day, consequently load demand is also
increasing. During Rathyatra and Sunabesa
more than 10 Lakhs people assemble on
Grand Road to witness the occasion. The
existing OH system of power supply in
Grand Road and surrounding the temple is
unsafe and also aesthetically not
appealing. Power supply to Grand Road
and its vicinity is unreliable due to
frequent breakdown of conductors due to
saline climatic condition and old network.
In order to feed a reliable power supply to
these important areas, M/S PRDC is
entrusted to prepare a detailed project
report and supervise the work for
replacement of the existing OH system by
UG cable system.
Puri - Few facts The City is located at 19°48′N
85°51′E19.8°N 85.85°E. It has an average
Lord Jagannath Temple
elevation of 0 meters (0 feet). As of 2001
India census, Puri had a population of
1, 57,610.
Puri city, on the east coast of India, in the
state of Odisha is a holy pilgrimage center,
enshrining Lord Jagannath, colossal
temple. Puri is the forerunner of the
Jagannath cult in Odisha. The vast Lord
Jagannath temple complex occupies an
area of over 4, 00, 000 square feet and is
bounded by a 20 feet high fortified wall.
This complex contains about 120 temples
and shrines. The shikhara of the Jagannath
temple towers to a height of 192 feet.
Structurally the temple has four chambers.
In the first phase, Government of Odisha is
planning to replace the existing OH lines
along both sides of the Grand Road and
temple surrounding for smooth movement
of chariots during world famous Rathyatra
and Sunabesa.
Proposed system To convert the overhead primary 11 kV &
secondary LT Distribution system to Under
Ground Cabling system and to achieve the
above objectives, PRDC has proposed to
form a ring among three existing primary
Sub-Stations through 10 no’s of RMUs, 24
no’s of 750 kVA CSS replacing existing small
DTCs. The existing total capacity of 192
DTCs is 19,974 KVA and the total capacity
of 76 DTCs (44 retained + 32 proposed
DTCs in the new UG Cable Feeders) will be
26426 kVA. The entire network will be
connected through SCADA system which
will be controlled remotely from a Primary
Sub-Station.
Special care has been taken considering all
aspects to make this project as a model
one in Odisha. A detailed survey was
conducted for the existing and proposed
system by our experts Er. Jagannath Gupta
and Er. Gurusripad M.V for preparation of
the DPR. The scheme was presented before
the Honorable Chief Minister of Odisha and
was highly appreciated. The project cost is
estimated to be around eighteen crores
which would be invested jointly by CESU
and Govt. of Odisha. The project is
expected to be completed before
December-2012.
Consultancy Services Rendered
UG cabling project at
world famous tourist
place: Puri city in the
state of Odisha
Grand Road - Puri

PRDC News Page 3
PRDC team successfully completed TWO
overseas projects for Qatar Petroleum
(QP), Qatar.
1. Engineering Consultancy for 33kV
Network QP, Dukhan.
2. Front End Engineering Design
(FEED) for Power Factor
Correction for 33 kV Network, QP,
Dukhan.
The QP project-1 i.e. “Engineering
Consultancy Services for 33 kV Network,
QP, Dukhan” focused on the protection
and relay co-ordination for existing
network in depth and to analyze all the
fault incidents and failure cases to find out
the exact nature of problems and to
provide techno-economical solutions to
them.
Based on the detailed analysis, it is
observed that there were few mal-
operations and relay setting were revised
along with recommendation for automatic
generation control of DPS generation
through PLC/SCADA scheme. Further, in
view of changes in the network in the
future operating conditions including
planned decommissioning of some of the
generation, short term solution is also
recommended with the stage-wise
operation. PRDC has undertaken
protection requirement of largest
petroleum company and it has passed
many test including third party validation.
The QP project-2 i.e. “Front End
Engineering Design for Power Factor
Correction for 33 kV Network, QP,
Dukhan” focused on harmonic study and
analysis, proposal and design of capacitor
banks for the proposed QP network for
power factor improvement. The
overvoltage studies were carried out for
the sizing of capacitor banks considering
various combinations and operating
conditions to arrive at the highest rated
capacitor bank to be proposed in the QP
electrical network. Further studies were
performed to verify the occurrence of
ferroresonance.
Based on studies conducted for different
possible operating conditions, it was
observed that there could be a chance of
occurrence of ferroresonance, hence it
was recommended to ensure minimum
loading on secondary of transformer to
damp out the ferroresonance oscillations.
Power system studies provide information
that allows to understand the root of
present or future power system problems
and to make correct decisions in planning
upgrades or extensions in an industrial
plant, which lead to reduced operating
costs, increased availability and minimized
equipment or system failure.
PRDC has successfully taken up several
consultancy projects for many steel plants
in India. One such study was carried out
for Tata Steel plant in Jamshedpur. Tata
Steel is the largest iron and steel
producing plant in India, as well as the
oldest. Initially the Tata steel was
producing 5.0 MTPA crude steel. Tata
Steel's existing plant at Jamshedpur has
plans for the expansion of from 5 million
tonnes per annum to 6.8 million tonnes
per annum and then further expansion to
10 MTPA crude steel. The main sources of
power for TATA STEEL 10 MTPA plant are
Jojobera power plant of Tata Power
Company Limited (TPCL) and in-plant
generators of captive power plants PH-3,
PH-4, PH-5 & PH-6 supplemented by
utility grid viz. Damodar Valley
Corporation (DVC). The study is aimed to
carry out the power system analysis for
the 10 MTPA expansion project.
PRDC has successfully completed the
assignment by carrying out detailed
analysis of load flow, short circuit,
stability, relay co-ordination for various
stages of expansion. The studies were
carried out for various operating
conditions of the plant to ensure stable
and reliable operation of the system.
Further the important factor in any steel
plant study is the harmonic measurement
and detailed analysis was carried out. It is
observed that the voltage Total Harmonic
Distortion is within the limits for the
considering operating condition.
The highlights of the study was
• The reactive power support required in
the form of capacitor bank for the plant
was identified in order to minimize the
penalty likely to be imposed by utilities
as well as to minimize system losses.
• Considering various operating
conditions, grid islanding studies were
carried out and the detailed load
shedding scheme were identified for
stable operation in the worst case
operation.
• Critical clearing time at different voltage
levels was identified in order to clear
faults so as to avoid system going out of
step under various system conditions.
• Suggested to change to modern relays.
If quality is defined by what the customers
want, one way to measure the success of
an Electric power distribution system is to
deliver reliable & quality electric power to
customers spread throughout utility’s
service territory. In order to achieve the
objective, it is required to judiciously plan
the infrastructure development in
generation, transmission and distribution
well in advance giving the long gestation
period for the same coupled with a better
operational facility. The basic requirement
for better planning and operation is to
have accurate forecasting facilitates in the
operating area for various time horizon.
The various time horizons for the Load
forecast in utilities can be short term from
one hour to one week, medium term from
a week to a year and long term forecasting
which are longer than a year. Short-term
forecasting is motivated by a need to reach
a decision, for an optimal plan for utilizing
available resources to meet the demand at
an optimal cost. (Contd…)
Power System Studies:
Qatar Petroleum Projects,
QATAR
Power System Analysis of
10 MTPA,
Tata Steel Jamshedpur Plant
Discussion Paper on
Long Term Demand
Forecast By: Dr. K. Balaraman

PRDC News Page 4
income, economic growth, cost, industrial
& commercial activity and also other
socioeconomic variables. Econometric
models are estimate equations that relate
electricity demand to external factors.
An important problem to solve in
econometric method is the selection of
the correct independent variables. Initially
an extensive list of possible combination
exists, and the problems arise in choosing
the appropriate variables and in
estimating how many of them should be
included in the final model. The final
model should incorporate all the
important explanatory variables. In
addition, it should be simple in order to
make it easier to use and interpret.
The multi-variable regression analysis is
used to establish the correlation between
selected socioeconomic energy variables
and energy consumption data using the
past sample data. The relation obtained is
then used to estimate the energy
consumption data for the future years
using the trend/modified trend values for
the regression variables for the future
years. The main advantage of this type of
model is that it explicitly measures the
effect of underlying causes of trends and
patterns along with statistical evaluation
of forecast uncertainty. This method
combines well with economic and
demographic information on service
territory. However, the disadvantage of
this method is that it requires skill and
experience in econometrics and
programming along with the extensive
data required for detailed disaggregated
model.
The bottom up approach is gaining its
popularity in the demand forecast,
particularly where the geographical area is
small and end use techniques can be
applied easily. This approach finds it
extensive use in the distribution system
planning. The most popular technique in
this approach is end use methodology.
This methodology started at the supply
point of the customer and end use load
profiles are used to determine the
expected loads on feeders and sub -
stations. Here the forecast identified areas
with high, moderate, low and no growth.
The end use load profiles are divided into
classes to group the different load profiles
in classes that are more homogeneous.
The bottom up approach of load
forecasting addresses not only the question
of how much & when demand would occur
but also where the demand is likely to take
place. Geographical maps are used to
indicate the location (where) of the
expected loads or increase in new supply
points. The service territory is divided into
smaller area and these smaller areas can
be small square areas or irregularly shaped
& sized to determine the expected loads on
feeders.
In this approach, the load growth is
considered to occur due to:
I. New customers connected or existing
customers increasing their supply.
II. New uses of electricity, existing
customers may add new appliances or
replace existing equipment with
improved devices which may require
more or less power.
III. Change in the customer profile from
residential to commercial or industrial
or vice versa.
Based on the above factors, these two load
forecast techniques are generally adopted.
Trending involves extrapolating past load
growth into the future or simulation which
involves modeling the process of load
growth itself. The simulation process
works well for high spatial resolution –
when the region studied is divided into
very small areas. Trending is most suited
to large area forecasting.
The simulation process starts by
distinguishing customers by class like
residential, commercial and industrial or
sub classes. Simulation attempts to
reproduce the process of load growth to
forecast where, when and how the load
will develop and the reasons behind the
load growth.
Most of the techniques in the bottom up
approach revolve around spatial load
forecasting.
The short term demand projection is the
basis for scheduling the generation,
optimum operational planning of
generation facilities vis-à-vis import,
maintenance programs, load control etc.
The medium term demand forecasting is
used for generation outage program, tying
up for short gestation period generations,
distribution system reinforcement etc. The
long term demand forecasting is used for
capacity planning, strengthening of the T
& D network, tying up for fuel linkages etc.
It is a universally accepted business
practice among utilities across the world
to carry out demand estimations for the
future.
There are two major approaches for long
term demand forecasting viz.
I. Top down approach
II. Bottom up approach
The top down approach focuses on the
macro parameters like GDP, population,
per-capita income, prices for forecasting
of demand. The bottom up approach
focuses on micro parameters like growth
centers/areas, change in load profile, load
density, number of consumers, step loads
etc. As prudence practice utilities always
find it necessary to consider both the
approaches and finalize the demand for
the future.
The top down approach is the most
popular in the sense that most of the
utilities are following this methodology. In
this approach, the macro socioeconomic
parameters are considered in the
regression model and the relation is
formed for forecasting the future demand.
This method works well for large
geographical area wherein the aggregated
socioeconomic data is available and
sensitivity of demand with respect to
change in any of the variable can be
accurately determined. Most of the
econometric methods and trending
methods fall in this approach.
The econometric method is the most
popular top down approach which
determines energy demand by considering
the influence of socioeconomic
independent variables, such as population,

PRDC News Page 5
Dr. R. Nagaraja, MD, PRDC and Symposium
Chair, in his introductory remarks stressed
on the importance of ICT applications to
make the utilities clean, green and smart.
The two day symposium was attended by
around 70 delegates. The participants
were from POWERGRID, SRLDC, KPTCL,
Infosys, PRDC, CPRI and various
engineering institutes. 13 papers were
presented by the respective authors in
different sessions. The symposium was
divided into five sessions on different
topics. Each session was chaired by an
expert in that field related to the session
topic. Invited technical talks were also
arranged by eminent personalities in the
field. The session on ‘ICT Infrastructure’
was chaired by Dr. R. Nagaraja, MD, PRDC.
On the opening day, Mr. Babu Narayanan,
CTA, PRDC delivered an invited talk on
‘BESCOM Pilot Project on Smart Grid’
which was well received by the
participants.
your concern. While going through all the
assignments, I inculcate various new skills.
The most prestigious thing for me is to
work with the most prestigious company
which is working for developing new ideas
in the field of electrical and electronics.
I hope you will be helping me to develop as
a skillful electrical engineer. Thank you for
giving me the opportunity to learn at your
concern. “
Gopi Raman, (Electrical and Electronics
dept.), GGITM, Bhopal
PRDC was actively involved in organizing
The 20th
Annual Symposium on “Emerging
Application of ICT in Utilities” conducted
by IEEE Bangalore Section at Bangalore on
4th
& 5th
November 2011. The Symposium
was inaugurated by Sri. Bharat Lal Meena,
Commissioner, Bangalore Development
Authority who gave factual information
about how the human errors are reduced
and billing process was improved by
introducing ICTs in utilities.
Events
IEEE Bangalore Section 20th
Annual Symposium on
“Emerging Applications of ICT
in Utilities”
Dr. R. Nagaraja, MD, PRDC addressing inaugural function
PRDC is dedicated to encouraging talent and strengthening industry - academic
relation. In this regard, every year PRDC identifies bright young minds from various
institutes for “PRDC EEE Student Assistance ship program”. Selected students are
given assignments on a regular basis, take part in joint R&D projects, seminars and
symposia which allows them to know trends in the sector and enhance technical
knowledge. Here is what some of them have stated about the programme……….
“I am pleased to inform
you that being a part of
PRDC EEE student
assistanceship program I
learnt many skills and I
am very proud to be the
part of this program at
EEE Programme - feedback from students
“I’m one of the few
privileged students of
Electrical & Electronics
Dept., Sir MVIT, and
Bangalore to have been
given the ASSISTANCESHIP PROGRAM by
PRDC. We were specially picked by PRDC
after a set of short listing and interviews in
our 3rd semester. We’ve done various
types of assignments like coding on power
electronics and math problems, collecting
IEEE papers on SVC and making a
presentation out of it, etc. The
assignments were very interesting and
helped us know a lot of things. Side by
side we were always guided by PRDC to
spread the word about the scope and
importance of power systems among our
peers and juniors which we tried our best
to do. PRDC had been kind enough to let
us do our final year project with them and
we wish to make the most of this
opportunity in all dimensions”.
!!! THANK YOU PRDC!!!
Aafreen Shaik, Sir MVIT, Bangalore
PRDC News Page 6
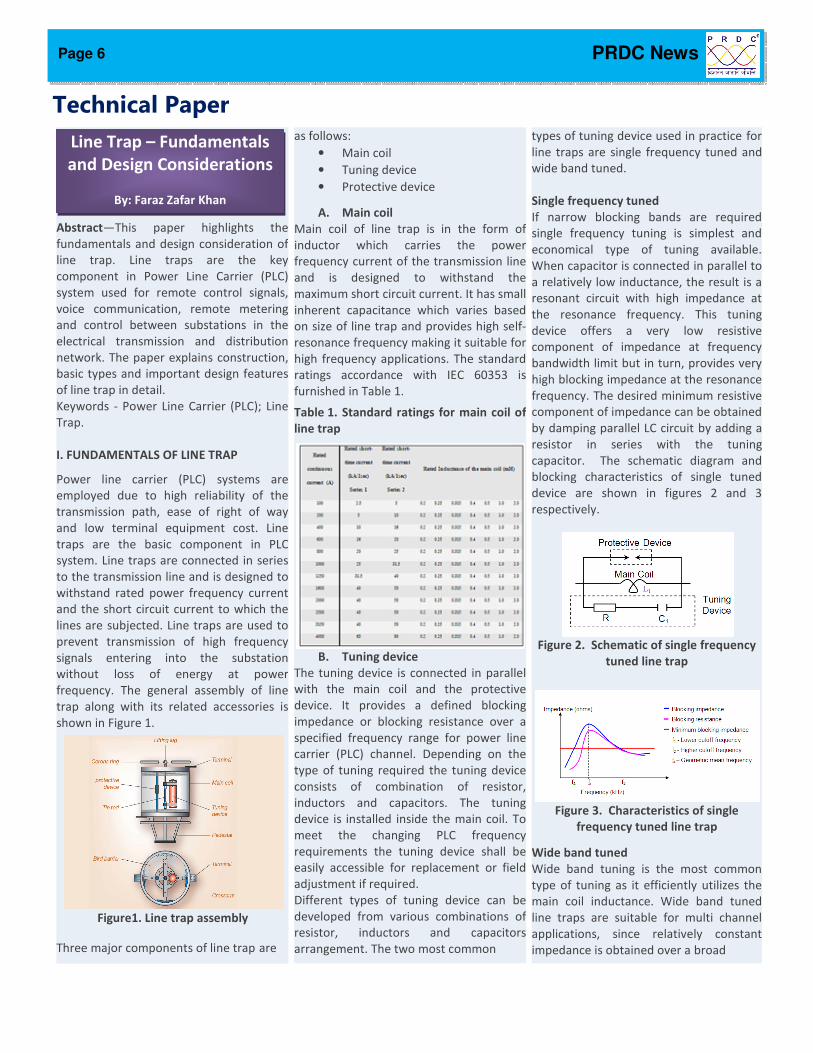
Technical Paper as follows:
• Main coil
• Tuning device
• Protective device
A. Main coil
Main coil of line trap is in the form of
inductor which carries the power
frequency current of the transmission line
and is designed to withstand the
maximum short circuit current. It has small
inherent capacitance which varies based
on size of line trap and provides high self-
resonance frequency making it suitable for
high frequency applications. The standard
ratings accordance with IEC 60353 is
furnished in Table 1.
Table 1. Standard ratings for main coil of
line trap
B. Tuning device
The tuning device is connected in parallel
with the main coil and the protective
device. It provides a defined blocking
impedance or blocking resistance over a
specified frequency range for power line
carrier (PLC) channel. Depending on the
type of tuning required the tuning device
consists of combination of resistor,
inductors and capacitors. The tuning
device is installed inside the main coil. To
meet the changing PLC frequency
requirements the tuning device shall be
easily accessible for replacement or field
adjustment if required.
Different types of tuning device can be
developed from various combinations of
resistor, inductors and capacitors
arrangement. The two most common
types of tuning device used in practice for
line traps are single frequency tuned and
wide band tuned.
Single frequency tuned
If narrow blocking bands are required
single frequency tuning is simplest and
economical type of tuning available.
When capacitor is connected in parallel to
a relatively low inductance, the result is a
resonant circuit with high impedance at
the resonance frequency. This tuning
device offers a very low resistive
component of impedance at frequency
bandwidth limit but in turn, provides very
high blocking impedance at the resonance
frequency. The desired minimum resistive
component of impedance can be obtained
by damping parallel LC circuit by adding a
resistor in series with the tuning
capacitor. The schematic diagram and
blocking characteristics of single tuned
device are shown in figures 2 and 3
respectively.
Figure 2. Schematic of single frequency
tuned line trap
Figure 3. Characteristics of single
frequency tuned line trap
Wide band tuned
Wide band tuning is the most common
type of tuning as it efficiently utilizes the
main coil inductance. Wide band tuned
line traps are suitable for multi channel
applications, since relatively constant
impedance is obtained over a broad
Abstract—This paper highlights the
fundamentals and design consideration of
line trap. Line traps are the key
component in Power Line Carrier (PLC)
system used for remote control signals,
voice communication, remote metering
and control between substations in the
electrical transmission and distribution
network. The paper explains construction,
basic types and important design features
of line trap in detail.
Keywords - Power Line Carrier (PLC); Line
Trap.
I. FUNDAMENTALS OF LINE TRAP
Power line carrier (PLC) systems are
employed due to high reliability of the
transmission path, ease of right of way
and low terminal equipment cost. Line
traps are the basic component in PLC
system. Line traps are connected in series
to the transmission line and is designed to
withstand rated power frequency current
and the short circuit current to which the
lines are subjected. Line traps are used to
prevent transmission of high frequency
signals entering into the substation
without loss of energy at power
frequency. The general assembly of line
trap along with its related accessories is
shown in Figure 1.
Three major components of line trap are
Line Trap – Fundamentals
and Design Considerations
By: Faraz Zafar Khan
Figure1. Line trap assembly
PRDC News Page 7
frequency range. This type of tuning
provides high bandwidth flexibility for
future changes or expansion of PLC
frequencies.
Schematic and characteristics of typical
wide band tuned line trap are shown in
figures 4 and 5 respectively.
Figure 4. Schematic of wide band tuned
line trap
Figure 5. Characteristics of wide band
tuned line trap
Protective device
The protective device is connected across
the main coil and tuning device which
prevents the line trap from being damaged
by transient over-voltages. Its rating is
chosen to respond to high transient over-
voltages, but it will not operate as a result
of the power frequency voltage developed
across line trap by the rated short circuit
current, nor will it remain in operation
after the response to transient over-
voltage developed across the line trap by
the rated short time current. It is
recommended that non-linear resistor type
arresters for a.c system should be used in
accordance with IEC publication 99 or
equivalent standard. The nominal
discharge current should be equal to or
greater than that of station arrester
installed behind the line traps. In no case
this current shall be less than 5 kA.
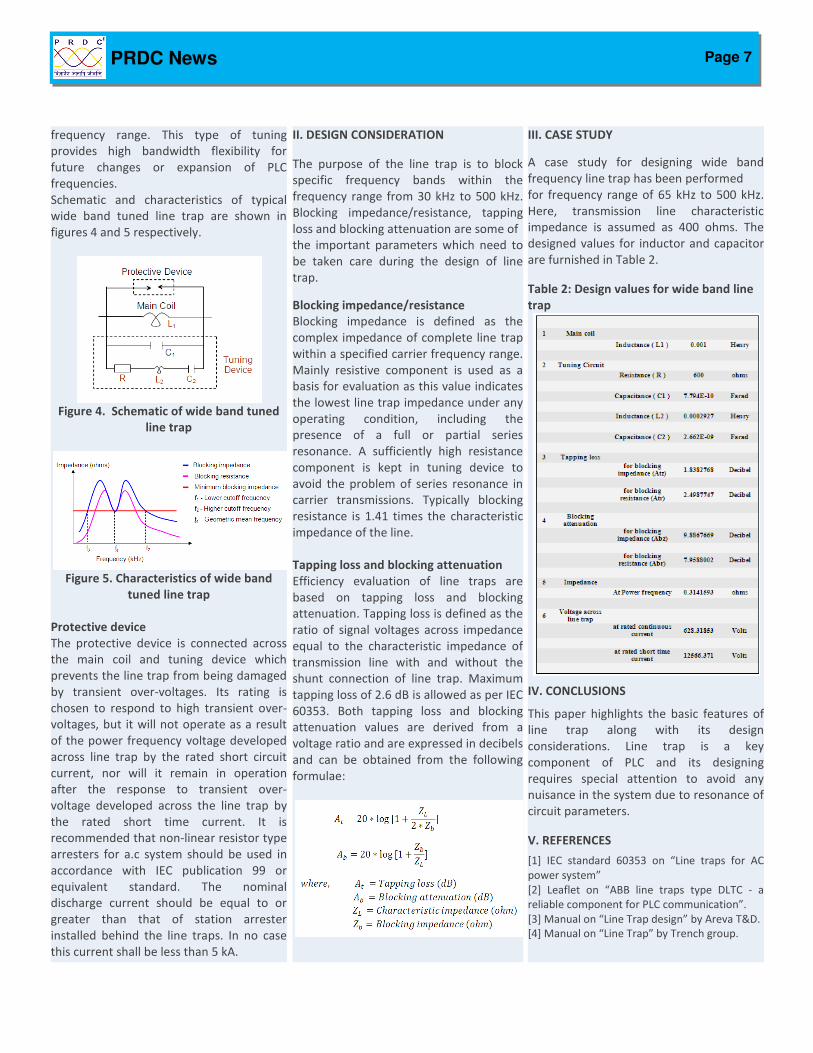
III. CASE STUDY
A case study for designing wide band
frequency line trap has been performed
for frequency range of 65 kHz to 500 kHz.
Here, transmission line characteristic
impedance is assumed as 400 ohms. The
designed values for inductor and capacitor
are furnished in Table 2.
Table 2: Design values for wide band line
trap
IV. CONCLUSIONS
This paper highlights the basic features of
line trap along with its design
considerations. Line trap is a key
component of PLC and its designing
requires special attention to avoid any
nuisance in the system due to resonance of
circuit parameters.
V. REFERENCES
[1] IEC standard 60353 on “Line traps for AC
power system”
[2] Leaflet on “ABB line traps type DLTC - a
reliable component for PLC communication”.
[3] Manual on “Line Trap design” by Areva T&D.
[4] Manual on “Line Trap” by Trench group.
II. DESIGN CONSIDERATION
The purpose of the line trap is to block
specific frequency bands within the
frequency range from 30 kHz to 500 kHz.
Blocking impedance/resistance, tapping
loss and blocking attenuation are some of
the important parameters which need to
be taken care during the design of line
trap.
Blocking impedance/resistance
Blocking impedance is defined as the
complex impedance of complete line trap
within a specified carrier frequency range.
Mainly resistive component is used as a
basis for evaluation as this value indicates
the lowest line trap impedance under any
operating condition, including the
presence of a full or partial series
resonance. A sufficiently high resistance
component is kept in tuning device to
avoid the problem of series resonance in
carrier transmissions. Typically blocking
resistance is 1.41 times the characteristic
impedance of the line.
Tapping loss and blocking attenuation
Efficiency evaluation of line traps are
based on tapping loss and blocking
attenuation. Tapping loss is defined as the
ratio of signal voltages across impedance
equal to the characteristic impedance of
transmission line with and without the
shunt connection of line trap. Maximum
tapping loss of 2.6 dB is allowed as per IEC
60353. Both tapping loss and blocking
attenuation values are derived from a
voltage ratio and are expressed in decibels
and can be obtained from the following
formulae:
PRDC News Page 8
Events and Achievements
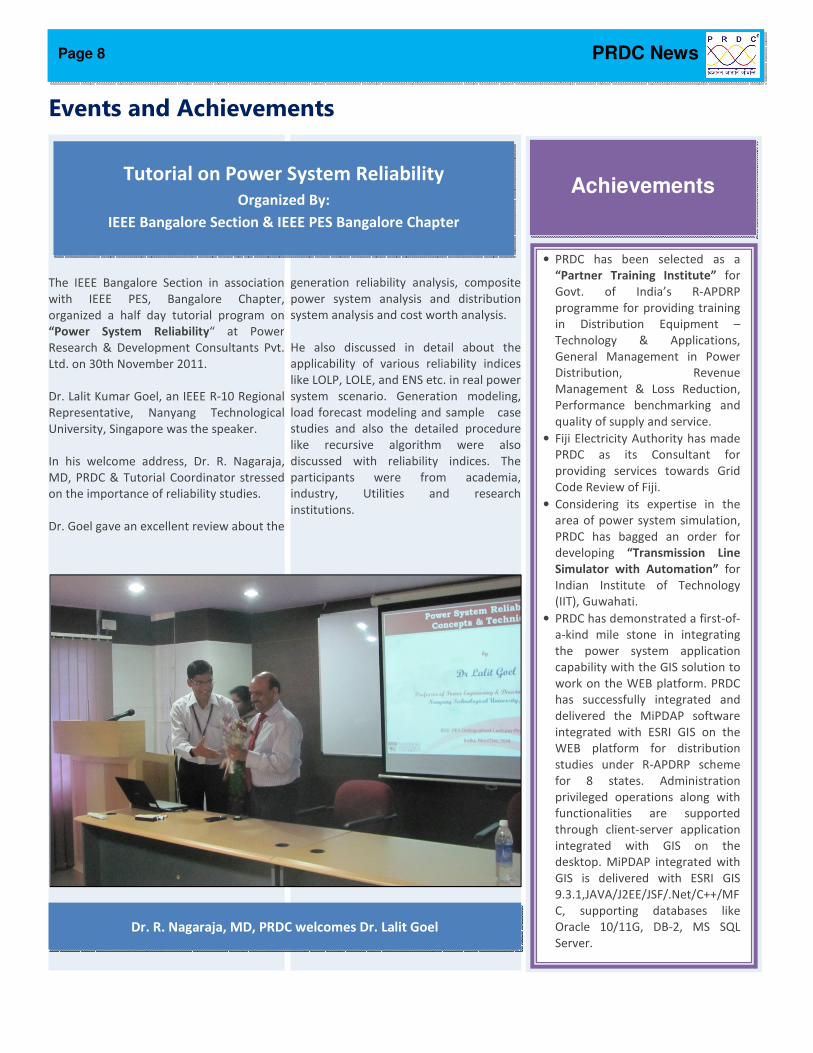
The IEEE Bangalore Section in association
with IEEE PES, Bangalore Chapter,
organized a half day tutorial program on
“Power System Reliability“ at Power
Research & Development Consultants Pvt.
Ltd. on 30th November 2011.
Dr. Lalit Kumar Goel, an IEEE R-10 Regional
Representative, Nanyang Technological
University, Singapore was the speaker.
In his welcome address, Dr. R. Nagaraja,
MD, PRDC & Tutorial Coordinator stressed
on the importance of reliability studies.
Dr. Goel gave an excellent review about the
Achievements
generation reliability analysis, composite
power system analysis and distribution
system analysis and cost worth analysis.
He also discussed in detail about the
applicability of various reliability indices
like LOLP, LOLE, and ENS etc. in real power
system scenario. Generation modeling,
load forecast modeling and sample case
studies and also the detailed procedure
like recursive algorithm were also
discussed with reliability indices. The
participants were from academia,
industry, Utilities and research
institutions.
Tutorial on Power System Reliability
Organized By:
IEEE Bangalore Section & IEEE PES Bangalore Chapter
Dr. R. Nagaraja, MD, PRDC welcomes Dr. Lalit Goel
• PRDC has been selected as a
“Partner Training Institute” for
Govt. of India’s R-APDRP
programme for providing training
in Distribution Equipment –
Technology & Applications,
General Management in Power
Distribution, Revenue
Management & Loss Reduction,
Performance benchmarking and
quality of supply and service.
• Fiji Electricity Authority has made
PRDC as its Consultant for
providing services towards Grid
Code Review of Fiji.
• Considering its expertise in the
area of power system simulation,
PRDC has bagged an order for
developing “Transmission Line
Simulator with Automation” for
Indian Institute of Technology
(IIT), Guwahati.
• PRDC has demonstrated a first-of-
a-kind mile stone in integrating
the power system application
capability with the GIS solution to
work on the WEB platform. PRDC
has successfully integrated and
delivered the MiPDAP software
integrated with ESRI GIS on the
WEB platform for distribution
studies under R-APDRP scheme
for 8 states. Administration
privileged operations along with
functionalities are supported
through client-server application
integrated with GIS on the
desktop. MiPDAP integrated with
GIS is delivered with ESRI GIS
9.3.1,JAVA/J2EE/JSF/.Net/C++/MF
C, supporting databases like
Oracle 10/11G, DB-2, MS SQL
Server.

PRDC News Page 9
c
Our Expertise in Training At PRDC, we conduct various training
programmes throughout the year. The
duration of the training programme varies
from one to four weeks.
One Week Training We conduct one week training programme
on MiPower. It’s a Standard Course.
MiPower Training Level 1
Level 1 is a training programme on basic
theory & simple problems (hands-on).
Level 1 Batch:
1. 16th
Jan 2012 to 20th
Jan 2012
2. 12th
Mar 2012 to 16th
Mar 2012
MiPower Training Level 2
Level 2 is a training programme which
consists of only hands-on and solving own
system problems, sorting out issues and
clarifications.
Level 2 Batch:
1. 6th
Feb 2012 to 10th
Feb 2012
Short Term Training /Workshop
In addition to the above said programme
PRDC is also conducting short term training
program and workshops to impart
knowledge and practical approach on
specific topics, which are of relevance to
power engineers in day-to-day works. Such
training not only enhances their knowledge
but also helps to implement in their regular
routine works.
For short term and special trainings please
contact our marketing team:
Training Calendar - 2012 Upcoming Events
Workshop Participation
PRDC conducted a training programme on “Emerging Trends in Power Systems &
MiPower Applications” ETPMA’11 at Mar Baselios College of Engineering and
Technology, Trivandrum during 21-25, November 2011.
PRDC News Page 10
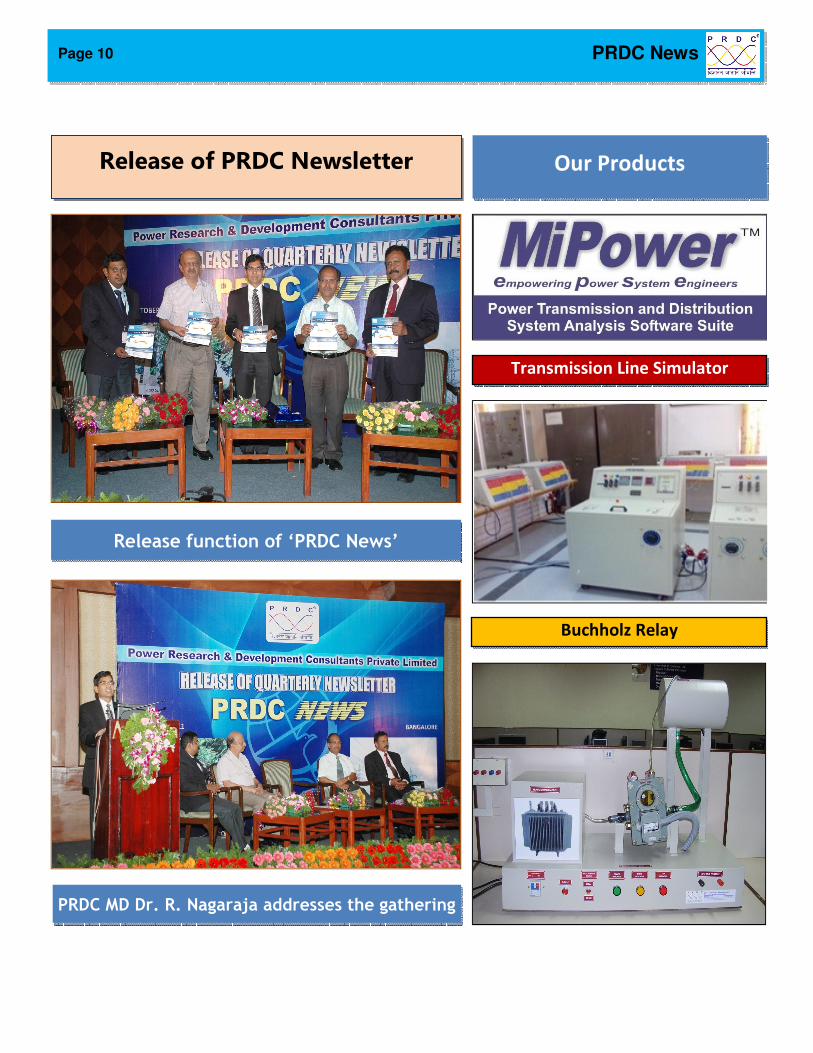
Release of PRDC Newsletter
Our Products
Buchholz Relay
Transmission Line Simulator
Release function of ‘PRDC News’
PRDC MD Dr. R. Nagaraja addresses the gathering

PRDC News Page 11
PDU – Phase Detection Unit
Need for Phase Detection
This is the first product of its kind. This
device is used for determining any
unknown phase in the 3 phase electrical
system. This device is of great help to local
electricity companies and survey groups.
This device when connected to the
incoming supply line of any consumer, can
determine whether the consumer is in R-
Phase, Y-Phase or B-Phase. This helps the
utility companies to balance the loads for
each of the 3 phases for effective
utilization of power.
This product has got an overwhelming
response throughout the industry. The
surveyors appointed for the R-APDRP
project by Ministry of Power, Govt. of
India have been using this product
successfully for their projects.
Under R-APDRP project, consumer survey
is a part. Consumer survey was faced by a
criticality in determining the phase of a
single phase consumer.
This unit solves the criticality by providing
an easy solution to determine the
unknown phase. The portable device can
be just plugged to any consumer’s outlet
and instant indication about the phase can
be seen through the 3 coloured LEDs on
the user friendly front panel.
The rover unit works while within the RF
range of the master device which can be
connected to any known phase either at
the transformer or even at any consumer
whose phase has been already
determined.
Principle of Operation
The device works on RF technology
working in the ISM Band and does not
require a license. The Master Device sends
the phase angle data of the reference
phase to the rover in digital form. The
rover receives the data through the RF
channel, decodes it and compares with the
phase angle data of the phase under test.
The result of comparison gives the
identification of the phase under test. The
device works only when the rover is within
the RF range of the master, otherwise it
switches of all the LEDs in the indication
panel.
The similar products available in the
market are bulky and much higher in
terms of cost which gives our product an
edge over all other similar products.
Basically the similar products available in
the international market use GPS
technology which requires clear sky for
satellite communication and hence does
not work in closed areas such as
basements or inside the building. But in
Indian scenario most of the meter
terminals are located in confined areas. In
these conditions our equipment works
efficiently, thanks to the latest RF
technology.
This unit can be used in various
configurations. Only one master can
provide information to maximum of 8
rovers. This makes parallel surveying of
different consumers thus saving time.
Our devices are being used throughout
India successfully. We are also in a process
of upgrading the system with memory,
display and keypad. This will reduce the
manual entry of data and thus reducing
errors. The new system can store the
meter number or the consumer number
and when the phase is checked,
automatically it can store the phase data of
the respective meter identified by its
number.
Features
• Phase detection time: within 1500
ms.
• Microprocessor based design for
improved efficiency.
• Separate LED indication for R, Y and
B Phases.
• Inbuilt consistency functions for
error free operation.
• Programmable reference selector.
• No external power supply required.
• Single key menu function.
• Compact and portable design.
• Long Range: Up to 500m coverage.
• Easy to use and user friendly
operation.
• CAT III Probes ensuring better
insulation and safety.
• Light weight polycarbonate body for
safety from shocking hazards.

PRDC News Page 12
Power Research & Development Consultants Pvt. Ltd # 5, 11
th Cross, 2
nd Stage, West of Chord Road, Bangalore, INDIA, PIN 560086
Tel: +91-80-4245-5555, 23192209 Fax: +91-80-4245-5556, 23192210
Email: [email protected] www.prdcinfotech.com