Embed Size (px)
Citation preview

From impact evaluations to cost-benefit analysis?
DEC Course Poverty and Inequality - Module 6: Evaluating the impacts of assigned programs
March 28, 2008
Jed Friedman
Development Research Group
Outline
Conceptual framework Challenge of accounting for ‘full’ benefits
and costs Evidence C/B education programs Broader comparison across programs:
C/B nutrition interventions
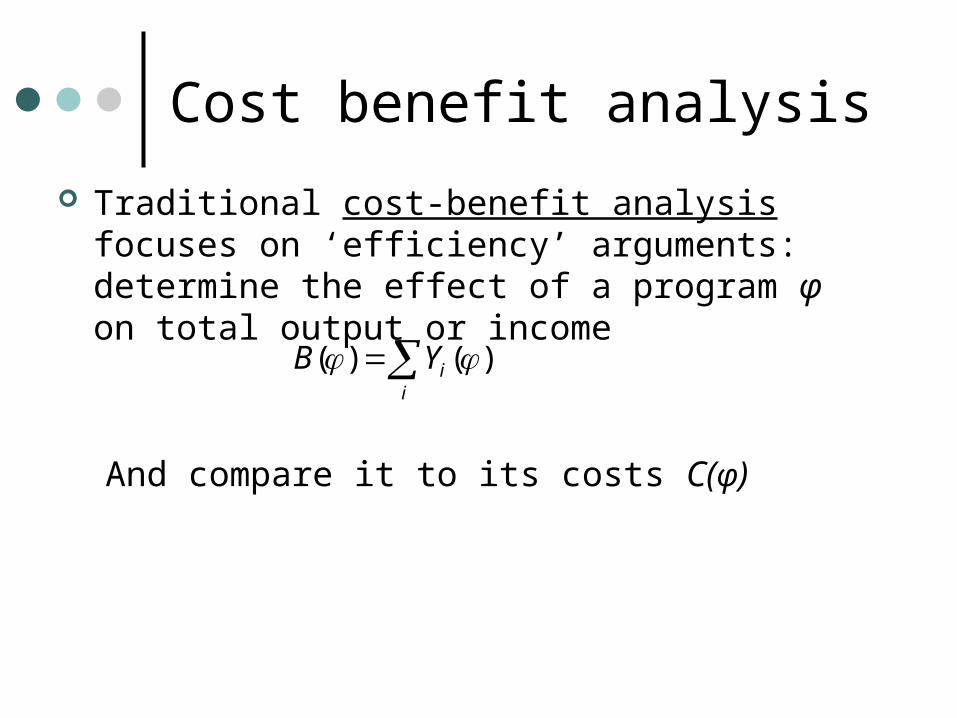
Cost benefit analysis
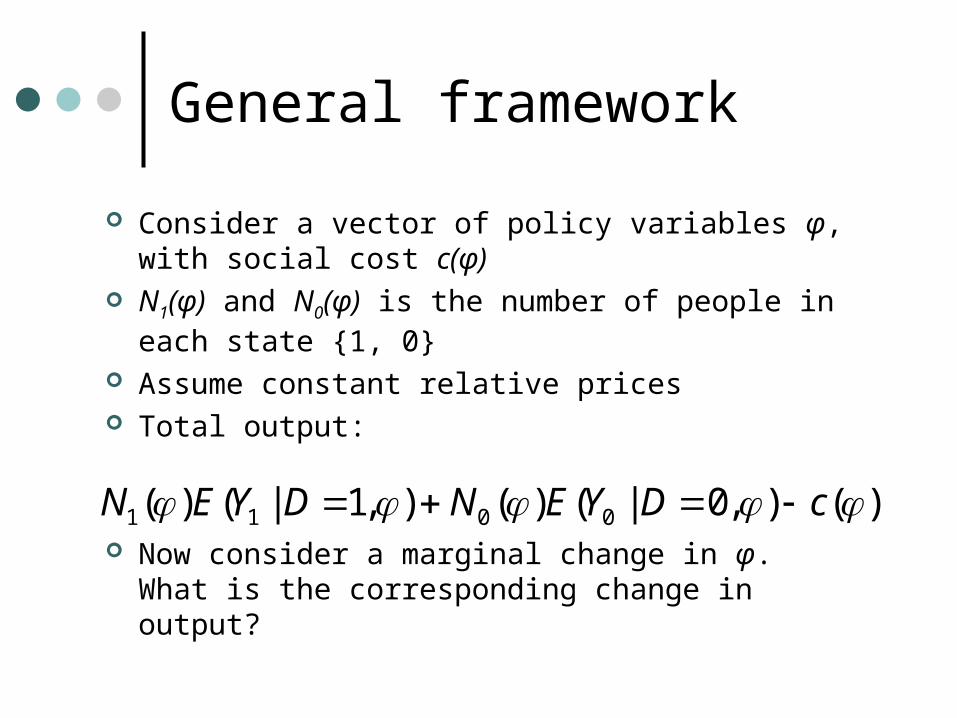
Traditional cost-benefit analysis focuses on ‘efficiency’ arguments: determine the effect of a program φ on total output or income
And compare it to its costs C(φ)
)()( i
iYB
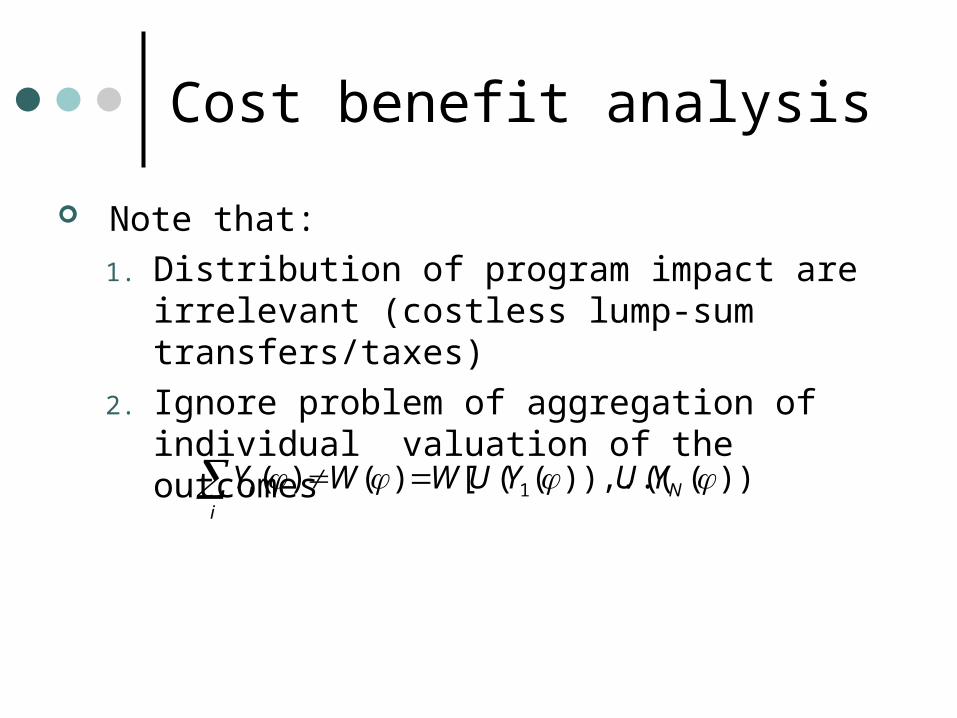
Cost benefit analysis
Note that:
1. Distribution of program impact are irrelevant (costless lump-sum transfers/taxes)
2. Ignore problem of aggregation of individual valuation of the outcomes
))](()),..((([)()( 1 Ni
i YUYUWWY
Cost benefit analysis
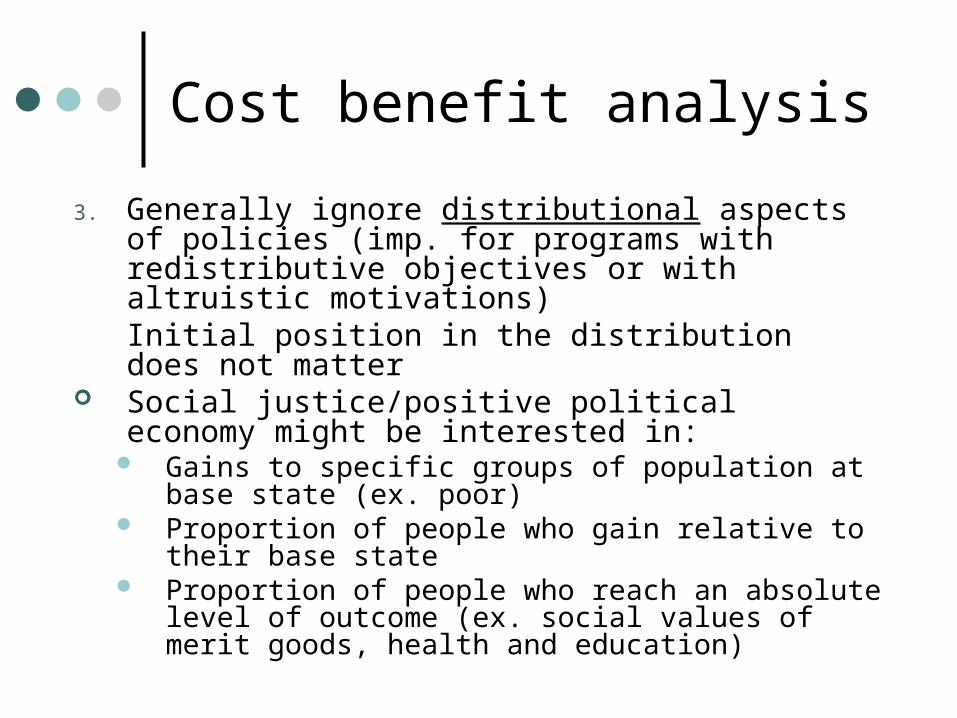
3. Generally ignore distributional aspects of policies (imp. for programs with redistributive objectives or with altruistic motivations)Initial position in the distribution does not matter
Social justice/positive political economy might be interested in:
Gains to specific groups of population at base state (ex. poor)
Proportion of people who gain relative to their base state
Proportion of people who reach an absolute level of outcome (ex. social values of merit goods, health and education)

Cost benefit analysis
4. Full social costs of the program should include the welfare cost of raising funds, generally ignored.
General framework
Consider a vector of policy variables φ, with social cost c(φ)
N1(φ) and N0(φ) is the number of people in each state {1, 0}
Assume constant relative prices Total output:
Now consider a marginal change in φ. What is the corresponding change in output?
)(),0|()(),1|()( 0011 cDYENDYEN
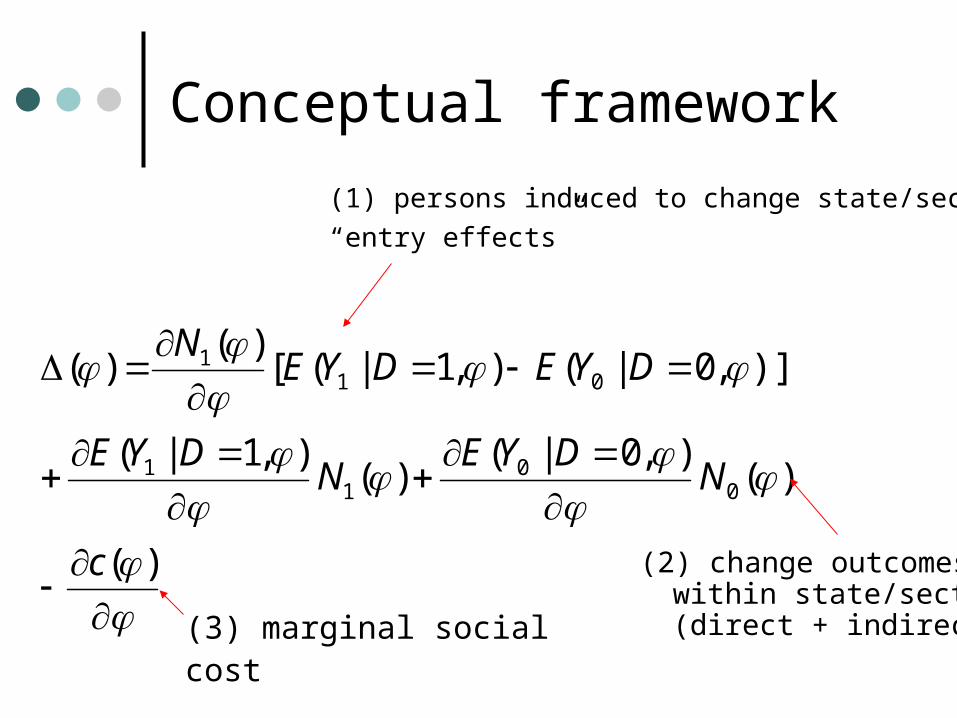
Conceptual framework
)(
)(),0|(
)(),1|(
)],0|(),1|([)(
)(
00
11
011
c
NDYE
NDYE
DYEDYEN
(1) persons induced to change state/sector:
“entry effects”
(2) change outcomes within state/sector (direct + indirect)(3) marginal social
cost
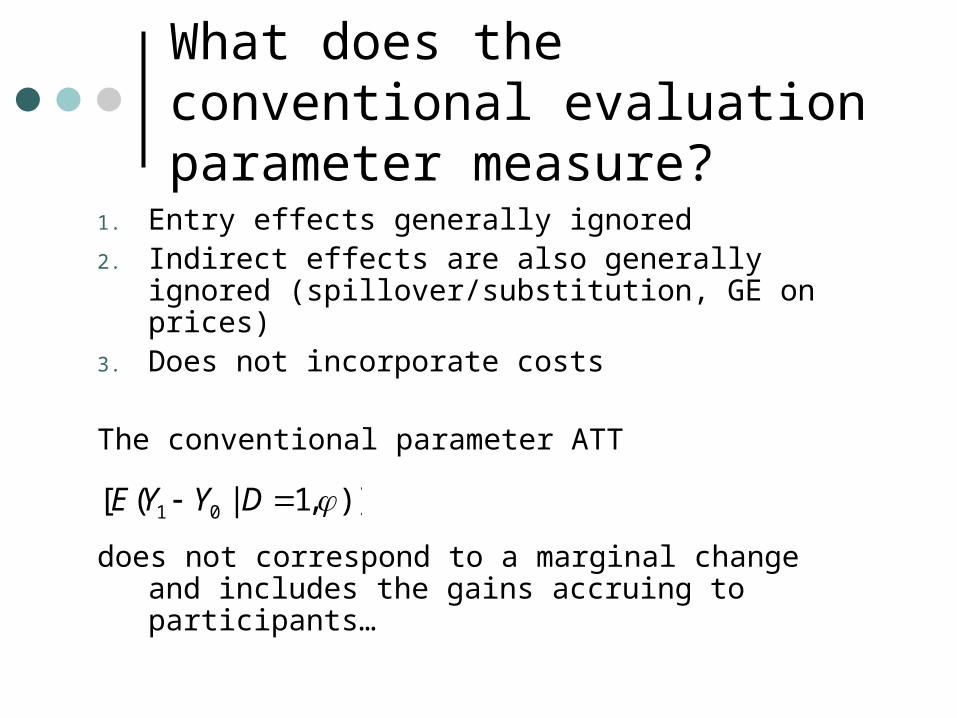
What does the conventional evaluation parameter measure?
1. Entry effects generally ignored2. Indirect effects are also generally ignored
(spillover/substitution, GE on prices)3. Does not incorporate costs
The conventional parameter ATT
does not correspond to a marginal change and includes the gains accruing to participants…
)],1|([ 01 DYYE

What does the conventional evaluation parameter measure?
1. Entry effects generally ignored (Moffitt 1992, 2003, Heckman 1992):
effect of the program on the rate at which individuals apply or gain admittance to the program.
Direct: policy changes the way applicants are handled
Indirect: policy reform changes the attractiveness of the program
What does the conventional evaluation parameter measure?
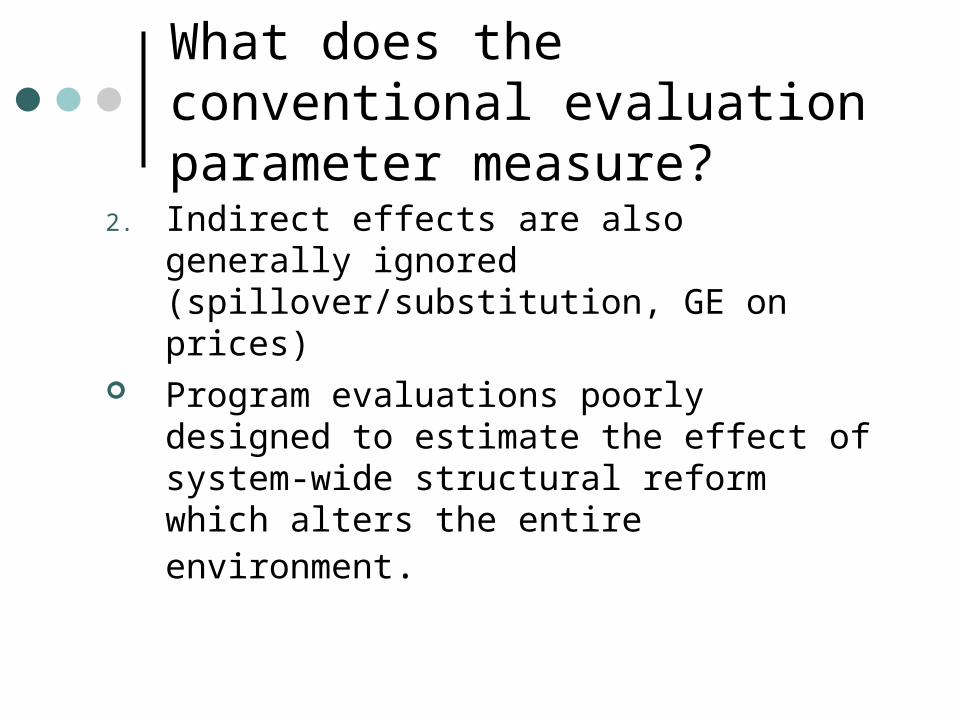
2. Indirect effects are also generally ignored (spillover/substitution, GE on prices)
Program evaluations poorly designed to estimate the effect of system-wide structural reform which alters the entire environment.
What does the conventional evaluation parameter measure?
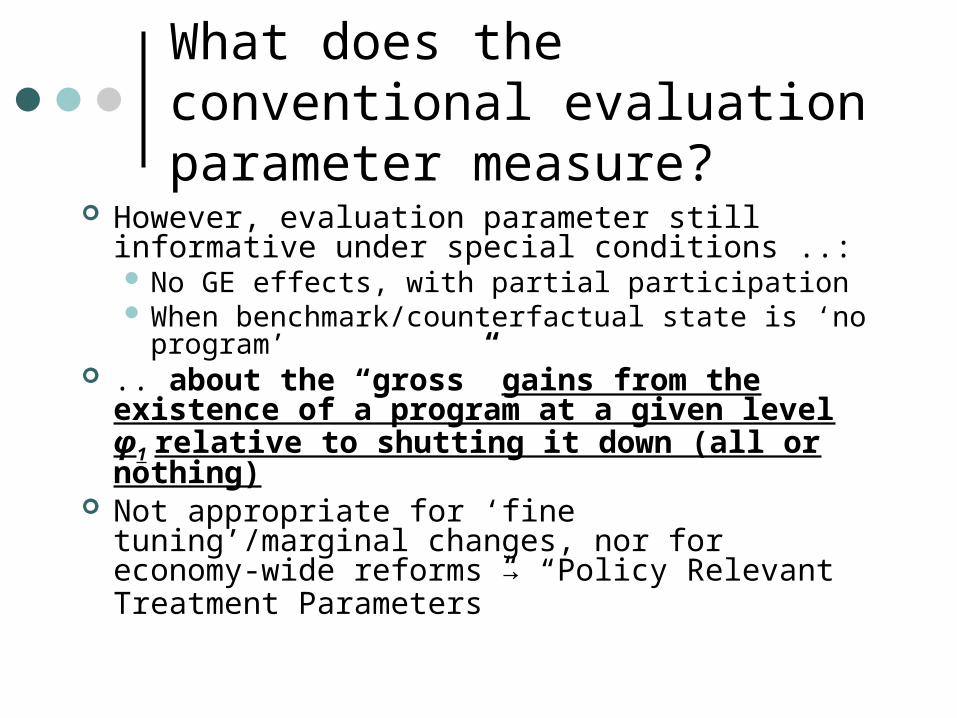
However, evaluation parameter still informative under special conditions ..: No GE effects, with partial participation When benchmark/counterfactual state is ‘no
program’ .. about the “gross” gains from the existence
of a program at a given level φ1 relative to shutting it down (all or nothing)
Not appropriate for ‘fine tuning’/marginal changes, nor for economy-wide reforms → “Policy Relevant Treatment Parameters”
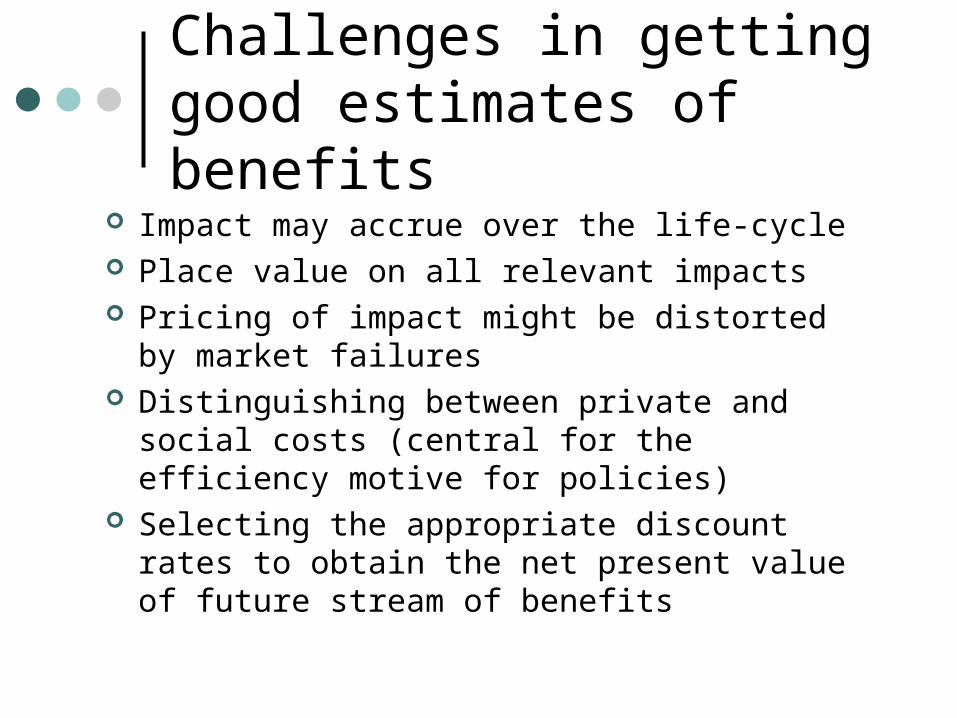
Challenges in getting good estimates of benefits
Impact may accrue over the life-cycle Place value on all relevant impacts Pricing of impact might be distorted by market
failures Distinguishing between private and social costs
(central for the efficiency motive for policies) Selecting the appropriate discount rates to
obtain the net present value of future stream of benefits
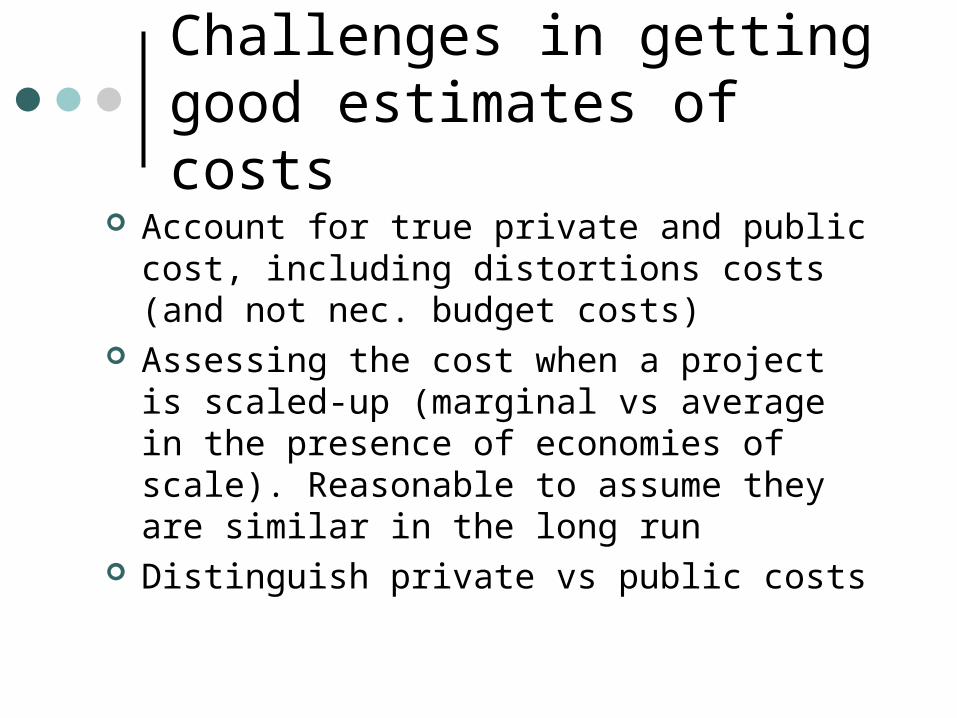
Challenges in getting good estimates of costs
Account for true private and public cost, including distortions costs (and not nec. budget costs)
Assessing the cost when a project is scaled-up (marginal vs average in the presence of economies of scale). Reasonable to assume they are similar in the long run
Distinguish private vs public costs
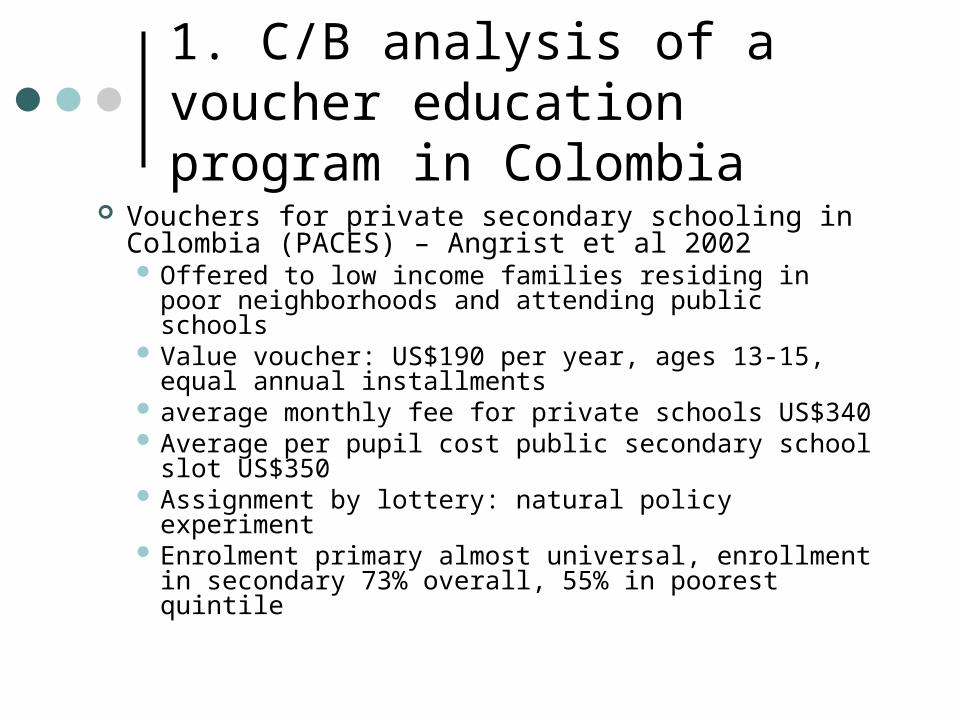
1. C/B analysis of a voucher education program in Colombia
Vouchers for private secondary schooling in Colombia (PACES) – Angrist et al 2002 Offered to low income families residing in poor
neighborhoods and attending public schools Value voucher: US$190 per year, ages 13-15,
equal annual installments average monthly fee for private schools US$340 Average per pupil cost public secondary school
slot US$350 Assignment by lottery: natural policy experiment Enrolment primary almost universal, enrollment in
secondary 73% overall, 55% in poorest quintile
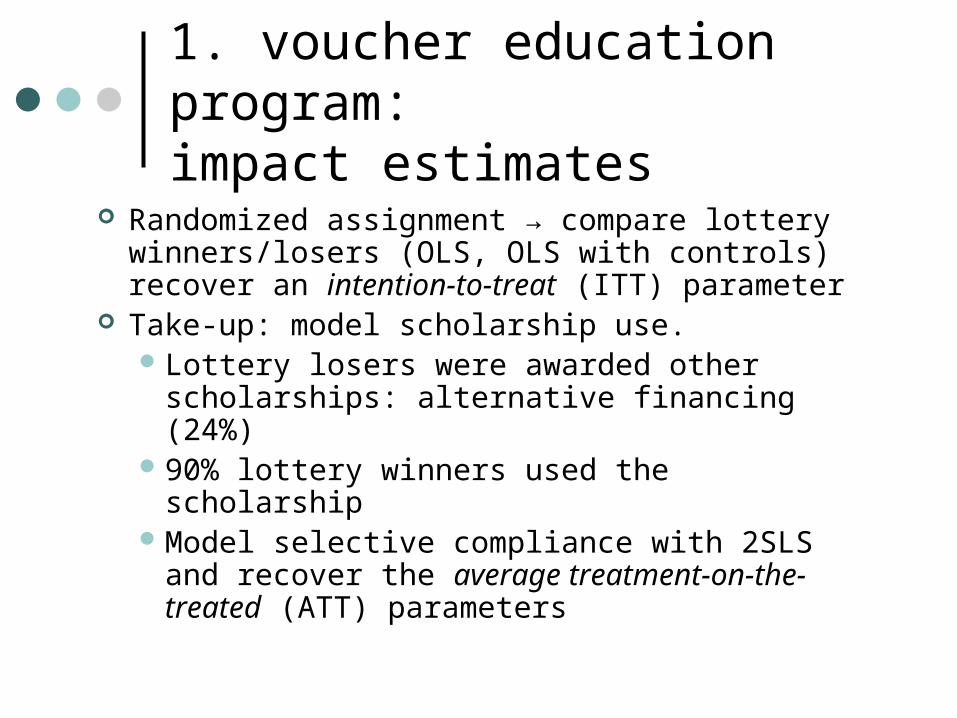
1. voucher education program:impact estimates
Randomized assignment → compare lottery winners/losers (OLS, OLS with controls) recover an intention-to-treat (ITT) parameter
Take-up: model scholarship use.Lottery losers were awarded other
scholarships: alternative financing (24%)90% lottery winners used the scholarshipModel selective compliance with 2SLS and
recover the average treatment-on-the-treated (ATT) parameters
1. voucher education program:impact estimates
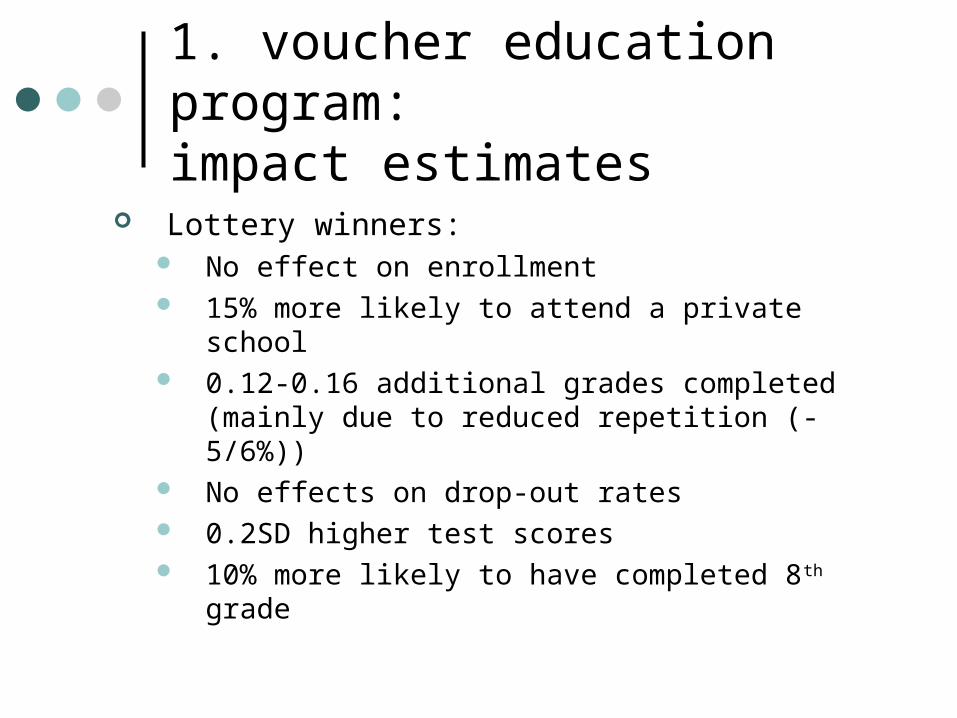
Lottery winners: No effect on enrollment 15% more likely to attend a private school 0.12-0.16 additional grades completed (mainly
due to reduced repetition (-5/6%)) No effects on drop-out rates 0.2SD higher test scores 10% more likely to have completed 8th grade
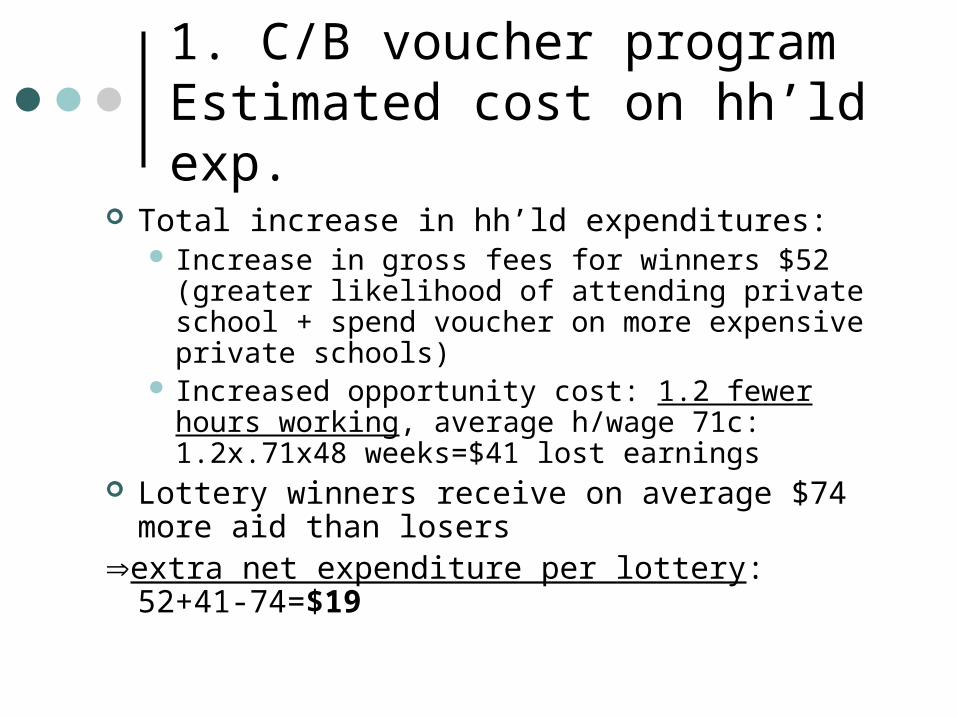
1. C/B voucher program Estimated cost on hh’ld exp.
Total increase in hh’ld expenditures: Increase in gross fees for winners $52 (greater
likelihood of attending private school + spend voucher on more expensive private schools)
Increased opportunity cost: 1.2 fewer hours working, average h/wage 71c: 1.2x.71x48 weeks=$41 lost earnings
Lottery winners receive on average $74 more aid than losers
extra net expenditure per lottery: 52+41-74=$19
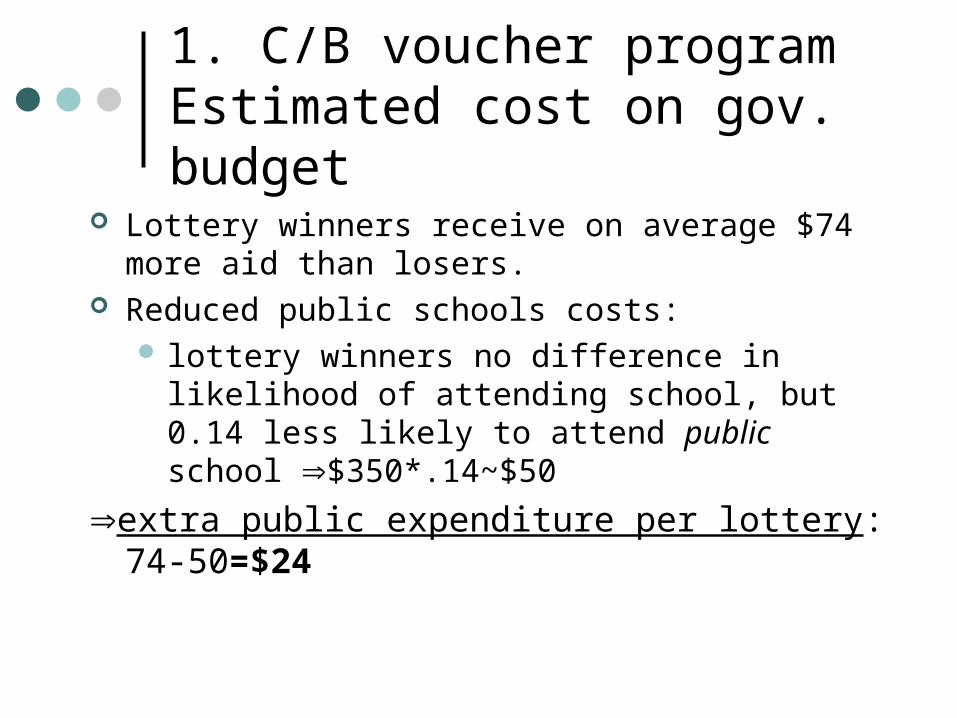
1. C/B voucher program Estimated cost on gov. budget
Lottery winners receive on average $74 more aid than losers.
Reduced public schools costs: lottery winners no difference in likelihood of
attending school, but 0.14 less likely to attend public school $350*.14~$50
extra public expenditure per lottery: 74-50=$24
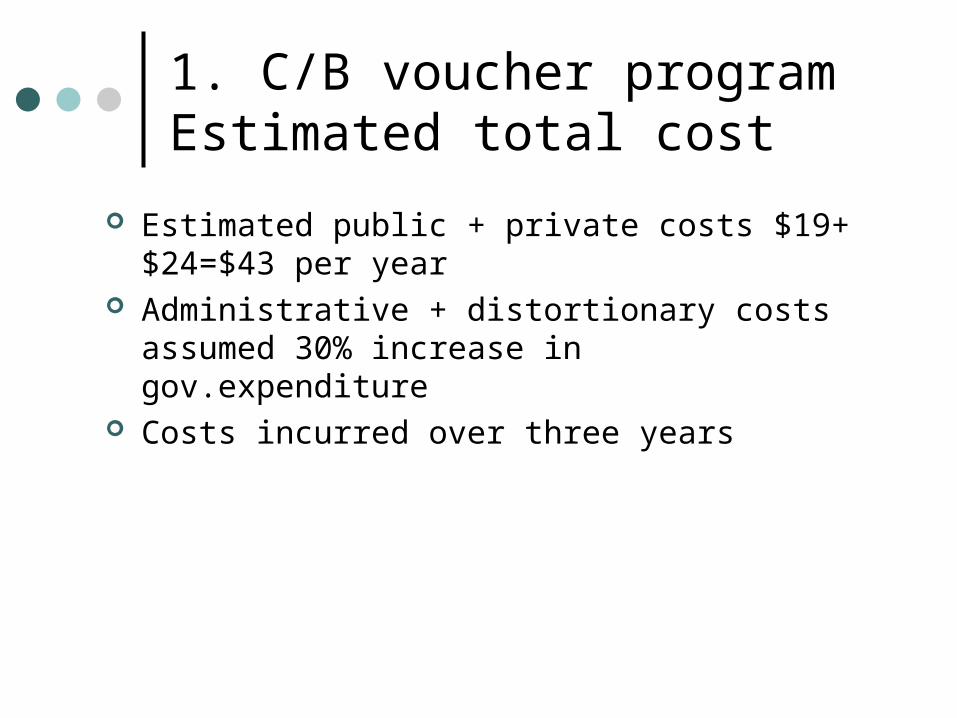
1. C/B voucher program Estimated total cost
Estimated public + private costs $19+$24=$43 per year
Administrative + distortionary costs assumed 30% increase in gov.expenditure
Costs incurred over three years
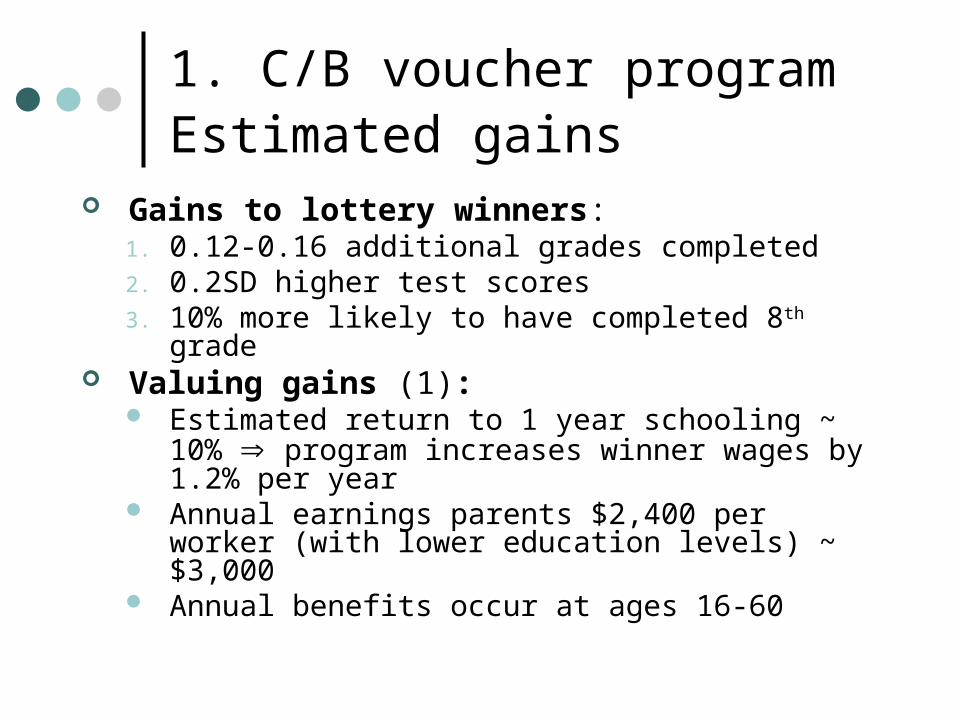
1. C/B voucher program Estimated gains
Gains to lottery winners: 1. 0.12-0.16 additional grades completed2. 0.2SD higher test scores3. 10% more likely to have completed 8th grade
Valuing gains (1): Estimated return to 1 year schooling ~ 10%
program increases winner wages by 1.2% per year
Annual earnings parents $2,400 per worker (with lower education levels) ~ $3,000
Annual benefits occur at ages 16-60
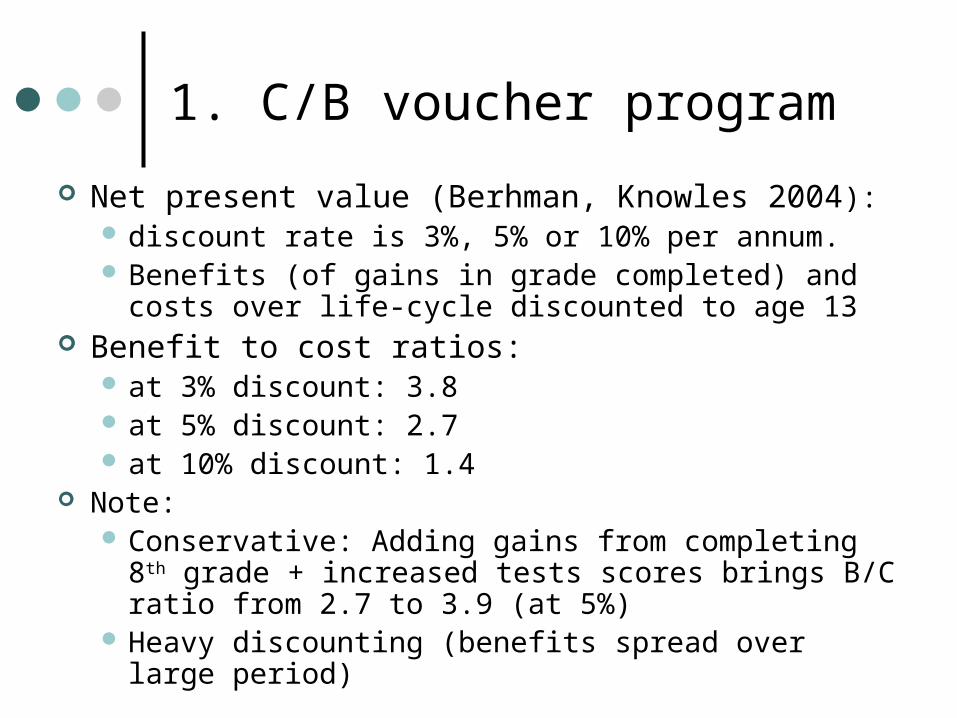
1. C/B voucher program
Net present value (Berhman, Knowles 2004): discount rate is 3%, 5% or 10% per annum. Benefits (of gains in grade completed) and costs over
life-cycle discounted to age 13 Benefit to cost ratios:
at 3% discount: 3.8 at 5% discount: 2.7 at 10% discount: 1.4
Note: Conservative: Adding gains from completing 8th grade
+ increased tests scores brings B/C ratio from 2.7 to 3.9 (at 5%)
Heavy discounting (benefits spread over large period)
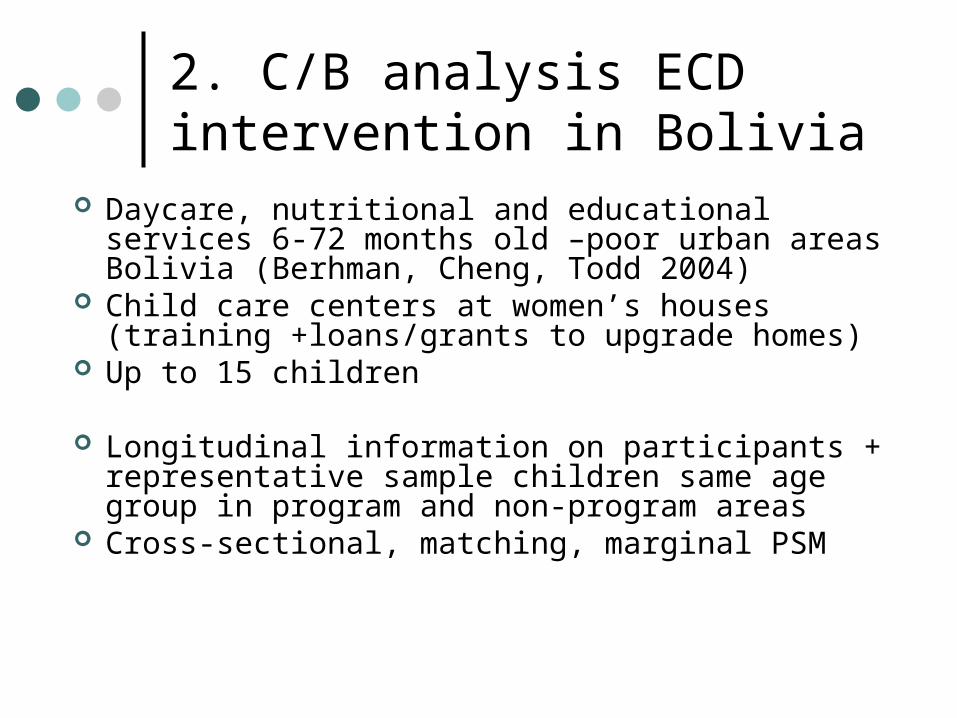
2. C/B analysis ECD intervention in Bolivia
Daycare, nutritional and educational services 6-72 months old –poor urban areas Bolivia (Berhman, Cheng, Todd 2004)
Child care centers at women’s houses (training +loans/grants to upgrade homes)
Up to 15 children
Longitudinal information on participants + representative sample children same age group in program and non-program areas
Cross-sectional, matching, marginal PSM

2. C/B analysis ECD intervention in Bolivia: costs
Cost: estimated $43/month child enrolled (516/year)
Costs presented with/without 25% upward adjustment for distortionary costs of government financing
Costs calculating assuming that children take part to the program for 3 years (age 2-5)
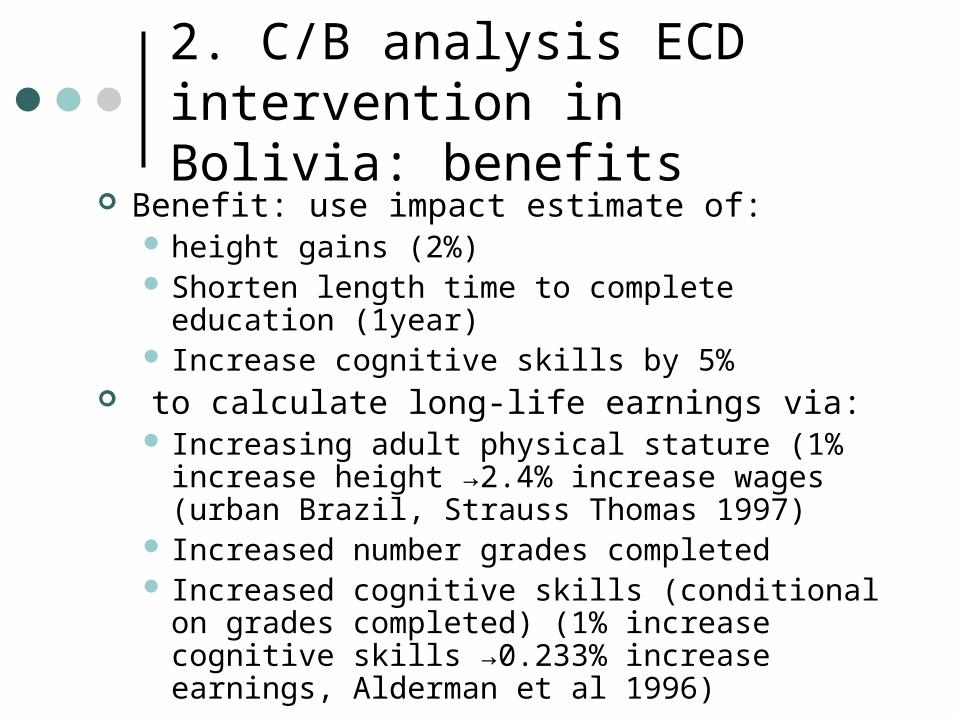
2. C/B analysis ECD intervention in Bolivia: benefits
Benefit: use impact estimate of: height gains (2%) Shorten length time to complete education (1year) Increase cognitive skills by 5%
to calculate long-life earnings via: Increasing adult physical stature (1% increase
height →2.4% increase wages (urban Brazil, Strauss Thomas 1997)
Increased number grades completed Increased cognitive skills (conditional on grades
completed) (1% increase cognitive skills →0.233% increase earnings, Alderman et al 1996)
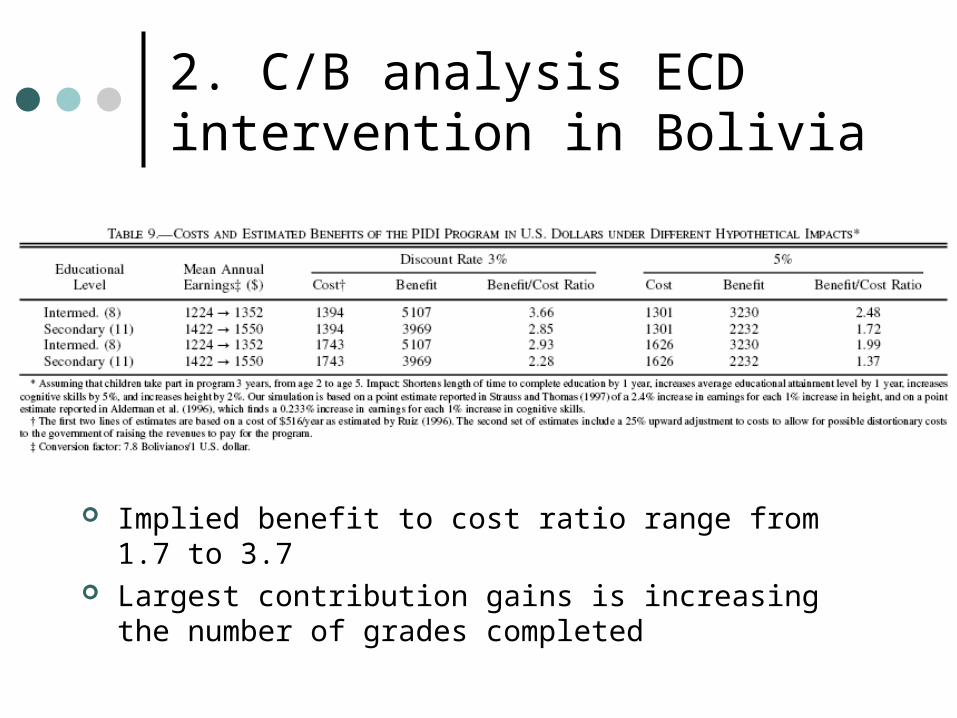
2. C/B analysis ECD intervention in Bolivia
Implied benefit to cost ratio range from 1.7 to 3.7 Largest contribution gains is increasing the number of
grades completed
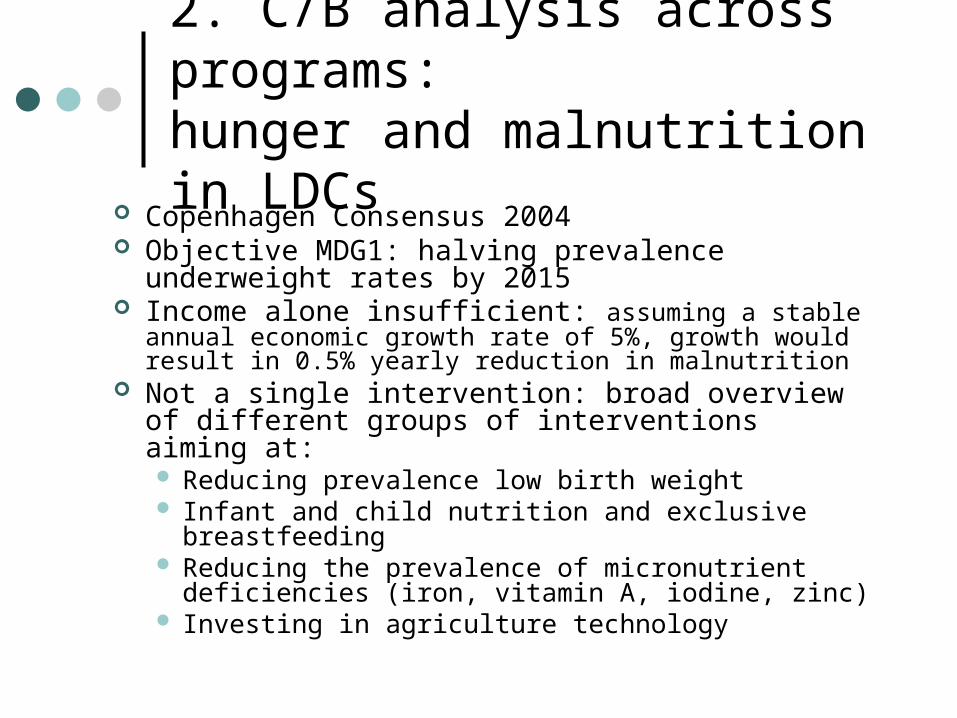
2. C/B analysis across programs:hunger and malnutrition in LDCs
Copenhagen Consensus 2004 Objective MDG1: halving prevalence underweight
rates by 2015 Income alone insufficient: assuming a stable annual
economic growth rate of 5%, growth would result in 0.5% yearly reduction in malnutrition
Not a single intervention: broad overview of different groups of interventions aiming at: Reducing prevalence low birth weight Infant and child nutrition and exclusive breastfeeding Reducing the prevalence of micronutrient
deficiencies (iron, vitamin A, iodine, zinc) Investing in agriculture technology
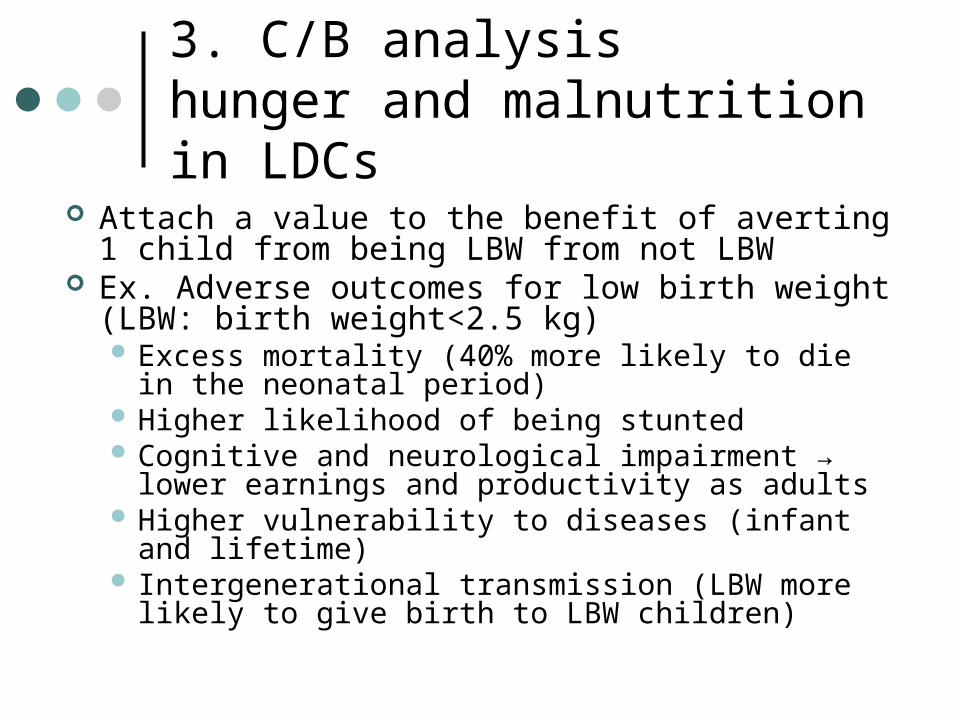
3. C/B analysis hunger and malnutrition in LDCs
Attach a value to the benefit of averting 1 child from being LBW from not LBW
Ex. Adverse outcomes for low birth weight (LBW: birth weight<2.5 kg) Excess mortality (40% more likely to die in the
neonatal period) Higher likelihood of being stunted Cognitive and neurological impairment → lower
earnings and productivity as adults Higher vulnerability to diseases (infant and lifetime) Intergenerational transmission (LBW more likely to
give birth to LBW children)
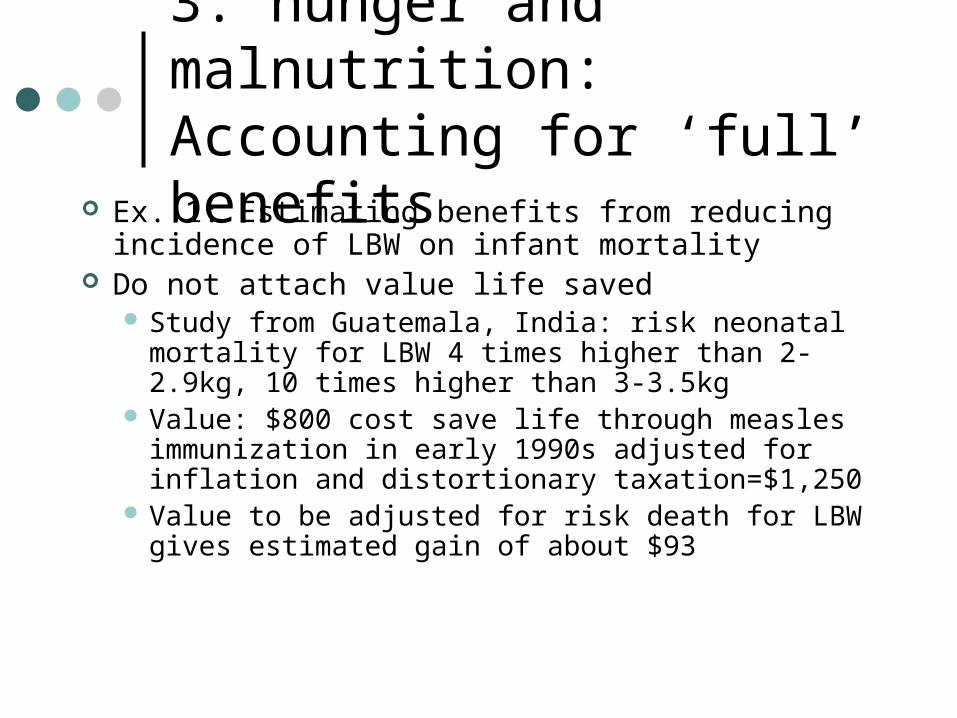
3. hunger and malnutrition:Accounting for ‘full’ benefits
Ex. 1: Estimating benefits from reducing incidence of LBW on infant mortality
Do not attach value life saved Study from Guatemala, India: risk neonatal
mortality for LBW 4 times higher than 2-2.9kg, 10 times higher than 3-3.5kg
Value: $800 cost save life through measles immunization in early 1990s adjusted for inflation and distortionary taxation=$1,250
Value to be adjusted for risk death for LBW gives estimated gain of about $93
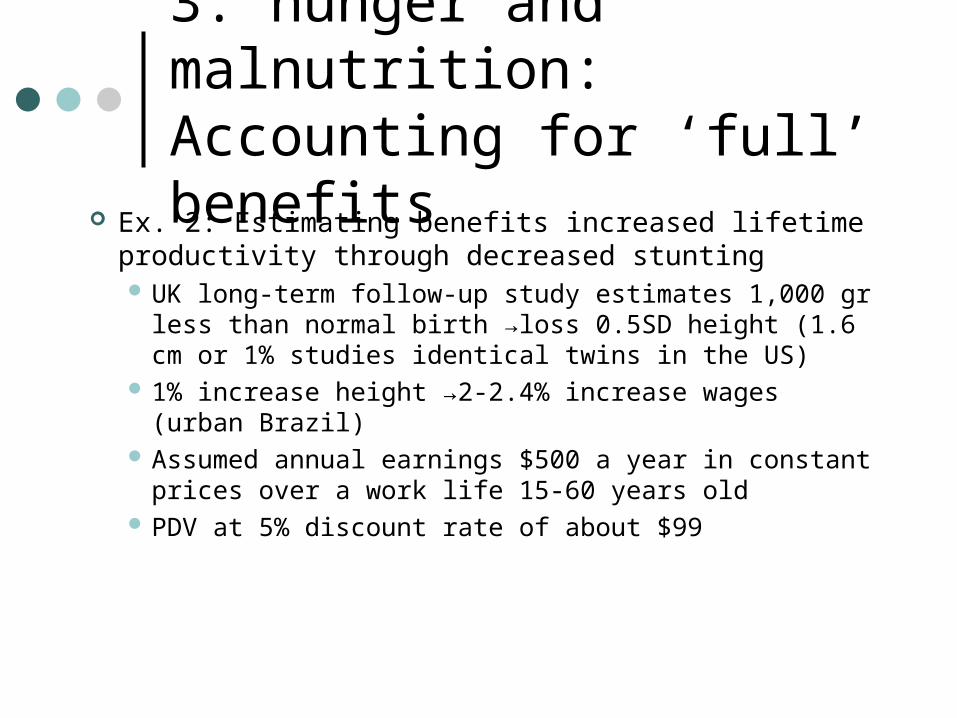
3. hunger and malnutrition:Accounting for ‘full’ benefits
Ex. 2: Estimating benefits increased lifetime productivity through decreased stunting UK long-term follow-up study estimates 1,000 gr
less than normal birth →loss 0.5SD height (1.6 cm or 1% studies identical twins in the US)
1% increase height →2-2.4% increase wages (urban Brazil)
Assumed annual earnings $500 a year in constant prices over a work life 15-60 years old
PDV at 5% discount rate of about $99
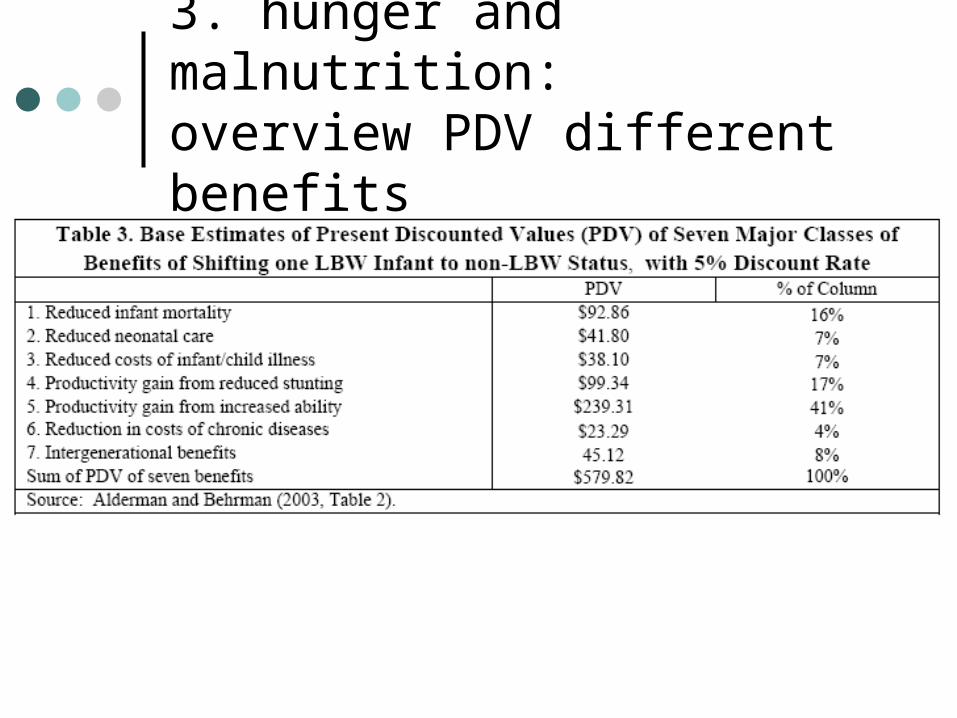
3. hunger and malnutrition:overview PDV different benefits
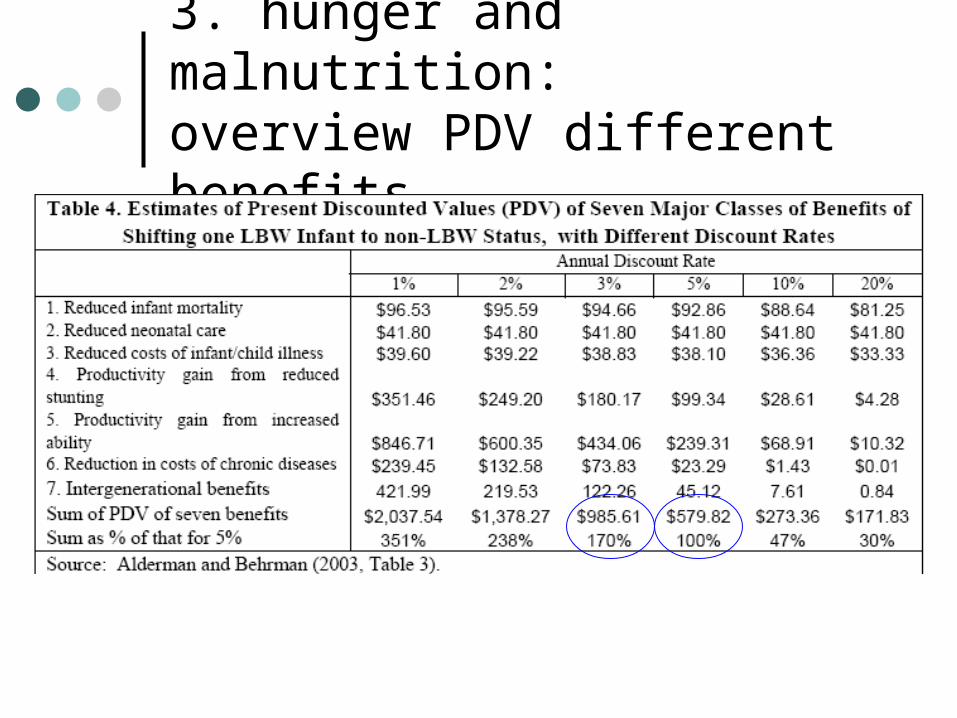
3. hunger and malnutrition:overview PDV different benefits
3. hunger and malnutrition:review various types of intervention
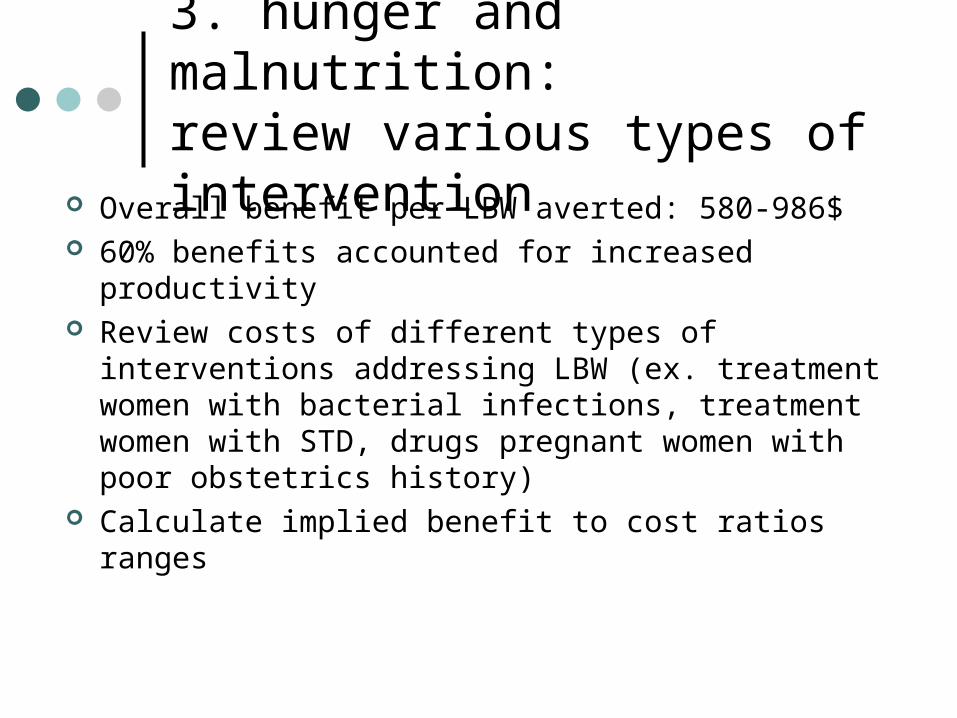
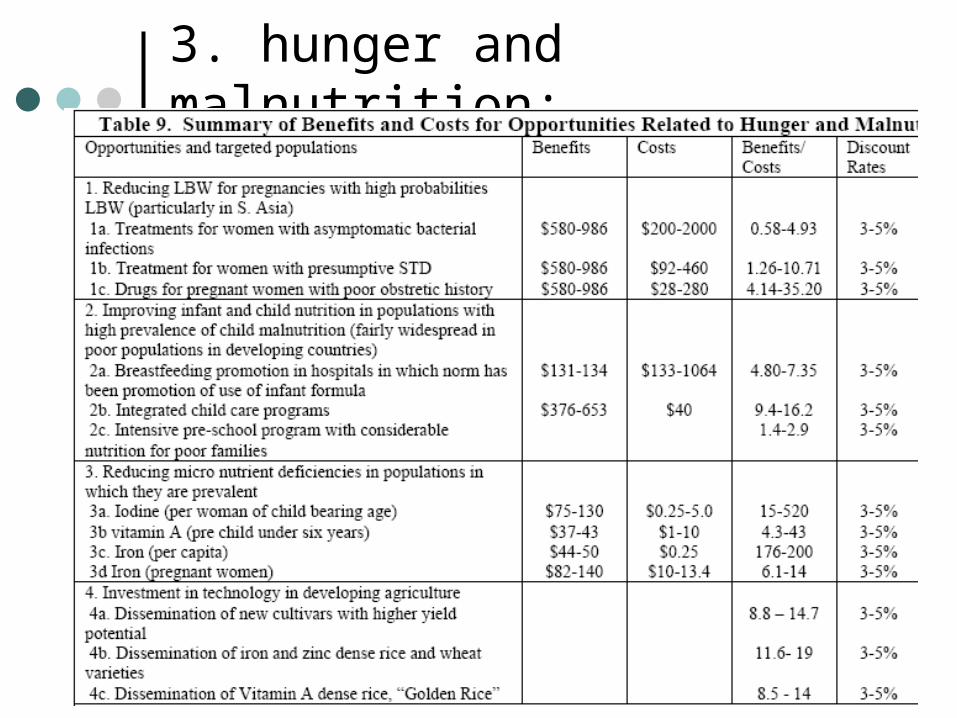
Overall benefit per LBW averted: 580-986$ 60% benefits accounted for increased productivity Review costs of different types of interventions
addressing LBW (ex. treatment women with bacterial infections, treatment women with STD, drugs pregnant women with poor obstetrics history)
Calculate implied benefit to cost ratios ranges
3. hunger and malnutrition:
Essential to account for full benefits and costs Awareness of the assumptions underlying cost-
benefit analysis and impact estimates Parameter generally estimated in the evaluation
literature do not lend themselves to marginal changes in policies Recent literature on distributional treatment
effects Ex-ante simulations. And structural modeling
Conclusions