Embed Size (px)
Citation preview


From CIO’s Desk November 2017
1
Macroeconomic concerns particularly on PKR devaluation amid fragile domestic politics continued to weigh heavy on the market sentiments during the month. Consequently, equities (KSE100 index) only managed to deliver a return of ~0.99% M/M during November 2017. CPI inflation rose to 3.97% Y/Y in November 2017 vs 3.8%/3.81% in October 2017/November 2016. SBP reported CAD at ~$1.32bn for October 2017 vs ~$956mn in September 2017. The increment was mainly led by higher trade deficit and decline in workers’ remittances. But imposition of regulatory duty on imports of 731 non-essential items coupled with issuance of Eurobond/Sukuk worth $2.5bn is likely to improve the BoP and forex reserves situation for the time being. We continue to monitor political and macroeconomic situation as senate election is due in March 2018. We believe timely elections are likely to be taken positively by the market. With respect to stock market performance, index heavy weight E&P sector continued to register gains on the back of increase in international crude oil prices due to geopolitical concerns and relatively normalized global inventory levels. On the other hand, announcement of abrupt closure of FO based power plants led to closure of local refinery operations which translated into declining stock prices of the mid-down stream energy chain. Though the decision was subsequently reversed, we assign high probabilities that FO based electricity generation will be restricted once RLNG and coal based power plants come online. Initial impression of this development seems positive for inefficient FO based IPPs and negative for efficient FO based IPPs. SBP announced the last MPS for 2017 keeping target rate unchanged at 5.75%. In November 2017, SBP borrowed total funds worth PKR. 1,314bn in the T-Bill auction against a monthly target of PKR.1,200bn with a total maturing amount of PKR 1,142bn. The bidding pattern was skewed towards 3-months tenor. In the first auction, SBP borrowed PKR 699bn against the target of PKR 650bn, with maturing amount of PKR 615bn. However, the total borrowed amount in the second auction was PKR.615bn against the target of PKR. 550bn with maturing amount of PKR.527bn. The cut-off yields for 3-month and 6-month T-Bill were 5.9910% and 6.0109% respectively, whereas no bids were received for 12-month T-Bill in the given month. Furthermore, SBP rejected the PIB auction while total bid amount was PKR 23.7bn against the target amount of PKR 50bn exhibiting market expectations of a rate hike in the near future. Going forward; the mounting pressure on external account and currency coupled with possible reversal of inflationary pressures provide little room for downward adjustment of the policy rate. We continue to monitor all key sectors and portfolio holdings on regular basis and reassess our investment case. We remain open-minded and do not hesitate in admitting our shortcomings and believe in rectifying them. We would like to take this opportunity to reiterate our equity strategy of buying quality companies at discounted valuations. It is imperative for investors to acknowledge that equity market returns over medium to long term are likely to beat other asset classes. It is in times of such volatility that investors must remain focused on valuations and not get overwhelmed by short term equity price movements.
19,000
19,500
20,000
20,500
21,000
21,500
-
20
40
60
80
100
120
1-N
ov
7-N
ov
13-N
ov
17-N
ov
23-N
ov
29-N
ov
Shares in mnKSE 30 Perfomance
Volume (L.H.S) KSE-30 (R.H.S)
0.0%
4.0%
8.0%
12.0%
16.0%
Apr-1
2Au
g-12
Dec-
12Ap
r-13
Aug-
13De
c-13
Apr-1
4Au
g-14
Dec-
14Ap
r-15
Aug-
15De
c-15
Apr-1
6Au
g-16
Dec-
16Ap
r-17
Aug-
17
Monthly YoY Inflation
Unit Trust of Pakistan (UTP) November 2017
MUFAP Recommended Format
2
Investment philosophy UTP is a balanced fund that aims to preserve and grow investor’s capital in the long term while providing a regular stream of current income on an annual basis. The fund operates a diverse portfolio of equity and fixed income investments whereby the equity component is meant to provide the growth in capital while dividends on the equity component along with the fixed income investments help generate the current income. Key information Fund type Open endCategory Balanced SchemeFund launch date 27 October, 1997Net Assets (PKR mn) 1,416.39Net Assets Excluding JSIL FoFs (PKR mn)
1,416.39
NAV (PKR) 160.05Benchmark BM #Management fee 2.00% (Exclusive of SST & FED)Front-end Load 3.00%Back-end Load NILPricing mechanism Forward Trustee Central Depository Company of Pakistan Ltd.Dealing Days & Cut-off time (Monday to Friday) 3:00 p.m.Auditor Deloitte Yousuf Adil Risk profile MediumListing PSXLeverage NILManagement Quality Rating AM2 by JCR-VISEntity Rating A+ (Long Term), A1 (Short Term) by PACRAInvestment Committee MembersMr. Hasnain Raza Nensey - CEO Mr. Zahid Ullah Khan - CIO / Fund ManagerMr. Khawar Iqbal - CFO Mr. Asad Ali - Acting Head of ResearchMr. Syed Ali Turab Alvi-CSO
80 90
100 110 120 130 140 150 160
Nov-1
4
Jan-1
5
Mar-1
5
May-1
5
Jul-1
5
Sep-1
5
Nov-1
5
Jan-1
6
Mar-1
6
May-1
6
Jul-1
6
Sep-1
6
Nov-1
6
Jan-1
7
Mar-1
7
May-1
7
Jul-1
7
Sep-1
7
Nov-1
7
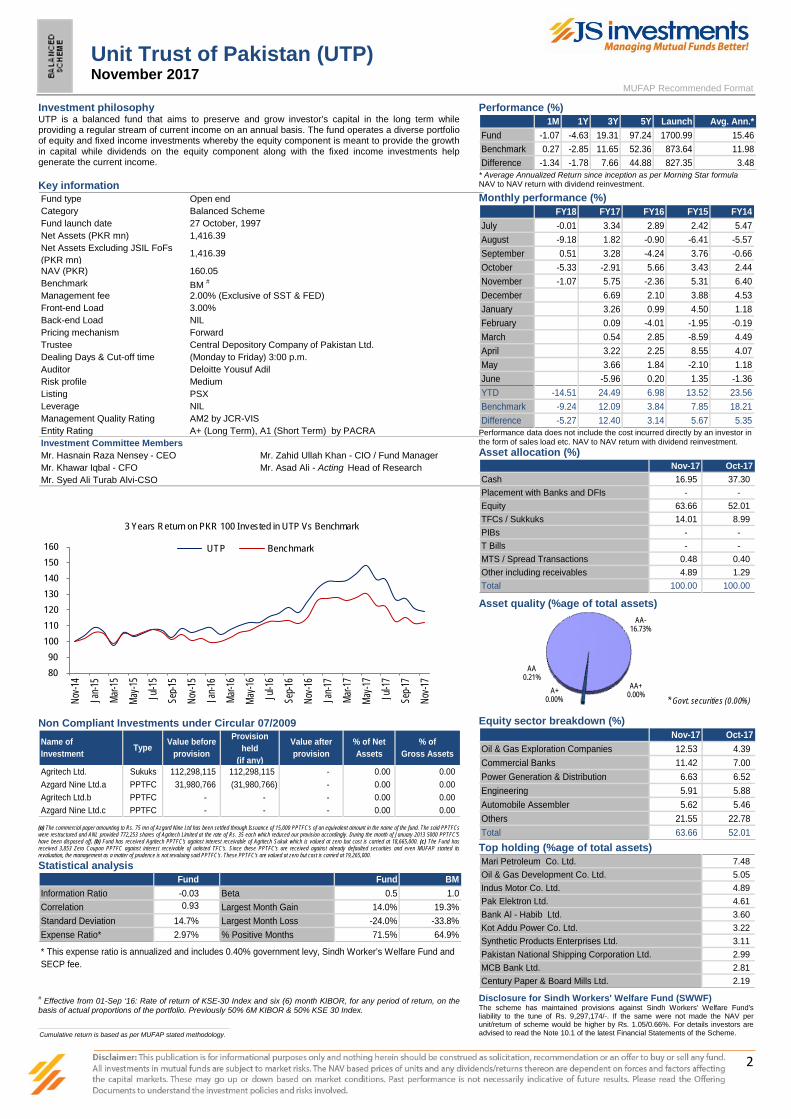
3 Years Return on PKR 100 Invested in UTP Vs Benchmark
UTP Benchmark
Non Compliant Investments under Circular 07/2009 Name ofInvestment Type Value before
provision
Provision held
(if any)
Value after provision
% of Net Assets
% of Gross Assets
Agritech Ltd. Sukuks 112,298,115 112,298,115 - 0.00 0.00Azgard Nine Ltd.a PPTFC 31,980,766 (31,980,766) - 0.00 0.00Agritech Ltd.b PPTFC - - - 0.00 0.00Azgard Nine Ltd.c PPTFC - - - 0.00 0.00
(a) The commercial paper amounting to Rs. 75 mn of Azgard Nine Ltd has been settled through Issuance of 15,000 PPTFC's of an equivalent amount in the name of the fund. The said PPTFCs were restructured and ANL provided 772,253 shares of Agritech Limited at the rate of Rs. 35 each which reduced our provision accordingly. During the month of January 2013 5000 PPTFC'S have been disposed off. (b) Fund has received Agritech PPTFC's against interest receivable of Agritech Sukuk which is valued at zero but cost is carried at 18,665,000. (c) The Fund has received 3,853 Zero Coupon PPTFC against interest receivable of unlisted TFC's. Since these PPTFC's are received against already defaulted securities and even MUFAP started its revaluation, the management as a matter of prudence is not revaluing said PPTFC's. These PPTFC's are valued at zero but cost is carried at 19,265,000. # Effective from 01-Sep ‘16: Rate of return of KSE-30 Index and six (6) month KIBOR, for any period of return, on the basis of actual proportions of the portfolio. Previously 50% 6M KIBOR & 50% KSE 30 Index.
Cumulative return is based as per MUFAP stated methodology.
Performance (%) 1M 1Y 3Y 5Y Launch Avg. Ann.*
Fund -1.07 -4.63 19.31 97.24 1700.99 15.46Benchmark 0.27 -2.85 11.65 52.36 873.64 11.98Difference -1.34 -1.78 7.66 44.88 827.35 3.48
* Average Annualized Return since inception as per Morning Star formula NAV to NAV return with dividend reinvestment.
Monthly performance (%) FY18 FY17 FY16 FY15 FY14
July -0.01 3.34 2.89 2.42 5.47August -9.18 1.82 -0.90 -6.41 -5.57September 0.51 3.28 -4.24 3.76 -0.66October -5.33 -2.91 5.66 3.43 2.44November -1.07 5.75 -2.36 5.31 6.40December 6.69 2.10 3.88 4.53January 3.26 0.99 4.50 1.18February 0.09 -4.01 -1.95 -0.19March 0.54 2.85 -8.59 4.49April 3.22 2.25 8.55 4.07May 3.66 1.84 -2.10 1.18June -5.96 0.20 1.35 -1.36YTD -14.51 24.49 6.98 13.52 23.56Benchmark -9.24 12.09 3.84 7.85 18.21Difference -5.27 12.40 3.14 5.67 5.35
Performance data does not include the cost incurred directly by an investor in the form of sales load etc. NAV to NAV return with dividend reinvestment.
Asset allocation (%) Nov-17 Oct-17
Cash 16.95 37.30 Placement with Banks and DFIs - - Equity 63.66 52.01 TFCs / Sukkuks 14.01 8.99 PIBs - - T Bills - - MTS / Spread Transactions 0.48 0.40 Other including receivables 4.89 1.29 Total 100.00 100.00
Asset quality (%age of total assets)
AA0.21%
AA+0.00%A+
0.00%
AA-16.73%
* Govt. securities (0.00%)
Equity sector breakdown (%) Nov-17 Oct-17
Oil & Gas Exploration Companies 12.53 4.39 Commercial Banks 11.42 7.00 Power Generation & Distribution 6.63 6.52 Engineering 5.91 5.88 Automobile Assembler 5.62 5.46 Others 21.55 22.78 Total 63.66 52.01
Top holding (%age of total assets) Mari Petroleum Co. Ltd. 7.48 Oil & Gas Development Co. Ltd. 5.05 Indus Motor Co. Ltd. 4.89 Pak Elektron Ltd. 4.61 Bank Al - Habib Ltd. 3.60 Kot Addu Power Co. Ltd. 3.22 Synthetic Products Enterprises Ltd. 3.11 Pakistan National Shipping Corporation Ltd. 2.99 MCB Bank Ltd. 2.81 Century Paper & Board Mills Ltd. 2.19
Disclosure for Sindh Workers' Welfare Fund (SWWF) The scheme has maintained provisions against Sindh Workers' Welfare Fund's liability to the tune of Rs. 9,297,174/-. If the same were not made the NAV per unit/return of scheme would be higher by Rs. 1.05/0.66%. For details investors are advised to read the Note 10.1 of the latest Financial Statements of the Scheme.
Statistical analysis Fund Fund BM
Information Ratio -0.03 Beta 0.5 1.0Correlation 0.93 Largest Month Gain 14.0% 19.3%Standard Deviation 14.7% Largest Month Loss -24.0% -33.8%Expense Ratio* 2.97% % Positive Months 71.5% 64.9%
* This expense ratio is annualized and includes 0.40% government levy, Sindh Worker’s Welfare Fund and SECP fee.

EQU
ITY
SCH
EME
JS Growth Fund (JS GF) November 2017
MUFAP Recommended Format
3
Investment philosophy
The main objective of JSGF is to enable the Certificate Holders to participate in a diversified portfolio of high quality equity securities listed on the stock exchanges and to maximize the investment return, by prudent investment management. Key information Fund type Open endCategory Equity SchemeFund launch date 06 June, 2006 *Net Assets (PKR mn) 2,142.71Net Assets Excluding JSIL FoFs (PKR mn)
2,142.71
NAV (PKR) 185.17Benchmark KSE30 (Total Return Index) Effective from 01-Sep '16.Management fee 2.00% (Exclusive of SST & FED)Front-end Load 3.00%Back-end Load NILPricing mechanism Forward Trustee MCB Financial Services LtdDealing Days & Cut-off time (Monday to Friday) 3:00 p.m.Auditor Grant Thorton
Risk profile HighListing PSXLeverage NILManagement Quality Rating AM2 by JCR-VISEntity Rating A+ (Long Term), A1 (Short Term) by PACRAInvestment Committee MembersMr. Hasnain Raza Nensey - CEO Mr. Syed Ali Turab Alvi-CSOMr. Zahid Ullah Khan - CIO / Fund Manager Mr. Asad Ali - Acting Head of ResearchMr. Khawar Iqbal - CFO
80
100
120
140
160
180
Nov-
14Ja
n-15
Mar
-15
May
-15
Jul-1
5Se
p-15
Nov-
15Ja
n-16
Mar
-16
May
-16
Jul-1
6Se
p-16
Nov-
16Ja
n-17
Mar
-17
May
-17
Jul-1
7Se
p-17
Nov-
17
3 Years Return on PKR 100 Invested in JS Growth Fund Vs Benchmark
JSGF Benchmark
-
20
40
60
80
100
Jun-17 Jul-17 Aug-17 Sep-17 Oct-17 Nov-17
Equity Cash Other including receivables
Performance (%) 1M 1Y 3Y 5Y Launch Avg. Ann.*
Fund -0.73 -6.36 31.53 150.35 199.11 10.00Benchmark 1.38 -6.32 7.49 62.84 79.45 5.22Difference -2.11 -0.04 24.04 87.51 119.66 4.78
* Average Annualized Return since inception as per Morning Star formula NAV to NAV return with dividend reinvestment.
Monthly performance (%) FY18 FY17 FY16 FY15 FY14
July 0.76 3.46 3.44 2.92 11.41August -11.28 3.45 -2.40 -9.21 -8.85September 0.26 3.02 -6.80 4.22 0.45October -5.86 0.94 6.53 1.46 1.83November -0.73 10.55 -4.82 3.53 15.14December 9.87 3.81 8.28 4.63January 7.16 -0.79 8.17 1.43February -1.51 -4.46 -5.12 0.06March -0.73 4.74 -11.16 6.43April 2.78 3.49 11.54 3.18May 3.12 1.02 -2.67 1.78June -8.37 1.06 2.53 -1.28YTD -16.25 37.56 3.88 12.42 40.12Benchmark -14.40 17.92 0.37 5.67 25.96Difference -1.85 19.64 3.51 6.75 14.16
Performance data does not include the cost incurred directly by an investor in the form of sales load etc. NAV to NAV return with dividend reinvestment. Asset allocation (%)
Nov-17 Oct-17Cash 11.00 19.30Equity 83.80 79.50Other including receivables 5.21 1.20Total 100.00 100.00 Equity sector breakdown (%)
Nov-17 Oct-17Insurance 14.81 14.97Oil & Gas Exploration Companies 11.06 5.29Commercial Banks 10.06 9.73Sugar & Allied Industries 9.19 8.68Engineering 6.04 6.16Others 32.63 34.67Total 83.80 79.50 Top holding (%age of total assets) Shahtaj Sugar Mills Ltd. 8.38IGI Insurance Ltd. 8.21Adamjee Insurance Co. Ltd. 6.59Mari Petroleum Co. Ltd. 5.75Oil & Gas Development Co. Ltd. 5.31Pak Elektron Ltd. 4.39Rafhan Maize Products Ltd. 4.26Orix Leasing Pakistan Ltd. 4.02Attock Petroleum Ltd. 3.47Bank Alfalah Ltd. 3.44 Disclosure for Sindh Workers' Welfare Fund (SWWF) The scheme has maintained provisions against Sindh Workers' Welfare Fund's liability to the tune of Rs. 18,411,165/-. If the same were not made the NAV per unit/return of scheme would be higher by Rs. 1.59/0.86%. For details investors are advised to read the Note 10.1 of the latest Financial Statements of the Scheme. * Converted into open end scheme on 19 July, 2013.
Cumulative return is based as per MUFAP stated methodology.
Statistical analysis Fund Fund BM
Information Ratio -0.01 Beta 0.8 1.0Correlation 0.92 Largest Month Gain 18.9% 25.2%Standard Deviation 23.4% Largest Month Loss -35.2% -45.1%Expense Ratio* 2.88% % Positive Months 62.3% 60.1%
* This expense ratio is annualized and includes 0.40% government levy, Sindh Worker’s Welfare Fund and SECP fee.Selling & Marketing Expense PKR 378,259.
JS Value Fund (JS VF) November 2017
MUFAP Recommended Format
4
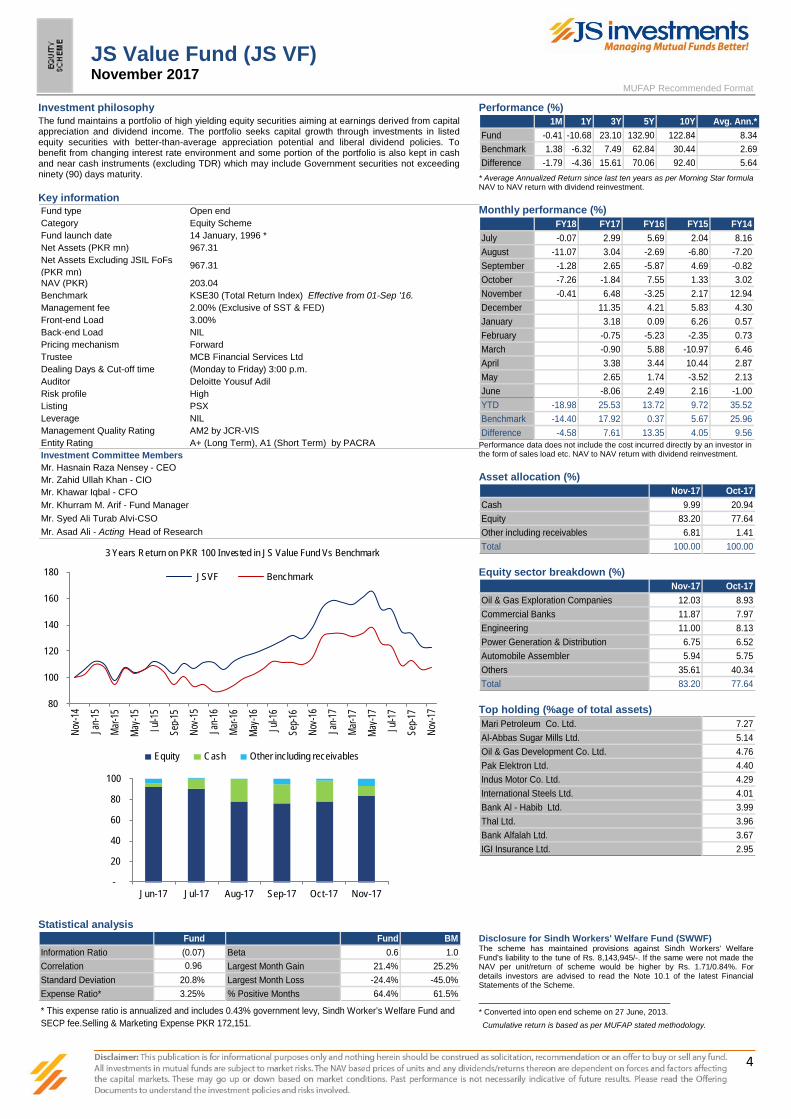
Investment philosophy
The fund maintains a portfolio of high yielding equity securities aiming at earnings derived from capital appreciation and dividend income. The portfolio seeks capital growth through investments in listed equity securities with better-than-average appreciation potential and liberal dividend policies. To benefit from changing interest rate environment and some portion of the portfolio is also kept in cash and near cash instruments (excluding TDR) which may include Government securities not exceeding ninety (90) days maturity. Key information Fund type Open endCategory Equity SchemeFund launch date 14 January, 1996 *Net Assets (PKR mn) 967.31Net Assets Excluding JSIL FoFs (PKR mn)
967.31
NAV (PKR) 203.04Benchmark KSE30 (Total Return Index) Effective from 01-Sep '16.Management fee 2.00% (Exclusive of SST & FED)Front-end Load 3.00%Back-end Load NILPricing mechanism Forward Trustee MCB Financial Services LtdDealing Days & Cut-off time (Monday to Friday) 3:00 p.m.Auditor Deloitte Yousuf Adil Risk profile HighListing PSXLeverage NILManagement Quality Rating AM2 by JCR-VISEntity Rating A+ (Long Term), A1 (Short Term) by PACRAInvestment Committee MembersMr. Hasnain Raza Nensey - CEOMr. Zahid Ullah Khan - CIOMr. Khawar Iqbal - CFOMr. Khurram M. Arif - Fund ManagerMr. Syed Ali Turab Alvi-CSOMr. Asad Ali - Acting Head of Research
80
100
120
140
160
180
Nov-1
4
Jan-1
5
Mar-1
5
May-1
5
Jul-1
5
Sep-1
5
Nov-1
5
Jan-1
6
Mar-1
6
May-1
6
Jul-1
6
Sep-1
6
Nov-1
6
Jan-1
7
Mar-1
7
May-1
7
Jul-1
7
Sep-1
7
Nov-1
7
3 Years Return on PKR 100 Invested in JS Value Fund Vs Benchmark
JSVF Benchmark
-
20
40
60
80
100
Jun-17 Jul-17 Aug-17 Sep-17 Oct-17 Nov-17
Equity Cash Other including receivables
Performance (%) 1M 1Y 3Y 5Y 10Y Avg. Ann.*
Fund -0.41 -10.68 23.10 132.90 122.84 8.34Benchmark 1.38 -6.32 7.49 62.84 30.44 2.69Difference -1.79 -4.36 15.61 70.06 92.40 5.64
* Average Annualized Return since last ten years as per Morning Star formula NAV to NAV return with dividend reinvestment. Monthly performance (%)
FY18 FY17 FY16 FY15 FY14July -0.07 2.99 5.69 2.04 8.16August -11.07 3.04 -2.69 -6.80 -7.20September -1.28 2.65 -5.87 4.69 -0.82October -7.26 -1.84 7.55 1.33 3.02November -0.41 6.48 -3.25 2.17 12.94December 11.35 4.21 5.83 4.30January 3.18 0.09 6.26 0.57February -0.75 -5.23 -2.35 0.73March -0.90 5.88 -10.97 6.46April 3.38 3.44 10.44 2.87May 2.65 1.74 -3.52 2.13June -8.06 2.49 2.16 -1.00YTD -18.98 25.53 13.72 9.72 35.52Benchmark -14.40 17.92 0.37 5.67 25.96Difference -4.58 7.61 13.35 4.05 9.56
Performance data does not include the cost incurred directly by an investor in the form of sales load etc. NAV to NAV return with dividend reinvestment. Asset allocation (%)
Nov-17 Oct-17Cash 9.99 20.94Equity 83.20 77.64Other including receivables 6.81 1.41Total 100.00 100.00 Equity sector breakdown (%)
Nov-17 Oct-17Oil & Gas Exploration Companies 12.03 8.93Commercial Banks 11.87 7.97Engineering 11.00 8.13Power Generation & Distribution 6.75 6.52Automobile Assembler 5.94 5.75Others 35.61 40.34Total 83.20 77.64 Top holding (%age of total assets) Mari Petroleum Co. Ltd. 7.27Al-Abbas Sugar Mills Ltd. 5.14Oil & Gas Development Co. Ltd. 4.76Pak Elektron Ltd. 4.40Indus Motor Co. Ltd. 4.29International Steels Ltd. 4.01Bank Al - Habib Ltd. 3.99Thal Ltd. 3.96Bank Alfalah Ltd. 3.67IGI Insurance Ltd. 2.95 Disclosure for Sindh Workers' Welfare Fund (SWWF) The scheme has maintained provisions against Sindh Workers' Welfare Fund's liability to the tune of Rs. 8,143,945/-. If the same were not made the NAV per unit/return of scheme would be higher by Rs. 1.71/0.84%. For details investors are advised to read the Note 10.1 of the latest Financial Statements of the Scheme.
* Converted into open end scheme on 27 June, 2013.
Cumulative return is based as per MUFAP stated methodology.
Statistical analysis Fund Fund BM
Information Ratio (0.07) Beta 0.6 1.0Correlation 0.96 Largest Month Gain 21.4% 25.2%Standard Deviation 20.8% Largest Month Loss -24.4% -45.0%Expense Ratio* 3.25% % Positive Months 64.4% 61.5%
* This expense ratio is annualized and includes 0.43% government levy, Sindh Worker’s Welfare Fund and SECP fee.Selling & Marketing Expense PKR 172,151.
EQU
ITY
SCH
EME
JS Large Cap. Fund (JS LCF) November 2017
MUFAP Recommended Format
5
Investment philosophy
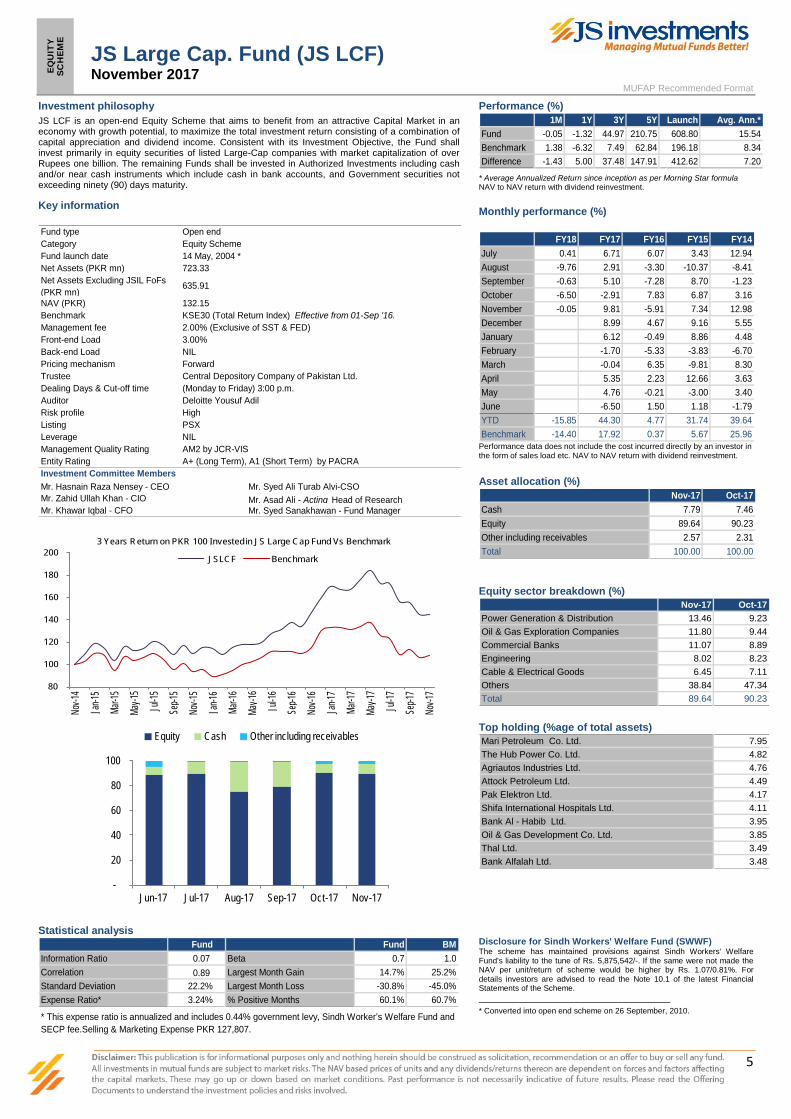
JS LCF is an open-end Equity Scheme that aims to benefit from an attractive Capital Market in an economy with growth potential, to maximize the total investment return consisting of a combination of capital appreciation and dividend income. Consistent with its Investment Objective, the Fund shall invest primarily in equity securities of listed Large-Cap companies with market capitalization of over Rupees one billion. The remaining Funds shall be invested in Authorized Investments including cash and/or near cash instruments which include cash in bank accounts, and Government securities not exceeding ninety (90) days maturity. Key information
Fund type Open endCategory Equity SchemeFund launch date 14 May, 2004 *Net Assets (PKR mn) 723.33Net Assets Excluding JSIL FoFs (PKR mn)
635.91
NAV (PKR) 132.15Benchmark KSE30 (Total Return Index) Effective from 01-Sep '16.Management fee 2.00% (Exclusive of SST & FED)Front-end Load 3.00%Back-end Load NILPricing mechanism Forward Trustee Central Depository Company of Pakistan Ltd.Dealing Days & Cut-off time (Monday to Friday) 3:00 p.m.Auditor Deloitte Yousuf Adil Risk profile HighListing PSXLeverage NILManagement Quality Rating AM2 by JCR-VISEntity Rating A+ (Long Term), A1 (Short Term) by PACRAInvestment Committee MembersMr. Hasnain Raza Nensey - CEO Mr. Syed Ali Turab Alvi-CSOMr. Zahid Ullah Khan - CIO Mr. Asad Ali - Acting Head of ResearchMr. Khawar Iqbal - CFO Mr. Syed Sanakhawan - Fund Manager
80
100
120
140
160
180
200
Nov-1
4
Jan-1
5
Mar-1
5
May-1
5
Jul-1
5
Sep-1
5
Nov-1
5
Jan-1
6
Mar -1
6
May-1
6
Jul -1
6
Sep-1
6
Nov-1
6
Jan-1
7
Mar-1
7
May-1
7
Jul-1
7
Sep-1
7
Nov-1
7
3 Years Return on PKR 100 Invested in JS Large Cap Fund Vs Benchmark
JSLCF Benchmark
-
20
40
60
80
100
Jun-17 Jul-17 Aug-17 Sep-17 Oct-17 Nov-17
Equity Cash Other including receivables
Statistical analysis
Fund Fund BMInformation Ratio 0.07 Beta 0.7 1.0Correlation 0.89 Largest Month Gain 14.7% 25.2%Standard Deviation 22.2% Largest Month Loss -30.8% -45.0%Expense Ratio* 3.24% % Positive Months 60.1% 60.7%
* This expense ratio is annualized and includes 0.44% government levy, Sindh Worker’s Welfare Fund and SECP fee.Selling & Marketing Expense PKR 127,807.
Performance (%) 1M 1Y 3Y 5Y Launch Avg. Ann.*
Fund -0.05 -1.32 44.97 210.75 608.80 15.54Benchmark 1.38 -6.32 7.49 62.84 196.18 8.34Difference -1.43 5.00 37.48 147.91 412.62 7.20
* Average Annualized Return since inception as per Morning Star formula NAV to NAV return with dividend reinvestment.
Monthly performance (%)
FY18 FY17 FY16 FY15 FY14July 0.41 6.71 6.07 3.43 12.94August -9.76 2.91 -3.30 -10.37 -8.41September -0.63 5.10 -7.28 8.70 -1.23October -6.50 -2.91 7.83 6.87 3.16November -0.05 9.81 -5.91 7.34 12.98December 8.99 4.67 9.16 5.55January 6.12 -0.49 8.86 4.48February -1.70 -5.33 -3.83 -6.70March -0.04 6.35 -9.81 8.30April 5.35 2.23 12.66 3.63May 4.76 -0.21 -3.00 3.40June -6.50 1.50 1.18 -1.79YTD -15.85 44.30 4.77 31.74 39.64Benchmark -14.40 17.92 0.37 5.67 25.96
Performance data does not include the cost incurred directly by an investor in the form of sales load etc. NAV to NAV return with dividend reinvestment.
Asset allocation (%)
Nov-17 Oct-17Cash 7.79 7.46Equity 89.64 90.23Other including receivables 2.57 2.31Total 100.00 100.00
Equity sector breakdown (%)
Nov-17 Oct-17Power Generation & Distribution 13.46 9.23Oil & Gas Exploration Companies 11.80 9.44Commercial Banks 11.07 8.89Engineering 8.02 8.23Cable & Electrical Goods 6.45 7.11Others 38.84 47.34Total 89.64 90.23
Top holding (%age of total assets) Mari Petroleum Co. Ltd. 7.95The Hub Power Co. Ltd. 4.82Agriautos Industries Ltd. 4.76Attock Petroleum Ltd. 4.49Pak Elektron Ltd. 4.17Shifa International Hospitals Ltd. 4.11Bank Al - Habib Ltd. 3.95Oil & Gas Development Co. Ltd. 3.85Thal Ltd. 3.49Bank Alfalah Ltd. 3.48
Disclosure for Sindh Workers' Welfare Fund (SWWF) The scheme has maintained provisions against Sindh Workers' Welfare Fund's liability to the tune of Rs. 5,875,542/-. If the same were not made the NAV per unit/return of scheme would be higher by Rs. 1.07/0.81%. For details investors are advised to read the Note 10.1 of the latest Financial Statements of the Scheme. * Converted into open end scheme on 26 September, 2010.

JS Islamic Fund (JS ISF) November 2017
MUFAP Recommended Format
6
Investment philosophy
JS Islamic Fund [JS ISF] aims to grow investor’s capital in the long term in adherence with principles of Shariah compliance as advised by the Shariah Advisory Council (SAC) of this fund. The fund investments are limited to asset classes approved by the Shariah Advisory Council (SAC) and all companies under investment consideration are semiannually screened for Shariah compliance. Key information Fund type Open endCategory Shariah Compliant Islamic - Equity SchemeFund launch date 27 December, 2002Net Assets (PKR mn) 1,422.44Net Assets Excluding JSIL FoFs (PKR mn)
1,248.57
NAV (PKR) 106.65Benchmark KMI-30 IndexManagement fee 2.00% (Exclusive of SST & FED)Front-end Load 3.00%Back-end Load NILPricing mechanism Forward Trustee Central Depository Company of Pakistan Ltd.Dealing Days & Cut-off time (Monday to Friday) 3:00 p.m.Auditor A. F. Ferguson & Co.Shariah advisor M/s. Al Hilal Shariah Advisors (Pvt) LimitedRisk profile HighListing PSXLeverage NILManagement Quality Rating AM2 by JCR-VISEntity Rating A+ (Long Term), A1 (Short Term) by PACRAInvestment Committee MembersMr. Hasnain Raza Nensey - CEOMr. Zahid Ullah Khan - CIO / Fund ManagerMr. Khawar Iqbal - CFOMr. Syed Ali Turab Alvi-CSOMr. Asad Ali - Acting Head of Research
80 100 120 140 160 180 200 220
Nov-1
4
Jan-1
5
Mar-1
5
May-1
5
Jul-1
5
Sep-1
5
Nov-1
5
Jan-1
6
Mar-1
6
May-1
6
Jul-1
6
Sep-1
6
Nov-1
6
Jan-1
7
Mar-1
7
May-1
7
Jul-1
7
Sep-1
7
Nov-1
7
3 Years Retun on PKR 100 Inveseted in JS Islamic Fund Vs Benchmark
ISF Benchmark
-
20
40
60
80
100
Jun-17 Jul-17 Aug-17 Sep-17 Oct-17 Nov-17
Equity Cash Other including receivables
Performance (%) 1M 1Y 3Y 5Y Launch Avg. Ann.*
Fund -1.01 -8.47 53.49 225.92 873.89 16.46Benchmark 1.19 -4.67 36.78 138.79 661.91 14.56Difference -2.20 -3.80 16.71 87.13 211.98 1.90
* Average Annualized Return since inception as per Morning Star formula NAV to NAV return with dividend reinvestment.
Monthly performance (%) FY18 FY17 FY16 FY15 FY14
July -0.13 9.76 2.96 3.79 15.35August -10.34 1.98 -4.33 -11.70 -11.98September -1.03 7.51 -6.10 9.19 1.59October -6.99 -2.04 5.97 8.71 1.02November -1.01 10.44 -5.64 7.98 10.07December 8.12 4.56 8.68 4.84January 3.13 0.54 7.41 5.64February -1.21 -5.20 -1.86 -3.33March 0.27 7.66 -10.57 7.37April 6.12 2.37 13.79 3.46May 2.94 1.85 -1.15 0.81June -7.02 2.33 5.55 0.67YTD -18.41 46.06 5.88 42.90 38.43Benchmark -13.36 18.80 15.53 20.10 29.89Difference -5.05 27.26 -9.65 22.80 8.54
Performance data does not include the cost incurred directly by an investor in the form of sales load etc. NAV to NAV return with dividend reinvestment. Asset allocation (%)
Nov-17 Oct-17Cash 9.44 28.42Equity 85.05 70.16Other including receivables 5.51 1.42Total 100.00 100.00
Equity sector breakdown (%)
Nov-17 Oct-17Oil & Gas Exploration Companies 17.66 8.77Engineering 12.01 8.61Power Generation & Distribution 10.37 9.39Cable & Electrical Goods 6.61 6.76Automobile Parts & Accessories 5.45 4.42Others 32.95 32.20Total 85.05 70.16 Top holding (%age of total assets) Oil & Gas Development Co. Ltd. 9.32Mari Petroleum Co. Ltd. 8.34Agriautos Industries Ltd. 5.45Pak Elektron Ltd. 4.84Engro Corporation Ltd. 4.75International Steels Ltd. 4.14The Hub Power Co. Ltd. 4.12Attock Petroleum Ltd. 3.88Kot Addu Power Co. Ltd. 3.73Thal Ltd. 3.63
Disclosure for Sindh Workers' Welfare Fund (SWWF) The scheme has maintained provisions against Sindh Workers' Welfare Fund's liability to the tune of Rs. 9,243,107/-. If the same were not made the NAV per unit/return of scheme would be higher by Rs. 0.69/0.65%. For details investors are advised to read the Note 10.1 of the latest Financial Statements of the Scheme. Cumulative returns are based as per MUFAP stated methodology.
Statistical analysis Fund Fund BM
Information Ratio (0.08) Beta 0.8 1.0Correlation 0.93 Largest Month Gain 15.4% 20.2%Standard Deviation 21.9% Largest Month Loss -28.7% -37.1%Expense Ratio* 3.13% % Positive Months 67.2% 64.2%
* This expense ratio is annualized and includes 0.43% government levy, Sindh Worker’s Welfare Fund and SECP fee.Selling & Marketing Expense PKR 257,257.

JS Fund of Funds (JS FoF) November 2017
MUFAP Recommended Format
7
Investment philosophy
JS FoF is a fund of funds that aims to grow investor’s capital in the long term while diversifying the asset manager risk bundled together with the benefits of an asset allocation fund. The fund operates a diverse portfolio of equity, balanced, fixed income and money market funds (both open and closed ended) with the option to adjust the asset mix as equity markets rise or fall and the economy strengthens or weakens.
Key information Fund type Open endCategory Fund of Fund SchemeFund launch date 31 October, 2005Net Assets (PKR mn) 273.70Net Assets Excluding JSIL FoFs (PKR mn)
273.70
NAV (PKR) 50.77Benchmark BM FOF#
Management fee 1.00% (Exclusive of SST & FED)Front-end Load 3.00%Back-end Load NILPricing mechanism Forward Trustee Central Depository Company of Pakistan Ltd.Dealing Days & Cut-off time (Monday to Friday) 3:00 p.m.Auditor Deloitte Yousuf Adil Risk profile MediumListing PSXLeverage NILManagement Quality Rating AM2 by JCR-VISEntity Rating A+ (Long Term), A1 (Short Term) by PACRAInvestment Committee MembersMr. Hasnain Raza Nensey - CEOMr. Zahid Ullah Khan - CIO / Fund ManagerMr. Khawar Iqbal - CFOMr. Syed Ali Turab Alvi-CSOMr. Asad Ali - Acting Head of Research
80
90
100
110
120
130
140
150
160
170
Nov-1
4
Jan-15
Mar-15
May-1
5
Jul-15
Sep-1
5
Nov-1
5
Jan-16
Mar-16
May-1
6
Jul-16
Sep-1
6
Nov-1
6
Jan-17
Mar-17
May-1
7
Jul-17
Sep-1
7
Nov-1
7
3 Years Return on PKR 100 Invested in JS Fund of Fund Vs Benchmark
FoF Benchmark
75
80
85
90
95
100
Jun-17 Jul-17 Aug-17 Sep-17 Oct-17 Nov-17
Open End / Closed End Funds Cash
Statistical analysis
Fund Fund BMInformation Ratio 0.09 Beta 0.9 1.0Correlation 0.94 Largest Month Gain 13.6% 11.0%Standard Deviation 16.1% Largest Month Loss -13.7% -25.1%Expense Ratio* 1.31% % Positive Months 65.8% 67.8%
* This expense ratio is annualized and includes 0.21% government levy, Sindh Worker’s Welfare Fund and SECP fee.
Performance (%) 1M 1Y 3Y 5Y Launch Avg. Ann.*
Fund -1.32 -1.55 28.63 118.33 333.74 12.90Benchmark 0.93 -6.91 19.99 78.15 165.97 8.43Difference -2.25 5.36 8.64 40.18 167.77 4.48
* Average Annualized Return since inception as per Morning Star formula NAV to NAV return with dividend reinvestment. Monthly performance (%)
FY18 FY17 FY16 FY15 FY14July -0.22 1.09 2.66 4.88 13.60August -8.63 0.94 -2.28 -7.37 -8.62September 0.17 2.85 -6.25 3.52 6.78October -3.18 -3.09 5.78 2.93 -0.05November -1.32 5.77 -2.97 4.47 7.87December 8.27 3.78 5.34 4.63January 4.48 -1.11 5.35 3.32February -0.28 -3.30 -0.95 -2.52March -0.78 6.21 -7.01 5.38April 3.95 3.63 10.03 4.43May 3.85 3.71 -1.97 1.77June -6.62 -0.24 1.01 -0.67YTD -12.75 21.37 9.08 20.44 40.09Benchmark -12.10 15.74 3.98 21.16 19.79Difference -0.65 5.63 5.10 -0.72 20.30
Performance data does not include the cost incurred directly by an investor in the form of sales load etc. NAV to NAV return with dividend reinvestment. Asset allocation (%)
Nov-17 Oct-17Open End / Closed End Funds 92.51 90.68 T Bills - - Cash 7.33 9.18 Other including receivables 0.15 0.14
Total 100.00 100.00 Top holding (%age of total assets) JS Large Cap. Fund 31.59JS Income Fund 15.61Atlas Stock Market Fund 11.82NAFA Islamic Energy Fund 10.77National Investment Trust 10.57ABL Stock Fund 10.15Alhamra Islamic Income Fund 2.01n/a n/aTotal 92.51
Disclosure for Sindh Workers' Welfare Fund (SWWF) The scheme has maintained provisions against Sindh Workers' Welfare Fund's liability to the tune of Rs. 1,519,908/-. If the same were not made the NAV per unit/return of scheme would be higher by Rs. 0.28/0.56%. For details investors are advised to read the Note 10.1 of the latest Financial Statements of the Scheme. Cumulative returns are based as per MUFAP stated methodology. # 'Weighted Average of "Three (3) months PKRV rates", "Six (6) months KIBOR rates" and "KSE-100 Index", on the basis of actual investment in money market, income and equity schemes '. "

JS Islamic Hybrid Fund of Funds (JS IHFoF) November 2017
MUFAP Recommended Format
8
SHAR
IAH
COM
PLIA
NT
FUND
OF
FUND
S SC
HEM
E
Investment philosophy
JS Islamic Hybrid Fund of Funds aims to generate need based returns for its clients by offering several Allocation Baskets/Plans with varying mix of exposures to low / high risk asset classes via underlying mutual funds. Investment Objectives of the Allocation Baskets/Plans initially offered under JSIHFOF are Mustanad, Mustahkem, Mutanasib, Mufeed & Munafa.
Key information Fund type Open endCategory Shariah Compliant Fund of FundsFund launch date 7 June, 2017Benchmark BM IHFOF*Management fee Nil (Up to 1% M.Fee p.a. applicable on investments
made in CIS not managed by JSILFront-end Load Mustanad 0% | Mustehkam 0.5% | Mutanasib Up to
3% | Mufeed Up to 3% | Munafa Up to 3% of NAV(FED & SST rate applicable)
Back-end Load NILPricing mechanism Forward Trustee MCB Financial Services Ltd.Dealing Days & Cut-off time (Monday to Friday) 4:00 p.m.Auditor KPMG Taseer Hadi & Co.Risk profile Low-Moderate-High (as per allocation
basket/plan)Listing PSXLeverage NILManagement Quality Rating AM2 by JCR-VISEntity Rating A+ (Long Term), A1 (Short Term) by PACRAInvestment Committee MembersMr. Hasnain Raza Nensey - CEOMr. Zahid Ullah Khan - CIOMr. Khawar Iqbal - CFOMr. Syed Ali Turab Alvi-CSOMr. Khurram M. Arif - Fund ManagerMr. Asad Ali - Acting Head of Research
NAV (PKR) Net Assets (PKR mn)JSIHFOF - Mustanad 103.97 54.24JSIHFOF - Mustahkem 95.62 256.84JSIHFOF - Mutanasib 82.42 62.77JSIHFOF - Munafa 81.53 16.13JSIHFOF - Mufeed 81.42 65.50
-10 20 30 40 50 60 70 80 90
100
Mustehkam Munafa Mustanad Mutansib Mufeed
Islamic Hybrid Fund of Fund Allocation
Cash Investment in Mutual Funds Other including receivables
Expense ratio Expense
RatioIncludes government levy, Sindh Worker’s Welfare
Fund and SECP feeJS Islamic Hybrid Fund Of Funds-Mustanad 0.55% 0.20%JS Islamic Hybrid Fund Of Funds-Mustahkem 0.48% 0.12%JS Islamic Hybrid Fund Of Funds-Mutanasib 0.71% 0.13%JS Islamic Hybrid Fund Of Funds-Munafa 1.18% 0.16%JS Islamic Hybrid Fund Of Funds-Mufeed 0.71% 0.13%
All ratios are annualized
BM IHFOF* Weighted average daily return of KMI 30 index, six (6)/ three (3) month average deposit rates of three (3) 'A' rated scheduled Islamic Banks or Islamic Banking windows of scheduled Commercial Banks, as selected by MUFAP based on actual proportion of the Equity Portion consisting of Shariah Compliant Equity Funds, Income Portion consisting of Shariah Compliant Income and Money Market Funds, and any Cash or Near cash instruments in each of the Allocation Baskets". Disclosure for Sindh Workers' Welfare Fund (SWWF) The scheme has maintained provisions against Sindh Workers' Welfare Fund's liability to the tune of Rs. 110,109/-. If the same were not made the NAV per unit/return of scheme would be higher by Rs. 0.22(Mustanad), Rs. 0.00(Mustahkem), 0.21% (Mustanad), 0.00% (Mustahkem).For details investors are advised to read the Note 9.1 of the latest Financial Statements of the Scheme.
Performance (%) 1M 1Y 3Y 5Y Launch
JSIHFOF - Mustanad * 3.52 n/a n/a n/a 8.62Benchmark * 2.21 n/a n/a n/a 1.79JSIHFOF - Mustahkem -0.03 n/a n/a n/a -4.38Benchmark 0.38 n/a n/a n/a -4.36JSIHFOF - Mutanasib -0.90 n/a n/a n/a -17.58Benchmark 1.15 n/a n/a n/a -14.98JSIHFOF - Munafa -1.27 n/a n/a n/a -18.47Benchmark 1.25 n/a n/a n/a -15.75JSIHFOF - Mufeed -1.00 n/a n/a n/a -18.58Benchmark 1.24 n/a n/a n/a -15.78* Annualized returns NAV to NAV return with dividend reinvestment. Monthly performance (%)
FY18 FY17 FY18 FY17 FY18 FY17 FY18 FY17 FY18 FY17Jul 2.24 n/a 0.38 n/a 0.59 n/a 0.64 n/a 0.61 n/aAug 4.46 n/a (2.85) n/a (9.97) n/a (9.43) n/a (9.82) n/aSep 32.15 n/a 0.08 n/a (0.75) n/a (0.81) n/a (0.95) n/aOct 3.87 n/a (1.29) n/a (5.94) n/a (6.67) n/a (6.56) n/aNov 3.52 n/a (0.03) n/a (0.90) n/a (1.27) n/a (1.00) n/aDec n/a n/a n/a n/a n/aJan n/a n/a n/a n/a n/aFeb n/a n/a n/a n/a n/aMar n/a n/a n/a n/a n/aApr n/a n/a n/a n/a n/aMay n/a n/a n/a n/a n/aJun 3.02 -0.72 -1.62 -2.14 -2.08YTD 9.22 3.02 -3.69 -0.72 -16.22 -1.62 -16.69 -2.14 -16.85 -2.08BM 2.05 0.11 -2.61 -1.80 -11.70 -3.72 -11.34 -4.97 -11.90 -4.41Diff. 7.18 2.91 -1.08 1.08 -4.52 2.10 -5.35 2.83 -4.95 2.33
JSIHFOFMufeed
JSIHFOFMustahkem
JSIHFOFMunafa
JSIHFOFMustanad*
JSIHFOFMutanasib
* Annualized returns Performance data does not include the cost incurred directly by an investor in the form of sales load etc. NAV to NAV return with dividend reinvestment. Asset allocation (%)
JSIHFOFMustanad
JSIHFOF Mustahkem
JSIHFOFMutanasib
JSIHFOFMunafa
JSIHFOFMufeed
Cash 1.69 8.83 4.27 6.97 7.06 Equity - - - - - Open End Funds 63.53 68.35 94.72 89.39 92.00 Other 34.78 22.82 1.01 3.64 0.95 Total 100.00 100.00 100.00 100.00 100.00
Nov-17
Top holding (%age of total assets) JSIHFOF - Mustanad
33.57 29.94 0.01
JSIHFOF - Mustahkem28.01 20.47 16.80
JSIHFOF - Mutanasib74.74 9.87 5.94
JSIHFOF - Munafa78.79 10.60
JSIHFOF - Mufeed82.12 9.88
Atlas Islamic Income FundJS Islamic FundNAFA Riba Free Savings Fund
Atlas Islamic Income FundNAFA Riba Free Savings FundAlhamra Islamic Income Fund
JS Islamic FundNAFA Islamic Energy FundAtlas Islamic Income Fund
JS Islamic FundNAFA Islamic Energy Fund
JS Islamic FundNAFA Islamic Energy Fund

JS Islamic Active Allocation Plan - I (JS IAAP I) November 2017
MUFAP Recommended Format
9
SHAR
IAH
COM
PLIA
NT
FUND
OF
FUND
S SC
HEM
E
Investment philosophy JS Islamic Active Allocation Plan – I is a limited-term (2 Years) active allocation plan offered under “JS Islamic Hybrid Fund of Funds”. The plan aims to generate superior returns by dynamically managing the plan’s exposure in “Income Portion” and “Equity Portion” based on the investment view on the different asset classes. Key information Fund type Open endCategory Shariah Compliant Fund of FundsFund launch date 21 September, 2017Benchmark BM IHFOF*Management fee 1% (No M.Fee to be charged on
investments made in CIS managed by JSIL)
Front-end Load Up to 3% of NAV (FED & SST rate applicable)
Contingent Load 4% of NAV on redemption requests during 1st year of subscription and 2% of NAV on redemption requests during 2nd year of subscription
Back-end Load NILPricing mechanism Forward Trustee MCB Financial Services Ltd.Dealing Days & Cut-off time (Monday to Friday) 4:00 p.m.Auditor KPMG Taseer Hadi & Co.Risk profile Medium to HighListing PSXLeverage NILManagement Quality Rating AM2 by JCR-VISInvestment Committee MembersMr. Hasnain Raza Nensey _ CEOMr. Zahid Ullah Khan - CIOMr. Khawar Iqbal - CFOMr. Syed Ali Turab Alvi- CSOMr. Khurram M. Arif - Fund ManagerMr. Asad Ali - Acting Head of Research
NAV (PKR) Net Assets (PKR mn)
JSIHFOF - JS IAAP_I 100.24 129.97
BM IHFOF* Weighted average daily return of KMI 30 index, six (6)/ three (3) month average deposit rates of three (3) 'A' rated scheduled Islamic Banks or Islamic Banking windows of scheduled Commercial Banks, as selected by MUFAP based on actual proportion of the Equity Portion consisting of Shariah Compliant Equity Funds, Income Portion consisting of Shariah Compliant Income and Money Market Funds, and any Cash or Near cash instruments in each of the Allocation Baskets".
Performance (%)
1M 6M 1Y 2Y Launch Avg. Ann.*Fund -0.07 n/a n/a n/a 0.24 n/aBenchmark -0.05 n/a n/a n/a -0.01 n/aDifference -0.02 n/a n/a n/a 0.25 n/a
NAV to NAV return with dividend reinvestment. Monthly performance (%)
JS IAAP_I Benchmark Diff.July n/a n/a n/aAugust n/a n/a n/aSeptember 0.11 - 0.11 October 0.20 0.04 0.16 November (0.07) (0.05) (0.02) DecemberJanuaryFebruaryMarchAprilMayJuneYTD 0.24 -0.01 0.25
Performance data does not include the cost incurred directly by an investor in the form of sales load etc. NAV to NAV return with dividend reinvestment. Asset allocation (%)
Nov-17 Sep-17Cash 3.10 100.00
Equity - -
Open End / Closed End Funds 69.15 -
Other including receivables 27.74 -
Total 100.00 100.00
Top holding (%age of total assets) Alhamra Islamic Income Fund 29.03Nafa Riba Free Savings Fund 28.13Atlas Islamic Income Fund 7.19JS Islamic Fund 4.79n/a n/an/a n/an/a n/an/a n/an/a n/aTotal 69.14
Expense Ratio
Expense Ratio
Includes government levy, Sindh Worker’s Welfare
Fund and SECP feeJS Islamic Hybrid FOF-IAAP-1 0.47% 0.14%
All ratios are annualized
Disclosure for Sindh Workers' Welfare Fund (SWWF) The scheme has maintained provisions against Sindh Workers' Welfare Fund's liability to the tune of Rs. 5,638/-. If the same were not made the NAV per unit/return of scheme would be higher by Rs. 0.00/0.00%. For details investors are advised to read the Note 9.1 of the latest Financial Statements of the Scheme

JS Cash Fund (JS CF) November 2017
MUFAP Recommended Format
10
Investment philosophy
JS Cash Fund (JS CF) is an open-end 'Money Market Scheme' that mainly invests in low risk short-term fixed income instruments including money market instruments to provide a regular and reasonable return to investors while ensuring high liquidity. The Fund shall invest primarily in short duration instruments and may even hold some or all of its assets in cash for the purpose maintaining liquidity. Key information Fund type Open endCategory Money Market SchemeFund launch date 29 March, 2010Net Assets (PKR mn) 576.77Net Assets Excluding JSIL FoFs (PKR mn)
576.77
NAV (PKR) 103.75Benchmark BM CF1
Management fee 0.50% (Exclusive of SST & FED)Front-end Load 1.00%Back-end Load NILPricing mechanism BackwardTrustee MCB Financial Services Ltd Dealing Days & Cut-off time (Monday to Friday) 3:00 p.m.Auditor KPMG Taseer Hadi & Co.Risk profile Extremely LowListing PSXFund stability rating (JCR-VIS) AA+ (f)Leverage NILManagement Quality Rating AM2 by JCR-VISEntity Rating A+ (Long Term), A1 (Short Term) by PACRAInvestment Committee MembersMr. Hasnain Raza Nensey - CEOMr. Zahid Ullah Khan - CIOMr. Khawar Iqbal - CFOMr. Syed Ali Turab Alvi-CSOMr Asim Ilyas - Fund Manager
Mr. Asad Ali - Acting Head of Research
100
105
110
115
120
125
Nov-
14
Jan-
15
Mar
-15
May
-15
Jul-1
5
Sep-
15
Nov-
15
Jan-
16
Mar
-16
May
-16
Jul-1
6
Sep-
16
Nov-
16
Jan-
17
Mar
-17
May
-17
Jul-1
7
Sep-
17
Nov-
17
3 Years Return on PKR 100 Invested in JS Cash Fund Vs Benchmark
JSCF Benchmark
-
20
40
60
80
100
Jun-17 Jul-17 Aug-17 Sep-17 Oct-17 Nov-17
T Bills Cash
Performance (%) Annualized performance2 1M 1Y 3Y 5Y Launch
Fund 4.83 5.60 6.71 8.23 11.55Benchmark 5.20 5.36 6.23 8.05 10.69Difference -0.37 0.23 0.48 0.18 0.85
NAV to NAV return with dividend reinvestment. Monthly performance (%) Annualized performance2
FY18 FY17 FY16 FY15 FY14July 4.98 5.51 5.87 8.62 7.28August 4.96 5.37 5.72 8.69 7.24September 4.87 5.06 6.94 8.68 5.83October 4.92 4.99 5.66 9.05 7.27November 4.83 4.90 4.54 9.34 7.65December 5.28 5.61 8.33 8.04January 10.85 5.70 10.03 8.06February 4.91 5.47 7.62 8.17March 5.41 5.54 7.17 8.86April 4.43 5.35 8.93 8.88May 4.60 5.38 6.65 8.91June 5.33 4.95 14.10 8.84YTD 4.95 5.71 5.71 9.30 8.21Benchmark 5.23 5.29 5.74 8.20 8.73Difference -0.28 0.41 -0.03 1.10 -0.52
Performance data does not include the cost incurred directly by an investor in the form of sales load etc. NAV to NAV return with dividend reinvestment. Asset allocation (%)
Nov-17 Oct-17Cash 22.98 27.13 Placement with Banks and DFIs - - T Bills 76.88 72.72 Other including receivables 0.14 0.15 Total 100.00 100.00 Asset quality (%age of total assets)
AAA76.88%
AA+0.01%
AA-0.12%
AA22.86%
* Govt. securities (76.88 %)
Disclosure for Sindh Workers' Welfare Fund (SWWF) The scheme has maintained provisions against Sindh Workers' Welfare Fund's liability to the tune of Rs. 1,404,879/-. If the same were not made the NAV per unit/return of scheme would be higher by Rs. 0.25/0.24%. For details investors are advised to read the Note 10.1 of the latest Financial Statements of the Scheme.
1. 70% three (3) months PKRV rates + 30% three (3) months average
deposit rate of three (3) “AA” rated scheduled Banks as selected by MUF AP
2. Annualized return is based as per MUFAP stated methodology.
Statistical analysis Fund BM Fund BM
Standard Deviation 0.8% 0.6% Largest Month Gain 1.2% 0.9%Expense Ratio* 1.12% Largest Month Loss 0.0% 0.0%Duration (Days) 15 % Positive Months 100.0% 100.0%WAM (Days) 15
* This expense ratio is annualized and includes 0.26% government levy, Sindh Worker’s Welfare Fund and SECP fee.

JS Income Fund (JS IF) November 2017
MUFAP Recommended Format
11
Investment philosophy
JS IF is an income fund that aims to preserve investor’s capital while providing a regular stream of current income on an annual basis which is higher than that offered by commercial banks on deposits of a similar liquidity profile as this fund. The fund operates a diverse portfolio of investment-grade debt securities, government securities and money market instruments. The fund may maintain liquidity in the form of spread transactions and bank deposits.
Key information Fund type Open endCategory Income Fund SchemeFund launch date 26 August, 2002Net Assets (PKR mn) 2,911.28Net Assets Excluding JSIL FoFs (PKR mn)
2,868.06
NAV (PKR) 98.05Benchmark BM IF #Management fee 0.75% (Exclusive of SST & FED)Front-end Load 1.00%Back-end Load NILPricing mechanism Forward Trustee MCB Financial Services LtdDealing Days & Cut-off time (Monday to Friday) 3:00 p.m.Auditor Grant Thorton Anjum Rahman & CoRisk profile Low To MediumListing PSXFund stability rating (PACRA) A+ (f)Leverage NILManagement Quality Rating AM2 by JCR-VISEntity Rating A+ (Long Term), A1 (Short Term) by PACRAInvestment Committee MembersMr. Hasnain Raza Nensey - CEOMr. Zahid Ullah Khan - CIOMr. Khawar Iqbal - CFOMr Asim Ilyas - Fund ManagerMr. Syed Ali Turab Alvi-CSOMr. Asad Ali - Acting Head of Research
# The performance benchmark of the Fund shall be 'Average Return of Six (6) months KIBOR for any period of return. Effective from September 01 2016: Previously 40% 1Year PKRV rate + 60% 6M kibor.
98
108
118
128
Nov
-14
Jan-
15
Mar
-15
May
-15
Jul-1
5
Sep-
15
Nov
-15
Jan-
16
Mar
-16
May
-16
Jul-1
6
Sep-
16
Nov
-16
Jan-
17
Mar
-17
May
-17
Jul-1
7
Sep-
17
Nov
-17
3 Years Return on PKR 100 Invested in JS Income Fund VsBenchmark
IF Benchmark
Non Compliant Investments under Circular 07/2009 Name ofInvestment Type Value before
provisionProvision held
(if any)Value after provision
% of Net Assets
% of Gross Assets
Azgard Nine a TFC 6,661,110 (6,661,110) - - -
Azgard Nine b PPTFCs 31,980,766 (31,980,766) - - -
Agritech Ltd. c Sukuk 59,572,782 (59,572,782) - - -
Agritech Ltd.d PPTFC - - - - -
Dewan Cement e TFC 50,000,000 (49,990,000) 10,000 0.00 0.00
Azgard Nine f PPTFC - - - - - a) The fund has made a full provision against the principal amount in accordance with the requirements of regulatory body & the provisioning policy of the Fund. (b) The CP of ANL has been settled through issuance of 15,000 PPTFCs in the name of the Fund. These PPTFCs have been restructured however, the mgt. as a matter of prudence has maintained the provision against the said PPTFCs. In lieu of restructuring of Azgard Nine existing debt securities, Agritech pledge shares has been credited in Faysal Bank (Trustee of the Issuer) CDS account. These shares are booked and marked to market accordingly. (c) The fund has made a full provision against the principal amount in accordance with the requirements of Circular 1 & the provisioning policy of the Fund. (d) The Fund has made a full provision against the principal amount of Agritech Limited’s Sukuk in accordance with the requirements of Circular 1 of 2009 issued by the SECP and the provisioning policy of the Fund. The Fund has received Agritech Limited’s PPTFC of face value of Rs. 11.245 million against interest due on Agritech Limited’s Sukuk which is not recognized as income by the Fund and these PPTFCs are valued at zero. (e) Non rated securities. (f) The fund received 4,827 zero coupon PPTFCs against interest receivable of listed and unlisted TFCs. Since these PPTFCs are received against already defaulted securities and have non-performing status in MUFAP, therefore the management as a matter of prudence maintained the provision against the said PPTFCs. These PPTFCs are valued at zero but cost is carried at 24,135,000.
Performance (%) Annualized performance1 1M 1Y 3Y 5Y Launch
Fund 5.36 5.79 7.85 9.14 14.58 Benchmark 6.18 6.32 7.32 9.65 16.38 Difference (0.82) (0.54) 0.53 (0.51) (1.80)
NAV to NAV return with dividend reinvestment.
Monthly performance (%) Annualized performance1 FY18 FY17 FY16 FY15 FY14
July 6.02 13.78 11.50 7.44 4.86August 4.40 5.72 5.82 9.04 6.71September 6.41 7.13 3.69 9.55 -0.15October 4.60 5.17 3.31 8.90 5.81November 5.36 9.04 5.95 14.85 12.33December 6.66 6.58 20.84 7.77January 5.32 3.76 16.64 10.36February 4.82 9.81 7.55 7.29March 5.75 6.23 5.65 12.38April 4.10 0.86 17.17 13.93May 6.17 11.44 2.59 -0.41June 8.03 4.86 1.75 8.34YTD 5.40 7.04 6.33 10.65 7.67Benchmark 6.22 6.27 6.70 9.35 10.30Difference -0.82 0.76 -0.37 1.30 -2.63
Performance data does not include the cost incurred directly by an investor in the form of sales load etc. NAV to NAV return with dividend reinvestment.
Asset allocation (%) Nov-17 Oct-17
Cash 72.37 87.03 Placement with Banks and DFIs 3.59 3.48 Equity* 0.22 0.24 T Bills - - PIBs - - TFCs / Sukkuks 20.89 7.58 MTS / Spread Transactions 0.93 0.79 Other including receivables 2.00 0.89 Total 100.00 100.00
* Under debt-swap arrangement with Azgard Nine Limited (ANL), the fund has received shares of Agritech Limited (AGL), against the investments of ANL-PPTFC and listed TFCs, these listed TFCs and PPTFCs had been fully provided.
List of TFC/Sukuks Holdings (%) Nov-17
Dawood Hercules Sukuk 7.56 Aspin Pharma (Pvt) Ltd 5.58 Sukuk - Byco Oil Pakistan Ltd 3.96
Asset quality (%age of total assets)
AAA3.96%
AA+0.00%
AA-57.74%
AA7.56%
A+0.07%
A-14.22%
A13.29%
* Govt. securities (0.00%) Disclosure for Sindh Workers' Welfare Fund (SWWF) The scheme has maintained provisions against Sindh Workers' Welfare Fund's liability to the tune of Rs. 3,562,144 /-. If the same were not made the NAV per unit/return of scheme would be higher by Rs. 0.12/0.12%. For details investors are advised to read the Note 11.1 of the latest Financial Statements of the Scheme. 1 Annualized performance return is based as per MUFAP stated methodology.
Statistical analysis
Fund BM Fund BMStandard Deviation 4.2% 1.0% Largest Month Gain 3.7% 1.2%Expense Ratio* 1.32% Largest Month Loss -10.3% 0.0%Duration (Yr) 0.09 % Positive Months 92.9% 100.0%WAM (Yr) 1.02
* This expense ratio is annualized and includes 0.30% government levy, Sindh Worker’s Welfare Fund and SECP fee.

JS Islamic Income Fund (JSIIF) November 2017 MUFAP Recommended Format
12
Investment philosophy
The objective of JS Islamic Income Fund (JSIIF) is to generate stable returns and ensure capital preservation over medium to long term, by investing primarily in quality Sukuks, Shariah-compliant Government Securities, Shariah-compliant Bank Deposits and other Shariah-compliant debt instruments. Key information Fund type Open endCategory Shariah Compliant Income Scheme 3Fund launch date 5 June, 2013Net Assets (PKR mn) 109.95Net Assets Excluding JSIL FoFs (PKR mn)
109.95
NAV (PKR) 102.06Benchmark # BM IIF1
Management fee 0.75% (Exclusive of SST & FED)Front-end Load 1.00%Back-end Load NILPricing mechanism Forward Trustee MCB Financial Services Ltd.Dealing Days & Cut-off time (Monday to Friday) 3:00 p.m.Auditor Grant Thorton Anjum Rahman & CoShariah advisor M/s. Al Hilal Shariah Advisors (Pvt) LimitedRisk profile Low to MediumListing PSXFund stability rating (PACRA) AA- (f)Leverage NILManagement Quality Rating AM2 by JCR-VISEntity Rating A+ (Long Term), A1 (Short Term) by PACRAInvestment Committee MembersMr. Hasnain Raza Nensey - CEOMr. Zahid Ullah Khan - CIOMr. Khawar Iqbal - CFOMr. Syed Ali Turab Alvi-CSOMr Asim Ilyas - Fund Manager
Mr. Asad Ali - Acting Head of Research
95
100
105
110
115
120
Nov
-14
Dec
-14
Jan-
15F
eb-1
5M
ar-1
5A
pr-1
5M
ay-1
5Ju
n-15
Jul-1
5A
ug-1
5S
ep-1
5O
ct-1
5N
ov-1
5D
ec-1
5Ja
n-16
Feb
-16
Mar
-16
Apr
-16
May
-16
Jun -
16Ju
l -16
Aug
-16
Sep
-16
Oct
-16
Nov
-16
Dec
-16
Jan-
17F
eb-1
7M
ar-1
7A
pr-1
7M
ay-1
7Ju
n-17
Jul-1
7A
ug-1
7S
ep-1
7O
ct-1
7N
ov-1
7
3 Years Return on PKR 100 Invested in JS Islamic Income Fund Vs Benchmark
JSIIF Benchmark
-
20
40
60
80
100
Jun-17 Jul-17 Aug-17 Sep-17 Oct-17 Nov-17
TFCs / Sukkuks Cash Other including receivables
Performance (%) Annualized performance2 1M 6M 1Y 2Y Launch
Fund 1.79 3.74 1.35 3.39 5.61Benchmark 2.57 3.01 3.61 8.52 6.46Difference -0.78 0.73 -2.26 -5.13 -0.85
NAV to NAV return with dividend reinvestment. Monthly performance (%) Annualized performance2
FY18 FY17 FY16 FY15 FY14July -4.64 4.22 4.58 2.42 6.83August -0.47 4.20 3.98 3.13 6.91September 6.50 4.69 -0.12 4.26 7.88October 2.90 9.15 2.33 6.45 6.81November 1.79 9.62 1.56 5.54 12.54December -6.16 6.75 5.80 9.47January -2.06 -1.27 12.25 6.55February -0.13 3.34 5.95 11.28March -1.95 7.50 8.08 13.07April 1.90 4.03 7.13 6.10May 2.41 6.06 7.42 10.17June 16.77 4.33 4.05 4.19YTD 1.17 3.58 3.66 6.22 8.80Benchmark 2.78 4.21 5.49 7.62 7.16Difference -1.61 -0.63 -1.83 -1.41 1.64
Performance data does not include the cost incurred directly by an investor in the form of sales load etc. NAV to NAV return with dividend reinvestment. Asset allocation (%age of total assets)
Nov-17 Oct-17Cash 60.76 89.51Placement with Banks and DFIs 8.84 8.92 TFCs / Sukkuks 26.58 0.00Other including receivables 3.82 1.57Total 100.00 100.00 Asset quality (%age of total assets)
AAA26.58%
AA+0.01%
AA-0.10%
AA0.01%
* Govt. securities (0.00)%)
Sukuks allocation - Top Ten Holding
26.58%
0.0%
25.0%
50.0%
75.0%
100.0%
125.0%
GoP Ijara Sukkuks
Disclosure for Sindh Workers' Welfare Fund (SWWF) The scheme has maintained provisions against Sindh Workers' Welfare Fund's liability to the tune of Rs. 1,691,908/-. If the same were not made the NAV per unit/return of scheme would be higher by Rs. 1.57/1.54%. For details investors are advised to read the Note 10.1 of the latest Financial Statements of the Scheme.
1. From 18th Aug ‘17 the performance benchmark of the scheme shall be “Six (6)
months average deposits rate of three (3) A rated scheduled Islamic banks or Islamic windows of conventional banks as selected by MUFAP.
2. Annualized return is based as per MUFAP stated methodology. 3. The fund had converted from a Shariah Compliant Government Securities Fund to a
Shariah Compliant Income Fund effective 18th Aug ’17.
Statistical analysis
Fund BM Fund BMStandard Deviation 1.3% 0.5% Largest Month Gain 1.4% 0.7%Expense Ratio* 2.77% Largest Month Loss -0.5% 0.0%WAM (Yr) 1.34 % Positive Months 85.5% 100.0%
* This expense ratio is annualized and includes 0.28% government levy, Sindh Worker’s Welfare Fund and SECP fee.

JS Capital Protected Fund V (JSCPF_V) November 2017
MUFAP Recommended Format
13
Investment philosophy
JS Capital protected Fund V aims at protecting investor capital through the investment structure by placing 88% of the Fund’s Deposited property as term deposit(s) with Bank Alfalah Limited, having rating of “AA” with a positive outlook (Capital Protected Portion). The remaining Investment Portion of the Fund shall be invested in equity market or any other Authorized Investment instrument. Key information Fund type Open endCategory Capital Protected SchemeFund launch date 30 May, 2016Net Assets (PKR mn) 254.41NAV (PKR) 101.48Benchmark BM1
Management fee 1.00% (Exclusive of SST & FED)Front-end Load 1.00%Back-end Load NILContingent Load Up to 2.0% of NAV during the first 12 months and three weeks
Up to 1.0% of NAV during the last 12 months and three weeksPricing mechanism Forward Trustee MCB Financial Services LimitedDealing Days & Cut-off time (Monday to Friday) 3:00 p.m.Auditor Grant Thornton Anjum Rahman Chartered AccountantsRisk profile Very LowListing PSXLeverage NILCapital Protection Rating CP2+ (CP Two plus) by PACRAManagement Quality Rating AM2 by JCR-VISInvestment Committee MembersMr. Hasnain Raza Nensey - CEO Mr. Syed Ali Turab Alvi-CSOMr. Zahid Ullah Khan - CIO Mr. Asad Ali - Acting Head of ResearchMr. Khawar Iqbal - CFO Mr. Syed Sanakhawan - Fund Manager
95
100
105
110
Jul-1
6
Aug-
16
Sep-
16
Oct-1
6
Nov-
16
Dec-
16
Jan-
17
Feb-
17
Mar
-17
Apr-1
7
May
-17
Jun-
17
Jul-1
7
Aug-
17
Sep-
17
Oct-1
7
Nov-
17
3 Years Return on PKR 100 Invested in JS Capital Protected Fund V Vs Benchmark
JSCPF_V Benchmark
84 86 88 90 92 94 96 98
100
Jun-17 Jul-17 Aug-17 Sep-17 Oct-17 Nov-17
Placement with Banks and DFIs Equity TDR
Statistical analysis
Fund Fund BMStandard Deviation 1.7% Beta 1.1 1.0Expense Ratio* 2.15% Largest Month Gain 1.0% 1.3%
Largest Month Loss -0.7% -0.2%% Positive Months 73.7% 89.5%
* This expense ratio is annualized and includes 0.24% government levy, Sindh Worker’s Welfare Fund and SECP fee.
Performance (%) 1M 6M 1Y 2Y Launch Avg. Ann.*
Fund 0.16 -0.47 2.97 n/a 5.60 3.69Benchmark 0.47 1.45 5.45 n/a 8.10 5.31Difference -0.31 -1.92 -2.48 n/a -2.50 -1.63
* Average Annualized Return since inception as per Morning Star formula NAV to NAV return with dividend reinvestment. Monthly performance (%)
FY18 FY17 FY16July 0.31 -0.20 n/aAugust -0.75 0.83 n/aSeptember 0.31 0.91 n/aOctober -0.24 -0.08 n/aNovember 0.16 0.97 n/aDecember 0.83 n/aJanuary 0.89 n/aFebruary 0.24 n/aMarch 0.42 n/aApril 0.63 n/aMay 0.40 n/aJune -0.26 0.10YTD -0.21 5.71 0.10Benchmark 1.47 6.37 0.15Difference -1.68 -0.66 -0.05
Performance data does not include the cost incurred directly by an investor in the form of sales load etc. NAV to NAV return with dividend reinvestment. Asset allocation (%)
Nov-17 Oct-17Cash 0.44 0.64Equity 1.32 5.16TDR 7.21 2.74Placement with Banks and DFIs 91.03 91.46Total 100.00 100.00
Equity sector breakdown (%)
Nov-17 Oct-17Automobile Assembler 0.62 0.94Miscellaneous 0.32 0.29Glass & Ceramics 0.19 0.46Engineering 0.19 1.21Oil & Gas Marketing Companies 0.00 0.31Others 0.00 1.95Total 1.32 5.16
Top holding (%age of total assets) Indus Motor Co. Ltd. 0.62Synthetic Products Enterprises Ltd. 0.32Tariq Glass Industries Ltd. 0.19Ittefaq Iron Industries Ltd. 0.19Pakistan State Oil Co. Ltd. 0.00n/a n/an/a n/an/a n/an/a n/an/a n/a
1 The benchmark of the Fund for any period of return shall be the “Weighted Average Daily Return of KSE-100 Index and Three (3) Months Deposit Rate of a Double A minus (AA-) or above rated Bank based on the Fund’s actual Proportion in the Investment and Capital Protection Portions”.
“Capital protection only applies to unit holders who hold their investments until the maturity date” Disclosure for Sindh Workers' Welfare Fund (SWWF) The scheme has maintained provisions against Sindh Workers' Welfare Fund's liability to the tune of Rs. 304,253/-. If the same were not made the NAV per unit/return of scheme would be higher by Rs. 0.12/0.12%. For details investors are advised to read the Note 11.1 of the latest Financial Statements of the Scheme.

JS Pension Savings Fund (JS PSF) November 2017
MUFAP Recommended Format
14
Investment philosophy
JS Pension Savings Fund (JS PSF) is designed to provide a secure source of savings and retirement income to individuals. JS PSF is a portable pension scheme allowing individuals the flexibility of contributions and portfolio customization through allocation of such contributions among equity and fixed income investment avenues suited to their specific needs and risk profile. Key information Fund type Open endCategory Voluntary Pension SchemeFund launch date 26 June, 2007Benchmark n/aManagement fee 1.50% (Exclusive of SST & FED)Front-end Load 3.00%Back-end Load NILPricing mechanism Forward Trustee Central Depository Company of Pakistan Ltd.Dealing Days & Cut-off time (Monday to Friday) 3:00 p.m.Auditor KPMG Taseer Hadi & CoRisk profile Investor dependent Leverage NILManagement Quality Rating AM2 by JCR-VISEntity Rating A+ (Long Term), A1 (Short Term) by PACRAInvestment Committee MembersMr. Hasnain Raza Nensey - CEOMr. Zahid Ullah Khan - CIOMr. Khawar Iqbal - CFOMr. Syed Ali Turab Alvi-CSOMr. Syed Sanakhawan - Fund ManagerMr. Asad Ali - Acting Head of Research
Net Assets (PKR mn)JS-PSF - Equity Sub Fund 208.28JS-PSF - Debt Sub Fund 168.09JS-PSF - MM Sub Fund 117.75
NAV (PKR)JS-PSF - Equity Sub Fund 465.93JS-PSF - Debt Sub Fund 232.25JS-PSF - MM Sub Fund 186.90
95
105
115
125
135
145
155
165
Nov-1
4
Jan-1
5
Mar-1
5
May-1
5
Jul-1
5
Sep-1
5
Nov-1
5
Jan-1
6
Mar-1
6
May-1
6
Jul-1
6
Sep-1
6
Nov-1
6
Jan-1
7
Mar-1
7
May-1
7
Jul-1
7
Sep-1
7
Nov-1
7
3 Years Return on PKR 100 Invested in JS Pension Saving Fund
PSF-Equty PSF-Debt PSF-MM
020406080
100
Equity Cash Other T Bills & PIBs
Cash T Bills Cash Other
JS Pension Equity JS Pension Debt JS Pension Money Market
Nov-17 Oct-17 Sep-17 Aug-17 Jul-17 Jun-17 May-17
Disclosure for Sindh Workers' Welfare Fund (SWWF) The scheme has maintained provisions against Sindh Workers' Welfare Fund's liability to the tune of Rs. 2,462,894/-. If the same were not made the NAV per unit/return of scheme would be higher by Rs. 4.22 (ESF), Rs. 0.48(DSF), Rs. 0.37 (MMF) / 0.91% (ESF), 0.21% (DSF), 0.20% (MMF). For details investors are advised to read the Note 8.1 of the latest Financial Statements of the Scheme. 1 Annualized performance return is based as per MUFAP stated methodology.
Performance (%) 1M 1Y 3Y 5Y Launch
Equity Sub Fund 1.40 -5.19 19.44 239.75 365.97Debt Sub Fund 1 3.47 4.60 18.04 32.88 132.27MM Sub Fund 1 2.61 3.49 14.12 34.57 86.92
NAV to NAV return with dividend reinvestment.
Monthly performance (%) Annualized performance1 Equity Debt 1 MM 1
FY18 FY17 FY18 FY17 FY18 FY17July 0.12 3.67 3.86 7.38 4.53 10.72August -11.77 3.10 3.54 3.43 1.40 3.03September -1.81 6.25 3.97 3.25 4.46 3.47October -7.58 -1.66 3.67 0.59 1.20 0.72November 1.40 8.43 3.47 4.23 2.61 6.91December 9.81 3.61 3.46January 2.96 13.90 12.87February 0.49 3.30 2.49March 0.89 3.80 3.91April 3.81 3.22 0.79May 5.20 4.14 2.88June -6.81 3.36 0.40YTD -18.72 41.25 3.72 4.63 2.84 4.42
Performance data does not include the cost incurred directly by an investor in the form of sales load etc. NAV to NAV return with dividend reinvestment.
Asset allocation (%) Equity Nov-17 Oct-17Cash 2.77 2.12 Equity 93.18 96.99 Other including receivables 4.05 0.89 Total 100.00 100.00 Debt Nov-17 Oct-17Cash 5.42 3.59 Equity* 0.09 0.11 TFCs / Sukkuks 7.11 - T Bills & PIBs 87.24 96.20 Other including receivables 0.14 0.11 Total 100.00 100.00 Money Market Nov-17 Oct-17Cash 19.53 6.90 Placement with Banks - - Equity* 0.66 0.77 T Bills 79.62 92.11 Other including receivables 0.19 0.22 Total 100.00 100.00
* Under debt-swap arrangement with Azgard Nine Limited (ANL), debt and money market sub funds have received shares of Agritech Limited (AGL), against the investments of ANL-PPTFC, these PPTFCs in sub funds had been fully provided.
Equity sector breakdown (%) Nov-17 Oct-17
Oil & Gas Exploration Companies 13.12 11.40 Engineering 11.22 13.14 Power Generation & Distribution 8.41 7.52 Automobile Assembler 7.93 8.14 Commercial Banks 7.59 4.17 Others 44.91 52.62 Total 93.18 96.99
Top holding (%age of total assets) Mari Petroleum Co. Ltd. 9.93 Indus Motor Co. Ltd. 5.92 The Hub Power Co. Ltd. 5.77 Attock Petroleum Ltd. 5.32 Century Paper & Board Mills Ltd. 4.89 International Industries Ltd. 4.69 Shifa International Hospitals Ltd. 4.67 Pak Elektron Ltd. 4.66 Agriautos Industries Ltd. 4.58 Thal Ltd. 4.14
VPS
-SH
AR
IAH
C
OM
PLIA
NT
FUN
D JS Islamic Pension Savings Fund (JS IPSF)
November 2017 MUFAP Recommended Format
15
Investment philosophy
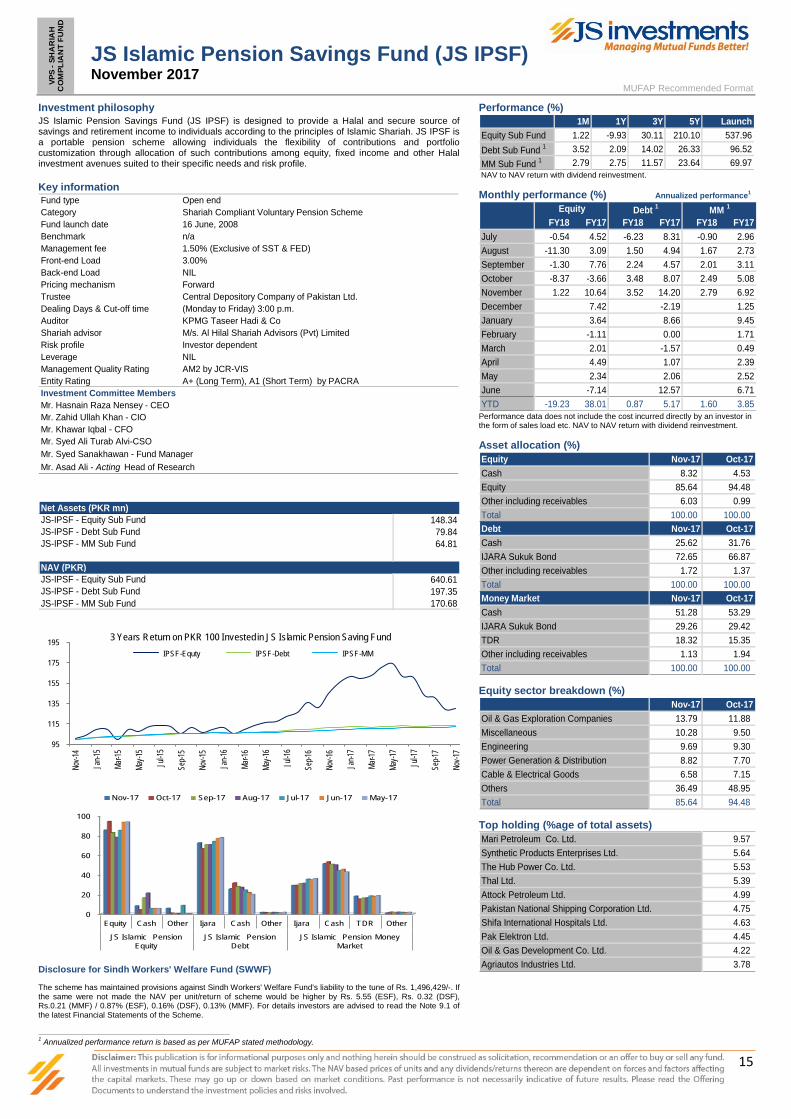
JS Islamic Pension Savings Fund (JS IPSF) is designed to provide a Halal and secure source of savings and retirement income to individuals according to the principles of Islamic Shariah. JS IPSF is a portable pension scheme allowing individuals the flexibility of contributions and portfolio customization through allocation of such contributions among equity, fixed income and other Halal investment avenues suited to their specific needs and risk profile. Key information Fund type Open endCategory Shariah Compliant Voluntary Pension SchemeFund launch date 16 June, 2008Benchmark n/aManagement fee 1.50% (Exclusive of SST & FED)Front-end Load 3.00%Back-end Load NILPricing mechanism Forward Trustee Central Depository Company of Pakistan Ltd.Dealing Days & Cut-off time (Monday to Friday) 3:00 p.m.Auditor KPMG Taseer Hadi & CoShariah advisor M/s. Al Hilal Shariah Advisors (Pvt) LimitedRisk profile Investor dependent Leverage NILManagement Quality Rating AM2 by JCR-VISEntity Rating A+ (Long Term), A1 (Short Term) by PACRAInvestment Committee MembersMr. Hasnain Raza Nensey - CEOMr. Zahid Ullah Khan - CIOMr. Khawar Iqbal - CFOMr. Syed Ali Turab Alvi-CSOMr. Syed Sanakhawan - Fund ManagerMr. Asad Ali - Acting Head of Research
Net Assets (PKR mn)JS-IPSF - Equity Sub Fund 148.34JS-IPSF - Debt Sub Fund 79.84JS-IPSF - MM Sub Fund 64.81
NAV (PKR)JS-IPSF - Equity Sub Fund 640.61JS-IPSF - Debt Sub Fund 197.35JS-IPSF - MM Sub Fund 170.68
95
115
135
155
175
195
Nov-1
4
Jan-1
5
Mar-1
5
May-1
5
Jul-1
5
Sep-1
5
Nov-1
5
Jan-1
6
Mar-1
6
May-1
6
Jul-1
6
Sep-1
6
Nov-1
6
Jan-1
7
Mar-1
7
May-1
7
Jul-1
7
Sep-1
7
Nov-1
7
3 Years Return on PKR 100 Invested in JS Islamic Pension Saving Fund IPSF-Equty IPSF-Debt IPSF-MM
0
20
40
60
80
100
Equity Cash Other Ijara Cash Other Ijara Cash TDR Other
JS Islamic Pension Equity
JS Islamic Pension Debt
JS Islamic Pension Money Market
Nov-17 Oct-17 Sep-17 Aug-17 Jul-17 Jun-17 May-17
Disclosure for Sindh Workers' Welfare Fund (SWWF) The scheme has maintained provisions against Sindh Workers' Welfare Fund's liability to the tune of Rs. 1,496,429/-. If the same were not made the NAV per unit/return of scheme would be higher by Rs. 5.55 (ESF), Rs. 0.32 (DSF), Rs.0.21 (MMF) / 0.87% (ESF), 0.16% (DSF), 0.13% (MMF). For details investors are advised to read the Note 9.1 of the latest Financial Statements of the Scheme.
1 Annualized performance return is based as per MUFAP stated methodology.
Performance (%) 1M 1Y 3Y 5Y Launch
Equity Sub Fund 1.22 -9.93 30.11 210.10 537.96Debt Sub Fund 1 3.52 2.09 14.02 26.33 96.52MM Sub Fund 1 2.79 2.75 11.57 23.64 69.97
NAV to NAV return with dividend reinvestment. Monthly performance (%) Annualized performance1
Equity Debt 1 MM 1
FY18 FY17 FY18 FY17 FY18 FY17July -0.54 4.52 -6.23 8.31 -0.90 2.96August -11.30 3.09 1.50 4.94 1.67 2.73September -1.30 7.76 2.24 4.57 2.01 3.11October -8.37 -3.66 3.48 8.07 2.49 5.08November 1.22 10.64 3.52 14.20 2.79 6.92December 7.42 -2.19 1.25January 3.64 8.66 9.45February -1.11 0.00 1.71March 2.01 -1.57 0.49April 4.49 1.07 2.39May 2.34 2.06 2.52June -7.14 12.57 6.71YTD -19.23 38.01 0.87 5.17 1.60 3.85
Performance data does not include the cost incurred directly by an investor in the form of sales load etc. NAV to NAV return with dividend reinvestment. Asset allocation (%) Equity Nov-17 Oct-17Cash 8.32 4.53 Equity 85.64 94.48 Other including receivables 6.03 0.99 Total 100.00 100.00 Debt Nov-17 Oct-17Cash 25.62 31.76 IJARA Sukuk Bond 72.65 66.87 Other including receivables 1.72 1.37 Total 100.00 100.00 Money Market Nov-17 Oct-17Cash 51.28 53.29 IJARA Sukuk Bond 29.26 29.42 TDR 18.32 15.35 Other including receivables 1.13 1.94 Total 100.00 100.00
Equity sector breakdown (%)
Nov-17 Oct-17Oil & Gas Exploration Companies 13.79 11.88 Miscellaneous 10.28 9.50 Engineering 9.69 9.30 Power Generation & Distribution 8.82 7.70 Cable & Electrical Goods 6.58 7.15 Others 36.49 48.95 Total 85.64 94.48
Top holding (%age of total assets) Mari Petroleum Co. Ltd. 9.57 Synthetic Products Enterprises Ltd. 5.64 The Hub Power Co. Ltd. 5.53 Thal Ltd. 5.39 Attock Petroleum Ltd. 4.99 Pakistan National Shipping Corporation Ltd. 4.75 Shifa International Hospitals Ltd. 4.63 Pak Elektron Ltd. 4.45 Oil & Gas Development Co. Ltd. 4.22 Agriautos Industries Ltd. 3.78

JS Performance SummaryNovember 2017
16
Fund Category
November 2017
Performance Summary of JSIL Funds
Fund Name FY 12 FY 13 FY 14 FY 15 FY 16 FY 17 FY 18Average
AnnualisedReturn
***
TrailingOneYear
Return
Equity
JS Growth Fund
JS Large Cap. Fund
Benchmark
JS Income Fund*Income
Balanced
Money Market
Capital Protected
Benchmark*
Unit Trust Of Pakistan
Benchmark
JS Cash Fund*
Benchmark*
JS Capital Protected Fund V
Benchmark
17.92% 56.91% 40.12% 12.42% 3.88% 37.56% -16.25% 10.00% -6.36%
JS Value Fund** 15.25% 64.30% 35.52% 9.72% 13.72% 25.53% -18.98% 8.34% -10.68%
14.87% 54.57% 39.64% 31.74% 4.77% 44.30% -15.85% 15.54% -1.32%
2.90% 35.95% 25.96% 5.67% 0.37% 17.92% -14.40% -6.32%
Benchmark** 2.90% 35.95% 25.96% 5.67% 0.37% 17.92% -14.40% -6.32%
Benchmark 2.90% 35.95% 25.96% 5.67% 0.37% 17.92% -14.40% 5.22%
2.69%
8.34%
-6.32%
13.07% 10.60% 7.67% 10.65% 6.33% 7.04% 5.40% 14.58% 5.79%
13.01% 10.38% 10.30% 9.35% 6.70% 6.27% 6.22% 16.38% 6.32%
16.60% 42.01% 23.56% 13.52% 6.98% 24.49% -14.51 15.46% -4.63%
8.37% 22.77% 18.21% 7.85% 3.84% 12.09% -9.24% 11.98 -2.85%
11.65% 9.11% 8.21% 9.30% 5.71% 5.71% 4.95% 11.55% 5.60%
10.12% 8.98% 8.73% 8.20% 5.74% 5.29% 5.23% 10.69% 5.36%
n/a n/a n/a n/a 0.10% 5.71% -0.21% 3.69% 2.97%
-1.55%
n/a n/a n/a n/a 0.15% 6.37% 1.47% 5.31% 5.45%
20.00% 21.01% 40.09% 20.44% 9.08% 21.37% -12.75% 12.90%
9.88% 26.91% 19.79% 21.16% 3.98% 15.74% -12.10% 8.43% -6.91%
Fund of Funds Fund of Funds
Fund of Funds Benchmark
CONVENTIONAL FUNDS
Shariah Compliant Income
SHARIAH COMPLIANT FUND OF FUNDS
SHARIAH COMPLIANT FUND OF FUNDS
SHARIAH COMPLIANT FUND OF FUNDS
SHARIAH COMPLIANT FUND OF FUNDS
SHARIAH COMPLIANT FUND OF FUNDS
JS Islamic FundShariah Compliant Equity
KMI 30
JS Islamic Income Fund*(JS Islamic Government Securities Fund)
Equity Sub Fund JS Pension Savings
Debt Sub Fund JS Pension Savings*
Money Market Sub Fund JS Pension Savings*
Equity Sub Fund JS Islamic Pension Savings
Debt Sub Fund JS Islamic Pension Savings*
Money Market Sub Fund
* All returns are Annualized ** Average annualized Return since last ten year as per Morning Star Forumla *** Average annualized Return since inception as per Morning Star Forumla
JS Islamic Pension Savings*
Benchmark*
JSIHFOF - Mustahkem
Benchmark
JSIHFOF - Munafa
Benchmark
JSIHFOF - Mustanad*
Benchmark*
JSIHFOF - Mutanasib
Benchmark
JSIHFOF - Mufeed
Benchmark
SHARIAH COMPLIANT FUNDS
VOLUNTARY PENSION SCHEME
25.84% 45.51%
13.57% 54.41%
38.43%
29.89%
42.90%
20.10%
5.88%
15.53%
46.06%
18.80%
-18.41%
-13.36%
16.46%
14.56%
-8.47%
-4.67%
n/a 6.03% 8.80% 6.22% 3.66% 3.58% 1.17% 5.61% 1.35%
n/a 6.70% 7.16% 7.62% 5.49% 4.21% 2.78% 6.46% 3.61%
n/a n/a n/a n/a n/a -0.72% -3.69% -4.38% n/a
n/a n/a n/a n/a n/a -1.80% -2.61% -4.36% n/a
n/a n/a n/a n/a n/a -2.14% -16.69% -18.47% n/a
n/a n/a n/a n/a n/a -4.97% -11.34% -15.75% n/a
n/a n/a n/a n/a n/a 0.19% 9.22% 8.62% n/a
n/a n/a n/a n/a n/a 0.01% 2.05% 1.79% n/a
n/a n/a n/a n/a n/a -1.62% -16.22% -17.58% n/a
n/a n/a n/a n/a n/a -3.72% -11.70% -14.98% n/a
n/a n/a
n/a n/a
n/a
n/a
n/a
n/a
n/a
n/a
-2.08%
-4.41%
-16.85%
-11.90%
-18.58%
-15.78%
n/a
n/a
SHARIAH COMPLIANT FUND OF FUNDS JS Islamic Active Allocation Plan - I
Benchmark
n/a n/a
n/a n/a
n/a
n/a
n/a
n/a
n/a
n/a
n/a
n/a
0.24%
-0.01%
n/a
n/a
0.24%
-0.01%
17.09% 78.21%
11.15% 11.42%
61.51%
4.36%
22.91%
10.75%
3.35%
5.30%
41.25%
4.63%
-18.72%
3.72%
15.89%
8.41%
-5.19%
4.60%
10.72% 11.34%
18.29% 55.71%
6.91%
49.02%
6.69%
32.03%
4.11%
4.13%
4.42%
38.01%
2.84%
-19.23%
6.18%
21.63%
3.49%
-9.93%
10.03% 7.86%
9.68% 6.56%
6.76%
6.64%
3.90%
5.32%
3.92%
2.42%
5.17%
3.85%
0.87%
1.60%
7.40%
5.77%
2.09%
2.75%