Embed Size (px)
Citation preview

REPORT OF TWO TESTSIN THE SUMMER COURSE, SEPTEMBER, 1955
by
Bryan Chapman
FRITZ ENGINEERINGLABORATOliY LIBRARY
Submitted in fulfillment of the requirements in CourseC. E. 406 "Special problems in Civil Engineering".
Fritz Engineering LaboratoryLEHIGH UNIVERSITY
Bethlehem, Pa.
Contents
Introduction.
Measurements.
(a) Cross-Sectional
(b) Material - Coupon Tests
Control Beam Test.
(a) Theory
(b) Test Set-up and Proceedure
(c) Test Results
Tables.
Figures.
Page1
Introduction
The summer course held at Fritz Laboratory, Lehigh
University in September, 1955 was entitled "Plastic Design in Structural
Steel". It consisted of a series of lectures, some demonstration experi
mental tests and evening discussion pertaining to the lectures.
The following report is a description of the work done by the
author in the preparation and running of the demonstration tests and
other experimental data displayed in conjunction with them.

-2
Measurements
All the material used to make up the test specimens for
the demonstrations was drawn from three different WF beam sections:
l2WF36l4WF3830WF108
To predict the behavior of the various test specimens and
to interpret and compare experimental results, it was necessary to
find out certain physical-properties of the WF sections used. These
properties are of two types
(a) cross-sectional,(b) material - coupon tests,
and are obtained partly by direct measurement and partly by calculation
as a result of these measurements.
(a) Cross-sectional.
By means of a micrometer gage reading to an accuracy of
one ten thousandth (the last figure being estimated) a set of readings
was made along the web and tapered flanges of a sample profile from each
of the WF sections to be used. Readings with the micrometer were made
twice for every point along each profile and an average taken as indicated
in the typical chart in Table 1. To obtain the actual taper, the thick-
ness at various points along the flanges was set out on a plot. The overall..'
dimensions were also taken at several points along each of the three sample
sections.
The cross-section properties resulting from these rmeasurements
together with the theoretical values and the percentage variation are set
out in Table 2. The overall dimensions and thickness shown were obtained
from the averages of'several measurements. The areas, moments of inertia,
section moduli and radii of gyration were sub?~quently calculated from there.
-3
The only significent variations between the handbook and measured values
were in the web and average flange thickness of the 30WFI08 and 12WF36 and
these are dependent upon the accurate setting of the rolls when milled.
(b) Material - Coupon Tests
Standard flat tension coupons were used to determine the
material properties of the three sections to be used. A coupon was cut
from part of the web and another from the flange of each of the WF shapes.
With micrometer a set of readings of width and thickness were made along
the narrower middle portion of each coupon specimen. Every reading was
repeated and an average area of cross-section determined for each coupon.
Two punch marks were made, set 8" apart over the central strip in every
specimen. Tens'ile loading in a Baldwin Universal hydraulic test machine
was then applied to each specimen in turn.
To set up a coupon in the testing machine, first it was
necessary to ensure that the load scale read zero for no load. The
specimen was then placed in the machine and a small load put on to maintain
an initial grip by the jaws. A light metal guide was clamped over each of
»/~~the punch marks in the specimen and a Selson motor mounted on an adjustable
arm was connected to the guides by levers. The other part of the automatic
stress-strain recording equipment was then set up. This involved the
fitting of a sheet of squared paper onto,the drum, coupling t~e drum to
the load reading indicator, and setting the stilo or the drum. Finally,,
a dial gage was portioned to read movement between the heads of the test-
ing machine; then loading of the specimen was commenced.
At first, a small valve opening was set on the machine so as
to give a slow rate of loading and to provide sufficient opportunity of
noting the time-lapse between several load points in the elastic range.
By averaging these time measurements the elastic strain rate was obtained
and also the value of the elastic strain. The Modulus of elasticity was

-4
obtained by measuring the slope of the initial part of the stress-strain
curve (up to the proportional limit). Fig. 1 gives a typical stress-strain
curve for a standard (A7) mild steel tensile coupon. Shortly beyond the
proportional limit, the load attained a value after which it usually de
creased slightly. This value could be readily observed on the load scale
and provided an opportunity to check the upper yield point or the graph
in the recorder and thus to check the calibration of the drum. Application
of load to the specimen: was continued beyond the yield point and after
decreasing slightly the load maintained a constant value for a steady in
crease in strain. This is indicated on the graph as a horizontal line.
In testing some specimens a slight depression below this horizontal line
would be observed immediately past the yield point. This could be con
firmed on the load scale and was termed the 'lower yield point'. Ability
to observe this lower yield point seemed to be dependent on the ductility
of the material and the strain rate and phasing of the stress-strain re
corder for the particular specimen.
In the initial plastic region while the graph remained a
horizontal line, the continuous dynamic loading was halted at several
different points along the line. At each of these points the loading
valve was temporarily closed so that only static load was being applied to
the specimen. Thus when there was no further yielding as indicated by a
constant reading on the dial gage between heads of the testing machine,
a static value of the load could be recorded for that point. This load
was usually 2 or 3 kips below the dynamic value. An average strain rate
for this section of the curve was also obtained from several time checks.
At a point where the strain had become approximately 12 to
13 times the magnitude of the strain at yield point, the specimen would
begin to withstand an increase in load and the material was said to have

-5
become strain hardened. From this point the increase in load remained
uniform up to approximately 30 times the yield strain before degenerating
into a curve which is almost exponential up to ultimate load.
Just prior to strain hardening, a sudden small dip in the
stress-strain curve might sometimes be noted. During the previous section
of the curve the material had been in a plastic state with the fibres slip-
ping evenly across one another; this last dip of the load may be attributed
to a sudden lessening of friction between the fibres causing some of them
to lose alignment and resulting in an increase of friction and providing
further capacity to carry load.
When the curve had been plotted sufficiently into strain-
hardening to establish the initial slope, the strain recording section
was cut out. That i~ the Sel~n Motors and the rotary motion of the
drum were switched off. The levers could then be unhooked from the
guides. The guides were removed from the specimen and the sel~n motor
swung clear so that nothing would be damaged when the specimen broke.
The rate of loading was then increased and the ultimate
load eventually recorded. Immediately the ultimate load had been reached,
the load indicator was disconnected. As the load began to falloff,
necking of the specimen became visible and was soon followed by failure.
After removal of the coupon from the testing machine an
approximate measurement of the final lemgth between gage marks was made
with a steel scale. From this the percentage elongation over the 8-inch
gage-length was obtained.
Other data compiled from the testing of each coupon were:
(1) Young's Modulus of Elasticity
(2) Elastic Strain Rate(3) Limit of Proportionality(4) Yield Point Stress-upper and lower

-6
(5) Strain at Yield point(6) Average Static Yield Stress(7)Plastic Strain Rate(8) Strain at Strain hardening(9) Strain Hardening Modulus
(10) Ultimate Stress
The more significant results are set out for comparison in
Table 3. It will be noted that the values yary~between coupons taken
from anyone shape. To compute the plastic moment Mp for the l2WF36
section as was necessary, for example, in order to predict the M-Q curve
and the ultimate ·load of the Control Beam Test, a value for the static
yield stress cry was required. The arithmetic mean for the four tensilest
coupons gives cr = 35.9 k.s.i. This led to a value of t,he plastic momentYst
which was almost identical to the mean experimental value and suggests
that this method of evaluating cry is a reliable one.st

-7
CONTROL· BEAM TEST
(a) Theory
The purpose of this test was to obtain the relationship
between moment and curvature under pure bending for a given WF section.
The length of l2WF36 used was cut from material out of which the specimens
for several of the other demonstration tests had been f~bricated. Thus
some measure of control for those tests was also provided. In addition
this test was intended to show the formation of a plastic hinge under
effective plastic design and to demonstrate the reserve of moment above the
yield point due to full plastic yeilding of the cross-section.
In terms of the simple plastic theory, there are two possible
hinge mechanisms for a simply supported beam with a concentrated load ap-
plied at each third point. One hinge only being required to provide a
mechanism, the hinge will form under one of the loads. For equal loads
as in this test, two hinges will theoretically form simultaneously. In
practice, due to inequalities in fabrication and other slight physical ir-
regularities this never happens precisely. If the weight of the beam it-
self were significant enough, the plastic hinge could form at the center
despite third point loading.
However, the self weight of the beam being negligable in this
case,
the plastic moment, ~ = cry g = 35,900 x 51.4 = 1.850000 inch lbs.
From the diagram in Fig. 2, it will be seen that for the
yield load P , the maximum elasticy
M = ~ ~ = Py ~2Y 3' 6
bending moment
By definition Py is the load required to develop the plastic
moment Mp in the first hinge of a structure and Pu the load to develop Mp
~~~' {~--4
~~~O~fL L3 [,
S :. V
,~,,""'- .. ,='.:
]-,/--*i$,~-'\t\'"
"'""""""="';?""'~'.
/?~V-:::'":",\
. f}/
-8
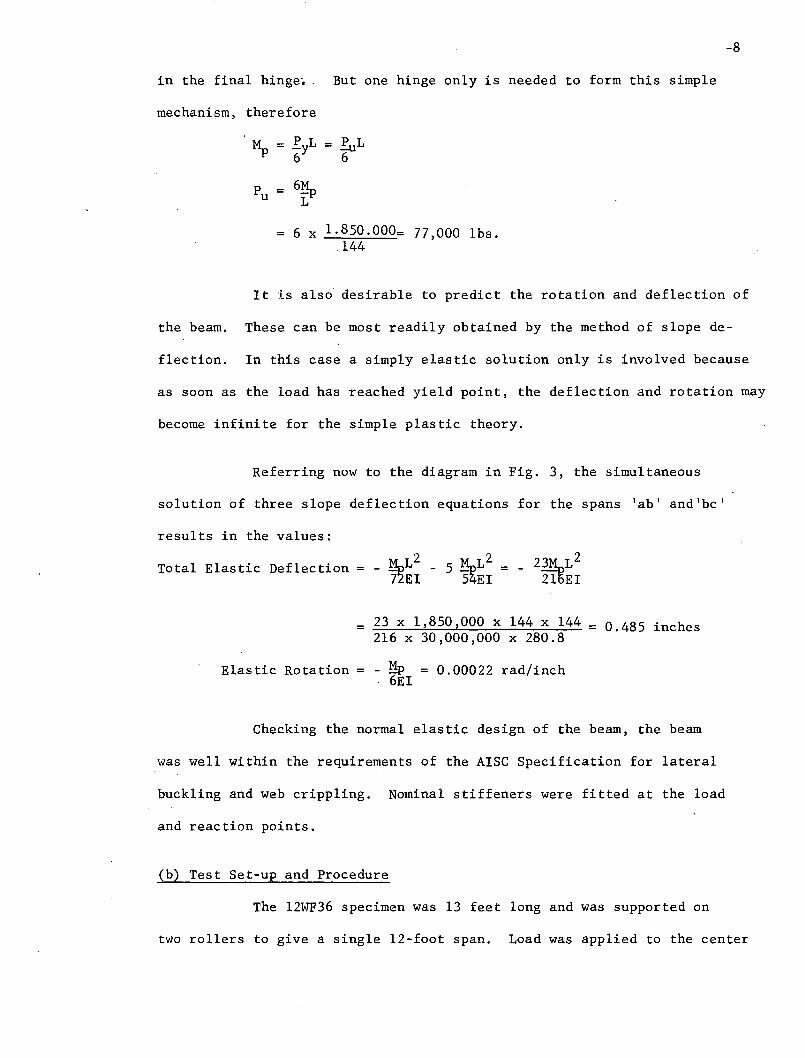
in the final hinge.. But one hinge only is needed to form this simple
mechanism, therefore
RuL6
6~L
= 6 x 1.850.000= 77,000 lbs.144
It is als~ desirable to predict the rotation and deflection of
the beam. These can be most readily obtained by the method of slope de-
flection. In this case a simply elastic solution only is involved because
as soon as the load has reached yield point, the deflection and rotation may
become infinite for the simple plastic theory.
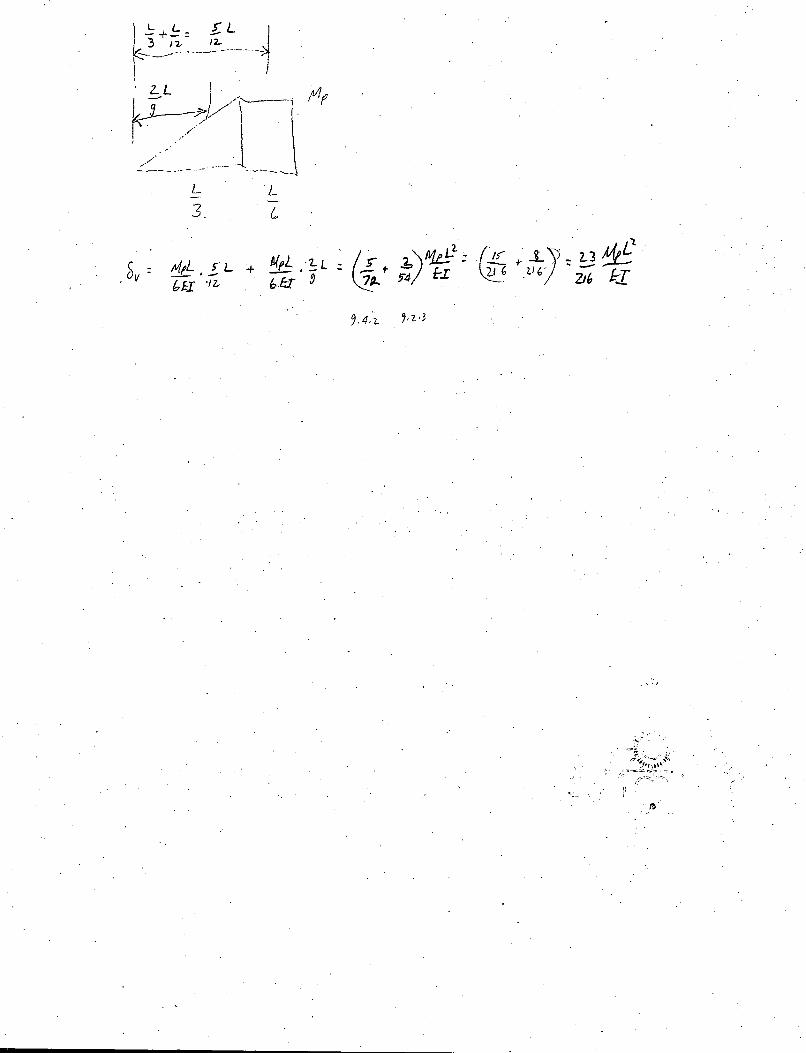
Referring now to the diagram in Fig. 3, the simultaneous
solution of three slope deflection equations for the spans lab' and'bc'
results in the values:
Total Elastic Deflection = -
23 x 1,850,000 x 144 x 144 = 0.485 inches216 x 30,000,000 x 280.8
Elastic Rotation = - ~p = 0.00022 rad/inch6EI
Checking the normal elastic design of the beam, the beam
was well within the requirements of the AISC Specification for lateral
buckling and web crippling. Nominal stiffeners were fitted at the load
and reaction points.
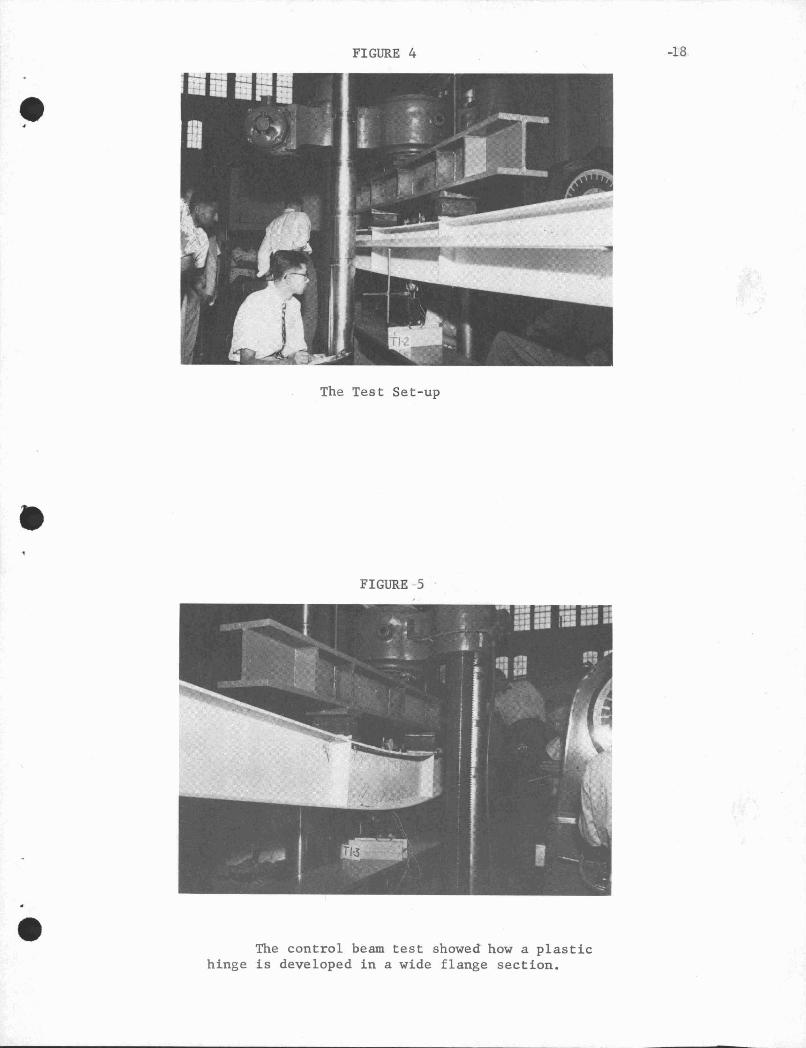
(b) Test Set-up and Procedure
The l2WF36 specimen was 13 feet long and was supported on
two rollers to give a single l2-foot span. Load was applied to the center

of a spreader beam by meanS'6f,a 300,000 lb hydraulic universal testing
machine. From the spreader beam the load was distributed to the specimen
at the two third points of the span by means of further rollers. The
supporting rollers were carried on a heavy 14 inch wide-flange section
which transmitted the reactions to the testing machine table. The set
up is shown in Figs. 2 and 4.
The measurements which could be made were limited by the
short time available for the test and the data which it was possible to
make available to the audience immediately. The instruments used and
measurements made were an automatic plotting board giving an instant
curve of load versus center deflection and an indicator to measure the
rotation in the central third of the span of the beam along which the
bending moment was constant and maximum. The center deflection was
recorded by means of a dial gage attached to a tixed bar adjacent to the
beam and measured movement under the center of the beam. The load was
read directly off a dial coupled to the testing machine.
The automatic plotting board which was used in the test
is an electromagnetic piece of equipment with which a graph of load
may be plotted against deflection to a large scale automatically as the
load and deflection of a specimen vary during a test. In fact, this
device could be used to record motion of ?ny two variable measurements or
other suitable data during a test. Its purpose in this test was to better
inform the spectators of the progress of the test.
-9
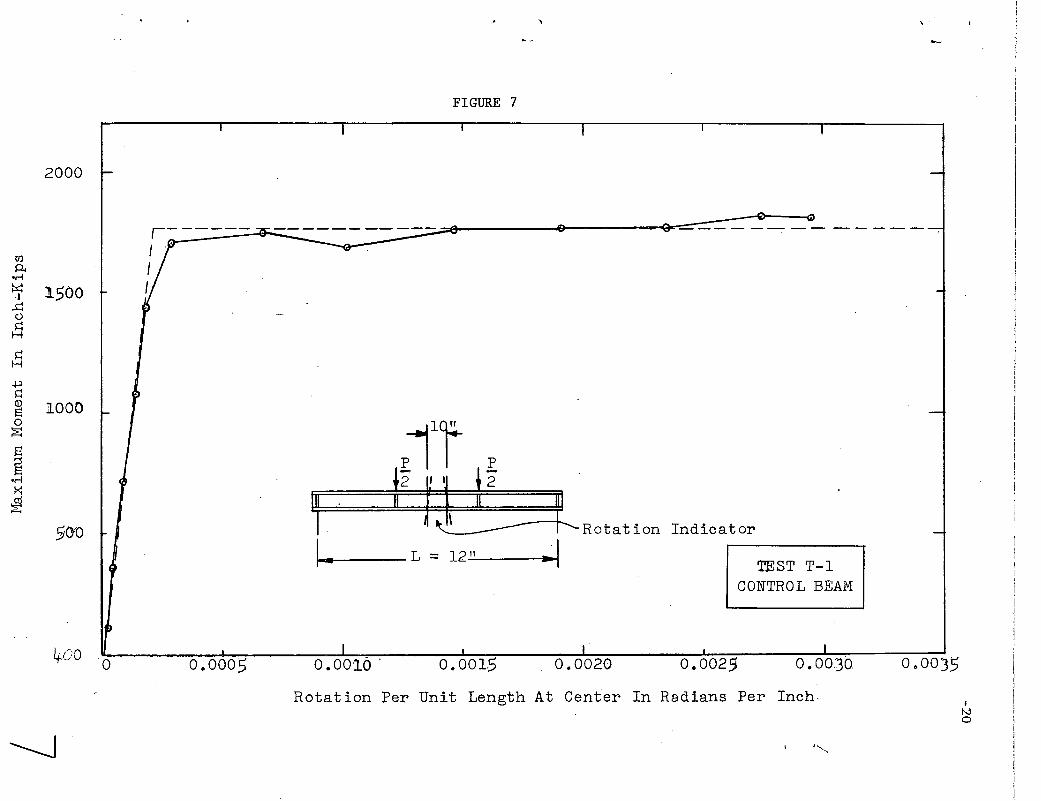
The rotation indicator is a standard lab. instrument for
measuring the unit rotation ~ in bending tests and consists of two dial
gages reading changes of length along parallel chords set a known distance
apart in the pla~~ of bending.
-10
Before any load was applied a set of zero readings was taken
on the rotation and deflection indicators. Also a sling was passed under
the center of the beam and around the top of the loading cross-head as a
safety precaution against any slip or tilt of the beam when greatly deflected.
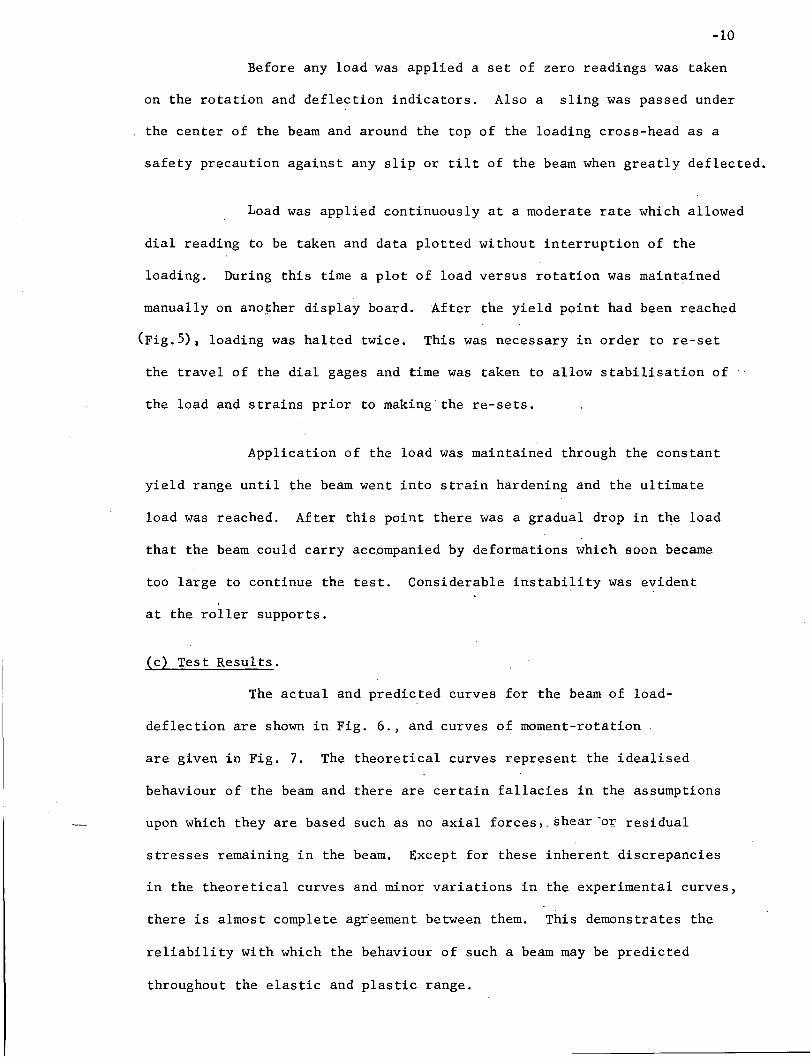
Load was applied continuously at a moderate rate which allowed
dial reading to be taken and data plotted without interruption of the
loading. During this time a plot of load versus rotation was maintained
manually on ano~her display board. After the yield point had been reached
(Fig,S)l loading was halted twice. This was necessary in order to re-set
the travel of the dial gages and time was taken to allow stabilisation of
the load and strains prior to making the re-sets.
Application of the load was maintained through the constant
yield range until the beam went into strain hardening and the ultimate
load was reached. After this point there was a gradual drop in the load
that the beam could carry accompanied by deformations which soon became
too large to continue the test. Considerable instability was evident
at the roller supports.
(c) Test Results.
The actual and predicted curves for the beam of load
deflection are shown in Fig. 6., and curves of moment-rotation
are given in Fig. 7. The theoretical curves represent the idealised
behaviour of the beam and there are certain fallacies in the assumptions
upon which they are based such as no axial forces,. shear-o~ residual
stresses remaining in the beam. Except for these inherent discrepancies
in the theoretical curves and minor variations in the experimental curves,
there is almost complete agreement between them. This demonstrates the
reliability with which the behaviour of such a beam may be predicted
throughout the elastic and plastic range.

-11
In the experimental curves, the load remained practically constant
up to a value of about eight times the yield deflection, 0y and nine
times the yield rotation, ~y. This was approaching the characteristic
stress-strain curve proportions for A-7 steel. The familiar strain
hardening phenomenon was also exhibited at this 'stage when the load
began to gradual increase an appreciable amount before final falling off.
Considerable capacity of the beam to carry load was shown
together with ample rotation capacity. No lateral instability was evident
until the deflection had become excessive for most practical purposes.
This test effectively illustrated the merits and characteristics
of the plastic theory of design and analysis.

TABLE 1
321
0.4539 b.4548 0.4544.O~ 4695 0.4699 0.46970.:073 0.5084 0.5089
0.5555 0.5495 0.552.5
0.5942 0.5918 0.5930
0.6108 0.6107 0.6108
0.5385 0.5389 0.5387
0.5103 0.5090 0.5097
0.4733 0.4751 0.47420.4609 0.4601 0.4605
2
3')1 -0.4499 0.4494 0.44970.4685 0.4694 O. !~6900.5044 0.5021 10.5036,.0.5305 0.5318 0.5312
.;0.5706 0.5703 0,5705
0.5797 0.5798 . 0,5797
0.5488 0.5475 10.5482
0.5158 0.5164 10.5161
0.4779 0.4773 10.47760.4569 0.4587 0.4578
10.510310.510310.51031
Depth Width
12.31 0.62
12.29 6.63
o.
o
0 10 0 0 0 0 0 0 0 0,. . . . . . .l.U I~ l.V l.V l.V l.V l.V l.V l.V l.V1JI l.V N l.V l.V l.V l.V l.V 1JI-....I l.V 0 00 0 1JI N ~ \0 ~~ -....I 00 0 0 00 \0 l.V \0 ~
0 0 0 0 0 0 0 0 0 0. . , -. ;.., I~ . . .lJ.' LV l.V W l.V l.V l.V l.V1JI l.V N I'-:- L":i ~ .... , N l.V l.V 1JI-....I l.;..l tn ry-. c· C', ID ~ \0 l.V!-' I-' N '-" VljO W I-' l.V 0
i
10.517410.516810.51711
N
t:! (f.l 1-3III (!) CDrt n IIIro '"T rt
t-"0 Z;:l 0.
l.V I-' N0 N 0rt 1JI::r :E:
'Tj 1JI
~ l.V(JQ Q'\~
I-'\01JI1JI
e~
1')

TABLE 2
SECTION PROPERTIES OF TEST SPECIMENS
. . - .
Area DepthFlange . - Axis x-x
Webof of Aver- Thick-Section Sec- Sec"'~ Width age _ness I S Z ftion tion -_ Thick-
- __ ness _.
A d b t W
in2 in. in o in. in • in4 1n3i11
3
.. .. -30WFI08- . - . -
Handbook 31.77 29.82 10.484 0.760 o ..-'1·8 4L~61. 0 299.2 345.5 1.16• .')4r1easured 30.46 29.93 10.460 0.74° O.51G 4345.8 290.3 334,,1 1.15rfj Variation -4.12 +0.37 ",,0,,23 =2.63 =5.46 - 2~58 - 2.98 - 3.30 -0.86fO
" __Clli __ ~_-ft:l_C::)"_'!"J:ODCIO,,'t=7~__
~.._Cl:I ____ ---......_----:~;:;-l--:~;:;-
""".----- ... _- ~---- ...-.. -. ______ .... a::o -------14WF38Handbook 11.17 14.12 6 0 776 38503 54.6 61.,9 1.13Measured 10.83 14",07 6.880 0.486 0.313 369.5 52.5 59.12 1.13%Variation -3.22 -0.35 +1.51 -0.526 0.000 - 4.10 -4.00 -3.85 °c,- ___ -=:ll ______ IiID_
IIDl:Il:ll~~c._1IlIO ~-4II'l--_---.. Q:;t'lo=s ___ ea_OO _c::;1_~"'___-~ ..-... -(.,- ...._------- ~-----_ ..- -------- -----~-
12WF36Handbook 10 0 59 12.24 6.565 o.9!.0 0.305 280 0 8 45.9 51.42 1,,12f1easured 10.78 12.30 6.625 00514 0.337 282,,1 45.9 51.79 1013%Variation +1.79 +0 0 49 +0.91 ~4.81 +10.50 + 0.46 ° +0.72 -0.89
'i::'SPS4"7!lJ"= - ~. ~
_.-
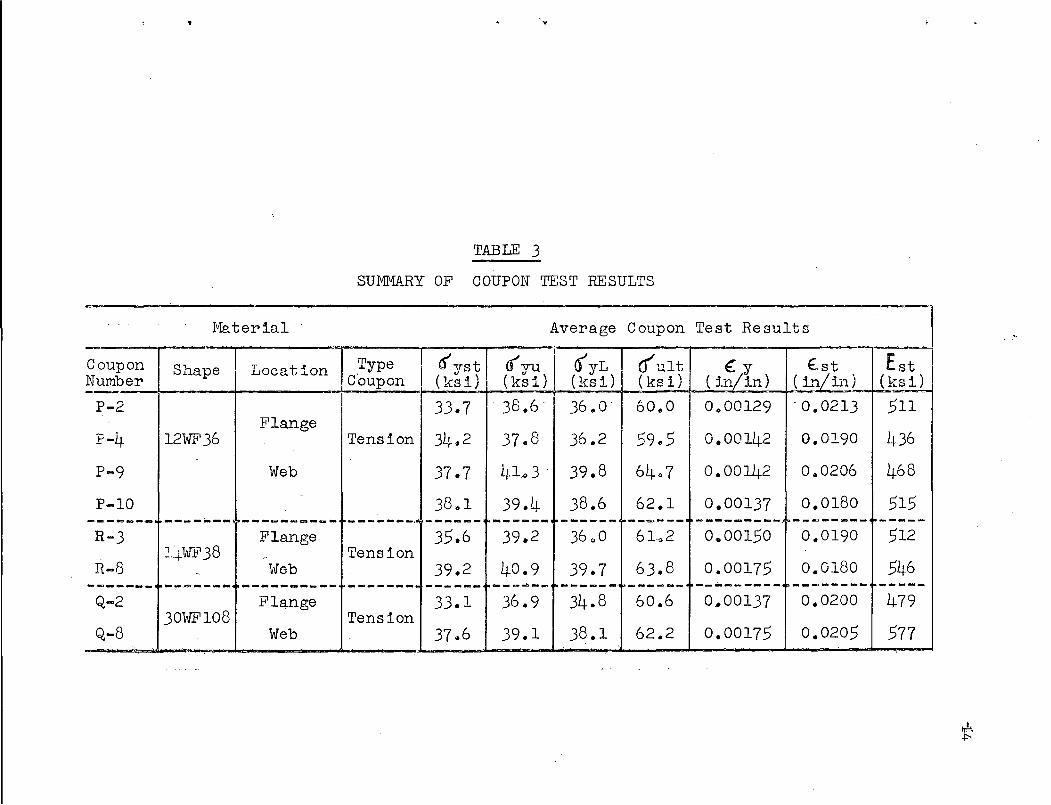
TABLE 3
SUMMARY OF COUPON TEST RESULTS
1'18.t er ial .. Average Coupon Test Results
! cryst I I
{}yL c(ult EstCoupon Shape Locat ion Type ((vu I t.y €.stNumber C'oupon I (ks i) : ( k;i) (ksi) (ks i) ( h~/in) (L"i~;) (ksi)--
P-2 33.7 . 38.6- 36.0' 60.0 0000129 . 0.0213 511Flange
P-4 12WF36 Tension 3Lto 2 37.8 36.2 59.5 0.00142 0.0190 436
P-9 Web 37.7 41.. 3 . 39.8 6407 0.00142 0.0206 468
P-I0-
38 .. 1 39.4 38.6 62.1 0.0180 5150.00137___ 00 __·_ ---- ..-- ---._------ -------... ------ p.._---- ------ __ "Qi.l ___ tII
----~----- ~--IIIit:J .. -_-- -----R-3 Flange 35.6 39.2 36,,0 61,,2 0,,00150 0.0190 512
::'.+~vF38 .- TensionR-8 Web 39.2 40.9 39.7 63.8 0.00175 0.0180 546_-._--.. - __ .A!;:l ___ '" -- .. _- ... ---- ----- .. - ------=- • ___ ob __ lIII ______ ------ --------- -------- -----Q-2 Flange 33.1 36.9 34.8 60.6 0.. 00137 0.0200 479
30WFI08 TensionQ-8 Web 37.6 39.1 38.1 62.2 0.00175 0.0205 577
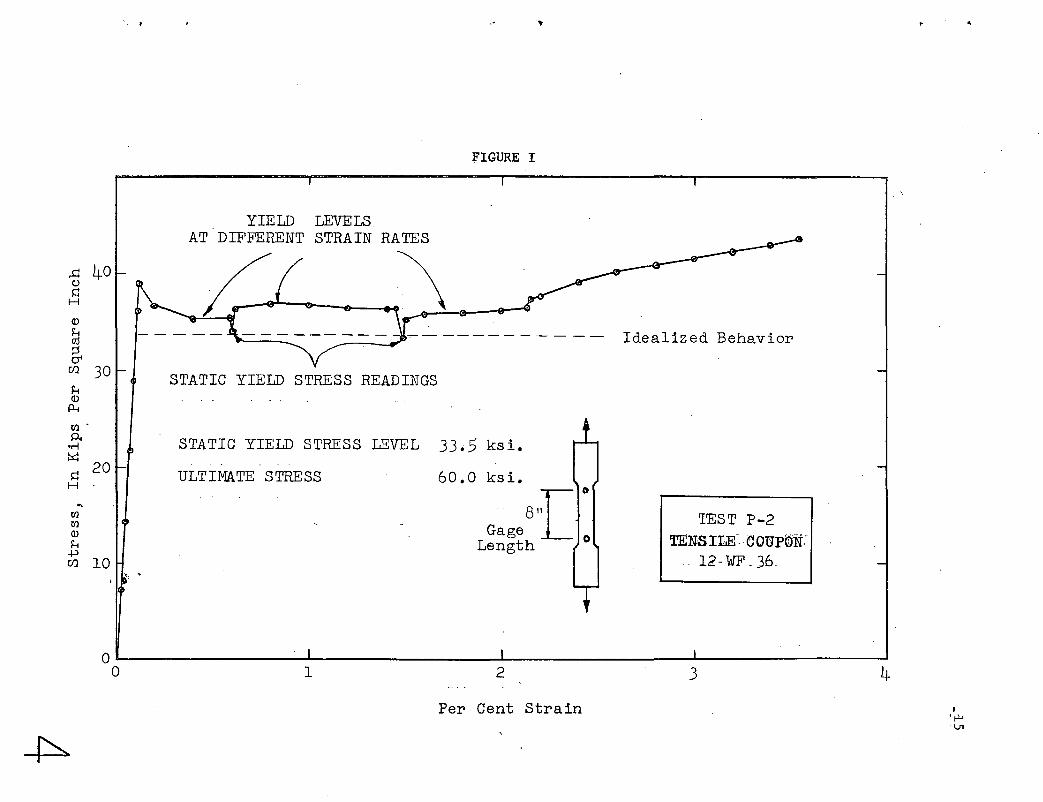
FIGURE I
..c: 40()
~H
<DHtilg.
(/) 30H<D
P-t
l1.l'p.,
•r-!t::s::j
~ 20H
11.l11.l<DH+J(/) 10
.~. ..
YIELDAT DIFFERENT
STATIC YIELD STRESS READINGS
STATIC YIELD STRESS LEVEL 33.5 ks i •
ULTIMATE STRESS 60.0 ksL
81[0Gage 0
Length
Idealized Behavior
TEST P-2
TENSILEr. CO:UPGN:12., WF _36.
OL- ..l..... -L- --l- --'
01234
Per Cent Strain I'~-U1

FIGURE 2
P
Spreader Beam
Base Beam
12 WF 364' _0"
SETUP FOR CONTROL BEAM TEST (T-l)
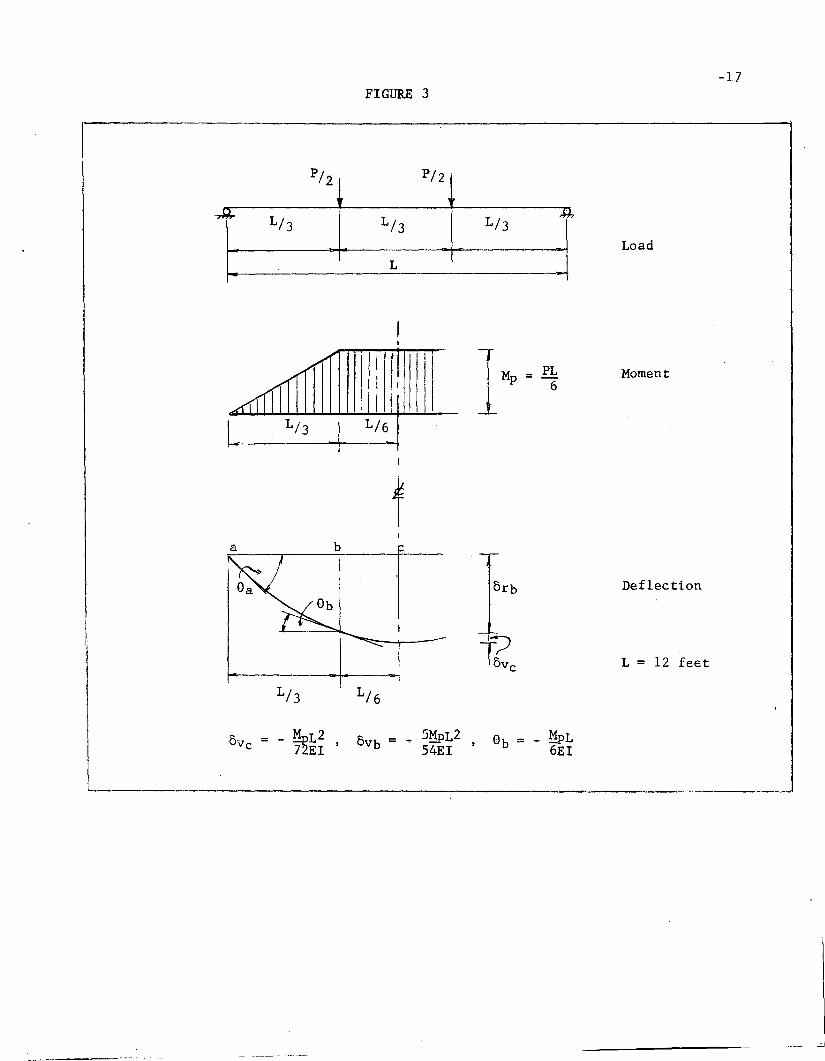
FIGURE 3
PI P/2 .
...----_2*__~_---...
1-:L/_
3 .1_ L~3 ~~
f--------I-----lL/3 L/6
Ov = - ~pL2, OVb = ~ 5~L2, 0b = - ~Lc 72EI 54EI 6EI
Load
Moment
Deflection
L = 12 feet
-17
e.
FIGURE 4
The Test Set-up
FIGURE 5
The control beam test showed how a plastichinge is developed in a wide flange section.
-18
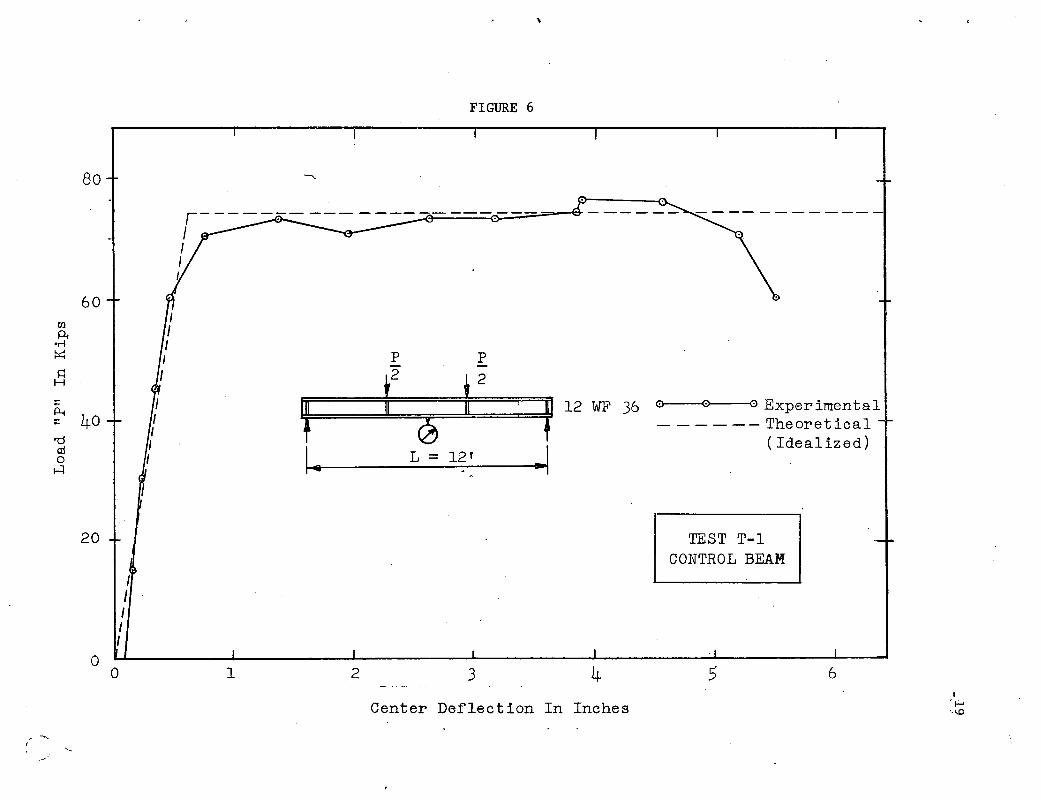
FIGURE 6
80
r-----~--------~----~--
IIII
60O'lPI
OM~ P Ps:: r ~ 2
H
~ f12 WF 36 0 0 o Experimental
~:: 40 0 - - - - -- Theoretical'0 ( Idealized)til I.- ~I0 L = 12'
...:l
20 TEST T-lCONTROL BEAM:
IIIII
050 1 2 3 4 6
I
Center Deflection In Inches '~
"\.0
,
FIGURE 7
2000
------ ---- ~----&----~-::::::-::~~~-- - - --r------III
1000
p11
j P
~.
~=.====~~Rotation1....4111----- L = 12 II ~I
Indicator
TEST T-1CONTROL BEAM
4-00 ·~0----0-.~o~01-0~5~--~0-.0-L0-l-"'6~·---0-......00~1~.5-;----0~.-0.L..0~20~· ---0-.-J0L-0~2--:5-----:-0-. 0-"0-3""'0-.------:0=-.--=0-=-:'035
Rotation Per Unit Length At Center In Radians Per Inch·I
!'-.Jo
![©(Q)[lJLJJ~~ ~m~~@lF[}=[] (Q)~ …digital.lib.lehigh.edu/fritz/pdf/272_5.pdf · · 2012-08-01tor of the Fritz Engineering Labora ... Then a stress vs-Et curve would be drawn as](https://img.pdfslide.us/doc/110x75/5aad34447f8b9a693f8e11a0/qljljj-mlf-q-of-the-fritz-engineering-labora-then-a-stress.jpg)