Embed Size (px)
Citation preview
Carmen Revenga Jake Brunner Norbert HenningerKen Kassem Richard Payne
Freshwater Systems
PILOT ANALYSIS OF GLOBAL ECOSYSTEMS
P I L O T A N A L Y S I S O F G L O B A L E C O S Y S T E M S
FreshwaterSystems
CARMEN REVENGA
JAKE BRUNNER
NORBERT HENNINGER
KEN KASSEM
RICHARD PAYNE
CAROLLYNE HUTTER
PUBLICATIONS DIRECTOR
HYACINTH BILLINGS
PRODUCTION MANAGER
MAGGIE POWELL AND KATHY DOUCETTE
COVER DESIGN AND LAYOUT
DAVID HOSANSKY
EDITING
Copyright © 2000 World Resources Institute. All rights reserved.ISBN: 1-56973-460-7
Library of Congress Catalog Card No. 00-109503
Printed in the United States of America on chlorine-free paper withrecycled content of 50%, 20% of which is post-consumer.
Photo Credits: Cover: Little Abiqua Creek, Oregon, Dennis A. Wentz, Smaller ecosystemphotos: Forests: Digital Vision, Ltd., Agriculture: Philippe Berry, Grasslands: PhotoDisc, Coastal:Digital Vision, Ltd., Prologue: Iguaçu Falls, Argentina/Brazil, Carmen Revenga, HumanModification of Freshwater Systems: Dalles Dam, Oregon, Corbis Images, Water Quantity:Digital Vision Ltd., Water Quality: Florida Everglades, South Florida Water Management District,Food — Inland Fisheries: Nile River, Gene Wampler, Biodiversity: Florida Everglades, SouthFlorida Water Management District.
Each World Resources Institute Report represents a timely, scholarly treat-ment of a subject of public concern. WRI takes responsibility for choosingthe study topics and guaranteeing its authors and researchers freedom of
inquiry. It also solicits and responds to the guidance of advisory panels and expertreviewers. Unless otherwise stated, however, all the interpretation and findings setforth in WRI publications are those of the authors.
P i l o t A n a l y s i s o f G l o b a l E c o s y s t e m s
FreshwaterSystems
CARMEN REVENGA
JAKE BRUNNER
NORBERT HENNINGER
KEN KASSEM
RICHARD PAYNE
With analytical contributions from:C. Nilsson, M. Svedmark, P. Hansson, S. Xiong, and K. Berggren, Land-
scape Ecology, Umeå University, Sweden (river fragmentation analysis)
Charles J. Vörösmarty and Balázs Fekete, Complex Systems Research
Center, University of New Hampshire, and Wolfgang Grabs, Global Runoff
Data Centre, Koblenz, Germany (global runoff analysis)
Kirsten M. J. Thompson, World Resources Institute (population projection
and water scarcity analysis)
Published by World Resources InstituteWashington, DC
This report is also available at http://www.wri.org/wr2000
i v P i l o t A n a l y s i s o f G l o b a l E c o s y s t e m s
Pilot Analysis ofGlobal Ecosystems (PAGE)
A series of five technical reports, available in print and on-line athttp://www.wri.org/wr2000.
A G R O E C O S Y S T E M SStanley Wood, Kate Sebastian, and Sara J. Scherr, Pilot Analysis of Global Ecosystems:
Agroecosystems, A joint study by International Food Policy Research Institute and World
Resources Institute, International Food Policy Research Institute and World Resources
Institute, Washington D.C.
October 2000 / paperback / ISBN 1-56973-457-7 / US$20.00
C O A S TA L E C O S Y S T E M SLauretta Burke, Yumiko Kura, Ken Kassem, Mark Spalding, Carmen Revenga, and
Don McAllister, Pilot Analysis of Global Ecosystems: Coastal Ecosystems, World Resources
Institute, Washington D.C.
November 2000 / paperback / ISBN 1-56973-458-5 / US$20.00
F O R E S T E C O S Y S T E M SEmily Matthews, Richard Payne, Mark Rohweder, and Siobhan Murray, Pilot Analysis
of Global Ecosystems: Forest Ecosystems, World Resources Institute, Washington D.C.
October 2000 / paperback / ISBN 1-56973-459-3 / US$20.00
F R E S H WAT E R S Y S T E M SCarmen Revenga, Jake Brunner, Norbert Henninger, Ken Kassem, and Richard Payne
Pilot Analysis of Global Ecosystems: Freshwater Systems, World Resources Institute,
Washington D.C.
October 2000 / paperback / ISBN 1-56973-460-7 / US$20.00
G R A S S L A N D E C O S Y S T E M SRobin White, Siobhan Murray, and Mark Rohweder, Pilot Analysis of Global Ecosystems:
Grassland Ecosystems, World Resources Institute, Washington D.C.
November 2000 / paperback / ISBN 1-56973-461-5 / US$20.00
The full text of each report will be available on-line at the time of publication. Printedcopies may be ordered by mail from WRI Publications, P.O. Box 4852, HampdenStation, Baltimore, MD 21211, USA. To order by phone, call 1-800-822-0504 (withinthe United States) or 410-516-6963 or by fax 410-516-6998. Orders may also beplaced on-line at http://www.wristore.com.
The agroecosystem report is also available at http://www.ifpri.org. Printed copies maybe ordered by mail from the International Food Policy Research Institute, Communica-tions Service, 2033 K Street, NW, Washington, D.C. 20006-5670, USA.
Project ManagementNorbert Henninger, WRI
Walt Reid, WRI
Dan Tunstall, WRI
Valerie Thompson, WRI
Arwen Gloege, WRI
Elsie Velez-Whited, WRI
AgroecosystemsStanley Wood, International Food
Policy Research Institute
Kate Sebastian, International Food
Policy Research Institute
Sara J. Scherr, University of
Maryland
Coastal EcosystemsLauretta Burke, WRI
Yumiko Kura, WRI
Ken Kassem, WRI
Mark Spalding, UNEP-WCMC
Carmen Revenga, WRI
Don McAllister, Ocean Voice
International
Forest EcosystemsEmily Matthews, WRI
Richard Payne, WRI
Mark Rohweder, WRI
Siobhan Murray, WRI
Freshwater SystemsCarmen Revenga, WRI
Jake Brunner, WRI
Norbert Henninger, WRI
Ken Kassem, WRI
Richard Payne, WRI
Grassland EcosystemsRobin White, WRI
Siobhan Murray, WRI
Mark Rohweder, WRI
F r e s h w a t e r S y s t e m s v
Contents
FOREWORD ..................................................................................................................................................................... vii
ACKNOWLEDGMENTS ..................................................................................................................................................... ix
INTRODUCTION TO THE PILOT ANALYSIS OF GLOBAL ECOSYSTEMS ..................................................... Introduction / 1
FRESHWATER SYSTEMS: EXECUTIVE SUMMARY .......................................................................................................... 1
Scope of the AssessmentKey Findings and Information IssuesConclusions
PROLOGUE: FRESHWATER SYSTEMS—WHAT THEY ARE, WHY THEY MATTER ....................................................... 11
HUMAN MODIFICATION OF FRESHWATER SYSTEMS ................................................................................................... 15
Modification Of RiversChanges In Groundwater ResourcesWetland Extent and ChangeWatershed ModificationModification Of Freshwater Systems Information Status and Needs
WATER QUANTITY .......................................................................................................................................................... 25
OverviewCondition Indicators of Water QuantityCapacity of Freshwater Systems to Provide WaterWater Quantity Information Status and Needs
WATER QUALITY ............................................................................................................................................................. 31
OverviewCondition Indicators of the Quality of Surface WatersCondition Indicators of Groundwater QualityCapacity of Freshwater Systems to Provide Clean WaterWater Quality Information Status and Needs
FOOD—INLAND FISHERIES ........................................................................................................................................... 41
Status and Trends in Inland FisheriesPressures on Inland Fishery ResourcesCondition Indicators of Fish ProductionCapacity of Freshwater System to Provide FoodInland Fisheries Information Status and Needs
v i P I L O T A N A L Y S I S O F G L O B A L E C O S Y S T E M S
BIODIVERSITY ................................................................................................................................................................ 49
OverviewIndicators of Biological ValueCondition Indicators of BiodiversityCapacity of Freshwater Systems to Sustain BiodiversityBiodiversity Information Status and Needs
TABLES
Table 1. Alteration of Freshwater Systems Worldwide .................................................................................................. 16Table 2. Large Dams and Storage Capacity of Large Reservoirs by Continent ............................................................... 17Table 3. Global Annual Renewable Water Supply Per Person in 1995 and Projections for 2025 .................................... 27Table 4. Trends in U.S. Stream Water Quality, 1980–89 .............................................................................................. 35Table 5. Changes in Fish Species Composition and Fisheries for Selected Rivers, Lakes, and Inland Seas ..................... 45Table 6. Species Richness by Ecosystem .................................................................................................................... 50Table 7. Watersheds with High Fish Species Richness and Endemism ......................................................................... 51
FIGURES
Figure 1. Trading Biodiversity for Export Earnings: The Changing Lake Victoria Fishery (Kenya Only) ......................... 12Figure 2. Skjern River Floodplain: Marshland and Meadow Area in 1871 and 1987 ..................................................... 13Figure 3. Statistical distribution of BOD by Continent, 1976–90 ................................................................................. 34Figure 4. Inland Capture Fisheries by Continent, 1984–97 ......................................................................................... 42Figure 5. Top Ten Producing Countries, 1997 ............................................................................................................. 43Figure 6. Global Inland Capture and Freshwater Aquaculture Growth, 1984–97 .......................................................... 44Figure 7. Commercial Landings of Salmon and Steelhead in the Columbia River, 1886–1998 ....................................... 46Figure 8. Globally Outstanding Freshwater Ecoregions in North America .................................................................... 52
BOXES
Box 1. What Is at Stake and What Are the Trade-offs: Okavango Delta ........................................................................ 20Box 2. Index of Watershed Indicators from the U.S. Environmental Protection Agency ................................................. 32Box 3. Threats and Issues Facing Inland Fisheries by Continent ................................................................................. 47
MAPS
Map 1. River Channel Fragmentation and Flow RegulationMap 2. Number of Large Dams under Construction by River Basin as of 1998Map 3. Residence Time of Continental Runoff by River BasinMap 4. Africa: Wetlands, Dams, and Ramsar SitesMaps 5a and 5b. United States: Historical Wetland Loss by State, 1780s–1980s and United States: Net Change in Wetland Area, 1982–92Map 6. Percentage of Cropland Area by River BasinMap 7. Percentage of Urban and Industrial Land Use by River BasinMaps 8a and 8b. Europe and the Middle East: Intensive Agricultural Land Use by Subbasin and Insular Southeast Asia: Intensive Agricultural Land Use by SubbasinMap 9. Annual Renewable Water Supply Per Person by River Basin, 1995Map 10. Projected Annual Renewable Water Supply Per Person by River Basin, 2025Map 11. Annual Renewable Water Supply and Dry Season Flow by River BasinMap 12. Trends in Inland Capture Fisheries by Country, 1984–97Map 13. Important Areas and Ecoregions for Freshwater BiodiversityMap 14. Fish Species Richness and Endemism by River BasinMap 15. Amphibian Census Sites and Decline IndexMap 16. Imperiled Freshwater Fish and Herpetofauna in North American Freshwater EcoregionsMap 17. Number of Species Introductions into Inland Waters by CountryMap 18. Zebra Mussel Expansion and Water Hyacinth Presence in the United States
BIBLIOGRAPHY............................................................................................................................................................... 59
F r e s h w a t e r S y s t e m s v i i
Foreword
Earth’s ecosystems and its peoples are bound together in agrand and complex symbiosis. We depend on ecosystems tosustain us, but the continued health of ecosystems depends,in turn, on our use and care. Ecosystems are the productiveengines of the planet, providing us with everything from thewater we drink to the food we eat and the fiber we use forclothing, paper, or lumber. Yet, nearly every measure we useto assess the health of ecosystems tells us we are drawing onthem more than ever and degrading them, in some cases atan accelerating pace.
Our knowledge of ecosystems has increased dramaticallyin recent decades, but it has not kept pace with our ability toalter them. Economic development and human well-beingwill depend in large part on our ability to manage ecosys-tems more sustainably. We must learn to evaluate our deci-sions on land and resource use in terms of how they affectthe capacity of ecosystems to sustain life — not only humanlife, but also the health and productive potential of plants,animals, and natural systems.
A critical step in improving the way we manage the earth’secosystems is to take stock of their extent, their condition,and their capacity to provide the goods and services we willneed in years to come. To date, no such comprehensive as-sessment of the state of the world’s ecosystems has been un-dertaken.
The Pilot Analysis of Global Ecosystems (PAGE) beginsto address this gap. This study is the result of a remarkablecollaborative effort between the World Resources Institute(WRI), the International Food Policy Research Institute(IFPRI), intergovernmental organizations, agencies, researchinstitutes, and individual experts in more than 25 countriesworldwide. The PAGE compares information already avail-able on a global scale about the condition of five major classesof ecosystems: agroecosystems, coastal areas, forests, fresh-water systems, and grasslands. IFPRI led the agroecosystemanalysis, while the others were led by WRI. The pilot analy-sis examines not only the quantity and quality of outputs butalso the biological basis for production, including soil andwater condition, biodiversity, and changes in land use overtime. Rather than looking just at marketed products, such as
food and timber, the study also analyses the condition of abroad array of ecosystem goods and services that people need,or enjoy, but do not buy in the marketplace.
The five PAGE reports show that human action has pro-foundly changed the extent, condition, and capacity of allmajor ecosystem types. Agriculture has expanded at the ex-pense of grasslands and forests, engineering projects havealtered the hydrological regime of most of the world’s majorrivers, settlement and other forms of development have con-verted habitats around the world’s coastlines. Human activi-ties have adversely altered the earth’s most important bio-geochemical cycles — the water, carbon, and nitrogen cycles— on which all life forms depend. Intensive managementregimes and infrastructure development have contributedpositively to providing some goods and services, such as foodand fiber from forest plantations. They have also led to habi-tat fragmentation, pollution, and increased ecosystem vul-nerability to pest attack, fires, and invasion by nonnative spe-cies. Information is often incomplete and the picture con-fused, but there are many signs that the overall capacity ofecosystems to continue to produce many of the goods andservices on which we depend is declining.
The results of the PAGE are summarized in World Resources2000–2001, a biennial report on the global environment pub-lished by the World Resources Institute in partnership withthe United Nations Development Programme, the United Na-tions Environment Programme, and the World Bank. Theseinstitutions have affirmed their commitment to making theviability of the world’s ecosystems a critical development pri-ority for the 21st century. WRI and its partners began workwith a conviction that the challenge of managing earth’s eco-systems — and the consequences of failure — will increasesignificantly in coming decades. We end with a keen aware-ness that the scientific knowledge and political will requiredto meet this challenge are often lacking today. To make soundecosystem management decisions in the future, significantchanges are needed in the way we use the knowledge andexperience at hand, as well as the range of information broughtto bear on resource management decisions.
viii P I L O T A N A L Y S I S O F G L O B A L E C O S Y S T E M S
A truly comprehensive and integrated assessment of glo-bal ecosystems that goes well beyond our pilot analysis isnecessary to meet information needs and to catalyze regionaland local assessments. Planning for such a Millennium Eco-system Assessment is already under way. In 1998, represen-tatives from international scientific and political bodies be-gan to explore the merits of, and recommend the structurefor, such an assessment. After consulting for a year and con-sidering the preliminary findings of the PAGE report, theyconcluded that an international scientific assessment of thepresent and likely future condition of the world’s ecosystemswas both feasible and urgently needed. They urged local,national, and international institutions to support the effortas stakeholders, users, and sources of expertise. If concludedsuccessfully, the Millennium Ecosystem Assessment will gen-erate new information, integrate current knowledge, developmethodological tools, and increase public understanding.
Human dominance of the earth’s productive systems givesus enormous responsibilities, but great opportunities as well.The challenge for the 21st century is to understand the vul-
nerabilities and resilience of ecosystems, so that we can findways to reconcile the demands of human development withthe tolerances of nature.
We deeply appreciate support for this project from theAustralian Centre for International Agricultural Research,The David and Lucile Packard Foundation, The NetherlandsMinistry of Foreign Affairs, the Swedish International Devel-opment Cooperation Agency, the United Nations Develop-ment Programme, the United Nations EnvironmentProgramme, the Global Bureau of the United States Agencyfor International Development, and The World Bank.
A special thank you goes to the AVINA Foundation, theGlobal Environment Facility, and the United Nations Fundfor International Partnerships for their early support of PAGEand the Millennium Ecosystem Assessment, which was in-strumental in launching our efforts.
JONATHAN LASH
PresidentWorld Resources Institute
F r e s h w a t e r S y s t e m s i x
Acknowledgments
national Earth Science Information Network (CIESIN); Com-plex Systems Research Center, University of New Hampshire;Convention on Wetlands; COWI Consulting Engineers andPlanners AS, Denmark; Declining Amphibian PopulationsTask Force; DHI Water & Environment, Denmark; EuropeanEnvironment Agency; Fisheries Department, Food and Agri-culture Organization of the United Nations (FAO); GlobalRunoff Data Centre, Koblenz, Germany; Land and WaterDevelopment Division, FAO; Landscape Ecology, Umeå Uni-versity, Sweden; U.S. National Oceanic and Atmospheric Ad-ministration – National Geophysical Data Center (NOAA-NGDC); National Resources Conservation Service, U.S. De-partment of Agriculture (USDA); National Wetlands Inven-tory, United States Fish and Wildlife Service; Oregon De-partment of Fish and Wildlife, U.S.A; State of Ohio Environ-mental Protection Agency, U.S.A.; United States GeologicalSurvey (USGS); Washington Department of Fish and Wild-life, U.S.A.; World Conservation Monitoring Centre (WCMC);World Wildlife Fund-U.S. (WWF-U.S.)
The authors would also like to express their gratitude tothe many individuals who contributed information and ad-vice, attended expert workshops, and reviewed successivedrafts of this report.
Robin Abell, WWF-U.S.; Devin Bartley, Fisheries Depart-ment, FAO; Amy Benson, USGS; Ger Bergkamp, IUCN- TheWorld Conservation Union; Stephen J. Brady, Natural Re-sources Conservation Service, USDA; Jesslyn Brown, USGS/EROS Data Center; Morley Brownstein, Health Canada;Cynthia Carey, Department of Biology, University of Colo-rado; John Cooper, Environment Canada; Thomas E. Dahl,National Wetlands Inventory, U.S. Fish and Wildlife Service;Nick Davidson, Convention on Wetlands; Jean-Marc Faurès,Land and Water Development Division, FAO; Stephen Fos-ter, British Geological Survey; Andy Fraser, EnvironmentCanada; Scott Frazier, Wetlands International; Brij Gopal,Jawaharlal Nehru University, New Delhi, India; JippeHoogeveen, Land and Water Development Division, FAO;Colette Jacono, USGS; Jim Kapetsky, Fisheries Department,FAO; James Karr, University of Washington; Les Kaufman,Marine Program, Boston University; Kim Martz, USGS; Don
The World Resources Institute and the International FoodPolicy Research Institute would like to acknowledge the mem-bers of the Millennium Assessment Steering Committee, whogenerously gave their time, insights, and expert review com-ments in support of the Pilot Analysis of Global Ecosystems.
Edward Ayensu, Ghana; Mark Collins, United NationsEnvironment Programme-World Conservation MonitoringCentre (UNEP -WCMC), United Kingdom; Angela Cropper,Trinidad and Tobago; Andrew Dearing, World Business Coun-cil for Sustainable Development (WBCSD); Janos Pasztor,UNFCCC; Louise Fresco, FAO; Madhav Gadgil, Indian In-stitute of Science, Bangalore, India; Habiba Gitay, Austra-lian National University, Australia; Gisbert Glaser, UNESCO;Zuzana Guziova, Ministry of the Environment, Slovak Re-public; He Changchui, FAO; Calestous Juma, Harvard Uni-versity; John Krebs, National Environment Research Coun-cil, United Kingdom; Jonathan Lash, World Resources Insti-tute; Roberto Lenton, UNDP; Jane Lubchenco, Oregon StateUniversity; Jeffrey McNeely, World Conservation Union(IUCN), Switzerland; Harold Mooney, International Councilfor Science (ICSU); Ndegwa Ndiangui, Convention to Com-bat Desertification; Prabhu L. Pingali, CIMMYT; Per Pinstrup-Andersen, Consultative Group on International AgriculturalResearch; Mario Ramos, Global Environment Facility; PeterRaven, Missouri Botanical Garden; Walter Reid, Secretariat;Cristian Samper, Instituto Alexander Von Humboldt, Colom-bia; José Sarukhán, CONABIO, Mexico; Peter Schei, Direc-torate for Nature Management, Norway; Klaus Töpfer, UNEP;José Galízia Tundisi, International Institute of Ecology, Bra-zil; Robert Watson, World Bank; Xu Guanhua, Ministry ofScience and Technology, People’s Republic of China; A.H.Zakri, Universiti Kebangsaan Malaysia, Malaysia.
The Pilot Analysis of Global Ecosystems would not havebeen possible without the data provided by numerous insti-tutions and agencies. The authors of the freshwater systemsanalysis wish to express their gratitude for the generous co-operation and invaluable information they received from thefollowing organizations:
BirdLife International; Center for Environmental SystemsResearch, University of Kassel, Germany; Center for Inter-
x P I L O T A N A L Y S I S O F G L O B A L E C O S Y S T E M S
McAllister, Ocean Voice International; Timothy L. Miller,USGS; Peter Moyle, Wildlife, Fish, and Conservation Biol-ogy, University of California, Davis; Tom Neill, Oregon De-partment of Fish and Wildlife; Christer Nilsson, Umeå Uni-versity, Sweden; Kim W. Olesen, DHI Water & Environment,Denmark; Francisco Olivera, Center for Research in WaterResources, University of Texas at Austin; Chales R. O’Neill,National Zebra Mussel Information Clearinghouse, New YorkSea Grant; Sandra Postel, Global Water Policy Project; Ed-ward T. Rankin, State of Ohio Environmental ProtectionAgency; Corinna Ravilious, WCMC; Ilze Reiss, EnvironmentCanada; Hans H. Riber, COWI Consulting Engineers andPlanners AS, Denmark; Steve Rothert, International RiversNetwork; Robert Rusin, Goddard Space Flight Center, NASA;Dork Sahagian, IGBP/GAIM, University of New Hampshire;John R. Sauer, USGS; Teresa Scott, Washington Departmentof Fish and Wildlife; Igor Shiklomanov, State HydrologicalInstitute, St. Petersburg, Russia; Robert Slater, Environment
Canada; Charles Spooner, U.S. Environmental ProtectionAgency; Bruce Stein, The Nature Conservancy; Melanie J.Stiassny, American Museum of Natural History; Greg Thomp-son, Environment Canada, Niels Thyssen, European Envi-ronment Agency; Joshua Viers, Dept. of Environmental Sci-ence and Policy, University of California, Davis; ZipanganiM. Vokhiwa, Ministry of Research and Environmental Affairs,Malawi; Charles Vörösmarty, University of New Hampshire;David Wilcove, Environmental Defense.
We also wish to thank the many individuals at WRI whowere generous with their help as this report progressed: TonyJanetos, Yumiko Kura, Gregory Mock, and Dan Tunstall.Kirsten Thompson and Johnathan Kool worked tirelessly inthe GIS lab to produce the PAGE maps. Hyacinth Billings,Kathy Doucette, Carollyne Hutter, and Maggie Powell guidedthe report through production with their usual calm skill, andprovided editorial and design assistance.
F r e s h w a t e r S y s t e m s I n t r o d u c t i o n / 1
I n t r o d u c t i o n t o t h e P A G E
Introduction to the Pilot Analysis
of Global Ecosystems
may not know of each other’s relevantfindings.
O B J E C T I V E SThe Pilot Analysis of Global Ecosystems(PAGE) is the first attempt to synthesizeinformation from national, regional, andglobal assessments. Information sourcesinclude state of the environment re-ports; sectoral assessments of agricul-ture, forestry, biodiversity, water, andfisheries, as well as national and glo-bal assessments of ecosystem extentand change; scientific research articles;and various national and internationaldata sets. The study reports on five ma-jor categories of ecosystems:? Agroecosystems;? Coastal ecosystems;? Forest ecosystems;? Freshwater systems;? Grassland ecosystems.
These ecosystems account for about90 percent of the earth’s land surface,excluding Greenland and Antarctica.PAGE results are being published as aseries of five technical reports, each cov-ering one ecosystem. Electronic versionsof the reports are posted on the Websiteof the World Resources Institute [http://www.wri.org/wr2000] and theagroecosystems report also is availableon the Website of the International FoodPolicy Research Institute [http://www/ifpri.org].
The primary objective of the pilotanalysis is to provide an overview of eco-system condition at the global and con-tinental levels. The analysis documents
the extent and distribution of the fivemajor ecosystem types and identifiesecosystem change over time. It analyzesthe quantity and quality of ecosystemgoods and services and, where dataexist, reviews trends relevant to the pro-duction of these goods and services overthe past 30 to 40 years. Finally, PAGEattempts to assess the capacity of eco-systems to continue to provide goodsand services, using measures of biologi-cal productivity, including soil andwater conditions, biodiversity, and landuse. Wherever possible, information ispresented in the form of indicators andmaps.
A second objective of PAGE is toidentify the most serious informationgaps that limit our current understand-ing of ecosystem condition. The infor-mation base necessary to assess ecosys-tem condition and productive capacityhas not improved in recent years, andmay even be shrinking as funding forenvironmental monitoring and record-keeping diminishes in some regions.
Most importantly, PAGE supports thelaunch of a Millennium Ecosystem As-sessment, a more ambitious, detailed,and integrated assessment of global eco-systems that will provide a firmer basisfor policy- and decision-making at thenational and subnational scale.
A N I N T E G R A T E D A P P R O A C H T OA S S E S S I N G E C O S Y S T E M G O O D SA N D S E R V I C E SEcosystems provide humans with awealth of goods and services, including
P E O P L E A N D E C O S Y S T E M SThe world’s economies are based on thegoods and services derived from ecosys-tems. Human life itself depends on thecontinuing capacity of biological pro-cesses to provide their multitude of ben-efits. Yet, for too long in both rich andpoor countries, development prioritieshave focused on how much humanitycan take from ecosystems, and too littleattention has been paid to the impact ofour actions. We are now experiencingthe effects of ecosystem decline in nu-merous ways: water shortages in thePunjab, India; soil erosion in Tuva, Rus-sia; fish kills off the coast of North Caro-lina in the United States; landslides onthe deforested slopes of Honduras; firesin the forests of Borneo and Sumatra inIndonesia. The poor, who often dependdirectly on ecosystems for their liveli-hoods, suffer most when ecosystems aredegraded.
A critical step in managing our eco-systems is to take stock of their extent,their condition, and their capacity tocontinue to provide what we need. Al-though the information available todayis more comprehensive than at any timepreviously, it does not provide a com-plete picture of the state of the world’secosystems and falls far short of man-agement and policy needs. Informationis being collected in abundance butefforts are often poorly coordinated.Scales are noncomparable, baselinedata are lacking, time series are incom-plete, differing measures defy integra-tion, and different information sources
I n t r o d u c t i o n / 2 P I L O T A N A L Y S I S O F G L O B A L E C O S Y S T E M S
I n t r o d u c t i o n t o t h e P A G E
food, building and clothing materials,medicines, climate regulation, water pu-rification, nutrient cycling, recreationopportunities, and amenity value. Atpresent, we tend to manage ecosystemsfor one dominant good or service, suchas grain, fish, timber, or hydropower,without fully realizing the trade-offs weare making. In so doing, we may be sac-rificing goods or services more valuablethan those we receive — often thosegoods and services that are not yet val-ued in the market, such as biodiversityand flood control. An integrated ecosys-tem approach considers the entire rangeof possible goods and services a givenecosystem provides and attempts to op-timize the benefits that society can de-rive from that ecosystem and across eco-systems. Its purpose is to help maketrade-offs efficient, transparent, and sus-tainable.
Such an approach, however, presentssignificant methodological challenges.Unlike a living organism, which mightbe either healthy or unhealthy but can-not be both simultaneously, ecosystemscan be in good condition for producingcertain goods and services but in poorcondition for others. PAGE attempts toevaluate the condition of ecosystems byassessing separately their capacity toprovide a variety of goods and servicesand examining the trade-offs humanshave made among those goods and ser-vices. As one example, analysis of aparticular region might reveal that foodproduction is high but, because of irri-gation and heavy fertilizer application,the ability of the system to provide cleanwater has been diminished.
Given data inadequacies, this sys-tematic approach was not always fea-sible. For each of the five ecosystems,PAGE researchers, therefore, focus ondocumenting the extent and distributionof ecosystems and changes over time.We develop indicators of ecosystem con-dition — indicators that inform us about
the current provision of goods and ser-vices and the likely capacity of the eco-system to continue providing thosegoods and services. Goods and servicesare selected on the basis of their per-ceived importance to human develop-ment. Most of the ecosystem studies ex-amine food production, water qualityand quantity, biodiversity, and carbonsequestration. The analysis of forestsalso studies timber and woodfuel pro-duction; coastal and grassland studiesexamine recreational and tourism ser-vices; and the agroecosystem study re-views the soil resource as an indicatorof both agricultural potential and its cur-rent condition.
P A RT N E R S A N D T H E R E S E A R C HP R O C E S SThe Pilot Analysis of Global Ecosys-tems was a truly international collabo-rative effort. The World Resources In-stitute and the International FoodPolicy Research Institute carried outtheir research in partnership with nu-merous institutions worldwide (see Ac-knowledgments). In addition to thesepartnerships, PAGE researchers reliedon a network of international expertsfor ideas, comments, and formal re-views. The research process includedmeetings in Washington, D.C., attendedby more than 50 experts from devel-oped and developing countries. Themeetings proved invaluable in devel-oping the conceptual approach andguiding the research program towardthe most promising indicators giventime, budget, and data constraints.Drafts of PAGE reports were sent to over70 experts worldwide, presented andcritiqued at a technical meeting of theConvention on Biological Diversity inMontreal (June, 1999) and discussedat a Millennium Assessment planningmeeting in Kuala Lumpur, Malaysia(September, 1999). Draft PAGE mate-rials and indicators were also presented
and discussed at a Millennium Assess-ment planning meeting in Winnipeg,Canada, (September, 1999) and at themeeting of the Parties to the Conven-tion to Combat Desertification, held inRecife, Brazil (November, 1999).
K E Y F I N D I N G SKey findings of PAGE relate both to eco-system condition and the informationbase that supported our conclusions.
The Current State of
EcosystemsThe PAGE reports show that human ac-tion has profoundly changed the extent,distribution, and condition of all majorecosystem types. Agriculture has ex-panded at the expense of grasslands andforests, engineering projects have al-tered the hydrological regime of most ofthe world’s major rivers, settlement andother forms of development have con-verted habitats around the world’s coast-lines.
The picture we get from PAGE re-sults is complex. Ecosystems are in goodcondition for producing some goods andservices but in poor condition for pro-ducing others. Overall, however, thereare many signs that the capacity of eco-systems to continue to produce many ofthe goods and services on which we de-pend is declining. Human activitieshave significantly disturbed the globalwater, carbon, and nitrogen cycles onwhich all life depends. Agriculture, in-dustry, and the spread of human settle-ments have permanently converted ex-tensive areas of natural habitat and con-tributed to ecosystem degradationthrough fragmentation, pollution, andincreased incidence of pest attacks,fires, and invasion by nonnative species.
The following paragraphs look acrossecosystems to summarize trends in pro-duction of the most important goods and
F r e s h w a t e r S y s t e m s I n t r o d u c t i o n / 3
I n t r o d u c t i o n t o t h e P A G E
services and the outlook for ecosystemproductivity in the future.
Food ProductionFood production has more than keptpace with global population growth. Onaverage, food supplies are 24 percenthigher per person than in 1961 and realprices are 40 percent lower. Productionis likely to continue to rise as demandincreases in the short to medium term.Long-term productivity, however, isthreatened by increasing water scarcityand soil degradation, which is now se-vere enough to reduce yields on about16 percent of agricultural land, espe-cially cropland in Africa and CentralAmerica and pastures in Africa. Irri-gated agriculture, an important compo-nent in the productivity gains of theGreen Revolution, has contributed towaterlogging and salinization, as well asto the depletion and chemical contami-nation of surface and groundwater sup-plies. Widespread use of pesticides oncrops has lead to the emergence of manypesticide-resistant pests and pathogens,and intensive livestock production hascreated problems of manure disposaland water pollution. Food productionfrom marine fisheries has risen sixfoldsince 1950 but the rate of increase hasslowed dramatically as fisheries havebeen overexploited. More than 70 per-cent of the world’s fishery resources forwhich there is information are now fullyfished or overfished (yields are static ordeclining). Coastal fisheries are underthreat from pollution, development, anddegradation of coral reef and mangrovehabitats. Future increases in productionare expected to come largely fromaquaculture.
Water QuantityDams, diversions, and other engineer-ing works have transformed the quan-tity and location of freshwater availablefor human use and sustaining aquatic
ecosystems. Water engineering has pro-foundly improved living standards, byproviding fresh drinking water, water forirrigation, energy, transport, and floodcontrol. In the twentieth century, waterwithdrawals have risen at more thandouble the rate of population increaseand surface and groundwater sources inmany parts of Asia, North Africa, andNorth America are being depleted.About 70 percent of water is used in ir-rigation systems where efficiency is of-ten so low that, on average, less than halfthe water withdrawn reaches crops. Onalmost every continent, river modifica-tion has affected the flow of rivers to thepoint where some no longer reach theocean during the dry season. Freshwa-ter wetlands, which store water, reduceflooding, and provide specializedbiodiversity habitat, have been reducedby as much as 50 percent worldwide.Currently, almost 40 percent of theworld’s population experience seriouswater shortages. Water scarcity is ex-pected to grow dramatically in some re-gions as competition for water grows be-tween agricultural, urban, and commer-cial sectors.
Water QualitySurface water quality has improved withrespect to some pollutants in developedcountries but water quality in develop-ing countries, especially near urban andindustrial areas, has worsened. Water isdegraded directly by chemical or nutri-ent pollution, and indirectly when landuse change increases soil erosion or re-duces the capacity of ecosystems to fil-ter water. Nutrient runoff from agricul-ture is a serious problem around theworld, resulting in eutrophication andhuman health hazards in coastal regions,especially in the Mediterranean, BlackSea, and northwestern Gulf of Mexico.Water-borne diseases caused by fecalcontamination of water by untreatedsewage are a major source of morbidity
and mortality in the developing world.Pollution and the introduction of non-native species to freshwater ecosystemshave contributed to serious declines infreshwater biodiversity.
Carbon StorageThe world’s plants and soil organismsabsorb carbon dioxide (CO2) during pho-tosynthesis and store it in their tissues,which helps to slow the accumulationof CO2 in the atmosphere and mitigateclimate change. Land use change thathas increased production of food andother commodities has reduced the netcapacity of ecosystems to sequester andstore carbon. Carbon-rich grasslandsand forests in the temperate zone havebeen extensively converted to croplandand pasture, which store less carbon perunit area of land. Deforestation is itselfa significant source of carbon emissions,because carbon stored in plant tissue isreleased by burning and accelerated de-composition. Forests currently storeabout 40 percent of all the carbon heldin terrestrial ecosystems. Forests in thenorthern hemisphere are slowly increas-ing their storage capacity as they regrowafter historic clearance. This gain, how-ever, is more than offset by deforesta-tion in the tropics. Land use change ac-counts for about 20 percent of anthro-pogenic carbon emissions to the atmo-sphere. Globally, forests today are a netsource of carbon.
BiodiversityBiodiversity provides many direct ben-efits to humans: genetic material for cropand livestock breeding, chemicals formedicines, and raw materials for indus-try. Diversity of living organisms and theabundance of populations of many spe-cies are also critical to maintaining bio-logical services, such as pollination andnutrient cycling. Less tangibly, but noless importantly, diversity in nature isregarded by most people as valuable in
I n t r o d u c t i o n / 4 P I L O T A N A L Y S I S O F G L O B A L E C O S Y S T E M S
I n t r o d u c t i o n t o t h e P A G E
its own right, a source of aesthetic plea-sure, spiritual solace, beauty, and won-der. Alarming losses in globalbiodiversity have occurred over the pastcentury. Most are the result of habitatdestruction. Forests, grasslands, wet-lands, and mangroves have been exten-sively converted to other uses; only tun-dra, the Poles, and deep-sea ecosystemshave experienced relatively littlechange. Biodiversity has suffered asagricultural land, which supports far lessbiodiversity than natural forest, has ex-panded primarily at the expense of for-est areas. Biodiversity is also diminishedby intensification, which reduces thearea allotted to hedgerows, copses, orwildlife corridors and displaces tradi-tional varieties of seeds with modernhigh-yield, but genetically uniform,crops. Pollution, overexploitation, andcompetition from invasive species rep-resent further threats to biodiversity.Freshwater ecosystems appear to be themost severely degraded overall, with anestimated 20 percent of freshwater fishspecies becoming extinct, threatened, orendangered in recent decades.
Informat ion Status
and Needs
Ecosystem Extent and Land UseCharacterizationAvailable data proved adequate to mapapproximate ecosystem extent for mostregions and to estimate historic changein grassland and forest area by compar-ing current with potential vegetationcover. PAGE was able to report only onrecent changes in ecosystem extent atthe global level for forests and agricul-tural land.
PAGE provides an overview of hu-man modifications to ecosystemsthrough conversion, cultivation,firesetting, fragmentation by roads anddams, and trawling of continentalshelves. The study develops a number
of indicators that quantify the degree ofhuman modification but more informa-tion is needed to document adequatelythe nature and rate of human modifica-tions to ecosystems. Relevant data at theglobal level are incomplete and someexisting data sets are out of date.
Perhaps the most urgent need is forbetter information on the spatial distri-bution of ecosystems and land uses. Re-mote sensing has greatly enhanced ourknowledge of the global extent of veg-etation types. Satellite data can provideinvaluable information on the spatialpattern and extent of ecosystems, ontheir physical structure and attributes,and on rates of change in the landscape.However, while gross spatial changes invegetation extent can be monitored us-ing coarse-resolution satellite data,quantifying land cover change at thenational or subnational level requireshigh-resolution data with a resolution oftens of meters rather than kilometers.
Much of the information that wouldallow these needs to be met, at both thenational and global levels, already ex-ists, but is not yet in the public domain.New remote sensing techniques and im-proved capabilities to manage complexglobal data sets mean that a completesatellite-based global picture of theearth could now be made available, al-though at significant cost. This informa-tion would need to be supplemented byextensive ground-truthing, involving ad-ditional costs. If sufficient resourceswere committed, fundamentally impor-tant information on ecosystem extent,land cover, and land use patterns aroundthe world could be provided at the levelof detail needed for national planning.Such information would also prove in-valuable to international environmentalconventions, such as those dealing withwetlands, biological diversity, desertifi-cation, and climate change, as well asthe international agriculture, forest, andfishery research community.
Ecosystem Condition and Capacityto Provide Goods and Services
In contrast to information on spatial ex-tent, data that can be used to analyzeecosystem condition are often unavail-able or incomplete. Indicator develop-ment is also beset by methodological dif-ficulties. Traditional indicators, for ex-ample, those relating to pressures on en-vironments, environmental status, or so-cietal responses (pressure-state-re-sponse model indicators) provide onlya partial view and reveal little about theunderlying capacity of the ecosystem todeliver desired goods and services.Equally, indicators of human modifica-tion tell us about changes in land use orbiological parameters, but do not nec-essarily inform us about potentially posi-tive or negative outcomes.
Ecosystem conditions tend to behighly site-specific. Information on ratesof soil erosion or species diversity in onearea may have little relevance to an ap-parently similar system a few miles away.It is expensive and challenging to moni-tor and synthesize site-specific data andpresent it in a form suitable for nationalpolicy and resource management deci-sions. Finally, even where data are avail-able, scientific understanding of howchanges in biological systems will affectgoods and services is limited. For ex-ample, experimental evidence showsthat loss of biological diversity tends toreduce the resilience of a system to per-turbations, such as storms, pest out-breaks, or climate change. But scien-tists are not yet able to quantify howmuch resilience is lost as a result of theloss of biodiversity in a particular siteor how that loss of resilience might af-fect the long-term production of goodsand services.
Overall, the availability and qualityof information tend to match the recog-nition accorded to various goods and ser-vices by markets. Generally good dataare available for traded goods, such as
F r e s h w a t e r S y s t e m s I n t r o d u c t i o n / 5
I n t r o d u c t i o n t o t h e P A G E
grains, fish, meat, and timber productsand some of the more basic relevant pro-ductivity factors, such as fertilizer ap-plication rates, water inputs, and yields.Data on products that are exchanged ininformal markets, or consumed directly,are patchy and often modeled. Examplesinclude fish landings from artisanal fish-eries, woodfuels, subsistence food cropsand livestock, and nonwood forest prod-ucts. Information on the biological fac-tors that support production of thesegoods — including size of fish spawn-ing stocks, biomass densities, subsis-tence food yields, and forest food har-vests — are generally absent.
The future capacity (long-term pro-ductivity) of ecosystems is influenced bybiological processes, such as soil forma-tion, nutrient cycling, pollination, andwater purification and cycling. Few ofthese environmental services have, asyet, been accorded economic value thatis recognized in any functioning market.There is a corresponding lack of sup-port for data collection and monitoring.This is changing in the case of carbonstorage and cycling. Interest in the pos-sibilities of carbon trading mechanismshas stimulated research and generatedmuch improved data on carbon storesin terrestrial ecosystems and the dimen-sions of the global carbon cycle. Fewcomparable datasets exist for elementssuch as nitrogen or sulfur, despite their
fundamental importance in maintainingliving systems.
Although the economic value of ge-netic diversity is growing, informationon biodiversity is uniformly poor.Baseline and trend data are largely lack-ing; only an estimated 15 to 20 percentof the world’s species have been identi-fied. The OECD Megascience Forumhas launched a new international pro-gram to accelerate the identification andcataloging of species around the world.This information will need to be supple-mented with improved data on speciespopulation trends and the numbers andabundance of invasive species. Devel-oping databases on population trends (andthreat status) is likely to be a major chal-lenge, because most countries still needto establish basic monitoring programs.
The PAGE divides the world’s eco-systems to examine them at a globalscale and think in broad terms about thechallenges of managing themsustainably. In reality, ecosystems arelinked by countless flows of material andhuman actions. The PAGE analysis doesnot make a distinction between naturaland managed ecosystems; human inter-vention affects all ecosystems to somedegree. Our aim is to take a first steptoward understanding the collective im-pacts of those interventions on the fullrange of goods and services that ecosys-tems provide. We conclude that we lack
much of the baseline information nec-essary to determine ecosystem condi-tions at a global, regional or, in manyinstances, even a local scale. We alsolack systematic approaches necessary tointegrate analyses undertaken at differ-ent locations and spatial scales.
Finally, it should be noted that PAGElooks at past trends and current status,but does not try to project future situa-tions where, for example, technologicaldevelopment might increase dramati-cally the capacity of ecosystems to de-liver the goods and services we need.Such considerations were beyond thescope of the study. However, technolo-gies tend to be developed and appliedin response to market-related opportu-nities. A significant challenge is to findthose technologies, such as integratedpest management and zero tillage culti-vation practices in the case of agricul-ture, that can simultaneously offer mar-ket-related as well as environmentalbenefits. It has to be recognized, none-theless, that this type of “win-win” so-lution may not always be possible. Insuch cases, we need to understand thenature of the trade-offs we must makewhen choosing among different combi-nations of goods and services. At presentour knowledge is often insufficient to tellus where and when those trade-offs areoccurring and how we might minimizetheir effects.
F r e s h w a t e r S y s t e m s 1
E x e c u t i v e S u m m a r y
F R E S H WAT E R S Y S T E M S:E X E C U T I V E S U M M A RY
On a global scale, only limited information is available onthe condition of the world’s freshwater systems. Often thespatial resolution and temporal domains for different parts ofthe world are poorly harmonized. Most developing countrieslack environmental monitoring programs for freshwater sys-tems. Even developed countries with data-collection systemson hydrology, species, habitats, and physical and chemicalparameters of water quality have done little to develop indi-cators that measure important ecological processes of fresh-water systems, such as water purification and aquifer recharge.More also needs to be done to integrate data for entire water-sheds, from water supply and consumption to land use andbiodiversity.
Our analysis looks at measures that show the degree ofhuman intervention in the hydrological cycle and what weknow concerning three important goods and services providedby freshwater systems: water, food, and biodiversity. Thesegoods and services were chosen partly on the advice of a widerange of freshwater experts and partly because of data avail-ability. The data and indicators presented in this pilot analy-sis focus on the following:? Human modification of freshwater systems. (These
include all physical changes in the hydrological cycle,especially river and stream corrections, flood control bydams, conversion of wetlands, and land-use changes inthe entire watershed—all of which are changing runoffcharacteristics).? Water quantity (i.e., availability).? Water quality.? Food (fish in particular).? Biodiversity.
We use these indicators to identify existing data, highlightcharacteristics of ideal indicators to measure the capacity offreshwater ecosystems, and point out data and informationneeds. These in turn will become useful inputs for the Mil-lennium Ecosystem Assessment.
The constant cycle of water between the oceans, atmosphere,and land sustains life on Earth. All organisms on the planetneed water to survive. Without water, microorganisms thatdecompose organic matter could not exist, interrupting theecological loops of matter and energy and shutting down allecosystems.
Freshwater systems are created by water that enters theterrestrial environment as precipitation and flows both aboveand below ground toward the sea. These systems encompassa wide range of habitats, including rivers, lakes, and wet-lands, and the riparian zones associated with them. Theirboundaries are constantly changing with the seasonality inthe hydrological cycle. Their environmental benefits and costsare distributed widely across time and space, because of thecomplex interactions between climate, surface water andgroundwater, and coastal marine areas.
This analysis concentrates on the terrestrial water that ismost accessible to humans: the water in rivers, lakes, andwetlands. Humans also rely heavily on groundwater, which isthe only source of fresh water in some parts of the world.However, this paper will not focus as extensively on ground-water, in part because the data on this resource are scarce.
Scope of the AssessmentThis study analyzes quantitative and qualitative informationand develops selected indicators of the condition of the world’sfreshwater systems. The condition is defined as the currentand future capacity of the systems to continue providing thefull range of goods and services needed or valued by humans.
Where available, we use global data sets to illustrate keyindicators. In cases in which global data are not available,we use regional- and national-level information to illustrateimportant concepts, indicators, trends, and issues. Sometimes,local-level case studies have been used to illustrate trendsthat appear to be important but for which national or globaldata do not exist.
2 P I L O T A N A L Y S I S O F G L O B A L E C O S Y S T E M S
E x e c u t i v e S u m m a r y
Even though food production from irrigated crops is inti-mately related to water availability, and agriculture is the big-gest user of water, this report does not assess the condition offreshwater systems for agriculture production. A separate PilotAnalysis of Global Ecosystems (PAGE) report onagroecosystems assesses agriculture production in detail.Moreover, this report on freshwater systems does not coveradditional important services derived from freshwater sys-tems such as hydropower, transportation, and recreation.
Hydropower electricity production plays a significant rolein the overall energy output of many countries. Of the totalelectricity generated in the world, hydropower accounts for18 percent and in 18 countries, including Brazil, Norway,Burundi, and Laos, it generates 90 percent or more of theelectricity (Gleick 1998:276–280).
Since historical times, transportation has been a crucialservice that humans have derived from freshwater systems.Rivers have been harnessed as routes for exploring, coloniz-ing, and settling new areas, as well as transporting goods andcommunicating. In western Europe, for example, inland wa-terways transport almost 8 percent of all inland freight (EEA1995:441).
Tourism and recreation, as well as the more subtle spiri-tual and aesthetic qualities of freshwater systems, constituteperhaps the most important omission from this study. Societyplaces a high value on freshwater recreational activities, suchas boating, fishing, hunting, birdwatching, and swimming.These services generate billions of dollars in direct and indi-rect revenue in many developed and developing countries.
Exact figures are hard to calculate because of the dispersednature of these activities. In the United States alone, how-ever, 30 million anglers went freshwater fishing in 1996, ex-pending US$24.5 billion on trips and equipment (UFWS1996:8).
The spiritual and aesthetic qualities of freshwater systemscannot readily be captured by the kind of quantitative analy-sis presented here. For two reasons, this study does not con-sider data on tourism revenues, which some analysts haveused as proxy measures of human appreciation. First, the veryconcept of analyzing freshwater systems goods and servicesis essentially utilitarian, whereas emotional commitment tothese systems as things of beauty or intrinsic value is essen-tially normative. Second, any attempt to develop quantitativeindicators of such intangible issues risks removing them fromtheir proper arena of political, moral, and cultural debate.
Finally, even though groundwater resources play a criti-cal role in many regions of the world by providing potable,industrial, and irrigation water, global data on this resourceare scarce and dispersed among national agencies. This analy-sis, therefore, provides a general overview of the issues af-fecting groundwater resources and their condition.
Key F ind ings and Informat ion I s suesThe following tables (pp. 3–7) summarize key findings of thestudy regarding the condition of freshwater systems, as wellas the quality and availability of data.
F r e s h w a t e r S y s t e m s 3
E x e c u t i v e S u m m a r y
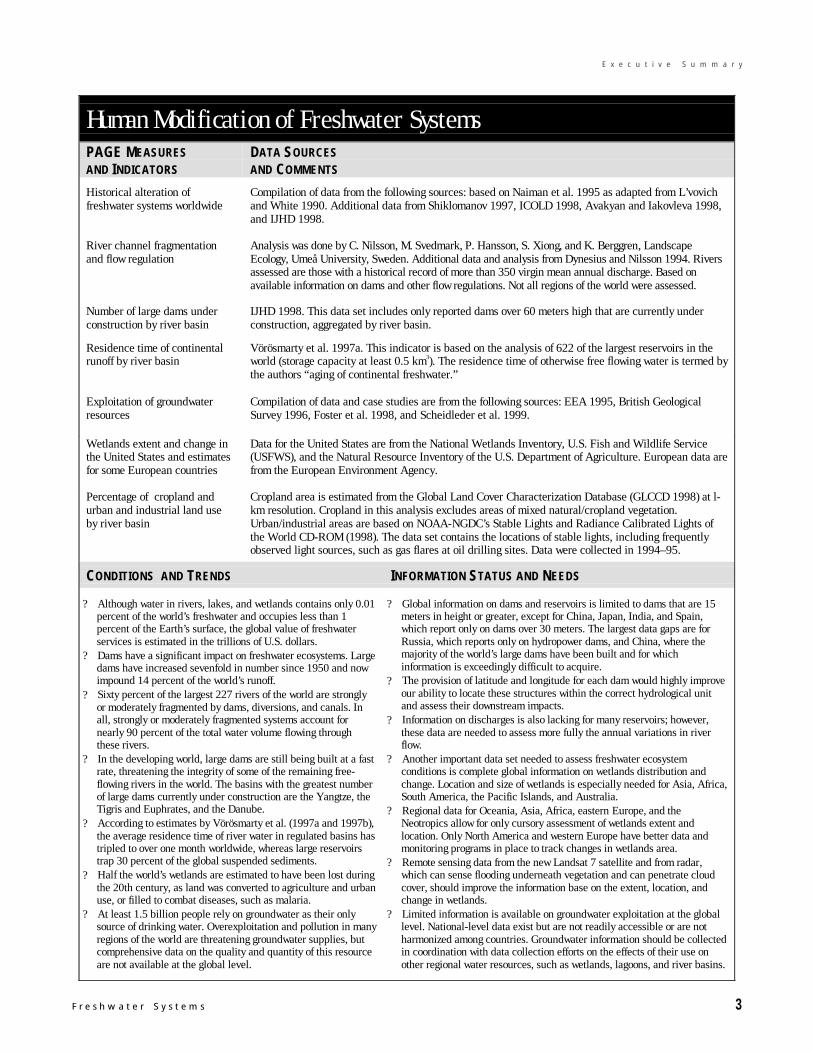
Human Modification of Freshwater SystemsPAGE MEASURESAND INDICATORS
DATA SOURCESAND COMMENTS
Historical alteration offreshwater systems worldwide
Compilation of data from the following sources: based on Naiman et al. 1995 as adapted from L’vovichand White 1990. Additional data from Shiklomanov 1997, ICOLD 1998, Avakyan and Iakovleva 1998,and IJHD 1998.
River channel fragmentationand flow regulation
Analysis was done by C. Nilsson, M. Svedmark, P. Hansson, S. Xiong, and K. Berggren, LandscapeEcology, Umeå University, Sweden. Additional data and analysis from Dynesius and Nilsson 1994. Riversassessed are those with a historical record of more than 350 virgin mean annual discharge. Based onavailable information on dams and other flow regulations. Not all regions of the world were assessed.
Number of large dams underconstruction by river basin
IJHD 1998. This data set includes only reported dams over 60 meters high that are currently underconstruction, aggregated by river basin.
Residence time of continentalrunoff by river basin
Vörösmarty et al. 1997a. This indicator is based on the analysis of 622 of the largest reservoirs in theworld (storage capacity at least 0.5 km3). The residence time of otherwise free flowing water is termed bythe authors “aging of continental freshwater.”
Exploitation of groundwaterresources
Compilation of data and case studies are from the following sources: EEA 1995, British GeologicalSurvey 1996, Foster et al. 1998, and Scheidleder et al. 1999.
Wetlands extent and change inthe United States and estimatesfor some European countries
Data for the United States are from the National Wetlands Inventory, U.S. Fish and Wildlife Service(USFWS), and the Natural Resource Inventory of the U.S. Department of Agriculture. European data arefrom the European Environment Agency.
Percentage of cropland andurban and industrial land useby river basin
Cropland area is estimated from the Global Land Cover Characterization Database (GLCCD 1998) at l-km resolution. Cropland in this analysis excludes areas of mixed natural/cropland vegetation.Urban/industrial areas are based on NOAA-NGDC’s Stable Lights and Radiance Calibrated Lights ofthe World CD-ROM (1998). The data set contains the locations of stable lights, including frequentlyobserved light sources, such as gas flares at oil drilling sites. Data were collected in 1994–95.
CONDITIONS AND TRENDS INFORMATION STATUS AND NEEDS
? Although water in rivers, lakes, and wetlands contains only 0.01percent of the world’s freshwater and occupies less than 1percent of the Earth’s surface, the global value of freshwaterservices is estimated in the trillions of U.S. dollars.
? Dams have a significant impact on freshwater ecosystems. Largedams have increased sevenfold in number since 1950 and nowimpound 14 percent of the world’s runoff.
? Sixty percent of the largest 227 rivers of the world are stronglyor moderately fragmented by dams, diversions, and canals. Inall, strongly or moderately fragmented systems account fornearly 90 percent of the total water volume flowing throughthese rivers.
? In the developing world, large dams are still being built at a fastrate, threatening the integrity of some of the remaining free-flowing rivers in the world. The basins with the greatest numberof large dams currently under construction are the Yangtze, theTigris and Euphrates, and the Danube.
? According to estimates by Vörösmarty et al. (1997a and 1997b),the average residence time of river water in regulated basins hastripled to over one month worldwide, whereas large reservoirstrap 30 percent of the global suspended sediments.
? Half the world’s wetlands are estimated to have been lost duringthe 20th century, as land was converted to agriculture and urbanuse, or filled to combat diseases, such as malaria.
? At least 1.5 billion people rely on groundwater as their onlysource of drinking water. Overexploitation and pollution in manyregions of the world are threatening groundwater supplies, butcomprehensive data on the quality and quantity of this resourceare not available at the global level.
? Global information on dams and reservoirs is limited to dams that are 15meters in height or greater, except for China, Japan, India, and Spain,which report only on dams over 30 meters. The largest data gaps are forRussia, which reports only on hydropower dams, and China, where themajority of the world’s large dams have been built and for whichinformation is exceedingly difficult to acquire.
? The provision of latitude and longitude for each dam would highly improveour ability to locate these structures within the correct hydrological unitand assess their downstream impacts.
? Information on discharges is also lacking for many reservoirs; however,these data are needed to assess more fully the annual variations in riverflow.
? Another important data set needed to assess freshwater ecosystemconditions is complete global information on wetlands distribution andchange. Location and size of wetlands is especially needed for Asia, Africa,South America, the Pacific Islands, and Australia.
? Regional data for Oceania, Asia, Africa, eastern Europe, and theNeotropics allow for only cursory assessment of wetlands extent andlocation. Only North America and western Europe have better data andmonitoring programs in place to track changes in wetlands area.
? Remote sensing data from the new Landsat 7 satellite and from radar,which can sense flooding underneath vegetation and can penetrate cloudcover, should improve the information base on the extent, location, andchange in wetlands.
? Limited information is available on groundwater exploitation at the globallevel. National-level data exist but are not readily accessible or are notharmonized among countries. Groundwater information should be collectedin coordination with data collection efforts on the effects of their use onother regional water resources, such as wetlands, lagoons, and river basins.
4 P I L O T A N A L Y S I S O F G L O B A L E C O S Y S T E M S
E x e c u t i v e S u m m a r y
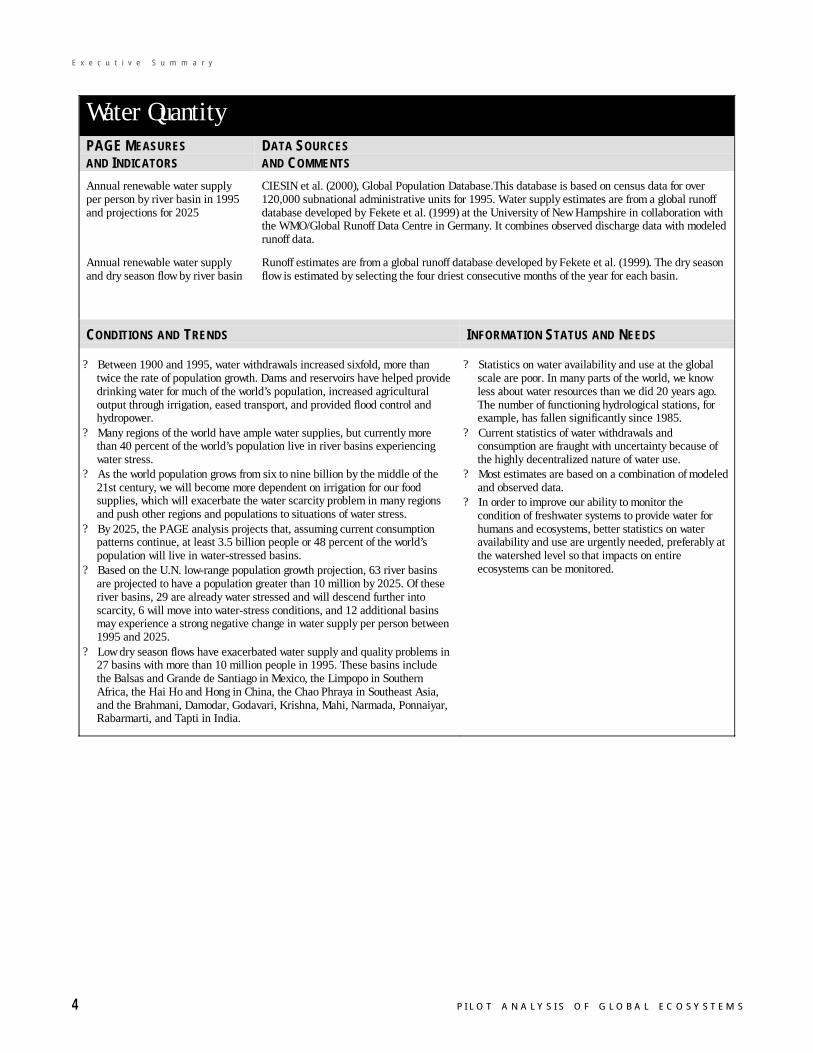
Water QuantityPAGE MEASURESAND INDICATORS
DATA SOURCESAND COMMENTS
Annual renewable water supplyper person by river basin in 1995and projections for 2025
CIESIN et al. (2000), Global Population Database.This database is based on census data for over120,000 subnational administrative units for 1995. Water supply estimates are from a global runoffdatabase developed by Fekete et al. (1999) at the University of New Hampshire in collaboration withthe WMO/Global Runoff Data Centre in Germany. It combines observed discharge data with modeledrunoff data.
Annual renewable water supplyand dry season flow by river basin
Runoff estimates are from a global runoff database developed by Fekete et al. (1999). The dry seasonflow is estimated by selecting the four driest consecutive months of the year for each basin.
CONDITIONS AND TRENDS INFORMATION STATUS AND NEEDS
? Between 1900 and 1995, water withdrawals increased sixfold, more thantwice the rate of population growth. Dams and reservoirs have helped providedrinking water for much of the world’s population, increased agriculturaloutput through irrigation, eased transport, and provided flood control andhydropower.
? Many regions of the world have ample water supplies, but currently morethan 40 percent of the world’s population live in river basins experiencingwater stress.
? As the world population grows from six to nine billion by the middle of the21st century, we will become more dependent on irrigation for our foodsupplies, which will exacerbate the water scarcity problem in many regionsand push other regions and populations to situations of water stress.
? By 2025, the PAGE analysis projects that, assuming current consumptionpatterns continue, at least 3.5 billion people or 48 percent of the world’spopulation will live in water-stressed basins.
? Based on the U.N. low-range population growth projection, 63 river basinsare projected to have a population greater than 10 million by 2025. Of theseriver basins, 29 are already water stressed and will descend further intoscarcity, 6 will move into water-stress conditions, and 12 additional basinsmay experience a strong negative change in water supply per person between1995 and 2025.
? Low dry season flows have exacerbated water supply and quality problems in27 basins with more than 10 million people in 1995. These basins includethe Balsas and Grande de Santiago in Mexico, the Limpopo in SouthernAfrica, the Hai Ho and Hong in China, the Chao Phraya in Southeast Asia,and the Brahmani, Damodar, Godavari, Krishna, Mahi, Narmada, Ponnaiyar,Rabarmarti, and Tapti in India.
? Statistics on water availability and use at the globalscale are poor. In many parts of the world, we knowless about water resources than we did 20 years ago.The number of functioning hydrological stations, forexample, has fallen significantly since 1985.
? Current statistics of water withdrawals andconsumption are fraught with uncertainty because ofthe highly decentralized nature of water use.
? Most estimates are based on a combination of modeledand observed data.
? In order to improve our ability to monitor thecondition of freshwater systems to provide water forhumans and ecosystems, better statistics on wateravailability and use are urgently needed, preferably atthe watershed level so that impacts on entireecosystems can be monitored.
F r e s h w a t e r S y s t e m s 5
E x e c u t i v e S u m m a r y
Water QualityPAGE MEASURESAND INDICATORS
DATA SOURCES ANDCOMMENTS
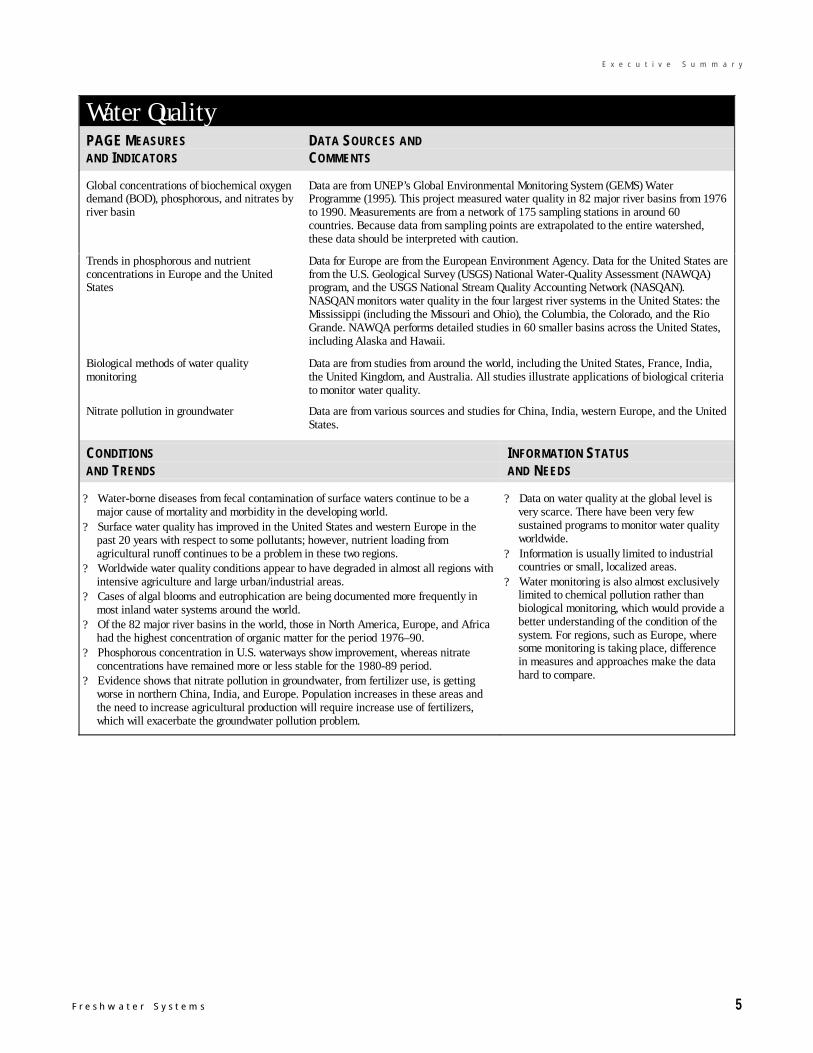
Global concentrations of biochemical oxygendemand (BOD), phosphorous, and nitrates byriver basin
Data are from UNEP’s Global Environmental Monitoring System (GEMS) WaterProgramme (1995). This project measured water quality in 82 major river basins from 1976to 1990. Measurements are from a network of 175 sampling stations in around 60countries. Because data from sampling points are extrapolated to the entire watershed,these data should be interpreted with caution.
Trends in phosphorous and nutrientconcentrations in Europe and the UnitedStates
Data for Europe are from the European Environment Agency. Data for the United States arefrom the U.S. Geological Survey (USGS) National Water-Quality Assessment (NAWQA)program, and the USGS National Stream Quality Accounting Network (NASQAN).NASQAN monitors water quality in the four largest river systems in the United States: theMississippi (including the Missouri and Ohio), the Columbia, the Colorado, and the RioGrande. NAWQA performs detailed studies in 60 smaller basins across the United States,including Alaska and Hawaii.
Biological methods of water qualitymonitoring
Data are from studies from around the world, including the United States, France, India,the United Kingdom, and Australia. All studies illustrate applications of biological criteriato monitor water quality.
Nitrate pollution in groundwater Data are from various sources and studies for China, India, western Europe, and the UnitedStates.
CONDITIONSAND TRENDS
INFORMATION STATUSAND NEEDS
? Water-borne diseases from fecal contamination of surface waters continue to be amajor cause of mortality and morbidity in the developing world.
? Surface water quality has improved in the United States and western Europe in thepast 20 years with respect to some pollutants; however, nutrient loading fromagricultural runoff continues to be a problem in these two regions.
? Worldwide water quality conditions appear to have degraded in almost all regions withintensive agriculture and large urban/industrial areas.
? Cases of algal blooms and eutrophication are being documented more frequently inmost inland water systems around the world.
? Of the 82 major river basins in the world, those in North America, Europe, and Africahad the highest concentration of organic matter for the period 1976–90.
? Phosphorous concentration in U.S. waterways show improvement, whereas nitrateconcentrations have remained more or less stable for the 1980-89 period.
? Evidence shows that nitrate pollution in groundwater, from fertilizer use, is gettingworse in northern China, India, and Europe. Population increases in these areas andthe need to increase agricultural production will require increase use of fertilizers,which will exacerbate the groundwater pollution problem.
? Data on water quality at the global level isvery scarce. There have been very fewsustained programs to monitor water qualityworldwide.
? Information is usually limited to industrialcountries or small, localized areas.
? Water monitoring is also almost exclusivelylimited to chemical pollution rather thanbiological monitoring, which would provide abetter understanding of the condition of thesystem. For regions, such as Europe, wheresome monitoring is taking place, differencein measures and approaches make the datahard to compare.
6 P I L O T A N A L Y S I S O F G L O B A L E C O S Y S T E M S
E x e c u t i v e S u m m a r y
Food Production – Inland FisheriesPAGE MEASURESAND INDICATORS
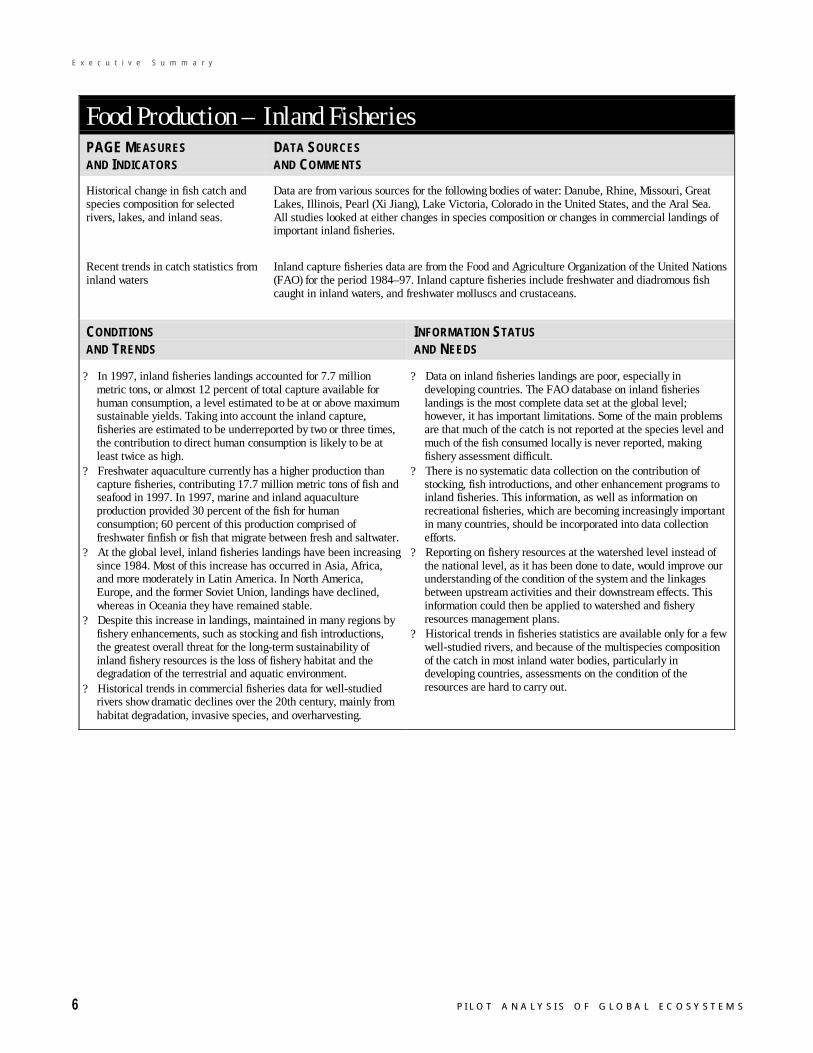
DATA SOURCESAND COMMENTS
Historical change in fish catch andspecies composition for selectedrivers, lakes, and inland seas.
Data are from various sources for the following bodies of water: Danube, Rhine, Missouri, GreatLakes, Illinois, Pearl (Xi Jiang), Lake Victoria, Colorado in the United States, and the Aral Sea.All studies looked at either changes in species composition or changes in commercial landings ofimportant inland fisheries.
Recent trends in catch statistics frominland waters
Inland capture fisheries data are from the Food and Agriculture Organization of the United Nations(FAO) for the period 1984–97. Inland capture fisheries include freshwater and diadromous fishcaught in inland waters, and freshwater molluscs and crustaceans.
CONDITIONSAND TRENDS
INFORMATION STATUSAND NEEDS
? In 1997, inland fisheries landings accounted for 7.7 millionmetric tons, or almost 12 percent of total capture available forhuman consumption, a level estimated to be at or above maximumsustainable yields. Taking into account the inland capture,fisheries are estimated to be underreported by two or three times,the contribution to direct human consumption is likely to be atleast twice as high.
? Freshwater aquaculture currently has a higher production thancapture fisheries, contributing 17.7 million metric tons of fish andseafood in 1997. In 1997, marine and inland aquacultureproduction provided 30 percent of the fish for humanconsumption; 60 percent of this production comprised offreshwater finfish or fish that migrate between fresh and saltwater.
? At the global level, inland fisheries landings have been increasingsince 1984. Most of this increase has occurred in Asia, Africa,and more moderately in Latin America. In North America,Europe, and the former Soviet Union, landings have declined,whereas in Oceania they have remained stable.
? Despite this increase in landings, maintained in many regions byfishery enhancements, such as stocking and fish introductions,the greatest overall threat for the long-term sustainability ofinland fishery resources is the loss of fishery habitat and thedegradation of the terrestrial and aquatic environment.
? Historical trends in commercial fisheries data for well-studiedrivers show dramatic declines over the 20th century, mainly fromhabitat degradation, invasive species, and overharvesting.
? Data on inland fisheries landings are poor, especially indeveloping countries. The FAO database on inland fisherieslandings is the most complete data set at the global level;however, it has important limitations. Some of the main problemsare that much of the catch is not reported at the species level andmuch of the fish consumed locally is never reported, makingfishery assessment difficult.
? There is no systematic data collection on the contribution ofstocking, fish introductions, and other enhancement programs toinland fisheries. This information, as well as information onrecreational fisheries, which are becoming increasingly importantin many countries, should be incorporated into data collectionefforts.
? Reporting on fishery resources at the watershed level instead ofthe national level, as it has been done to date, would improve ourunderstanding of the condition of the system and the linkagesbetween upstream activities and their downstream effects. Thisinformation could then be applied to watershed and fisheryresources management plans.
? Historical trends in fisheries statistics are available only for a fewwell-studied rivers, and because of the multispecies compositionof the catch in most inland water bodies, particularly indeveloping countries, assessments on the condition of theresources are hard to carry out.
F r e s h w a t e r S y s t e m s 7
E x e c u t i v e S u m m a r y
Freshwater BiodiversityPAGE MEASURESAND INDICATORS
DATA SOURCESAND COMMENTS
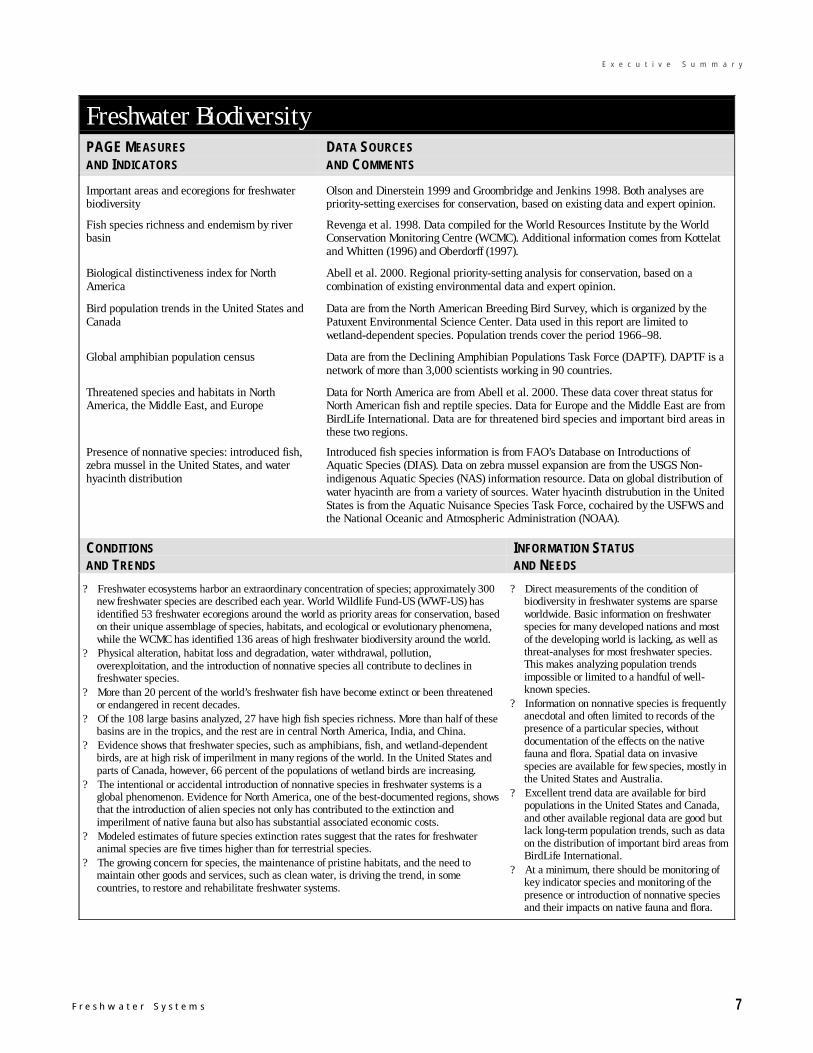
Important areas and ecoregions for freshwaterbiodiversity
Olson and Dinerstein 1999 and Groombridge and Jenkins 1998. Both analyses arepriority-setting exercises for conservation, based on existing data and expert opinion.
Fish species richness and endemism by riverbasin
Revenga et al. 1998. Data compiled for the World Resources Institute by the WorldConservation Monitoring Centre (WCMC). Additional information comes from Kottelatand Whitten (1996) and Oberdorff (1997).
Biological distinctiveness index for NorthAmerica
Abell et al. 2000. Regional priority-setting analysis for conservation, based on acombination of existing environmental data and expert opinion.
Bird population trends in the United States andCanada
Data are from the North American Breeding Bird Survey, which is organized by thePatuxent Environmental Science Center. Data used in this report are limited towetland-dependent species. Population trends cover the period 1966–98.
Global amphibian population census Data are from the Declining Amphibian Populations Task Force (DAPTF). DAPTF is anetwork of more than 3,000 scientists working in 90 countries.
Threatened species and habitats in NorthAmerica, the Middle East, and Europe
Data for North America are from Abell et al. 2000. These data cover threat status forNorth American fish and reptile species. Data for Europe and the Middle East are fromBirdLife International. Data are for threatened bird species and important bird areas inthese two regions.
Presence of nonnative species: introduced fish,zebra mussel in the United States, and waterhyacinth distribution
Introduced fish species information is from FAO’s Database on Introductions ofAquatic Species (DIAS). Data on zebra mussel expansion are from the USGS Non-indigenous Aquatic Species (NAS) information resource. Data on global distribution ofwater hyacinth are from a variety of sources. Water hyacinth distrubution in the UnitedStates is from the Aquatic Nuisance Species Task Force, cochaired by the USFWS andthe National Oceanic and Atmospheric Administration (NOAA).
CONDITIONSAND TRENDS
INFORMATION STATUSAND NEEDS
? Freshwater ecosystems harbor an extraordinary concentration of species; approximately 300new freshwater species are described each year. World Wildlife Fund-US (WWF-US) hasidentified 53 freshwater ecoregions around the world as priority areas for conservation, basedon their unique assemblage of species, habitats, and ecological or evolutionary phenomena,while the WCMC has identified 136 areas of high freshwater biodiversity around the world.
? Physical alteration, habitat loss and degradation, water withdrawal, pollution,overexploitation, and the introduction of nonnative species all contribute to declines infreshwater species.
? More than 20 percent of the world’s freshwater fish have become extinct or been threatenedor endangered in recent decades.
? Of the 108 large basins analyzed, 27 have high fish species richness. More than half of thesebasins are in the tropics, and the rest are in central North America, India, and China.
? Evidence shows that freshwater species, such as amphibians, fish, and wetland-dependentbirds, are at high risk of imperilment in many regions of the world. In the United States andparts of Canada, however, 66 percent of the populations of wetland birds are increasing.
? The intentional or accidental introduction of nonnative species in freshwater systems is aglobal phenomenon. Evidence for North America, one of the best-documented regions, showsthat the introduction of alien species not only has contributed to the extinction andimperilment of native fauna but also has substantial associated economic costs.
? Modeled estimates of future species extinction rates suggest that the rates for freshwateranimal species are five times higher than for terrestrial species.
? The growing concern for species, the maintenance of pristine habitats, and the need tomaintain other goods and services, such as clean water, is driving the trend, in somecountries, to restore and rehabilitate freshwater systems.
? Direct measurements of the condition ofbiodiversity in freshwater systems are sparseworldwide. Basic information on freshwaterspecies for many developed nations and mostof the developing world is lacking, as well asthreat-analyses for most freshwater species.This makes analyzing population trendsimpossible or limited to a handful of well-known species.
? Information on nonnative species is frequentlyanecdotal and often limited to records of thepresence of a particular species, withoutdocumentation of the effects on the nativefauna and flora. Spatial data on invasivespecies are available for few species, mostly inthe United States and Australia.
? Excellent trend data are available for birdpopulations in the United States and Canada,and other available regional data are good butlack long-term population trends, such as dataon the distribution of important bird areas fromBirdLife International.
? At a minimum, there should be monitoring ofkey indicator species and monitoring of thepresence or introduction of nonnative speciesand their impacts on native fauna and flora.
8 P I L O T A N A L Y S I S O F G L O B A L E C O S Y S T E M S
E x e c u t i v e S u m m a r y
Conclusions
Human activities have severely affected the condition of fresh-water systems worldwide. Even though humans have increasedthe amount of water available for use with dams and reser-voirs, more than 40 percent of the world’s population lives inconditions of water stress. This percentage is estimated togrow to almost 50 percent by 2025. Surface and groundwateris being degraded in almost all regions of the world by inten-sive agriculture and rapid urbanization, aggravating the wa-ter scarcity problem. In addition, lack of access to clean wa-ter continues to be a leading cause of illness and death inmuch of the developing world. Food production from wildfisheries has been affected by habitat degradation,overexploitation, and pollution to a point where most of theseresources are not sustainable without fishery enhancements.Finally, the capacity of freshwater ecosystems to supportbiodiversity is highly degraded at a global level, with manyfreshwater species facing rapid population declines or ex-tinction.
The PAGE study relied on existing global and regionaldata collected by organizations and scientists around theworld. Without their efforts and their willingness to share thedata, this study would not have been possible. We found manydetailed data sets at the national level, particularly for theUnited States. However, at the global level, data on freshwa-ter resources are scarce. Basic statistics on water availabilityand use, for example, are not readily available or are avail-able only at the national level. This makes an assessment offreshwater systems difficult because the ideal biophysical unitof analysis is the watershed—which often crosses nationalboundaries.
Improved national and global data on ecosystem land usecharacteristics, basic hydrological information, fisheries pro-duction, and freshwater species could lead to significantlymore knowledge about the condition of freshwater systems.Better information on actual stream and river discharge, andthe amount of water withdrawn and consumed, would increaseour ability to manage freshwater systems more efficiently andevaluate trade-offs. But much effort and financial commit-ment would have to be made to restore many of the hydrologi-cal stations around the world, which have been declining sincethe mid-1980s and, in some cases, are no longer functioning.
Remotely sensed data from new satellites with higher qual-ity sensors and much larger onboard storage capacity willallow better analysis of the changes in land-use patterns, andmay allow for a complete and accurate mapping of the extentof both seasonal and permanent wetlands. With this informa-tion, resource managers would be able to use existing models
to better understand how watershed changes are likely to af-fect the water quantity, and quality, of rivers and lakes.
In terms of food production from inland waters, there is anurgent need to improve the quality of the data on inland cap-ture fisheries and those environmental and socioeconomicfactors that affect their sustainability. Improved inland fish-ery data are likely to require improved or new monitoringnetworks, which means a financial commitment to strengthenboth national fisheries departments and collaborating orga-nizations, such as the Food and Agriculture Organization ofthe United Nations.
Better information on water quality can provide nationswith immediate benefits because of the direct connectionbetween water quality and human health. But gathering suchinformation generally requires expensive monitoring networksthat are beyond the reach of many developing countries. Eventhough surface water monitoring programs are well developedin most Organization for Economic Cooperation and Devel-opment (OECD) countries, water quality monitoring in mostparts of the world is rudimentary or nonexistent. Even thosedeveloped countries that have water quality monitoring pro-grams in place focus on chemical parameters that leave outimportant biological information. One of the biggest challengesin future water monitoring programs is the integration ofchemical and biological measures of water quality.
If surface water monitoring is still deficient in many coun-tries, the situation for groundwater is worse. Many nationslack proper monitoring of groundwater recharge quality.Information on groundwater quality, as well as on aquifer stor-age capacity and exploitation, is urgently needed. Currentlythere are two proposed initiatives that could help fill in theinformation gap on groundwater resources as well as promotetheir sound management. The first is a high-level Ground-water Management Advisory Team, coordinated by the WorldBank and the Global Water Partnership. The aim of this teamis to promote more effective management of groundwater re-sources around the world, through improved understandingof the hydrogeological constraints and strengthening of theinstitutional framework. The second is an InternationalGroundwater Resources Assessment Center, that will collectdata on and monitor groundwater worldwide. This initiativeis being coordinated by UNESCO and the World Meteoro-logical Organization.
Finally, as this study will stress, information on freshwa-ter biodiversity is poor even in those developed nations thathave considerable financial and technical resources. Thereare several new international initiatives, including the OECD’sGlobal Biodiversity Information Facility (GBIF) and the Glo-bal Taxonomy Initiative of the Convention on Biological Di-
F r e s h w a t e r S y s t e m s 9
E x e c u t i v e S u m m a r y
versity that will help identify and catalogue species aroundthe world. This knowledge and monitoring would allow for amore complete assessment of the condition of freshwater sys-tems.Recommendations for the Millennium Ecosystem Assessmentinclude the following:
? Compiling more complete information on the preciselocation of the world’s dams, including the thousands ofdams less than 15 meters in height that are not currentlylisted in international databanks.? Developing a complete global spatial data set on
wetlands distribution. Information on the location andsize of wetlands is especially needed for Asia, Africa,South America, and Oceania.? Promoting the restoration of the hydrological monitoring
stations and improving the water supply and usestatistics at the watershed level.
? Compiling a global data set on groundwater resources,including their distribution, capacity, and use.? Encouraging national governments to establish water
quality monitoring programs that combine chemical andbiological measures for both surface and groundwater.? Strengthening the role of national fisheries departments
in data collection for inland fisheries resources.? Establishing a systematic data collection effort on the
contributions of fish stocking, introduction, and otherenhancement programs to inland fisheries.? Monitoring key indicator species for freshwater systems,
as well as monitoring the presence or introduction ofnonnative species and their impacts on native fauna andflora.
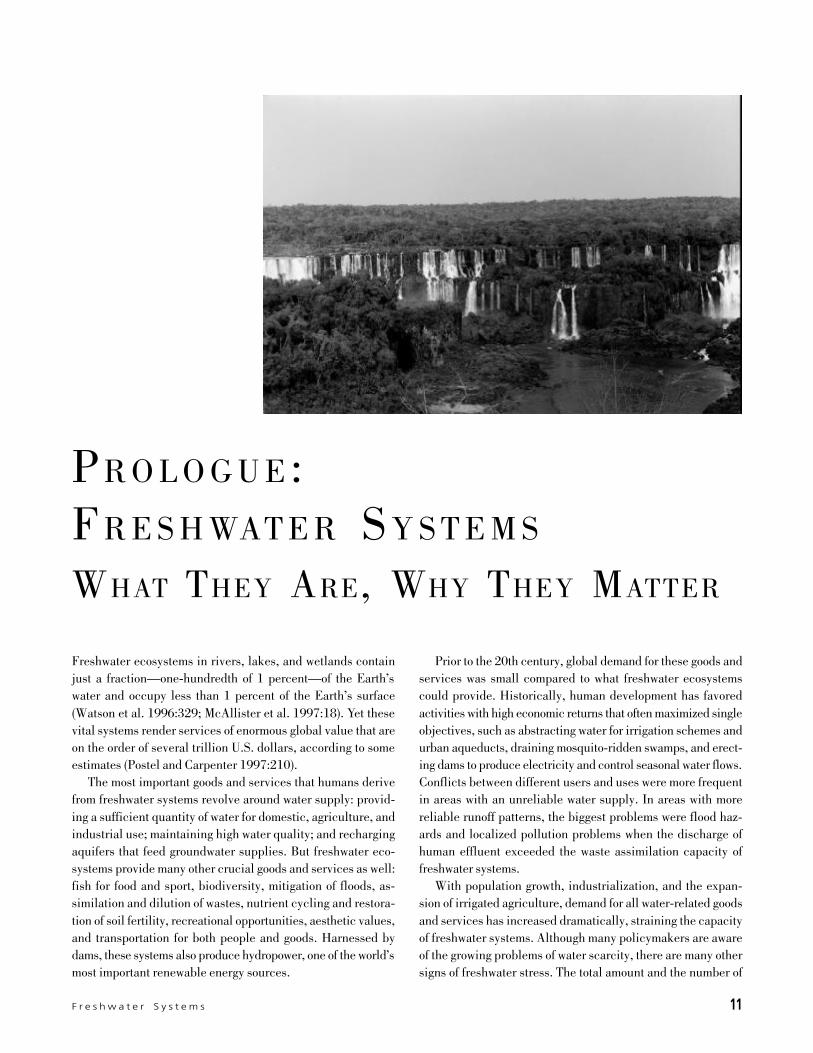
F r e s h w a t e r S y s t e m s 11
P r o l o g u e
Prior to the 20th century, global demand for these goods andservices was small compared to what freshwater ecosystemscould provide. Historically, human development has favoredactivities with high economic returns that often maximized singleobjectives, such as abstracting water for irrigation schemes andurban aqueducts, draining mosquito-ridden swamps, and erect-ing dams to produce electricity and control seasonal water flows.Conflicts between different users and uses were more frequentin areas with an unreliable water supply. In areas with morereliable runoff patterns, the biggest problems were flood haz-ards and localized pollution problems when the discharge ofhuman effluent exceeded the waste assimilation capacity offreshwater systems.
With population growth, industrialization, and the expan-sion of irrigated agriculture, demand for all water-related goodsand services has increased dramatically, straining the capacityof freshwater systems. Although many policymakers are awareof the growing problems of water scarcity, there are many othersigns of freshwater stress. The total amount and the number of
Freshwater ecosystems in rivers, lakes, and wetlands containjust a fraction—one-hundredth of 1 percent—of the Earth’swater and occupy less than 1 percent of the Earth’s surface(Watson et al. 1996:329; McAllister et al. 1997:18). Yet thesevital systems render services of enormous global value that areon the order of several trillion U.S. dollars, according to someestimates (Postel and Carpenter 1997:210).
The most important goods and services that humans derivefrom freshwater systems revolve around water supply: provid-ing a sufficient quantity of water for domestic, agriculture, andindustrial use; maintaining high water quality; and rechargingaquifers that feed groundwater supplies. But freshwater eco-systems provide many other crucial goods and services as well:fish for food and sport, biodiversity, mitigation of floods, as-similation and dilution of wastes, nutrient cycling and restora-tion of soil fertility, recreational opportunities, aesthetic values,and transportation for both people and goods. Harnessed bydams, these systems also produce hydropower, one of the world’smost important renewable energy sources.
P R O L O G U E :F R E S H WAT E R S Y S T E M S
WHAT THEY ARE, WHY THEY MATTER
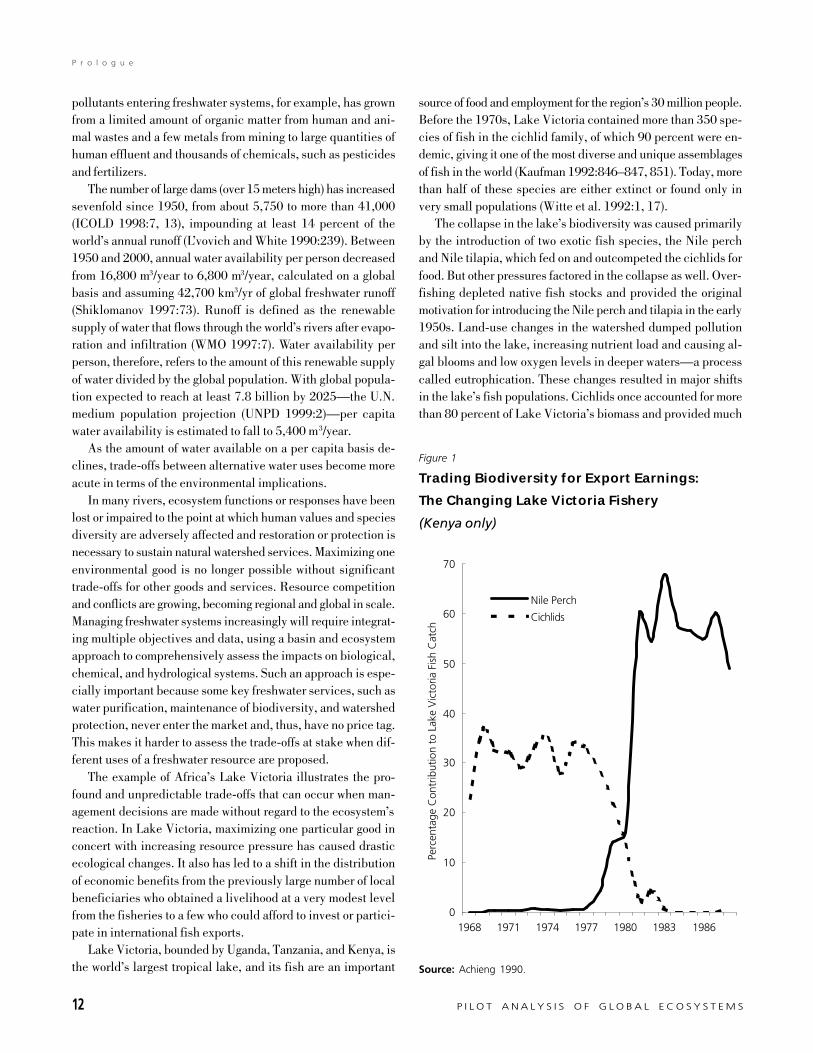
12 P I L O T A N A L Y S I S O F G L O B A L E C O S Y S T E M S
P r o l o g u e
pollutants entering freshwater systems, for example, has grownfrom a limited amount of organic matter from human and ani-mal wastes and a few metals from mining to large quantities ofhuman effluent and thousands of chemicals, such as pesticidesand fertilizers.
The number of large dams (over 15 meters high) has increasedsevenfold since 1950, from about 5,750 to more than 41,000(ICOLD 1998:7, 13), impounding at least 14 percent of theworld’s annual runoff (L’vovich and White 1990:239). Between1950 and 2000, annual water availability per person decreasedfrom 16,800 m3/year to 6,800 m3/year, calculated on a globalbasis and assuming 42,700 km3/yr of global freshwater runoff(Shiklomanov 1997:73). Runoff is defined as the renewablesupply of water that flows through the world’s rivers after evapo-ration and infiltration (WMO 1997:7). Water availability perperson, therefore, refers to the amount of this renewable supplyof water divided by the global population. With global popula-tion expected to reach at least 7.8 billion by 2025—the U.N.medium population projection (UNPD 1999:2)—per capitawater availability is estimated to fall to 5,400 m3/year.
As the amount of water available on a per capita basis de-clines, trade-offs between alternative water uses become moreacute in terms of the environmental implications.
In many rivers, ecosystem functions or responses have beenlost or impaired to the point at which human values and speciesdiversity are adversely affected and restoration or protection isnecessary to sustain natural watershed services. Maximizing oneenvironmental good is no longer possible without significanttrade-offs for other goods and services. Resource competitionand conflicts are growing, becoming regional and global in scale.Managing freshwater systems increasingly will require integrat-ing multiple objectives and data, using a basin and ecosystemapproach to comprehensively assess the impacts on biological,chemical, and hydrological systems. Such an approach is espe-cially important because some key freshwater services, such aswater purification, maintenance of biodiversity, and watershedprotection, never enter the market and, thus, have no price tag.This makes it harder to assess the trade-offs at stake when dif-ferent uses of a freshwater resource are proposed.
The example of Africa’s Lake Victoria illustrates the pro-found and unpredictable trade-offs that can occur when man-agement decisions are made without regard to the ecosystem’sreaction. In Lake Victoria, maximizing one particular good inconcert with increasing resource pressure has caused drasticecological changes. It also has led to a shift in the distributionof economic benefits from the previously large number of localbeneficiaries who obtained a livelihood at a very modest levelfrom the fisheries to a few who could afford to invest or partici-pate in international fish exports.
Lake Victoria, bounded by Uganda, Tanzania, and Kenya, isthe world’s largest tropical lake, and its fish are an important
source of food and employment for the region’s 30 million people.Before the 1970s, Lake Victoria contained more than 350 spe-cies of fish in the cichlid family, of which 90 percent were en-demic, giving it one of the most diverse and unique assemblagesof fish in the world (Kaufman 1992:846–847, 851). Today, morethan half of these species are either extinct or found only invery small populations (Witte et al. 1992:1, 17).
The collapse in the lake’s biodiversity was caused primarilyby the introduction of two exotic fish species, the Nile perchand Nile tilapia, which fed on and outcompeted the cichlids forfood. But other pressures factored in the collapse as well. Over-fishing depleted native fish stocks and provided the originalmotivation for introducing the Nile perch and tilapia in the early1950s. Land-use changes in the watershed dumped pollutionand silt into the lake, increasing nutrient load and causing al-gal blooms and low oxygen levels in deeper waters—a processcalled eutrophication. These changes resulted in major shiftsin the lake’s fish populations. Cichlids once accounted for morethan 80 percent of Lake Victoria’s biomass and provided much
Figure 1
Trading Biodiversity for Export Earnings:
The Changing Lake Victoria Fishery
(Kenya only)
Source: Achieng 1990.
0
10
20
30
40
50
60
70
1968 1971 1974 1977 1980 1983 1986
Perc
enta
ge C
ontr
ibut
ion
to L
ake
Vic
toria
Fis
h C
atch
Nile Perch
Cichlids
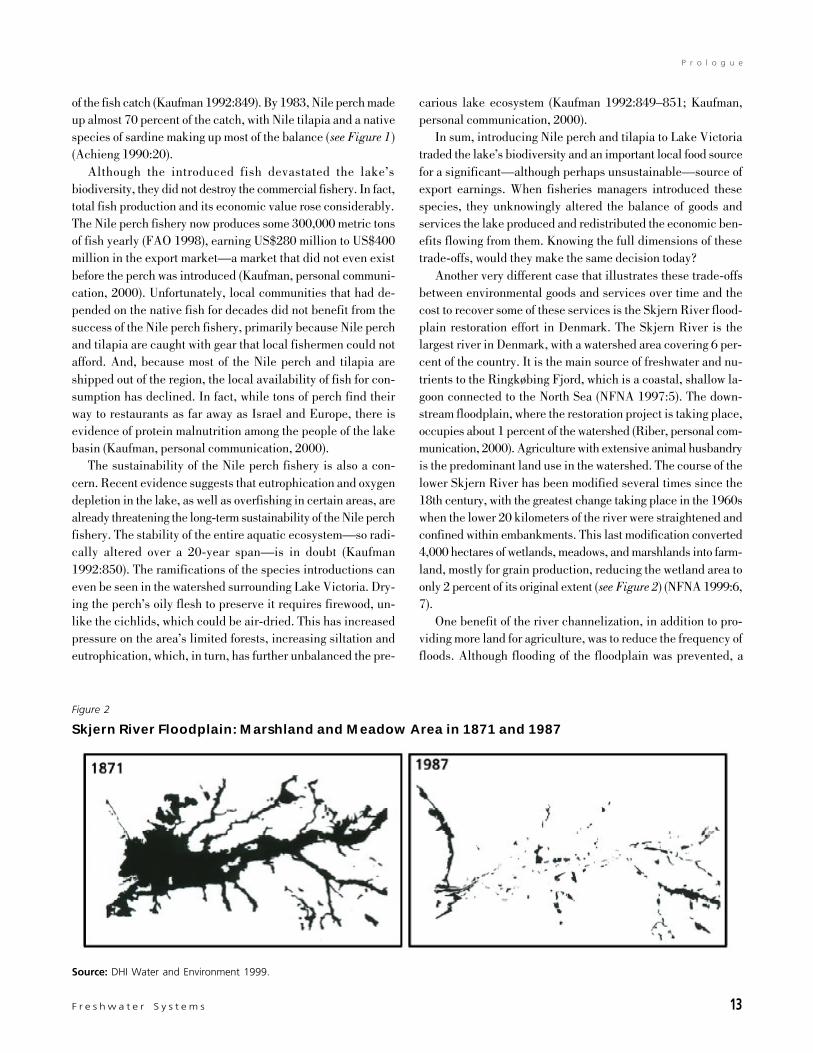
F r e s h w a t e r S y s t e m s 13
P r o l o g u e
of the fish catch (Kaufman 1992:849). By 1983, Nile perch madeup almost 70 percent of the catch, with Nile tilapia and a nativespecies of sardine making up most of the balance (see Figure 1)(Achieng 1990:20).
Although the introduced fish devastated the lake’sbiodiversity, they did not destroy the commercial fishery. In fact,total fish production and its economic value rose considerably.The Nile perch fishery now produces some 300,000 metric tonsof fish yearly (FAO 1998), earning US$280 million to US$400million in the export market—a market that did not even existbefore the perch was introduced (Kaufman, personal communi-cation, 2000). Unfortunately, local communities that had de-pended on the native fish for decades did not benefit from thesuccess of the Nile perch fishery, primarily because Nile perchand tilapia are caught with gear that local fishermen could notafford. And, because most of the Nile perch and tilapia areshipped out of the region, the local availability of fish for con-sumption has declined. In fact, while tons of perch find theirway to restaurants as far away as Israel and Europe, there isevidence of protein malnutrition among the people of the lakebasin (Kaufman, personal communication, 2000).
The sustainability of the Nile perch fishery is also a con-cern. Recent evidence suggests that eutrophication and oxygendepletion in the lake, as well as overfishing in certain areas, arealready threatening the long-term sustainability of the Nile perchfishery. The stability of the entire aquatic ecosystem—so radi-cally altered over a 20-year span—is in doubt (Kaufman1992:850). The ramifications of the species introductions caneven be seen in the watershed surrounding Lake Victoria. Dry-ing the perch’s oily flesh to preserve it requires firewood, un-like the cichlids, which could be air-dried. This has increasedpressure on the area’s limited forests, increasing siltation andeutrophication, which, in turn, has further unbalanced the pre-
carious lake ecosystem (Kaufman 1992:849–851; Kaufman,personal communication, 2000).
In sum, introducing Nile perch and tilapia to Lake Victoriatraded the lake’s biodiversity and an important local food sourcefor a significant—although perhaps unsustainable—source ofexport earnings. When fisheries managers introduced thesespecies, they unknowingly altered the balance of goods andservices the lake produced and redistributed the economic ben-efits flowing from them. Knowing the full dimensions of thesetrade-offs, would they make the same decision today?
Another very different case that illustrates these trade-offsbetween environmental goods and services over time and thecost to recover some of these services is the Skjern River flood-plain restoration effort in Denmark. The Skjern River is thelargest river in Denmark, with a watershed area covering 6 per-cent of the country. It is the main source of freshwater and nu-trients to the Ringkøbing Fjord, which is a coastal, shallow la-goon connected to the North Sea (NFNA 1997:5). The down-stream floodplain, where the restoration project is taking place,occupies about 1 percent of the watershed (Riber, personal com-munication, 2000). Agriculture with extensive animal husbandryis the predominant land use in the watershed. The course of thelower Skjern River has been modified several times since the18th century, with the greatest change taking place in the 1960swhen the lower 20 kilometers of the river were straightened andconfined within embankments. This last modification converted4,000 hectares of wetlands, meadows, and marshlands into farm-land, mostly for grain production, reducing the wetland area toonly 2 percent of its original extent (see Figure 2) (NFNA 1999:6,7).
One benefit of the river channelization, in addition to pro-viding more land for agriculture, was to reduce the frequency offloods. Although flooding of the floodplain was prevented, a
Figure 2
Skjern River Floodplain: Marshland and Meadow Area in 1871 and 1987
Source: DHI Water and Environment 1999.
14 P I L O T A N A L Y S I S O F G L O B A L E C O S Y S T E M S
P r o l o g u e
new flooding risk in the neighboring towns emerged, but theseflooding events were marginal (Riber, personal communication,2000). Also on the negative side of the ledger, channel modifi-cation reduced biodiversity in the watershed. For example, ot-ters disappeared, nesting waterfowl declined, and the salmonpopulation—the last wild salmon population in Denmark—wasreduced to a small fraction of its peak (NFNA 1999:4, 24, 25).Draining wetlands caused other environmental changes, includ-ing ground subsidence of up to one meter in certain areas, ochreleaching, and waterlogging that reduced the productivity of thereclaimed agricultural land. In addition, the intensive agricul-tural use brought higher nutrient loadings to the fjord, contrib-uting to its eutrophication (Olesen and Havnø 1998:3; NFNA1999:12, 13).
The Skjern River floodplain restoration project was moti-vated by changes in societal values and priorities, notably thedecreased economic importance of agriculture in the country,an increased appreciation of nature for recreation and tourism,and the desire to rectify past environmental damage. Work be-gan in 1999 with the aim of restoring the Skjern River to a“natural” river by eliminating embankments, returning the riverto its original meandering course, and recreating wetlands. The
goal is to bring back salmon, bird, and plant populations. Fur-thermore, the new wetlands will act as filters, decreasingeutrophication in the fjord and helping to restore its biodiversity.The cost of the restoration project is estimated at US$35 mil-lion. It will take 3 years to restore the planned 2,200 hectaresof wetlands. The area will be operated as a natural park by theNational Forest and Nature Agency, which is also responsiblefor implementing the project (NFNA 1999).
Restoration projects like the Skjern River floodplain incor-porate, albeit retroactively, all the elements that are importantfor the management of freshwater systems. They rely on scien-tific data and modeling, integrate multiple objectives, use a basinand ecosystem approach, and look at trade-offs between differ-ent goods and services. To avoid costly restoration projects, fu-ture assessments of freshwater systems need to include as manyof these elements as possible. The level of detail and compre-hensiveness will vary with the scale and purpose of the assess-ment. Assessments at a global level that are used to set priori-ties and identify key trends will require less detail, but theywill ultimately constitute a much needed worldwide integrationof more apparent regional patterns.
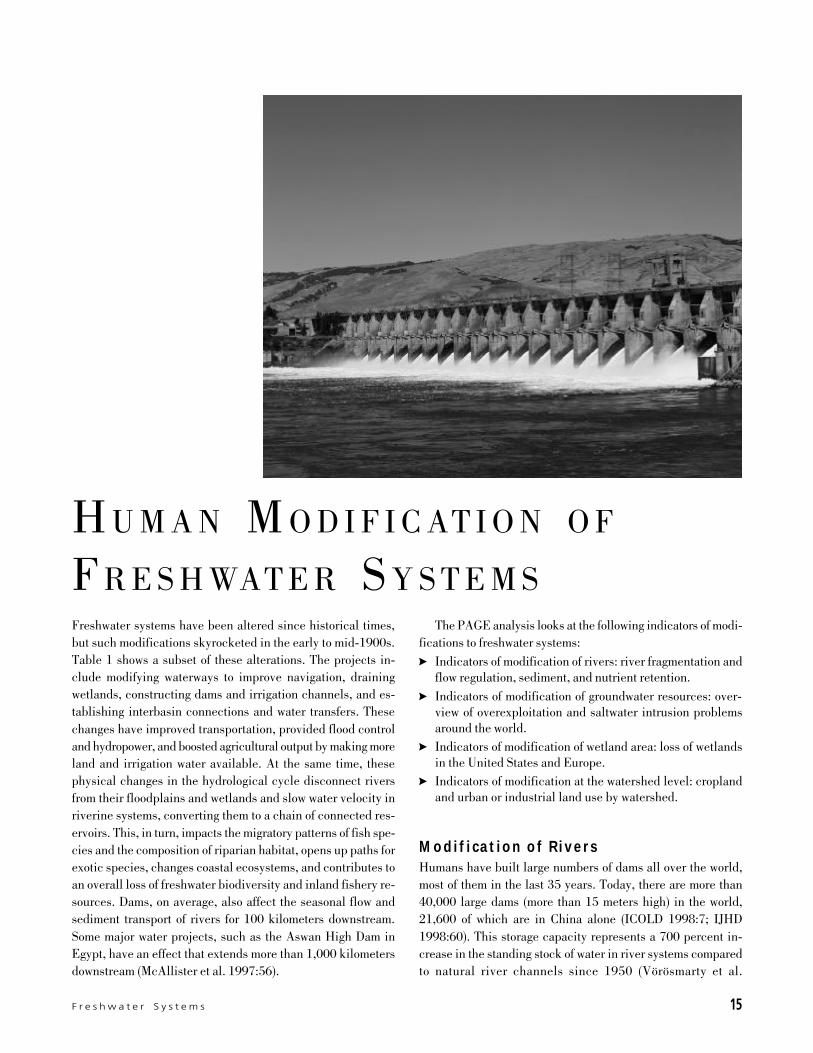
F r e s h w a t e r S y s t e m s 15
P r o l o g u e
H U M A N M O D I F I C AT I O N O F
F R E S H WAT E R S Y S T E M SThe PAGE analysis looks at the following indicators of modi-
fications to freshwater systems:
? Indicators of modification of rivers: river fragmentation andflow regulation, sediment, and nutrient retention.
? Indicators of modification of groundwater resources: over-view of overexploitation and saltwater intrusion problemsaround the world.? Indicators of modification of wetland area: loss of wetlands
in the United States and Europe.? Indicators of modification at the watershed level: cropland
and urban or industrial land use by watershed.
Modification of RiversHumans have built large numbers of dams all over the world,most of them in the last 35 years. Today, there are more than40,000 large dams (more than 15 meters high) in the world,21,600 of which are in China alone (ICOLD 1998:7; IJHD1998:60). This storage capacity represents a 700 percent in-crease in the standing stock of water in river systems comparedto natural river channels since 1950 (Vörösmarty et al.
Freshwater systems have been altered since historical times,but such modifications skyrocketed in the early to mid-1900s.Table 1 shows a subset of these alterations. The projects in-clude modifying waterways to improve navigation, drainingwetlands, constructing dams and irrigation channels, and es-tablishing interbasin connections and water transfers. Thesechanges have improved transportation, provided flood controland hydropower, and boosted agricultural output by making moreland and irrigation water available. At the same time, thesephysical changes in the hydrological cycle disconnect riversfrom their floodplains and wetlands and slow water velocity inriverine systems, converting them to a chain of connected res-ervoirs. This, in turn, impacts the migratory patterns of fish spe-cies and the composition of riparian habitat, opens up paths forexotic species, changes coastal ecosystems, and contributes toan overall loss of freshwater biodiversity and inland fishery re-sources. Dams, on average, also affect the seasonal flow andsediment transport of rivers for 100 kilometers downstream.Some major water projects, such as the Aswan High Dam inEgypt, have an effect that extends more than 1,000 kilometersdownstream (McAllister et al. 1997:56).
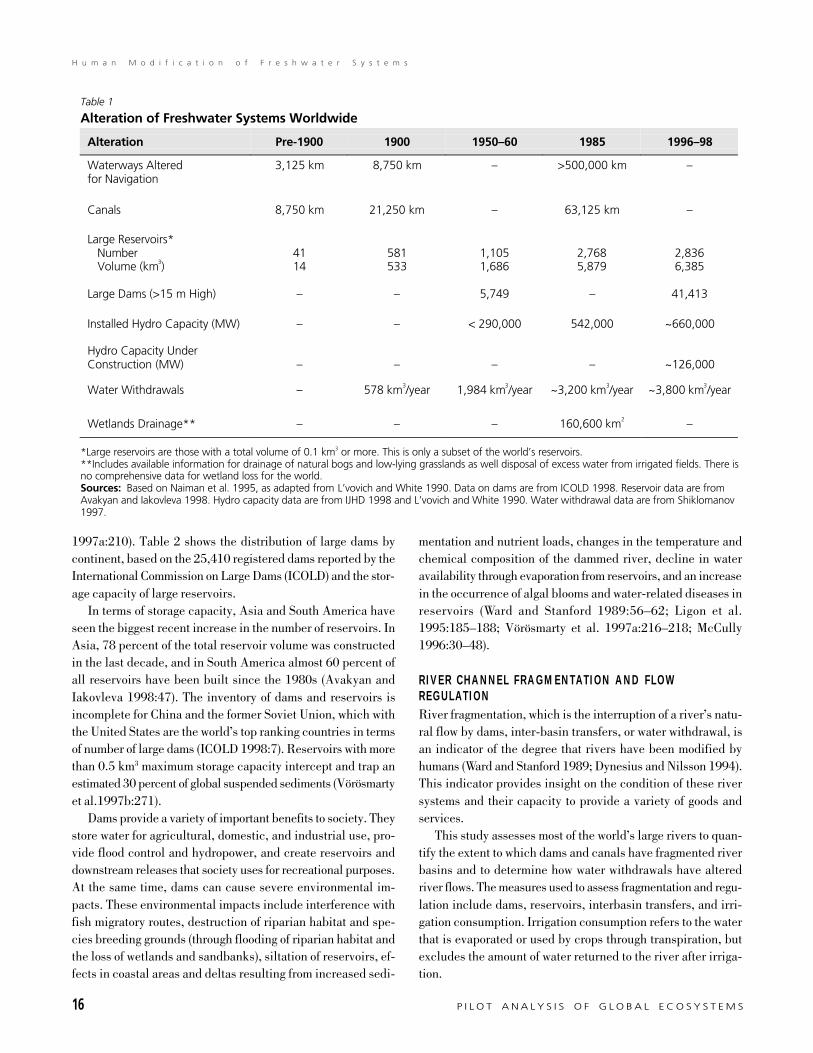
16 P I L O T A N A L Y S I S O F G L O B A L E C O S Y S T E M S
H u m a n M o d i f i c a t i o n o f F r e s h w a t e r S y s t e m s
1997a:210). Table 2 shows the distribution of large dams bycontinent, based on the 25,410 registered dams reported by theInternational Commission on Large Dams (ICOLD) and the stor-age capacity of large reservoirs.
In terms of storage capacity, Asia and South America haveseen the biggest recent increase in the number of reservoirs. InAsia, 78 percent of the total reservoir volume was constructedin the last decade, and in South America almost 60 percent ofall reservoirs have been built since the 1980s (Avakyan andIakovleva 1998:47). The inventory of dams and reservoirs isincomplete for China and the former Soviet Union, which withthe United States are the world’s top ranking countries in termsof number of large dams (ICOLD 1998:7). Reservoirs with morethan 0.5 km3 maximum storage capacity intercept and trap anestimated 30 percent of global suspended sediments (Vörösmartyet al.1997b:271).
Dams provide a variety of important benefits to society. Theystore water for agricultural, domestic, and industrial use, pro-vide flood control and hydropower, and create reservoirs anddownstream releases that society uses for recreational purposes.At the same time, dams can cause severe environmental im-pacts. These environmental impacts include interference withfish migratory routes, destruction of riparian habitat and spe-cies breeding grounds (through flooding of riparian habitat andthe loss of wetlands and sandbanks), siltation of reservoirs, ef-fects in coastal areas and deltas resulting from increased sedi-
mentation and nutrient loads, changes in the temperature andchemical composition of the dammed river, decline in wateravailability through evaporation from reservoirs, and an increasein the occurrence of algal blooms and water-related diseases inreservoirs (Ward and Stanford 1989:56–62; Ligon et al.1995:185–188; Vörösmarty et al. 1997a:216–218; McCully1996:30–48).
RIVER CHANNEL FRAGMENTATION AND FLOWREGULATIONRiver fragmentation, which is the interruption of a river’s natu-ral flow by dams, inter-basin transfers, or water withdrawal, isan indicator of the degree that rivers have been modified byhumans (Ward and Stanford 1989; Dynesius and Nilsson 1994).This indicator provides insight on the condition of these riversystems and their capacity to provide a variety of goods andservices.
This study assesses most of the world’s large rivers to quan-tify the extent to which dams and canals have fragmented riverbasins and to determine how water withdrawals have alteredriver flows. The measures used to assess fragmentation and regu-lation include dams, reservoirs, interbasin transfers, and irri-gation consumption. Irrigation consumption refers to the waterthat is evaporated or used by crops through transpiration, butexcludes the amount of water returned to the river after irriga-tion.
Table 1
Alteration of Freshwater Systems Worldwide
Alteration Pre-1900 1900 1950–60 1985 1996–98
Waterways Alteredfor Navigation
3,125 km 8,750 km – >500,000 km –
Canals 8,750 km 21,250 km – 63,125 km –
Large Reservoirs* Number Volume (km3)
4114
581533
1,1051,686
2,7685,879
2,8366,385
Large Dams (>15 m High) – – 5,749 – 41,413
Installed Hydro Capacity (MW)
Hydro Capacity UnderConstruction (MW)
–
–
–
–
< 290,000
–
542,000
–
~660,000
~126,000
Water Withdrawals – 578 km3/year 1,984 km3/year ~3,200 km3/year ~3,800 km3/year
Wetlands Drainage** – – – 160,600 km2 –
*Large reservoirs are those with a total volume of 0.1 km3 or more. This is only a subset of the world’s reservoirs.**Includes available information for drainage of natural bogs and low-lying grasslands as well disposal of excess water from irrigated fields. There isno comprehensive data for wetland loss for the world.Sources: Based on Naiman et al. 1995, as adapted from L’vovich and White 1990. Data on dams are from ICOLD 1998. Reservoir data are fromAvakyan and Iakovleva 1998. Hydro capacity data are from IJHD 1998 and L’vovich and White 1990. Water withdrawal data are from Shiklomanov1997.
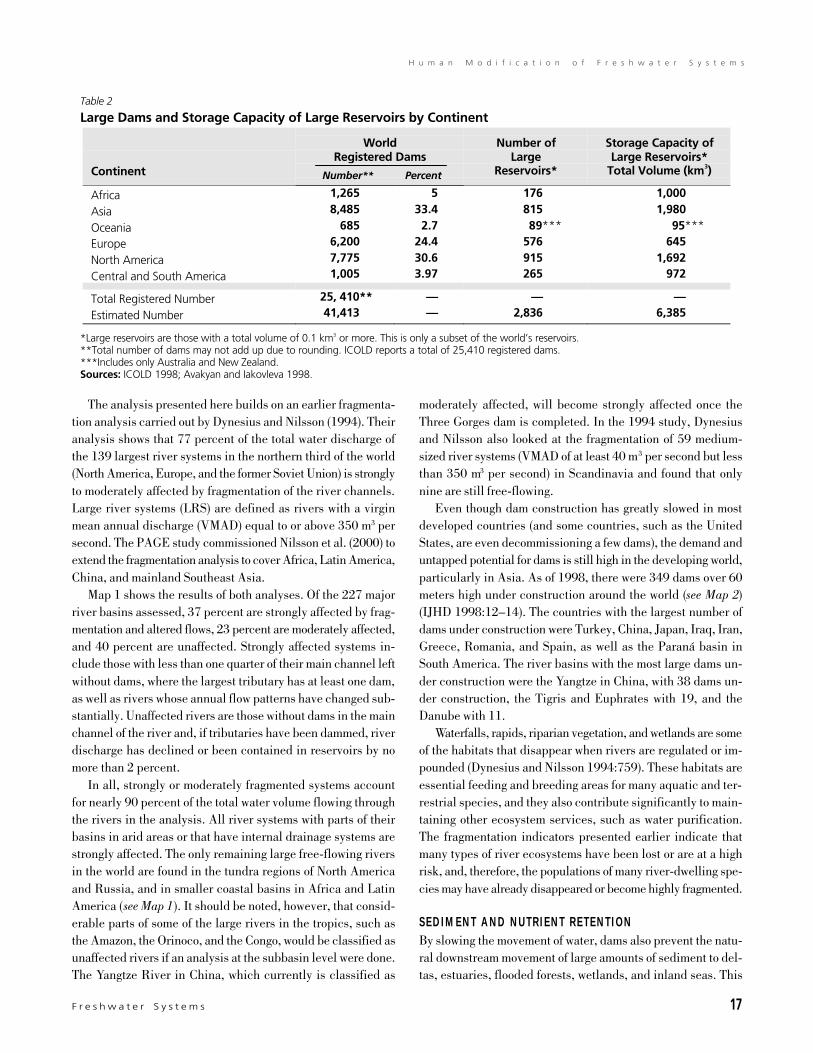
F r e s h w a t e r S y s t e m s 17
H u m a n M o d i f i c a t i o n o f F r e s h w a t e r S y s t e m s
The analysis presented here builds on an earlier fragmenta-tion analysis carried out by Dynesius and Nilsson (1994). Theiranalysis shows that 77 percent of the total water discharge ofthe 139 largest river systems in the northern third of the world(North America, Europe, and the former Soviet Union) is stronglyto moderately affected by fragmentation of the river channels.Large river systems (LRS) are defined as rivers with a virginmean annual discharge (VMAD) equal to or above 350 m3 persecond. The PAGE study commissioned Nilsson et al. (2000) toextend the fragmentation analysis to cover Africa, Latin America,China, and mainland Southeast Asia.
Map 1 shows the results of both analyses. Of the 227 majorriver basins assessed, 37 percent are strongly affected by frag-mentation and altered flows, 23 percent are moderately affected,and 40 percent are unaffected. Strongly affected systems in-clude those with less than one quarter of their main channel leftwithout dams, where the largest tributary has at least one dam,as well as rivers whose annual flow patterns have changed sub-stantially. Unaffected rivers are those without dams in the mainchannel of the river and, if tributaries have been dammed, riverdischarge has declined or been contained in reservoirs by nomore than 2 percent.
In all, strongly or moderately fragmented systems accountfor nearly 90 percent of the total water volume flowing throughthe rivers in the analysis. All river systems with parts of theirbasins in arid areas or that have internal drainage systems arestrongly affected. The only remaining large free-flowing riversin the world are found in the tundra regions of North Americaand Russia, and in smaller coastal basins in Africa and LatinAmerica (see Map 1). It should be noted, however, that consid-erable parts of some of the large rivers in the tropics, such asthe Amazon, the Orinoco, and the Congo, would be classified asunaffected rivers if an analysis at the subbasin level were done.The Yangtze River in China, which currently is classified as
moderately affected, will become strongly affected once theThree Gorges dam is completed. In the 1994 study, Dynesiusand Nilsson also looked at the fragmentation of 59 medium-sized river systems (VMAD of at least 40 m3 per second but lessthan 350 m3 per second) in Scandinavia and found that onlynine are still free-flowing.
Even though dam construction has greatly slowed in mostdeveloped countries (and some countries, such as the UnitedStates, are even decommissioning a few dams), the demand anduntapped potential for dams is still high in the developing world,particularly in Asia. As of 1998, there were 349 dams over 60meters high under construction around the world (see Map 2)(IJHD 1998:12–14). The countries with the largest number ofdams under construction were Turkey, China, Japan, Iraq, Iran,Greece, Romania, and Spain, as well as the Paraná basin inSouth America. The river basins with the most large dams un-der construction were the Yangtze in China, with 38 dams un-der construction, the Tigris and Euphrates with 19, and theDanube with 11.
Waterfalls, rapids, riparian vegetation, and wetlands are someof the habitats that disappear when rivers are regulated or im-pounded (Dynesius and Nilsson 1994:759). These habitats areessential feeding and breeding areas for many aquatic and ter-restrial species, and they also contribute significantly to main-taining other ecosystem services, such as water purification.The fragmentation indicators presented earlier indicate thatmany types of river ecosystems have been lost or are at a highrisk, and, therefore, the populations of many river-dwelling spe-cies may have already disappeared or become highly fragmented.
SEDIMENT AND NUTRIENT RETENTIONBy slowing the movement of water, dams also prevent the natu-ral downstream movement of large amounts of sediment to del-tas, estuaries, flooded forests, wetlands, and inland seas. This
Table 2
Large Dams and Storage Capacity of Large Reservoirs by Continent
Continent
WorldRegistered Dams
Number ofLarge
Reservoirs*
Storage Capacity ofLarge Reservoirs*
Total Volume (km3)
Africa 1,265 5 176 1,000
Asia 8,485 33.4 815 1,980
Oceania 685 2.7 89*** 95***
Europe 6,200 24.4 576 645
North America 7,775 30.6 915 1,692
Central and South America 1,005 3.97 265 972
Total Registered Number 25, 410** — — —
Estimated Number 41,413 — 2,836 6,385
*Large reservoirs are those with a total volume of 0.1 km3 or more. This is only a subset of the world’s reservoirs.**Total number of dams may not add up due to rounding. ICOLD reports a total of 25,410 registered dams.***Includes only Australia and New Zealand.Sources: ICOLD 1998; Avakyan and Iakovleva 1998.
Number** Percent
18 P I L O T A N A L Y S I S O F G L O B A L E C O S Y S T E M S
H u m a n M o d i f i c a t i o n o f F r e s h w a t e r S y s t e m s
retention can rob the downstream areas of the sediments andnutrients that they depend on, affecting species compositionand productivity. Coastal fisheries, for example, depend on up-stream inputs to replenish nutrients. After the Aswan High Damwas built on the Nile River, the supply of phosphate and sili-cate to the coastal area was reduced to 4 and 18 percent, re-spectively, of pre-dam conditions (FAO 1995a:30). This drop innutrients, combined with increased salinity in the delta becauseof a reduction in the Nile outflow as well as overfishing, re-duced the productivity of the coastal fisheries (FAO 1995a:38,39).
Water retention alters a river’s flow regime, which eliminatesor reduces spring runoff or flood pulses that often play a criticalrole in maintaining downstream riparian and wetland commu-nities. These habitats are essential as breeding and feedinggrounds for many fish and bird species. When dams interruptthese pulses, these habitats and associated species are lost(Abramovitz 1996:11). Sediment retention also interferes withdam operations and shortens their useful lives. In the UnitedStates, about 2 km3 of reservoir storage capacity is lost fromsediment retention each year, at a cost of US$819 million an-nually (Vörösmarty et al. 1997a:217).
Finally, water and sediment retention affect water qualityand the waste processing capacity of rivers (the ability to breakdown organic pollutants). The slow-moving water in reservoirsis stratified into layers instead of being well-mixed, with thebottom waters of the reservoir often depleted of oxygen. Theseoxygen-starved waters can produce toxic hydrogen sulfide gasthat degrades water quality. In addition, oxygen-depleted wa-ters released from dams have a reduced capacity to processwaste for up to 100 kilometers downstream because the waste-processing ability of river water depends directly on its level ofdissolved oxygen.
An indicator of the extent to which dams have affected waterstorage and sediment retention at the global level is the changein “residence time” of otherwise free flowing water. This indi-cator, developed by Vörösmarty et al. (1997a), is based on theanalysis of 622 of the world’s largest reservoirs —defined asreservoirs with a storage capacity equal or above 0.5 km3—andexamined the increase in the time it takes an average drop ofwater entering the river to reach the sea. This residence time istermed by the authors as the “aging of continental freshwater.”
Map 3 shows the changes in residence time or aging of riverwater at the mouth of each of the 236 regulated drainage basinsthat were analyzed (Vörösmarty et al. 1997a:210–219). World-wide, the average age of river water in regulated basins hastripled to well over one month (Vörösmarty et al. 1997a:215).Among the basins most affected are the Colorado and Rio Grandein North America, the Nile and the Volta in Africa, and the RioNegro in Argentina.
Changes in Groundwater Resources
Groundwater is a resource of global importance, particularly inarid and semiarid areas of the world where access to surfacewater is limited. Groundwater resources include shallow anddeep rechargeable aquifers that are connected to rivers, streams,or seas, and nonrenewable aquifers or fossil water that may havebeen created by precipitation during the last Ice Age. Most aqui-fers are replenished by rain that infiltrates through the soil orby river losses during floods (UNEP 1996:6; Shiklomanov1997:19). Fossil water resources, on the other hand, are notnaturally or artificially recharged, so once they have been ex-ploited they may never be replenished (UNEP 1996:7;Shiklomanov 1997:23).
It is estimated that at least 1.5 billion people use groundwa-ter as their sole source of drinking water (UNEP 1996:4).Groundwater is also important for irrigation. For instance, morethan 50 percent of the water used in India for irrigation comesfrom groundwater resources (Foster et al. 2000:2). Growingpopulations, expanding urbanization and industrialization, andincreasing demands for food security are placing more pressureon the world’s groundwater supplies.
There are two major consequences of the increasing needfor world groundwater supplies. One is “groundwater mining,”in which groundwater abstraction exceeds the natural rate ofreplenishment. This can result in land subsidence (in whichthe land sinks), saltwater intrusion, and groundwater suppliesbecoming economically and technically unfeasible for use as astable water supply (UNEP 1996:4, 15). The second major con-sequence is the degradation of water quality resulting from avariety of point and nonpoint source pollutants, including agri-cultural runoff, sewage from urban centers, and industrial ef-fluents (see Section on Water Quality).
We lack basic information at the global level on the size,recharge rates, and condition of groundwater supplies. There isdata on distribution, but they are dispersed among national agen-cies and, in most cases, not harmonized (Foster, personal com-munication, 2000). However, in areas where groundwater isimportant for domestic use and irrigation, countries have pro-duced groundwater inventories and are monitoring groundwa-ter quality. For example, in Europe the European EnvironmentAgency shows that nearly 60 percent of the cities with morethan 100,000 people are located in areas where there is ground-water overabstraction (EEA 1995:66). Groundwateroverexploitation is also evident in many Asian cities. The citiesof Bangkok, Manila, Tianjin, Beijing, Madras, Shanghai, andXian, for example, have all registered a decline in water tablelevels of 10–50 meters (Foster et al. 1998:23). Thisoverexploitation in many cases is accompanied by water qual-ity degradation and land subsidence. For instance in Mexico,where many cities have experienced declines in groundwater
F r e s h w a t e r S y s t e m s 19
H u m a n M o d i f i c a t i o n o f F r e s h w a t e r S y s t e m s
levels, the aquifer that supplies much of Mexico City had fallenby 10 meters as of 1992 with a consequent land subsidence ofup to 9 meters (Foster et al. 1998:23, 25). One of the worstcases of groundwater overexploitation is Yemen where, in someareas, the rate of abstraction is 400 percent greater than therate of recharge (Briscoe 1999).
In coastal zones, groundwater overabstraction can reversethe natural flow of groundwater into the ocean, causing saltwa-ter to intrude into inland aquifers. Where coastal aquifers areused to supply drinking water or irrigation, saltwater intrusionis a serious problem. Because of the high marine salt content, aconcentration of only 2 percent seawater in an aquifer is enoughto make groundwater supplies unusable for human consump-tion (Scheidleder et al. 1999:91). A recent study of groundwa-ter resources in Europe shows that saltwater intrusion as a con-sequence of overabstraction is most prevalent in the Mediterra-nean countries, particularly along the coastlines of Spain, Italy,and Turkey (Scheidleder et al. 1999:91). Of 126 groundwaterareas, for which status was reported, 53 showed saltwater intru-sion. Most of the aquifers were used for public and industrialwater supply (Scheidleder et al. 1999:90, 92).
Saltwater intrusion can also occur in inland areas wheregroundwater overexploitation leads to the rise of highly miner-alized water from deeper aquifers. This problem has been re-ported in Europe for 1 area in Latvia, 3 areas in Poland, and 14in the Republic of Moldova (Scheidleder et al. 1999:90, 91).
It should be noted that data provided by different Europeancountries are based on groundwater sampling units that are notstandardized and range in size from single sampling sites toregional administrative units. The quality of data, therefore, isuneven, and it gives an incomplete picture of the situation.Countries that have not reported data are not necessarily free ofgroundwater resources problems.
Saltwater intrusion is also a serious problem in the largecoastal cities of South and Southeast Asia, where groundwaterabstraction is widespread but unregulated. The depression ofgroundwater tables because of overabstraction has caused salt-water intrusion as far inland as 10 kilometers in the coastalalluvial aquifer in Madras, and up to 5 kilometers in Manila. InBangkok, groundwater overexploitation has caused the waterlevel of the underlying aquifer to drop by 60 meters, resultingin problems with saltwater intrusion and land subsidence. Theland surface has fallen by as much as 60 to 80 centimeters inthe center of the city (British Geological Survey 1996:21).
Finally, although little information is available, changes inthe water levels affect cave- and aquifer-dwelling species. Mostof these species have not yet been studied and may have impor-tant ecological functions (McAllister et al. 1997:24).
Wetland Extent and Change
Wetlands are a key component of freshwater ecosystems. Theyinclude a variety of highly productive habitat types from floodedforests and floodplains to shallow lakes and marshes. Wetlandsprovide a wide array of goods and services, including flood con-trol, nutrient cycling and retention, carbon storage, water filter-ing, water storage and aquifer recharge, shoreline protectionand erosion control, and a range of food and material products,such as fish, shellfish, timber, and fiber. Wetlands also providehabitat for a large number of species, from waterfowl and fish toinvertebrates and plants. In North America, for instance, 39percent of plant species depend on wetlands (Myers 1997:129).Wetlands also have aesthetic and recreational values, althoughthese are harder to quantify. They can include activities, suchas birdwatching, hiking, fishing, and hunting.
Not only are wetlands highly productive and biologically rich,but a large part of the world’s population lives in or near flood-plain areas, where the soils are rich in nutrients and, therefore,very fertile. As a result of their potential as agricultural land(and also because they are feared as places that harbor dis-ease), wetlands have undergone massive conversion around theworld. Sometimes, this has come with considerable ecologicaland socioeconomic costs (see Box 1 on the Okavango Delta). InAfrica, for example, many wetlands and floodplains are at riskof disappearing as a result of large-scale irrigation schemes andother water management activities (Barbier and Thompson1998:434). When large irrigation or hydropower schemes areproposed, the downstream impacts often are not fully taken intoaccount. Barbier and Thompson (1998) compared the gainsupstream to the losses downstream of a large-scale irrigationscheme in the Hadejia-Jama’are River basin in northeasternNigeria. This analysis concluded that even though the proposedirrigation scheme would increase food production upstream, thewater management plan would not provide enough benefits tojustify the significant losses to local communities downstreamthat would result from reduced agricultural, fishing, andfuelwood production (Barbier and Thompson 1998:439–440).
Another dramatic example of the unforeseen damage bylarge-scale water engineering works is the effects of a dam andflood embankments on the Waza-Logone floodplain in northernCameroon (Ngantou and Braund 1999:19, 20). In the 1970s,the Waza-Logone floodplain provided habitat for tens of thou-sands of grazing mammals, birds, and fish, as well as suste-nance for more than 100,000 sedentary and nomadic people.The population lived primarily by fishing and pastoralism —activities that depended heavily on the annual flood regime.The construction of a dam and the development of a rice irriga-tion scheme in 1979 resulted in reduced flooding over largeparts of the plain, leading to the collapse of the fishery, a reduc-
20 P I L O T A N A L Y S I S O F G L O B A L E C O S Y S T E M S
H u m a n M o d i f i c a t i o n o f F r e s h w a t e r S y s t e m s
Box 1
What Is at Stake and What Are the Trade-offs: Okavango Delta
the government of Namibia floated plans to build a 250-kilometer pipeline from the Okavango River to tap 20 mil-lion m3 of the river’s water annually for Namibia’s capitalcity (Pottinger 1997:1). This project would be the first majordiversion of the Okavango’s waters, and it would have un-known but potentially negative effects on wildlife, rural live-lihoods, and the Delta’s growing tourist industry. A recentreview of Namibia’s water needs showed that groundwatersources, combined with existing water supplies, effectivedemand management, and artificial aquifer recharge, couldprovide the needed water to Namibia without the costlydevelopment of the pipeline (Rothert 1998:22). Yet pres-sure to build the pipeline arises every few years with theonset of a drought, a regular occurrence in this arid region.A short-term planning perspective means that the likelihoodof diverting the Okavango River remains high (Rothert1998:1, 2).
References
Howe, C.W. 1994. “The IUCN Review of the Southern Okavango
Integrated Water Development Project.” Environment 36 (1):25–
28.
Pottinger, L. 1997. “Namibian Pipeline Project Heats Up.” World
Rivers Review 12 (1):2–3. Available on-line at: http:\\www.irn.org.
Rothert, S. 1998. “Okavango Pipeline Remains a Pipe-Dream for
Now.” World Rivers Review 13 (3):1–2. Available on-line at:
http:\\www.irn.org.
Rothert, S. 1999. Meeting Namibia’s Water Needs While Sparing
the Okavango. Berkeley, California, U.S.A.: International Rivers
Network.
Rothert, S. International Rivers Network. Personal communication,
July 20, 2000.
One of the most remarkable cases in which a globally impor-tant wetland area is at risk from drainage and water extrac-tion is the Okavango Delta in Botswana. The Okavango Riverflows from the highlands of Angola through Namibia andBotswana, where it forms the Okavango Delta, a vast 15,000-square kilometer alluvial fan on the otherwise parched sandsof the Kalahari Desert (Rothert 1999:1). The desert oasis pro-vides habitat for a large array of plants and animals that wouldnot survive the arid environment, and it helps sustain almost130,000 people of several ethnic groups living in over 30communities (Rothert, personal communication, 2000). Thepeople have depended on the Okavango’s waters for gen-erations, and with a growing tourist industry, which employsthousands of people and earns Botswana over US$250 mil-lion in revenues annually, they have every incentive to pre-serve and manage the Delta’s wildlife and water resources(Rothert 1999:1).
The Okavango River is also one of the few large river sys-tems in the world without notable human developments suchas dams or water diversions. But over the past 20 years, therehave been several proposals for large-scale engineeringprojects that would alter this fragile ecosystem and developthe region. The first large development plan for the Deltawas the 1982 Southern Okavango Integrated Water Devel-opment Project. The Botswana government faced strong op-position to the project from local residents, and it eventuallyagreed to an outside assessment of the project that was con-ducted by IUCN-The World Conservation Union (IUCN). TheIUCN report concluded that most of the major engineeringworks of the project would not meet their stated objectivesof increasing food production and rural living standards. TheBotswana government cancelled all plans to implement theproject in 1992 over the protests of the bureaucracy in chargeof water development (Howe 1994:25, 28).
Large development projects that will likely cause harm tothe Delta ecosystem are still being proposed. In late 1996,
tion in available grazing grounds, and a shortage of surface waterduring the dry season. As a consequence, there was a drasticdecline in biodiversity as well as a massive migration of peopleand livestock out of the area. In 1988, the international com-munity recognized the problems in the Waza-Logone floodplainand helped launch a program to rehabilitate the floodplain. Therehabilitation project is now in its third phase, and it alreadyhas boosted fish production and increased the availability ofdry-season grazing (Ngantou and Braund 1999:19, 20).
GLOBAL EXTENT OF WETLANDSA recent review of wetland resources concluded that reliableglobal estimates of wetlands extent could not be produced withavailable data (Finlayson and Davidson 1999:2). The review—commissioned by the Convention on Wetlands, also known asthe Ramsar Convention, and carried out by Wetlands Interna-tional and the Environmental Research Institute of the Super-vising Scientist in Australia – stated that regional data forOceania, Asia, Africa, eastern Europe, and the neotropics al-
F r e s h w a t e r S y s t e m s 21
H u m a n M o d i f i c a t i o n o f F r e s h w a t e r S y s t e m s
low just a cursory assessment of wetland extent and location.Only North America and western Europe have published morerobust estimates of wetland extent. In addition, some good ex-amples of wetland inventory processes exist. The MedWet pro-gram, for example, is coordinating wetlands activities through-out the Mediterranean (Finlayson and Davidson 1999:6).
Wetland inventories have been incomplete and are difficultto undertake for a number of reasons:
? Definitions. The definition of a wetland varies with researchpurpose and an organization’s mandate. For example, stud-ies interested in modeling trace gases have concentrated oninland wetlands (defined as “areas with a water table at ornear the soil surface for a significant part of the growing sea-son, and which are covered by active vegetation during theperiod of water saturation,” IGBP 1998:7). The Ramsar Con-vention uses a very broad definition, covering both inlandand marine wetlands. The latter includes reefs and seagrassbeds as specific habitat types because the definition delin-eates marine areas up to a water depth of six meters.? Scope. Data from national inventories are often incomplete
and difficult to compare because some concentrate on spe-cific habitat types, such as wetlands of importance to migra-tory birds, whereas others include artificial wetlands, suchas rice paddies.? Limitations of maps. Wetland inventories sometimes use
existing maps to estimate wetland extent, such as Opera-tional Navigation Charts for global analyses and large-scaletopographic maps for national assessments. Wetland extentthen becomes a function of scale and the cartographic con-vention of the mapmaker. For example, navigation charts willdepict only wetlands that are visible by pilots. In addition,the rules for placing wetlands symbols on a map usually varywith institutions.
? Boundaries. Researchers have problems defining boundariesand separating individual wetlands from wetland complexes.Some boundaries are difficult to determine because of lim-ited access and seasonal changes in water availability.? Limitations of remote sensing products. The wide range in
the sizes and types of wetlands and the problem of combin-ing hydrologic and vegetation characteristics to define wet-lands make it difficult to produce a global, economical, andhigh-resolution data set with existing sensors.
Considering these limitations, Map 4 is currently the bestregional approximation of wetlands in Africa. The World Con-servation Monitoring Centre (WCMC) and IUCN— estimatedthe location and extent of the wetlands. A group of experts de-lineated wetlands boundaries by generalizing information oninundated areas, rivers, lakes, and topography from the 1:1million Operational Navigation Charts (WRI 1995:18). This mapprovides more detail than other global, coarse resolution datasets that use potential vegetation, soils, and terrain to delineatewetlands—for example, data produced to estimate methane
emissions (Matthews and Fung 1987:61–86) or the InternationalSatellite Land Surface Climatology Project (ISLCP 1987–1988).It also provides more detail on wetlands than the most recentland cover characterization map by the International Geosphere-Biosphere Programme (IGBP) of the International Council forScience, which mostly shows coastal wetlands. However, be-cause of its scale, it underestimates wetlands areas in valleybottoms, such as dambos (“valley meadowlands” in southernAfrica), which are important for agricultural production, foodsecurity, and habitat (Chenje and Johnson 1996:52–54).
Map 4 also shows a proxy variable, location of dams, to indi-cate the potential of changed hydrological regimes. Only a fewof the wetlands shown on Map 4 have been designated as im-portant wetlands under the Ramsar Convention (Ramsar Con-vention Website: http://ramsar.org/key_sitelist.htm). Of these,6 have been listed in the Montreux Record, a register of wet-land sites on the List of Wetlands of International Importancethat includes places where changes in ecological character haveoccurred, are occurring, or are likely to occur as a result oftechnological developments, pollution, or other human inter-ference (Ramsar Convention Website: http://ramsar.org/key_montreux_record.htm).
HOW HAS WETLAND AREA CHANGED?Modifying wetlands has been a major focus of many develop-ment and river regulation plans for decades. Wetlands have beeneither completely converted to other land uses (often by build-ing drainage ditches and filling in swamps) or their functionshave been altered gradually by changing hydrologic regimesand introducing agricultural crops and livestock. Data on ac-tual numbers of wetlands converted or modified are not avail-able globally. However, Myers (1997:129) estimated that half ofthe wetlands of the world were lost in the 20th century. A 1992review of 344 Ramsar sites showed that 84 percent were eitherthreatened or experiencing ecological changes, mostly fromdrainage for agriculture and urban development, pollution, andsiltation (Dugan and Jones 1993:35–38).
Certain regions and countries have undertaken a more con-cise effort to track wetland loss. For example, the U.S. Fish andWildlife Service tracks the status of U.S. wetlands and theamount of wetlands lost or gained over time through its Na-tional Wetlands Inventory. Its first assessment examined theextent of wetland losses over the first 200 years of the country’shistory. Total wetland losses in the lower 48 states were esti-mated to be 53 percent from the 1780s to the 1980s, with 22states believed to have lost 50 percent or more of their wetlands(see Map 5a). Only Alaska, Hawaii, and New Hampshire lostless than 20 percent (Dahl 1990:5). Most of the losses were toagriculture.
Wetland losses in the lower 48 United States were also quan-tified and statistically compared for the 1970s and 1980s (Dahl
22 P I L O T A N A L Y S I S O F G L O B A L E C O S Y S T E M S
H u m a n M o d i f i c a t i o n o f F r e s h w a t e r S y s t e m s
and Johnson 1991:1–23). The study estimated the loss of wet-lands in the lower 48 states during this period to be greaterthan 2 percent, totaling 1.05 million hectares. The total recordedchange in wetlands area dropped from 42.9 million hectares inthe mid-1970s to 41.8 million hectares in the mid-1980s (Dahland Johnson 1991:1).
The study showed that 1.34 million hectares of inland fresh-water wetlands were lost during this period, while 320,680 hect-ares of freshwater ponds were gained. Of the lost freshwaterwetlands, 54 percent were converted to agriculture, 41 percentwere filled but not yet converted to an identifiable land usecategory, and 5 percent were converted to urban uses (Dahl andJohnson 1991:11, 12). The largest drop of any wetland categorywas for forested freshwater wetlands, which declined by 6.2percent over the ten-year period. Much of this loss was in thesoutheastern states, each of which lost significantly more than40,000 hectares of forested freshwater wetlands (Dahl andJohnson 1991:11, 12).
The Natural Resources Inventory (NRI), a division of theU.S. Department of Agriculture, carried out an additional studyof wetland loss on nonfederal lands from 1982–87 in the UnitedStates. During this period an average of 72,600 hectares werelost each year (Brady and Flather 1994:693). Although thisanalysis was limited to the five-year period, it provides someindication of regional trends in wetland losses and gains duringthe 1982–92 period that Map 5b illustrates.
The combined NRI and Fish and Wildlife Service data givethe best estimates of wetland losses over time in the UnitedStates. These data show that the rate of wetland losses has de-clined substantially in the last 50 years. The estimate of aver-age annual loss from the time of settlement to 1954 is 329,000to 359,000 hectares. This dropped to 185,000 hectares per yearfrom 1954 to 1974. From 1974 to 1982 the rate dropped again,to 117,000 hectares yearly, and then to 32,000 hectares yearlyfrom 1982 to 1992 (Heimlich et al. 1998:20).
In Europe, particularly in the Mediterranean basin, wetlandloss is even more severe. Estimates show, for example, that Spainhas lost more than 60 percent of all inland freshwater wetlandssince 1970 (EEA 1995:207); Lithuania has lost 70 percent ofits wetlands in the last 30 years (EEA 1999:291); and the openplains of the southwestern part of Sweden have lost 67 percentof their wetlands and ponds to drainage in the last 50 years(EEA 1995:185). Overall, draining and conversion to agricul-ture alone has reduced wetlands area in Europe by some 60percent (EEA 1998:291).
Wetland loss data for other regions of the world, as well asdata on more gradual modifications of wetlands hydrologicalregime are even harder to obtain. For example, because wet-land ecosystems depend on a saturated water table and are gen-erally very sensitive to changes in water levels, groundwateroverabstraction can cause substantial damage to wetlands by
causing the underlying water table to drop. If water withdraw-als are large enough, wetlands can be permanently destroyed(EEA 1995:66). In 1995, the European Environment Agencyestimated that around 25 percent of the most important wet-lands in Europe were threatened by groundwateroverexploitation (EEA 1995:67). A more recent study showsthat six wetlands designated as Ramsar sites in Denmark, foursites in Hungary, and one in the United Kingdom were reportedas being in danger because of groundwater overexploitation(Scheidleder et al. 1999:96). An additional 46 Ramsar sitesfrom 7 European countries were reported as being under threatfor other reasons (Scheidleder et al. 1999:96). The informationgathered from these countries, however, is very incomplete. Only14 countries out of 37 responded to the questionnaire, and thethreat status for wetlands was provided for only 50 percent ofthe identified Ramsar sites. Therefore, these data do not reflectthe actual extent of the threat to wetlands on the continent(Scheidleder et al. 1999:95, 96).
OPPORTUNITIES FOR FUTURE WETLANDS MONITORINGUSING REMOTE SENSINGThe IGBP has identified the production of a global baselinedata set of wetlands as a high priority (IGBP 1998). New remotesensing techniques and improved capabilities to manage com-plex global data sets make such an endeavor more feasible (IGBP1998:17). Radar, which can sense flooding underneath vegeta-tion and can penetrate cloud cover, is probably the best alter-native for developing a global wetland database (IGBP 1998:27).Because of its high resolution and sensitivity to water, radardata reveal a much finer wetland texture, particularly in areasof flooded forests, than other remotely sensed data. Consequentlyradar data show much larger wetland areas than existing esti-mates, which is consistent with the conclusions of the IGBPassessment that the global extent of wetlands has been signifi-cantly underestimated (Darras et al. 1999:39). Seasonallyflooded wetlands provide highly productive croplands and graz-ing, essential for food security and income generation, as wellas providing important habitat for migratory birds and otherterrestrial and aquatic species. Information on the extent, loca-tion, and change in wetland areas is, thus, crucial to assessingthe condition of freshwater ecosystems.
The launch of Landsat 7 in April 1999 opened a new era incivilian remote sensing, thanks to a higher quality sensor, acomprehensive data acquisition strategy, and a liberal datapolicy. The sensor includes a 15-meter resolution panchromaticband, in addition to five 30-meter resolution optical and infra-red bands, which can be used to resolve more detailed land-cover features. Landsat 7 also has much greater onboard stor-age capacity than previous Landsat generations which, coupledwith an acquisition strategy based on cloud climatology, is in-tended to provide complete global coverage four times a year.
F r e s h w a t e r S y s t e m s 23
H u m a n M o d i f i c a t i o n o f F r e s h w a t e r S y s t e m s
Finally, in an attempt to maximize use of these data, the priceper image has been reduced from US$4,200 to US$600. Higherquality data, available on a regular basis and at modest cost,should allow complete and accurate mapping of the extent ofboth seasonal and permanent wetlands (USGS Landsat 7Website: http://landsat7.usgs.gov/).
Watershed ModificationFreshwater systems are influenced not only by modifying riv-ers, lakes, and wetlands directly, but also by changing land-usepatterns in the whole watershed. The pattern and extent of cit-ies, roads, agricultural land, and natural areas within a water-shed influences infiltration properties, transpiration rates, andrunoff patterns, which in turn impact water quantity and qual-ity. For example, expanding impervious areas increases the vol-ume and rate of runoff of receiving streams and impacts thewater quality and biodiversity of freshwater systems (Jones etal. 1997:51).
At the global level, we used two indicators representing ag-ricultural and urban areas to show the extent to which water-sheds have been modified in ways likely to affect the conditionof freshwater ecosystems. First, we examined the distribution ofwatersheds containing intensive agriculture because watershedswith intensive agricultural development are likely to experi-ence water quality degradation from pesticide and nutrient run-offs and increased sediment loads (see Map 6). Agricultural ar-eas were extracted from the IGBP version of a global one-kilo-meter resolution land-cover characteristics database (GLCCD1998). These cropland areas exclude those with more balancedmosaics of cropland and natural vegetation. Second, we exam-ined the distribution of urban areas as judged by satellite im-ages of nighttime lights for 1994–95. Because more urbanizedwatersheds tend to have greater impervious areas as well ashigher quantities of urban and industrial pollution, this mapalso shows greater pressure on freshwater systems (see Map 7).Urban areas came from a five-kilometer resolution stable-lightsdatabase (NOAA-NGDC 1998). The stable-lights database mea-sures emitted nighttime visible and near-infrared radiation fromcities, towns, and industrial sites. The data better represent ur-ban areas with highly developed economies indicated by ex-tensive electricity networks, street lighting, and industrial ac-tivities, such as refineries. They underestimate urban areaswithin countries with less developed economies.
These two indicators show the degree of human modifica-tion of original natural vegetation in a watershed. They are alsoproxy indicators for water quality impacts, indicating the po-tential of pesticide and nitrogen runoffs, increased sedimentloads, and increased potential for urban and industrial pollut-ants. All indicators were aggregated by large river basins toproduce global maps.
Maps 6 and 7 show contrasting patterns of modified landuse. Map 6 shows that intensively cropped land is concentratedin five areas: Europe, India, eastern China, Southeast Asia, andthe midwestern United States, with smaller concentrations inArgentina, Australia, and Central America. Africa is striking inits lack of intensively cropped land, with the exception of smallpatches along the Mediterranean coast and in South Africa. Thisreflects the minimal use of chemical inputs and the low level ofagricultural productivity in most African countries.
Map 7 shows a much more concentrated pattern of urbanand industrial development. Highly urbanized watersheds areconcentrated along the east coast of the United States, WesternEurope, and Japan, with lesser concentrations in coastal China,India, Central America, most of the United States, Western Eu-rope, and the Persian Gulf.
These maps show the average amount of intensively culti-vated land or urban and industrial area for each large river ba-sin. However, they do not allow for the assessment of land usewithin watersheds and, therefore, fail to show potentially im-portant within-basin differences. We, therefore, used a higherresolution river basin database to calculate the concentrationof intensively cultivated land within individual subbasins (EDC1999). Map 8a shows the results for Europe (west of the UralMountains) and the Middle East; and Map 8b shows the resultsfor insular Southeast Asia. There are 4,033 subbasins in Eu-rope and 4,077 in insular Southeast Asia.
In Europe, the most intensively cultivated land area formsan arc extending from northern France to the Ukraine. Cropintensity is higher in basins in northern France, the Nether-lands, and southern England, and in the subbasins of the Oder,Vistula, Dnieper, and Don rivers in Eastern Europe. There arealso intensively cropped areas in parts of the Danube basin andsubbasins close to the Black Sea, particularly around the Sea ofAzov.
Insular Southeast Asia presents a gradient of agriculturaluse from more populated areas, such as Java and the Philip-pines, where intensively cultivated areas are predominant inmost basins, to a low level of cropland area in Borneo, and theCelebes.
Modification of Freshwater Systems:
Information Status and NeedsThe previous section demonstrates the influence of humans onthe hydrological cycle. This influence is global and the degreeof modification is significant. As the river fragmentation andsediment retention indicators show, there are very few large,free-flowing river systems in the world. While dam construc-tion has greatly slowed in most developed countries, it contin-ues apace in China, Japan, India, Iran, Turkey, and several coun-
24 P I L O T A N A L Y S I S O F G L O B A L E C O S Y S T E M S
H u m a n M o d i f i c a t i o n o f F r e s h w a t e r S y s t e m s
tries in South America. Our understanding of the environmen-tal and social impacts of such projects is constrained by thelimited availability and patchy quality of information. Severalinformation gaps need to be filled to get a more accurate as-sessment of the condition of freshwater systems around the world.
One of the key databases needed to assess the condition offreshwater systems is a complete global database on dams. Theinformation used to develop the indicators in this analysis wasrestricted to large dams, and it came mostly from ICOLD’s WorldRegister of Dams (ICOLD 1998). The registry contains infor-mation only for dams that are 15 meters in height or greater,except for China, Japan, India, Spain, and the United Stateswhere entries are only for dams 30 meters in height or greater(ICOLD 1998:7). The largest data gaps are for Russia, whichreports only hydropower dams, and China, where the majorityof the world’s large dams have been built and for which infor-mation is exceedingly difficult to acquire.
The dams used in this study represent only a portion of theglobal water impoundment and are missing basic attributes aboutdam operations and biophysical characteristics of the reservoirs(Vörösmarty et al. 1997a:218). For example, data on downstreamdischarges are lacking for many reservoirs, however, these dataare needed to assess more fully the interannual variations inriver flow brought about by engineering. Current research is,therefore, limited to statements based on mean annual condi-tions, which miss important dry season variations (Vörösmartyand Sahagian 2000:13). This information is sometimes avail-able for individual reservoirs, but there is a lack of basic docu-mentation at continental or global scales.
The existing global register of dams is also limited by a lackof data about dam locations. The ICOLD database, for example,provides the river and closest town for each entry, but no latitu-dinal and longitudinal coordinates, which makes the process ofgeo-referencing dams very tedious and adds to location errors.The provision of latitude and longitude for each dam wouldhighly improve our ability to locate these structures within the
correct hydrological unit and assess their impact on the fresh-water systems (Vörösmarty and Sahagian 2000:14).
Another key data set needed to assess freshwater ecosystemconditions is complete global information on wetland distribu-tion and change. There is sufficient demand by internationalconventions (such as Ramsar and the Convention on BiologicalDiversity) and scientists working on global environmental is-sues to improve global data on wetlands. The recent review ofwetland resources, commissioned by the Ramsar Convention(Finlayson and Davidson 1999), made two important recom-mendations:
? Focus first on producing basic data on the location and sizeof wetlands, especially for Asia, Africa, South America, thePacific Islands, and Australia, using remotely sensed dataand surveys. The data need to include major biophysicalfeatures, including information on the variation of wetlandareas and the timing of floods.? In a second step, compile data on wetland threats, land ten-
ure, management, and uses and initiate studies on wetlandbenefits and values.
These recommendations were echoed at a March 1999 plan-ning meeting of the IGBP, which emphasized that the produc-tion of a global wetland inventory was a high priority (Darras etal. 1999:3).
Finally, global data on the exploitation and condition ofgroundwater resources are also urgently needed. Many coun-tries that depend on groundwater resources have inventoriedthe location of aquifers and their use. On the continental andglobal levels, however, such information is inconsistent and notreadily available. Data on groundwater quality is extremely lim-ited and available only for some countries. Countries that sharemajor aquifers should coordinate information on the resource.Information on groundwater exploitation should also be collectedin coordination with data collection efforts on the effects of theseextractions on other regional water resources, such as wetlands,lagoons, and river basins.
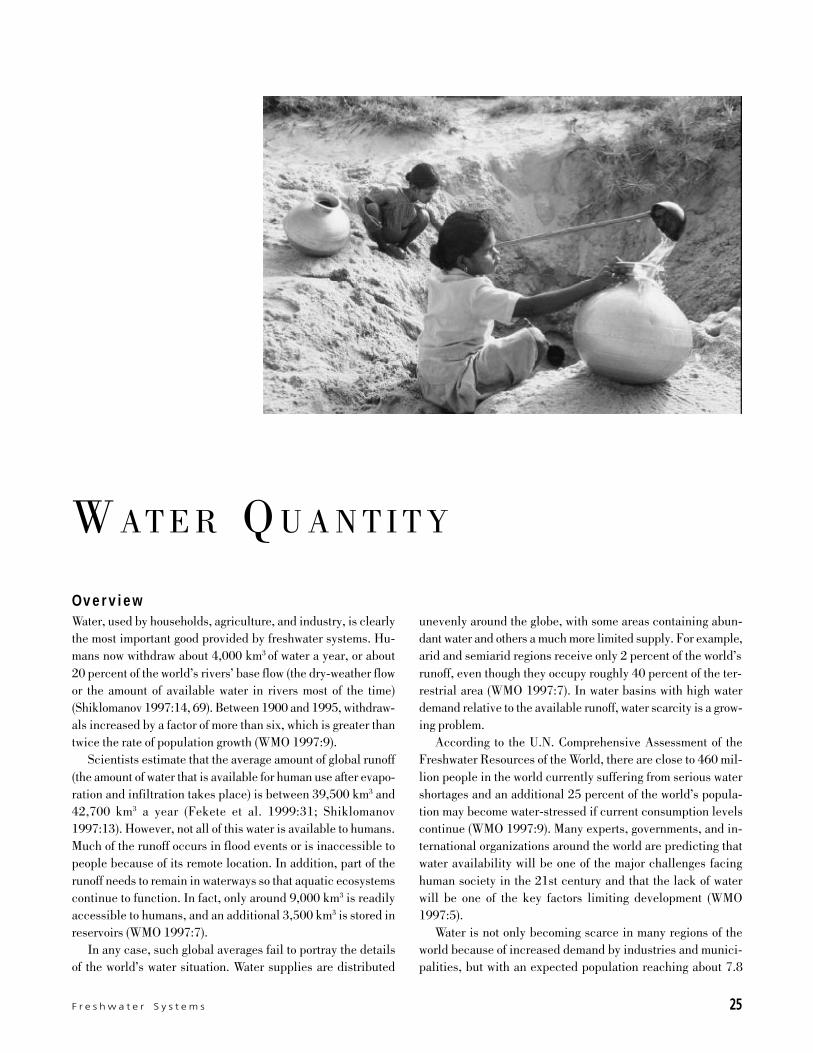
F r e s h w a t e r S y s t e m s 25
H u m a n M o d i f i c a t i o n o f F r e s h w a t e r S y s t e m s
W AT E R Q U A N T I T Y
unevenly around the globe, with some areas containing abun-dant water and others a much more limited supply. For example,arid and semiarid regions receive only 2 percent of the world’srunoff, even though they occupy roughly 40 percent of the ter-restrial area (WMO 1997:7). In water basins with high waterdemand relative to the available runoff, water scarcity is a grow-ing problem.
According to the U.N. Comprehensive Assessment of theFreshwater Resources of the World, there are close to 460 mil-lion people in the world currently suffering from serious watershortages and an additional 25 percent of the world’s popula-tion may become water-stressed if current consumption levelscontinue (WMO 1997:9). Many experts, governments, and in-ternational organizations around the world are predicting thatwater availability will be one of the major challenges facinghuman society in the 21st century and that the lack of waterwill be one of the key factors limiting development (WMO1997:5).
Water is not only becoming scarce in many regions of theworld because of increased demand by industries and munici-palities, but with an expected population reaching about 7.8
OverviewWater, used by households, agriculture, and industry, is clearlythe most important good provided by freshwater systems. Hu-mans now withdraw about 4,000 km3 of water a year, or about20 percent of the world’s rivers’ base flow (the dry-weather flowor the amount of available water in rivers most of the time)(Shiklomanov 1997:14, 69). Between 1900 and 1995, withdraw-als increased by a factor of more than six, which is greater thantwice the rate of population growth (WMO 1997:9).
Scientists estimate that the average amount of global runoff(the amount of water that is available for human use after evapo-ration and infiltration takes place) is between 39,500 km3 and42,700 km3 a year (Fekete et al. 1999:31; Shiklomanov1997:13). However, not all of this water is available to humans.Much of the runoff occurs in flood events or is inaccessible topeople because of its remote location. In addition, part of therunoff needs to remain in waterways so that aquatic ecosystemscontinue to function. In fact, only around 9,000 km3 is readilyaccessible to humans, and an additional 3,500 km3 is stored inreservoirs (WMO 1997:7).
In any case, such global averages fail to portray the detailsof the world’s water situation. Water supplies are distributed
26 P I L O T A N A L Y S I S O F G L O B A L E C O S Y S T E M S
H u m a n M o d i f i c a t i o n o f F r e s h w a t e r S y s t e m s
billion by 2025— the U.N medium projection (UNPD 1999:2)—food production will have to increase, meaning more waterresources will be needed for irrigation.
At present, irrigated agriculture accounts for 40 percent ofglobal food production even though it represents just 17 per-cent of global cropland (WMO 1997:9). Agriculture is society’smajor user of water, withdrawing 70 percent of all water (WMO1997:8). Most irrigation systems are relatively inefficient. Glo-bal estimates of irrigation efficiency are around 40 percent(Postel 1993:56; Seckler et al. 1998:25). Even though irriga-tion for food production is an increasingly important service, itis not analyzed in detail in this report because it has been ex-amined separately under the agroecosystem component of PAGE(Wood et al. 2000).
At the same time that water demand is increasing, pollutionfrom industry, urban centers, and agricultural runoff is limitingthe amount of water available for domestic use and food pro-duction. In developing countries, an estimated 90 percent ofwastewater is discharged directly to rivers and streams withoutany waste processing treatment (WMO 1997:11). In many partsof the world, rivers and lakes have been so polluted that theirwater is unfit even for industrial uses (WMO 1997:11). Threatsof water quality degradation are most severe in areas where wateris scarce because the dilution effect is inversely related to theamount of water in circulation. The loss of ecological services isconsiderable, but difficult to assess.
The Aral Sea represents one of the most extreme cases inenvironmental degradation of an aquatic system. Large-scaleupstream diversions of the Amu Darya and Syr Darya river flowfor irrigation of about seven million hectares of land, has re-duced inflow to the extent that the volume of water in the Aralbasin has been reduced by 75 percent since 1960 (UNESCO2000:35; Postel 1999:94). This loss of water, together with ex-cessive chemicals from agricultural runoff, has caused a col-lapse in the Aral Sea fishing industry, a loss of biodiversity andwildlife habitat, particularly the rich wetlands and deltas, andan increase in human pulmonary and other diseases in the arearesulting from the high toxicity of the salt concentrations in theexposed seabed (Postel 1999:94; WMO 1997:10).
Condition Indicators of Water QuantityGiven humanity’s dependence on water, one would expect thatan assessment of the capacity of freshwater systems to providethis basic good would be easy to carry out. However, research-ers looking into freshwater ecosystems at the global level facetwo major data gaps: water use and water supply at the water-shed level. For some countries, reliable information on watersupply and use is not even available at a national level.
To get a better understanding of the balance of water de-mand and supply and to better estimate the dimensions of the
global water problem, the PAGE study developed two indica-tors that measure the capacity of freshwater systems to providewater for human consumption. These indicators are the follow-ing:
? Per capita water supply by river basin;? Dry season flow by river basin.
PER CAPITA WATER SUPPLY BY RIVER BASINTo calculate water supply, the PAGE study undertook a newanalysis of water scarcity using a somewhat different methodol-ogy than the 1997 U.N. assessment mentioned previously. Be-cause country-level estimates of water availability may hide sig-nificant within-basin differences, the PAGE study calculatedwater supply for individual river basins, rather than at a na-tional or state level, with the object of identifying those areaswhere water supply per person fell below 1,700 m3/year.
Water experts define areas where per capita water supplydrops below 1,700 m3/year as experiencing “water stress”—asituation in which disruptive water shortages can frequentlyoccur (Falkenmark and Widstrand 1992:1–33; Hinrichsen etal. 1998:4). In areas where annual water supplies drop below1,000 m3 per person per year, the consequences can be moresevere and lead to problems with food production and economicdevelopment unless the region is wealthy enough to apply newtechnologies for water use, conservation, or reuse.
According to the PAGE analysis, some 41 percent of theworld’s population, or 2.3 billion people, live in river basinsunder water stress, with per capita water supply below 1,700m3/year (see Map 9 and Table 3). Of these, some 1.7 billionpeople reside in highly stressed river basins where water sup-ply falls below 1,000 m3/year. By 2025, the PAGE analysisprojects that, assuming current consumption patterns continue,at least 3.5 billion people— or 48 percent of the world’s pro-jected population —will live in water-stressed river basins (seeMap 10 and Table 3). Of these, 2.4 billion will live under highwater stress conditions. This per capita water supply calcula-tion, however, does not take into account the coping capabili-ties of different countries to deal with water shortages. For ex-ample, high-income countries that are water scarce may be ableto cope to some degree with water shortages by investing indesalination or reclaimed wastewater. The study also discountsthe use of fossil water sources because such use is unsustain-able in the long term.
The 2025 estimates are considered conservative because theyare based on the United Nations’ low-range projections for popu-lation growth, which has population peaking at 7.2 billion in2025 (UNPD 1999:3). In addition, a slight mismatch betweenthe water runoff and population data sets leaves 4 percent ofthe global population unaccounted for in this analysis.
Map 9 was developed by combining a global population da-tabase for 1995 that uses census data for over 120,000 admin-
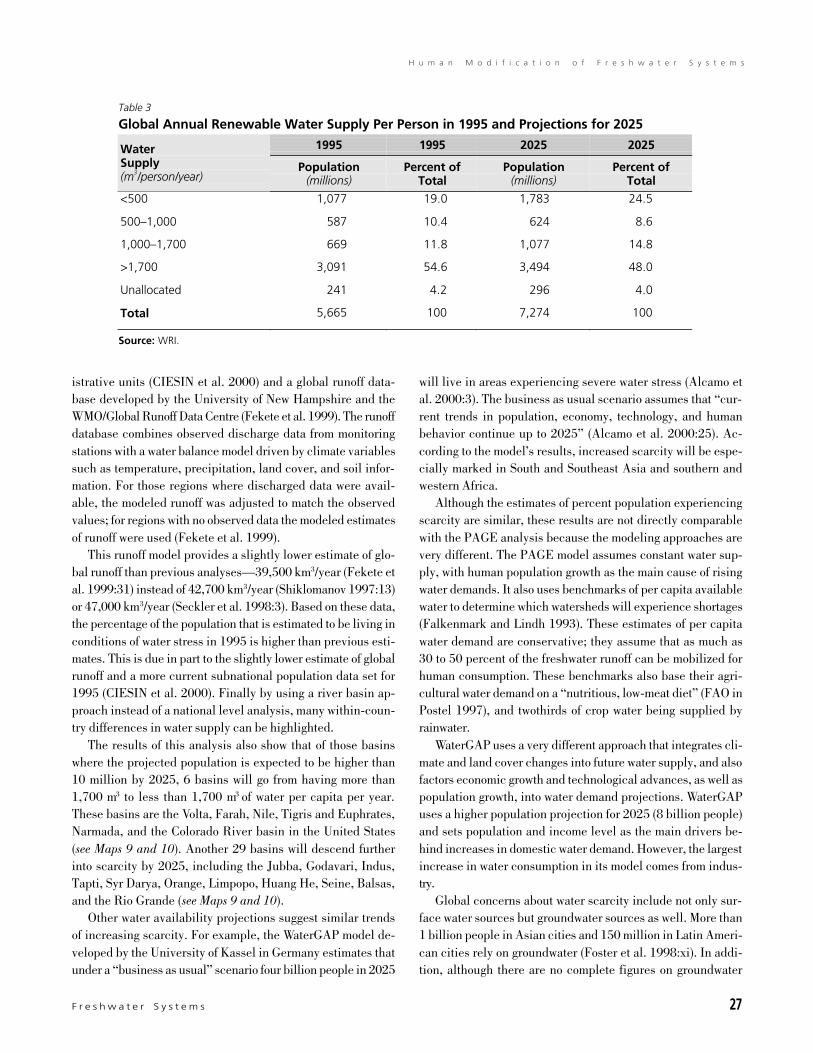
F r e s h w a t e r S y s t e m s 27
H u m a n M o d i f i c a t i o n o f F r e s h w a t e r S y s t e m s
istrative units (CIESIN et al. 2000) and a global runoff data-base developed by the University of New Hampshire and theWMO/Global Runoff Data Centre (Fekete et al. 1999). The runoffdatabase combines observed discharge data from monitoringstations with a water balance model driven by climate variablessuch as temperature, precipitation, land cover, and soil infor-mation. For those regions where discharged data were avail-able, the modeled runoff was adjusted to match the observedvalues; for regions with no observed data the modeled estimatesof runoff were used (Fekete et al. 1999).
This runoff model provides a slightly lower estimate of glo-bal runoff than previous analyses—39,500 km3/year (Fekete etal. 1999:31) instead of 42,700 km3/year (Shiklomanov 1997:13)or 47,000 km3/year (Seckler et al. 1998:3). Based on these data,the percentage of the population that is estimated to be living inconditions of water stress in 1995 is higher than previous esti-mates. This is due in part to the slightly lower estimate of globalrunoff and a more current subnational population data set for1995 (CIESIN et al. 2000). Finally by using a river basin ap-proach instead of a national level analysis, many within-coun-try differences in water supply can be highlighted.
The results of this analysis also show that of those basinswhere the projected population is expected to be higher than10 million by 2025, 6 basins will go from having more than1,700 m3 to less than 1,700 m3 of water per capita per year.These basins are the Volta, Farah, Nile, Tigris and Euphrates,Narmada, and the Colorado River basin in the United States(see Maps 9 and 10). Another 29 basins will descend furtherinto scarcity by 2025, including the Jubba, Godavari, Indus,Tapti, Syr Darya, Orange, Limpopo, Huang He, Seine, Balsas,and the Rio Grande (see Maps 9 and 10).
Other water availability projections suggest similar trendsof increasing scarcity. For example, the WaterGAP model de-veloped by the University of Kassel in Germany estimates thatunder a “business as usual” scenario four billion people in 2025
will live in areas experiencing severe water stress (Alcamo etal. 2000:3). The business as usual scenario assumes that “cur-rent trends in population, economy, technology, and humanbehavior continue up to 2025” (Alcamo et al. 2000:25). Ac-cording to the model’s results, increased scarcity will be espe-cially marked in South and Southeast Asia and southern andwestern Africa.
Although the estimates of percent population experiencingscarcity are similar, these results are not directly comparablewith the PAGE analysis because the modeling approaches arevery different. The PAGE model assumes constant water sup-ply, with human population growth as the main cause of risingwater demands. It also uses benchmarks of per capita availablewater to determine which watersheds will experience shortages(Falkenmark and Lindh 1993). These estimates of per capitawater demand are conservative; they assume that as much as30 to 50 percent of the freshwater runoff can be mobilized forhuman consumption. These benchmarks also base their agri-cultural water demand on a “nutritious, low-meat diet” (FAO inPostel 1997), and twothirds of crop water being supplied byrainwater.
WaterGAP uses a very different approach that integrates cli-mate and land cover changes into future water supply, and alsofactors economic growth and technological advances, as well aspopulation growth, into water demand projections. WaterGAPuses a higher population projection for 2025 (8 billion people)and sets population and income level as the main drivers be-hind increases in domestic water demand. However, the largestincrease in water consumption in its model comes from indus-try.
Global concerns about water scarcity include not only sur-face water sources but groundwater sources as well. More than1 billion people in Asian cities and 150 million in Latin Ameri-can cities rely on groundwater (Foster et al. 1998:xi). In addi-tion, although there are no complete figures on groundwater
Table 3
Global Annual Renewable Water Supply Per Person in 1995 and Projections for 2025
1995 1995 2025 2025WaterSupply(m3/person/year)
Population(millions)
Percent ofTotal
Population(millions)
Percent ofTotal
<500 1,077 19.0 1,783 24.5
500–1,000 587 10.4 624 8.6
1,000–1,700 669 11.8 1,077 14.8
>1,700 3,091 54.6 3,494 48.0
Unallocated 241 4.2 296 4.0
Total 5,665 100 7,274 100
Source: WRI.
28 P I L O T A N A L Y S I S O F G L O B A L E C O S Y S T E M S
W a t e r Q u a n t i t y
use by the rural population, many countries are increasinglydependent on this resource for both domestic and agriculturaluse (Foster et al. 2000:1). Currently humans withdraw approxi-mately 600–700 km3 per year—about 20 percent of global wa-ter withdrawals (Shiklomanov 1997:53–54). Some of this wateris fossil water that comes from deep sources that are isolatedfrom the normal runoff cycle, but much groundwater comes fromshallower aquifers that draw from the same global runoff thatfeeds freshwater ecosystems. Indeed, overdrafting of ground-water sources can rob streams and rivers of a significant frac-tion of their flow. In the same way, pollution of aquifers by ni-trates, pesticides, and industrial chemicals often affects waterquality in adjacent freshwater ecosystems. Although overdraftingand contamination of groundwater aquifers are known to bewidespread and growing problems (UNEP 1996:4–5), compre-hensive data on groundwater resources and pollution trends arenot available at the global level.
DRY SEASON FLOW BY RIVER BASINThese basinwide estimates mask the effect of seasonal runoffpatterns, which reduce that amount of water that is available forhuman use. In many parts of the tropics, rainfall is highly con-centrated in time. For example, it has been estimated that all ofIndia’s rainfall falls in 100 hours during the monsoon months(Seckler, personal communication, 1999). Most runs off intothe sea before it can be captured for human use.
In almost every continent, river modification has affectedthe natural flow of the rivers to a point where, during the dryseason, the outflow to the sea is nonexistent. For example, suchrivers as the Colorado, Huang-He, Ganges, Nile, Syr Darya,and Amu Darya, all run dry at the mouth during the dry season(Postel 1995:10). The Amu Darya and the Syr Darya used tocontribute 55 billion cubic meters of water annually to the AralSea prior to 1960, but this volume has been reduced to an aver-age of 7 billion m3, or 6 percent of the total annual flow for theperiod 1981–90 (Postel 1995:14, 15). Most of the water is di-verted for irrigation (Postel 1995:14).
To assess runoff seasonally, and its implications for wateravailability, base flow as a percent of total flow per person wascalculated for every river basin. Base flow, the volume of runoffavailable during the dry season (Foster et al. 1998:10), is de-fined here hydrologically as the four consecutive months withthe lowest cumulative runoff. Map 11 highlights basins that areeither water stressed (less than 1,700m3/year per person) or havejust adequate supplies of water (between 1,700 and 4,000 m3/year per person) with a pronounced dry season. Basins with apronounced dry season are those where less than 2 percent ofthe total annual runoff occurs in the 4 driest months of the year.Twenty-seven of these basins had more than ten million peoplein 1995 (outlined in black in Map 11). They include the Balsasand Grande de Santiago basins in Mexico, the Limpopo in South-
ern Africa, the Hai Ho and Hong in China, the Chao Phraya inSoutheast Asia, and the Brahmani, Damodar, Godavari, Krishna,Mahi, Narmada, Ponnaiyar, Rabarmarti, and Tapti in India. Here,low dry season flows have exacerbated water supply and qual-ity problems.
Capacity of Freshwater Systems to
Provide WaterHumans withdraw about one fifth of the normal (nonflood) flowof the world’s rivers, but in river basins in arid or populousregions the proportion can be much higher. This has implica-tions for the species living in or dependent on these systems, aswell as for future human water supplies. Currently, more than40 percent of the world’s population lives in water-scarce riverbasins. With growing populations, water scarcity is projected toincrease significantly in the next decades, affecting half of theworld’s people by 2025. Widespread depletion and pollution ofgroundwater sources, which account for about 20 percent ofglobal water withdrawals, also is a growing problem for fresh-water ecosystems because groundwater aquifers are often linkedto surface water sources.
Water Quantity Information Status and
NeedsThe single greatest barrier to better analyses of how the hydro-logical cycle is being impacted by engineering works and land-use change is the poor quality of the hydrological data. Thereliability and availability of hydrological data has deterioratedsharply since the mid-1980s when international support of na-tional monitoring programs was reduced, particularly from U.N.agencies. The number of functioning hydrological stations hasfallen significantly since 1985 (Fekete et al. 1999:8). In manyparts of the developing world we know less about hydrologicalconditions than we did 20 years ago. As a result, major projectsare being designed and in some cases implemented without thebasic hydrological data needed to assess the financial—let aloneenvironmental—impacts of these projects.
In addition, currently available statistics on water withdrawaland consumption are fraught with uncertainty because of thehighly decentralized nature of water use. Our knowledge of theextent and nature of irrigated land at the continental and globallevels is poor, for example, even though the agriculture sectoris responsible for 93 percent of water consumption and 70 per-cent of withdrawals (WMO 1997:8). The irrigated area data-base developed by the University of Kassel and used in thePAGE agroecosystems report (Wood et al. 2000) is the only glo-bally complete and consistent coverage that estimates area“equipped” for irrigation. However, the coarse resolution (50
F r e s h w a t e r S y s t e m s 29
W a t e r Q u a n t i t y
kilometers) and lack of information about crop types, opera-tions of irrigation systems, and other variables precluded itsuse for more detailed analyses. Even when higher resolutiondata are used, huge differences have been observed betweenremotely sensed estimates and field-based estimates. Thesedifferences are partly attributable to different definitions of ir-rigated land (for example, the area equipped for irrigation, thearea actually irrigated, or the irrigated area multiplied by thenumber of crops) and underreporting by farmers (Frolking et al.1999: 407–416).
As mentioned in previous sections, comprehensive statis-tics on supply and use of groundwater resources are also lack-ing for domestic and urban use, as well as irrigation (Foster etal. 1998:xi; Foster et al. 2000:2). In order to improve our abilityto monitor the condition of freshwater systems to provide waterfor humans and ecosystems, better statistics on water availabil-ity and use are urgently needed—preferably at the watershedlevel.
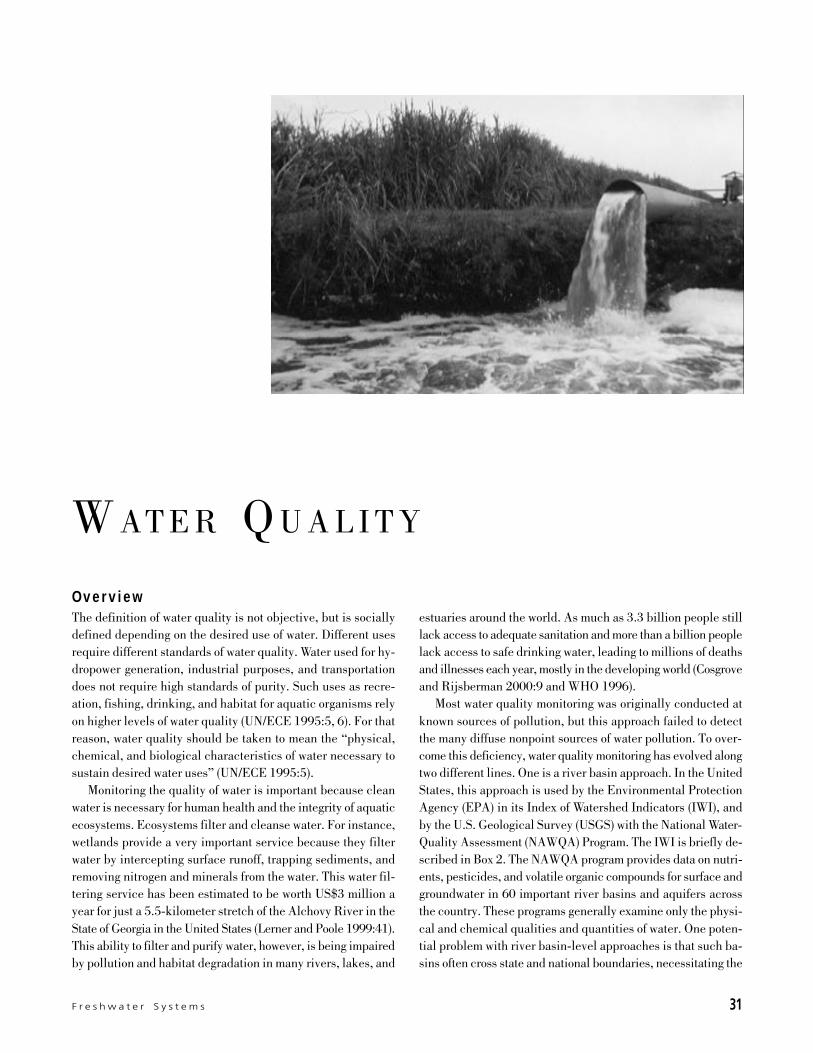
F r e s h w a t e r S y s t e m s 31
W a t e r Q u a n t i t y
W AT E R Q U A L I T Y
estuaries around the world. As much as 3.3 billion people stilllack access to adequate sanitation and more than a billion peoplelack access to safe drinking water, leading to millions of deathsand illnesses each year, mostly in the developing world (Cosgroveand Rijsberman 2000:9 and WHO 1996).
Most water quality monitoring was originally conducted atknown sources of pollution, but this approach failed to detectthe many diffuse nonpoint sources of water pollution. To over-come this deficiency, water quality monitoring has evolved alongtwo different lines. One is a river basin approach. In the UnitedStates, this approach is used by the Environmental ProtectionAgency (EPA) in its Index of Watershed Indicators (IWI), andby the U.S. Geological Survey (USGS) with the National Water-Quality Assessment (NAWQA) Program. The IWI is briefly de-scribed in Box 2. The NAWQA program provides data on nutri-ents, pesticides, and volatile organic compounds for surface andgroundwater in 60 important river basins and aquifers acrossthe country. These programs generally examine only the physi-cal and chemical qualities and quantities of water. One poten-tial problem with river basin-level approaches is that such ba-sins often cross state and national boundaries, necessitating the
OverviewThe definition of water quality is not objective, but is sociallydefined depending on the desired use of water. Different usesrequire different standards of water quality. Water used for hy-dropower generation, industrial purposes, and transportationdoes not require high standards of purity. Such uses as recre-ation, fishing, drinking, and habitat for aquatic organisms relyon higher levels of water quality (UN/ECE 1995:5, 6). For thatreason, water quality should be taken to mean the “physical,chemical, and biological characteristics of water necessary tosustain desired water uses” (UN/ECE 1995:5).
Monitoring the quality of water is important because cleanwater is necessary for human health and the integrity of aquaticecosystems. Ecosystems filter and cleanse water. For instance,wetlands provide a very important service because they filterwater by intercepting surface runoff, trapping sediments, andremoving nitrogen and minerals from the water. This water fil-tering service has been estimated to be worth US$3 million ayear for just a 5.5-kilometer stretch of the Alchovy River in theState of Georgia in the United States (Lerner and Poole 1999:41).This ability to filter and purify water, however, is being impairedby pollution and habitat degradation in many rivers, lakes, and
32 P I L O T A N A L Y S I S O F G L O B A L E C O S Y S T E M S
W a t e r Q u a l i t y
need for a high level of governmental or intergovernmental co-ordination of monitoring activities.
Another approach to water quality monitoring is an integra-tion of chemical and biological parameters to measure condi-tion. Whereas biological measures of water quality do not elimi-nate the need for chemical water monitoring, they are often lessexpensive than chemical analyses and can provide a useful in-dex of potential chemical pollution problems (UN/ECE 1995:9,10). Biological monitoring programs are used to measure waterquality standards in the United States, the United Kingdom,and Australia, and have been applied in a number of other coun-tries around the world.
This section will examine different measures of surface andgroundwater quality in use around the world, and will brieflyexamine trends in the water quality of rivers and streams. It willfocus on Europe and the United States because trend data forother regions of the world are not as readily available(Shiklomanov 1997:27).
The quality of surface waters in industrialized countries hasgenerally been improving with respect to some pollutants overthe last 20 years, but new chemicals are increasingly becominga problem. For example, in most developed countries waste treat-ment plants have considerably reduced fecal contamination ofsurface waters. However, in developing countries sewage treat-
Box 2
Index of Watershed Indicators from the U.S.Environmental Protection Agency
6. Watersheds with more serious water quality problemsand higher vulnerability to stressors;
7. Watersheds with insufficient data to be assessed forwater quality and vulnerability.
There has to be a minimum of 10 of the indicators inorder for a watershed to get an “IWI score.” Otherwisethe watershed is characterized as having “insufficientdata.”
The following table presents the results for 1999:
Number of
IWI Watersheds
Better Water Quality–Low Vulnerability 310
Better Water Quality–High Vulnerability 29
Less Serious Water Quality Problems–
Low Vulnerability 736
Less Serious Water Quality Problems–
High Vulnerability 58
More Serious Water Quality Problems–
Low Vulnerability 496
More Serious Water Quality Problems–
High Vulnerability 38
Insufficient Data 595
Overall 32 percent of those watersheds with sufficientdata to be scored are classified as having serious waterquality problems and 48 percent are classified as havingless serious water quality problems. It is also important tonote that even in the United States, where data collec-tion on water quality is more systematic than in manyother countries, regulators lack the information to assess26 percent of the watersheds selected for this index.
Source: EPA 1999.
To better communicate water pollution problems and addresswater quality issues in the United States, the EnvironmentalProtection Agency (EPA) has developed an Index of Water-shed Indicators (IWI) for 2,262 watersheds. It integrates 15indicators of watershed condition and vulnerability. The con-dition indicators are based on a range of variables, includingthe number of fish consumption alerts by watershed, data oncontaminated sediments from sampling stations, recent andhistorical loss of wetlands, and water quality reports mea-sured against state and tribal water quality standards desig-nated for that particular water body.
In addition, the EPA uses another eight indicators to de-scribe watershed vulnerability. These vulnerability indicatorsrepresent pressures on freshwater systems that are linked towater degradation and habitat quality in watersheds. Theyinclude the number of aquatic or wetland species at risk, thedischarged loads of pollutants, and the potential impact ofurban and agricultural runoff.
The EPA uses different weighting schemes to aggregateindicators of watershed condition and vulnerability into theIWI, assigning scores for each watershed assessed. Based onthese scores, watersheds are classified into seven categories:
1. Watersheds with better water quality and lower vulnerabil-ity to stressors, such as pollutant loadings;
2. Watersheds with better water quality and higher vulnerabil-ity to stressors;
3. Watersheds with less serious water quality problems andlower vulnerability to stressors;
4. Watersheds with less serious water quality problems andhigher vulnerability to stressors;
5. Watersheds with more serious water quality problems andlower vulnerability to stressors;
F r e s h w a t e r S y s t e m s 33
W a t e r Q u a l i t y
ment is still not the norm, with 90 percent being dischargeddirectly into rivers, lakes, and coastal areas without any treat-ment (WRI 1996:21). Consequently, water-related diseases, suchas cholera, amoebic dysentery, schistosomiasis, malaria, andtrypanosomiasis among others, claim 5 million lives annuallyworldwide and cause illness in perhaps half of the populationof the developing world each year (WHO 1996). New pollutionproblems from agricultural and industrial sources have emergedin both industrialized and developing countries, and have be-come one of the biggest challenges facing water resources inmany parts of the world (Shiklomanov 1997:36).
Fortunately methods for monitoring change have improvedas well. Many states and countries have moved beyond the con-ventional monitoring methods toward biological indicators ofwater quality. These are discussed in greater detail later. Ground-water resources are also important. Because groundwater is hid-den from view, many pollution and contamination problems thataffect supplies have been more difficult to detect and have onlyrecently been discovered.
Condition Indicators of the Quality of
Surface WatersInformation about water quality at the global level is poor anddifficult to obtain for a number of reasons. Water quality prob-lems are often local and natural water quality is highly variabledepending on the location, season, or even time of day. Globalcriteria for water quality are, therefore, difficult to construct(Shiklomanov 1997:27).
However, there are many trends in the contamination of wa-ter supplies worldwide, and these have changed greatly overtime. The main contamination problems 100 years ago werefecal and organic pollution from untreated human wastewater.The fecal contamination of water has been largely eliminated inmost industrialized countries; however, organic matter pollu-tion is still a problem in much of the world, especially in rap-idly expanding cities in developing countries (Shiklomanov1997:28). New pollution problems, particularly from agricul-tural runoff and industrial effluents, are increasing in both in-dustrialized and developing countries. In rapidly industrializ-ing countries, such as China, India, Mexico, and Brazil, un-treated sewage and industrial wastes create substantial pres-sures on water quality that are much greater than the problemsof the past (Shiklomanov 1997:27; UNEP/GEMS 1995:6).
A number of chemical, physical, and microbial factors nega-tively affect water quality (Taylor and Smith 1997; Shiklomanov1997; UNEP/GEMS 1995). These include the following:
? Organic pollutants. Organic matter is a problem because iteasily decomposes in water, consuming dissolved oxygen inthe process. This often leads to the eutrophication and deoxy-
genation of waterways, with negative effects for aquatic life.The process also releases ammonium, which when convertedto ammonia by natural chemical processes, is poisonous tofish. The primary sources of organic matter in lakes and riv-ers are wastewater from industrial plants and domestic sew-age.? Nutrients. Increased nutrient concentrations in freshwater,
such as phosphorus and nitrates, can also cause eutrophica-tion in lakes and rivers by decreasing the amount of oxygenavailable to aquatic life. This kills fish and other aquaticorganisms. High levels of nitrates, when ingested in drink-ing water, restrict oxygen transport in the human bloodstreamand can lead to illness.
? Heavy metals. These can be a severe problem because theyaccumulate in the tissues of fish and shellfish and are highlytoxic. They also persist for long periods of time in freshwaterecosystems. Heavy metal pollution tends to be localizedaround industrial and mining centers.? Microbial contamination. The contamination of water by
bacteria, protists, and amoebae also pose threats to humanhealth though the spread of infectious diseases. Fecal con-tamination from untreated sewage, for instance, leads to out-breaks of diseases that claim millions of lives each year.? Toxic organic compounds. These include oil, petroleum prod-
ucts, pesticides, plastics, and industrial chemicals. All theseare toxic to aquatic fauna and humans.
? Salinization. Increasing levels of salinity from overirrigationand groundwater overabstraction renders freshwater suppliesundrinkable and kills crops.? Acidification. Decreasing pH levels in rivers and lakes be-
cause of sulfuric deposition created by industrial activitykills fish and also leaches trace metals from soils, which hasnegative effects on human health.? Suspended particles. These can be from either inorganic or
organic matter. They degrade habitats of aquatic organismsand reduce water quality for drinking and recreational uses.
? Temperature: The thermal characteristics of water are cru-cial for aquatic life. Temperature determines the rate ofchemical and biological processes, such as algal growth anddecomposition of organic matter. Fragmentation of rivers bydams and reservoirs, as well as industrial uses such as hy-dropower and cooling plants, impact water temperatures.
CHEMICAL METHODS OF WATER QUALITY MONITORINGThe amount of organic matter in freshwater systems around theworld can be gauged by the global distribution of biochemicaloxygen demand (BOD) measurements, seen in Figure 3. BODincreases with the amount of organic matter in water and givesan indication for the potential of algal growth and eutrophica-tion (see following note on the definitions of BOD and chemicaloxygen demand, or COD). The BOD concentration of clean fresh-water is normally around 2 mg/l, whereas values exceeding 5mg/l usually indicate pollution (EEA 1994:45). The values in
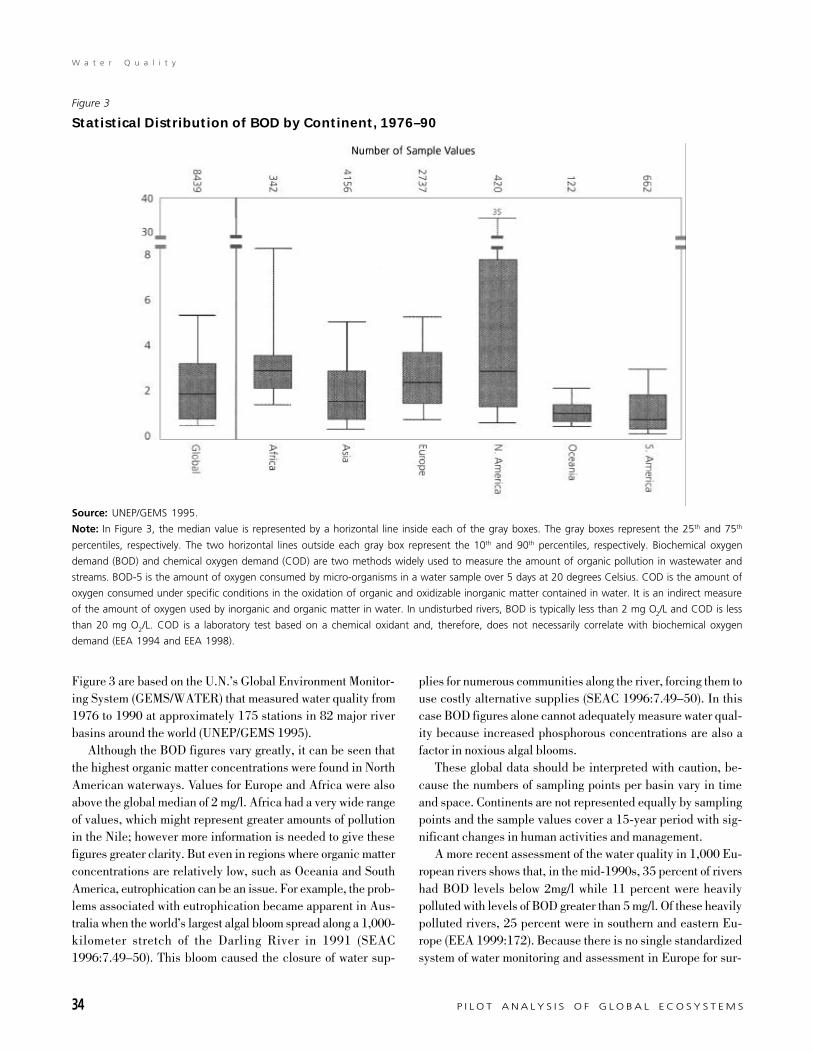
34 P I L O T A N A L Y S I S O F G L O B A L E C O S Y S T E M S
W a t e r Q u a l i t y
Figure 3 are based on the U.N.’s Global Environment Monitor-ing System (GEMS/WATER) that measured water quality from1976 to 1990 at approximately 175 stations in 82 major riverbasins around the world (UNEP/GEMS 1995).
Although the BOD figures vary greatly, it can be seen thatthe highest organic matter concentrations were found in NorthAmerican waterways. Values for Europe and Africa were alsoabove the global median of 2 mg/l. Africa had a very wide rangeof values, which might represent greater amounts of pollutionin the Nile; however more information is needed to give thesefigures greater clarity. But even in regions where organic matterconcentrations are relatively low, such as Oceania and SouthAmerica, eutrophication can be an issue. For example, the prob-lems associated with eutrophication became apparent in Aus-tralia when the world’s largest algal bloom spread along a 1,000-kilometer stretch of the Darling River in 1991 (SEAC1996:7.49–50). This bloom caused the closure of water sup-
plies for numerous communities along the river, forcing them touse costly alternative supplies (SEAC 1996:7.49–50). In thiscase BOD figures alone cannot adequately measure water qual-ity because increased phosphorous concentrations are also afactor in noxious algal blooms.
These global data should be interpreted with caution, be-cause the numbers of sampling points per basin vary in timeand space. Continents are not represented equally by samplingpoints and the sample values cover a 15-year period with sig-nificant changes in human activities and management.
A more recent assessment of the water quality in 1,000 Eu-ropean rivers shows that, in the mid-1990s, 35 percent of rivershad BOD levels below 2mg/l while 11 percent were heavilypolluted with levels of BOD greater than 5 mg/l. Of these heavilypolluted rivers, 25 percent were in southern and eastern Eu-rope (EEA 1999:172). Because there is no single standardizedsystem of water monitoring and assessment in Europe for sur-
Figure 3
Statistical Distribution of BOD by Continent, 1976–90
Source: UNEP/GEMS 1995.
Note: In Figure 3, the median value is represented by a horizontal line inside each of the gray boxes. The gray boxes represent the 25th and 75th
percentiles, respectively. The two horizontal lines outside each gray box represent the 10th and 90th percentiles, respectively. Biochemical oxygen
demand (BOD) and chemical oxygen demand (COD) are two methods widely used to measure the amount of organic pollution in wastewater and
streams. BOD-5 is the amount of oxygen consumed by micro-organisms in a water sample over 5 days at 20 degrees Celsius. COD is the amount of
oxygen consumed under specific conditions in the oxidation of organic and oxidizable inorganic matter contained in water. It is an indirect measure
of the amount of oxygen used by inorganic and organic matter in water. In undisturbed rivers, BOD is typically less than 2 mg O2/L and COD is less
than 20 mg O2/L. COD is a laboratory test based on a chemical oxidant and, therefore, does not necessarily correlate with biochemical oxygen
demand (EEA 1994 and EEA 1998).
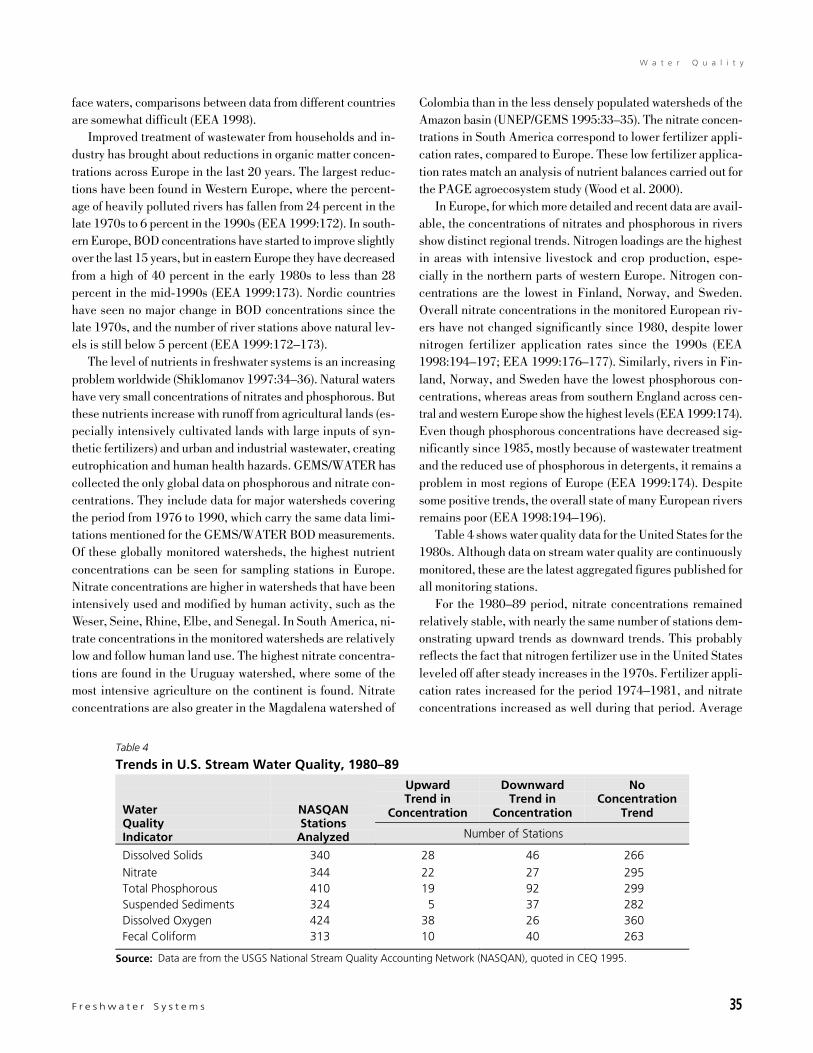
F r e s h w a t e r S y s t e m s 35
W a t e r Q u a l i t y
face waters, comparisons between data from different countriesare somewhat difficult (EEA 1998).
Improved treatment of wastewater from households and in-dustry has brought about reductions in organic matter concen-trations across Europe in the last 20 years. The largest reduc-tions have been found in Western Europe, where the percent-age of heavily polluted rivers has fallen from 24 percent in thelate 1970s to 6 percent in the 1990s (EEA 1999:172). In south-ern Europe, BOD concentrations have started to improve slightlyover the last 15 years, but in eastern Europe they have decreasedfrom a high of 40 percent in the early 1980s to less than 28percent in the mid-1990s (EEA 1999:173). Nordic countrieshave seen no major change in BOD concentrations since thelate 1970s, and the number of river stations above natural lev-els is still below 5 percent (EEA 1999:172–173).
The level of nutrients in freshwater systems is an increasingproblem worldwide (Shiklomanov 1997:34–36). Natural watershave very small concentrations of nitrates and phosphorous. Butthese nutrients increase with runoff from agricultural lands (es-pecially intensively cultivated lands with large inputs of syn-thetic fertilizers) and urban and industrial wastewater, creatingeutrophication and human health hazards. GEMS/WATER hascollected the only global data on phosphorous and nitrate con-centrations. They include data for major watersheds coveringthe period from 1976 to 1990, which carry the same data limi-tations mentioned for the GEMS/WATER BOD measurements.Of these globally monitored watersheds, the highest nutrientconcentrations can be seen for sampling stations in Europe.Nitrate concentrations are higher in watersheds that have beenintensively used and modified by human activity, such as theWeser, Seine, Rhine, Elbe, and Senegal. In South America, ni-trate concentrations in the monitored watersheds are relativelylow and follow human land use. The highest nitrate concentra-tions are found in the Uruguay watershed, where some of themost intensive agriculture on the continent is found. Nitrateconcentrations are also greater in the Magdalena watershed of
Colombia than in the less densely populated watersheds of theAmazon basin (UNEP/GEMS 1995:33–35). The nitrate concen-trations in South America correspond to lower fertilizer appli-cation rates, compared to Europe. These low fertilizer applica-tion rates match an analysis of nutrient balances carried out forthe PAGE agroecosystem study (Wood et al. 2000).
In Europe, for which more detailed and recent data are avail-able, the concentrations of nitrates and phosphorous in riversshow distinct regional trends. Nitrogen loadings are the highestin areas with intensive livestock and crop production, espe-cially in the northern parts of western Europe. Nitrogen con-centrations are the lowest in Finland, Norway, and Sweden.Overall nitrate concentrations in the monitored European riv-ers have not changed significantly since 1980, despite lowernitrogen fertilizer application rates since the 1990s (EEA1998:194–197; EEA 1999:176–177). Similarly, rivers in Fin-land, Norway, and Sweden have the lowest phosphorous con-centrations, whereas areas from southern England across cen-tral and western Europe show the highest levels (EEA 1999:174).Even though phosphorous concentrations have decreased sig-nificantly since 1985, mostly because of wastewater treatmentand the reduced use of phosphorous in detergents, it remains aproblem in most regions of Europe (EEA 1999:174). Despitesome positive trends, the overall state of many European riversremains poor (EEA 1998:194–196).
Table 4 shows water quality data for the United States for the1980s. Although data on stream water quality are continuouslymonitored, these are the latest aggregated figures published forall monitoring stations.
For the 1980–89 period, nitrate concentrations remainedrelatively stable, with nearly the same number of stations dem-onstrating upward trends as downward trends. This probablyreflects the fact that nitrogen fertilizer use in the United Statesleveled off after steady increases in the 1970s. Fertilizer appli-cation rates increased for the period 1974–1981, and nitrateconcentrations increased as well during that period. Average
Table 4
Trends in U.S. Stream Water Quality, 1980–89
UpwardTrend in
Concentration
DownwardTrend in
Concentration
NoConcentration
TrendWaterQualityIndicator
NASQANStations
Analyzed Number of Stations
Dissolved Solids 340 28 46 266
Nitrate 344 22 27 295Total Phosphorous 410 19 92 299Suspended Sediments 324 5 37 282Dissolved Oxygen 424 38 26 360Fecal Coliform 313 10 40 263
Source: Data are from the USGS National Stream Quality Accounting Network (NASQAN), quoted in CEQ 1995.
36 P I L O T A N A L Y S I S O F G L O B A L E C O S Y S T E M S
W a t e r Q u a l i t y
nitrate concentrations were greater in agricultural and urbanareas than in forested areas (Smith et al. 1994: 122).
Trends in phosphorous concentrations in the United Statesshowed greater improvement, with five times more states show-ing downward trends than upward trends. Decreases were morelikely to be found in the East, Midwest, and the Great Lakesregions, while the majority of increases occurred in the South-east (Smith et al. 1994: 124).
The decreased concentrations of phosphorous in streams andrivers in the United States is attributable to reduced phospho-rous in laundry detergents and improved controls in wastewatertreatment plants. The increased number of sewage treatmentplants has also reduced the amount of nitrogen in the form ofammonium, which is toxic to fish. However, the sewage treat-ment process converts ammonium to nitrates that are still re-leased into waterways. Thus, the total amount of nitrogen flow-ing into waterways has not necessarily decreased with a greaternumber of sewage treatment facilities (Mueller and Helsel 1996).
Water quality programs in most OECD countries have beeneffective in reducing many kinds of chemical pollution in theirwaterways. The biggest reductions have been from point sourcepollutants. For example, in the United States from 1972 to 1992the amount of sewage treated at wastewater treatment plantsincreased by 30 percent, yet BOD measurements of waters nearthese plants declined by 36 percent (CEQ 1995: 229). How-ever, national programs have not been effective in reducingnonpoint source nutrients, sediments, and toxics that come fromagriculture, urban and suburban stormwater runoff, mining, andoil and gas operations (NRC 1992:47;EEA 1999:178).
Similarly the existing data tell us little about the biologicalcharacteristics of inland waters because historically, water qual-ity monitoring has focused on the measurement of chemicalparameters. Although such information has provided importantand predictive tools for evaluating water quality, the monitoringof biological indicators to assess the health of freshwater eco-systems is now also recognized as an important component ofwater quality monitoring programs. Beginning in the 1980s andincreasingly in the last 10 years, a greater number of states inthe United States and other countries are including biologicalmonitoring as an important part of their overall water qualitymonitoring programs.
BIOLOGICAL METHODS OF W ATER QUALITY MONITORINGMeasurements of water quality based exclusively on chemicalor physical properties are often used as surrogate measures ofbiological quality. But a reliance on these measures alone risksmissing many important biological characteristics, such as habi-tat alteration and species composition. Furthermore, improve-ments in chemical parameters in many cases will not lead toincreases in biological integrity by themselves. Biological moni-
toring goes beyond the conventional measures of water qualityto address questions of ecosystem function and integrity.
Early attempts to apply biological criteria to water qualitymonitoring were largely qualitative, narrative descriptions basedon a single-dimension metric, such as general species richness(Yoder and Rankin 1998). These single-variable measures didnot give an adequate understanding of the complex biologicalinteractions in aquatic ecosystems. To address these problems,the biologist James Karr developed the Index of Biotic Integrity(IBI) for freshwater habitats in 1981 (Karr and Chu 1999:2).The goal of the IBI is the integration of data about fish species,populations, and assemblages into a single comparative numericindicator. Karr’s IBI used 12 quantitative metrics based on 3categories: species richness and composition, trophic composi-tion, and fish abundance and condition. It was first applied tostreams and rivers of the midwestern United States.
A number of states in the United States have modified andadjusted the IBI, with Ohio having one of the most comprehen-sive programs for the assessment of freshwater biological integ-rity. After seven years of developing its IBI, Ohio formallyadopted the index in 1990 and now uses biological monitoringas an established part of its water quality assessment programs(Yoder and Rankin 1995). Ohio’s IBI modified some of the origi-nal 12 metrics and adjusted them to the state’s natural land-scape variability (Yoder and Rankin 1995). Whereas the stan-dard IBI concentrates on fish diversity, abundance, and com-munity structure, Ohio has a separate index for invertebratespecies, called the Invertebrate Community Index (ICI), whichdetects additional trends and ecosystem conditions (DeShon1995).
Less comprehensive but still effective indices have beendeveloped in other states to measure biotic integrity. The FloridaDepartment of Environmental Protection created the StreamCondition Index (SCI) to measure the effects of nonpoint sourcepollution on biological integrity in the state, using macro-inver-tebrates as indicator species. The SCI metrics include the totalnumber of taxa, the total number of insect taxa (mayflies,stoneflies, and caddisflies), the number of midge larvae taxa,the percent of dominant taxon, the percent of diptera, the per-cent of filterers, and the weighted sum of tolerant and intolerantspecies. With increasing disturbance, species tolerance and rich-ness are expected to decrease, while species composition willchange differentially depending on the species. As with otherIBIs, the Florida SCI scores reflect these potential changes. Stateofficials continue to modify the SCI (Barbour et al. 1996).
The IBI used in Ohio requires data collection and analysisfrom hundreds of sites each year, which means that time andmoney must be spent to obtain IBI scores and recalibrate refer-ence site values. Indices that use macro-invertebrates alone areless expensive because the costs of data collection are not ashigh for invertebrates as for fish. However, using more than one
F r e s h w a t e r S y s t e m s 37
W a t e r Q u a l i t y
taxa increases the amount of information available to resourcemanagers. Ohio officials have found, however, that biological sur-veying is cost-competitive with water chemistry surveys and bio-assays (Yoder 1991:101–102). Chemical assessments, for ex-ample, have lower unit costs per sample but many more of themare needed. For a single stream in Ohio, chemical assessmentin the late 1980s cost up to US$32,400 for 90 samples, com-pared with US$22,000 for 12 biological surveys. Nine bioas-says cost between US$16,000 and US$28,000 (Yoder 1991:101).
Both chemical and biological criteria serve as important com-ponents in assessing water quality. Ohio compared biologicaland chemical assessments in 625 water body segments through-out the state in 1990. In 49.8 percent of the samples, biologicalimpairment was detected with either an IBI or ICI in which nochemical impairment was measured. Both biological and chemi-cal impairment were found in 47.4 percent of the samples,whereas only 2.8 percent of the samples found chemical im-pairment without any corresponding measured biological deg-radation. This comparison demonstrated the importance of us-ing biological criteria in addition to chemical indicators of wa-ter quality. In a majority of cases in which only biological im-pairment was measured, the reasons for decreased biologicalintegrity (increased organic matter, habitat modification, silt-ation) could not be measured using chemical criteria alone(Yoder 1991:98).
A similar approach to evaluating ecosystem conditions thatuses whole-watershed metrics rather than site-specific variableswithin freshwater systems alone is the Watershed Index of Bi-otic Integrity (W-IBI). This index was developed to evaluate100 watersheds in the Sierra Nevada Mountains of California(Moyle and Randall 1998:1320). The W-IBI uses such vari-ables as the number of dams, reservoirs, and water diversions,along with the percentage of the area with roads in each water-shed to assess condition. Data on native and introduced fishspecies— as well as on other taxa, such as native frogs, whichare highly sensitive to disturbance and have completely disap-peared from many watersheds— were also used as indicators.Indices were scored on a scale of 20 to 100, with 80 to 100being excellent. Only 7 out of 100 watersheds were ranked inthe excellent category. Watersheds that scored poorly were thoseat lower elevations where stream channels had been highlymodified by dams, diversions, agriculture, or urbanization, andhigh-elevation streams where native frogs had declined andintroduced predatory fish were present in formerly fishless ar-eas. The W-IBI gives a good watershed-level estimation of bi-otic integrity and health, but sacrifices some local-level infor-mation in the process. For example, within a poorly rankedwatershed, there can be streams that have very high biotic in-tegrity, but this will not show up in the W-IBI classification(Moyle and Randall 1998:1323–1325).
The IBI has also been applied outside the United States. Forexample, an IBI has been developed for the Seine River basinin France (Oberdorff and Hughes 1992). Analysis of these datashowed that IBI scores decreased through time, reflecting in-creasing amounts of pollution and habitat disturbance since the1960s. IBI values varied longitudinally as well, decreasing inall years in a downstream direction because of an increasingamount of disturbance, a trend that became more marked after1967.
Another application of the IBI was also used to assess thebiological integrity of rivers in India (Ganasan and Hughes 1998)and Mexico (Lyons et al. 1995). The study in India, for example,examined two rivers that had large quantities of untreated wasteand toxic heavy metals (Ganasan and Hughes 1998:367). TheIBI scores, based on 1986, 1989, and 1991 data, increaseddownstream from cities and towns, reflecting a gradual recov-ery of biotic integrity with increasing distance from pollutionsources. Nonnative fish species comprised between 4 and 55percent of individuals at sites where water flow was restrictedby an impoundment, compared with 1 to 2 percent of individu-als at the least disturbed sites. One of the main conclusions ofthis study was that the original IBI format could be adapted toIndian rivers, despite an overlap of only two families and nospecies between the midwestern United States and the Indianstudy site. However, further evaluations of this trial study needto be undertaken before the Indian IBI can be widely used inan effective and cost-efficient manner (Ganasan and Hughes1998:378–379).
An alternative to the IBI for making biological assessmentsof water quality is multivariate statistical analysis of aquaticcommunities to make predictions of species composition in dif-ferent sites. Multivariate models have been developed that pre-dict the number of macro-invertebrate freshwater fauna expectedto occur at a given site in the absence of environmental stress.The observed invertebrate fauna is then compared to the ex-pected fauna based on statistical methods, and the ratio of ob-served to expected fauna is used to classify the health of a site.Unstressed sites should have observed/expected ratios that areclose to one, whereas stressed sites will have lower ratios.
Examples of freshwater biological monitoring programs thatuse multivariate statistical methods can be found in the UnitedKingdom (Wright 1995), Australia (Marchant et al. 1997), andthe state of Maine in the United States (Davies et al. 1995). Inmost cases the sampling strategies used to assess biologicalcommunities are the same as those used in IBIs, and the twomethods generally produce similar results. Multivariate meth-ods of analysis have the potential to produce accurate predic-tions of species compositions at unsampled sites based on thecorrelation between reference site data and measured environ-mental variables of water quality (Marchant et al. 1997:664).
38 P I L O T A N A L Y S I S O F G L O B A L E C O S Y S T E M S
W a t e r Q u a l i t y
But more data must be collected than with the IBI to achievebetter results.
Condition Indicators of Groundwater
QualityThe major sources of groundwater pollution are leaching of pol-lutants from agriculture, industry, and untreated sewage, salt-water intrusion caused by overabstraction of groundwater (whichwas discussed in a previous section), and naturalhydrogeochemical pollution. Because of the relative inaccessi-bility and slow movement of the resource, polluted groundwa-ter is very difficult to purify (UNEP 1996:22). Once pollutantsenter a groundwater aquifer, the environmental damage can besevere and long lasting, partly because of the very long timeneeded to flush pollutants out of the aquifer (UNEP 1996:14).Because it is primarily used for drinking water, groundwaterpollution from untreated sewage, intensive agricultural, solidwaste disposal, and industry can cause serious human healthproblems (Shiklomanov 1997:42). Global data on the quality ofgroundwater resources is lacking. Even where available, datausually are not comparable because of the different measuresand standards used, which vary by country (Shiklomanov1997:42; Scheidleder et al. 1999:11; Foster, personal commu-nication, 2000). However, there is evidence that groundwatercontamination from fertilizers, pesticides, industrial effluents,sewage, and hydrocarbons is occurring in many parts of theworld.
Because the source of groundwater pollution is determinedby local conditions, and these vary widely, we have selectedparticular cases to illustrate pollution problems affecting ground-water resources around the world. The selection of cases is basedmostly on data availability. This overview of groundwater qual-ity is by no means comprehensive and portrays trends for onlysome pollutants and certain regions of the world.
NITRATE POLLUTIONNitrate pollution of groundwater sources is a problem in bothindustrialized and industrializing countries (UNEP 1996:28).Nitrate pollution can come from agricultural, urban, or indus-trial sources; untreated sewage is a major source of nitrate pol-lution in many parts of the world (UNEP 1996:22). Natural ni-trate levels in groundwater are low, usually around 10 mg/l ofnitrate (Scheidleder et al. 1999:19). Nitrate moves slowly insoil and groundwater, so there is typically a time lag of 1 to 20years from the time of pollution until its detection.
In China, nitrogen fertilizer consumption increased sharplyin the 1980s and now equals application rates in western Eu-rope. Fourteen cities and counties in northern China, coveringan area of 140,000 square kilometers, were sampled to assessthe extent of nitrate contamination of groundwater supplies
(Zhang et al. 1996: 224). This area had over 20 billion cubicmeters of groundwater withdrawals in 1980, mostly for irriga-tion but with large amounts used for drinking water supplies aswell (UN 1997:29). Over one half of the sampled areas had ni-trate concentrations that were above the allowable limit for ni-trate in drinking water. The majority of these were smaller townsand cities (10,000 to 100,000 in population) that were sur-rounded by agricultural areas with high fertilizer applicationrates and that depended on groundwater for the majority of theirdrinking water supplies (Zhang et al. 1996:227). Pollution ofgroundwater supplies from synthetic fertilizer application is alsoa problem in parts of India. Groundwater samples in the statesof Uttar Pradesh, Haryana, and Punjab were found to have be-tween 5 and 16 times the prescribed safe amount of nitrate,with one site in Haryana almost 30 times the prescribed limit.Groundwater in these areas is also being progressively depletedbecause of overabstraction for irrigation (TERI 1998: 214–215).
Nitrate pollution of groundwater supplies is also a problemin industrialized countries, as can be seen from a recent Euro-pean assessment of groundwater resources (Scheidleder et al.1999). Twenty-two countries reported regional-level data onnitrate pollution. The number of sampling sites varied widelyfrom one region to another. In 50 of the reported regions, nitratelevels exceeded 25 mg/l in at least a quarter of the total samples.The levels exceeded 25 mg/l in half of the samples in an addi-tional 13 regions. In some regions of France, the Netherlands,and Slovenia, nitrate concentrations exceeded 50 mg/l in 67percent of sampling sites. In Poland and Moldova, groundwaterwells with nitrate concentrations in excess of 45 mg/l could befound across all parts of both countries (Scheidleder et al.1999:54).
In general, the risk of nitrate pollution for groundwater sup-plies is directly related to the amount of fertilizers or other ni-trogen inputs to the land, and the permeability of the soilsthrough which nitrogen is leached. In the United States, ground-water provides drinking water for more than onehalf of thenation’s population (UNEP 1996:12). Data collected by theUSGS NAWQA program demonstrate that nitrate concentrationsin groundwater exceeding the recommended level of 10 mg/lare significantly greater in aquifers that have high nitrogen in-puts and are most vulnerable to leaching (Nolan et al. 1998).Nevertheless, little information exists about groundwater sup-plies at the national level in the United States, and data areespecially poor for ammonium and phosphorous concentrations.
The USGS has begun a more comprehensive program ofgroundwater quality monitoring, but several more years of sam-pling will be needed before enough data will be collected toanalyze national trends (Mueller and Helsel 1996). A prelimi-nary analysis of nitrate in U.S. groundwater, however, showsthat high concentrations in shallow groundwater are widespreadand closely correlated with agricultural areas, yet no regional
F r e s h w a t e r S y s t e m s 39
W a t e r Q u a l i t y
patterns could be discerned (USGS 1999:41). The applicationrates of synthetic nitrogen fertilizer can be used as a generalindicator of groundwater quality because increasing levels ofagricultural intensification usually mean overapplication of fer-tilizers and subsequent leaching into groundwater supplies(Scheidleder et al. 1999:21).
NATURAL (HYDROGEOCHEMICAL) POLLUTIONNatural groundwater contamination in the Indian state of WestBengal and in Bangladesh currently threatens the lives of mil-lions of people. In West Bengal, 7 districts covering an area ofover 37,000 square kilometers are contaminated with arsenic,with an estimated 1.1 million people drinking from contami-nated wells. A survey found that 200,000 people were sufferingfrom arsenic-related diseases, but the numbers could poten-tially be much higher because the total population of the af-fected area is over 9.5 million people (Mandal et al. 1996:976).Naturally occurring arsenic also affects wells across Bangladesh;as many as one million wells in Bangladesh and west Bengalmight be contaminated. Ironically, many of these wells weredrilled to provide a safe drinking water alternative to heavilypolluted surface water supplies. (Nickson et al. 1998: 338).
Capacity of Freshwater Systems to
Provide Clean WaterSurface water quality has improved in most OECD countriesduring the past 20 years, but nitrate and pesticide contamina-tion remain persistent problems. Data on water quality in otherregions of the world are sparse, but water quality appears to bedegraded in almost all regions with intensive agriculture andrapid urbanization. Unfortunately, little information is availableto evaluate the extent to which chemical contamination hasimpaired freshwater biological functions. However, incidentsof algal blooms and eutrophication are widespread in freshwa-ter systems all over the world—an indicator that these systemsare profoundly affected by water pollution. In addition, themassive loss of wetlands at a global level has greatly impairedthe capacity of freshwater systems to filter and purify water.
Nitrate pollution of groundwater supplies in northern Chinaand India is likely to remain a serious problem for years to come.Increasing populations mean that agricultural productivity hasto increase to meet growing needs, yet in China the amount ofarable land is slowly decreasing due to urbanization. It is esti-mated that application rates for nitrogen fertilizer will doubleor triple in the next 30 years (Zhang et al. 1996: 223). Not onlyare there negative health effects associated with nitrate pollu-tion of groundwater, but overapplication has serious economiccosts as well. For one 115,000-hectare region in the northernprovince of Shaanxi, economic losses because of excessive appli-
cation of nitrogen fertilizer were estimated to be US$13 million(Emteryd et al. 1998:443).
Water Quality Information Status and
NeedsBecause the quality of water is one of the most critical factorsaffecting the quality of life on Earth, monitoring water quality isan urgent and important task. Unfortunately, there have beenfew sustained programs for the global monitoring of the qualityof water, with the result that information is highly localized andfar from complete.
One of the only global attempts at water quality monitoringhas been the UNEP GEMS/WATER program that examined datafrom 82 major river basins worldwide over a period of a decadeand a half. This program gathered data on a variety of waterquality issues, including nutrients, oxygen balance, suspendedsediments, salinization, microbial pollution, and acidification.Yet, the number of monitored watersheds were too sparse andthe frequency and type of measurements were too inconsistentto paint a comprehensive picture of global water quality trends.Further studies of this kind need more comprehensive and sys-tematic data collection, and monitoring should be carried outindefinitely so that long-term trends can be analyzed. Data needsare especially critical for developing countries, which often donot have strong national monitoring programs, yet, face seriouswater quality problems.
Surface water monitoring programs are relatively well de-veloped in most OECD countries, where many different physi-cal and chemical measures are monitored. Data for groundwa-ter are less reliable in most cases, and much more informationneeds to be gathered in all countries on groundwater quality.Even in the United States, efforts by the USGS to monitor ground-water quality have begun only in recent years, and current moni-toring covers only a portion of the country’s land area.
In developing countries, the situation is much worse. Thereare a few localized studies of groundwater quality for many de-veloping countries, but no country has a comprehensive pro-gram for groundwater monitoring. A global program for address-ing groundwater quality issues could be built around a few in-dicator variables that are most likely to adversely affect humanhealth (such as nitrates, salts, and toxic chemicals), with fre-quent monitoring carried out in areas of heavy dependence ongroundwater use.
One of the most important issues that must be addressed inany global program of water quality monitoring is the need formore biological monitoring. It has been shown that chemicalmonitoring alone fails to identify many instances in which fresh-water ecosystems are stressed or threatened by nonchemicalfactors. Declines of biological integrity can have adverse ef-
40 P I L O T A N A L Y S I S O F G L O B A L E C O S Y S T E M S
W a t e r Q u a l i t y
fects on human welfare as well, through declining fish and shell-fish stocks. Biological monitoring is needed to give greater in-formation about overall ecosystem health and integrity.
However, unlike programs for the monitoring of chemicaland physical parameters, biological monitoring cannot easilybe carried out on a global scale. This is because the informationneeded to conduct useful indicators of biological integrity can-not be found in single-measure indices. Information about fresh-water biotic integrity is highly dependent on local circumstances,such as the numbers and types of organisms and the ways inwhich freshwater biological communities are structured. Nosingle IBI-type measure could be constructed for the entire worldbecause IBIs require locally calibrated reference sites to be
useful. Unlike conventional chemical measures of water qual-ity, biological indices are difficult to construct even at the na-tional level, depending on the size of the country. In the UnitedStates, where several nationwide programs for measuring chemi-cal aspects of water quality are underway, biological monitor-ing is conducted at the state level, and it probably will never becoordinated at a higher level of administration.
One of the biggest challenges in future global water monitor-ing programs is the integration of chemical and biological mea-sures of water quality. Although the former can be carried out atnational and even continental scales, the latter must be ap-proached at the local and regional level. Yet, both have impor-tant messages to tell us about water quality and ecosystem health.
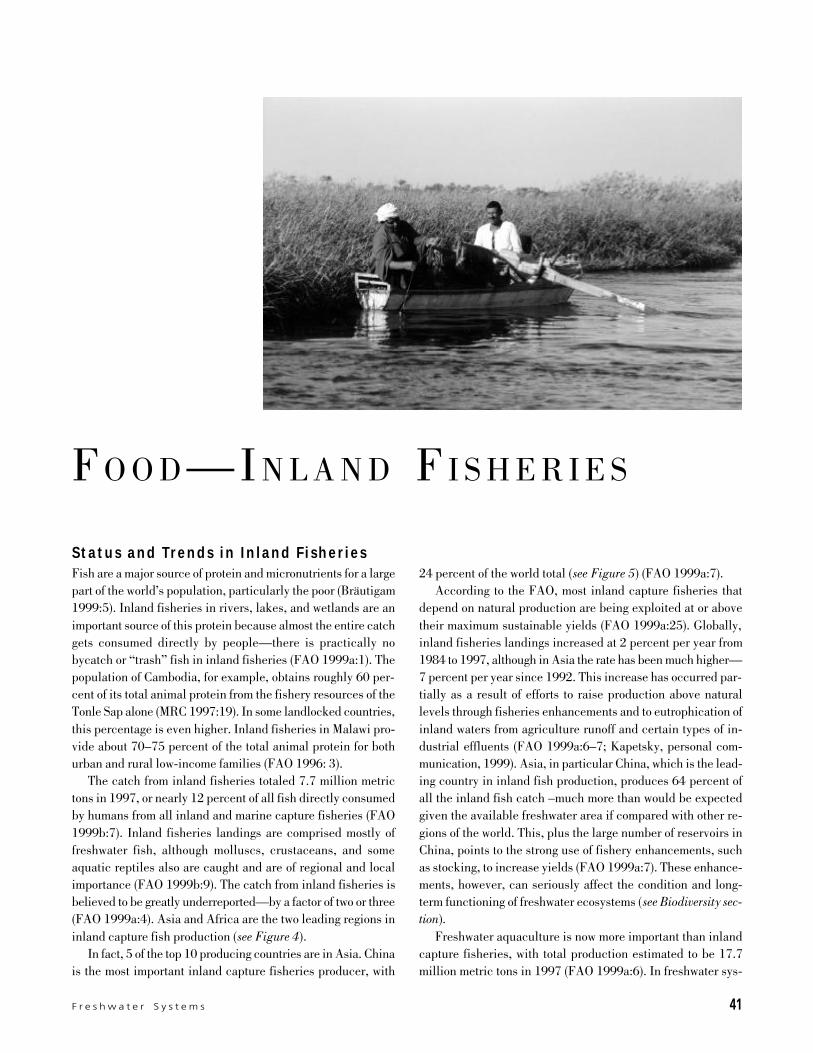
F r e s h w a t e r S y s t e m s 41
W a t e r Q u a l i t y
F O O D —I N L A N D F I S H E R I E S
24 percent of the world total (see Figure 5) (FAO 1999a:7).According to the FAO, most inland capture fisheries that
depend on natural production are being exploited at or abovetheir maximum sustainable yields (FAO 1999a:25). Globally,inland fisheries landings increased at 2 percent per year from1984 to 1997, although in Asia the rate has been much higher—7 percent per year since 1992. This increase has occurred par-tially as a result of efforts to raise production above naturallevels through fisheries enhancements and to eutrophication ofinland waters from agriculture runoff and certain types of in-dustrial effluents (FAO 1999a:6–7; Kapetsky, personal com-munication, 1999). Asia, in particular China, which is the lead-ing country in inland fish production, produces 64 percent ofall the inland fish catch –much more than would be expectedgiven the available freshwater area if compared with other re-gions of the world. This, plus the large number of reservoirs inChina, points to the strong use of fishery enhancements, suchas stocking, to increase yields (FAO 1999a:7). These enhance-ments, however, can seriously affect the condition and long-term functioning of freshwater ecosystems (see Biodiversity sec-tion).
Freshwater aquaculture is now more important than inlandcapture fisheries, with total production estimated to be 17.7million metric tons in 1997 (FAO 1999a:6). In freshwater sys-
Status and Trends in Inland FisheriesFish are a major source of protein and micronutrients for a largepart of the world’s population, particularly the poor (Bräutigam1999:5). Inland fisheries in rivers, lakes, and wetlands are animportant source of this protein because almost the entire catchgets consumed directly by people—there is practically nobycatch or “trash” fish in inland fisheries (FAO 1999a:1). Thepopulation of Cambodia, for example, obtains roughly 60 per-cent of its total animal protein from the fishery resources of theTonle Sap alone (MRC 1997:19). In some landlocked countries,this percentage is even higher. Inland fisheries in Malawi pro-vide about 70–75 percent of the total animal protein for bothurban and rural low-income families (FAO 1996: 3).
The catch from inland fisheries totaled 7.7 million metrictons in 1997, or nearly 12 percent of all fish directly consumedby humans from all inland and marine capture fisheries (FAO1999b:7). Inland fisheries landings are comprised mostly offreshwater fish, although molluscs, crustaceans, and someaquatic reptiles also are caught and are of regional and localimportance (FAO 1999b:9). The catch from inland fisheries isbelieved to be greatly underreported—by a factor of two or three(FAO 1999a:4). Asia and Africa are the two leading regions ininland capture fish production (see Figure 4).
In fact, 5 of the top 10 producing countries are in Asia. Chinais the most important inland capture fisheries producer, with
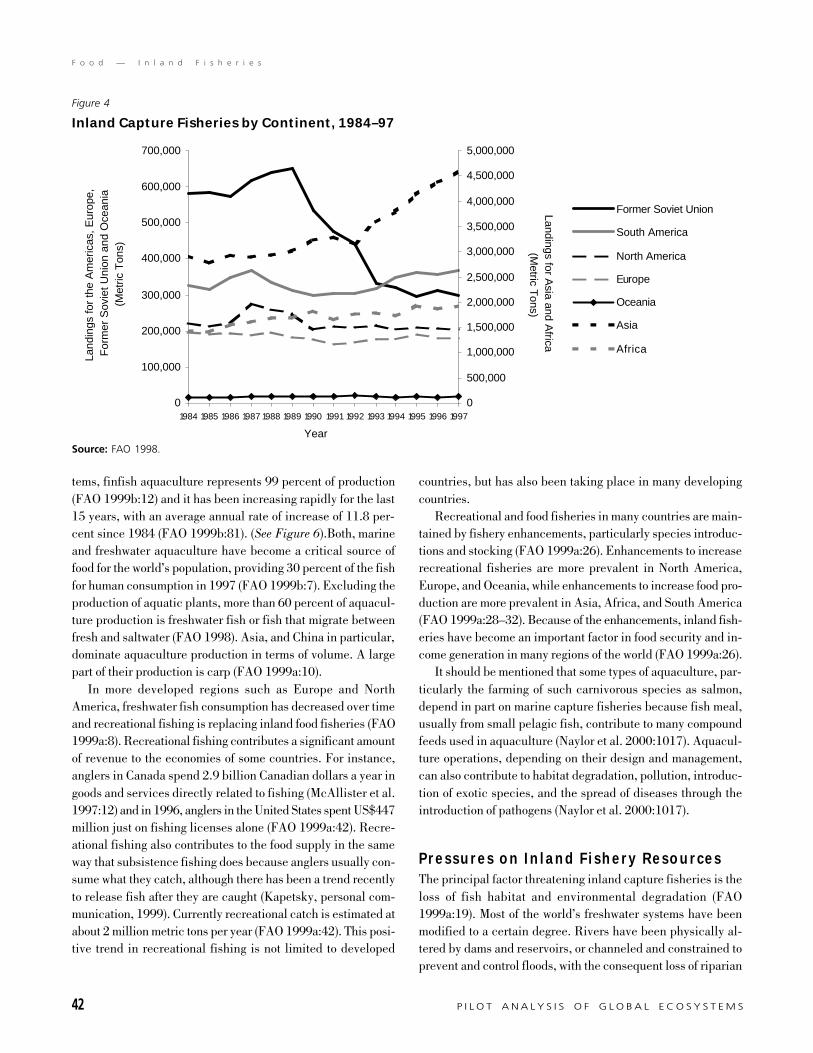
42 P I L O T A N A L Y S I S O F G L O B A L E C O S Y S T E M S
F o o d — I n l a n d F i s h e r i e s
tems, finfish aquaculture represents 99 percent of production(FAO 1999b:12) and it has been increasing rapidly for the last15 years, with an average annual rate of increase of 11.8 per-cent since 1984 (FAO 1999b:81). (See Figure 6).Both, marineand freshwater aquaculture have become a critical source offood for the world’s population, providing 30 percent of the fishfor human consumption in 1997 (FAO 1999b:7). Excluding theproduction of aquatic plants, more than 60 percent of aquacul-ture production is freshwater fish or fish that migrate betweenfresh and saltwater (FAO 1998). Asia, and China in particular,dominate aquaculture production in terms of volume. A largepart of their production is carp (FAO 1999a:10).
In more developed regions such as Europe and NorthAmerica, freshwater fish consumption has decreased over timeand recreational fishing is replacing inland food fisheries (FAO1999a:8). Recreational fishing contributes a significant amountof revenue to the economies of some countries. For instance,anglers in Canada spend 2.9 billion Canadian dollars a year ingoods and services directly related to fishing (McAllister et al.1997:12) and in 1996, anglers in the United States spent US$447million just on fishing licenses alone (FAO 1999a:42). Recre-ational fishing also contributes to the food supply in the sameway that subsistence fishing does because anglers usually con-sume what they catch, although there has been a trend recentlyto release fish after they are caught (Kapetsky, personal com-munication, 1999). Currently recreational catch is estimated atabout 2 million metric tons per year (FAO 1999a:42). This posi-tive trend in recreational fishing is not limited to developed
countries, but has also been taking place in many developingcountries.
Recreational and food fisheries in many countries are main-tained by fishery enhancements, particularly species introduc-tions and stocking (FAO 1999a:26). Enhancements to increaserecreational fisheries are more prevalent in North America,Europe, and Oceania, while enhancements to increase food pro-duction are more prevalent in Asia, Africa, and South America(FAO 1999a:28–32). Because of the enhancements, inland fish-eries have become an important factor in food security and in-come generation in many regions of the world (FAO 1999a:26).
It should be mentioned that some types of aquaculture, par-ticularly the farming of such carnivorous species as salmon,depend in part on marine capture fisheries because fish meal,usually from small pelagic fish, contribute to many compoundfeeds used in aquaculture (Naylor et al. 2000:1017). Aquacul-ture operations, depending on their design and management,can also contribute to habitat degradation, pollution, introduc-tion of exotic species, and the spread of diseases through theintroduction of pathogens (Naylor et al. 2000:1017).
Pressures on Inland Fishery ResourcesThe principal factor threatening inland capture fisheries is theloss of fish habitat and environmental degradation (FAO1999a:19). Most of the world’s freshwater systems have beenmodified to a certain degree. Rivers have been physically al-tered by dams and reservoirs, or channeled and constrained toprevent and control floods, with the consequent loss of riparian
Figure 4
Inland Capture Fisheries by Continent, 1984–97
Source: FAO 1998.
0
100,000
200,000
300,000
400,000
500,000
600,000
700,000
1984 1985 1986 1987 1988 1989 1990 1991 1992 1993 1994 1995 1996 1997
Year
Land
ings
for
the
Am
eric
as, E
urop
e,
For
mer
Sov
iet U
nion
and
Oce
ania
(M
etric
Ton
s)
0
500,000
1,000,000
1,500,000
2,000,000
2,500,000
3,000,000
3,500,000
4,000,000
4,500,000
5,000,000
Landings for Asia and A
frica (M
etric Tons)
Former Soviet Union
South America
North America
Europe
Oceania
Asia
Africa
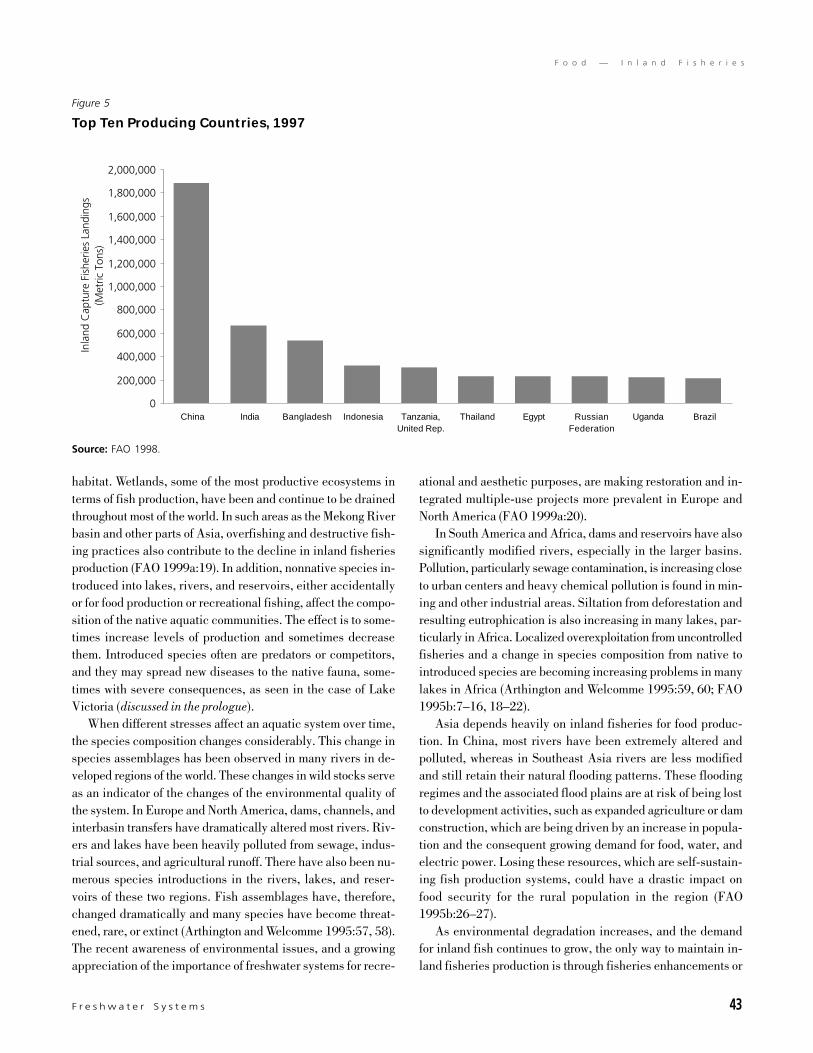
F r e s h w a t e r S y s t e m s 43
F o o d — I n l a n d F i s h e r i e s
habitat. Wetlands, some of the most productive ecosystems interms of fish production, have been and continue to be drainedthroughout most of the world. In such areas as the Mekong Riverbasin and other parts of Asia, overfishing and destructive fish-ing practices also contribute to the decline in inland fisheriesproduction (FAO 1999a:19). In addition, nonnative species in-troduced into lakes, rivers, and reservoirs, either accidentallyor for food production or recreational fishing, affect the compo-sition of the native aquatic communities. The effect is to some-times increase levels of production and sometimes decreasethem. Introduced species often are predators or competitors,and they may spread new diseases to the native fauna, some-times with severe consequences, as seen in the case of LakeVictoria (discussed in the prologue).
When different stresses affect an aquatic system over time,the species composition changes considerably. This change inspecies assemblages has been observed in many rivers in de-veloped regions of the world. These changes in wild stocks serveas an indicator of the changes of the environmental quality ofthe system. In Europe and North America, dams, channels, andinterbasin transfers have dramatically altered most rivers. Riv-ers and lakes have been heavily polluted from sewage, indus-trial sources, and agricultural runoff. There have also been nu-merous species introductions in the rivers, lakes, and reser-voirs of these two regions. Fish assemblages have, therefore,changed dramatically and many species have become threat-ened, rare, or extinct (Arthington and Welcomme 1995:57, 58).The recent awareness of environmental issues, and a growingappreciation of the importance of freshwater systems for recre-
ational and aesthetic purposes, are making restoration and in-tegrated multiple-use projects more prevalent in Europe andNorth America (FAO 1999a:20).
In South America and Africa, dams and reservoirs have alsosignificantly modified rivers, especially in the larger basins.Pollution, particularly sewage contamination, is increasing closeto urban centers and heavy chemical pollution is found in min-ing and other industrial areas. Siltation from deforestation andresulting eutrophication is also increasing in many lakes, par-ticularly in Africa. Localized overexploitation from uncontrolledfisheries and a change in species composition from native tointroduced species are becoming increasing problems in manylakes in Africa (Arthington and Welcomme 1995:59, 60; FAO1995b:7–16, 18–22).
Asia depends heavily on inland fisheries for food produc-tion. In China, most rivers have been extremely altered andpolluted, whereas in Southeast Asia rivers are less modifiedand still retain their natural flooding patterns. These floodingregimes and the associated flood plains are at risk of being lostto development activities, such as expanded agriculture or damconstruction, which are being driven by an increase in popula-tion and the consequent growing demand for food, water, andelectric power. Losing these resources, which are self-sustain-ing fish production systems, could have a drastic impact onfood security for the rural population in the region (FAO1995b:26–27).
As environmental degradation increases, and the demandfor inland fish continues to grow, the only way to maintain in-land fisheries production is through fisheries enhancements or
Figure 5
Top Ten Producing Countries, 1997
Source: FAO 1998.
0
200,000
400,000
600,000
800,000
1,000,000
1,200,000
1,400,000
1,600,000
1,800,000
2,000,000
China India Bangladesh Indonesia Tanzania,United Rep.
Thailand Egypt RussianFederation
Uganda Brazil
Inla
nd C
aptu
re F
ishe
ries
Land
ings
(Met
ric T
ons)
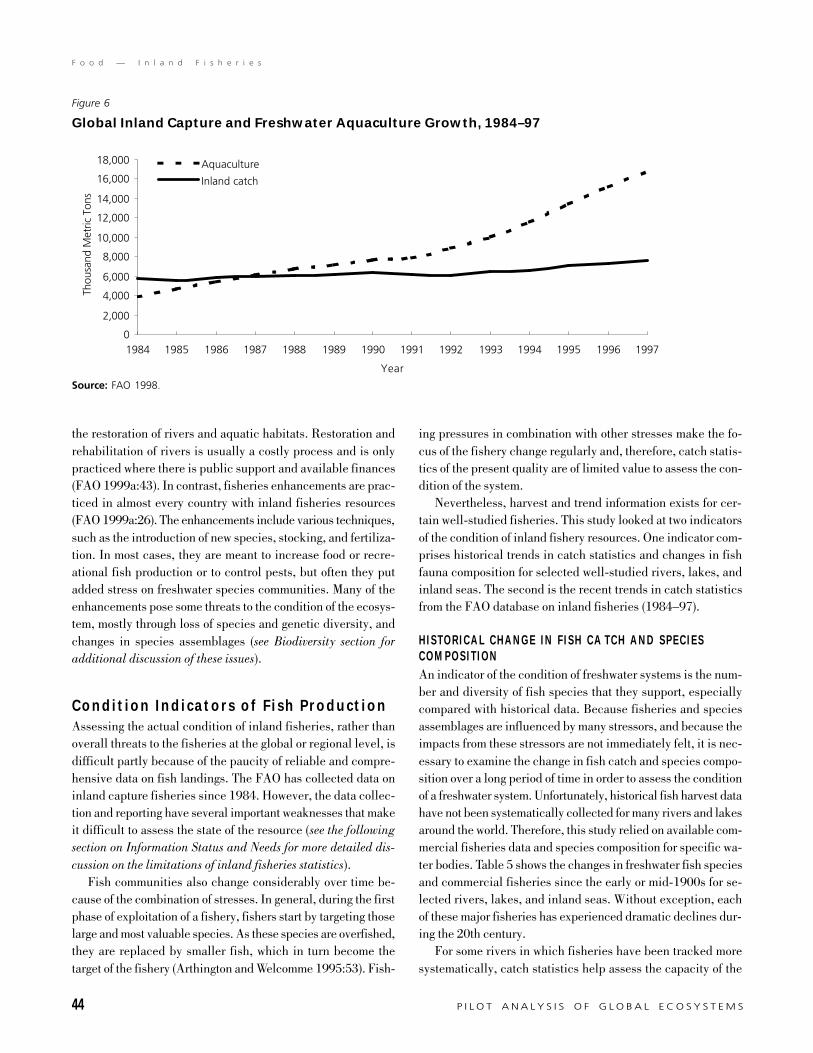
44 P I L O T A N A L Y S I S O F G L O B A L E C O S Y S T E M S
F o o d — I n l a n d F i s h e r i e s
the restoration of rivers and aquatic habitats. Restoration andrehabilitation of rivers is usually a costly process and is onlypracticed where there is public support and available finances(FAO 1999a:43). In contrast, fisheries enhancements are prac-ticed in almost every country with inland fisheries resources(FAO 1999a:26). The enhancements include various techniques,such as the introduction of new species, stocking, and fertiliza-tion. In most cases, they are meant to increase food or recre-ational fish production or to control pests, but often they putadded stress on freshwater species communities. Many of theenhancements pose some threats to the condition of the ecosys-tem, mostly through loss of species and genetic diversity, andchanges in species assemblages (see Biodiversity section foradditional discussion of these issues).
Condition Indicators of Fish ProductionAssessing the actual condition of inland fisheries, rather thanoverall threats to the fisheries at the global or regional level, isdifficult partly because of the paucity of reliable and compre-hensive data on fish landings. The FAO has collected data oninland capture fisheries since 1984. However, the data collec-tion and reporting have several important weaknesses that makeit difficult to assess the state of the resource (see the followingsection on Information Status and Needs for more detailed dis-cussion on the limitations of inland fisheries statistics).
Fish communities also change considerably over time be-cause of the combination of stresses. In general, during the firstphase of exploitation of a fishery, fishers start by targeting thoselarge and most valuable species. As these species are overfished,they are replaced by smaller fish, which in turn become thetarget of the fishery (Arthington and Welcomme 1995:53). Fish-
ing pressures in combination with other stresses make the fo-cus of the fishery change regularly and, therefore, catch statis-tics of the present quality are of limited value to assess the con-dition of the system.
Nevertheless, harvest and trend information exists for cer-tain well-studied fisheries. This study looked at two indicatorsof the condition of inland fishery resources. One indicator com-prises historical trends in catch statistics and changes in fishfauna composition for selected well-studied rivers, lakes, andinland seas. The second is the recent trends in catch statisticsfrom the FAO database on inland fisheries (1984–97).
HISTORICAL CHANGE IN FISH CA TCH AND SPECIESCOMPOSITIONAn indicator of the condition of freshwater systems is the num-ber and diversity of fish species that they support, especiallycompared with historical data. Because fisheries and speciesassemblages are influenced by many stressors, and because theimpacts from these stressors are not immediately felt, it is nec-essary to examine the change in fish catch and species compo-sition over a long period of time in order to assess the conditionof a freshwater system. Unfortunately, historical fish harvest datahave not been systematically collected for many rivers and lakesaround the world. Therefore, this study relied on available com-mercial fisheries data and species composition for specific wa-ter bodies. Table 5 shows the changes in freshwater fish speciesand commercial fisheries since the early or mid-1900s for se-lected rivers, lakes, and inland seas. Without exception, eachof these major fisheries has experienced dramatic declines dur-ing the 20th century.
For some rivers in which fisheries have been tracked moresystematically, catch statistics help assess the capacity of the
Figure 6
Global Inland Capture and Freshwater Aquaculture Growth, 1984–97
Source: FAO 1998.
0
2,000
4,000
6,000
8,000
10,000
12,000
14,000
16,000
18,000
1984 1985 1986 1987 1988 1989 1990 1991 1992 1993 1994 1995 1996 1997
Year
Thou
sand
Met
ric T
ons
Aquaculture
Inland catch
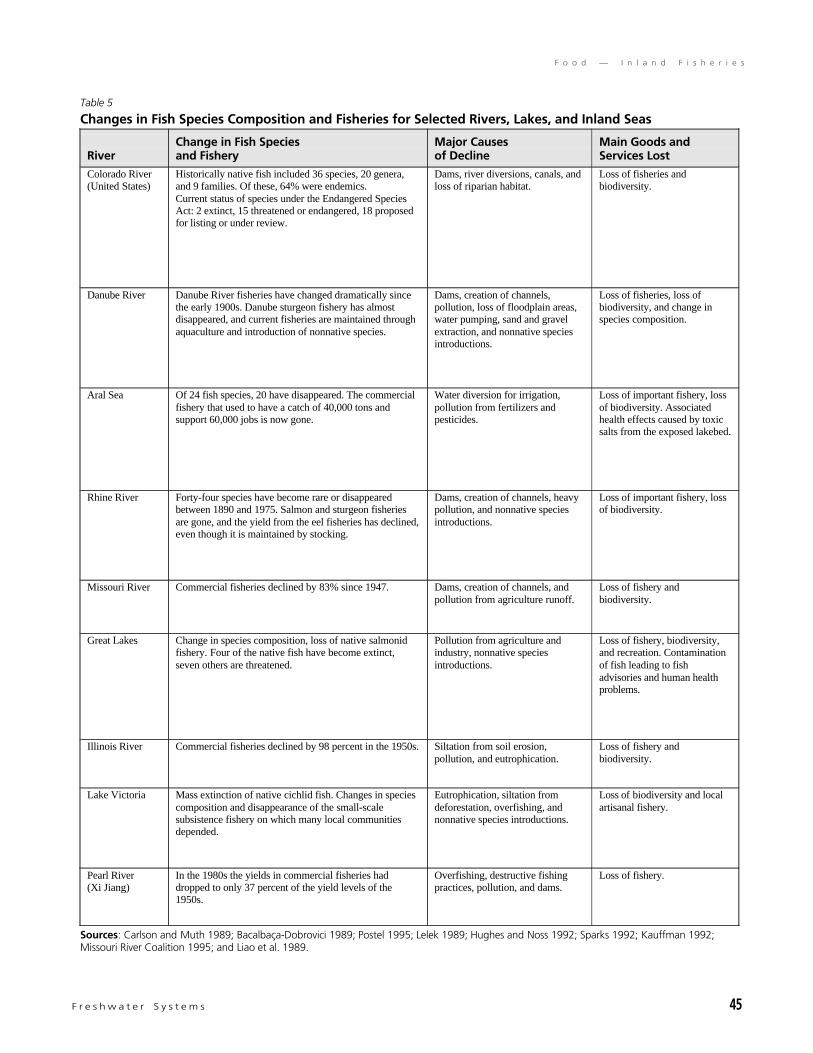
F r e s h w a t e r S y s t e m s 45
F o o d — I n l a n d F i s h e r i e s
Table 5
Changes in Fish Species Composition and Fisheries for Selected Rivers, Lakes, and Inland Seas
RiverChange in Fish Speciesand Fishery
Major Causesof Decline
Main Goods andServices Lost
Colorado River(United States)
Historically native fish included 36 species, 20 genera,and 9 families. Of these, 64% were endemics.Current status of species under the Endangered SpeciesAct: 2 extinct, 15 threatened or endangered, 18 proposedfor listing or under review.
Dams, river diversions, canals, andloss of riparian habitat.
Loss of fisheries andbiodiversity.
Danube River Danube River fisheries have changed dramatically sincethe early 1900s. Danube sturgeon fishery has almostdisappeared, and current fisheries are maintained throughaquaculture and introduction of nonnative species.
Dams, creation of channels,pollution, loss of floodplain areas,water pumping, sand and gravelextraction, and nonnative speciesintroductions.
Loss of fisheries, loss ofbiodiversity, and change inspecies composition.
Aral Sea Of 24 fish species, 20 have disappeared. The commercialfishery that used to have a catch of 40,000 tons andsupport 60,000 jobs is now gone.
Water diversion for irrigation,pollution from fertilizers andpesticides.
Loss of important fishery, lossof biodiversity. Associatedhealth effects caused by toxicsalts from the exposed lakebed.
Rhine River Forty-four species have become rare or disappearedbetween 1890 and 1975. Salmon and sturgeon fisheriesare gone, and the yield from the eel fisheries has declined,even though it is maintained by stocking.
Dams, creation of channels, heavypollution, and nonnative speciesintroductions.
Loss of important fishery, lossof biodiversity.
Missouri River Commercial fisheries declined by 83% since 1947. Dams, creation of channels, andpollution from agriculture runoff.
Loss of fishery andbiodiversity.
Great Lakes Change in species composition, loss of native salmonidfishery. Four of the native fish have become extinct,seven others are threatened.
Pollution from agriculture andindustry, nonnative speciesintroductions.
Loss of fishery, biodiversity,and recreation. Contaminationof fish leading to fishadvisories and human healthproblems.
Illinois River Commercial fisheries declined by 98 percent in the 1950s. Siltation from soil erosion,pollution, and eutrophication.
Loss of fishery andbiodiversity.
Lake Victoria Mass extinction of native cichlid fish. Changes in speciescomposition and disappearance of the small-scalesubsistence fishery on which many local communitiesdepended.
Eutrophication, siltation fromdeforestation, overfishing, andnonnative species introductions.
Loss of biodiversity and localartisanal fishery.
Pearl River(Xi Jiang)
In the 1980s the yields in commercial fisheries haddropped to only 37 percent of the yield levels of the1950s.
Overfishing, destructive fishingpractices, pollution, and dams.
Loss of fishery.
Sources: Carlson and Muth 1989; Bacalbaça-Dobrovici 1989; Postel 1995; Lelek 1989; Hughes and Noss 1992; Sparks 1992; Kauffman 1992;Missouri River Coalition 1995; and Liao et al. 1989.
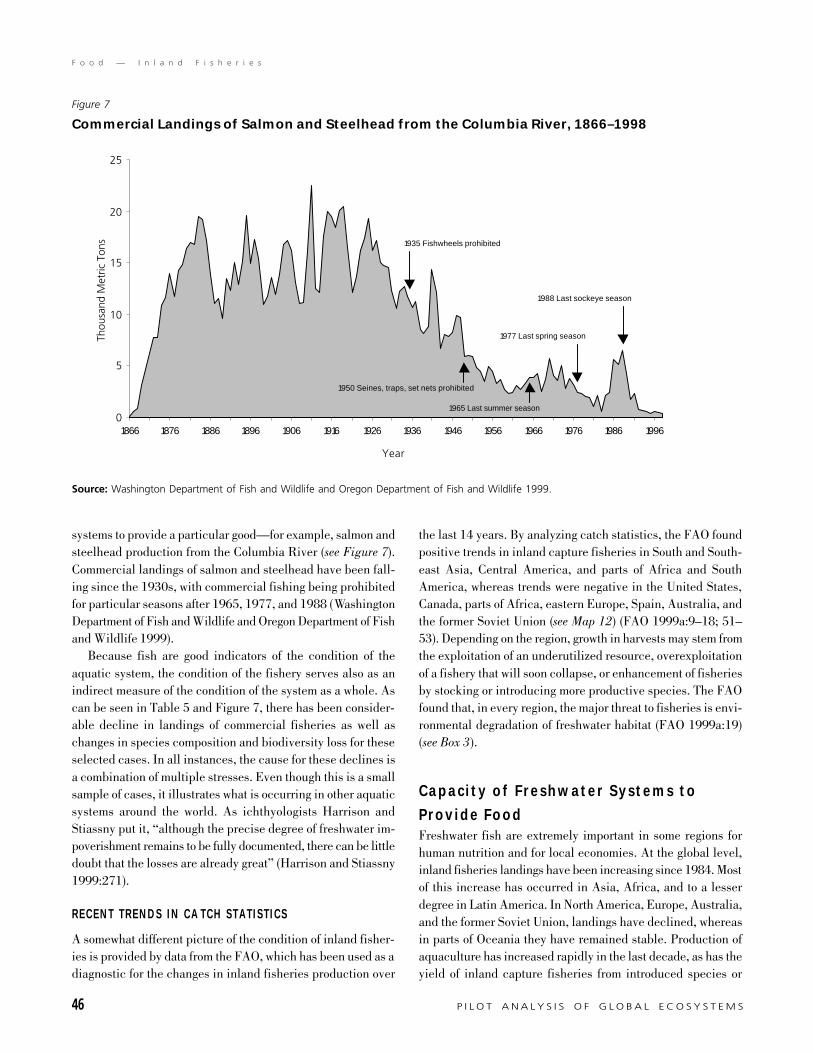
46 P I L O T A N A L Y S I S O F G L O B A L E C O S Y S T E M S
F o o d — I n l a n d F i s h e r i e s
systems to provide a particular good—for example, salmon andsteelhead production from the Columbia River (see Figure 7).Commercial landings of salmon and steelhead have been fall-ing since the 1930s, with commercial fishing being prohibitedfor particular seasons after 1965, 1977, and 1988 (WashingtonDepartment of Fish and Wildlife and Oregon Department of Fishand Wildlife 1999).
Because fish are good indicators of the condition of theaquatic system, the condition of the fishery serves also as anindirect measure of the condition of the system as a whole. Ascan be seen in Table 5 and Figure 7, there has been consider-able decline in landings of commercial fisheries as well aschanges in species composition and biodiversity loss for theseselected cases. In all instances, the cause for these declines isa combination of multiple stresses. Even though this is a smallsample of cases, it illustrates what is occurring in other aquaticsystems around the world. As ichthyologists Harrison andStiassny put it, “although the precise degree of freshwater im-poverishment remains to be fully documented, there can be littledoubt that the losses are already great” (Harrison and Stiassny1999:271).
RECENT TRENDS IN CA TCH STATISTICS
A somewhat different picture of the condition of inland fisher-ies is provided by data from the FAO, which has been used as adiagnostic for the changes in inland fisheries production over
the last 14 years. By analyzing catch statistics, the FAO foundpositive trends in inland capture fisheries in South and South-east Asia, Central America, and parts of Africa and SouthAmerica, whereas trends were negative in the United States,Canada, parts of Africa, eastern Europe, Spain, Australia, andthe former Soviet Union (see Map 12) (FAO 1999a:9–18; 51–53). Depending on the region, growth in harvests may stem fromthe exploitation of an underutilized resource, overexploitationof a fishery that will soon collapse, or enhancement of fisheriesby stocking or introducing more productive species. The FAOfound that, in every region, the major threat to fisheries is envi-ronmental degradation of freshwater habitat (FAO 1999a:19)(see Box 3).
Capacity of Freshwater Systems to
Provide FoodFreshwater fish are extremely important in some regions forhuman nutrition and for local economies. At the global level,inland fisheries landings have been increasing since 1984. Mostof this increase has occurred in Asia, Africa, and to a lesserdegree in Latin America. In North America, Europe, Australia,and the former Soviet Union, landings have declined, whereasin parts of Oceania they have remained stable. Production ofaquaculture has increased rapidly in the last decade, as has theyield of inland capture fisheries from introduced species or
Source: Washington Department of Fish and Wildlife and Oregon Department of Fish and Wildlife 1999.
Figure 7
Commercial Landings of Salmon and Steelhead from the Columbia River, 1866–1998
0
5
10
15
20
25
1866 1876 1886 1896 1906 1916 1926 1936 1946 1956 1966 1976 1986 1996
Year
Thou
sand
Met
ric T
ons 1935 Fishwheels prohibited
1988 Last sockeye season
1977 Last spring season
1950 Seines, traps, set nets prohibited
1965 Last summer season
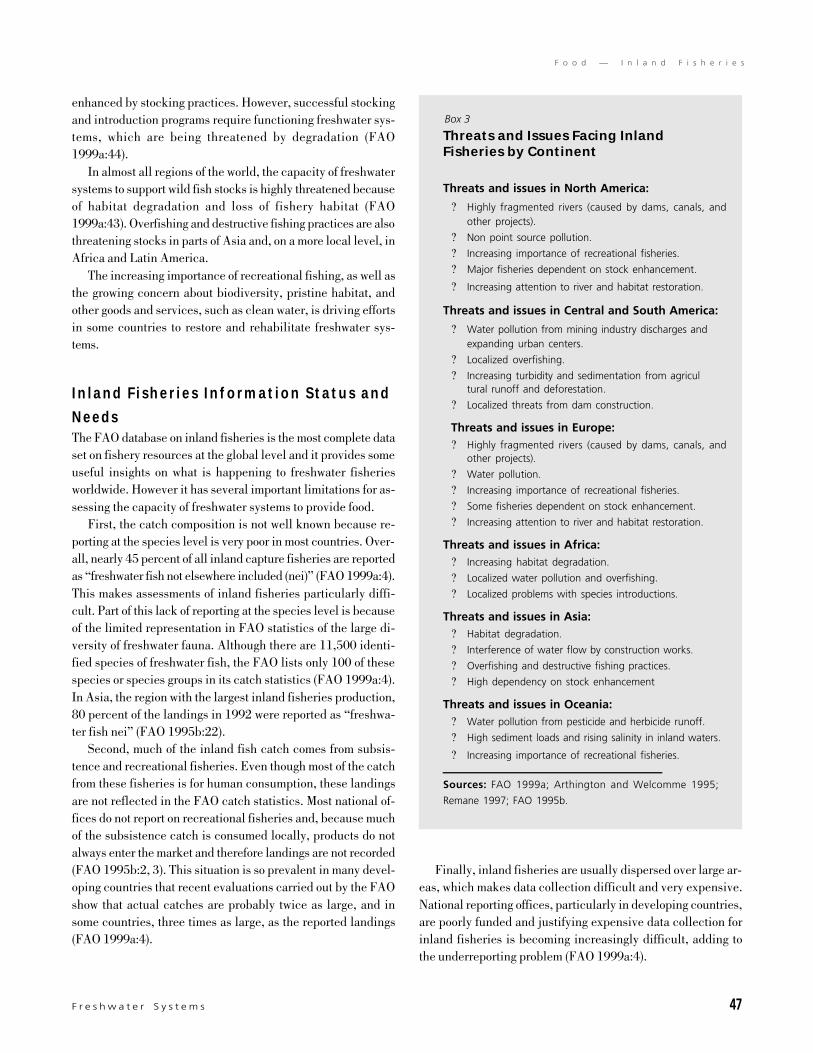
F r e s h w a t e r S y s t e m s 47
F o o d — I n l a n d F i s h e r i e s
enhanced by stocking practices. However, successful stockingand introduction programs require functioning freshwater sys-tems, which are being threatened by degradation (FAO1999a:44).
In almost all regions of the world, the capacity of freshwatersystems to support wild fish stocks is highly threatened becauseof habitat degradation and loss of fishery habitat (FAO1999a:43). Overfishing and destructive fishing practices are alsothreatening stocks in parts of Asia and, on a more local level, inAfrica and Latin America.
The increasing importance of recreational fishing, as well asthe growing concern about biodiversity, pristine habitat, andother goods and services, such as clean water, is driving effortsin some countries to restore and rehabilitate freshwater sys-tems.
Inland Fisheries Information Status and
NeedsThe FAO database on inland fisheries is the most complete dataset on fishery resources at the global level and it provides someuseful insights on what is happening to freshwater fisheriesworldwide. However it has several important limitations for as-sessing the capacity of freshwater systems to provide food.
First, the catch composition is not well known because re-porting at the species level is very poor in most countries. Over-all, nearly 45 percent of all inland capture fisheries are reportedas “freshwater fish not elsewhere included (nei)” (FAO 1999a:4).This makes assessments of inland fisheries particularly diffi-cult. Part of this lack of reporting at the species level is becauseof the limited representation in FAO statistics of the large di-versity of freshwater fauna. Although there are 11,500 identi-fied species of freshwater fish, the FAO lists only 100 of thesespecies or species groups in its catch statistics (FAO 1999a:4).In Asia, the region with the largest inland fisheries production,80 percent of the landings in 1992 were reported as “freshwa-ter fish nei” (FAO 1995b:22).
Second, much of the inland fish catch comes from subsis-tence and recreational fisheries. Even though most of the catchfrom these fisheries is for human consumption, these landingsare not reflected in the FAO catch statistics. Most national of-fices do not report on recreational fisheries and, because muchof the subsistence catch is consumed locally, products do notalways enter the market and therefore landings are not recorded(FAO 1995b:2, 3). This situation is so prevalent in many devel-oping countries that recent evaluations carried out by the FAOshow that actual catches are probably twice as large, and insome countries, three times as large, as the reported landings(FAO 1999a:4).
Box 3
Threats and Issues Facing InlandFisheries by Continent
Threats and issues in North America:
? Highly fragmented rivers (caused by dams, canals, andother projects).
? Non point source pollution.
? Increasing importance of recreational fisheries.
? Major fisheries dependent on stock enhancement.
? Increasing attention to river and habitat restoration.
Threats and issues in Central and South America:
? Water pollution from mining industry discharges andexpanding urban centers.
? Localized overfishing.
? Increasing turbidity and sedimentation from agricultural runoff and deforestation.
? Localized threats from dam construction.
Threats and issues in Europe:? Highly fragmented rivers (caused by dams, canals, and
other projects).
? Water pollution.
? Increasing importance of recreational fisheries.
? Some fisheries dependent on stock enhancement.
? Increasing attention to river and habitat restoration.
Threats and issues in Africa:? Increasing habitat degradation.
? Localized water pollution and overfishing.
? Localized problems with species introductions.
Threats and issues in Asia:? Habitat degradation.
? Interference of water flow by construction works.
? Overfishing and destructive fishing practices.
? High dependency on stock enhancement
Threats and issues in Oceania:? Water pollution from pesticide and herbicide runoff.
? High sediment loads and rising salinity in inland waters.
? Increasing importance of recreational fisheries.
Sources: FAO 1999a; Arthington and Welcomme 1995;
Remane 1997; FAO 1995b.
Finally, inland fisheries are usually dispersed over large ar-eas, which makes data collection difficult and very expensive.National reporting offices, particularly in developing countries,are poorly funded and justifying expensive data collection forinland fisheries is becoming increasingly difficult, adding tothe underreporting problem (FAO 1999a:4).
48 P I L O T A N A L Y S I S O F G L O B A L E C O S Y S T E M S
F o o d — I n l a n d F i s h e r i e s
To improve our capacity to assess the condition of aquaticsystems, catch statistics and trend analyses can be supplementedwith national-level information on market demand, land-usechange, and climatic factors. The FAO did this in its 1995 re-view, The State of Inland Capture Fisheries, and its fishery coun-try profiles, which provide a more in-depth analysis of the ca-pacity of freshwater systems in each region to sustain inlandcapture fish production.
There is an urgent need to improve the quality of the data oninland capture fisheries and those environmental and socio-economic factors that affect their sustainability. Reporting shouldbe at the species level, and ideally catch data should be col-lected and reported at the watershed or basin level (FAO1999a:4). National-level statistics do not provide the necessaryinformation to assess the condition of a particular body of wa-ter. This is especially true when a river or lake crosses interna-tional borders. Reporting at the watershed level could provide
better insight into the relationship between upstream activitiesand downstream effects, and these could be incorporated intomanagement plans.
Because the major threat to inland fisheries is environmen-tal degradation, information on land-use change, water quality,water withdrawals, and species introductions is critical for as-sessing the condition and potential of a particular fishery. Atpresent, these data are not collected at the watershed level, whichmakes their inclusion in analysis of fisheries resources diffi-cult.
Finally, data collection on recreational fisheries and fisheryenhancements, especially stocking and introduction programs,have to be incorporated in a systematic way into fisheries sta-tistics. The consequences of enhancement practices should alsobe assessed more closely to ensure that the integrity of the eco-system and its capacity to provide other goods and services ismaintained.
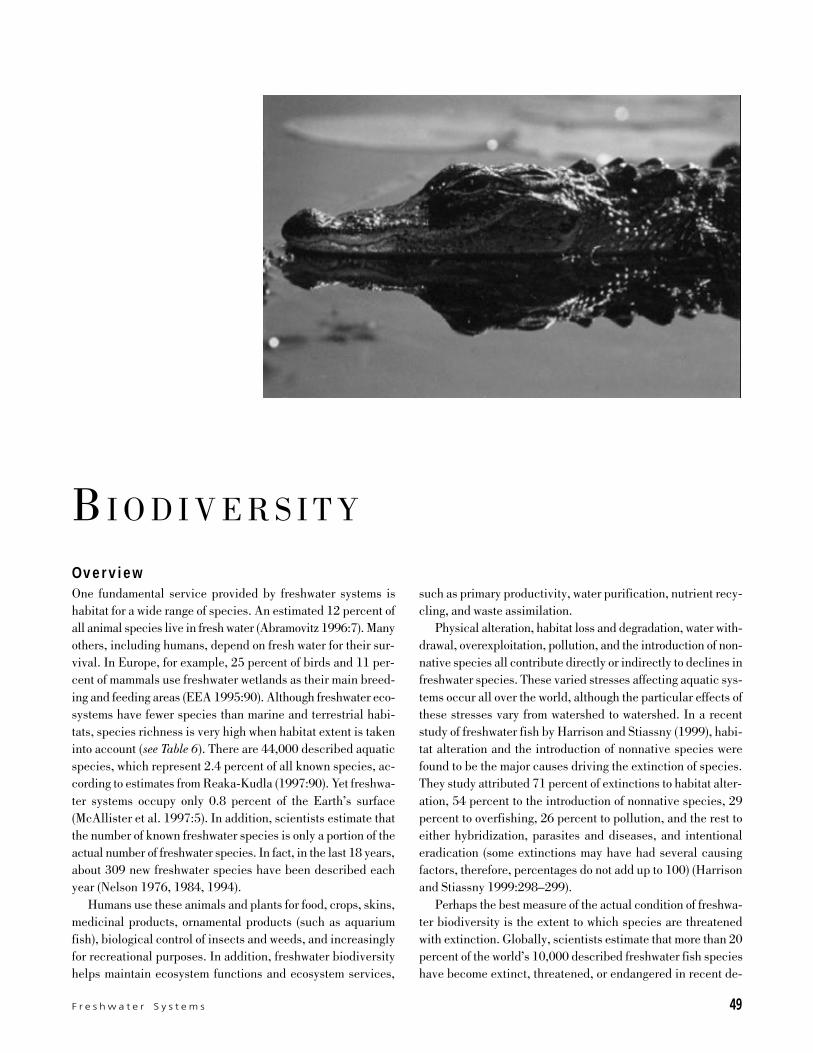
F r e s h w a t e r S y s t e m s 49
F o o d — I n l a n d F i s h e r i e s
B I O D I V E R S I T Y
such as primary productivity, water purification, nutrient recy-cling, and waste assimilation.
Physical alteration, habitat loss and degradation, water with-drawal, overexploitation, pollution, and the introduction of non-native species all contribute directly or indirectly to declines infreshwater species. These varied stresses affecting aquatic sys-tems occur all over the world, although the particular effects ofthese stresses vary from watershed to watershed. In a recentstudy of freshwater fish by Harrison and Stiassny (1999), habi-tat alteration and the introduction of nonnative species werefound to be the major causes driving the extinction of species.They study attributed 71 percent of extinctions to habitat alter-ation, 54 percent to the introduction of nonnative species, 29percent to overfishing, 26 percent to pollution, and the rest toeither hybridization, parasites and diseases, and intentionaleradication (some extinctions may have had several causingfactors, therefore, percentages do not add up to 100) (Harrisonand Stiassny 1999:298–299).
Perhaps the best measure of the actual condition of freshwa-ter biodiversity is the extent to which species are threatenedwith extinction. Globally, scientists estimate that more than 20percent of the world’s 10,000 described freshwater fish specieshave become extinct, threatened, or endangered in recent de-
OverviewOne fundamental service provided by freshwater systems ishabitat for a wide range of species. An estimated 12 percent ofall animal species live in fresh water (Abramovitz 1996:7). Manyothers, including humans, depend on fresh water for their sur-vival. In Europe, for example, 25 percent of birds and 11 per-cent of mammals use freshwater wetlands as their main breed-ing and feeding areas (EEA 1995:90). Although freshwater eco-systems have fewer species than marine and terrestrial habi-tats, species richness is very high when habitat extent is takeninto account (see Table 6). There are 44,000 described aquaticspecies, which represent 2.4 percent of all known species, ac-cording to estimates from Reaka-Kudla (1997:90). Yet freshwa-ter systems occupy only 0.8 percent of the Earth’s surface(McAllister et al. 1997:5). In addition, scientists estimate thatthe number of known freshwater species is only a portion of theactual number of freshwater species. In fact, in the last 18 years,about 309 new freshwater species have been described eachyear (Nelson 1976, 1984, 1994).
Humans use these animals and plants for food, crops, skins,medicinal products, ornamental products (such as aquariumfish), biological control of insects and weeds, and increasinglyfor recreational purposes. In addition, freshwater biodiversityhelps maintain ecosystem functions and ecosystem services,
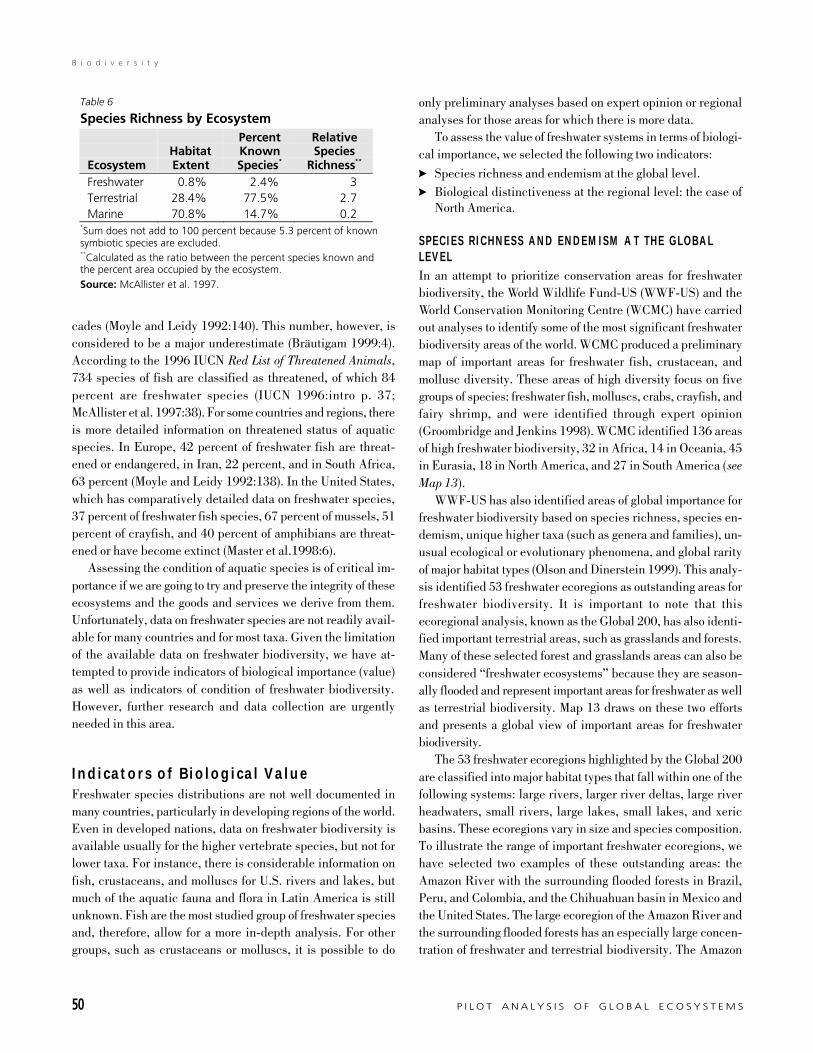
50 P I L O T A N A L Y S I S O F G L O B A L E C O S Y S T E M S
B i o d i v e r s i t y
cades (Moyle and Leidy 1992:140). This number, however, isconsidered to be a major underestimate (Bräutigam 1999:4).According to the 1996 IUCN Red List of Threatened Animals,734 species of fish are classified as threatened, of which 84percent are freshwater species (IUCN 1996:intro p. 37;McAllister et al. 1997:38). For some countries and regions, thereis more detailed information on threatened status of aquaticspecies. In Europe, 42 percent of freshwater fish are threat-ened or endangered, in Iran, 22 percent, and in South Africa,63 percent (Moyle and Leidy 1992:138). In the United States,which has comparatively detailed data on freshwater species,37 percent of freshwater fish species, 67 percent of mussels, 51percent of crayfish, and 40 percent of amphibians are threat-ened or have become extinct (Master et al.1998:6).
Assessing the condition of aquatic species is of critical im-portance if we are going to try and preserve the integrity of theseecosystems and the goods and services we derive from them.Unfortunately, data on freshwater species are not readily avail-able for many countries and for most taxa. Given the limitationof the available data on freshwater biodiversity, we have at-tempted to provide indicators of biological importance (value)as well as indicators of condition of freshwater biodiversity.However, further research and data collection are urgentlyneeded in this area.
Indicators of Biological ValueFreshwater species distributions are not well documented inmany countries, particularly in developing regions of the world.Even in developed nations, data on freshwater biodiversity isavailable usually for the higher vertebrate species, but not forlower taxa. For instance, there is considerable information onfish, crustaceans, and molluscs for U.S. rivers and lakes, butmuch of the aquatic fauna and flora in Latin America is stillunknown. Fish are the most studied group of freshwater speciesand, therefore, allow for a more in-depth analysis. For othergroups, such as crustaceans or molluscs, it is possible to do
only preliminary analyses based on expert opinion or regionalanalyses for those areas for which there is more data.
To assess the value of freshwater systems in terms of biologi-cal importance, we selected the following two indicators:
? Species richness and endemism at the global level.? Biological distinctiveness at the regional level: the case of
North America.
SPECIES R ICHNESS AND ENDEMISM A T THE GLOBALLEVELIn an attempt to prioritize conservation areas for freshwaterbiodiversity, the World Wildlife Fund-US (WWF-US) and theWorld Conservation Monitoring Centre (WCMC) have carriedout analyses to identify some of the most significant freshwaterbiodiversity areas of the world. WCMC produced a preliminarymap of important areas for freshwater fish, crustacean, andmollusc diversity. These areas of high diversity focus on fivegroups of species: freshwater fish, molluscs, crabs, crayfish, andfairy shrimp, and were identified through expert opinion(Groombridge and Jenkins 1998). WCMC identified 136 areasof high freshwater biodiversity, 32 in Africa, 14 in Oceania, 45in Eurasia, 18 in North America, and 27 in South America (seeMap 13).
WWF-US has also identified areas of global importance forfreshwater biodiversity based on species richness, species en-demism, unique higher taxa (such as genera and families), un-usual ecological or evolutionary phenomena, and global rarityof major habitat types (Olson and Dinerstein 1999). This analy-sis identified 53 freshwater ecoregions as outstanding areas forfreshwater biodiversity. It is important to note that thisecoregional analysis, known as the Global 200, has also identi-fied important terrestrial areas, such as grasslands and forests.Many of these selected forest and grasslands areas can also beconsidered “freshwater ecosystems” because they are season-ally flooded and represent important areas for freshwater as wellas terrestrial biodiversity. Map 13 draws on these two effortsand presents a global view of important areas for freshwaterbiodiversity.
The 53 freshwater ecoregions highlighted by the Global 200are classified into major habitat types that fall within one of thefollowing systems: large rivers, larger river deltas, large riverheadwaters, small rivers, large lakes, small lakes, and xericbasins. These ecoregions vary in size and species composition.To illustrate the range of important freshwater ecoregions, wehave selected two examples of these outstanding areas: theAmazon River with the surrounding flooded forests in Brazil,Peru, and Colombia, and the Chihuahuan basin in Mexico andthe United States. The large ecoregion of the Amazon River andthe surrounding flooded forests has an especially large concen-tration of freshwater and terrestrial biodiversity. The Amazon
Table 6
Species Richness by Ecosystem
EcosystemHabitatExtent
PercentKnownSpecies*
RelativeSpecies
Richness**
Freshwater 0.8% 2.4% 3Terrestrial 28.4% 77.5% 2.7Marine 70.8% 14.7% 0.2
*Sum does not add to 100 percent because 5.3 percent of knownsymbiotic species are excluded.**Calculated as the ratio between the percent species known andthe percent area occupied by the ecosystem.
Source: McAllister et al. 1997.
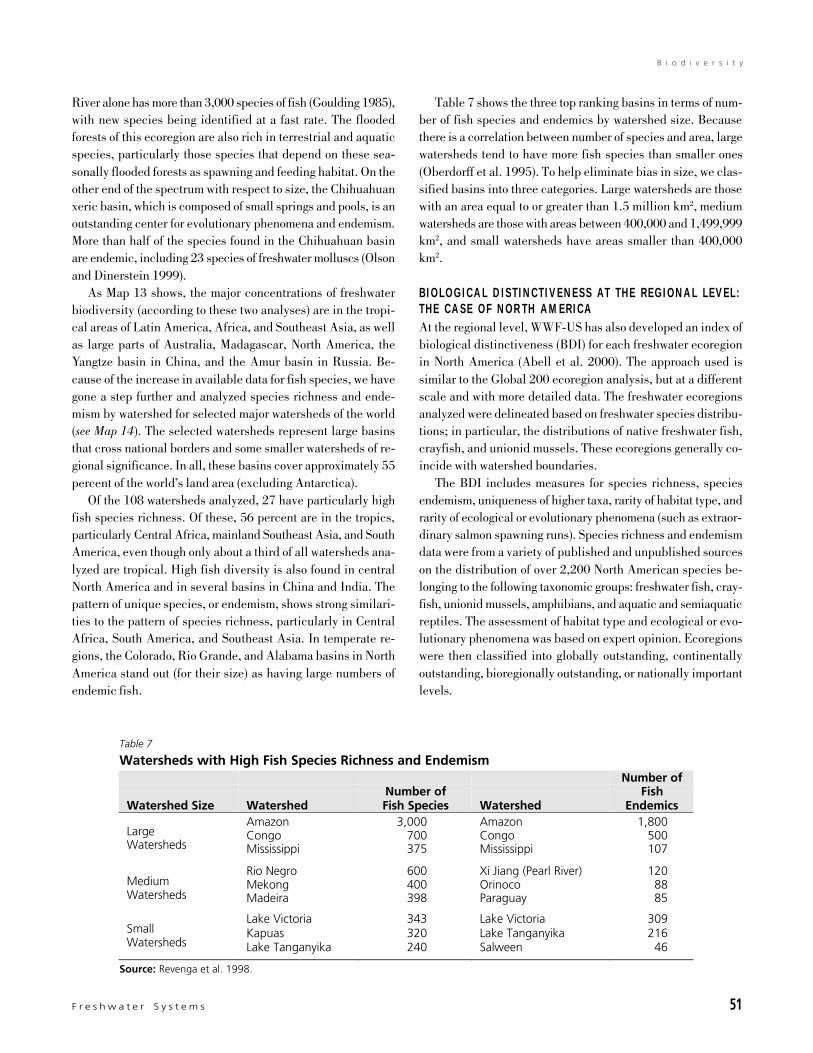
F r e s h w a t e r S y s t e m s 51
B i o d i v e r s i t y
River alone has more than 3,000 species of fish (Goulding 1985),with new species being identified at a fast rate. The floodedforests of this ecoregion are also rich in terrestrial and aquaticspecies, particularly those species that depend on these sea-sonally flooded forests as spawning and feeding habitat. On theother end of the spectrum with respect to size, the Chihuahuanxeric basin, which is composed of small springs and pools, is anoutstanding center for evolutionary phenomena and endemism.More than half of the species found in the Chihuahuan basinare endemic, including 23 species of freshwater molluscs (Olsonand Dinerstein 1999).
As Map 13 shows, the major concentrations of freshwaterbiodiversity (according to these two analyses) are in the tropi-cal areas of Latin America, Africa, and Southeast Asia, as wellas large parts of Australia, Madagascar, North America, theYangtze basin in China, and the Amur basin in Russia. Be-cause of the increase in available data for fish species, we havegone a step further and analyzed species richness and ende-mism by watershed for selected major watersheds of the world(see Map 14). The selected watersheds represent large basinsthat cross national borders and some smaller watersheds of re-gional significance. In all, these basins cover approximately 55percent of the world’s land area (excluding Antarctica).
Of the 108 watersheds analyzed, 27 have particularly highfish species richness. Of these, 56 percent are in the tropics,particularly Central Africa, mainland Southeast Asia, and SouthAmerica, even though only about a third of all watersheds ana-lyzed are tropical. High fish diversity is also found in centralNorth America and in several basins in China and India. Thepattern of unique species, or endemism, shows strong similari-ties to the pattern of species richness, particularly in CentralAfrica, South America, and Southeast Asia. In temperate re-gions, the Colorado, Rio Grande, and Alabama basins in NorthAmerica stand out (for their size) as having large numbers ofendemic fish.
Table 7 shows the three top ranking basins in terms of num-ber of fish species and endemics by watershed size. Becausethere is a correlation between number of species and area, largewatersheds tend to have more fish species than smaller ones(Oberdorff et al. 1995). To help eliminate bias in size, we clas-sified basins into three categories. Large watersheds are thosewith an area equal to or greater than 1.5 million km2, mediumwatersheds are those with areas between 400,000 and 1,499,999km2, and small watersheds have areas smaller than 400,000km2.
BIOLOGICAL DIST INCTIVENESS AT THE REGIONAL LEVEL:THE CASE OF NOR TH AMERICAAt the regional level, WWF-US has also developed an index ofbiological distinctiveness (BDI) for each freshwater ecoregionin North America (Abell et al. 2000). The approach used issimilar to the Global 200 ecoregion analysis, but at a differentscale and with more detailed data. The freshwater ecoregionsanalyzed were delineated based on freshwater species distribu-tions; in particular, the distributions of native freshwater fish,crayfish, and unionid mussels. These ecoregions generally co-incide with watershed boundaries.
The BDI includes measures for species richness, speciesendemism, uniqueness of higher taxa, rarity of habitat type, andrarity of ecological or evolutionary phenomena (such as extraor-dinary salmon spawning runs). Species richness and endemismdata were from a variety of published and unpublished sourceson the distribution of over 2,200 North American species be-longing to the following taxonomic groups: freshwater fish, cray-fish, unionid mussels, amphibians, and aquatic and semiaquaticreptiles. The assessment of habitat type and ecological or evo-lutionary phenomena was based on expert opinion. Ecoregionswere then classified into globally outstanding, continentallyoutstanding, bioregionally outstanding, or nationally importantlevels.
Table 7
Watersheds with High Fish Species Richness and Endemism
Watershed Size WatershedNumber ofFish Species Watershed
Number ofFish
EndemicsAmazon 3,000 Amazon 1,800Congo 700 Congo 500Large
Watersheds Mississippi 375 Mississippi 107
Rio Negro 600 Xi Jiang (Pearl River) 120Mekong 400 Orinoco 88Medium
Watersheds Madeira 398 Paraguay 85
Lake Victoria 343 Lake Victoria 309Kapuas 320 Lake Tanganyika 216Small
Watersheds Lake Tanganyika 240 Salween 46
Source: Revenga et al. 1998.
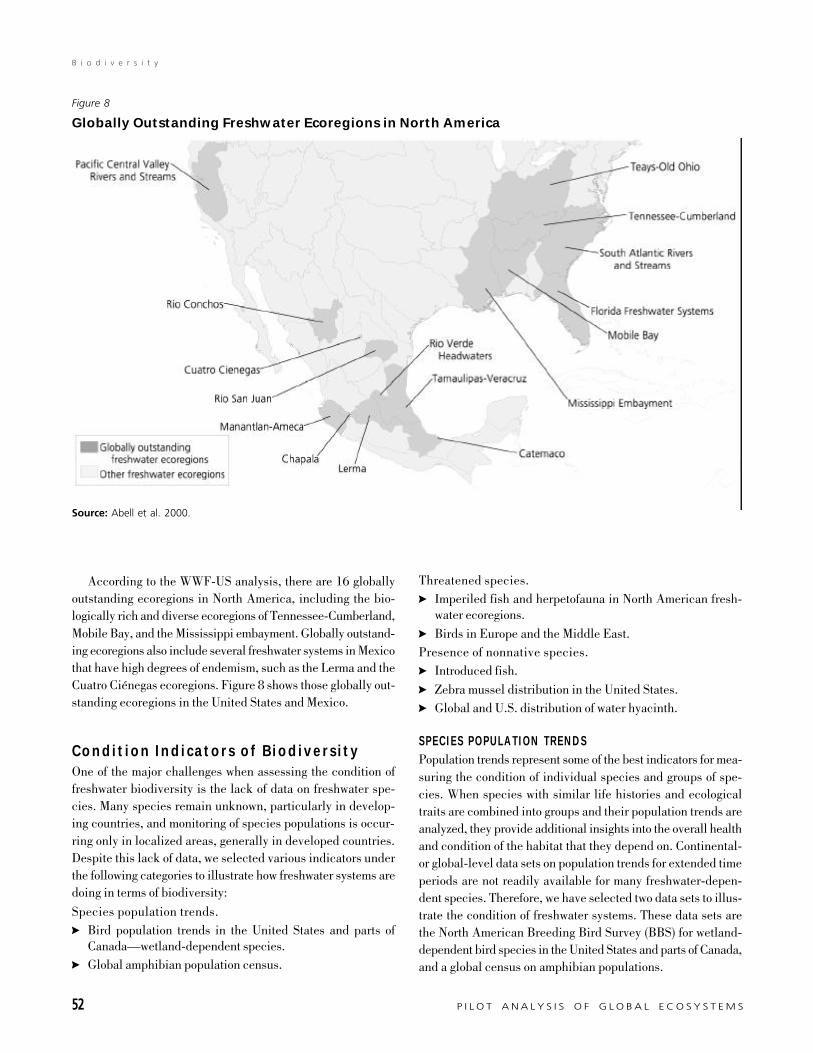
52 P I L O T A N A L Y S I S O F G L O B A L E C O S Y S T E M S
B i o d i v e r s i t y
According to the WWF-US analysis, there are 16 globallyoutstanding ecoregions in North America, including the bio-logically rich and diverse ecoregions of Tennessee-Cumberland,Mobile Bay, and the Mississippi embayment. Globally outstand-ing ecoregions also include several freshwater systems in Mexicothat have high degrees of endemism, such as the Lerma and theCuatro Ciénegas ecoregions. Figure 8 shows those globally out-standing ecoregions in the United States and Mexico.
Condition Indicators of BiodiversityOne of the major challenges when assessing the condition offreshwater biodiversity is the lack of data on freshwater spe-cies. Many species remain unknown, particularly in develop-ing countries, and monitoring of species populations is occur-ring only in localized areas, generally in developed countries.Despite this lack of data, we selected various indicators underthe following categories to illustrate how freshwater systems aredoing in terms of biodiversity:
Species population trends.? Bird population trends in the United States and parts of
Canada—wetland-dependent species.? Global amphibian population census.
Threatened species.? Imperiled fish and herpetofauna in North American fresh-
water ecoregions.
? Birds in Europe and the Middle East.Presence of nonnative species.? Introduced fish.
? Zebra mussel distribution in the United States.? Global and U.S. distribution of water hyacinth.
SPECIES POPULATION TRENDSPopulation trends represent some of the best indicators for mea-suring the condition of individual species and groups of spe-cies. When species with similar life histories and ecologicaltraits are combined into groups and their population trends areanalyzed, they provide additional insights into the overall healthand condition of the habitat that they depend on. Continental-or global-level data sets on population trends for extended timeperiods are not readily available for many freshwater-depen-dent species. Therefore, we have selected two data sets to illus-trate the condition of freshwater systems. These data sets arethe North American Breeding Bird Survey (BBS) for wetland-dependent bird species in the United States and parts of Canada,and a global census on amphibian populations.
Figure 8
Globally Outstanding Freshwater Ecoregions in North America
Source: Abell et al. 2000.
F r e s h w a t e r S y s t e m s 53
B i o d i v e r s i t y
Bird population trends in the United States and partsof CanadaIn 1966, the U.S. Department of the Interior launched the BBS.This survey is now being coordinated by the Patuxent Environ-mental Science Center in Maryland, and it covers the continen-tal United States and parts of Canada. The survey is based onobservations of breeding birds along more than 3,700 surveyroutes, each approximately 40 kilometers in length (BBSWebsite: http://www.mbr.nbs.gov/bbs). BBS data are extremelyuseful for monitoring the distribution and trends of particularspecies over time, and they provide one of the few such avail-able continental-level data sets.
The Patuxent Environmental Science Center has groupedthe more than 420 species of North American breeding birdsinto five breeding habitat groups: grassland, wetland-open wa-ter, successional-scrub, woodland, and urban species (Sauer etal. 1997). The wetland-open water group, discussed here, in-cludes 86 species that depend on wetlands and open water,such as the sandhill crane, northern pintail, canvasback, andking rail. In terms of species richness, the BBS data show thatfor the period of 1982 to 1996, the largest numbers of wetlandspecies (more than 60) are found in the Canadian provinces ofSaskatchewan and Alberta, and in North Dakota and Montanain the United States. Similar numbers of species also occur lo-cally in Florida, eastern Texas, southern Louisiana, northernCalifornia, and Minnesota. The fewest numbers of wetland spe-cies (less than five species), as is expected, are found in morearid areas along the Mexican-U.S. border from Texas to Ari-zona, as well as parts of southern Nevada, California, and Utah.
The population trend, covering the period from 1966 to 1998,reflects both increases and declines in the populations of wet-land species across the United States and Canada. Wetland birdsseem to be increasing from the Rocky Mountain region to thePacific Northwest, the Great Lakes region, and in the centralUnited States—especially in Texas— and from Louisiana northto Minnesota. Increases also have been recorded in areas ofCalifornia and Manitoba. Declining trends prevail in easternNorth America from Kentucky and Virginia south to Florida,parts of Quebec and Ontario, and the “prairie pothole” region—especially North Dakota. Significant declines are also noted inthe southwestern states.
In the entire survey area, 41 percent of wetland species hada significant positive trend, while 15 percent had a significantnegative trend. Among those species with negative populationtrends, the most significant declines were noted for the rustyblackbird, mottled duck, common tern, northern pintail, kingrail, horned grebe, little blue heron, and herring gull (BBSWebsite: http://www.mbr.nbs.gov/bbs).
According to the BBS data, nearly 66 percent of wetlandbird species have increasing population trends, the highest per-centage of increasing species of any group of bird species (BBS
Website: http://www.mbr.nbs.gov/bbs). However, the PatuxentEnvironmental Science Center recommends that these trendestimates be “viewed with considerable caution because wet-land birds tend to be very poorly represented along most BBSroutes.” It points out that the preferred habitat of most of thewetland birds is not found along the BBS routes and that wet-land species tend to be “very secretive and poorly censused bythe BBS methodology” (BBS Website: http://www.mbr.nbs.gov/bbs).
Some of these species are monitored through other nationalsurveys, such as waterfowl and other game species, which aresurveyed by the Office of Migratory Bird Management of the U.S. Fish and Wildlife Service and the Canadian Wildlife Ser-vice. Other species groups, such as marsh-breeding birds, arepoorly represented in the BBS and other existing monitoringprograms because they tend to inhabit areas that are not readilyaccessible. According to the Marshbird Monitoring Program,“little is known about the abundance, population trends, ormanagement needs of marsh bird species”; however, certainspecies such as the black and yellow rails and American bit-terns are of concern because “they are thought to be rare ordeclining” (Marshbird Monitoring Website: http://www.mp1-pwrc.usgs.gov/marshbird/).
Global amphibian population censusBecause of their combined terrestrial and aquatic lifecycle, di-verse reproductive modes, and permeable skin, amphibians aregood indicators of the health of ecosystems (Pelley 1998). Theyare more susceptible to climate change and pollution and usu-ally act as “early warning systems” when changes in the envi-ronment are occurring.
Amphibian populations have declined or even become ex-tinct in the past 50 years (DAPTF Website: http://www2.open.ac.uk/Ecology/J_Baker/JBtxt.htm). Many of thesedeclines were due to habitat alteration, such as the drainage ofwetlands, or to introduced predators and pollution. But over thepast 20 years, scientists throughout the globe have documenteddramatic declines or “atypical” fluctuations of amphibian popu-lations. These declines have occurred even in apparently pris-tine habitats, such as national parks and nature reserves wherehuman activity is very limited (Houlahan et al. 2000:752; Pelley1998; Carey et al. 2000:1). The evidence of these declines ismostly anecdotal, mainly because of a lack of long-term popu-lation data. However, because of the rapid disappearance ofamphibians in many parts of the world, IUCN’s Species Sur-vival Commission in 1991 launched the Declining Amphib-ian Populations Task Force (DAPTF). DAPTF is a networkof more than 3,000 scientists working in 90 countries to“determine the nature, extent and causes of declines of am-phibians throughout the world and promote means by whichdeclines can be halted or reversed” (DAPTF Website: http://
54 P I L O T A N A L Y S I S O F G L O B A L E C O S Y S T E M S
B i o d i v e r s i t y
www2.open.ac.uk/Ecology /J_Baker/JBtxt.htm). Map 15 pre-sents the first results of DAPTF.
These results show that there have been marked declines ineastern Australia, southeast Brazil, Central America, and athigher altitudes in the United States and Canada. More com-plete data for Australia show that in the last 20 years, 13 per-cent of the 208 native amphibian species have been classifiedas threatened or vulnerable—with almost 8 species consideredto be probably extinct (Tyler 1997). In Costa Rica, 20 of the 50amphibian species that were found in a 30 km2 study area ofthe Monteverde Cloud Forests Preserve have not been seen since1990 (Pounds et al. 1997).
This global trend in amphibian populations is confirmed byanother recently published study by Houlahan et al. (2000).The study analyzed 936 population data sets from 37 countriesand concluded that amphibian populations in North Americaand western Europe declined by 15 percent each year for the1960–66 period and 2 percent per year for the 1966–97 pe-riod. It should be noted that the sample size for the earlier yearsis relatively small (Houlahan et al. 2000:753). Because the datasets used in this study were mostly for northern latitudes, popu-lation declines for South America, Africa, and Australia werenot assessed (Houlahan et al. 2000:753).
Although there is considerable uncertainty in determiningwhether these phenomena are caused entirely by anthropogenicchanges in the environment alone, there is a general agreementamong experts that population declines are caused by a combi-nation of environmental factors acting synergistically. Thesefactors include the following: an increased exposure to ultra-violet radiation resulting from the thinning of the stratosphericozone layer; chemical pollution from pesticides, fertilizers, andherbicides; acid rain; pathogens; introduction of predators; andglobal climate change. Because of the wide range of factors thatare possibly affecting amphibians worldwide, population de-clines have been interpreted as a symptom of the general envi-ronmental degradation (Carey et al. 2000; Lips 1998; Pelley1998; DAPTF Website: http://www2.open.ac.uk/Ecology/J_Baker/JBtxt.htm).
THREATENED SPECIES
Species threat-status also represents a measure of the condi-tion of a particular ecosystem. For example, if a large percent-age of species in a particular river basin is highly threatened, itis likely that this risk is correlated to several factors affectingthe condition of that particular basin. Information on the statusof most freshwater species is not well known for many regionsof the world, but there are some data sets that allow us to look atthe condition of some of these groups. In particular, we haveselected the status of fish and herpetofauna in theUnited Statesand the status of wetland-dependent birds in Europe and the
Middle East. The indicator selection was based on data avail-ability.
Imperiled fish and herpetofauna for North Americanfreshwater ecoregionsData on imperiled fish and herpetofauna for North America wereaggregated into freshwater ecoregions by the WWF-US as partof its North America conservation assessment work on freshwa-ter ecoregions (Abell et al. 2000). Imperiled species are thosethat are considered endangered, threatened, or vulnerable (Abellet al. 2000:75). The original data for the United States andCanada are from The Nature Conservancy’s Natural Heritagedatabase as of 1997. Additional fish data are from Williams etal. (1989). The data for Mexico came from the Comisión Nacionalpara el Conocimiento y Uso de la Biodiversidad(CONABIO)(1998) and Gonzales et al. (1995).
The analysis of the data in Map 16 show that in the majorityof the western ecoregions more than 10 percent of fish speciesare imperiled. In 11 ecoregions more than 25 percent of thefish species are at risk, and in 3 ecoregions— Death Valley,Vegas-Virgin, and the Rio Verde headwaters —more than 50percent of the fish species are classified as endangered, threat-ened, or vulnerable. The Vegas-Virgin ecoregion has the high-est number of fish species at risk: 11 species, or 64 percent ofits fish fauna.
For herpetofauna, the imperilment level shows a similar pat-tern as that of fish, with the western United States and Mexicanecoregions having more imperiled species (see Map 16). In threeecoregions, Death Valley, Vegas-Virgin, and Rio Lerma, morethan 25 percent of the herpetofauna species are at risk. In RioLerma, 31 of 62 species are imperiled.
Birds in Europe and the Middle EastBirds can also be useful indicators for measuring the biologicalvalue and condition of freshwater systems. In Europe, 20 per-cent of regularly occurring bird species are dependent on in-land wetlands. Of all bird species with “unfavorable conserva-tion status” in Europe—those that are categorized as endan-gered, vulnerable, rare, or declining—30 percent are inlandwetland-dependent species (Tucker and Evans 1997:133). In-land wetlands in Europe are also the major habitat for eightglobally threatened species of birds, including the slender-billedcurlew—one of the world’s most threatened bird species andclassified as critically endangered by IUCN (Collar et al.1994:85). The major threat to these populations throughoutEurope is loss of wetland habitat.
In the Middle East, BirdLife International has identified 391Important Bird Areas (IBA). IBAs include areas that supportimportant concentrations of bird species globally or regionally,areas with important threatened bird species, or sites that rep-resent unique restricted habitats of importance to birds (Evans
F r e s h w a t e r S y s t e m s 55
B i o d i v e r s i t y
1994:20–27, 31). Wetlands are the main habitat type for theIBAs in the Middle East. Half of the 391 IBAs are wetlands, athird of which are coastal wetlands and the rest classified asnonmarine wetlands (Evans 1994:31). Even though wetlandsare a critical habitat for bird species in this region, 78 percentor 153 IBAs with nonmarine wetlands as their principal habitatare unprotected and only 6 percent have a high degree of legalprotection in the region. Wetland IBAs are also the most threat-ened, with 70 sites classified as moderately to highly threat-ened, 63 sites classified as having low threat, and 24 sites forwhich the threat has not been quantified (BirdLife International1999). The major threat to these areas is wetland loss or modi-fication.
In Europe, BirdLife International has identified 3,619 IBAsin 51 countries that occupy an area of 931,700 km2, of which69 percent contain wetland habitats. Of these IBAs with wet-lands, 57 percent have standing freshwater habitats, such aslakes, 44 percent have riparian habitat surrounding rivers andstreams, and 36 percent have a combination of fen, mire, bog,and spring habitats (some IBAs may contain two or more ofthese habitat types) (Heath and Evans 2000:43). Overall, 544IBAs in this region are threatened by drainage, 157 of whichare highly threatened (Heath and Evans 2000:56).
PRESENCE OF NONNATIVE SPECIESThe introduction of nonnative species is the second-leadingcause, after habitat degradation, of species extinction in fresh-water systems (Hill et al. 1997:1). Exotic species affect nativefaunas through predation, competition, disruption of food webs,and the introduction of diseases. The spread of exotic species isa global phenomenon, one that is increasing with the spread ofaquaculture, shipping, and global commerce. Introduced spe-cies, both intentional and accidental, include a variety of spe-cies groups from fish and higher plants (such as water hyacinth)to invertebrates and microscopic plants (such as, dinoflagel-lates). Worldwide, twothirds of the freshwater species introducedinto the tropics and more than 50 percent of those introduced totemperate regions have become established (Welcomme1988:29).
Species introduction can have serious economic and eco-logical consequences for freshwater ecosystems. While the ef-fect of nonnative species is worldwide in scope, the majority ofthe information about them is largely anecdotal or comes fromstudies and data collection on species introduced to developedcountries, such as the United States. Because comprehensivedata on nonnative species and their effects on biodiversity andecosystem condition are not available at the global or regionallevel, we have selected the following cases as indicators of fresh-water ecosystem condition: introduced fish, the zebra mussel,and the water hyacinth.
Introduced fishNonnative fish introductions are common in most parts of theworld, and they are an increasingly important component ofaquaculture (FAO 1999a:25–26). Introductions are usually doneto enhance food production and recreational fisheries, or to con-trol pests such as mosquitoes and aquatic weeds. Introducedfish, for example, account for 96.2 percent of fish production inSouth America and 84.7 percent in Oceania (Garibaldi andBartley 1998).
The introduction of nonnative fish, however, has its ecologi-cal costs. A survey of 31 studies of fish introductions in Eu-rope, North America, Australia, and New Zealand found that,in 77 percent of the cases, native fish populations were reducedor eliminated following the introduction of nonnative fish. In 69percent of the cases, the decline followed the introduction of asingle fish species, with salmonids responsible for the declineof native species in half of these cases (Ross 1991:363). In NorthAmerica, there have been recorded extinctions of 27 speciesand 13 subspecies of fish in the past 100 years. The introduc-tion of alien species was found to be a contributing factor in 68percent of these extinctions, although in almost every case therewere multiple stresses contributing to each extinction, such ashabitat alteration, chemical pollution, hybridization, and over-harvesting (Miller et al. 1989:22).
Accidental introductions can also have devastating effectson indigenous fish and the fisheries they support, as happenedwith the sea lamprey (Petromyzon marinus) in the Great Lakesof the United States. This fish first appeared in Lake Ontario in1835 and by the 1940s had extended its range into Lake Supe-rior. Preying on native freshwater fish, the lamprey has been acontributing factor in the decline of several species, includingwalleye, lake trout, ciscoes, and introduced salmon. Its pres-ence was a factor in the crash of the lake trout fishery in Huron,Michigan, and Superior lakes in the 1940s and 1950s. Sea lam-prey predation, combined with overfishing and hybridization,led to the extinction of three ciscoe species in this century. In1991, efforts to control sea lampreys through chemical andmechanical means cost Canada and the United States US$8million, with an additional US$12 million spent on lake troutrestoration (Fuller et al. 1999:19–21).
There are distinct trade-offs between the value of introduc-ing fish for human consumption and the negative impact onnative aquatic ecosystems. Two species of tilapia (Mozambiquetilapia and Nile tilapia), the common carp, and two species oftrout (rainbow and brook trout) have established self-sustain-ing populations around the world and contribute significantlyto food production (FAO 1999a:27). In 1997, for example, 2.2million metric tons of common carp and 742,000 metric tons ofNile tilapia were produced through aquaculture worldwide (FAO1998). Other species that have been introduced worldwide for
56 P I L O T A N A L Y S I S O F G L O B A L E C O S Y S T E M S
B i o d i v e r s i t y
mosquito and weed control include the mosquito fish, guppy,and grass carp.
Map 17 shows the degree of international introductions bycountry as recorded in the FAO Database on Introductions ofAquatic Species (DIAS). The largest percentage of these intro-ductions—35.5 percent—took place between 1940 and 1979(DIAS Website: http://www.fao.org/fi/statist/fisoft/dias/index.htm). It should be noted that the DIAS database consid-ers only species introduced from one country to another and notwithin-country introductions or translocations.
Introduced species account for almost 10 percent of globalaquaculture production (DIAS Website: http://www.fao.org/fi/statist/fisoft/dias/index.htm), but they have largely unquantifiednegative effects on many native species in the systems to whichthey are introduced. By feeding at the bottom of lakes and riv-ers, carp, for example, increase siltation and turbidity, causingdecreases in water clarity and negative impacts on native spe-cies (Fuller et al. 1999:69). They have been associated with thedisappearance of native fish in Argentina, Venezuela, Mexico,Kenya, India, and elsewhere (Welcomme 1988). These fish alsohave been introduced into areas where they are not used foraquaculture, resulting in dramatic changes in fish communitystructures in many places. In the Salton Sea of California,Mozambique tilapia are considered a major factor in the de-cline of the desert pupfish (Fuller et al. 1999:440). In Austra-lia, exotic fish species are the leading cause in the decline of22 species of native fish that are classified as endangered, vul-nerable, or rare (Wager and Jackson 1993).
Zebra mussel distribution in the United StatesThe invasion and spread of the zebra mussel (Dreissenapolymorpha) in the United States is one of the few long-termdocumented cases that can illustrate the cost to biodiversityand to other goods and services derived from rivers and lakes.Native to eastern Europe, the zebra mussel had spread to allmajor European rivers by the early 19th century. The musselwas first discovered in the Great Lakes in 1988, and expandedits range in North America rapidly in the following decade (USGSzebra mussel website: http://nas.er. usgs.gov/zebra.mussel/docs/sp_account.html#HDR1). The mussels were introduced throughthe release of ballast water from transatlantic cargo ships. At-taching themselves to ships, the mussels within a few yearsspread throughout the Great Lakes and into the Mississippi Riverdrainage area (USGS zebra mussel website: http://nas.er.usgs.gov/zebra.mussel/docs/sp_account.html#HDR1).Map 18 shows the rapid expansion of the zebra mussel from theGreat Lakes to other rivers and lakes in the eastern part of theUnited States.
Zebra mussels are small and attach themselves to many man-made underwater structures, such as intake pipes for powerplants, locks, and dams, and other industrial infrastructure.
Utilities, industrial facilities, and drinking water treatment plantshave been particularly affected. The economic costs of eradi-cating the mussels are enormous. Survey data from over 400facilities in the United States and Canada found that the cost ofzebra mussel eradication from 1989 to 1995 totaled over US$69million, with annual costs rising from US$234,140 in 1989 toUS$17,751,000 in 1995 (O’Neill 1996:1, 2). These figures rep-resent gross underestimates of the total costs because they arebased on a small sample of the total number of potentially af-fected facilities. An estimated projection of total costs from 1989to 1995 is in the range of US$300 million to US$400 million(O’Neill, personal communication, 1999).
Introduced zebra mussels also have negative ecological ef-fects. A study of zebra mussels in western Lake Erie found thatzebra mussel infestation from 1989 to 1991 caused the deathsof almost all native clams at 17 sampling stations, leading to acollapse of clam biodiversity and the near-extinction of manynative clam species. No living native clam species were foundat the sampling stations by 1991 (Schloesser and Nalepa1994:2238–2239). In the St. Croix River, a federally designatedwild and scenic river in the upper Mississippi River basin, theonly known viable population of the winged mapleleaf clam(Quadrula frugosa) is currently threatened by the advancingzebra mussels (USGS zebra mussel Website: http://nas.er.usgs.gov/zebra.mussel/docs/ sp_account.html#HDR1).
Global and U.S. distribution of water hyacinthWater hyacinth (Eichhornia crassipes) is another example of awidespread exotic species that is causing considerable economicand ecological damage in many parts of the world. This plant,thought to be indigenous to the upper reaches of the Amazonbasin, was spread throughout much of the planet for use as anornamental beginning in the mid-19th century (Gopal 1987:1).By 1900 it had spread to every continent except Europe andhas now achieved pan-tropical distribution. The plant spreadsquickly to new rivers and lakes in the tropics, clogging water-ways and infrastructure, reducing light and oxygen in freshwa-ter systems, and causing changes in water chemistry and spe-cies assemblages (Hill et al. 1997). These changes can disruptthe livelihoods of local communities that depend on goods andservices derived from these systems (Hill et al. 1997). For in-stance, in Papua New Guinea, water hyacinth has been con-firmed in almost 100 locations with the most serious infestationreported for the Sepik River, where it has had “devastating ef-fects on socioeconomic structure and on the environment”(Harley et al. 1997). The spread of hyacinth impairs fishingactivities, travel to market to sell and buy produce, and accessto fishing areas. In addition, hyacinth and other aquatic weedsact as vectors in the life cycles of insects that transmit diseases,such as schistosomiasis and lymphatic filariasis (Bos 1997).Even in its native range of South America, water hyacinth has
F r e s h w a t e r S y s t e m s 57
B i o d i v e r s i t y
become a pest in Guyana and Surinam and has spread into ad-jacent regions, creating problems in rivers and reservoirs byclogging dams and intake valves in Argentina, Bolivia, Cuba,and Mexico (Harley et al. 1997).
Unfortunately, despite the many problems associated withthe water hyacinth, thorough studies quantifying its distribu-tion, its impact on biodiversity, and its socioeconomic param-eters within freshwater systems and rural riparian communitiesare lacking. The United States has a comparably comprehen-sive data set on the distribution of this alien species. In theUnited States, the aquatic plant has established populations inmost of Florida, Louisiana, and along the coastal states of theGulf of Mexico, and into basins in eastern Texas. The southerncoastline of California and the Sacramento River basin havealso been affected by the spread of the hyacinth (USGS inva-sive species Website: http://nas.er.usgs.gov/plants/maps/smec.gif). Map 18 shows the distribution of water hyacinth acrossthe United States.
Water hyacinth has also spread to most rivers and lakes inthe tropics. A 1987 study by B. Gopal found that the plant hadspread to most regions of tropical and subtropical Asia, Africa,and Central America (Gopal 1987). This distribution patternwas confirmed by a more recent review by Harley et al. (1997).In recent years, water hyacinth has spread very rapidly in Af-rica, from the Nile Delta and the Congo basin to regions in WestAfrica (particularly Cote d’Ivoire, Benin, and Nigeria), the equa-torial zone of East Africa, and to the southern part of the conti-nent, specifically Zambia, Zimbabwe, Mozambique, and SouthAfrica (Harley et al. 1997). In Australia, water hyacinth hasspread along the entire coast, although its impact is being re-duced by biological control. It has also spread to many PacificIslands, including New Zealand. In South America, water hya-cinth is found in the majority of the Amazon tributaries, as wellas in Guyana, Surinam, Argentina, Paraguay, Uruguay, the north-ern part of Colombia, Venezuela, and the central rivers in Chile.It is also found in most of Central America and the Caribbeanislands (Gopal 1987:46–60; Harley et al. 1997). In Asia, it haswidely spread through the Southeast and India. In Europe, how-ever, it has been reported only in Portugal (Gopal 1987:46–60).
Capacity of Freshwater Systems to
Sustain BiodiversityHabitat degradation, physical alteration through dams and ca-nals, water withdrawals, overharvesting, pollution, and the in-troduction of nonnative species have all taken a heavy toll onfreshwater biodiversity. As a consequence, the capacity of fresh-water ecosystems to support biodiversity is highly degraded ata global level. Because of the lack of data for most freshwaterspecies and the difficulty quantifying the impacts of some pres-
sures, such as introduction of nonnative species, it is hard toprovide a quantifiable measure of the condition of freshwaterbiodiversity around the world. However, studies done for NorthAmerican freshwater fauna, for which there are more data, showthat species are being lost at an “ever-accelerating rate” (Moyleand Leidy 1992:163) and suggest that future extinction ratesare five times higher for freshwater animal species than for ter-restrial ones (Ricciardi and Rasmussen 1999:1221). Indeed, ofall the ecosystems assessed under PAGE, freshwater ecosys-tems are in by far the worst condition from the standpoint oftheir ability to support biological diversity. More than 20 per-cent of the world’s 10,000 freshwater fish species have becomeextinct, threatened, or endangered in recent decades, and manymore aquatic-dependent species, such as mussels, birds, andplants are also highly threatened. Rising global demand for waterand food will increase the already considerable pressures onfreshwater ecosystems, putting more of the species and ecosys-tem processes at risk.
Biodiversity Information Status and
NeedsDirect measurements of the condition of biodiversity in fresh-water systems are sparse worldwide. As mentioned throughoutthis section, global data on freshwater biodiversity are lackingfor many developed nations and most of the developing world.This makes analyzing population trends impossible or limitedto a handful of well-known species.
There is excellent trend data for bird populations in theUnited States and Canada. For other regions of the world, how-ever, databases on the distribution of Important Bird Areas suchas those from BirdLife International, are of high quality butlack long-term population trends. Information on nonnativespecies is frequently anecdotal and often limited to records ofthe presence or absence of a particular species, without docu-mentation of the effects on the native fauna and flora. Regionaland local spatial distribution on certain invasive species is avail-able for few species, mostly in the United States and Australia.
Some of these data gaps are being filled through studies thatdraw on local experts, museum collections, and field invento-ries. However, more information on species assemblages, inter-actions, and population trends is urgently needed to assess thecondition of freshwater systems. At the global level, many coun-tries probably cannot mount this data collection effort becauseof the high monitoring costs. At a minimum, there should bemonitoring of key indicator species, as well as monitoring of thepresence or introduction of nonnative species and their impactson native fauna and flora. The development of a simple andmore affordable IBI at the watershed level may be a reasonableapproach for many countries.
F r e s h w a t e r S y s t e m s 59
B i b l i o g r a p h y
Bibliography
Brady, S. J. and C. H. Flather. 1994. “Changes in Wetlands on Nonfederal
Rural Land of the Conterminous United States from 1982 to 1987.”
Environmental Management 18 (5): 693–705.
Bräutigam, A. 1999. “The Freshwater Crisis.” World Conservation, 30 (2): 4-5.
Breeding Bird Survey Website. Available on-line at: http://
www.mbr.nbs.gov/bbs. Viewed 7/31/00.
Briscoe, J. 1999. “Water Resources Management in Yemen – Results of a
Consultation.” Office memorandum. Washington, DC: The World Bank.
British Geological Survey. 1996. Characterisation and Assessment of
Groundwater Quality Concerns in Asia-Pacific Region: The Aquifers of
the Asia-Pacific Region–An Invaluable but Fragile Resource. UNEP/
DEIA/AR.96-1. Prepared on the behalf of the U.N. Environment
Programme (UNEP) and the World Health Organization. Nairobi, Kenya:
UNEP.
Carey, C., H. R. Heyer, J. Wilkinson, R. A. Alford, J. W. Arntzen, T.
Halliday, L. Hungerford, K. R. Lips, E. M. Middleton, S. A. Orchard,
and A. S. Rand. 2000. “Amphibian Declines and Environmental
Change: An Overview.” Draft manuscript. Boulder, Colorado, U.S.A.:
University of Colorado.
Carlson, C. A. and R. T. Muth. 1989. “The Colorado River: Lifeline of the
American Southwest,” pp. 220–239 in Proceedings of the International
Large River Symposium. D. P. Dodge, ed. Canadian Special Publication
of Fisheries and Aquatic Science 106. Ottawa, Canada: Department of
Fisheries and Oceans.
CEQ (Council on Environmental Quality). 1995. Enviromental Quality —
Twenty-Fith Anniversary Rerpot. Washington, DC: The Council for
Environmental Quality.
Chenje, M. and P. Johnson, eds. 1996. Water in Southern Africa. A report by
the Southern African Development Community, IUCN-The World
Conservation Union, and Southern African Research & Documentation
Centre. Harare, Zimbabwe: Print Holdings.
CIESIN (Center for International Earth Science Information Network),
International Food Policy Research Institute, and World Resources
Institute. 2000. Gridded Population of the World, Version 2. Palisades,
New York: CIESIN and Columbia University. Available on-line at:
http://sedac.ciesin.org/plue/gpw.
Collar, N. J., M. J. Crosby and A. J. Stattersfield. 1994. Birds to Watch 2: the
World List of Threatened Birds. No.4, BirdLife Conservation Series,
Duncan Brooks, ed. Cambridge, U.K.: BirdLife International.
Abell, R.A., D.M. Olson, E. Dinerstein, P.T. Hurley, J.T. Diggs, W.
Eichbaum, S. Walters, W. Wettengel, T. Allnutt, C.J. Loucks, and P.
Hedao. 2000. Freshwater Ecoregions of North America: A Conservation
Assessment, Washington, DC: World Wildlife Fund-United States.
Abramovitz, J. N. 1996. Imperiled Waters, Impoverished Future: The Decline
of Freshwater Ecosystems. Worldwatch Paper 128. Washington, DC:
Worldwatch Insititute.
Achieng, A. P. 1990. “The Impact of the Introduction of Nile Perch, Lates
niloticus (L.), on the Fisheries of Lake Victoria.” Journal of Fish Biology
37(Supplement A): 17–23.
Alcamo, J., T. Henrichs, and T. Rösch. 2000. World Water in 2025 — Global
Modeling and Scenario Analysis for the World Commission on Water for
the 21st Century. Report A0002. Kassel, Germany: Center for Environ-
mental Systems Research, University of Kassel.
Arthington, A. H. and R. L. Welcomme. 1995. “The Condition of Large
River Systems of the World,” pp. 44–75 in Condition of the World’s
Aquatic Habitats. Proceedings of the World Fisheries Congress, Theme
1. N. B. Armantrout and R. J. Wolotira, Jr., eds. Lebanon, New
Hampshire, U.S.A.: Science Publishers Inc.
Avakyan, A. B. and V. B. Iakovleva. 1998. “Status of Global Reservoirs: The
Positionin the Late Twentieth Century.” Lakes & Reservoirs: Research
and Management 3: 45–52.
Bacalbaça-Dobrovici, N. 1989. “The Danube River and its Fisheries,” pp.
455–468 in Proceedings of the International Large River Symposium. D.
P. Dodge, ed. Canadian Special Publication of Fisheries and Aquatic
Science 106. Ottawa, Canada: Department of Fisheries and Oceans.
Barbier, E. B. and J. R. Thompson. 1998. “The Value of Water: Floodplain
versus Large-Scale Irrigation Benefits in Northern Nigeria.” Ambio 27
(6): 434–440.
Barbour, M. T., J. Gerritsen, and J. S. White. 1996. Development of the
Stream Condition Index (SCI) for Florida. Florida Department of
Environmental Protection. Owings Mills, Maryland, U.S.A.: Tetra Tech
Inc.
BirdLife International. 1999. Georeferenced data on threat status for
wetlands in the Middle East provided to WRI for the PAGE analysis.
Bos, R. 1997. “The Human Health Impact of Aquatic Weeds,” in E.S.
Delfosse and N.R. Spencer, eds., Proceedings of the International Water
Hyacinth Consortium. Washington, DC: World Bank. Available on-line
at: http://www.sidney.ars.usda.gov/scientists/nspencer/water_h/
appendix4.htm
60 P I L O T A N A L Y S I S O F G L O B A L E C O S Y S T E M S
B i b l i o g r a p h y
CONABIO (Comisión Nacional para el Conocimiento y Uso de la
Biodiversidad). 1998. Programa de Cuencas Hidrológicas Prioritarias y
Biodiversidad de México de la Comisión Nacional para el Conocimiento
y Uso de la Biodiversidad. Primer Informe Técnico. México D.F.:
CONABIO/USAID/FMCN/WWF.
Cosgrove, W. J. and F. R. Rijsberman. 2000. World Water Vision: Making
Water Everybody’s Business. Report prepared for the World Water
Council. London, U. K.: Earthscan Publications Ltd.
Dahl, T. E. 1990. Wetland Losses in the United States 1780s to 1980s.
Washington, DC: U.S. Department of the Interior, Fish and Wildlife
Service.
Dahl, T. E. and C. E. Johnson. 1991. Status and Trends of Wetlands in the
Conterminous United States, Mid-1970’s to Mid-1980’s. Washington, DC:
U.S. Department of the Interior, Fish and Wildlife Service.
DAPTF (Declining Amphibian Populations Task Force) Website available
on-line at: http://www2.open.ac.uk/Ecology/J_Baker/JBtxt.htm. Viewed
8/19/99.
Darras, S., M. Michou, and C. Sarrat. 1999. A First Step Toward Identifying
a Global Delineation of Wetlands. IGBP-DIS Wetlands Data Initiative.
IGBP-DIS Working Paper No. 19. Toulouse, France: IGBP-DIS.
Davies, S.P., L. Tsomides, D.L. Courtemanch, and F. Drumond. 1995. Maine
Biological Monitoring and Biocriteria Development Program. Augusta,
Maine, U.S.A.: Maine Department of Environmental Protection.
DeShon, J.E. 1995. “Development and Application of the Invertebrate
Community Index (ICI),” pp. 217–243 (Chapter 15) in Biological
Assessment and Criteria: Tools for Water Resource Planning and Decision
Making, W.S. Davis and T. Simon, eds. Boca Raton, Florida, U.S.A.:
Lewis Publishers.
DHI Water and Environment. 1999. Maps provided to WRI for the PAGE
analysis. Hørsholm, Denmark.
DIAS (Database on Introduction of Aquatic Species) Website. 2000.
Available on-line at: http://www.fao.org/fi/statist/fisoft/dias/index.htm.
Viewed 9/11/00.
Dugan, P. J. and T. Jones. 1993. “Ecological Change in Wetlands: A Global
Overview,” pp. 34–38 in Waterfowl and Wetland Conservation in the
1990s: A Global Perspective. Proceedings of an IWRB Symposium. St.
Petersburg Beach, Florida, U.S.A. 12–19 November 1992. M. Moser,
R.C. Prentice, and J. van Vessem, eds. IWRB Special Publication No.
26. Slimbridge, U. K.: The International Waterfowl and Wetlands
Research Bureau (IWRB).
Dynesius, M. and C. Nilsson. 1994. “Fragmentation and Flow Regulation of
River Systems in the Northern Third of the World.” Science 266: 753–
762.
EDC (U.S. Geological Survey’s EROS Data Center). 1999. HYDRO 1K
Dataset available on-line at: http://edcdaac.usgs.gov/gtopo30/hydro/.
Sioux Falls, South Dakota, U.S.A.: USGS EDC and United Nations
Environment Programme/Global Resource Information Database
(UNEP/GRID).
EEA (European Environment Agency). 1994. European Rivers and Lakes:
Assessment of Their Environmental State. P. Kristensen and H. O.
Hansen, eds., EEA Environmental Monographs 1, National Environ-
mental Research Institute, Copenhagen, Denmark: Danish Ministry of
Environment and Energy.
EEA (European Environment Agency).1995. Europe’s Environment: The
Dobríš Assessment. D.Stanners and P. Bourdeau, eds. Copenhagen,
Denmark: European Environment Agency.
EEA (European Environment Agency). 1998. Europe’s Environment: The
Second Assessment. Copenhagen, Denmark: European Environment
Agency.
EEA (European Environment Agency). 1999. Environment in the European
Union at the Turn of the Century. Environmental Assessment Report No.
2. Copenhagen, Denmark: European Environment Agency.
Emteryd, O., D.Q. Lu, and N. Nykvist. 1998. “Nitrate in Soil Profiles and
Nitrate Pollution of Drinking Water in the Loess Region of China.”
Ambio 27 (6): 441–443.
EPA (Environmental Protection Agency). 1999. U.S. EPA Office of Water
Website available on-line at: http://www.epa.gov/iwi/ Viewed 7/25/00.
ESRI (Environmental Systems Research Institute). 1992. ArcUSA 1:214 GIS
Database CD-Rom. Redlands, California, U.S.A.: ESRI.
ESRI (Environmental Systems Research Institute). 1996. “World Countries
1995,” in ESRI Data and Maps. Volume 1. CD-Rom. Redlands,
California, U.S.A.: ESRI.
Evans, M. I. 1994. Important Bird Areas in the Middle East. No.2, BirdLife
Conservation Series, Duncan Brooks, ed., Cambridge, U.K.: BirdLife
International.
Falkenmark, M. and G. Lindh. 1993. “Water and Economic Development,”
pp. 80–91 in P. Gleick, ed., Water in Crisis: A Guide to the World’s Fresh
Water Resources. Oxford, U.K.: Oxford University Press.
Falkenmark, M. and C. Widstrand. 1992. “Population and Water Resources:
A Delicate Balance.” Population Bulletin 47 (3): 1–36.
FAO (Food and Agriculture Organization of the United Nations). 1995a.
Effects of Riverine Inputs on Coastal Ecosystems and Fisheries Resources.
FAO Fisheries Technical Paper No. 349. Rome, Italy: FAO.
FAO (Food and Agriculture Organization of the United Nations), 1995b.
Review of the State of World Fishery Resources: Inland Capture Fisheries.
FAO Inland Water Resources and Aquaculture Service, Fishery
Resources Division.FAO Fisheries Circular No. 885. Rome, Italy: FAO.
FAO (Food and Agriculture Organization of the United Nations). 1998.
Global Production Dataset 1984–1997, Global Capture Dataset 1984–
1997, and Aquaculture Quantities Dataset 1984–1997, Fishery Statistics
Databases, downloadable with Fishstat-Plus software at: http://
www.fao.org/WAICENT/ FAOINFO/FISHERY/statist/FISOFT/
FISHPLUS.HTM.FISHSTAT PLUS, Version 2.19 by Yury Shatz. Rome,
Italy: FAO.
F r e s h w a t e r S y s t e m s 61
B i b l i o g r a p h y
FAO (Food and Agriculture Organization of the United Nations). 1996.
“Malawi Fishery Country Profile.” FAO Fisheries Department Website
available on-line at: http://www.fao.org/fi/fcp/malawie.htm. Viewed 6/
27/00.
FAO (Food and Agriculture Organization of the United Nations). 1999a.
Review of the State of World Fishery Resources: Inland Fisheries. FAO
Inland Water Resources and Aquaculture Service, Fishery Resources
Division, FAO Fisheries Circular No. 942. Rome, Italy: FAO.
FAO (Food and Agriculture Organization of the United Nations). 1999b. The
State of World Fisheries and Aquaculture 1998. Rome, Italy: FAO
Fisheries Department.
FAO (Food and Agriculture Organization of the United Nations). 1999c.
Data on location of dams for Africa provided to WRI for PAGE Analysis.
Rome, Italy: FAO.
Fekete, B., C. J. Vörösmarty, and W. Grabs. 1999. Global, Composite Runoff
Fields Based on Observed River Discharge and Simulated Water Balance.
World Meteorological Organization Global Runoff Data Center Report
No. 22. Koblenz, Germany: WMO-GRDC.
Finlayson, C.M. and N.C. Davidson. 1999. Global Review of Wetland
Resources and Priorities for Wetland Inventory: Summary Report.
Wageningen, Netherlands: Wetlands International and Jabiru, Australia:
the Environmental Research Institute of the Supervising Scientists.
Foster, S., A. Lawrence, and B. Morris. 1998. Groundwater in Urban
Development: Assessing Management Needs and Formulating Policy
Strategies. World Bank Technical Paper No. 390. Washington, DC: The
World Bank.
Foster, S., J. Chilton, M. Moench, F. Cardy, and M. Schiffler. 2000.
Groundwater in Rural Development: Facing the Challenges of Supply
and Resource Sustainability. World Bank Technical Paper No. 463.
Washington, DC: The World Bank.
Foster, S. British Geological Survey. 2000. Personal Communication. 5 July.
Frolking, S., X. Xiao, Y. Zhuang, W. Salas, and C. Li. 1999. “Agricultiral
Land-Use in China: A Comparison of Area Estimates from Ground-
Based Census and Satellite-Borne Remote Sensing.” Global Ecology &
Biogeography 8 (5): 407–416.
Fuller, P.L., L.G. Nico, and J.D. Williams. 1999. Nonindigenous Fishes
Introduced into Inland Waters of the United States. American Fisheries
Society, Special Publication no.27. Bethesda, Maryland, U.S.A.:
American Fisheries Society.
Ganasan, V. and R. M. Hughes. 1998. “Application of an Index of
Bbiological Integrity (IBI) to Fish Assemblages of the Rivers Khan and
Kshipra (Madhya Pradesh), India.” Freshwater Biology 40: 367–383.
Garibaldi, L. and D. M. Bartley, 1998. The database on introductions of
aquatic species (DIAS). Food and Agriculture Organization of the
United Nations (FAO) Aquaculture Newsletter (FAN), no. 20. Available
on the Web at http://www.fao.org/fi/statist/fisoft/dias/index.htm.
GLCCD (Global Land Cover Characteristics Database), Version 1.2. 1998.
Loveland, T.R., B.C. Reed, J.F. Brown, D.O. Ohlen, Z. Zhu, L. Yang, and
J. Merchant. 2000. “Development of a Global Land Cover Characteris-
tics Database and IGBP DISCover from 1-km AVHRR data.” Interna-
tional Journal of Remote Sensing 21 (6-7): 1303–1330. Data available
on-line at: http://edcdaac.usgs.gov/ glcc/glcc.html.
Gleick, P. H.1998. The World’s Water 1998-1999: The Biennial Report on
Freshwater Resources. Washington, DC: Island Press.
Gonzales, A., J. L. Camarillo, F. Mendoza, and M. Mancilla. 1995. “Impacts
of Expanding Human Populations on the Herpetofauna of the Valley of
Mexico.” Herpetological Review 17: 30–31.
Gopal, B. 1987. Water Hyacinth. Aquatic Plant Studies 1, Amsterdam and
New York: Elsevier Science.
Goulding, M. 1985. “Forest Fishes of the Amazon,” in Key Environments:
Amazonia, G.T. Prance and T.E. Lovejoy, eds., Oxford, U.K.: Pergamon
Press.
Groombridge B. and M. Jenkins. 1998. Freshwater Biodiversity: a
Preliminary Global Assessment. World Conservation Monitoring Centre,
Cambridge, U.K.: World Conservation Press.
Harley, K., M.H. Julien, and A.D. Wright. 1997. “Water Hyacinth: a
Tropical Worldwide Problem and Methods for its Control,” in E.S.
Delfosse and N.R. Spencer, eds., Proceedings of the International Water
Hyacinth Consortium. Washington, DC: World Bank. Available on-line
at: http://www.sidney.ars.usda.gov/scientists/ nspencer/water_h/
appendix7.htm
Harrison, I. J. and M. J. Stiassny. 1999. “The Quiet Crisis: A Prelimminary
Listing of the Freshwater Fishes of the World that Are Extinct or
‘Missing in Action’,” pp. 271–331 in Extinctions in Near Time,
MacPhee, ed. New York, New York: Kluwer Academic/Plenum
Publishers.
Heath, M. F. and M. I. Evans, eds. 2000. Important Bird Areas in Europe:
Priority Sites for Conservation. 2 vols. BirdLife Conservation Series No.
8. Cambridge, U. K.: BirdLife International.
Heimlich, R. E., K. D. Wiebe, R. Claassen, D. Gadsby, and R. M.
House.1998. Wetlands and Agriculture: Private Interests and Public
Benefits. Agriculture Economic Report No. 765. Washigton, DC: U.S.
Department of Agriculture, Economic Research Service.
Hill, G., J. Waage, and G. Phiri. 1997. “The Water Hyacinth Problem in
Tropical Africa,” in E.S. Delfosse and N.R. Spencer, eds., Proceedings of
the International Water Hyacinth Consortium. Washington, DC: World
Bank. Available on-line at: http://www.sidney.ars.usda.gov/scientists/
nspencer/water_h/appendix5.htm
Hinrichsen, D., B. Robey, and U.D. Upadhyay. 1998. Solutions for a Water-
Short World. Population Reports, Series M, No. 14. Baltimore, Maryland,
U.S.A.: Johns Hopkins University School of Public Health, Population
Information Program.
Houlahan, J. E., C. S. Findlay, B. R. Schmidt, A. H. Meyer, and S. L.
Kuzmin. 2000. “Quantitative Evidence for Global Amphibian
Population Declines.” Nature 404 (6779): 752–755.
62 P I L O T A N A L Y S I S O F G L O B A L E C O S Y S T E M S
B i b l i o g r a p h y
Hughes, R. M. and R. F. Noss. 1992. “Biological Diversity and Biological
Integrity: Current Concerns for Lakes and Streams.” Fisheries, May-June
1992, as cited in J. N. Abramovitz, Imperiled Waters, Impoverished
Future: The Decline of Freshwater Ecosystems. Worldwatch Paper 128.
Washington, DC: Worldwatch Insititute.
ICOLD (International Commission on Large Dams). 1998. World Register of
Dams 1998. Paris, France: ICOLD.
IGBP (The International Geosphere-Biosphere Programme). 1998. Global
Wetland Distribution and Functional Characterization: Trace Gases and
the Hydrologic Cycle. Report from the Joint GAIM, BAHC, IGBP-DIS,
IGAC, and LUCC Workshop, Santa Barbara, CA, U.S.A., 16–20 May
1996. D. Sahagian and J. Meybeck, eds. IGBP Report No. 46.
Stockholm, Sweden: IGBP.
IJHD (International Journal of Hydropower and Dams). 1998. 1998 World
Atlas and Industry Guide. Surrey, U. K.: Aqua-Media International.
ISLCP (International Satellite Land Surface Climatology Project). 1987.
“Global Data Set for Land-Atmosphere Models Initiative 1:87–88
Volumes 1–5.” NASA Goddard Distributed Active Archive Center
Science Data Series. Maryland, U.S.A.: NASA/Goddard Space Flight
Center.
IUCN (The World Conservation Union). 1996. 1996 IUCN Red List of
Threatened Animals. Gland, Switzerland: IUCN-The World Conservation
Union.
Jones, K. B., K. H. Riitters, J. D. Wickham, R. D. Tankersley Jr., R. V.
O’Neill, D. J. Chaloud, E. R. Smith, and A. C. Neale. 1997. An
Ecological Assessment of the United States Mid-Atlantic Region: A
Landscape Atlas. Washington, DC: U.S. Environmental Protection
Agency.
Karr, J. R. and E. W. Chu. 1999. Restoring Life in Running Waters: Better
Biological Monitoring. Washington, DC: Island Press
Kapetsky, J. Inland Water Resources and Aquaculture Service, FAO
Fisheries Department. 1999. Personal Communication. 27 August.
Kaufman, L. Boston University Marine Program. 2000. Personal Communi-
cation. Interview. 7 February.
Kaufman, L. 1992. “Catastrophic Change in Species-Rich Freshwater
Ecosystems: The Lessons from Lake Victoria.” Bioscience 42 (11): 846–
858.
Kottelat, M. and T. Whitten. 1996. Freshwater Biodiversity in Asia with
Special Reference to Fish. World Bank Technical Paper No. 343.
Washington, DC: The World Bank.
Lelek, A., 1989. “The Rhine River and Some of its Tributaries Under
Human Impact in the Last Two Centuries,” pp. 469–487 in Proceedings
of the International Large River Symposium. D. P. Dodge, ed. Canadian
Special Publication of Fisheries and Aquatic Science 106. Ottawa,
Canada: Department of Fisheries and Oceans.
Lerner, S. and W. Poole. 1999. The Economic Benefits of Parks and Open
Space: How Land Conservation Helps Communities Grow Smart and
Protect the Bottom Line. San Francisco, California, U.S.A.: The Trust for
Public Land.
Liao, G. Z., K. X. Lu, and X. Z. Xiao. 1989. “Fisheries Resources of the
Pearl River and Their Exploitation,” pp. 561–568 in Proceedings of the
International Large River Symposium. D. P. Dodge, ed. Canadian Special
Publication of Fisheries and Aquatic Science 106. Ottawa, Canada:
Department of Fisheries and Oceans.
Ligon, F. K., W. E. Dietrich, and W. J. Trush. 1995. “Downstream Ecological
Effects of Dams: A Geomorphic Perspective.” Bioscience 45 (3): 183–
192.
Lips, K. R. 1998. “Decline of a Tropical Montane Amphibian Fauna.”
Conservation Biology 12 (1): 106–17.
L’vovich, M. I. and G. F. White. 1990. “Use and Transformation of
Terrestrial Water Systems,” pp. 235–252 in The Earth as Transformed by
Human Actions: Global and Regional Changes in the Biosphere Over the
Past 300 Years. B. L. Turner II, W. C. Clark, R. W. Kates, J. F. Richards,
J. T. Mathews, and W. B. Meyer, eds. Cambridge, U. K.: Cambridge
University Press.
Lyons, J., S. Navarro-Pérez, P. A. Cochran, E. Santana, and M. Guzmán-
Arroyo. 1995. “Index of Biological Integrity Based on Fish Assemblages
for the Conservation of Streams and Rivers in West-Central Mexico.”
Conservation Biology 9 (3): 569–584.
Mandal, B. K., T. R. Chowdhury, G. Samanta, G. K. Basu, P. K. Chowdhury,
C. R. Chanda, D. Lodh, N. K. Karan, R. K. Dhar, D. K. Tamili, D. Das,
K. C. Saha and D. Chakraborti. 1996. “Arsenic in Groundwater in
Seven Districts of West Bengal, India—The Biggest Arsenic Calamity in
the World.” Current Science 70 (11): 976–86.
Marchant, R., A. Hirst, R. H. Norris, R. Butcher, L. Metzeling, and D.
Tiller. 1997. “Classification and Prediction of Macroinvertebrate
Assemblages from Running Waters in Victoria, Australia.” J. North
American Bentholological Society 16 (3): 664–81.
Marshbird Monitoring Website. Internet reference: http://www.mp1-
pwrc.usgs.gov/marshbird/. Viewed 8/19/99.
Master, L. L., S. R. Flack, and B. A. Stein, eds. 1998. Rivers of Life: Critical
Watersheds for Protecting Freshwater Biodiversity. Arlington, Virginia,
U.S.A.: The Nature Conservancy.
Matthews, E. and I. Fung. 1987. “Methane Emission from Natural Wetlands:
Global Distribution, Area, and Environmental Characteristics of
Sources.” Global Biogeochemical Cycles 1:61–86.
McAllister, D. E., A. L. Hamilton, and B. Harvey. 1997. “Global Freshwater
Biodiversity: Striving for the integrity of freshwater ecosystems.” Sea
Wind—Bulleting of Ocean Voice International 11 (3): 1–140.
McCully, P. 1996. Silenced Rivers: The Ecology and Politics of Large Dams.
London, U. K. and New Jersey, U.S.A.: Zed Books Ltd. and International
Rivers Network.
Miller, R. R., J. D. Williams, and J. E. Williams. 1989. “Extinctions of
North American Fishes During the Past Century.” Fisheries 14 (6): 22–
38.
F r e s h w a t e r S y s t e m s 63
B i b l i o g r a p h y
Missouri River Coalition. 1995. “Comments on the Missouri River Water
Control Manual Review and Update Draft Environmental Impact
Assessment, March 1, 1995.” As cited in J. N. Abramovitz, Imperiled
Waters, Impoverished Future: The Decline of Freshwater Ecosystems.
Worldwatch Paper 128. Washington, DC: Worldwatch Insititute.
Moyle, P.B. and P.J. Randall. 1998. “Evaluating the Biotic Integrity of
Watersheds in the Sierra Nevada, California.” Conservation Biology 12
(6): 1318–1326.
Moyle, P.B. and R.A. Leidy. 1992. “Loss of Biodiversity in Aquatic
Ecosystems: Evidence from Fish Faunas,” pp. 127–169 in Conservation
Biology: The Theory and Practice of Nature Conservation, Preservation
and Management. P.L. Fiedler and S.K. Jain, eds. New York, New York:
Chapman and Hall.
MRC (Mekong River Commission). 1997. Greater Mekong Sub-Region State
of the Environment Report. Bangkok, Thailand: Mekong River
Commission and United Nations Environment Programme.
Mueller, D.K. and D.R. Helsel. 1996. Nutrients in the Nation’s Waters—Too
Much of a Good Thing? USGS Circular 1136. Reston, Virginia, U.S.A.:
U.S. Geological Survey. Available on-line at: http://water.usgs.gov/
nawqa/circ-1136/h10.html.
Myers, N. 1997. “The Rich Diversity of Biodiversity Issues,” pp. 125–138
in Biodiversity II: Understanding and Protecting Our Biological
Resources, M. L. Reaka-Kudla, D. E. Wilson, and E. O. Wilson, eds.
Washington, DC: Joseph Henry Press.
Naiman, R. J., J. J. Magnuson, D. M. McKnight, and J. A. Stanford, eds.
1995. The Freshwater Imperative: A Research Agenda. Washington, DC:
Island Press.
Naylor, R. L., R. J. Goldburg, J. H. Primavera, N. Kautsky, M. C. M.
Beveridge, J. Clay, C. Folke, J. Lubchenco, H. Mooney, and M. Troell.
2000. “Effect of Aquaculture on World Fish Supplies.” Nature 405
(6790): 1017–1024.
Nelson, J. S. 1976. Fishes of the World. New York, New York: Wiley.
Nelson, J. S. 1984 (2d ed.). Fishes of the World. New York, New York: Wiley.
Nelson, J. S. 1994 (3d ed.). Fishes of the World. New York, New York: Wiley.
NFNA (National Forest and Nature Agency). August 1997. The Skjern River
Restoration Project Interim Report. Copenhagen, Denmark: Danish
Ministry of the Environment and Energy.
NFNA (National Forest and Nature Agency). 1999. The Skjern River
Restoration Project booklet. Copenhagen, Denmark: Danish Ministry of
the Environment and Energy.
Ngantou, D. and R. Braund. 1999. “Waza-Logobe: Restoring the Good
Life.” World Conservation 30 (2): 19–20.
Nickson, R., J. MacArthur, W. Burgess, K.M. Ahmed, P. Ravenscroft, M.
Rahman. 1998. “Arsenic Poisoning of Bangladesh Groundwater.”
Nature 395 (6700): 338.
Nilsson, C., M. Svedmark, P. Hansson, S. Xiong and K. Berggren. 2000.
River fragmentation and flow regulation analysis. Unpublished data.
Umeå, Sweden: Landscape Ecology, Umeå University.
NOAA-NGDC (National Oceanic and Atmospheric Administration-National
Geophysical Data Center). 1998. Stable Lights and Radiance Calibrated
Lights of the World CD-ROM. View Nighttime Lights of the World
database available on-line at: http://julius.ngdc.noaa.gov:8080/
production/html/BIOMASS/night.html. Boulder, Colorado, U.S.A.:
NOAA-NGDC.
Nolan, B.T., B.C. Ruddy, K.J. Hitt, and D.R. Helsel. 1998. “A National
Look at Nitrate Contamination of Ground Water.” Water Conditioning
and Purification 39 (12): 76–79.
NRC (National Research Council). 1992. Restoration of Aquatic Ecosystems.
Washington, DC: National Academy Press.
Oberdorff, T., and R.M. Hughes. 1992. “Modification of an Index of Biotic
Integrity Based on Fish Assemblages to Characterize Rivers of the Seine
Basin, France.” Hydrobiologia 228:11–130.
Oberdorff, T., J. F. Guégan, and B. Hugueny. 1995. “Global Scale Patterns
of Fish Species Richness in Rivers.” Ecography, 18: 345–352.
Oberdorff, T. 1997. Muséum National d’Histoire Naturelle, Lab.
D’Ichtyologie Général et Appliquée, Paris, France. Unpublished data
provided to WRI.
Olesen, K. W. and K. Havnr. 1998. Restoration of the Skjern River: Towards
a Sustainable River Management Solution. Hørsholm, Denmark: Danish
Hydraulic Institute.
Olson, D. and E. Dinerstein. 1999. The Global 200: A Representation
Approach to Conserving The Earth’s Distinctive Ecoregions. Draft
Manuscript, March. Washington, DC: World Wildlife Fund (WWF-US).
O’Neill, C. R. 1996. Economic Impact of Zebra Mussels: The 1995 National
Zebra Mussel Information Clearinghouse Study. Brockport, New York:
New York Sea Grant Extension.
O’Neill, C. R. 1999. National Zebra Mussel Information Clearinghouse, New
York Sea Grant. Personal Communication.
Pelley, Janet. 1998. “No Simple Answer to Recent Amphibian Declines.”
Environmental Science and Technology 32 (15): 352-53.
Postel, S. 1993. “Water and Agriculture,” pp. 56–66 in Water in Crisis: A
Guide to the World’s Fresh Water Resource, P. Gleick, ed. New York, New
York and Oxford, U.K.: Oxford University Press.
Postel, S. 1995. “Where Have All the Rivers Gone?” World Watch 8 (3): 9–
19.
Postel, S. 1997. Dividing the Waters. Available on-line at: http://
precision.uos.ac.kr/ leo/text/postel.html
Postel, S. 1999. Pillar of Sand: Can the Irrigation Miracle Last? Washing-
ton, DC: Worldwatch Institute.
Postel, S. and S. Carpenter. 1997. “Freshwater Ecosystem Services,” pp.
195–214 in Nature’s Services: Societal Dependence on Natural
Ecosystems. G. C. Daily, ed. Washington, DC: Island Press.
Pounds, J. A., M. P. Fogden, J. M. Savage, and G. C. Gorman. 1997. “Tests
of Null Models for Amphibian Declines on a Tropical Mountain.”
Conservation Biology 11: 1307–1322.
64 P I L O T A N A L Y S I S O F G L O B A L E C O S Y S T E M S
B i b l i o g r a p h y
Ramsar Convention Website. 2000. Available on-line at: http://ramsar.org/
key_sitelist.htm and Montreux Record at: http://ramsar.org/
key_montreux_record.htm. Viewed 7/14/00.
Reaka-Kudla, M. L.1997. “The Global Biodiversity of Coral Reefs: A
Comparison with Rain Forests,” pp. 83–108 in Biodiversity II:
Understanding and Protecting Our Biological Resources, M. L. Reaka-
Kudla, D. E. Wilson, and E. O. Wilson, eds. Washington, DC: Joseph
Henry Press.
Remane, K. ed. 1997. African Inland Fisheries, Aquaculture and the
Environment. Food and Agriculture Organization of the United Nations
(FAO). Rome, Italy: FAO.
Revenga, C., S. Murray, J. Abramovitz, and A. Hammond, 1998. Watersheds
of the World: Ecological Value and Vulnerability. Washington, DC: World
Resources Institute.
Riber, H. H. COWI Consulting Engineers and Planners AS. 2000. Personal
Communication. 16 January.
Ricciardi, A. and J. B. Rasmussen. 1999. “Extinction Rates of North
American Freshwater Fauna.” Conservation Biology 13 (5): 1220–1222.
Ross, S. T. 1991. “Mechanisms Structuring Stream Fish Assemblages: Are
There Lessons From Introduced Species?” Environmental Biology of
Fishes 30: 359–368.
Sauer, J. R., J. E. Hines, G. Gough, I. Thomas, and B.G. Peterjohn. 1997.
The North American Breeding Bird Survey Results and Analysis. Version
96.3. Laurel, Maryland, U.S.A: Patuxent Environmental Science Center.
Scheidleder, J. Grath, G. Winkler, U. St@rk, C. Koreimann, and C.
Gmeiner. 1999. Groundwater Quality and Quantity in Europe. S. Nixon,
ed. European Topic Centre on Inland Waters. Copenhagen, Denmark:
European Environment Agency.
Schloesser, Don W., and Thomas F. Nalepa. 1994. “Dramatic Decline of
Unionid Bivalves in Offshore Waters of Western Lake Erie after
Infestation by the Zebra Mussel, Dreissena polymorpha.” Canadian
Journal of Fish and Aquatic Science, 51: 2234–2242.
SEAC (State of the Environment Advisory Council). 1996. Australia State of
the Environment Report, Australian Department of the Environment
Sport and Territories. Collingwood, Australia: CSIRO Publishing.
Seckler, D., U. Amarasinghe, D. Molden, R. de Silva, and R. Barker. 1998.
World Water Demand and Supply, 1990 to 2025: Scenarios and Issues.
Research Report 19. Colombo, Sri Lanka: International Water
Management Institute.
Seckler, D. 1999. International Water Management Institute, Colombo, Sri
Lanka. Personal Communication. 15 May.
Shiklomanov, I.A. 1997. Comprehensive Assessment of the Freshwater
Resources of the World: Assessment of Water Resources and Water
Availability in the World. Stockholm, Sweden: World Meteorological
Organization and Stockholm Environment Institute.
Smith, R.A., R.B. Alexander, and K.J. Lanfear. 1994. Stream Water Quality
in the Coterminous United States—Status and Trends of Selected
Indicators During the 1980s. USGS Water Supply Paper 2400. Reston,
Virginia, U.S.A.: U.S. Geological Survey.
Sparks, R. E. 1992. “The Illinois River Floodplain Ecosystem,” in National
Research Council, Restoration of Aquatic Ecosystems: Science,
Technology and Public Policy, Washington, DC: National Academy
Press. As cited in J. N. Abramovitz, Imperiled Waters, Impoverished
Future: The Decline of Freshwater Ecosystems. Worldwatch Paper 128.
Washington, DC: Worldwatch Insititute.
Taylor, R. and I. Smith. 1997. State of New Zealand’s Environment 1997.
Wellington, New Zealand: The Ministry for the Environment. Available
on-line at: http://www.mfe.govt.nz/about/publications/ser/front.pdf.
TERI (Tata Energy Research Institute). 1998. Looking Back to Think Ahead:
Green India 2047. New Delhi, India: TERI.
The Nature Conservancy, 1997. Natural Heritage Central Databases, The
Nature Conservancy and the International Network of Natural Heritage
Programs and Conservation Data Centers. November 1997. Available
on-line at: http://www.consci.tnc.org/src/zoodata.htm.
Tucker, G. M., and M. I. Evans, 1997. Habitats for Birds in Europe: A
Conservation Strategy for the Wider Environment. No.6, BirdLife
Conservation Series, Duncan Brooks, ed. Cambridge, U.K.: BirdLife
International.
Tyler, M. J. 1997. The Action Plan for Australian Frogs. Adelaide, Australia:
Wildlife Australia Endangered Species Program, The University of
Adelaide.
UN (United Nations). 1997. China: Water Resources and Their Use.
Economic and Social Commission for Asia and the Pacific. New York,
New York: United Nations.
UN/ECE (United Nations Economic Commission for Europe). 1995. State of
the Art on Monitoring and Assessment: Rivers. UN/ECE Task Force on
Monitoring and Assessment, Draft Report V. Lelystad, the Netherlands:
RIZA.
UNEP (United Nations Environment Programme). 1996. Groundwater: A
Threatened Resource. UNEP Environment Library No. 15. Nairobi,
Kenya: UNEP.
UNEP/GEMS (United Nations Environment Program Global Environment
Monitoring System/Water). 1995. Water Quality of World River Basins.
Nairobi, Kenya: UNEP.
UNESCO (United Nations Educational, Scientific, and Cultural Organiza-
tion). 2000. Water Related Vision for the Aral Sea Basin for the Year
2025. Paris, France: UNESCO.
UNPD (United Nations Population Division). 1999. World Population
Prospects: The 1998 Revision. Vol. 1. New York, New York: United
Nations.
USFWS (U.S. Fish and Wildlife Service). 1996. National Survey of Fishing,
Hunting, and Wildlife-Associated Recreation. Washington, DC: U.S.
Department of the Interior, Fish and Wildlife Service and U.S.
Department of Commerce, Bureau of Census.
F r e s h w a t e r S y s t e m s 65
B i b l i o g r a p h y
USGS (U.S. Geological Survey). Zebra Mussel Website. Available on-line at:
http://nas.er. usgs.gov/zebra.mussel/docs/sp_account.html#HDR1.
Viewed 7/19/00.
USGS (U.S. Geological Survey). Invasive Species Website. Available on-line
at: http://nas.er.usgs.gov/plants/maps/smec.gif. Viewed 7/19/00.
USGS (U.S. Geological Survey). Landsat 7 Web Site. Available on-line at:
http://landsat7.usgs.gov. Viewed 7/30/00.
USGS (U.S. Geological Survey). 1999. The Quality of Our Nation’s Waters
— Nutrients and Pesticides. USGS Circular 1225. Reston, Virginia,
U.S.A.: USGS.
Vörösmarty, C. J., K. P. Sharma, B. M. Fekete, A. H. Copeland, J. Holden, J.
Marble, and J. A. Lough. 1997a. “The Storage and Aging of Continental
Runoff in Large Reservoir Systems of the World.” Ambio 26(4): 210–
219.
Vörösmarty, C. J., M. Meybeck, B. M. Fekete, and K. P. Sharma. 1997b.
“The Potential Impact of Neo-Castorization on Sediment Transport by
the Global Network of Rivers,” pp. 261–272 in D. Walling and J. L.
Probst, eds. Human Impact on Erosion and Sedimentation. Wallingford,
U. K.: IAHS Press.
Vörösmarty, C., and D. Sahagian. 2000. “Anthropogenic Disturbance of the
Terrestrial Water Cycle.” Bioscience. In press.
Wager, R. and P. Jackson. 1993. The Action Plan for Australian Freshwater
Fishes. Australian Nature Conservation Agency (ANCA), Endangered
Species Program, Project No. 147. Canberra, Australia: ANCA.
Ward, J. V. and J. A. Stanford. 1989. “Riverine Ecosystems: The Influence
of Man on Catchment Dynamics and Fish Ecology,” pp. 56–64 in D. P.
Dodge, ed. Proceedings of the International Large River Symposium,
Canadian Special Publication of Fisheries and Aquatic Sciences 106.
Ottawa, Canada: Department of Fisheries and Oceans.
Washington Department of Fish and Wildlife and Oregon Department of
Fish and Wildlife. 1999. Status Report Columbia River Fish Runs and
Fisheries, 1938-1998. Vancouver, Washington and Clackamas, Oregon,
U.S.A.: Joint Columbia River Management Staff.
Watson, R. T., M. C. Zinyowera, and R. H. Moss. 1996. Climate Change
1995, Impacts, Adaptations and Mitigation of Climate Change: Scientific
Technical Analyses. Contribution of Working Group II to the Second
Assessment Report of the Intergovernmental Panel on Climate Change.
Cambridge, U.K.: Cambridge University Press.
WCMC (World Conservation Monitoring Centre). 1996. Biodiversity Map
Library. Cambridge, U.K.: WCMC.
Welcomme, R.L. 1988. International Introductions of Inland Aquatic
Species. Food and Agriculture Organization of the United Nations (FAO)
Technical Series Paper 294. Rome, Italy: FAO.
WHO (World Health Organization). 1996. Water and Sanitation Fact Sheet.
Online at: http://www.who.org/inf-fs/en/fact112.html. Viewed September
12, 2000.
Williams, J. E. Johnson, D. A. Hendrickson, S. Contreras-Balderas, J. D.
Williams, M. Navarro-Mendoza, D. E. McAllister, and D. E. Deacon.
1989. “Fishes of North America Endangered, Threatened or of Special
Concern: 1989.” Fisheries 14(6): 2–20.
Witte, F., T. Goldschmidt, J. Wanink, M. van Oijen, K. Goudswaard, E.
Witte-Mass, and N. Bouton. 1992. “The Destruction of an Endemic
Species Flock: Quantitative Data on the Decline of the Haplochromine
Cichlids of Lake Victoria.” Environmental Biology of Fishes 34:1-28.
WMO (World Meteorological Organization). 1997. Comprehensive Assessment
of the Freshwater Resources of the World. Stockholm, Sweden: WMO and
Stockholm Environment Institute.
Wood, S., K. Sebastian, and S. J. Scherr. 2000. Pilot Analysis of Global
Ecosystems: Agroecosystems Technical Report. Washington, DC: World
Resources Institute and International Food Policy Research Institute.
WRI (World Resources Institute). 1995. Africa Data Sampler User’s Guide; A
Georeferenced Database for all African Countries. Washington, DC: WRI.
WRI (World Resources Institute) in collaboration with the United Nations
Environment Programme, The United Nations Development Programme,
and the World Bank 1996. World Resources 1996-97. New York, New
York: Oxford University Press.
Wright, J .F. 1995. “Development and Use of a System for Predicting the
Macroinvertebrate Fauna in Flowing Waters.” Australian Journal of
Ecology 20: 181–97.
Yoder, C. O. 1991. “Answering Some Concerns about Biological Criteria
Based on Experiences in Ohio,” pp. 95–104 in Proceedings: Water
Quality Standards for the 21st Century. Washington, DC: US Environ-
mental Protection Agency, Criteria and Standards Division.
Yoder, C. O. and E. T. Rankin. 1995. “Biological Criteria Program
Development and Implementation in Ohio,” chapter 9 in W.S. Davis and
T. Simon, eds. Biological Assessment and Criteria: Tools for Water
Resource Planning and Decision Making. Boca Raton, Florida, U.S.A:
Lewis Publishers.
Yoder, C. O., and E. T. Rankin. 1998. “The Role of Biological Indicators in
a State Water Quality Management Process.” Environmental Manage-
ment and Assessment 51: 61–88.
Zhang, W.L., Z.X. Tian, N. Zhang, and X.Q. Li. 1996. “Nitrate Pollution of
Groundwater in Northern China.” Agriculture, Ecosystems and
Environment 59: 223-31.