Embed Size (px)
Citation preview

ANNUAL REPORT
2018
2 Table of Contents
4 Fresenius Group in figures
5 Key figures of the
business segments
7 Targets, results and outlook
8 To our shareholders
16 Report of the Supervisory Board
24 Business segments
24 Fresenius Medical Care
26 Fresenius Kabi
28 Fresenius Helios
30 Fresenius Vamed
32 Fresenius share
36 Group Management Report
(see detailed register on page 36)
37 Fundamental information about
the Group
37 The Group’s business model
40 Goals and strategies
42 Corporate performance
criteria
43 Investment and acquisition
process
43 Research and development
46 Employees
47 Procurement
47 Quality management
47 Responsibility, environmental
management, sustainability
48 Economic report
48 Health care industry
52 Overall business development
54 Results of operations, financial
position, assets and liabilities
70 Overall assessment of the
business situation
70 Outlook
70 General and mid-term
outlook
71 Future markets
72 Health care sector and
markets
74 Group sales and earnings
75 Sales and earnings by
business segment
76 Financing
76 Investments
76 Organization
76 Dividend
77 Opportunities and risk report
77 Opportunities management
77 Risk management
79 Risk areas
90 Assessment of overall risk
92 Group Non-Financial Report
93 Our responsibility
96 Serving the well-being
of the patient
108 Doing the right thing
113 Being an attractive employer
121 Protecting nature as the basis
for life
125 Protecting human rights
128 Responsibility in the supply chain
129 Limited assurance report of the
independent auditor
131 Corporate governance declaration
and report
163 Consolidated financial statements
164 Consolidated statement of income
164 Consolidated statement of
comprehensive income
165 Consolidated statement of
financial position
166 Consolidated statement of cash flows
168 Consolidated statement of
changes in equity
170 Consolidated segment reporting
172 Notes
(see detailed register on page 172)
173 General notes
194 Notes on the consolidated
statement of income
199 Notes on the consolidated
statement of financial position
225 Other notes
259 Notes in accordance with the
German Commercial Code
(HGB)
262 Auditor’s report
270 Boards
270 Supervisory Board
Fresenius SE & Co. KGaA
272 Management Board
Fresenius Management SE
273 Supervisory Board
Fresenius Management SE
274 Glossary
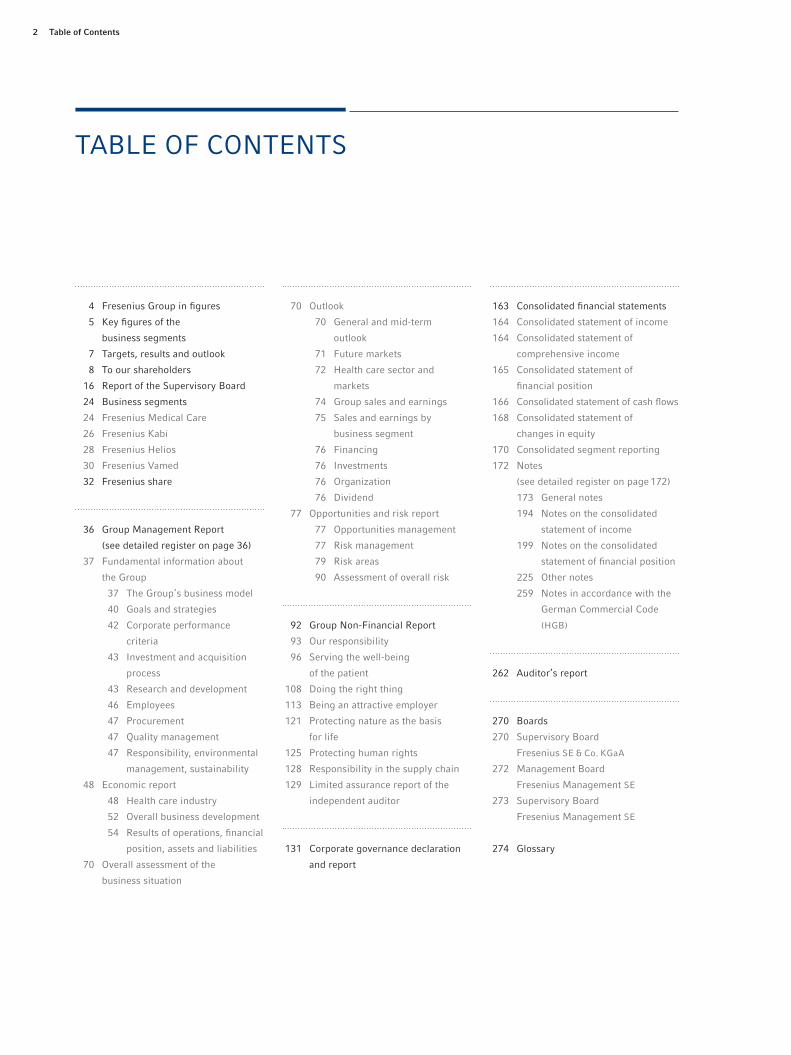
TABLE OF CONTENTS

3
Fresenius is a global health care group providing products and services for dialysis,
hospitals, and outpatient medical care. In addition, Fresenius focuses on hospital
operations. We also manage projects and provide services for hospitals and other health
care facilities worldwide. More than 275,000 employees have dedicated themselves
to the service of health in over 100 countries worldwide.

4 Fresenius Group in figures
FRESENIUS GROUP IN FIGURES (IFRS)
€ in millions 2018 2017 2016 2015 2014
Sales and Earnings
Sales 33,530 33,886 29,471 27,995 23,459
EBITDA 1 5,991 6,267 5,517 5,125 4,114
EBIT 1 4,561 4,830 4,302 4,001 3,159
Net income 2 1,871 1,816 1,560 1,436 1,088
Depreciation and amortization 1,430 1,437 1,215 1,124 955
Earnings per share in € 2 3.37 3.28 2.85 2.64 2.01
Cash flow and Balance sheet
Operating cash flow 3,742 3,937 3,585 3,349 2,560
Operating cash flow in % of sales 11.2% 11.6% 12.2% 12.0% 10.9%
Total assets 56,703 53,133 46,697 43,233 39,955
Non-current assets 41,913 40,529 34,953 32,800 30,389
Equity 3 25,008 21,720 20,849 18,453 15,860
Equity ratio 3 44% 41% 45% 43% 40%
Net debt 16,275 17,406 13,201 13,725 14,173
Net debt / EBITDA 4, 5 2.71 2.84 2.33 2.65 3.22
Investments 6 3,249 8,680 2,559 2,051 3,770
Profitability
EBIT margin 1 13.6% 14.3% 14.6% 14.3% 13.5%
Return on equity after taxes (ROE) 2 12.1% 13.3% 12.3% 12.9% 11.4%
Return on operating assets (ROOA) 4 9.0% 9.4% 10.0% 10.2% 9.0%
Return on invested capital (ROIC) 4 8.3% 8.0% 8.5% 8.4% 7.5%
Dividend per share in € 0.80 7 0.75 0.62 0.55 0.44
Employees (December 31) 276,750 273,249 232,873 222,305 216,275
1 Before special items2 Net income attributable to shareholders of Fresenius SE & Co. KGaA; before special items3 Including noncontrolling interest4 Before special items; 2014, 2016, 2017, 2018 pro forma acquisitions5 At LTM average exchange rates for both net debt and EBITDA6 Investments in property, plant and equipment, and intangible assets, acquisitions7 Proposal
For a detailed overview of special items and adjustments please see the reconciliation tables on pages 58 to 61.
Our interactive tool with additional key figures is available on www.fresenius.com/interactive-tool.
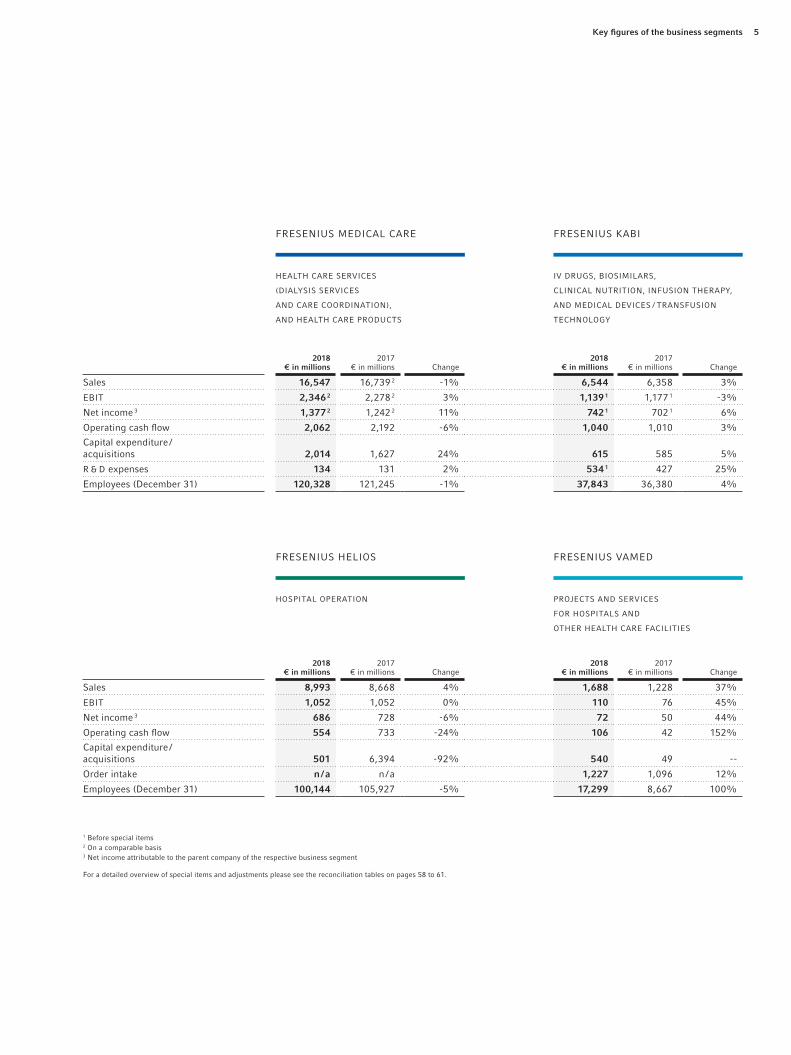
5Key figures of the business segments
FRESENIUS MEDICAL CARE
FRESENIUS HELIOS
FRESENIUS KABI
FRESENIUS VAMED
HEALTH CARE SERVICES
(DIALYSIS SERVICES
AND CARE COORDINATION),
AND HEALTH CARE PRODUCTS
HOSPITAL OPERATION
IV DRUGS, BIOSIMILARS,
CLINICAL NUTRITION, INFUSION THERAPY,
AND MEDICAL DEVICES / TRANSFUSION
TECHNOLOGY
PROJECTS AND SERVICES
FOR HOSPITALS AND
OTHER HEALTH CARE FACILITIES
1 Before special items2 On a comparable basis3 Net income attributable to the parent company of the respective business segment
For a detailed overview of special items and adjustments please see the reconciliation tables on pages 58 to 61.
2018€ in millions
2017€ in millions Change
2018€ in millions
2017€ in millions Change
Sales 16,547 16,739 2 - 1% 6,544 6,358 3%
EBIT 2,346 2 2,278 2 3% 1,139 1 1,177 1 - 3%
Net income 3 1,377 2 1,242 2 11% 742 1 702 1 6%
Operating cash flow 2,062 2,192 - 6% 1,040 1,010 3%
Capital expenditure / acquisitions 2,014 1,627 24% 615 585 5%
R & D expenses 134 131 2% 534 1 427 25%
Employees (December 31) 120,328 121,245 - 1% 37,843 36,380 4%
2018€ in millions
2017€ in millions Change
2018€ in millions
2017€ in millions Change
Sales 8,993 8,668 4% 1,688 1,228 37%
EBIT 1,052 1,052 0% 110 76 45%
Net income 3 686 728 - 6% 72 50 44%
Operating cash flow 554 733 - 24% 106 42 152%
Capital expenditure /acquisitions 501 6,394 - 92% 540 49 --
Order intake n / a n / a 1,227 1,096 12%
Employees (December 31) 100,144 105,927 - 5% 17,299 8,667 100%

6

7Targets / results / outlook
TARGETS / RESULTS / OUTLOOK
TARGETS 2018 1 RESULTS 2018 OUTLOOK 2019 9
Fresenius GroupSales (growth, in constant currency) 5% – 8% 3 low end 6% 3 3 %– 6%Net income 2 (growth, in constant currency) 6% – 9% 4 low end 7% 4 ~ 0%Net income 2 (growth, in constant currency) excluding biosimiliars ~ 10% – 13% 4 low end 11% 4
Investments in property, plant and equipment 6% of sales 6% of sales 7% of sales
Business segments
Fresenius Medical Care
Sales (growth, in constant currency) 2% – 3% 3 4% 3 3% – 7% Net income 5 on comparable basis 4 (growth, in constant currency) 11% – 12% 14%Net income 5 adjusted 4 (growth, in constant currency) 2% – 3% 4% - 2% – + 2%
Fresenius Kabi Sales (growth, organic) 4% – 7% top end 7% 3% – 6%EBIT 6 (growth, in constant currency) 1% – 3% 2% 3% – 6%EBIT 6 (growth, in constant currency) excluding biosimiliars ~ 9% – 11% 10%
Fresenius Helios
Sales (growth, organic) 3% – 6% 10 low end 3% 10 2% – 5%
EBIT (growth) 0% – 2% 8 0% 8 - 5% – - 2 %
Fresenius Vamed
Sales (growth, organic) 5% – 10% 16% ~ 10%EBIT (growth) 32% – 37% 8 45% 8 15% – 20%
Financing
Cash flow margin 10% – 12% 11% 10% – 12%
Net debt / EBITDA 7 Comparable 2017: 2.84 2.71 broadly on FY / 18 level
1 Updated October 2018 2 Net income attributable to shareholders of Fresenius SE & Co. KGaA 3 2017 adjusted for IFRS 15 adoption and divestitures of Care Coordination activities 4 Before special items and after adjustments 5 Net income attributable to shareholders of Fresenius Medical Care AG & Co. KGaA 6 Before special items 7 Calculated at annual average exchange rates, for both net debt and EBITDA; pro forma closed acquisitions / divestitures, excluding NxStage transaction;
excluding further potential acquisitions 8 After transfer of German post-acute care business from Fresenius Helios to Fresenius Vamed 9 Before special items and after adjustments, adjusted for IFRS 16 effects, excluding effects from NxStage transaction by FMC10 Helios Spain contributes 11 month to organic growth

To Our S
hareholders
To Our Shareholders8
2018 was another eventful year for Fresenius. Many develop-
ments were positive and took us forward – I’ll tell you about
the most important ones a little farther down. 2018 was also
a successful business year for our company, as we set new
records for sales and earnings – for the 15th straight year! We
will, therefore, be proposing to the Annual General Meeting
our 26th consecutive dividend increase.
There were also some less positive events last year, particu-
larly the legal dispute with Akorn. Our original intent was
to acquire this U.S.-based generic drugs producer to achieve
a very targeted and sensible expansion of Fresenius Kabi’s
generics portfolio. It was the right plan at the time – until we
discovered grave misconduct at Akorn relating to product
data, which had been systematically manipulated. Misconduct
of this kind violates all our principles of integrity and moral
behavior, and after very careful consideration it was clear to
us that we had no choice but to terminate the merger agree-
ment. We knew this would lead to a very complicated legal
battle. But we also knew that we were in the right, and in the
end the courts in Delaware confirmed it.
The courts also confirmed that our due diligence of Akorn
was as thorough as legally possible. Unfortunately, deliberate
intent to deceive can never be completely ruled out, which
is why we secured contractual assurances concerning compli-
ance and correctness in those areas we were not allowed to
examine during the due diligence process. The fact that we
stopped the transaction on time showed that our risk man-
agement works. And it showed that we are uncompromising
in defense of our shareholders’ interests and our rights –
however difficult that may sometimes be.
Also very difficult last year was the fact that we had to reduce
our communicated earnings targets twice in the second half –
once for our 2018 guidance and once concerning our mid-term
Stephan Sturm
Chairman of the Management Board

To O
ur S
hare
hold
ers
To Our Shareholders 9
targets. That is not something we are used to doing, and it
falls short of our own standards. The main reasons were that
Fresenius Medical Care’s growth in North America and some
emerging market countries, while solid, was less than fore-
cast, and that patient admissions at Fresenius Helios in Ger-
many did not develop as expected. In both areas we have
already initiated strong measures to rectify the situation. In
addition, we will make additional investments that will pay
off in future, but will temporarily limit our earnings growth. The
two releases communicating our reduced targets created
quite some uncertainty on the capital markets, and triggered
a sharp slide in our share price. We will work hard to once
again strengthen confidence in the capabilities and dynamism
of our company.
» 2018 was another eventful year for Fresenius. «
The negative headlines should, however, not obscure the
fact that overall, 2018 was a successful year for Fresenius. In
constant currency, we increased our sales by 6 percent and
net income by 7 percent. That made 2018 our 15th consecu-
tive record year. The number of our employees climbed to
more than 276,000, we successfully expanded our activities
in every business segment, and some important milestones
were achieved. I’d like to tell you briefly about a few of them:
At Fresenius Medical Care, we have developed a new dialysis
machine – the 4008A – specially designed to meet the needs
of emerging markets. Sturdy, and simple to operate, it offers
Fresenius Medical Care’s high therapy standards while keep-
ing costs for healthcare systems low. In Asia, especially, there
is a huge treatment gap: Only one-third of people suffering
from kidney disease receive dialysis. With the 4008A, we want
to help make life-saving dialysis available to a growing num-
ber of patients. The machine has been launched in India, with
a phased introduction to follow in other Asia-Pacific region
countries.
The 4008A is the result of cooperation between Fresenius
experts from around the world, and we are steadily expand-
ing our international research and development network
to create products tailored to the different needs of different
markets. In the past year we have started work on a tech-
nology center in Schweinfurt and the expansion of our R & D
center in Bad Homburg. We have taken a stake in the U.S.
medical R & D company Humacyte, and entered a strategic
partnership to introduce a new vascular access for dialysis
patients based on human cells. And we have established a
long-term research collaboration with Germany’s Medical
Center Hamburg-Eppendorf to explore the molecular and cel-
lular mechanisms of kidney diseases.
In 2018, the groundbreaking ceremony was held in Schweinfurt for
a new, 8,000-square-meter technology center for the development
of dialysis machines.

To Our S
hareholders
To Our Shareholders10
We have further increased the number of our dialysis clinics
to more than 3,900. And we have been growing not only in
our established markets but in growth markets such as Brazil
and China. Through the divestment of Sound Inpatient Phy-
sicians Holdings, we have optimized our Care Coordination
portfolio.
Fresenius Kabi brought numerous new products on to the
market last year across our full portfolio, from I.V. generic
drugs to infusion pumps. To meet the steadily increasing
demand for high-quality medicines, we are continuously
investing in the expansion and modernization of our pro-
duction facilities. These projects are now underway in China,
the Dominican Republic, the United Kingdom, Canada, the
Netherlands and the United States. Just in our Melrose Park
plant, near Chicago, we will invest about € 350 million by
2026.
These investments not only ensure the continued growth of
Fresenius Kabi, they are helping us fulfill our responsibility
as a producer of essential medicines. Shortages of important
drugs occur regularly – even in advanced nations like the
United States. Thanks to the high quality of our production
processes and facilities, and our international production
network, we are often able to help overcome these shortages.
Last year we received an award from the U.S. Food and Drug
Administration for our efforts in helping to relieve a shortage
of I.V. saline solutions in the wake of Hurricane Maria.
We are also satisfied with the development of our biosimilars
business, acquired in 2017. We expect to bring our first bio-
similar to market in Europe this year – a biosimilar of Humira®,
currently the world’s top-selling pharmaceutical product. We
expect to launch it in the United States in 2023.
At Fresenius Helios, the picture is more mixed. Internation-
ally, the business continues to run outstandingly. Quirónsalud
is developing according to plan in Spain, where we opened
a new hospital in Cordoba and increased the number of our
hospitals in Andalusia to six. In October we agreed to acquire
Clínica Medellín, which operates two hospitals with a total of
185 beds in Colombia’s second-largest city. After our market
entry in Peru in 2017, we are strengthening our presence in
South America’s growing hospital market.
In Germany, however, we have been facing strong headwinds.
After many years of steady growth, admissions declined at
our HELIOS hospitals. Some of them had trouble filling job
vacancies, especially for highly specialized personnel, so we
In 2018, the German post-acute care business of Fresenius Helios was
transferred to Fresenius Vamed. Fresenius Helios will now focus even
more strongly on the acute care hospital business and its continued
internationalization.
Foto
cre
dit:
Fot
o W
alln
er

To O
ur S
hare
hold
ers
To Our Shareholders 11
could not handle as many patients as planned. Another rea-
son was the continuing trend toward more outpatient treat-
ments. We have already initiated active measures to respond
to these developments.
In addition, we reorganized our inpatient rehabilitation busi-
ness inside the Fresenius Group, transferring 38 healthcare
facilities and 13 service companies in Germany specializing
in inpatient post-acute and nursing care from Fresenius
Helios to Fresenius Vamed. This has strengthened Fresenius
Vamed’s position as one of the leading providers of post-
acute care in Europe, while Fresenius Helios will be able to
focus even more strongly on the acute care hospital business
and continued internationalization.
Fresenius Vamed developed strongly in other areas, as well.
We won contracts on almost every continent. In Germany, we
are now the leading supplier of services for sterile supplies,
following our acquisition of Instruclean. And in Austria, we
opened the country’s first family-oriented children’s rehabili-
tation clinic in St. Veit im Pongau, and took over management
of a health resort in Bad Waltersdorf. VAMED Vitality World
now operates 10 thermal spas and health resorts in Austria and
Hungary.
As you can see, Fresenius is in very good shape. We have
excellent prospects to continue our dynamic growth in the
future. But success does not happen by itself – you have to
make it happen. So for us, 2019 will mean increasing our
already very substantial investments in R & D and the further
development of our business. In this way we will be posi-
tioning Fresenius even better for the coming decade. Here are
a few concrete examples:
At the end of February, Fresenius Medical Care closed the
acquisition of the U.S. medical technology company NxStage,
which will greatly strengthen our position in home dialysis.
To extensively expand in home dialysis, we have to invest in
the necessary infrastructure. We will also invest more in new
products and in growth markets such as China.
» Fresenius is in very good shape. We have excellent pros-pects to continue our dynamic growth in the future. «
At Fresenius Kabi, we are investing massively in our strongest
growth areas: generics, but also enteral nutrition and infu-
sion solutions. We will also invest to further develop our new
biosimilars business. We are thereby securing significant
growth opportunities for the future.
The trend toward more outpatient treatments also offers
opportunities, and to profit from them at Fresenius Helios in
Germany we are expanding our outpatient offering in a new
division of Helios. In another, newly established division
we will build attractive business models. These include,
for example, video consultations in addition to our regular
outpatient care, check-ups as a standalone business, and
occupational medicine as a service for companies. Another
major focus is the ongoing digitalization of hospital pro-
cesses. We will also continue to work on establishing compe-

To Our S
hareholders
To Our Shareholders12
tence centers for specific pathologies and disease patterns.
And we want to hire 1,000 new care personnel, to further
improve care for our patients.
In Spain we are building a hospital just outside Madrid, in
Torrejón, while inside Madrid we are building Spain’s first
proton beam therapy center for the treatment of cancer.
At Fresenius Vamed, our main investment focus will be on
the expansion of the post-acute care business in Europe.
But more investments mean more costs, and these will tem-
porarily weigh on our earnings. For this reason, we expect
Fresenius’ 2019 income to be at about the same level as last
year’s. Sales, however, are expected to increase between 3
and 6 percent. After this year of investment, we are forecast-
ing a resumption of dynamic growth in our net income as
well, with organic growth averaging 5 to 9 percent annually
between 2020 and 2023. Over the same period, organic sales
growth should average 4 to 7 percent.
This guidance is based on our expectations for organic
growth. If we add in small and medium-sized acquisitions,
growth rates 1 percentage point higher can be expected.
Large, strategic takeovers will continue to be a driver of our
successful development; here we will remain prudent and
selective, but bold when it comes to seizing opportunities.
The long-term trends for the continued, positive develop-
ment of our company remain intact. The healthcare market is
growing, and life expectancies are continuously increasing.
Demand for high-quality medicine is rising around the world,
and needs and expectations are changing. It is no longer
only about preserving lives, but about raising people’s quality
of life into old age. The mighty challenge of keeping quality
healthcare affordable over the long term remains, but Fresenius
is making substantial contributions and is superbly posi-
tioned to do even more in the future.
» Each of our four business seg-ments will remain on its own a strong and stable pillar of our success. «
2018 showed, once again, the advantages of a diversified
healthcare Group standing on four strong pillars. Each of our
four business segments is active in a different, fast-growing
area of healthcare, which enables us to recognize trends early,
respond quickly to meet changing needs, and then offer
tailored solutions. At the same time, we can offer increased
stability. Temporary slowdowns in individual business seg-
ments can generally be balanced by faster growth in the others.
Even when, as in 2018, we encounter unexpected challenges
in individual segments, our size and stability allow us to
address them efficiently and comprehensively, without exces-
sive time pressure. In many cases the area in question comes
out stronger than before.

To O
ur S
hare
hold
ers
To Our Shareholders 13
And remember this: As a large, diversified company we can
take a totally different approach to strategic investments than
smaller companies active in fewer business areas. We are
not focused on the next quarter, but oriented to the long term.
What is decisive for us are the future developments in health-
care – and not only in the coming years, but over the coming
decades.
Each of our four business segments will remain on its own
a strong and stable pillar of our success. The measures we
have been taking to reinforce and better connect them will
make the business segments an even stronger foundation for
our future growth, because we are working to harness more
of the opportunities created by closer cooperation within our
company. In the past we have placed great weight on decen-
tralization, and strong units that operate as independently as
possible. That has many advantages and we want to continue
benefiting from them, but in some cases it means lost syner-
gies and untapped potential. I am convinced that with our
current size and structure, closer cooperation will create addi-
tional benefits. That is why I am pushing this development
forward, along with my colleagues on the Management Board.
Some first, very promising steps have been taken. For exam-
ple, Fresenius Medical Care is supporting Fresenius Kabi on
its entry into the North American infusion solutions market.
In other parts of the world, Fresenius Kabi is already a leading
producer of these products. In North America, Fresenius
Medical Care has large production and logistical capacities.
Through a close collaboration of these two business seg-
ments, we want to achieve low production and logistics costs
while providing a high-quality, fast and reliable supply.
In the announced acquisition of Clínica Medellín by Quirón-
salud, it was also a great advantage that Fresenius Medical
Care and Fresenius Kabi have been operating successfully in
Colom bia for years. Fresenius Medical Care already operates
a dialysis center in Clínica Medellín, and Fresenius Kabi is cur-
rently working with the company to establish a blood bank.
We want to expand this cooperation and bring in Fresenius
Vamed, as we also plan more growth in the Andes region.
Fresenius Vamed and Fresenius Helios have been working
very closely together in Spain and Germany on medical tech-
nology procurement, hospital construction, and non-medical
services.
We are also working to network more closely together our
employees, who now number more than 270,000. They all
want to help patients, and there is enormous potential there.
We want to encourage it, and get even more from it for our
company.
Above all, one thing remains crystal clear to us: The well-
being of patients is the key to our success! If they are doing
well, Fresenius will do well. And then you also profit, dear
shareholders.
With warm regards,
Stephan Sturm
Chairman of the Management Board

14
Managem
ent Board
Management Board
Dr. Francesco De Meo
Business Segment
Fresenius Helios
Dr. Ernst Wastler
Business Segment
Fresenius Vamed
MANAGEMENT BOARD

15
Man
agem
ent
Boa
rd
Management Board
Mats Henriksson
Business Segment
Fresenius Kabi
Stephan Sturm
Chairman of the
Management Board
Rachel Empey
Chief Financial Officer
Dr. Jürgen Götz
Chief Legal and
Compliance Officer,
and Labor Relations
Director
Rice Powell
Business Segment
Fresenius Medical Care

Supervisory B
oard Report
Report of the Supervisory Board16
REPORT OF THE SUPERVISORY BOARDIn 2018, the Supervisory Board of Fresenius SE & Co. KGaA fulfilled its obligations in accordance with the
provisions of the law, the articles of association, and the rules of procedure. It regularly advised the Manage-
ment Board of the general partner, Fresenius Management SE, regarding the management of the Company
and supervised the management in accordance with its Supervisory Board responsibilities.
COOPERATION BETWEEN THE MANAGEMENT AND THE SUPERVISORY BOARDCarrying out its monitoring and advisory activities, the Supervisory Board was regularly kept informed by
the management in a timely and comprehensive oral and written manner – about, among other things:
▶ all important matters relating to business policy,
▶ the course of business,
▶ profitability,
▶ the situation of the Company and of the Group,
▶ corporate strategy and planning,
▶ the risk situation,
▶ risk management and compliance, and
▶ important business events.

Sup
ervi
sory
Boa
rd R
epor
t
Report of the Supervisory Board 17
Based on the reports provided by the Management Board of the general partner, the Supervisory Board
discussed all significant business transactions in both the Audit Committee and in its plenary meetings. The
Management Board of the general partner discussed the Company’s strategic direction with the Supervisory
Board. The Supervisory Board passed resolutions within its legal and Company statutory authority.
The Supervisory Board of Fresenius SE & Co. KGaA convened for four regular meetings in 2018 – in March,
May, October, and December. Before the meetings, the Management Board of the general partner sent
detailed reports and comprehensive approval documents to the members of the Supervisory Board. At the
meetings, the Supervisory Board discussed in detail the sales and earnings growth, based on the reports
provided by the general partner’s Management Board. They also discussed significant Company decisions.
All matters requiring Supervisory Board approval were submitted with sufficient time for proper scrutiny.
After reviewing the related approval documents and following detailed consultation with the Management
Board of the general partner, the Supervisory Board approved all matters submitted to it.
The Supervisory Board was also informed about any important business events occurring between meet-
ings. In addition, the Chairman of the general partner’s Management Board regularly informed the Chair-
man of the Supervisory Board in separate meetings about the latest development of the business and forth-
coming decisions and discussed them with him.
Every member of the Supervisory Board of Fresenius SE & Co. KGaA attended all of the Supervisory Board
Meetings in 2018.
Participation in meetings of the Supervisory Board and the Audit Committee is reported individually for
all members on the Company’s website. Information on this can be found under “Supervisory Board”.
MAIN FOCUS OF THE SUPERVISORY BOARD’S ACTIVITIESIn 2018, the Supervisory Board mostly focused its monitoring and consulting activities on business opera-
tions and investments by the business segments. The Supervisory Board thoroughly reviewed and discussed
all business activities of significance to the Company with the Management Board. This related to the

Supervisory B
oard Report
Report of the Supervisory Board18
intended acquisition of Akorn, Inc., USA (Akorn) by Fresenius Kabi and the related litigation, and invest-
ments in the expansion of existing production facilities of Fresenius Kabi. The Supervisory Board also dealt
with the following items:
▶ 2019 budget
▶ medium-term strategy of the Fresenius Group
▶ business segment strategies (particularly the business outlook for Fresenius Helios
and Fresenius Medical Care)
▶ auditor rotation (scheduled for the annual financial statements for 2020)
At its meetings and within the Audit Committee, the Supervisory Board also kept itself regularly informed
about the Group’s risk situation and risk management activities, as well as compliance.
At the meeting on March 16, 2018, the Supervisory Board dealt intensively with the audit and approval
of the financial statements, the consolidated financial statements (IFRS), as well as the management report
and consolidated management report of Fresenius SE & Co. KGaA. The results for 2017 were discussed on
the basis of a detailed report provided by the Chairman of the Audit Committee and statements by the audi-
tor. At the same meeting, a resolution was passed on profit distribution proposed by the general partner,
Fresenius Management SE, and the Group Non-financial Report for 2017.
In addition, the business segments reported in detail on the course of business in the first two months of
the fiscal year. The focus was on Fresenius Medical Care. Furthermore, the Supervisory Board was informed
by Fresenius Kabi about the status of the Akorn transaction and the plans to expand the Fresenius Kabi
plants in Melrose Park, United States, and Haina, Dominican Republic. Another item discussed was the agenda
of the Annual General Meeting of Fresenius SE & Co. KGaA on May 18, 2018. The Supervisory Board also
dealt with IT security (“cybersecurity”). Finally, the Supervisory Board conducted its annual efficiency review
at this meeting.
At its meeting on May 18, 2018, immediately following the Annual General Meeting, the Supervisory
Board passed resolutions on the appointment of the auditor of the annual and consolidated financial statements
for 2018. In addition, the Management Board reported on business performance for the months January
through April 2018. Furthermore, the Supervisory Board was informed about the status of the Akorn trans-
action and the litigation related to it.
At the Supervisory Board meeting on October 19, 2018, the members of the Supervisory Board were
informed in detail about business performance from January through September 2018. The focus was on

Sup
ervi
sory
Boa
rd R
epor
t
Report of the Supervisory Board 19
the Fresenius Helios business segment. The Management Board of the general partner reported on the
biosimilars business of Fresenius Kabi, the Akorn litigation, and the effects of the withdrawal of the United
Kingdom from the European Union on the Fresenius Group.
The meeting of the Supervisory Board on December 7, 2018, focused on the development of business
in 2018. Plans for the years 2019 to 2021 for the Group and separately for all four segments were also pre-
sented. The Chairman of the Audit Committee reported in detail on the status of preparation of financial
statements. Additional focal points were the deliberations on the rotation of the auditor planned for 2020 and
the resolution on the recommendation of the Audit Committee on the proposal for the selection of the auditor
for 2020. In addition, resolutions were passed on the Declaration of Conformity with the German Corporate
Governance Code and on the commissioning of the auditor of the Group Non-financial Report of Fresenius
SE & Co. KGaA for 2018. In addition, the members of the Supervisory Board dealt with compliance, regulatory
issues, and legal risks, as well as the Akorn litigation.
CORPORATE GOVERNANCEOn December 20, 2018, the Supervisory Board and the Management Board of the general partner jointly
issued a Declaration of Conformity in accordance with the German Corporate Governance Code under Sec-
tion 161 of the German Stock Corporation Act (AktG).
The Management Board of the general partner and the Supervisory Board of Fresenius SE & Co. KGaA
have a duty to act in the best interests of the Company. In performing their activities, they do not pursue per-
sonal interests or bestow unjustified benefits on others. Any secondary activities or dealings with the Com-
pany by members of the corporate bodies must immediately be reported to, and approved by, the Supervisory
Board.
Prof. Dr. med. D. Michael Albrecht is a member of the Supervisory Board of our Company and medical
director and spokesman for the management board of the University Hospital Carl Gustav Carus Dresden, as
well as a member of the supervisory board of the University Hospital in Aachen. The Fresenius Group main-
tains regular business relationships with these hospitals in line with normal market conditions. Mr. Klaus-
Peter Müller is a member of the Supervisory Board and chairman of the Audit Committee of our Company and
a member of the Supervisory Board of Fresenius Management SE. He was also Chairman of the Super visory
Board of Commerzbank AG until May 8, 2018. The Fresenius Group maintains business relations with Com-
merzbank under normal market conditions. Mr. Michael Diekmann is Deputy Chairman of the Supervisory
Board and a member of the Supervisory Board of Fresenius Management SE. He is also a member of the Super-
visory Board of Allianz SE. In 2018, the Fresenius Group paid insurance premiums to Allianz under normal
market conditions.

Supervisory B
oard Report
Report of the Supervisory Board20
There are no direct consultant or other service agreements between the Company and any member of the
Supervisory Board.
There are regular separate preliminary meetings of the employee representatives and consultations
among the shareholder representatives.
For more information on Corporate Governance at Fresenius, please refer to the Corporate Governance
Declaration and Report on pages 131 to 162 of the Annual Report. Fresenius has disclosed the information
on related parties in its quarterly reports and on page 258 of the Annual Report.
GROUP NON-FINANCIAL REPORTKPMG AG Wirtschaftsprüfungsgesellschaft, Berlin, audited the Group Non-financial Report for 2018. This
was done in accordance with a resolution of the Supervisory Board of December 7, 2018, and the subsequent
appointment.
The Group Non-financial Report and the audit report of the appointed auditor were made available to
each member of the Supervisory Board of the Company in good time. At their meetings on March 13 and 14,
2019, the Audit Committee and then the Supervisory Board discussed all the documents in detail.
The auditor delivered a detailed report on the results of the audit at each of these meetings. The Audit
Committee and the Supervisory Board approved the auditor’s findings. The Audit Committee’s and the
Supervisory Board’s own review also found no objections to the Group Non-financial Report. At its meeting
on March 14, 2019, the Supervisory Board approved the Group Non-financial Report presented by the
general partner.
The Group Non-financial Report is published on pages 92 to 130 of the Annual Report and the auditor’s
findings are published on page 129 f. of the Annual Report.
WORK OF THE COMMITTEESThe Audit Committee held three meetings and four conference calls in 2018. The main focus of its monitor-
ing activities was on the preliminary audit of the annual financial statements of Fresenius SE & Co. KGaA and
the Group for 2017 and discussions with the auditor about their reports and the terms of reference of the
audit. Another matter dealt with by the Audit Committee was its recommendation to the Supervisory Board

Sup
ervi
sory
Boa
rd R
epor
t
Report of the Supervisory Board 21
regarding which auditing firm to propose as auditor for the annual financial statements of Fresenius
SE & Co. KGaA and the Group for 2018. The Supervisory Board’s proposal to the Annual General Meeting in
2018 to elect KPMG AG Wirtschaftsprüfungsgesellschaft, Berlin, as auditor was based on a recommendation
to this effect by the Audit Committee. The Audit Committee also dealt with the following items in detail:
▶ the 2018 quarterly reports,
▶ monitoring reports on progress of acquisitions,
▶ compliance,
▶ review of the risk management system, the internal control system, and the internal auditing system,
▶ preparation of the selection of the auditor for the annual financial statements for 2020 (auditor rotation),
and
▶ approval of non-auditing services provided by KPMG AG Wirtschaftsprüfungsgesellschaft, Berlin.
The Chairman of the Audit Committee reported regularly in subsequent Supervisory Board meetings on the
work of the committee.
The Chairman of the Audit Committee maintains a regular dialog between the Supervisory Board and the
Audit Committee on the one hand, and auditors on the other, even outside of meetings.
The Company’s Nomination Committee did not meet in 2018.
The Joint Committee is responsible for approving certain important transactions of Fresenius SE &
Co. KGaA and certain legal transactions between the Company and the Else Kröner-Fresenius Foundation.
In 2018, there were no transactions conducted that required its approval. For this reason, it did not meet
in 2018.
There is no Mediation Committee because the Supervisory Board of Fresenius SE & Co. KGaA does not
appoint the Management Board members of Fresenius Management SE.
For more information about the committees, their composition, and their work methods, please refer to
the Corporate Governance Declaration and Report on pages 135 and 136 and page 271 of the Annual
Report.

Supervisory B
oard Report
Report of the Supervisory Board22
PERSONNELMr. Rainer Stein retired from the Supervisory Board of Fresenius SE & Co. KGaA on August 31, 2018. He was
succeeded on the Board by Mr. Bernd Behlert with effect from September 1, 2018. At its meeting on May 18,
2018, the Supervisory Board elected Mr. Niko Stumpfögger as a member of the Audit Committee with effect
from the date of Mr. Rainer Stein’s resignation.
In 2018, there were no changes in the composition of the Management Board of the general partner
Fresenius Management SE.
FINANCIAL STATEMENTS AND CONSOLIDATED FINANCIAL STATEMENTSKPMG AG Wirtschaftsprüfungsgesellschaft, Berlin, audited the accounting records, the annual financial
statements prepared in accordance with the accounting principles of the German Commercial Code (HGB),
and the Company’s management report for 2018. The firm was elected as auditor in accordance with a
resolution passed at the Annual General Meeting of Fresenius SE & Co. KGaA on May 18, 2018, and was sub-
sequently commissioned by the Super visory Board. The Company’s financial statements, management
report, and the consolidated financial statements were prepared in accordance with IFRS accounting princi-
ples and with the regulations governing such statements under Section 315e of the German Commercial
Code (HGB). The auditors of KPMG issued their unqualified audit opinion for these statements.
The financial statement, the consolidated financial statement, the Management Reports, and the audi-
tor’s reports were submitted to each member of the Company’s Supervisory Board within the required time.
At their meetings on March 13 and 14, 2019, the Audit Committee and then the Supervisory Board dis-
cussed all the documents in detail.
The auditor gave a detailed report on the results of the audit at each of these meetings. The auditor found
no weaknesses in the risk management system or the internal control system with regard to the accounting
process. The auditor attended all meetings of the Supervisory Board and all meetings and conference calls
of the Audit Committee.
The Audit Committee and the Supervisory Board approved the auditor’s findings. Independent reviews
by the Audit Committee and the Supervisory Board raised no objections to the Company’s financial state-
ments and Management Report or the consolidated financial statements and the Group Management Reports.
At its meeting on March 14, 2019, the Supervisory Board approved the financial statements and Manage-
ment Reports presented by the general partner and the statements contained therein with respect to future
development.
Sup
ervi
sory
Boa
rd R
epor
t
Report of the Supervisory Board 23
The Supervisory Board concurs with the general partner’s proposal on the 2018 profit distribution.
The Supervisory Board would like to thank the members of the Management Board of the general part-
ner and all employees for their achievements.
Bad Homburg v. d. H., March 14, 2019
The Supervisory Board of Fresenius SE & Co. KGaA
Dr. Gerd Krick
Chairman

Business S
egments
Business Segments24
FRESENIUS MEDICAL CARE. Operating per- formance in 2018 was influenced by special items. We were able to increase the number of dialysis patients treated worldwide, further strengthening our market position.
Fresenius Medical Care is the world’s leading provider of
products and services for people with chronic kidney failure.
Around 3.4 million patients with this disease worldwide regu-
larly undergo dialysis treatment. When the kidney function
of patients with this disease fails, dialysis takes over the
vital task of cleansing the blood of toxins and surplus water.
Fresenius Medical Care offers products and services along
the entire dialysis value chain from a single source. We care
for more than 333,000 patients in our global network of more
than 3,900 dialysis clinics. At the same time, we operate
42 production sites, to provide dialysis products such as dia-
lysis machines, dialyzers, and related dis posables.
Our strategy is geared towards sustainable growth. We
aim to continuously improve the quality of life of patients with
kidney disease by offering innovative products and treatment
concepts of the highest quality.
BUSINESS DEVELOPMENTFresenius Medical Care decreased sales by 7% to € 16,547
million in 2018 (currency adjusted: - 2%). Organic sales
growth was 4%. The application of IFRS 15 reduced sales by
3%. With the prior-year basis additionally adjusted for
divested Care Coordination activities, sales in fiscal year 2018
decreased by 1% (increased by 4% in constant currency).
Health care services sales 1 (dialysis services and Care
Coordination) decreased by 2% (increased by 4% in constant
currency) to € 13,264 million. Sales of health care products
(e. g., dia ly sis products) increased by 1% (5% in constant cur-
rency) to € 3,283 million.
EBIT increased by 29% to € 3,038 million (2017:
€ 2,362 million). The increase is mainly attributable to the
divested Care Coordination activities. The EBIT margin was
18.4% (2017: 13.3%). EBIT on a comparable basis1 increased
by 6%; the EBIT margin 1, was 14.2% (2017: 13.6%).
SALES BY REGION
€ in millions 2018 2017 Change
Currency translation
effects
% of total Fresenius
Medical Caresales
North America 11,570 12,879 - 10% - 4% 70%
Europe / Middle East / Africa 2,587 2,547 2% - 2% 16%
Asia-Pacific 1,689 1,623 4% - 4% 10%
Latin America 686 720 - 5% - 27% 4%
Corporate 15 15 0% 0% 0%
Total 16,547 17,784 - 7% - 5% 100%
1 On a comparable basis
For a detailed reconciliation please refer to the tables on page 60.
Bus
ines
s S
egm
ents
Business Segments Fresenius Medical Care 25
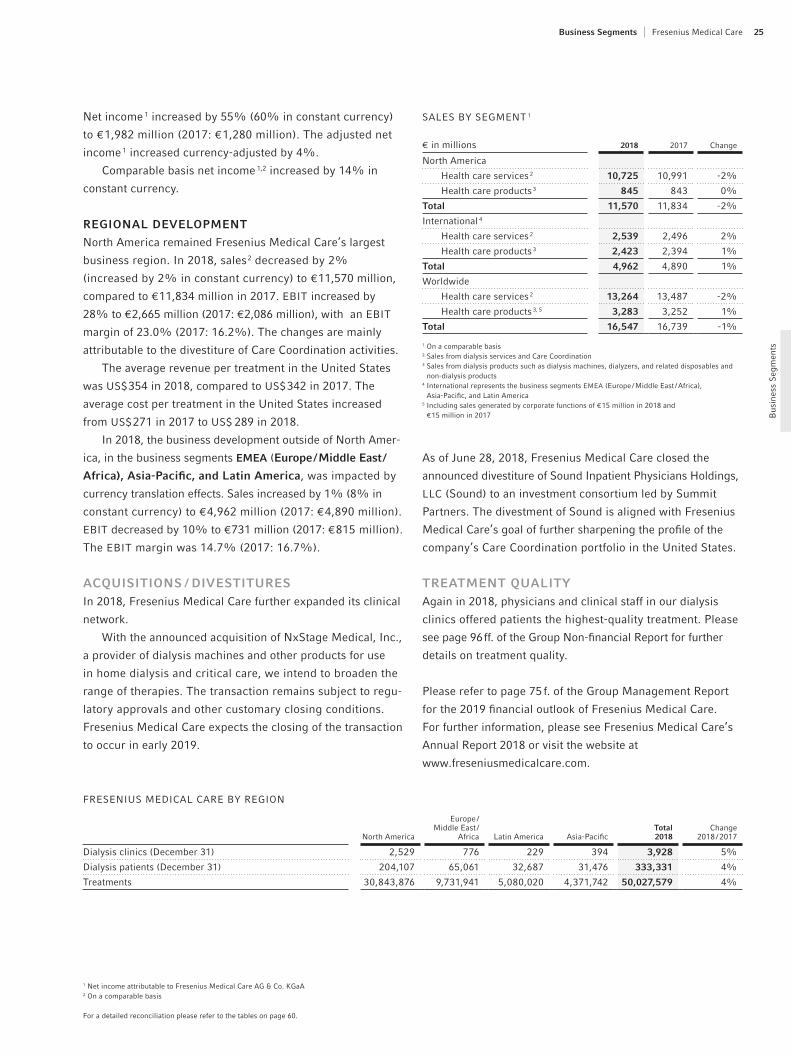
Net income 1 increased by 55% (60% in constant currency)
to € 1,982 million (2017: € 1,280 million). The adjusted net
income 1 increased currency-adjusted by 4%.
Comparable basis net income 1,2 increased by 14% in
constant currency.
REGIONAL DEVELOPMENT
North America remained Fresenius Medical Care’s largest
business region. In 2018, sales 2 decreased by 2%
(increased by 2% in constant currency) to € 11,570 million,
compared to € 11,834 million in 2017. EBIT increased by
28% to € 2,665 million (2017: € 2,086 million), with an EBIT
margin of 23.0% (2017: 16.2%). The changes are mainly
attributable to the divestiture of Care Coordination activities.
The average revenue per treatment in the United States
was US$ 354 in 2018, compared to US$ 342 in 2017. The
average cost per treatment in the United States increased
from US$ 271 in 2017 to US$ 289 in 2018.
In 2018, the business development outside of North Amer-
ica, in the business segments EMEA (Europe / Middle East /
Africa), Asia-Pacific, and Latin America, was impacted by
currency translation effects. Sales increased by 1% (8% in
constant currency) to € 4,962 million (2017: € 4,890 million).
EBIT decreased by 10% to € 731 million (2017: € 815 million).
The EBIT margin was 14.7% (2017: 16.7%).
ACQUISITIONS / DIVESTITURES In 2018, Fresenius Medical Care further expanded its clinical
network.
With the announced acquisition of NxStage Medical, Inc.,
a provider of dialysis machines and other products for use
in home dialysis and critical care, we intend to broaden the
range of therapies. The transaction remains subject to regu-
latory approvals and other customary closing conditions.
Fresenius Medical Care expects the closing of the transaction
to occur in early 2019.
As of June 28, 2018, Fresenius Medical Care closed the
announced divestiture of Sound Inpatient Physicians Holdings,
LLC (Sound) to an investment consortium led by Summit
Partners. The divestment of Sound is aligned with Fresenius
Medical Care’s goal of further sharpening the profile of the
company’s Care Coordination portfolio in the United States.
TREATMENT QUALITYAgain in 2018, physicians and clinical staff in our dialysis
clinics offered patients the highest-quality treatment. Please
see page 96 ff. of the Group Non-financial Report for further
details on treatment quality.
Please refer to page 75 f. of the Group Management Report
for the 2019 financial outlook of Fresenius Medical Care.
For further information, please see Fresenius Medical Care’s
Annual Report 2018 or visit the website at
www.freseniusmedicalcare.com.
North America
Europe / Middle East /
Africa Latin America Asia-PacificTotal2018
Change2018 / 2017
Dialysis clinics (December 31) 2,529 776 229 394 3,928 5%
Dialysis patients (December 31) 204,107 65,061 32,687 31,476 333,331 4%
Treatments 30,843,876 9,731,941 5,080,020 4,371,742 50,027,579 4%
FRESENIUS MEDICAL CARE BY REGION
€ in millions 2018 2017 Change
North America
Health care services 2 10,725 10,991 - 2%
Health care products 3 845 843 0%
Total 11,570 11,834 - 2%
International 4
Health care services 2 2,539 2,496 2%
Health care products 3 2,423 2,394 1%
Total 4,962 4,890 1%
Worldwide
Health care services 2 13,264 13,487 - 2%
Health care products 3, 5 3,283 3,252 1%
Total 16,547 16,739 - 1%
1 On a comparable basis2 Sales from dialysis services and Care Coordination3 Sales from dialysis products such as dialysis machines, dialyzers, and related disposables and
non-dialysis products4 International represents the business segments EMEA (Europe / Middle East / Africa),
Asia-Pacific, and Latin America5 Including sales generated by corporate functions of € 15 million in 2018 and
€ 15 million in 2017
SALES BY SEGMENT 1
1 Net income attributable to Fresenius Medical Care AG & Co. KGaA2 On a comparable basis
For a detailed reconciliation please refer to the tables on page 60.

Business S
egments
Business Segments26
FRESENIUS KABI. Our business grew across all regions and product segments in 2018. Organic sales growth of 7% and EBIT growth in constant currency of 2% significantly exceeded original expectations.
Fresenius Kabi specializes in the therapy and care of chronic-
ally and critically ill people. The portfolio includes IV drugs,
i. e., intravenously administered generic anesthetics, anal gesics,
anti-infectives, and drugs for the treatment of oncol ogical
and other critical diseases. We are also developing biosimi-
lars with a focus on oncology and autoimmune diseases.
Another product segment is clinical nutrition. In this segment,
we are one of the few companies worldwide that offer both
parenteral and enteral nutrition products. The infusion ther-
apy portfolio includes infusion solutions and blood volume
substitutes. In the medical devices / transfusion technology
segment, we offer infusion and nutrition pumps, as well as
consumables, for the administration of pharmaceuticals and
clinical nutrition products. Moreover, our portfolio includes
products used in the collection and processing of blood com-
ponents, as well as in transfusion medicine.
BUSINESS DEVELOPMENTSales increased by 3% to € 6,544 million in 2018. Organic sales
growth was 7%. Negative currency translation effects (4%)
were mainly related to the devaluation of the U.S. dollar, the
Brazilian real, and the Argentinian peso against the euro.
In Europe, we achieved organic sales growth of 3%
based on the good development of the clinical nutrition prod-
uct segment. In North America, organic sales growth was
8%, driven by persisting IV drug shortages and new product
launches. Fresenius Kabi also showed strong overall growth
in the emerging markets. We achieved organic sales growth of
17% in Latin America. In Asia-Pacific we achieved organic
sales growth of 12%.
€ in millions 2018 2017 Change
Currency translation
effects
% of total Fresenius Kabi
sales
Europe 2,248 2,214 2% - 1% 34%
North America 2,359 2,290 3% - 5% 36%
Asia-Pacific 1,300 1,196 9% - 3% 20%
Latin America / Africa 637 658 - 3% - 15% 10%
Total 6,544 6,358 3% - 4% 100%
SALES BY REGION

Bus
ines
s S
egm
ents
Business Segments Fresenius Kabi 27
ACQUISITIONS / INVESTMENTSIn the lawsuit by Akorn, Inc., a U.S.-based manufacturer and
marketer of prescription and over-the-counter pharmaceuti-
cal products, against Fresenius for the consummation of the
April 2017 merger agreement, the Supreme Court in the U.S.
state of Delaware ruled in favor of Fresenius on December 7,
2018. As this is the highest Court in Delaware, no further
appeal is possible (for further details please see page 67).
In the United States, we are expanding our plant in Mel-
rose Park, near Chicago, into a state-of-the-art campus for
the manufacture of intravenously administered drugs. The
investment volume for this expansion amounts to approxi-
mately US$ 350 million. At our existing site in Wilson, North
Carolina, we will invest approximately US$ 350 million in
the construction of a new manufacturing facility.
Enteral nutrition products are Fresenius Kabi’s fastest-
growing product segment. Due to strong demand, we will
create additional production capacities: last year, we started
to expand our plant in Wuxi, China, to produce enteral nutri-
tion products. Production is scheduled to start in 2019. We
are also expanding our production capacities in Europe, where
we will invest almost € 100 million in our plant in Emmer-
Compascuum, Netherlands.
PRODUCT SEGMENTSIn the generic IV drugs segment, we have expanded our
product portfolio to additional regional markets. There were
more than 90 product launches of IV drugs worldwide. In the
biosimilars segment, we took an important step in the future
commercialization of our biosimilar products with the con-
clusion of a global settlement and license agreement with
AbbVie for our biosimilar candidate of AbbVie’s Humira®.
Subject to regulatory approval, we will be able to market our
biosimilar candidate in the United States from September 30,
2023. Fresenius Kabi expects to launch the product in
Europe from the first half of 2019 onwards.
In clinical nutrition, we further expanded the market
presence of our products for parenteral nutrition. With our
three-chamber bags, we are the global leader in the multi-
chamber bag product segment for parenteral nutrition. In
2018, we launched our new product SmofKabiven extra
Nitrogen, a three-chamber bag with a special protein-energy
ratio, in Europe. We also introduced a new product line in
enteral nutrition in the year under review: Fresubin 2kcal
Savoury is a high-calorie, high-protein formula that we
launched in Europe and Latin America.
In infusion therapy, we launched our isotonic sodium
chloride solution in the freeflex bag in the United States.
In 2018, we continued to move forward with the inter-
nationalization of our product range and we introduced
new products in our medical devices / transfusion technol-
ogy business segment. For example, for our new Agilia SP
PCA infusion pump and our new Amika+ nutrition pump we
received CE marking and started launch activities worldwide.
Please refer to pages 75 f. of the Group Management Report
for the 2019 financial outlook of Fresenius Kabi. For further
information, please see Fresenius Kabi’s website at
www.fresenius-kabi.com.
1 Before special items; before expenditures for further development of biosimilars business. For a detailed overview of special items and adjustments please see the reconciliation table on page 61.
EBIT 1 rose by 5% to € 1,305 million. Currency translation had
a negative effect of 5%.
Sales by product segment were as follows:
€ in millions 2018 2017 Change
Europe 355 351 1%
North America 894 853 5%
Asia-Pacific / Latin America / Africa 398 373 7%
Administrative and corporate R & D expenses - 508 - 400 27%
EBIT 1 1,139 1,177 - 3%
EBIT excl. biosimilars 1 1,305 1,237 5%
EBIT margin excl. biosimilars 1 19.9% 19.5%
Net income 1, 2 742 702 6%
1 Before special items2 Net income attributable to the shareholders of Fresenius SE & Co. KGaA
€ in millions 2018 2017Organic
sales growth
IV drugs 2,735 2,699 5%
Clinical nutrition 1,796 1,671 13%
Infusion therapy 929 903 7%
Medical devices / Transfusion technology 1,084 1,085 4%
Total 6,544 6,358 7%

Business S
egments
Business Segments28
FRESENIUS HELIOS. The business development in 2018 was a mixed picture. While preparatory measures for expected regulatory requirements and a decline in the number of admissions weighed on business at Helios Germany, Helios Spain continued to show dynamic growth.
Fresenius Helios is Europe’s leading private hospital operator.
The company comprises Helios Germany and Helios Spain
(Quirónsalud); both are part of the holding company Helios
Health. Helios Germany operates 86 hos pitals, around 125 1
outpatient clinics, and 10 1 prevention centers. The company is
the largest provider of inpatient and outpatient care in Ger-
many. Helios Germany offers high-quality treatment across
the entire range of medical services. Quirónsalud operates
47 hospitals, 57 outpatient centers, and around 300 Occupa-
tional Risk Prevention (ORP) centers. Quirónsalud is Spain’s
largest private hospital operator with a comprehensive range
of inpatient and outpatient medical care.
BUSINESS DEVELOPMENTFresenius Helios increased sales by 4% (6% 2) to € 8,993 mil-
lion in 2018. Organic sales growth was 3%.
Sales of Helios Germany decreased by 2% (increased by
2% 2) to € 5,970 million. Organic sales growth was 2%. Sales
are impacted by a decline in admissions, inter alia due to a
trend towards outpatient treatments. In addition, vacancies
among specialized nurses and doctors in some of our hospitals
led to a decline in the number of cases. Measures to swiftly
fill vacant positions have been intensified. In order to benefit
from the trend towards outpatient treatments, Helios Ger-
many is expanding outpatient services in a separate division.
In addition, a new business segment was established to
develop attractive innovative business models and exploit
resulting growth opportunities.
Helios Spain increased sales by 17% to € 3,023 million.
Quirónsalud has been consolidated since February 1, 2017.
Organic sales growth was 6%.
EBIT of Fresenius Helios remained on the previous year’s
level at € 1,052 million (increased by 3% 2). The EBIT margin
was 11.7%. EBIT of Helios Germany decreased by 14%
(- 10% 2) to € 625 million with a margin of 10.5%. Given a sig-
nificant fixed-cost base, top-line performance impacts EBIT
over-proportionately. Additionally, EBIT development of Helios
Germany is negatively affected by DRG catalogue effects,
preparatory initiatives for expected regulatory requirements
(e. g., clustering), and a lack of privatization opportunities
in the German market. An unexpectedly high fluctuation rate
1 The year-on-year increase is mainly related to a changed reporting method. The figures now include locations instead of corporate entities. 2 Adjusted for German post-acute care business transferred from Fresenius Helios to Fresenius Vamed
€ in millions 2018 2017 Change
Sales 8,993 8,668 4%
Helios Germany 5,970 6,074 - 2%
Helios Spain 3,023 2,594 17%
EBIT 1,052 1,052 0%
Helios Germany 625 725 - 14%
Helios Spain 413 327 26%
EBIT margin in % 11.7 12.1
Helios Germany 10.5 11.9
Helios Spain 13.7 12.6
Net income 1 686 728 - 6%
2017: 11 months’ contribution of Helios Spain
1 Net income attributable to shareholders of Fresenius SE & Co. KGaA
SALES AND EARNINGS DEVELOPMENT

Bus
ines
s S
egm
ents
Business Segments Fresenius Helios 29
among doctors and the shortage of personnel in the field of
nursing had an additional negative impact on earnings.
EBIT of Helios Spain increased by 26% to € 413 million,
mainly due to the strong operating performance and the
additional month of consolidation compared to the prior-year
period, with a margin of 13.7%.
TRANSFER OF POST-ACUTE CARE BUSINESSOn July 1, 2018, 38 health care facilities and 13 service com-
panies in Germany specializing in inpatient rehabilitation and
care were transferred from Fresenius Helios to Fresenius
Vamed. Fresenius Helios will now focus even more strongly
on the acute care hospital business and its continued inter-
nationalization. The strategic focus of Fresenius Helios will
remain on its acute care hospitals, as well as the outpatient
acute care – including preventative medicine – and outpatient
post-acute care. The transaction had a total volume of € 468
million.
ACQUISITIONS / NEW HOSPITAL BUILDINGSIn September 2018, Helios Spain opened a new hospital in
Córdoba. The company now has six hospitals in Andalusia.
Quirónsalud has invested € 50 million in this new hospital.
In October 2018, it was announced that Helios Spain had
entered the attractive private hospital market in Colombia
with the acquisition of Clínica Medellín. Clínica Medellín oper-
ates two centrally located hospitals in Medellín, a major city
of 2.5 million people. The two facilities have a total of about
185 beds. The total investment for Clínica Medellín is more
than € 50 million. Fresenius Helios expects the trans action to
close in Q1 2019, pending antitrust and regulatory clearance.
INVESTMENTSIn 2018, Fresenius Helios invested a total of € 634 million
(2017: € 6,508 million). Of this, € 60 million accounted for
acquisitions. The main focus of investment in Germany was
new construction and the modernization of hospitals in Duis-
burg, Dachau, Wiesbaden, and Wuppertal, among other
locations.
In Spain we are investing around € 40 million in the con-
struction of a proton beam therapy center in Madrid. Sched-
uled for opening at the end of 2019, it will be the first facility
of this type for treating cancer patients in Spain.
Further, we are investing around € 30 million in a new
hospital site in Torrejón, which is located just outside of
Madrid. The opening of the new facility is planned for 2021.
ACT TO ENHANCE NURSE STAFFING LEVELSThe Act to Enhance Nurse Staffing Levels (PpSG) entered
into force on January 1, 2019 in Germany. From 2020, nurs-
ing costs will be deducted from the standardized base rates
and the costs for direct nursing patient care will instead be
fully reimbursed by the health insurance companies via sepa-
rate care budgets. In 2019, each additional nursing job car-
ing for bedridden patients – compared to 2018 – will be fully
reimbursed by health insurers. In addition, from 2019, a reg-
ulation setting a minimum limit for nursing will apply to hos-
pitals in Germany for the following areas: geriatrics, inten-
sive care, cardiology, and trauma surgery. This regulation is
valid for one year and is intended as a provisional measure.
From 2020, GKV1 and DKG2 will jointly set minimum limits for
additional areas in hospitals as well.
Please refer to pages 75 f. of the Group Management Report
for the 2019 financial outlook of Fresenius Helios.
For further information on Fresenius Helios, please see
www.helios-gesundheit.de (in German only) and
www.quironsalud.es/en (in Spanish and English).
2018 2017 Change
Acute clinics Germany 83 88 - 6%
Beds 28,802 29,438 - 2%
Dwell time (days) 5.9 6.2
Acute clinics Spain 47 45 4%
Beds 7,019 6,652 6%
Dwell time (days) 4.2 4.3
Patient numbers Germany 5,321,445 5,324,164 0%
Patients treated in hospital 1,218,199 1,237,068 - 2%
Patients treated as outpatients 4,073,047 4,028,503 1%
Patient numbers Spain 13,318,066 11,592,758 15%
Patients treated in hospital 437,855 353,307 24%
Patients treated as outpatients 12,880,211 11,239,451 15%
1 Central Association of the Statutory Health Insurance Funds2 German Hospital Association

Business S
egments
Business Segments30
FRESENIUS VAMED. Our company developed very well in 2018 and achieved both its sales target and its earnings target, which had been increased in the course of the year. The acquisition of post-acute care facilities in Germany strengthens our ser-vice business. A strong order book secures future growth in the project business.
Fresenius Vamed manages projects, provides services for hos-
pitals and other health care facilities worldwide, and is a
leading post-acute care provider in Central Europe. Our port-
folio ranges along the entire value chain: from project devel-
opment, planning, and turnkey construction, via maintenance
and technical management, to total operational management,
as illustrated in the diagram on page 31. Our offerings target
different areas of health care, from prevention to acute care,
rehabilitation, and nursing care. This comprehensive range of
competencies enables us to support complex health care
facilities efficiently and successfully at each stage of their life
cycle. As a specialist provider that can deliver the full spec-
trum of services worldwide, we are in a unique position. We
have thus far successfully completed more than 900 projects
in about 90 countries.
BUSINESS DEVELOPMENTIn 2018, Fresenius Vamed increased sales by 37% to
€ 1,688 million. Organic growth was 16%. Currency trans-
lation effects had no major impact on sales.
The table shows the sales development by activity:
EBIT grew by 45% (9% 1) to € 110 million (2017: € 76 mil-
lion). The EBIT margin increased to 6.5% (2017: 6.2%). EBIT
in the project business increased by 11% to € 30 million. In
the service business, EBIT grew by 63% to € 80 million. Net
income 2 improved to € 72 million (2017: € 50 million).
PROJECT BUSINESSVAMED’s project business comprises the consulting, project
development, planning, turnkey construction, and financing
management of projects. VAMED responds flexibly to the
local needs of clients, providing custom-tailored solutions all
from one source. We also carry out projects in cooperation
with partners. With 25 implemented projects, VAMED is a pio-
neer in public-private partnership (PPP) projects.
In Europe, VAMED has continued its positive development.
Among other things, we moved forward with construction
and modernization of the University Hospital Schleswig-
Holstein (UKSH), the largest PPP project in the German health
care sector. The handover of the new buildings at the two
locations in Kiel and Lübeck is planned for the second half of
2019. We were commissioned with the turnkey construction
of a research facility in Potsdam. In Austria and Switzerland,
€ in millions 2018 2017 Change
% of total Fresenius
Vamed sales
Project business 712 606 17% 42%
Service business 976 622 57% 58%
1 Adjusted for German post-acute care business transferred from Fresenius Helios to Fresenius Vamed2 Net income attributable to VAMED AG
€ in millions 2018 2017 Change
% of total Fresenius
Vamed sales
Europe 1,312 889 48% 78%
Africa 109 92 18% 6%
Asia-Pacific 221 200 11% 13%
Latin America 46 47 - 2% 3%
Total 1,688 1,228 37% 100%
SALES BY REGION

Bus
ines
s S
egm
ents
Business Segments Fresenius Vamed 31
VAMED VALUE CHAIN
Project development and consulting
Planning and financial engineering
Project management and construction
Services ▶ technical▶ commercial▶ infrastructural
Operational management▶ technical management▶ total operational
management
Project business Service business
we received orders to expand rehabilitation clinics. In Bosnia-
Herzegovina, we completed the new clinic center in Banja
Luka, the largest health care facility in the region. We are also
supporting other projects, including in the Netherlands,
Poland, Switzerland, and Italy.
We have also obtained important contracts in Africa,
including the turnkey construction of general hospitals in
Angola. In the Asia-Pacific region, new orders were received
from Indonesia, Mongolia, Sri Lanka, and Vietnam. In the
Middle East, we received an order to supply medical technol-
ogy to Oman. In Abu Dhabi, the construction of an integrated
health care center is progressing. In Latin America, VAMED
is responsible for new projects in Nicaragua, Bolivia, and
Trinidad and Tobago.
ORDER INTAKE AND ORDER BACKLOG FOR PROJECTS
€ in millions 2018 2017 Change
Order intake 1,227 1,096 12%
Order backlog (December 31) 2,420 2,147 13%
SERVICE BUSINESSModular in design, our service offering encompasses every
aspect of technical, commercial, and infrastructural facility
management as well as the total operational management for
health care facilities. The service business includes building
and equipment maintenance, medical technology manage-
ment, and technical management. Our integrated port folio of
services is aimed at the optimal operation of a health care
facility.
We were responsible for the total operational manage-
ment of 100 health care facilities with approximately 18,000
beds in 2018. In addition, as part of its technical operation
services, VAMED provides services glob ally to more than
840 health care facilities with approximately 193,000 beds.
Acquisitions in Germany and the United Kingdom have
strengthened the high-end services segment.
In Austria, we continued the partnership we have main-
tained since 1986 with Vienna’s General Hospital (AKH), one
of Europe’s largest hospitals. In Germany, we have been
providing technical services for UKSH since mid- 2015. In addi-
tion to Germany and Austria, we have obtained new service
contracts in important European markets such as Austria, Italy,
the Netherlands, the United Kingdom, and Spain.
On July 1, 2018, VAMED acquired from Fresenius Helios
38 health care facilities and 13 service companies in Ger-
many with a focus on inpatient rehabilitation and care. This
acquisition makes VAMED a leading provider of private
rehabilitation services in Europe. We are the largest private
provider in Austria and have expanded our offer to include a
children’s rehabilitation facility. In Switzerland, we strength-
ened our position as the second-largest private rehabilitation
provider. We also operate other well-known rehabilitation
facilities in the Czech Republic and the United Kingdom.
VAMED VITALITY WORLDWith the range of services offered by VAMED Vitality World,
we are building a bridge between preventive medicine and
health tourism in spa and health resorts. We are a leader in
the Austrian market and operate Hungary’s largest thermal
and health care spa, the Aqua World Budapest.
Please refer to pages 75 f. of the Group Management Report
for the 2019 financial outlook. For further information, please
see Fresenius Vamed’s website at www.vamed.com.

Fresenius Share
Fresenius Share32
STOCK MARKETS AND DEVELOPMENT OF THE FRESENIUS SHAREIn 2018, the weak stock market year was marked by nervous-
ness and uncertainty among investors. The trade conflict
between China and the United States, the Brexit negotiations,
the sharp rise in interest rates, especially in the United States,
and concerns about Italy’s budget were the dominant issues
in 2018.
The DAX decreased by 18%; the EURO STOXX 50 lost
14% for the year. The STOXX Europe 600 index ended
the year down by 13%. In this index, the subsector STOXX
Europe 600 Health Care decreased by 3%. The leading
U.S. indices performed as follows: the S & P 500 and the
Dow Jones Industrial Average both decreased by 6%.
The closing price for the Fresenius share on December 31,
2018, was € 42.38 and thus 35% below the closing price of
2017.
The market capitalization of Fresenius was € 23.6 billion
as of December 31, 2018, a decrease of 35% compared to
the previous year. The average daily trading volume on Xetra
increased by 42% to 1,648,837 Fresenius shares compared
to the previous year (2017: 1,164,824). DAX trading volume
increased by 14% in the same comparison time period.
FRESENIUS SHARE. We propose the 26th consecutive dividend increase. The financial markets are currently in a highly sensitive phase. In this market environment, the Group’s outlook for 2018 and the adjustment of the mediumterm targets have significantly impacted the Fresenius share price.

Fres
eniu
s S
hare
Fresenius Share 33
Despite the share price decline in 2018, Fresenius shares
remain an attractive investment. Anyone who invested
€ 1,000 ten years ago and reinvested the dividends would
have increased their capital to € 3,938 as of December 31,
2018. That is an average annual return of 13% (before
expenses and taxes).
In the United States, Fresenius has a Sponsored Level I
American Depositary Receipt (ADR) program. In this program,
four Fresenius ADRs correspond to one Fresenius share. The
ADRs are traded in the OTCQX International Premier market
segment.
KEY DATA OF THE FRESENIUS SHARE
2018 2017 2016 2015 2014
Number of shares 556,225,154 554,710,473 547,208,371 545,727,950 541,532,600
Stock exchange quotation 1 in €
High 70.94 79.65 74.26 69.75 44.12
Low 38.99 60.58 53.05 42.41 35.00
Year-end quotation 42.38 65.07 74.26 65.97 43.16
Market capitalization 2 in million € 23,573 36,095 40,636 36,002 23,373
Total dividend distribution in million € 445.0 3 416.0 343.1 300.2 238.3
Dividend per share in € 0.80 3 0.75 0.62 0.55 0.44
Earnings per share in € 4 3.37 3.28 2.85 2.64 2.01
1 Xetra closing price on the Frankfurt Stock Exchange 2 Total number of ordinary shares multiplied by the respective Xetra year-end quotation on the Frankfurt Stock Exchange3 Proposal4 Net income attributable to shareholders of Fresenius SE & Co. KGaA; before special items
CAPITAL STRUCTUREThe total number of issued shares at the end of 2018 was
556,225,154 (December 31, 2017: 554,710,473 shares). The
increase is due to the exercise of options in accordance with
stock option plans. Information on stock option plans can be
found on pages 250 to 258 of the Notes to this Annual
Report.
Fresenius share Monthly price range
ABSOLUTE SHARE PRICE PERFORMANCE 2018
FRESENIUS SHARE IN €
RELATIVE SHARE PRICE PERFORMANCE 2014 – 2018
FRESENIUS SHARE VS. DAX
Fresenius share in % DAX in % Fresenius high and low in €
80.00
75.00
70.00
65.00
60.00
55.00
50.00
45.00
40.00
35.00
30.00
Dec. 17 Feb. 18 Apr. 18 Jun. 18 Aug. 18 Oct. 18 Dec. 18
300
250
200
150
100
50
%
112
93
74
56
37
19
€
Dec. 2013 Dec. 2015Dec. 2014 Dec. 2016 Dec. 2017 Dec. 2018
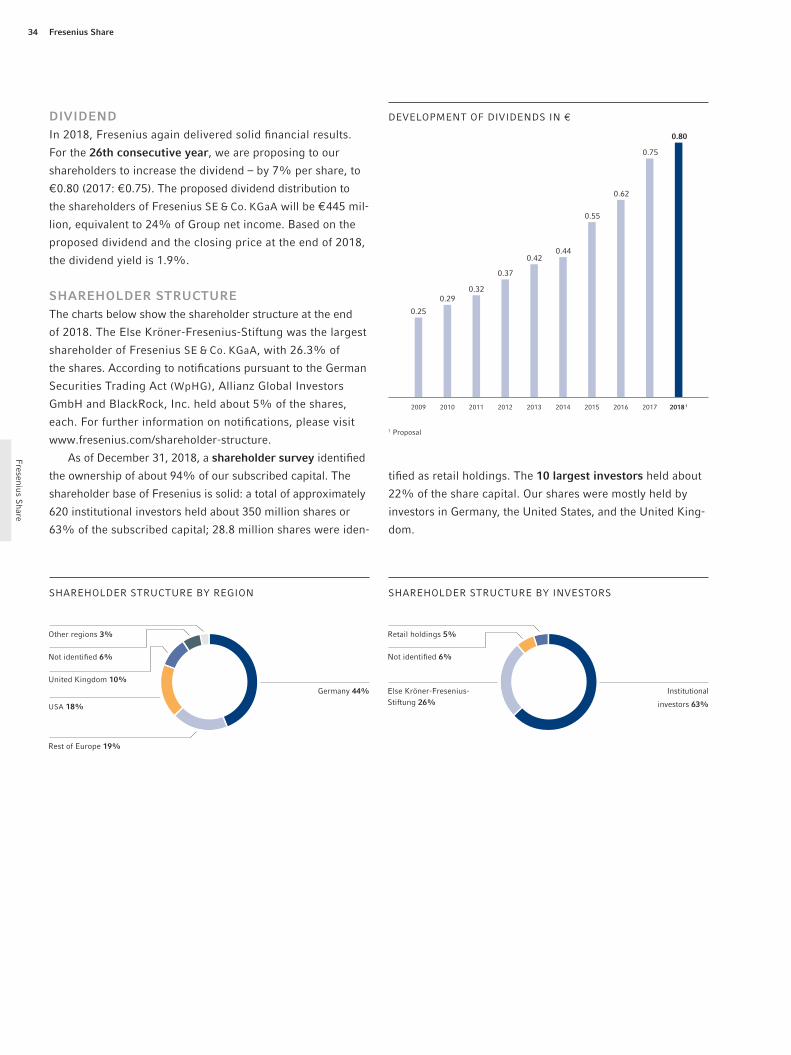
Fresenius Share
Fresenius Share34
DIVIDENDIn 2018, Fresenius again delivered solid financial results.
For the 26th consecutive year, we are proposing to our
shareholders to increase the dividend – by 7% per share, to
€ 0.80 (2017: € 0.75). The proposed dividend distribution to
the shareholders of Fresenius SE & Co. KGaA will be € 445 mil-
lion, equivalent to 24% of Group net income. Based on the
proposed dividend and the closing price at the end of 2018,
the dividend yield is 1.9%.
SHAREHOLDER STRUCTUREThe charts below show the shareholder structure at the end
of 2018. The Else Kröner-Fresenius-Stiftung was the largest
shareholder of Fresenius SE & Co. KGaA, with 26.3% of
the shares. According to notifications pursuant to the German
Securities Trading Act (WpHG), Allianz Global Investors
GmbH and BlackRock, Inc. held about 5% of the shares,
each. For further information on notifications, please visit
www.fresenius.com/shareholder-structure.
As of December 31, 2018, a shareholder survey identified
the ownership of about 94% of our subscribed capital. The
shareholder base of Fresenius is solid: a total of approximately
620 institutional investors held about 350 million shares or
63% of the subscribed capital; 28.8 million shares were iden-
tified as retail holdings. The 10 largest investors held about
22% of the share capital. Our shares were mostly held by
investors in Germany, the United States, and the United King-
dom.
SHAREHOLDER STRUCTURE BY REGION
Other regions 3%
United Kingdom 10%
USA 18%
Rest of Europe 19%
Not identified 6%
Germany 44%
SHAREHOLDER STRUCTURE BY INVESTORS
Retail holdings 5%
Else Kröner-Fresenius-Stiftung 26%
Not identified 6%
Institutional
investors 63%
DEVELOPMENT OF DIVIDENDS IN €
1 Proposal
2009 2010 2011 2012 2013 2014 2015 2016 2018 12017
0.25
0.290.32
0.37
0.420.44
0.62
0.55
0.75
0.80

Fres
eniu
s S
hare
Fresenius Share 35
ANALYST RECOMMENDATIONS The recommendations published by financial analysts are
an important guide for institutional and private investors when
making investment decisions. According to our survey, as
of February 12, 2019, we were rated with 11 “buy”, 8 “hold”,
and no “sell” recommendations.
The list of banks that provide regular analyst coverage
of Fresenius and their latest recommendations can be found
at www.fresenius.com/analysts-and-consensus.
INVESTOR RELATIONSOur investor relations activities are in accordance with the
transparency rules of the German Corporate Governance Code.
We communicate comprehensively, promptly, and openly
with private and institutional investors, as well as financial ana-
lysts. The equal treatment of all market actors is very impor-
tant to us.
We intensified our dialog with the capital markets
in 2018. In addition to its conference calls and webcasts,
Fresenius gave presentations in major European, U.S., Cana-
dian, and Asian financial markets. We expanded our contacts
with insti tutional investors and analysts at 21 international
investor conferences, 26 roadshows, and in numerous one-on-
one meetings. We also organized field trips with banks, giv-
ing investors and analysts the opportunity to discuss matters
with the Management Board.
The Fresenius investor relations team and the manage-
ment team were recognized in the results of the Extel Survey,
a broad survey conducted by the company Thomson Reuters,
which annually surveys some 15,000 investors and analysts
on various aspects of good investor relations. On this occasion,
the Fresenius investor relations team was honored as the
best in the MedTech sector in Europe.
ANALYST RECOMMENDATIONS
In addition, “Institutional Investor” honored Fresenius for the
best investor relations work in the health care sector in Europe.
Furthermore, the management and investor relations team
received the “Investor Darling” award for the best financial
communication of DAX companies from “Manager Magazin”.
We also continued the dialog with our private investors,
especially via the Internet. In addition, we participate in private
shareholder events. At www.fresenius.com/events-and-pre-
sentations our private shareholders can follow live webcasts of
the conference calls and can use our continuously increased
information offer on our website and social media channels.
If you would like to contact us or find out about our
2019 financial calendar, please take a look at the last page
of this Annual Report. For additional information visit us at
www.fresenius.com/investors.
Equal-weight / Hold / Neutral 42%
Accumulate / Add / Buy / Outperform /
Overweight 58%

Managem
ent Report
36 Group Management Report
37 Fundamental information about the Group
37 The Group’s business model
38 Important markets and competitive position
38 External factors
39 Management and control
39 Capital, shareholders, articles of association
40 Goals and strategies
42 Corporate performance criteria
43 Research and development
46 Employees
47 Procurement
47 Quality management
47 Responsibility, environmental management, sustainability
48 Economic report
48 Health care industry
49 The dialysis market
50 The market for generic IV drugs, biopharmaceuticals,
clinical nutrition, infusion therapy,
and medical devices / transfusion technology
51 The hospital market
52 The market for projects and services for hospitals and
other health care facilities
52 Overall business development
52 The Management Board’s assessment of the effect
of general economic developments and those in the
health care sector for Fresenius
52 The Management Board’s assessment of the
business results and significant factors affecting
operating performance
53 Comparison of the actual business results with
the forecasts
54 Results of operations, financial position, assets and liabilities
54 Results of operations
62 Financial position
67 Assets and liabilities
69 Corporate rating
70 Overall assessment of the business situation
70 Outlook
70 General and mid-term outlook
71 Future markets
72 Health care sector and markets
74 Group sales and earnings
75 Sales and earnings by business segment
76 Financing
76 Investments
76 Organization
76 Dividend
77 Opportunities and risk report
77 Opportunities management
77 Risk management
79 Risk areas
90 Assessment of overall risk
TABLE OF CONTENTS GROUP MANAGEMENT REPORT

Man
agem
ent
Rep
ort
Group Management Report Fundamental information about the Group 37
FUNDAMENTAL INFORMATION ABOUT
THE GROUP
THE GROUP’S BUSINESS MODEL Fresenius is a global health care Group in the legal form of
an SE & Co. KGaA (a partnership limited by shares). We offer
products and services for dialysis, hospitals, and outpatient
medical care. In addition, Fresenius focuses on hospital oper-
ations. We also manage projects and provide services for
hospitals and other health care facilities worldwide.
The operating business comprises four business segments,
all of which are legally independent entities managed by the
operating parent company Fresenius SE & Co. KGaA. The busi-
ness segments have a regional and decentralized structure.
▶ Fresenius Medical Care offers services and products for
patients with chronic kidney failure. As of December 31,
2018, Fresenius Medical Care treated 333,331 patients at
3,928 dialysis clinics. Dialyzers and dialysis machines
are among the most important product lines. In addition,
Fresenius Medical Care offers dialysis-related services,
among others in the field of Care Coordination.
▶ Fresenius Kabi specializes in intra venously administered
generic drugs (IV drugs), clinical nutrition, and infusion
therapies. The company is also a supplier of medical
devices and products of transfusion technology. In addition,
Fresenius Kabi is developing products with a focus on
oncology and autoimmune diseases within the bio similars
segment of Fresenius Kabi.
▶ Fresenius Helios is Europe’s leading private hospital
operator. The company comprises Helios Germany and
Helios Spain (Quirónsalud); both are part of the holding
company Helios Health. At the end of 2018, Helios Ger-
many operated a total of 86 hospitals, around 125 out-
patient clinics, and 10 prevention centers. Quirónsalud
operated 47 hospitals, 57 outpatient centers, and around
300 occu pational risk prevention centers at the end of
2018.
▶ Fresenius Vamed manages projects and provides services
for hospitals as well as other health care facilities world-
wide and is a leading post-acute care provider in Central
Europe. The portfolio ranges along the entire value chain –
from project development, planning, and turnkey con-
struction, via maintenance and technical management, to
total operational management.
GROUP STRUCTURE
Fresenius SE & Co. KGaA
31% 100% 100% 77%
Fresenius Medical Care
Fresenius Kabi
Fresenius Helios
Fresenius Vamed
GROUP MANAGEMENT REPORT. The advantages of our diversified Group structure were clearly evident in fiscal year 2018. We achieved our Group sales and earnings targets for fiscal year 2018.
Managem
ent Report
38 Group Management Report
Fresenius has an international sales network and maintains
more than 90 production sites. Large production sites are
located in the United States, China, Japan, Germany, and
Sweden. Production plants are also located in other European
countries and in Latin America, Asia-Pacific, and South Africa.
IMPORTANT MARKETS AND COMPETITIVE
POSITION
Fresenius operates in about 90 countries through its subsid-
iaries. The main markets are Europe with 43% and North
America with 42% of sales, respectively.
Fresenius Medical Care holds the leading position world-
wide in dialysis care as it serves about 10% of all dialysis
patients, as well as in dialysis products, with a market share
of about 35%. Fresenius Kabi holds leading market posi-
tions in Europe for large parts of its product portfolio and has
significant market shares in the growth markets of Asia-
Pacific and Latin America. In the United States, Fresenius Kabi
is one of the leading suppliers of generic IV drugs. Further
information on the market position of Fresenius Kabi can be
found in the market description on page 50 f. Fresenius Helios
is Europe’s leading private hospital operator. The company
comprises Helios Germany, the country’s largest private hos-
pital operator, and Helios Spain, Spain’s largest private hos-
pital operator. Fresenius Vamed is one of the world’s leading
companies in its field.
EXTERNAL FACTORS
Overall, the legal and economic factors for the Fresenius Group
were largely unchanged in 2018. The life-saving and life-
sustaining products and therapies that the Group offers are of
intrinsic importance for people worldwide. Therefore, the busi-
ness development of our company is fundamentally stable
and relatively independent of economic cycles. Preparatory
measures for upcoming regulatory changes in the German
hospital business already had a negative impact on earnings
in the 2018 fiscal year. For detailed information on our mar-
kets, please see pages 49 ff.
Furthermore, the diversification across four business seg-
ments and our global reach provide additional stability for
the Group.
Fluctuating exchange rates, particularly between the
U.S. dollar and the euro, have an effect on the income state-
ment and the balance sheet. In 2018, the average annual
exchange rate between the U.S. dollar and the euro of 1.18 was
above the 2017 rate of 1.13, and therefore had a negative
currency translation effect on the income statement. Further-
more, negative currency translation effects on the income
statement resulted, in particular, from the depreciation of Latin
American currencies (especially the Argentinian peso) against
the euro in the 2018 fiscal year. As a result of exchange rate
changes (from 1.20 U.S. dollars on December 31, 2017, to
1.15 U.S. dollars on December 31, 2018), the balance sheet total
increased by 7% (increased by 5% in constant currencies).
In 2018, the Fresenius Group was involved in various legal
disputes resulting from business operations. Although it is
not possible to predict the outcome of these disputes, none is
expected to have a significant adverse impact on the assets
and liabilities, financial position, and results of operations of
the Group. Further information regarding legal matters and
an ongoing internal compliance review at Fresenius Medical
Care can be found on pages 225 to 234 of the Notes.
We carefully monitor and evaluate country-specific, political,
legal, and financial conditions. This applies in particular to
the potential impact on our business of the United Kingdom’s
decision to leave the European Union and the ongoing uncer-
tainty about the conditions of withdrawal. We do not expect
this to have a material impact on our business at this time.
The share of sales generated in the United Kingdom is not
material in relation to Group sales. We do not expect any
negative effects on our financing either, as only an immaterial
portion of our credit lines is provided by banks domiciled in
the United Kingdom. Project teams in all divisions concerned
are identifying potential effects in terms of logistics, taxes,
customs duties, and potential regulations, among other things,
and initiating appropriate measures if necessary.

Man
agem
ent
Rep
ort
Group Management Report Fundamental information about the Group 39
MANAGEMENT AND CONTROL
In the legal form of a KGaA, the Company’s corporate bodies
are the General Meeting, the Supervisory Board, and the
general partner, Fresenius Management SE. Fresenius Man-
agement SE is wholly owned by Else Kröner- Fresenius-
Stiftung. The KGaA has a two-tier management system –
management and control are strictly separated.
The general partner, represented by its Management
Board, conducts the business and represents the Company in
dealings with third parties. The Management Board generally
has seven members. According to the Management Board’s
rules of procedure, each member is accountable for his or
her own area of responsibility. However, the members have
joint responsi bility for the management of the Group. In addi-
tion to the Supervisory Board of Fresenius SE & Co. KGaA,
Fresenius Management SE has its own Supervisory Board. The
Management Board is required to report to the Super visory
Board of Fresenius Management SE regularly, in particular on
its corporate policy and strategies, business profitability,
current operations, and any other matters that could be of sig-
nificance for the Company’s profitability and liquidity. The
Supervisory Board of Fresenius Management SE also advises
and supervises the Management Board in its management
of the Company. It is prohibited from managing the Company
directly. However, the Management Board’s rules of proce-
dure require it to obtain the approval of the Supervisory Board
of Fresenius Management SE for specific activities.
The members of the Management Board are appointed
and dismissed by the Supervisory Board of Fresenius Manage-
ment SE. Appointment and dismissal is in accordance with
Article 39 of the SE Regulation. The articles of association of
Fresenius Management SE also provide that deputy members
of the Management Board may be appointed.
The Supervisory Board of Fresenius SE & Co. KGaA
advises and supervises the management of the Company’s
business by the general partner, reviews the annual financial
statements and the consolidated financial statements, and
performs the other functions assigned to it by law and the
Company’s articles of association. It is involved in corporate
planning and strategy, and in all matters of fundamental
importance for the Company. The Supervisory Board of
Fresenius SE & Co. KGaA has six shareholder representatives
and six employee representatives. A Nomination Committee
of the Supervisory Board of Fresenius SE & Co. KGaA has
been instituted for election proposals for the shareholder
representatives. Its activities are aligned with the provisions
of law and the Corporate Governance Code. The shareholder
representatives are elected by the Annual General Meeting
of Fresenius SE & Co. KGaA. The European works council
elects the employee representatives to the Super visory Board
of Fresenius SE & Co. KGaA.
The Supervisory Board must meet at least twice per calen-
dar half-year. The Supervisory Board of Fresenius SE & Co.
KGaA has two permanent committees: the Audit Committee,
consisting of five members, and the Nomination Committee,
consisting of three members. The members of the committees
are listed on page 271 of this Annual Report. The Company’s
annual corporate governance declaration describes the proce-
dures of the Supervisory Board’s committees on page 135 f.
The declaration can also be found on the website
www. fresenius.com/corporate-governance.
The description of both the compensation system and
individual amounts paid to the Management Board and Super-
visory Board of Fresenius Management SE, and the Super-
visory Board of Fresenius SE & Co. KGaA, are included in the
Compensation Report on pages 146 ff. of this Annual Report.
The Compensation Report is part of the Group’s Manage-
ment Report.
CAPITAL, SHAREHOLDERS, ARTICLES OF
ASSOCIATION
The subscribed capital of Fresenius SE & Co. KGaA amounted
to 556,225,154 ordinary shares as of December 31, 2018
(December 31, 2017: 554,710,473).
The shares of Fresenius SE & Co. KGaA are non-par-value
bearer shares. Each share represents € 1.00 of the capital
stock. Shareholders’ rights are regulated by the German Stock
Corporation Act (AktG – Aktiengesetz).
Fresenius Management SE, as general partner, is autho -
rized, subject to the consent of the Supervisory Board of
Fresenius SE & Co. KGaA: to increase the subscribed capital of
Fresenius SE & Co. KGaA by a total amount of up to € 125 mil-
lion, until May 17, 2023, through a single or multiple issu-
ance of new bearer ordinary shares against cash contributions
and / or contributions in kind (Authorized Capital I). Share-
holders’ pre-emptive rights of subscription can be excluded.
In addition, there are the following Conditional Capitals:
▶ The subscribed capital is conditionally increased by up to
€ 4,735,083.00 through the issuance of new bearer ordi-
nary shares (Conditional Capital I). The conditional capi-
tal increase will only be executed to the extent that con-
vertible bonds for ordinary shares have been issued under
the 2003 Stock Option Plan and the holders of these con-
vertible bonds exercise their conversion rights.

Managem
ent Report
40 Group Management Report
▶ The subscribed capital is conditionally increased by up
to € 5,141,264.00 through the issuance of new bearer
ordinary shares (Conditional Capital II). The conditional
capital increase will only be executed to the extent that
subscription rights have been issued under the 2008 Stock
Option Plan, the holders of these subscription rights exer-
cise their rights, and the Company does not use its own
shares to service the subscription rights or does not exer-
cise its right to make payment in cash.
▶ The general partner is authorized, with the approval of
the Supervisory Board, until May 17, 2023, to issue option
bearer bonds and / or convertible bearer bonds, once or
several times, for a total nominal amount of up to € 2.5 bil-
lion. To fulfill the granted subscription rights, the sub-
scribed capital of Fresenius SE & Co. KGaA was increased
conditionally by up to € 48,971,202.00 through issuance
of new bearer ordinary shares (Conditional Capital III).
The conditional capital increase shall only be implemented
to the extent that the holders of convertible bonds issued
for cash, or of warrants from option bonds issued for
cash, exercise their conversion or option rights and as long
as no other forms of settlement are used.
▶ The share capital is conditionally increased by up to
€ 24,928,200.00 by the issuance of new ordinary bearer
shares (Conditional Capital IV). The conditional capital
increase will only be implemented to the extent that
subscription rights have been, or will be, issued in accor-
dance with the Stock Option Program 2013 and the
holders of subscription rights exercise their rights, and
the Company does not grant own shares to satisfy the
subscription rights.
The Company is author ized, until May 17, 2023, to purchase
and use its own shares up to a maximum amount of 10%
of the subscribed capital. In addition, when purchasing own
shares, the Company is authorized to use equity derivatives
with possible exclusion of any tender right. The Company had
not utilized these author izations as of December 31, 2018.
As the largest shareholder, Else Kröner- Fresenius-Stiftung,
Bad Homburg, Germany, informed the Company on Decem-
ber 18, 2018, that it held 146,261,594 ordi nary shares of
Fresenius SE & Co. KGaA. This corresponds to an equity interest
of 26.3% as of December 31, 2018.
Amendments to the articles of association are made in
accordance with Section 278 (3) and Section 179 (2) of the
German Stock Corporation Act (AktG) in conjunction with
Article 17 (3) of the articles of association of Fresenius SE &
Co. KGaA. Unless mandatory legal provisions require other-
wise, amendments to the articles of association require a sim-
ple majority of the subscribed capital represented in the
resolution. If the voting results in a tie, a motion is deemed
rejected. Furthermore, in accordance with Section 285 (2)
sentence 1 of the German Stock Corporation Act (AktG),
amendments to the articles of association require the consent
of the general partner, Fresenius Management SE. The
Supervisory Board is entitled to make such amendments to
the articles of association that only concern their wording
without a resolution of the General Meeting.
Under certain circumstances, a change of control as the
result of a takeover bid would impact our major long-term
financing agreements, which contain customary change of
control provisions that grant creditors the right to request
early repayments of outstanding amounts in case of a change
of control. The majority of our financing arrangements, in
particular our bonds placed in the capital markets, however,
require that the change of control is followed by a decline
or a withdrawal of the Company’s rating or that of the respec-
tive financing instruments.
GOALS AND STRATEGIESOur goal is to strengthen the position of Fresenius as a lead-
ing global provider of products and therapies for critically
and chronically ill people. With our four business segments,
we are concentrating on a limited number of health care
areas. As a result of this clear focus, we have developed unique
competencies. We are following our long-term strategies
consistently and are seizing our oppor tunities.
The key elements of the Fresenius Group’s strategy and
goals are to:
▶ Expand market position and worldwide presence:
Fresenius’ goal is to ensure and expand its long-term posi-
tion as a leading international provider of products and
services in the health care industry. To this end, and to
geographically expand our business, we plan to grow
organically as well as through selective small to medium-
sized acquisitions, complementing our existing portfolio.
We focus on markets with strong growth rates.

Man
agem
ent
Rep
ort
Group Management Report Fundamental information about the Group 41
Fresenius Medical Care is the worldwide leader in dialysis,
with a strong market position in the United States. Future
opportunities in dialysis will arise from further expansion
in dialysis care and products worldwide, as well as the
focused range in Care Coordination. In this area, Fresenius
Medical Care offers additional services for the holistic
care of patients and meets the increasing demand with
this model.
Fresenius Kabi is the market leader in infusion therapy
and/or clinical nutrition in Europe and in the key mar-
kets in Asia-Pacific (including China) and Latin America.
In the United States, Fresenius Kabi is one of the leading
players in the market for generic IV drugs. In addition,
Fresenius Kabi is one of the most important providers of
transfusion technology. Fresenius Kabi plans to roll out
products from its existing portfolio to the growth markets
and to launch exist ing products in the United States. Mar-
ket share is to be expanded further through the launch of
new products in the field of IV drugs, infusion therapy,
clinical nutrition, and medical devices / transfusion technol-
ogy.
With 86 hospitals, Fresenius Helios operates in nearly
all of Germany. Building on this, Fresenius Helios is now
in the position to develop new patient care models. To
benefit from the trend towards outpatient treatment, Helios
Germany has been expanding outpatient service offer-
ings in a separate division since September 2018.
Helios Spain has attractive growth opportunities
through the expansion and con struction of hospitals, and
potential for further consolidation in the highly frag-
ment ed private hospital market in Spain. Helios Health
exploits upcoming opportunities for cross-border synergies
in areas such as laboratory services and joint purchasing.
The cross-border exchange of experience and knowledge
is gradually creating the economic pre requisites for the
further internationalization of our hospital business. Helios
Spain announced the acquisition of Clínica Medellín in
2018. Fresenius Helios is thus entering the attractive pri-
vate hospital market in Colombia.
Fresenius Vamed will further expand its position as
a global specialist for pro jects and services for hospitals
and other health care facilities. With the acquisition of
Fresenius Helios’ German inpatient rehabilitation business,
Fresenius Vamed developed itself into one of the leading
providers of private rehabilitation services in Europe.
Moreover, the cooperation with Fresenius Helios is being
intensified, for example in technical services and pro-
curement, where Fresenius Helios and Fresenius Vamed
are now jointly purchasing certain products.
▶ Strengthen innovation: Fresenius’ strategy is to continue
building on its strength in technology, its competence
and quality in patient care, and its ability to manufacture
cost-effectively. We want to develop products and systems
that provide a high level of safety and user-friendliness
and enable tailoring to individual patient needs. We intend
to continue to meet our requirements of best-in-class
medi cal standards by offering more effective products and
treatment methods for the critically and chronic ally ill.
Fresenius Kabi, for example, develops imitation products of
biotechnologically produced drugs called biopharmaceu-
ticals, with a focus on oncology and autoimmune diseases.
Fresenius Helios’ goal is to foster knowledge sharing
across its international hospital network and use innova-
tion to develop the best health care services and therapies
for its patients. Since September 2018, Helios Germany
has been developing innovative business areas such as dig-
ital offerings in its own division. Fresenius Vamed’s goal
is to realize further projects in integrated health care ser-
vices and to support patient-oriented health care systems
more efficiently.
▶ Enhance profitability: Our goal is to continue to improve
Group profitability. To contain costs, we are concentrating
particularly on making our production plants more effi-
cient, exploiting economies of scale, leveraging the exist-
ing marketing and distribution infrastructure more inten-
sively, and practicing strict cost control. By focusing on
our operating cash flow and employing efficient working
capital management, we will increase our investment
flexibility and improve our balance sheet ratios. Another
goal is to optimize our weighted average cost of capital
(WACC) by deliberately employing a balanced mix of equity

Managem
ent Report
42 Group Management Report
and debt funding. In the present capital market condi-
tions, we believe we optimize our cost of capital if we hold
the net debt / EBITDA ratio within a range of 2.5 to 3.0
(before adoption of IFRS 16). Please see the following
section “Corporate Performance Criteria”, and pages 54
and 68, for more details.
We report on our goals in detail in the Outlook section on
pages 70 to 76.
CORPORATE PERFORMANCE CRITERIAThe Management Board makes operational and strategic
management decisions based on our Group-wide performance
indicators for growth, profitability, liquidity, capital efficiency,
and capital management. The most important financial per-
formance indicators for us are explained below and a definition
is provided in the glossary of financial terms on pages 276
to 278.
GROWTH
In line with our growth strategy, sales growth (in constant
currency) of the Group and, in our business segments, organic
sales growth in particular are of central importance.
PROFITABILITY
We use earnings before interest and taxes (EBIT) and EBIT
growth (in constant currency) to measure the profitability of
the segments. At Group level, we primarily use net income
and net income growth (in constant currency). In order to be
able to better compare the operating performance over sev-
eral periods, the results are adjusted by special items if nec-
essary.
LIQUIDITY
At the corporate level, cash flow margin is used as the main
liquidity indicator. In order to further analyze and optimize
the contributions of our business segments to operating cash
flow, we also use the additional performance indicators DSO 1
(days sales outstanding) and SOI 1 (scope of inventory). These
show the amount of receivables or inventories in relation
to the sales or costs of the services rendered during the past
reporting period.
CAPITAL EFFICIENCY
We work as profitably and efficiently as possible with the
capital provided to us by shareholders and lenders. In order to
manage this, we primarily calculate the Return on Invested
Capital (ROIC) 2 and the Return on Operating Assets (ROOA) 2.
CAPITAL MANAGEMENT
We use the ratio of net debt and EBITDA as the key parameter
for managing the capital structure. This measure indicates
the degree to which a company is able to meet its payment
obligations. Our business segments usually hold leading posi-
tions in growing and mostly non-cyclical markets. Since the
majority of our customers are of high credit quality, they gen-
erate mainly stable, predictable cash flows. The Group is
therefore able to use debt to finance its growth to a greater
extent than companies in other industries.
1 Does not reflect a core performance indicator2 For a detailed calculation of ROIC and ROOA please see page 277
FINANCIAL PERFORMANCE INDICATORS
Sales growth (in constant currency)
Sales growth (organic)
Operating income (EBIT) +/- Financial result - Income taxes - Minority interests
= Net income
EBIT growth (in constant currency)
Net income growth (in constant currency)
Operating cash flow ÷ Sales
= Cash flow margin
EBIT - Income taxes
= NOPAT ÷ Invested capital
= ROIC
EBIT ÷ Operating assets
= ROOA
Net debt ÷ EBITDA
= Leverage ratio
Growth Profitability Liquidity Capital efficiency Capital management

Man
agem
ent
Rep
ort
Group Management Report Fundamental information about the Group 43
1 Before revaluations of biosimilars contingent liabilities
INVESTMENT AND ACQUISITION PROCESS
Our investments and acquisitions are carried out using a
detailed coordination and evaluation process. As a first step,
the Management Board sets the Group’s investment targets
and the budget based on investment proposals. In the next
step, the respective business segments and the internal
Acquisition & Investment Council (AIC) determine the pro-
posed projects and measures, taking into account the overall
strategy, the total investment budget, and the required and
potential return on investment. We evaluate investment proj-
ects based on commonly used methods, such as internal
rate of return (IRR) and net present value (NPV). Within the
framework of the due diligence process, opportunities and
risks associated with the potential investment object are ana-
lyzed and assessed. In addition to reviewing the business
model, key financial figures and tax issues and the resulting
company valuation, this also includes a comprehensive
analysis of the market and competitive environment, regula-
tory framework conditions, and legal aspects. Furthermore,
the assessment also implies various issues relating to compli-
ance, production, research & development, quality, infor-
mation technology, human resources, and the environment.
Based on investment volume, a project is submitted for
approval to the executive committees or respective manage-
ments of the business segments, to the Management Board
of Fresenius Management SE, and / or its Supervisory Board.
RESEARCH AND DEVELOPMENTProduct and process development and the improvement of
therapies are at the core of our growth strategy. Fresenius
focuses its R & D efforts on its core competencies in the
following areas:
▶ Dialysis
▶ Generic IV drugs
▶ Biosimilars
▶ Infusion and nutrition therapies
▶ Medical devices
Apart from new products, we are concentrating on develop-
ing optimized or completely new therapies, treatment methods,
and services.
Research and development expenses 1 were € 669 million
(2017: € 558 million), approximately 6.9% of our product
sales (2017: 5.9%). Research services provided by third par-
ties are mainly used by Fresenius Kabi, especially in the field
of biosimilars. Fresenius Kabi increased its R & D spending by
25% 1, Fresenius Medical Care increased its R & D spending
by 2% . Detailed figures are included in the segment reporting
on pages 170 f.
As of December 31, 2018, there were 3,042 employees
in research and development (2017: 2,772). Of that number,
970 were employed at Fresenius Medical Care (2017: 848)
and 2,072 at Fresenius Kabi (2017: 1,924).
Our main research sites are in Europe, the United States,
and India. Product-related development activities are also
carried out in China.
2018 2017 2016 2015 2014
R & D expenses, € in millions 1 669 558 528 450 364
as % of product sales 1, 2 6.9 5.9 5.6 5.2 4.7
R & D employees 3,042 2,772 2,770 2,247 2,107
1 2018 before revaluations of biosimilars contingent liabilities 2 2014 – 2016, 2018 excluding impairment losses from capitalized in-process R & D activities
KEY FIGURES RESEARCH AND DEVELOPMENT
R & D EXPENSES BY SEGMENT 1
Fresenius Medical Care 20%
Fresenius Kabi 80%
2018: € 669 million

Managem
ent Report
44 Group Management Report
FRESENIUS MEDICAL CARE
Health care systems face major financial challenges not only
at present, but also in the long term. With regard to our R & D
activities, this confirms our intention to develop innovative
products that both meet high quality standards and are also
affordable. From our experience in operating our own dia-
lysis centers and the care of patients at home, we know that
these are not incompatible goals.
Our R & D strategy is globally oriented. This will enable
us to respond even better to the growing global demand for
high-quality and cost-efficient treatment methods. However,
we also take regional market conditions into account and offer
a diverse product portfolio. In the future, we want to provide
innovative, competitive products even more efficiently and
focus more strongly on developing countries.
In addition to R & D activities carried out at our company,
we collaborate with external partners with the aim of building
a comprehensive innovation and technology network. These
include numerous academic institutions, such as research insti-
tutes at renowned universities in the United States. Another
partner is the Renal Research Institute (RRI) in New York. This
subsidiary of Fresenius Medical Care North America is a
leading institution in the field of clinical research into chronic
kidney failure. Together we are working on fundamental
issues relating to dialysis treatment. We are increasingly col-
laborating with start-ups to support an open culture that
promotes innovation and to gain access to the latest technol-
ogies both in our core business and in adjacent areas that
are of future strategic interest to us.
We are also developing a portfolio of products that meet
the strictest requirements in terms of quality and efficiency,
especially for the emerging markets. This work is being con-
ducted in our own development center in China and at other
locations.
FRESENIUS KABI
Fresenius Kabi’s research and development activities concen-
trate on products for the therapy and care of critically and
chronically ill patients. Our products help to support medical
advancements in acute and post-acute care and improve the
patients’ quality of life. At the same time, our products are
helping to ensure that more and more patients worldwide
have access to high-quality, modern therapies.
Our development expertise includes all the related com-
ponents, such as the drug raw material, the pharmaceutical
formulation, the primary packaging, the medical device needed
for application of drugs and infusions, and the production
technology. In the area of biosimilars we have specialized in
the development of products for the treatment of oncology
and autoimmune diseases.
In the area of IV drugs, we are continuously working on the
extension of our drug portfolio. What matters most to us
here is that we launch new generic drug formulations directly
after the patents of the branded products expire. In addition,
we are working on the continuous improvement of non-
patented IV drugs already on the market, such as new formula-
tions and dosage forms as well as primary packaging. In 2018,
we had approximately 90 active projects in the area of gener-
ics. We focus, among other items, on complex formulations
such as active ingredients in liposomal 1 solutions and prod-
uct improvements that bring added value to both medical staff
and patients. Thus, we develop ready-to-use products that
are especially convenient and safe and help to prevent appli-
cation errors in day-to-day medical care. These are, for
example, ready-to-use solutions in our freeflex infusion bags
and pre-filled syringes. Drugs in pre-filled syringes are sim-
pler and safer to use than traditional applications, which helps
improve patient care.
In the biosimilars business, we have a pipeline of mole-
cules at different stages of development. A biosimilar is biologi-
cal medicine highly similar to another already approved bio-
logical medicine (which is called “reference product”). The aim
of our development activities is to obtain marketing approval
for the biosimilars contained in our development portfolio. The
development of a biosimilar is different from development of
new drugs. For example, there is no need for basic research to
prove the mechanism of action, or for extended toxicity or
dose-finding studies, since this has already been established
for the reference product. The focus is instead on reproduc-
1 Liposomes are tiny capsules used as a vehicle for active pharmaceutical ingredients. They allow for a targeted transportation of these ingredients to the location where they are needed within an organism.
Man
agem
ent
Rep
ort
Group Management Report Fundamental information about the Group 45
ibility of the product quality of the reference product. At the
end of 2017, we submitted our first application for approval of
a biosimilar product to the European regulatory authority,
the biosimilar version of MSB11022 (Adalimumab 1), which
can be used for chronic inflammatory diseases such as rheu-
matoid arthritis, intestinal diseases, and psoriasis (skin dis-
ease). We plan to launch Adalimumab in Europe in 2019. In
2018, we reached a milestone on the way to the approval of
another biosimilar. MSB 11455, a biosimilar candidate for
Neulasta® (Pegfilgrastim 2), has achieved its primary end-
points in the two pivotal clinical studies. Pegfilgrastim stim-
ulates the formation of white blood cells (leukocytes) in cer-
tain cancer treatments. MSB11456, a biosimilar candidate of
Tocilizumab, which is used in chronic inflammatory diseases
such as rheumatoid arthritis, is already in the clinical phase
of development.
Clinical nutrition provides care for patients who cannot
nourish themselves normally or sufficiently. This includes,
for example, patients in intensive care and those with serious
or chronic illnesses or malnourishment. Early and correct
intervention can help patients avoid malnutrition and its con-
sequences.
In parenteral nutrition, we devote our efforts to products
that make a significant contribution to improving clinical treat-
ment and the nutritional condition of patients and to innova-
tive containers such as our multi-chamber bags that are safe
and convenient in everyday use. In 2018, we continued the
development of parenteral formulations. We are concentrating
on formulations that are tailored to the needs of individual
patient groups. During 2018, we completed the decentralized
approval procedure in 28 European countries for our new
multi-chamber bag SmofKabiven Low Osmo for parenteral
nutrition. With that, we are expanding our range of Smof-
Kabiven three-chamber bags with a further product that enables
parenteral nutrition for patients with higher energy require-
ments and at the same time a well- tolerated composition for
peripheral application.
In addition, we received approval exclusively for the U.S.
market in a new indication for Omegaven, a 10% fish-oil-based
lipid emulsion. This approval has been issued as an orphan
drug. Omegaven (fish oil triglycerides) injectable emulsion is
indicated as a source of calories and fatty acids in pediatric
patients with parenteral nutrition-associated cholestasis (PNAC).
Our research and development work also includes the devel-
opment of market-specific parenteral formulations. In 2018,
we worked on products for the United States, South Korea,
and China, among other markets, as well as the further inter-
nationalization of our product range.
In the development of our enteral nutrition, we are
focus ing our research and development activities on product
concepts that support therapeutic compliance and thus the
success of therapy. These include, for example, developing
products with a wide variety of flavors to offer patients a wide
choice of daily treatments, as well as products with a higher
concentration of nutrients to facilitate the intake of the neces-
sary amount of nutrients. We are also working on products
that best meet the needs of specific patient groups.
In the area of infusion solutions, we are continuously
work ing on improved and new primary containers with the
aim of increasing the efficiency and safety of hospital staff.
These include, for example, port systems that do not require
the use of needles and thus reduce the risk of injury and
the number of steps involved in their application.
In our work in medical devices / transfusion technology,
we are constantly working on further developing our existing
portfolio, as well as on new products. Particularly in the
field of infusion technology, new software connections can con-
tribute to simplifying daily work in hospitals. In 2018, for
example, we received the CE mark for our Vigilant Master Med
software and subsequently launched it in Europe. This drug
library software offers a capacity of up to 10,000 drugs and up
to 30 therapies per drug and can be connected to our Agilia
infusion pump in hospitals, among other things. Vigilant Mas-
ter Med helps to reduce dosage errors in the daily medical
routine.
1 MSB 11022 is developed as a biosimilar for Humira® and has not yet been approved by the relevant health authorities. Humira® (Adalimumab) is a registered trademark of AbbVie Biotechnology Ltd.
2 MSB 11455 is developed as a biosimilar for Neulasta® and has not yet been approved by the relevant health authorities. Neulasta® (Pegfilgrastim) is a registered trademark of Amgen Inc.

Managem
ent Report
46 Group Management Report
EMPLOYEESThe knowledge, experience, and commitment of our employ-
ees are critical to our success. For this reason, Fresenius
values a culture of diversity. The interplay of a wide range of
views, opinions, cultural backgrounds, experiences, and
values helps us to achieve our full potential and contributes
to our success.
The number of employees increased by 1% to 276,750
employees at the end of 2018. With the transfer of Fresenius
Helios’ post-acute care business in Germany to Fresenius
Vamed, approximately 7,600 employees were taken over by
Fresenius Vamed.
Personnel expenses for the Fresenius Group were € 13,426
million in 2018 (2017: € 13,496 million), equivalent to 40.0%
of sales (2017: 39.8%). Personnel expenses are on the pre-
vious year’s level. Personnel expenses per employee were at
€ 48.6 thousand (2017: € 50.1 thousand) and at € 50.0 thou-
sand in constant currency. In Germany, Fresenius companies
have signed tariff agreements with IG BCE, Marburger Bund,
and ver.di (labor union for services). There were no significant
structural changes to compensation or employment agree-
ments in 2018.
HUMAN RESOURCES MANAGEMENT
We are constantly adapting our human resources tools to meet
new requirements arising from demographics, the transfor-
mation to a service economy, skills shortages, and the compati-
bility of job and family life. For example, we offer flexible
working hours and a long-term account for long-term pro-
fessional planning.
EMPLOYEE RECRUITMENT AND PERSONNEL
DEVELOPMENT
In order to ensure that our long-term needs for highly quali-
fied employees are met, and to recruit new employees, we
make use of online personnel marketing, regularly participate
in recruiting events and careers fairs, and organize our own
recruiting events. In addition, we encourage long-term reten-
tion with attractive development programs.
The approaches and measures for employee recruitment
and personnel development in the business segments are
based on the market requirements of each segment. They are
coordinated, developed, and realized independently for each
business segment.
At Fresenius, qualifications are the only thing that matters
in the selection of personnel. Consequently, at Fresenius
women and men with comparable qualifications will continue
to have the same career opportunities. As of December 31,
2018, the proportion of female employees within the Fresenius
Group was 68%. Women also held 30% of senior manage-
Dec. 31, 2018 Dec. 31, 2017 Dec. 31, 2016Change
2018 / 2017
% of total as of
Dec. 31, 2018
Fresenius Medical Care 120,328 121,245 116,120 - 1% 44%
Fresenius Kabi 37,843 36,380 34,917 4% 14%
Fresenius Helios 100,144 105,927 72,687 - 5% 36%
Fresenius Vamed 17,299 8,667 8,198 100% 6%
Corporate / Other 1,136 1,030 951 10% 0%
Total 276,750 273,249 232,873 1% 100%
NUMBER OF EMPLOYEES
EMPLOYEES BY REGION
Latin America and other regions 8%
Asia-Pacific 9%
North America 26%
Europe 57% (thereof Germany 32%)
2018: 276,750

Man
agem
ent
Rep
ort
Group Management Report Fundamental information about the Group 47
QUALITY MANAGEMENTThe quality of our products, services, and therapies is the
basis for optimal medical care. All processes are subject to
the highest quality and safety standards, for the benefit of
the patients and to protect our employees. Our quality man-
agement has the following three main objectives:
▶ to identify value-enhancing processes oriented toward
efficiency and the needs of our customers
▶ to monitor and manage these processes on the basis of
performance indicators
▶ to improve procedures
Further information on quality management at Fresenius can
be found in our Opportunities and Risk Report on pages 82 f.
as well as our Group Non-financial Report on pages 96 ff. of
our Annual Report.
RESPONSIBILITY, ENVIRONMENTAL MANAGEMENT, SUSTAINABILITYWe orient our activities within the Fresenius Group to long-
term goals, and thus ensure that our work is aligned to the
needs of patients and employees, as well as shareholders and
business partners, in a sustainable manner. Our responsibil-
ity as a health care Group goes beyond our business oper-
ations. We are committed to protecting nature as the basis
of life and using its resources responsibly. It is our mission to
constantly improve our performance in the areas of environ-
mental protection, occupational health and technical safety,
and product responsibility and logistics, and to comply with
legal requirements.
Further information can be found in our Group Non-financial
Report on pages 121 ff. of our Annual Report.
ment positions, based on the number of worldwide participants
in the Long Term Incentive Plan 2018 (LTIP 2018). Detailed
infor mation on the statutory targets for the participation of
women and men in management positions is available within
the Corporate Governance Declaration pursuant to Section
289f of the German Com mercial Code (HGB) on our website,
see www.fresenius.com/corporate-governance, as well as on
page 144 of the Annual Report.
You can visit our award-winning careers portal at
www.career. fresenius.com.
Further information on employment management can be
found in our Group Non-financial Report on pages 113 ff. of
our Annual Report.
PROCUREMENTIn 2018, the cost of raw materials and supplies and of pur-
chased components and services was € 9,366 million
(2017: € 9,032 million) and increased by 4% due to business
expansion.
€ in millions 2018 2017
Cost of raw materials and supplies 7,899 7,766
Write-downs of raw materials, supplies, and purchased components 0 0
Cost of purchased components and services 1,467 1,266
Total 9,366 9,032
An efficient value chain is important for our profitability. In an
environment characterized by ongoing cost-containment
pressure from health insurers as well as price pressure, secu-
rity and quality of supply play an important role. Within each
business segment of the Fresenius Group, procurement pro-
cesses are coordinated centrally, enabling us to bundle similar
requirements, negotiate global framework agreements, cons-
tantly monitor market and price trends, and ensure the safety
and quality of materials.
€ in millions 2018 2017 2016
Fresenius Medical Care 6,440 6,898 6,291
Fresenius Kabi 1,506 1,443 1,372
Fresenius Helios 4,815 4,672 3,528
Fresenius Vamed 545 358 339
Corporate / Others 120 125 113
Total 13,426 13,496 11,643
PERSONNEL EXPENDITURE COST OF MATERIAL BY BUSINESS SEGMENT 1
Fresenius Vamed 8%
Fresenius Helios 19%
Fresenius Kabi 22%
Fresenius Medical Care 51%
2018: € 9,366 million
1 Before consolidation

Managem
ent Report
Group Management Report48
ECONOMIC REPORT
HEALTH CARE INDUSTRYThe health care sector is one of the world’s largest industries
and shows excellent growth opportunities.
The main growth factors are:
▶ rising medical needs deriving from aging populations
▶ the growing number of chronically ill and multimorbid
patients
▶ stronger demand for innovative products and therapies
▶ advances in medical technology
▶ the growing health consciousness, which increases the
demand for health care services and facilities.
In the emerging countries, additional drivers are:
▶ expanding availability and correspondingly greater
demand for basic health care
▶ increasing national incomes and hence higher spending
on health care.
At the same time, the cost of health care is rising and claim-
ing an ever-increasing share of national income. Health care
spending averaged 8.9% of GDP in the OECD countries in
2017, with an average of US$ 4,003 spent per capita.
As in previous years, the United States had the highest
per capita spending (US$ 9,892). Germany ranked fifth among
the OECD countries with per capita spending of US$ 5,551.
In Germany, 85% of health spending was funded by pub-
lic sources in 2017, above the average of 74% in the OECD
countries.
Most of the OECD countries have enjoyed large gains in
life expectancy over the past decades, thanks to improved
living standards, public health interventions, and progress in
medical care. In 2016, average life expectancy in the OECD
countries was 80.8 years.
Health care structures are being reviewed and cost-cutting
potential identified in order to contain the steadily rising
health care expenditures. However, such measures cannot
compensate for the cost pressure. Market-based elements
are increasingly being introduced into the health care system
to create incentives for cost- and quality-conscious behavior.
Overall treatment costs will be reduced through improved
quality standards. In addition, ever-greater importance is being
placed on disease prevention and innovative reimbursement
models linked to treatment quality standards.
HEALTH CARE SPENDING AS % OF GDP
Source: OECD Health Data 2018
in % 2017 2010 2000 1990 1980 1970
USA 17.2 16.4 12.5 11.3 8.2 6.2
France 11.5 11.2 9.5 8.0 6.7 5.2
Germany 11.3 11.0 9.8 8.0 8.1 5.7
Switzerland 12.3 10.7 9.8 7.9 6.6 4.9
Spain 8.8 9.0 6.8 6.1 5.0 3.1
China 5.4 4.4 4.5 - - -

Man
agem
ent
Rep
ort
Group Management Report Economic report 49
Our most important markets developed as follows:
THE DIALYSIS MARKET
In 2018, the global dialysis market (products and services)
was worth approximately € 71 billion. In constant currency,
the global dialysis market grew by 4%.
Worldwide, approximately 4.1 million patients with chronic
renal failure were treated in 2018. Of these patients, around
3.4 million received dialysis treatments and about 786,000
were living with a transplanted kidney. About 89% were
treated with hemodialy sis and 11% with peritoneal dialysis.
The major growth driver is the growing number of
patients suffering from diabetes and high blood pressure, two
diseases that often precede the onset of chronic kidney fail-
ure.
The number of dialysis patients worldwide increased by
6% in 2018. In the United States, Japan, and Western and
Central Europe, patient growth was slower than in economi-
cally weaker regions where growth is mostly above 6%.
The prevalence rate, which is the number of people with
terminal kidney failure treated per million population, differs
widely from region to region. The significant divergence in
prevalence rates is due, on the one hand, to differences in age
demographics, incidence of renal risk factors, genetic predis-
position, and cultural habit, such as nutrition. On the other
hand, access to dialysis treatment is still limited in many coun-
tries. A great many individuals with terminal kidney failure
do not receive treatment and are therefore not included in the
prevalence statistics.
Dialysis careIn 2018, the global dialysis care market (including renal
pharmaceuticals) was worth approximately € 58 billion.
10% of worldwide dialysis patients were treated by
Fresenius Medical Care. With 3,928 dialysis clinics and 333,331
dialysis patients in approximately 50 countries, Fresenius
Medical Care operates by far the largest and most international
network of clinics. In the United States, Fresenius Medical
Care treated approximately 38% of dialysis patients in 2018.
The market for dialysis care in the United States is already
highly consolidated.
Outside the United States, the market for dialysis care is much
more fragmented. Here, Fresenius Medical Care competes
mainly with clinic chains, independent clinics, and with clin-
ics that are affiliated with hospitals.
Dialysis reimbursement systems differ from country to
country and often vary even within individual countries. The
public health care programs, the Centers for Medicare &
Medicaid Services (CMS), cover the medical services for the
majority of all dialysis patients in the United States.
Dialysis productsIn 2018, the global dialysis products market was worth
approximately € 13 billion.
Fresenius Medical Care is the leading provider of dialysis
products in the world, with a market share of about 35%.
Fresenius Medical Care is the leading supplier worldwide
of hemodialysis products, with a market share of 39%, and
has a market share of approximately 17% in the worldwide
market of products for peritoneal dialysis.
Care CoordinationThe field of Care Coordination currently includes services
relating to vascular, cardiovascular, and endovascular sur-
gery, health plan services, coordinated delivery of pharmacy
services, and care services, for example.
Chronic diseases such as diabetes or cardiovascular dis-
eases are steadily increasing. Nearly two-thirds of all people
worldwide die of those diseases. In many countries, the
majority of the health expenditure is spent on the treatment
of chronic diseases. To counteract the increasing cost pressure
that results from this, more and more health care systems –
such as that in the largest market for Fresenius Medical Care,
the United States – are no longer compensating for individual
services, but rather for a holistic and coordinated care.
A reasonable estimate of the market volume of coordinated
care is not possible due to the large number of different
services. We currently offer coordinated care services mainly
in North America and Asia-Pacific. Our services in Care

Managem
ent Report
Group Management Report50
Coordination are adapted to the requirements of these markets.
The expansion of our coordinated care services may vary
across countries and regions, depending on the particular
reimbursement system or market specifics.
THE MARKET FOR GENERIC IV DRUGS,
BIOPHARMACEUTICALS, CLINICAL NUTRITION,
INFUSION THERAPY, AND MEDICAL DEVICES /
TRANS FUSION TECHNOLOGY 1
The global market for generic IV drugs, biopharmaceuticals,
clinical nutrition, infusion therapy, and medical devices /
transfusion technology was worth about € 86 billion in 2018.
Thereof, the global market for generic IV drugs was worth
about € 33 billion 2. Fresenius Kabi was able to enter addi-
tional market segments of the global addressable market due
to targeted investments and the expansion of our product
portfolio, among others, in the area of complex formulations,
liposomal solutions, and pre-filled syringes.
In Europe and the United States, the market for IV drugs
grew by 4%. Growth is mainly achieved through products
that are brought to market when the original drug goes off-
patent, as well as through original off-patent products that are
offered at steady prices due to a unique selling proposition. Addi-
tionally, market growth is based on price increa ses for single
molecules by individual competitors. In the United States,
the most important generic IV drug market for Fresenius Kabi,
the company is one of the leading suppliers. Competitors
include Pfizer, Sanofi, Sandoz, and Teva Pharmaceutical Indus-
tries.
In 2017, Fresenius Kabi successfully completed the acqui-
sition of the biosimilar business of Merck KGaA. The trans-
action comprised the complete product pipeline, focusing on
oncology and autoimmune diseases. The relevant market for
the original biopharmaceuticals is worth about € 32 billion.
In 2018, the global market for clinical nutrition was
worth about € 8 billion. In Europe, the market grew by about
3%. In Latin America, the clinical nutrition market saw
growth of up to 10%. In Asia-Pacific, the market for enteral
nutrition grew by about 10%. In the area of parenteral nutri-
tion, Fresenius Kabi’s important market for three-chamber
bags grew by 6% to 8% in Asia-Pacific. In Africa, these two
segments also showed positive growth. There is growth
potential in clinical nutrition worldwide, because nutrition
therapies are often not yet sufficiently used in patient care,
although studies have proven their medical and economic
benefits. In cases of health- or age-induced nutritional defi-
ciencies, for example, the administration of clinical nutrition
can reduce hospital costs through shorter stays and less
nursing care. In the market for clinical nutrition, Fresenius
Kabi is one of the leading companies worldwide. In paren-
teral nutrition, the company is the leading supplier worldwide.
In the market for enteral nutrition, Fresenius Kabi is one of
the leading suppliers in Europe, Latin America, and China. In
parenteral nutrition, competitors include Baxter, B. Braun,
and Shanxi Pude Pharmaceuticals. In the market for enteral
nutrition, Fresenius Kabi competes with, among others,
Danone, Nestlé, and Abbott.
In 2018, Fresenius Kabi considers its global market for
infusion therapy to have been worth about € 6 billion. The
global market for infusion therapies grew by around 6%.
Infusion therapies (e. g., electrolytes) are part of the medical
standard in hospitals worldwide. Market growth is mainly
driven by increas ing product demand in emerging markets.
Fresenius Kabi is the market leader in infusion therapy in
Europe. Competitors include B. Braun and Baxter.
In 2018, the global market for medical devices / trans
fusion technology was worth more than € 6 billion, including
approximately € 4 billion for medical devices and about
€ 2 billion for transfusion technology. The market grew by
approximately 4%. In the medical devices market, the main
growth drivers are IT-based solutions that focus on application
safety and therapy efficiency. In the transfusion technology
market, growth is driven by generally increased demand for
blood products in emerging markets. The decline in the
demand for blood bags triggered by new treatment methods
in Europe and the United States in recent years is coming
to an end. The areas of plasma collection and therapeutic aphe-
resis are also experiencing positive growth.
1 Market data based on company research and refers to Fresenius Kabi’s addressable markets. This is subject to annual volatility due to currency fluctuations and patent expiries of original drugs in the IV drug market, among other things. Market data for clinical nutrition refers to Fresenius Kabi’s addressable markets, excluding Japan.
2 Market definition adjusted as in prior year: among other items, sales volume of non-patented branded drugs is included.

Man
agem
ent
Rep
ort
Group Management Report Economic report 51
KEY FIGURES FOR INPATIENT CARE IN GERMANY
2017 2016 2015 2014 2013Change
2017 / 2016
Hospitals 1,942 1,951 1,956 1,980 1,996 - 0.5%
Beds 497,182 498,718 499,351 500,680 500,671 - 0.3%
Length of stay (days) 7.3 7.3 7.3 7.4 7.5 - -
Number of admissions (millions) 19.44 19.53 19.24 19.15 18.79 - 0.5%
Average costs per admission in € 1 5,439 5,205 5,060 4,893 4,792 4.5%
1 Total costs, gross
Source: German Federal Statistical Office 2017
In the medical devices segment, Fresenius Kabi ranks among
the leading suppliers worldwide. International competitors
include Baxter, B. Braun, and Becton, Dickinson and Company,
as well as ICU Medical. In transfusion technology, Fresenius
Kabi is one of the world’s leading compa nies. Competitors
include Haemonetics, Macopharma, and Terumo.
THE HOSPITAL MARKET 1
In 2017, the market of acute care hospitals in Germany was
about € 102 billion 2, as defined by total costs of the German
acute care hospitals (gross). Personnel expenses accounted for
about 62% of hospital costs, and material costs for 38%.
Personnel and material expenses rose by 5% and 3% respec-
tively.
The admissions in the acute care hospital market decreased
by 0.5% in 2017.
Although their economic situation has improved com pared
with previous years, almost a third (30%) of the German
hospitals recorded losses in 2017. A further 11% broke even,
and 59% were able to generate a profit for the year. The
often difficult economic and financial situation of the hospitals
is accompanied by significant investment needs driven by
medical and technological advances, higher quality require-
ments, and necessary modernizations. Moreover, the federal
states failed to meet their statutory obligation to provide suf-
ficient financial resources in the past. This results into a
continuously increasing investment backlog. The Rheinisch-
Westfälisches Institut für Wirtschaftsforschung (RWI) esti-
mates that the annual investment requirement at German hos-
pitals (excluding university hospitals) is at least € 5.8 billion.
This is about twice the funding for investment currently being
provided by the federal states.
Helios Germany is the country’s leading hospital operator in
terms of sales, with a share of about 5.4% (2016: 5.5%) in
the acute care market. The hospitals of Helios Germany com-
pete mainly with individual hospitals or local and regional
hospital associations. Among private hospital chains, our main
competitors are Asklepios, Rhön-Klinikum, and Sana Kliniken.
The so-called change in value figure is relevant for the
increase in the reimbursement of hospital treatments. It is
used to compensate for rising costs in the hospital market,
particularly with regard to personnel and material costs. The
change in value figure is redetermined each year for the
following year. For 2018 it was 2.97% (2017: 2.50%).
The private Spanish hospital market volume was about
€ 14 billion 3 in 2017. In particular, the increasing number of
privately insured patients is opening up growth opportunities
for private operators. Private supplemental insurance in
Spain is relatively inexpensive. It is required in order to make
use of services in private hospitals. Among other factors, the
comparatively short waiting times for scheduled treatments
make private hos pitals attractive.
1 Most recent market data available: German Federal Statistical Office 2018; German Hospital Institute (DKI), Krankenhaus Barometer 2018; Rheinisch-Westfälisches Institut für Wirtschaftsforschung (RWI), Krankenhaus Rating Report 2018
2 The market is defined by total costs of the German acute care hospitals (gross), less academic research and teaching.3 Market data based on company research and refers to the addressable market of Quirónsalud. Market definition includes neither public-private partnership
(PPP) nor Occupational Risk Prevention centers (ORP). The market definition may differ from the definition in other contexts (e. g., regulatory definitions).
HOSPITAL BEDS BY OPERATOR
Private hospitals 19%
Independent non-profit hospitals 33%
Public hospitals 48%
2017: 497,182
Source: German Federal Statistical Office 2017

Managem
ent Report
Group Management Report52
The opportunity for private hospital operators to expand their
networks by building additional new hospitals opens up fur-
ther potential. Since the Spanish market is highly fragmented,
it has consolidation potential.
Quirónsalud is the market leader in Spain, with a market
share of approximately 12% in the private hospital market
in terms of sales. Quirónsalud competes with a large number
of stand-alone private hospitals, as well as with smaller
regional hospital chains such as Asisa, HM Hospitales,
Hospiten, Ribera, Salud Sanitas, and Vithas.
THE MARKET FOR PROJECTS AND SERVICES FOR
HOSPITALS AND OTHER HEALTH CARE FACILITIES
The market for projects and services for hospitals and other
health care facilities is very fragmented. Therefore, an over-
all market size cannot be determined. The market is country-
specific and depends, to a large extent, on factors such as
public health care policies, government regulation, and levels
of privatization, as well as demographics and economic and
political conditions. In markets with established health care
systems and mounting cost pressure, the challenge for hos-
pitals and other health care facilities is to increase their effi-
ciency. Here, demand is especially high for sustainable plan-
ning and energy-efficient construction, optimized hospital pro-
cesses, and the outsourcing of medical-technical support
services to external specialists. This enables hospitals to con-
centrate on their core competency − treating patients. In
addition to offering services for health care facilities world-
wide, Fresenius Vamed itself is active as a post-acute care
provider in several countries, including Germany, Austria,
Switzerland, the Czech Republic, and the United Kingdom. By
acquiring the post-acute care business of Fresenius Helios,
Fresenius Vamed has become a leading provider in this field
in Central Europe. In emerging markets, the focus is on
building and developing infrastructure and improving the level
of health care.
Fresenius Vamed is one of the world’s leading companies
in its market. The company has no competitors that cover
its comprehensive portfolio of services across the entire life
cycle worldwide. Competitors offer only parts of Fresenius
Vamed’s service portfolio. Depending on the service, the
company competes with international companies and consor-
tia, as well as with local providers.
OVERALL BUSINESS DEVELOPMENT
THE MANAGEMENT BOARD’S ASSESSMENT OF THE
EFFECT OF GENERAL ECONOMIC DEVELOPMENTS
AND THOSE IN THE HEALTH CARE SECTOR FOR
FRESENIUS
Overall, the development of the world economy had an only
negligible impact on our industry in 2018. On the whole,
the health care sector, both in mature and growth markets,
developed positively, with continued increasing demand for
health services. This had a positive effect on our business
development.
THE MANAGEMENT BOARD’S ASSESSMENT OF THE
BUSINESS RESULTS AND SIGNIFICANT FACTORS
AFFECTING OPERATING PERFORMANCE
The advantages of our diversified Group structure were clearly
evident in fiscal year 2018. We achieved our Group sales
and earnings targets for fiscal year 2018. Hence, the Manage-
ment Board is of the opinion that the Fresenius Group’s per-
formance in 2018 was successful overall.
Fresenius Medical Care’s sales on a comparable basis in
constant currency increased by 4% 1 to € 16,547 million. On
an adjusted basis 2, net income attributable to shareholders
of Fresenius Medical Care increased by 2% (4% in constant
currency) to € 1,185 million. On a comparable basis 2, net
income increased by 11% (14% in constant currency) to
€ 1,377 million.
Fresenius Kabi achieved organic sales growth of 7%. EBIT 3
decreased by 3% (increased by 2% in constant currency) to
€ 1,139 million. EBIT 3 before expenses for the further develop-
ment of the biosimilars business increased by 5% (increased
by 10% in constant currency) to € 1,305 million. Organic
sales growth of Fresenius Helios was 3%. EBIT was on the
previous year’s level at € 1,052 million (increased by 3% 4).
Fresenius Vamed achieved organic sales growth of 16%. EBIT
grew by 45% (9% 4) to € 110 million.
1 2017 adjusted for IFRS 15 adoption and divestitures of Care Coordination activities2 Before special items and after adjustments3 Before special items4 Adjusted for German post-acute care business transferred from Fresenius Helios to Fresenius Vamed
For a detailed overview of special items and adjustments please see the reconciliation tables on pages 58 to 61.

Man
agem
ent
Rep
ort
Group Management Report Economic report 53
COMPARISON OF THE ACTUAL BUSINESS RESULTS
WITH THE FORECASTS
For 2018, we had assumed that strong demand for our products
and services would continue. This proved to be the case.
The table below shows the guidance development for 2018
for the Group as well as for the business segments.
The financial developments at Fresenius Medical Care and
Fresenius Helios, which were below our expectations, were
only partially offset by the very good development at Fresenius
Kabi. Hence, we narrowed the Group sales and earnings
growth guidance to the low end of the respective ranges.
The guidance for the currency-adjusted sales growth was
achieved by the Fresenius Group. At 6% 1, this was within the
targeted range of 5% to 8% 1. Net income 2, 3 increased by
7% in constant currency and was likewise within the targeted
range of 6% to 9%. Excluding expenditures for the further
development of the biosimilars business, net income 2, 3
increased by 11% in constant currency and was thus within
the guided range of ~10% to 13% as well.
Fresenius invested € 2,163 million in property, plant and
equipment (2017: € 1,828 million). At 6.5%, the investments
in property, plant and equipment are above the prior-year
level of 5.4% as percentage of sales.
Operating cash flow was € 3,742 million (2017: € 3,937
million). The cash flow margin was 11.2% (2017: 11.6%)
ACHIEVED GROUP TARGETS 2018
Guidance 2018, published
February 2018
Guidance adjustment /
concretization, published May 2018
Guidance adjustment /
concretization, published July 2018
Guidance adjustment / concret-
ization, published October 2018
Achieved in2018
Group
Sales (growth, in constant currency) 5% – 8% 3
confirmed (low end) 6% 3
Net income 1 (growth, in constant currency) 6% – 9% 2
confirmed (low end) 7% 2
Net income 1 (growth, in constant currency) excluding biosimilars ~ 10% – 13% 2
confirmed (low end) 11% 2
Fresenius Medical Care
Sales on a comparable basis (growth, in constant currency) ~ 8% 5% – 7% 2% – 3% 4%
Net income on a comparable basis 4 (growth, in constant currency) 13% – 15% 11% – 12% 14%
Net income adjusted 4 (growth, in constant currency) 7% – 9% 2% – 3% 4%
Fresenius Kabi
Sales (growth, organic) 4% – 7%confirmed (top end) 7%
EBIT 7 (growth, in constant currency) - 6% – - 3% - 2 – 1% 1% – 3% 2%
EBIT 7 (growth, in constant currency) excluding biosimilars ~ 2% – 5% ~ 6 – 9% ~ 9% – 11% 10%
Fresenius Helios
Sales 5 (growth, organic) 3% – 6%confirmed (low end) 3%
EBIT (growth) 7% – 10% 5 – 8% 6 0% – 2% 6 0% 6
Fresenius Vamed
Sales (growth, organic) 5% – 10% confirmed 16%
EBIT (growth) 5% – 10% 32 – 37% 6 confirmed 45% 6
1 Net income attributable to shareholders of Fresenius SE & Co. KGaA2 Before special items and after adjustments3 2017 adjusted for IFRS 15 adoption and divestitures of Care Coordination activities4 Net income attributable to shareholders of Fresenius Medical Care AG & Co. KGaA5 Helios Spain contributes 11 months to organic growth6 After transfer of the German post-acute care business from Fresenius Helios to Fresenius Vamed7 Before special items
1 2017 adjusted for IFRS 15 adoption and divested Care Coordination activities2 Net income attributable to the shareholders of Fresenius SE & Co. KGaA3 Before special items and after adjustments
For a detailed overview of special items and adjustments please see the reconciliation tables on pages 58 to 61.

Managem
ent Report
Group Management Report54
and therefore in line with our expectations. We had expected
to achieve a cash flow margin between 10% and 12%.
Group net debt / EBITDA was 2.71 1, 2 (31 December 2017:
2.84 1, 2 ) and excluding divestitures of Care Coordination
activities 2.91 1, 2.
Group ROIC was 8.3% 2 (2017: 8.0% 2), and Group ROOA
was 9.0%2 (2017: 9.4% 2). The change is mainly driven
by a lower EBIT due to currency translation effects and the
R & D expenses for the biosimilars business. For the ROIC
these effects were compensated by lower tax expenses due
to the US tax reform.
RESULTS OF OPERATIONS, FINANCIAL POSITION, ASSETS AND LIABILITIES
RESULTS OF OPERATIONS
SalesIn 2018, we increased Group sales 3 by 6% in constant cur-
rency and by 2% at actual rates to € 33,530 million (2017:
€ 32,841 million). The chart on the right shows the various
influences on Fresenius’ Group sales.
In 2018, Fresenius Medical Care faced effects from the
shift of calcimimetic drugs into the clinical environment and
from lower sales with commercial payors. Sales of Fresenius
Helios are impacted by a decline in admissions. The volume
decline was offset by DRG price increases and better outcome
from the negotiations with the payors. In addition to that,
there were no major effects due to changes in product mix
or changes in prices in 2018.
Negative currency translation effects of 4% were mainly
driven by the devaluation of the U.S. dollar and the Argentinian
peso against the euro.
Sales growth by region is shown in the table below.
Sales growth in the business segments was as follows:
▶ Sales of Fresenius Medical Care decreased by 7% (- 2%
in constant currency) to € 16,547 million (2017: € 17,784
million). Organic sales growth was 4%. Currency transla-
tion effects reduced sales by 5%. The adoption of IFRS
15 reduced sales by 3%. With the 2017 base additionally
adjusted for divestitures of Care Coordination activities,
sales decreased by 1% (increased by 4% in constant cur-
rency). Health Care services sales 3 (dialysis services and
care coordination) decreased by 2% (increased by 4% in
constant currency) to € 13,264 million (2017: € 13,487
million). With € 3,283 million (2017: € 3,252 million), Health
Care product sales increased by 1% (5% in constant cur-
rency).
▶ Fresenius Kabi increased sales by 3% to € 6,544 million
(2017: € 6,358 million). Sales growth was mainly driven by
persisting IV drug shortages and new product launches
in the United States. Moreover, Fresenius Kabi achieved
strong sales growth in the emerging markets. Organic
SALES BY REGION
€ in millions 2018 2017 ChangeOrganic
sales growth
Currency translation
effectsAcquisitions /
divestitures
% of total
sales 4
North America 13,861 14,048 3 - 1% 3% - 4% 0% 42%
Europe 14,484 13,767 5% 3% - 1% 3% 43%
Asia-Pacific 3,366 3,182 6% 8% - 3% 1% 10%
Latin America 1,387 1,431 - 3% 16% - 20% 1% 4%
Africa 432 413 5% 7% - 2% 0% 1%
Total 33,530 32,841 3 2% 4% - 4% 2% 100%
1 At average exchange rates for the last 12 months for both net debt and EBITDA2 Pro forma closed acquisitions / divestitures, excluding NxStage transaction; before special items3 2017 adjusted for IFRS 15 adoption and divestitures of Care Coordination activities4 Based on contribution to consolidated sales
For a detailed overview of special items and adjustments please see the reconciliation tables on pages 58 to 61.
SALES GROWTH ANALYSIS
Organic sales growth
Acquisitions Divestitures Currency Total sales growth
2%
4%
2% 0% 4%

Man
agem
ent
Rep
ort
Group Management Report Economic report 55
sales growth was 7%. Negative currency translation effects
(4%) were mainly related to the devaluation of the U.S.
dollar, the Argentinian peso, and the Brazilian real against
the euro.
▶ Fresenius Helios increased sales by 4% (6% 1) to € 8,993
million (2017: € 8,668 million). Organic sales growth was
3%. Sales of Helios Germany decreased by 2% (increased
by 2% 1) to € 5,970 million (2017: € 6,074 million). Sales
were impacted by a decline in admissions, inter alia due
to a trend towards outpatient treatments. To profit from
this trend, Helios Germany is expanding outpatient ser-
vices offerings in a separate division. In addition, vacan-
cies among doctors and specialized nurses in some of our
hospitals led to a decline in the number of cases. Mea-
sures to swiftly fill vacant positions were intensified. Helios
Spain increased sales by 17% (organic growth: 6%) to
€ 3,023 million, mainly due to the additional month of con-
solidation compared to the prior-year period and excel-
lent operating performance.
▶ Fresenius Vamed increased sales by 37% (19% 1 ) to
€ 1,688 million (2017: € 1,228 million). Sales in the proj-
ect business increased by 17% to € 712 million (2017:
€ 606 million). Sales in the service business grew by 57%
to € 976 million (2017: € 622 million). The increase in
sales is due to a strong momentum in both the project and
service businesses as well as increased sales from ser-
vices for Fresenius Helios. The strong increase in the ser-
vice business was mainly driven by the transfer of the
German post-acute care business from Fresenius Helios
to Fresenius Vamed effective July 1, 2018. Order intake
in the project business again developed well; it increased
to € 1,227 million (2017: € 1,096 million). Fresenius Vamed
increased its order backlog by 13% to € 2,420 million
(December 31, 2017: € 2,147 million). Fresenius Vamed is
the only business segment within the Fresenius Group
whose business is significantly influenced by order intake
and order backlog.
Earnings structureGroup net income 2 after special items increased by 12% to
€ 2,027 million (2017: € 1,814 million). Growth in constant
currency was 15%. Earnings per share 2 after special items
increased to € 3.65 (2017: € 3.27). This represents an increase
of 12% at actual rates and of 15% in constant currency. The
weighted average number of shares was 555.5 million.
Group net income 2, 3 before special items increased by
3% to € 1,871 million (2017: € 1,816 million). Growth in
constant currency was 6%. Earnings per share 2, 3 increased
to € 3.37 (2017: € 3.28). This represents an increase of 3% at
actual rates and of 6% in constant currency.
SALES BY BUSINESS SEGMENT
€ in millions 2018 2017 Change
Organic sales
growth
Currency translation
effectsAcquisitions /
Divestitures
% of total
sales 5
Fresenius Medical Care 16,547 16,739 4 - 1% 4% - 5% 0% 49%
Fresenius Kabi 6,544 6,358 3% 7% - 4% 0% 19%
Fresenius Helios 8,993 8,668 4% 3% 0% 1% 27%
Fresenius Vamed 1,688 1,228 37% 16% - 1% 22% 5%
ORDER INTAKE AND ORDER BACKLOG − FRESENIUS VAMED
€ in millions 2018 2017 2016 2015 2014
Order intake 1,227 1,096 1,017 904 840
Order backlog (December 31) 2,420 2,147 1,961 1,650 1,398
1 Adjusted for German post-acute care business transferred from Fresenius Helios to Fresenius Vamed2 Net income attributable to shareholders of Fresenius SE & Co. KGaA3 Before special items4 2017 adjusted for IFRS 15 adoption and divestitures of Care Coordination activities5 Based on contribution to consolidated sales
For a detailed overview of special items and adjustments please see the reconciliation tables on pages 58 to 61.

Managem
ent Report
Group Management Report56
Group net income 1, 3 before special items and after adjust
ments increased by 4% (7% in constant currency) to € 1,871
million (2017: € 1,804 million). Earnings per share1,3 increased
by 3% (6% in constant currency) to € 3.37 (2017: € 3.26).
Group net income 1, 3 before expenses for the further
development of the biosimilars business increased by 8% to
€ 1,991 million (2017: € 1,847 million). Growth in constant
currency was 11%. Earnings per share 1, 3 before expenses
for the further development of the biosimilars business
increased to € 3.58 (2017: € 3.33). This represents an increase
of 8% at actual rates and of 11% in constant currency.
With the exception of hyperinflation in Argentina, inflation
did not have a significant impact on our results of operations.
Group EBITDA 3 decreased by 3% to € 5,991 million
(2017: € 6,174 million). This corresponds to 0% in constant
currency. Group EBIT 3 decreased by 4% to € 4,561 million
(2017: € 4,746 million). This corresponds to a decrease of 1%
in constant currency.
EBIT development by business segment was as follows:
▶ Fresenius Medical Care’s EBIT increased by 29% (con-
stant currency: 33%) to € 3,038 million (2017: € 2,362
million), mainly driven by the divestitures of Care Coordi-
nation activities. EBIT growth was also negatively impacted
by the difficult economic situation in some emerging
markets, including hyperinflation in Argentina. The EBIT
margin increased to 18.4% (2017: 13.3%). EBIT on a
comparable basis increased by 6% in constant currency
and EBIT margin was 14.2% (2017: 13.6%).
▶ Fresenius Kabi’s EBIT 2 decreased by 3% (increased by
2% in constant currency) to € 1,139 million (2017: € 1,177
million). The increase in constant currency was mainly
driven by strong sales and earnings growth in the United
States and in the emerging markets. The EBIT 2 margin
was 17.4% (2017: 18.5%). Fresenius Kabi’s EBIT 2 before
expenses for the further development of the biosimilars
business increased by 5% (10% in constant currency) to
€ 1,305 million (2017: € 1,237 million). The EBIT 2 margin
was 19.9% (2017: 19.5%).
▶ The EBIT of Fresenius Helios remained on the previous
year’s level at € 1,052 million (increased by 3% 4). The
EBIT margin was 11.7% (2017: 12.1%). EBIT of Helios Ger-
many decreased by 14% (- 10% 4) to € 625 million. The
EBIT margin was 10.5% (2017: 11.9%). This was mainly
due to the low sales growth and the transfer of the post-
acute facilities to Fresenius Vamed. The significant fixed-
cost base in the hospital business has a disproportion-
ately strong operating leverage effect on EBIT as the mar-
ket dynamics and sales development slow down. Further-
more, the development of Helios Germany is slowed by
additional catalogue effects, preparatory structural mea-
sures for expected regulatory requirements (e. g., cluster-
ing), and a lack of privatization opportunities in the Ger-
man market. An unexpectedly high fluctuation rate among
doctors and the shortage of personnel in the field of nurs-
ing had an additional negative impact on earnings. EBIT
of Helios Spain increased by 26% to € 413 million (2017:
€ 327 million), mainly due to the strong operating perfor-
mance and the additional month of consolidation com-
pared to the prior-year period, with a margin of 13.7%
(2017: 12.6%).
▶ Fresenius Vamed increased EBIT by 45% (9% 4) to € 110
million (2017: € 76 million). The EBIT margin increased to
6.5% (2017: 6.2%).
Development of other major items in the statement of incomeGroup gross profit decreased by 6% (- 3% in constant cur-
rency) to € 9,834 million (2017: € 10,491 million). The gross
margin increased to 29.3% (2017: 31.0%). The cost of sales
increased by 1% to € 23,696 million (2017: € 23,395 million).
Cost of sales as a percentage of Group sales increased to 70.7%
in 2018, compared to 69.0% in 2017.
1 Net income attributable to shareholders of Fresenius SE & Co. KGaA 2 Before special items3 Before special items and after adjustments4 Adjusted for German post-acute care business transferred from Fresenius Helios to Fresenius Vamed
For a detailed overview of special items and adjustments please see the reconciliation tables on pages 58 to 61.
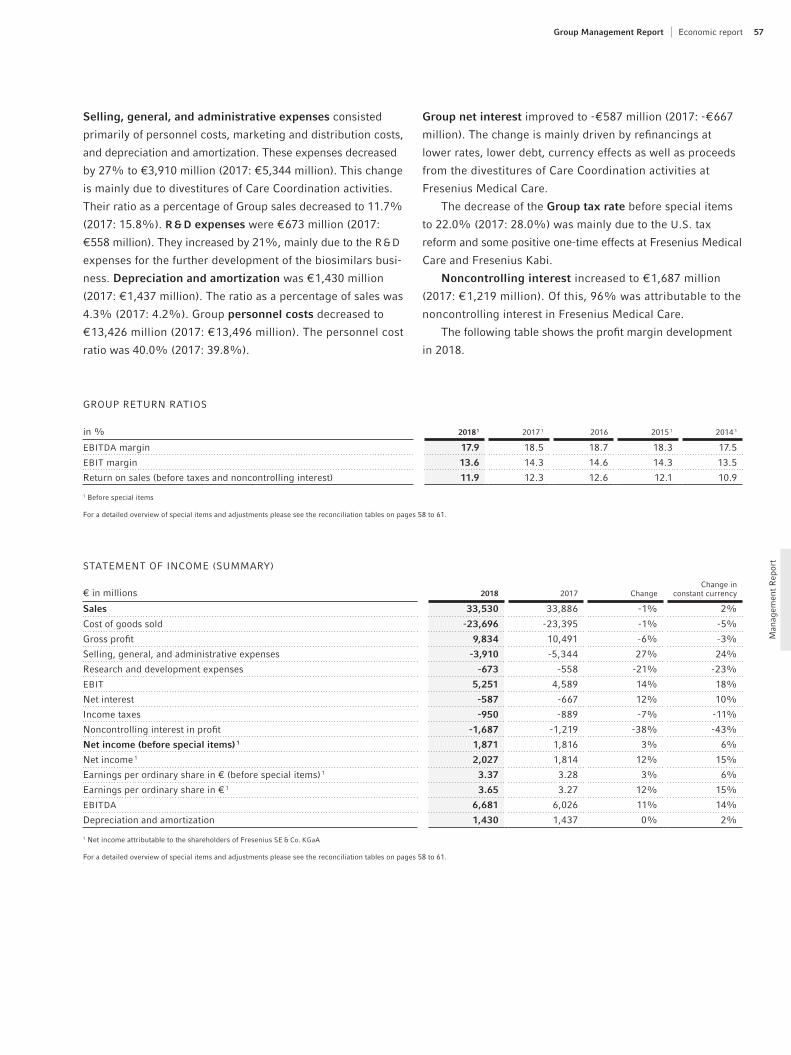
Man
agem
ent
Rep
ort
Group Management Report Economic report 57
Selling, general, and administrative expenses consisted
prima rily of personnel costs, marketing and distribution costs,
and depreciation and amortization. These expenses decreased
by 27% to €3,910 million (2017: € 5,344 million). This change
is mainly due to divestitures of Care Coordination activities.
Their ratio as a percentage of Group sales decreased to 11.7%
(2017: 15.8%). R & D expenses were € 673 million (2017:
€ 558 million). They increased by 21%, mainly due to the R & D
expenses for the further development of the biosimilars busi-
ness. Depreciation and amortization was € 1,430 million
(2017: € 1,437 million). The ratio as a percentage of sales was
4.3% (2017: 4.2%). Group personnel costs decreased to
€ 13,426 million (2017: € 13,496 million). The personnel cost
ratio was 40.0% (2017: 39.8%).
Group net interest improved to - € 587 million (2017: - € 667
million). The change is mainly driven by refinancings at
lower rates, lower debt, currency effects as well as proceeds
from the divestitures of Care Coordination activities at
Fresenius Medical Care.
The decrease of the Group tax rate before special items
to 22.0% (2017: 28.0%) was mainly due to the U.S. tax
reform and some positive one-time effects at Fresenius Medical
Care and Fresenius Kabi.
Noncontrolling interest increased to € 1,687 million
(2017: € 1,219 million). Of this, 96% was attributable to the
noncontrolling interest in Fresenius Medical Care.
The following table shows the profit margin development
in 2018.
STATEMENT OF INCOME (SUMMARY)
€ in millions 2018 2017 ChangeChange in
constant currency
Sales 33,530 33,886 - 1% 2%
Cost of goods sold 23,696 - 23,395 - 1% - 5%
Gross profit 9,834 10,491 - 6% - 3%
Selling, general, and administrative expenses 3,910 - 5,344 27% 24%
Research and development expenses 673 - 558 - 21% - 23%
EBIT 5,251 4,589 14% 18%
Net interest 587 - 667 12% 10%
Income taxes 950 - 889 - 7% - 11%
Noncontrolling interest in profit 1,687 - 1,219 - 38% - 43%
Net income (before special items) 1 1,871 1,816 3% 6%
Net income 1 2,027 1,814 12% 15%
Earnings per ordinary share in € (before special items) 1 3.37 3.28 3% 6%
Earnings per ordinary share in € 1 3.65 3.27 12% 15%
EBITDA 6,681 6,026 11% 14%
Depreciation and amortization 1,430 1,437 0% 2%
1 Net income attributable to the shareholders of Fresenius SE & Co. KGaA
For a detailed overview of special items and adjustments please see the reconciliation tables on pages 58 to 61.
in % 2018 1 2017 1 2016 2015 1 2014 1
EBITDA margin 17.9 18.5 18.7 18.3 17.5
EBIT margin 13.6 14.3 14.6 14.3 13.5
Return on sales (before taxes and noncontrolling interest) 11.9 12.3 12.6 12.1 10.9
1 Before special items
For a detailed overview of special items and adjustments please see the reconciliation tables on pages 58 to 61.
GROUP RETURN RATIOS

Managem
ent Report
Group Management Report58
RECONCILIATION FRESENIUS GROUP
Reconciliation to Group net incomeConsolidated results for 2018 include special items related
to the Akorn transaction. These are mainly transaction costs
in the form of legal and consulting fees, as well as costs of
the financing commitment for the Akorn transaction (trans-
action-related expenses). Moreover, special items arose from
gains / losses of divestitures in Care Coordination and the
impact of the FCPA-related charge at Fresenius Medical Care.
Furthermore, special items from revaluations of biosimilars’
contingent liabilities are included.
In order to compare the results with the scope of original
guidance, key figures are additionally adjusted for expendi-
tures for further development of the biosimilars business
and divestitures of Care Coordination activities at Fresenius
Medical Care.
The special items shown within the reconciliation tables are
reported in the Group Corporate / Other segment.
€ in millions 2018 2017 Growth rate
Growth rate in constant
currency
Sales reported 33,530 33,886 - 1% 2%
Adjustments from IFRS 15 - 486
Divestitures of Care Coordination activities at Fresenius Medical Care (FMC) (H2 / 2017) - 559
Sales basis for growth rates 33,530 32,841 2% 6%
EBIT reported (after special items) 5,251 4,589 14% 18 %
Transaction Costs Akorn, biosimilars 35 41
Revaluations of biosimilars contingent liabilities 7 -
Impact of FCPA-related charge 77 200
Gain related to divestitures of Care Coordination activities 809 -
EBIT (before special items) 4,561 4,830 - 6% - 3%
Divestitures of Care Coordination activities at FMC (H2 / 2017) - 84
EBIT basis for growth rates (before special items and after adjustments) 4,561 4,746 - 4% - 1%
Expenditures for further development of biosimilars business 166 60
EBIT basis for growth rates (before special items and after adjustments; excluding biosimilars) 4,727 4,806 - 2% 1%
Net interest reported (after special items) 587 - 667 12% 10%
Bridge Financing Costs Akorn 17 15
Net interest (before special items) 570 - 652 13% 10%
Divestitures of Care Coordination activities at FMC (H2 / 2017) 22
Net interest (before special items and after adjustments) 570 - 630 10% 7%
Expenditures for further development of biosimilars business 7 2
Net interest (before special items and after adjustments;excluding biosimilars) 563 - 628 10% 8%

Man
agem
ent
Rep
ort
Group Management Report Economic report 59
RECONCILIATION FRESENIUS GROUP
€ in millions 2018 2017 Growth rate
Growth rate in constant
currency
Income taxes reported (after special items) 950 - 889 - 7% - 11%
Transaction Costs Akorn, biosimilars 10 - 9
Bridge Financing Costs Akorn 5 - 4
Revaluations of biosimilars contingent liabilities 2 -
FCPA-related charge 49 -
Gain related to divestitures of Care Coordination activities 136 -
U.S. tax reform - 266
Income taxes (before special items) 880 - 1,168 25% 22%
Divestitures of Care Coordination activities at FMC (H2 / 2017) 20
Income taxes (before special items and after adjustments) 880 - 1,148 23% 21%
Expenditures for further development of biosimilars business 53 - 19
Income taxes (before special items and after adjustments; excluding biosimilars) 933 - 1,167 20% 17%
Noncontrolling interest (after special items) 1,687 - 1,219 - 38 % - 43%
FCPA-related charge 19 - 138
Gain related to divestitures of Care Coordination activities 466 -
U.S. tax reform 163
Noncontrolling interest (before special items) 1,240 - 1,194 - 4% - 7%
Divestitures of Care Coordination activities at FMC (H2 / 2017) 30
Noncontrolling interest (before special items and after adjustments) 1,240 - 1,164 - 7% - 10%
Net income reported (after special items) 2,027 1,814 12% 15%
Transaction Costs Akorn, biosimilars 25 32
Bridge Financing Costs Akorn 12 11
Revaluations of biosimilars contingent liabilities 5 -
FCPA-related charge 9 62
Gain related to divestitures of Care Coordination activities 207 -
U.S. tax reform - 103
Net income (before special items) 1,871 1,816 3% 6%
Divestitures of Care Coordination activities at FMC (H2 / 2017) - 12
Net income basis for growth rates (before special items and after adjustments) 1,871 1,804 4% 7%
Expenditures for further development of biosimilars business 120 43
Net income basis for growth rates (before special items and after adjustments; excluding biosimilars) 1,991 1,847 8% 11%
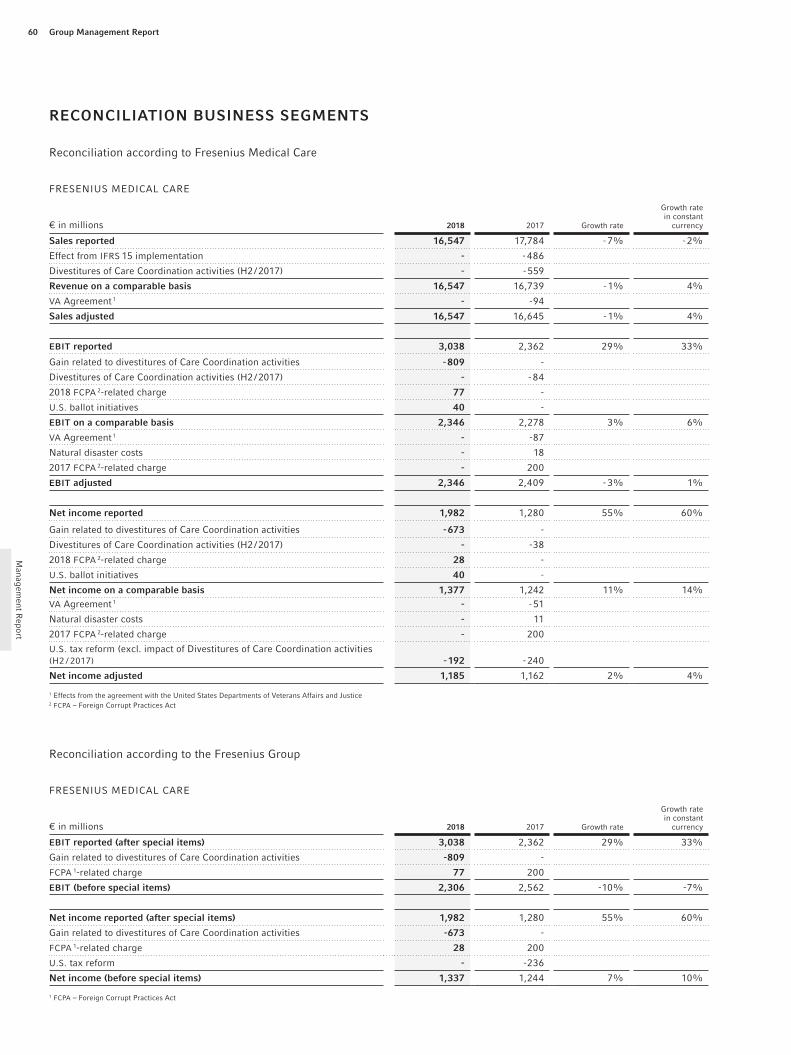
Managem
ent Report
Group Management Report60
RECONCILIATION BUSINESS SEGMENTS
FRESENIUS MEDICAL CARE
€ in millions 2018 2017 Growth rate
Growth rate in constant
currency
Sales reported 16,547 17,784 - 7% - 2%
Effect from IFRS 15 implementation - 486
Divestitures of Care Coordination activities (H2 / 2017) - 559
Revenue on a comparable basis 16,547 16,739 - 1% 4%
VA Agreement 1 - 94
Sales adjusted 16,547 16,645 - 1% 4%
EBIT reported 3,038 2,362 29% 33%
Gain related to divestitures of Care Coordination activities 809 -
Divestitures of Care Coordination activities (H2 / 2017) - 84
2018 FCPA 2-related charge 77 -
U.S. ballot initiatives 40 -
EBIT on a comparable basis 2,346 2,278 3% 6%
VA Agreement 1 - 87
Natural disaster costs 18
2017 FCPA 2-related charge 200
EBIT adjusted 2,346 2,409 - 3% 1%
Net income reported 1,982 1,280 55% 60%
Gain related to divestitures of Care Coordination activities 673 -
Divestitures of Care Coordination activities (H2 / 2017) - 38
2018 FCPA 2-related charge 28 -
U.S. ballot initiatives 40 -
Net income on a comparable basis 1,377 1,242 11% 14%
VA Agreement 1 - 51
Natural disaster costs 11
2017 FCPA 2-related charge 200
U.S. tax reform (excl. impact of Divestitures of Care Coordination activities (H2 / 2017) 192 - 240
Net income adjusted 1,185 1,162 2% 4%
1 Effects from the agreement with the United States Departments of Veterans Affairs and Justice2 FCPA – Foreign Corrupt Practices Act
€ in millions 2018 2017 Growth rate
Growth rate in constant
currency
EBIT reported (after special items) 3,038 2,362 29% 33%
Gain related to divestitures of Care Coordination activities 809 -
FCPA 1-related charge 77 200
EBIT (before special items) 2,306 2,562 - 10% - 7%
Net income reported (after special items) 1,982 1,280 55% 60%
Gain related to divestitures of Care Coordination activities 673 -
FCPA 1-related charge 28 200
U.S. tax reform - 236
Net income (before special items) 1,337 1,244 7% 10%
1 FCPA – Foreign Corrupt Practices Act
Reconciliation according to Fresenius Medical Care
Reconciliation according to the Fresenius Group
FRESENIUS MEDICAL CARE

Man
agem
ent
Rep
ort
Group Management Report Economic report 61
€ in millions 2018 2017 Growth rate
Sales reported 8,993 8,668 4%
German post-acute care business transferred from Fresenius Helios to Fresenius Vamed 230 -
Sales adjusted 9,223 8,668 6%
EBIT reported 1,052 1,052 0%
German post-acute care business transferred from Fresenius Helios to Fresenius Vamed 27 -
EBIT adjusted 1,079 1,052 3%
FRESENIUS HELIOS
FRESENIUS VAMED
€ in millions 2018 2017 Growth rate
Sales reported 1,688 1,228 37%
German post-acute care business transferred from Fresenius Helios to Fresenius Vamed 230 -
Sales adjusted 1,458 1,228 19%
EBIT reported 110 76 45%
German post-acute care business transferred from Fresenius Helios to Fresenius Vamed 27 -
EBIT adjusted 83 76 9%
€ in millions 2018 2017 Growth rate
Growth rate in constant
currency
Sales reported 6,544 6,358 3% 7%
Transaction Costs Akorn, biosimilars 34 41
Revaluations of biosimilars contingent liabilities 7 -
EBIT (before special items) 1,139 1,177 - 3% 2%
Expenditure for further development of biosimilars business 166 60
EBIT basis for growth rates (before special items; excluding biosimilars) 1,305 1,237 5% 10%
Transaction Costs Akorn, biosimilars 24 32
Revaluations of biosimilars contingent liabilities 5 -
Book gain from U.S. tax reform - 30
Net income (before special items) 742 702 6% 12%
Expenditures for further development of biosimilars business 120 43
Net income basis for growth rates (before special items; excluding biosimilars) 862 745 16% 21%
FRESENIUS KABI
RECONCILIATION BUSINESS SEGMENTS

Managem
ent Report
Group Management Report62
FINANCIAL POSITION
Financial management policies and goalsThe financing strategy of the Fresenius Group has the follow-
ing main objectives:
▶ Ensure financial flexibility
▶ Optimize the weighted average cost of capital
Ensuring financial flexibility is key to the financing strategy
of the Fresenius Group. This is achieved through a broad
spectrum of financing instruments, taking market capacity,
investor diversification, flexibility, credit covenants, and
the current maturity profile into consideration. The Group’s
maturity profile is characterized by a broad spread of maturi-
ties with a large proportion of mid- to long-term financing.
We also take into account the currency in which our earnings
and cash flows are generated when selecting the financing
instruments, and match them with appropriate debt structures
in the respective currencies.
The Group’s main debt financing instruments are shown
in the chart on the right. Sufficient financial cushion is assured
for the Fresenius Group by unused syndicated and bilateral
credit lines. In addition, Fresenius SE & Co. KGaA and Fresenius
Medical Care AG & Co. KGaA maintain commercial paper
programs. The Fresenius Medical Care accounts receivable
securitization program offers additional financing options.
Another main objective of the Fresenius Group’s financ-
ing strategy is to optimize the weighted average cost of
capital by employing a balanced mix of equity and debt. Due
to the Company’s diversification within the health care sector
and the strong market positions of the business segments in
global, growing, and non-cyclical markets, predictable and
sustainable cash flows are generated. These allow for a rea-
sonable proportion of debt, i. e., the use of a comprehensive
mix of financial instruments. A capital increase may also be
considered in exceptional cases to ensure long-term growth,
for example to finance a major acquisition.
In line with the Group’s structure, financing for Fresenius
Medical Care and the rest of the Fresenius Group is con-
ducted separately. There are no joint financing facilities and
no mutual guarantees. The Fresenius Kabi, Fresenius Helios,
and Fresenius Vamed business segments are financed pri ma r-
ily through Fresenius SE & Co. KGaA, in order to avoid any
structural subordination.
FinancingFresenius meets its financing needs through a combination
of operating cash flows generated in the business segments
and short-, mid-, and long-term debt. In addition to bank
loans, important financing instruments include bonds, Schuld -
schein loans, convertible bonds, commercial paper pro-
grams, and an accounts receivable securitization program.
Due to the balanced maturity profile, refinancing activi
ties were carried out only to a limited extent in 2018. In July
2018, Fresenius Medical Care AG & Co. KGaA issued a bond
with a volume of € 500 million and a tenor of seven years. The
bond has a coupon of 1.5% and an issue price of 99.704%.
It was issued under the Fresenius Medical Care European
Medium Term Note (EMTN) program. In December 2018,
Fresenius Medical Care increased its accounts receivable secu-
ritization program to US$ 900 million and extended it until
December 2021.
Other financial liabilities 6 %
FINANCING MIX OF THE FRESENIUS GROUP
Commercial papers 10 %
Equity-neutral convertible bonds 7 %
Schuldschein loans 9 %
Syndicated loans 21 %
Bonds 47 %
Dec. 31, 2018: € 18,984 million

Man
agem
ent
Rep
ort
Group Management Report Economic report 63
Fresenius SE & Co. KGaA and Fresenius Medical Care AG &
Co. KGaA maintain commercial paper programs under each
of which up to € 1.0 billion in short-term debt can be issued.
As of December 31, 2018, €973 million of Fresenius SE &
Co. KGaA’s commercial paper program was utilized. Under
Fresenius Medical Care AG & Co. KGaA’s commercial paper
program, € 1.0 billion were outstanding.
The Fresenius Group has drawn about €4.8 billion of
bilateral and syndicated credit lines. In addition, as of
December 31, 2018, the Group had approximately € 3.8 bil-
lion in unused credit lines available (including committed
credit lines of about € 3.0 billion). These credit facilities are
mainly available for general corporate purposes. They are
generally unsecured.
As of December 31, 2018, both Fresenius SE & Co. KGaA
and Fresenius Medical Care AG & Co. KGaA, including all
sub sidiaries, complied with the covenants under their debt
arrangements.
Detailed information on the Fresenius Group’s financing
can be found on pages 208 to 216 of the Notes. Further infor-
mation on financing requirements in 2019 is included in the
Outlook section on page 76.
Effect of offbalancesheet financing instruments on our financial position and liabilitiesFresenius is not involved in any off-balance-sheet transactions
that are likely to have a significant impact on its financial
position, expenses or income, results of operations, liquidity,
investments, assets and liabilities, or capitalization in pre-
sent or in future.
Liquidity analysisIn general, key sources of liquidity were operating cash flows
and cash inflow from financing activities including short-,
mid-, and long-term debt. Cash flow from oper ations is influ-
enced by the profitability of the business of Fresenius and
by net working capital, especially accounts receivable. Cash
inflow from financing activities is generated from short-term
borrowings through the commercial paper programs, and by
drawing on bank facilities. Additionally, Fresenius Medical
Care can sell receivables under its accounts receivable secu-
ritization program. Mid- and long-term funding are mostly
FINANCIAL POSITION – FIVE-YEAR OVERVIEW
€ in millions 2018 2017 2016 2015 2014
Operating cash flow 3,742 3,937 3,585 3,349 2,560
as % of sales 11.2 11.6 12.2 12.0 10.9
Working capital 1 7,827 7,771 6,998 6,091 5,451
as % of sales 23.3 22.9 23.7 21.8 23.2
Investments in property, plant and equipment, net 2,077 1,705 1,616 1,484 1,344
Cash flow before acquisitions and dividends 1,665 2,232 1,969 1,865 1,216
as % of sales 5.0 6.6 6.7 6.7 5.2
1 Trade accounts receivable and inventories, less trade accounts payable and payments received on accounts
1 As of December 31, 2018, major financing instruments 2 Pro forma incl. newly issued Fresenius SE & Co. KGaA € 500 million and € 500 million bonds
maturing in 2025 and 2029, excl. € 300 million and € 500 million bonds, maturing February and April 2019 and €200 million commercial papers
MATURITY PROFILE OF THE FRESENIUS GROUP
FINANCING FACILITIES 1, 2
€ in millions
2019 2020 2021 2022 2023 2024 20322029202720262025
4,000
3,500
3,000
2,500
2,000
1,500
1,000
500
0
203120302028

Managem
ent Report
Group Management Report64
CASH FLOW STATEMENT (SUMMARY)
€ in millions 2018 2017 Change Margin
Net income 3,714 3,033 22%
Depreciation and amortization 1,430 1,437 0%
Change in working capital and others 1,402 - 533 - 163%
Operating cash flow 3,742 3,937 - 5% 11.2%
Capital expenditure, net 2,077 - 1,705 - 22%
Cash flow before acquisitions and dividends 1,665 2,232 - 25% 5.0%
Cash used for acquisitions, net 613 - 5,865 --
Dividends paid 904 - 924 2%
Cash flow after acquisitions and dividends 1,374 - 4,557 --
Cash provided by / used for financing activities 369 4,796 --
Effect of exchange rate changes on cash and cash equivalents 68 - 182 --
Change in cash and cash equivalents 1,073 57 --
The detailed cash flow statement is shown in the consolidated financial statements.
provided by the syndicated credit agreements of Fresenius
SE & Co. KGaA and Fresenius Medical Care, as well as by
bonds, Schuldschein loans, and convertible bonds. Fresenius
is convinced that its existing credit facilities and inflows from
bond issuances, as well as the operating cash flows and addi-
tional sources of short-term funding, are sufficient to meet
the Company’s foreseeable liquidity needs.
The cash inflow of € 1,531 million from the sale of
Fresenius Medical Care’s Care Coordination activities was pri-
marily used to reduce financial liabilities. Therefore, there
was an overall cash outflow from financing activities in 2018.
DividendThe general partner and the Supervisory Board will propose
a dividend increase to the Annual General Meeting. For 2018,
a dividend of € 0.80 per share is proposed (2017: € 0.75 per
share). This is an increase of about 7%. The total dividend
distribution will also increase by about 7% to € 445 million
(2017: € 416 million).
Cash flow analysis Cash flow increased by 15% to € 5,144 million (2017: € 4,470
million). The change in working capital and others was
- € 1,402 million (2017: - € 533 million), mainly due to business
expansion. Operating cash flow decreased by 5% to € 3,742
million (2017: € 3,937 million). The decrease is mainly due to
the following effects: Fresenius Medical Care received a ~ €200
5,144 1,402
3,742 2,077
291
1,374
1,665
CASH FLOW IN € MILLIONS
Cash flow Change in working
capital and others
Operating cash flow
Capex, net Cash flow (before acqs. + dividends)
Acquisitions + dividends
+ Divestitures
Cash flow (after acqs. + dividends)
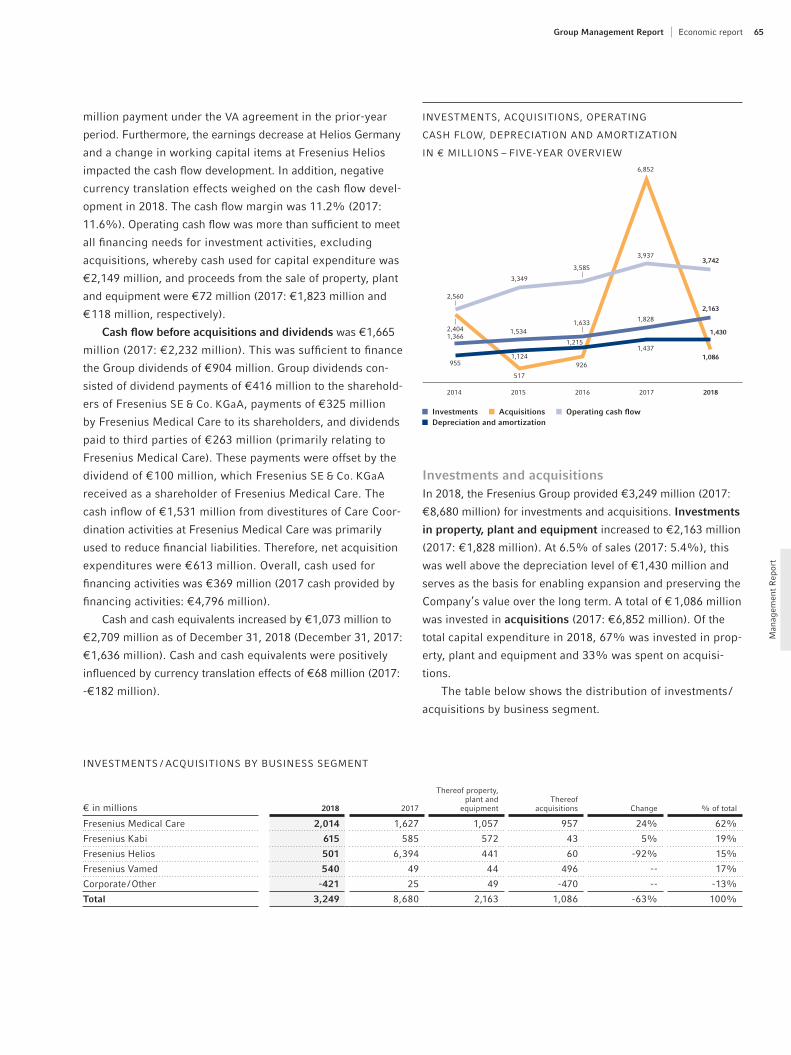
Man
agem
ent
Rep
ort
Group Management Report Economic report 65
million payment under the VA agreement in the prior-year
period. Furthermore, the earnings decrease at Helios Germany
and a change in working capital items at Fresenius Helios
impacted the cash flow development. In addition, negative
currency translation effects weighed on the cash flow devel-
opment in 2018. The cash flow margin was 11.2% (2017:
11.6%). Oper ating cash flow was more than sufficient to meet
all financing needs for investment activities, excluding
acquisitions, whereby cash used for capital expenditure was
€ 2,149 million, and proceeds from the sale of property, plant
and equipment were € 72 million (2017: € 1,823 million and
€ 118 million, respectively).
Cash flow before acquisitions and dividends was € 1,665
million (2017: € 2,232 million). This was sufficient to finance
the Group dividends of € 904 million. Group dividends con-
sisted of dividend payments of € 416 million to the sharehold-
ers of Fresenius SE & Co. KGaA, payments of € 325 million
by Fresenius Medical Care to its shareholders, and dividends
paid to third parties of € 263 million (primarily relating to
Fresenius Medical Care). These payments were offset by the
dividend of € 100 million, which Fresenius SE & Co. KGaA
received as a shareholder of Fresenius Medical Care. The
cash inflow of € 1,531 million from divestitures of Care Coor-
dination activities at Fresenius Medical Care was primarily
used to reduce financial liabilities. Therefore, net acquisition
expenditures were € 613 million. Overall, cash used for
financing activities was € 369 million (2017 cash provided by
financing activities: € 4,796 million).
Cash and cash equivalents increased by € 1,073 million to
€ 2,709 million as of December 31, 2018 (December 31, 2017:
€ 1,636 million). Cash and cash equivalents were positively
influenced by currency translation effects of € 68 million (2017:
-€ 182 million).
Investments and acquisitionsIn 2018, the Fresenius Group provided € 3,249 million (2017:
€ 8,680 million) for investments and acquisitions. Investments
in property, plant and equipment increased to € 2,163 million
(2017: € 1,828 million). At 6.5% of sales (2017: 5.4%), this
was well above the depreciation level of € 1,430 million and
serves as the basis for enabling expansion and preserving the
Company’s value over the long term. A total of € 1,086 million
was invested in acquisitions (2017: € 6,852 million). Of the
total capital expenditure in 2018, 67% was invested in prop-
erty, plant and equipment and 33% was spent on acquisi-
tions.
The table below shows the distribution of investments /
acquisitions by business segment.
INVESTMENTS / ACQUISITIONS BY BUSINESS SEGMENT
€ in millions 2018 2017
Thereof property, plant and
equipmentThereof
acquisitions Change % of total
Fresenius Medical Care 2,014 1,627 1,057 957 24% 62%
Fresenius Kabi 615 585 572 43 5% 19%
Fresenius Helios 501 6,394 441 60 - 92% 15%
Fresenius Vamed 540 49 44 496 -- 17%
Corporate / Other 421 25 49 - 470 -- - 13%
Total 3,249 8,680 2,163 1,086 - 63% 100%
INVESTMENTS, ACQUISITIONS, OPERATING
CASH FLOW, DEPRECIATION AND AMORTIZATION
IN € MILLIONS – FIVE-YEAR OVERVIEW
2014 2015 2016 2017 2018
2,404
3,742
1,534
1,086955
517
1,4301,366
1,124
2,163
2,560
3,349
1,633
926
3,585
1,828
6,852
1,437
3,937
1,215
Investments Acquisitions Operating cash flow Depreciation and amortization

Managem
ent Report
Group Management Report66
The chart on the right shows the regional breakdown.
The cash outflow for acquisitions is primarily related to the
following business segments:
▶ Fresenius Medical Care’s acquisition spendings were
mainly related to the purchase of dialysis clinics as well
as an equity investment in Humacyte, Inc., a medical
research and development company.
▶ Fresenius Kabi’s acquisition spending was mainly for
already planned acquisition-related milestone payments
relating to the acquisition of the biosimilars business
from Merck KGaA.
▶ Fresenius Helios’ acquisition spending was mainly for the
purchase of outpatient clinics in Germany.
▶ Fresenius Vamed’s acquisition spending was mainly for
the purchase of Fresenius Helios’ German post-acute
care business.
The main investments in property, plant and equipment were
as follows:
▶ modernization of existing, and equipping of new, dialysis
clinics at Fresenius Medical Care.
▶ optimization and expansion of production facilities, pri-
marily in North America and Europe for Fresenius Medi-
cal Care, and for Fresenius Kabi, primarily in Europe,
North America, and Asia. Significant individual projects
for Fresenius Kabi were investments in the production
plant in Melrose Park near Chicago and investments in
Wilson, North Carolina.
▶ new building and modernization of hospitals at Fresenius
Helios. The most significant individual projects were the
Amper-Kliniken, hospitals in Duisburg, Wiesbaden, and
Wuppertal, and the construction of a proton beam therapy
center in Madrid.
Investments in property, plant and equipment of €544 million
will be made in 2019, to continue with major ongoing invest
ment projects on the reporting date. These are investment
obligations mainly for hospitals at Fresenius Helios, as well
as investments to expand and optimize production facilities
for Fresenius Medical Care and Fresenius Kabi. These projects
will be financed from operating cash flow.
Acquisition of NxStage Medical, Inc. On August 7, 2017, Fresenius Medical Care announced the
acquisition of NxStage Medical, Inc. (NxStage), a U.S.-based
medical technology and services company, for a total trans-
action value of approximately US$ 2.0 billion (€ 1.7 billion). On
October 27, 2017, the shareholders of NxStage approved
the acquisition. The transaction remains subject to regulatory
approvals and other customary closing conditions. Fresenius
Medical Care expects the closing of the transaction to occur in
early 2019.
INVESTMENTS BY REGION
Other regions 4%
North America 39%
Asia-Pacific 6%
Europe 51%
2018: € 2,163 million

Man
agem
ent
Rep
ort
Group Management Report Economic report 67
€ in millions 2018 2017 Change
Investment in property, plant and equipment 2,163 1,828 18%
thereof maintenance 47% 51%
thereof expansion 53% 49%
Investment in property, plant and equipment as % of sales 6.5 5.4
Acquisitions 1,086 6,852 - 84%
Total investments and acquisitions 3,249 8,680 - 63%
INVESTMENTS AND ACQUISITIONSTermination of the merger agreement with Akorn, Inc.In the lawsuit by Akorn, Inc., a U.S.-based manufacturer and
marketer of prescription and over-the-counter pharmaceutical
products, against Fresenius for the consummation of the
April 2017 merger agreement, the Supreme Court in the U.S.
state of Delaware ruled in favor of Fresenius on Decem-
ber 7, 2018. As this is the highest court in Delaware, no fur-
ther appeal is possible.
Fresenius terminated the merger agreement due to Akorn’s
failure to fulfill several closing conditions. An independent
investigation initiated by Fresenius had revealed, among other
things, material breaches of FDA data integrity requirements
relating to Akorn’s operations. Akorn responded by suing in
the Court of Chancery in Delaware for the consummation
of the agreement, but Akorn’s lawsuit has been dismissed by
the Court of Chancery of Delaware in the first instance, as
well as in the second and last instance before the Delaware
Supreme Court.
Fresenius intends to hold Akorn liable for damages suf-
fered as a result of lost acquisition expenses.
Divestment of Sound Holdings, LLC
On June 28, 2018, Fresenius Medical Care completed the
divestment of its controlling interest in Sound Inpatient Phy-
sicians Holdings, LLC to an investment consortium led by
Summit Partners, L.P. The total transaction proceeds were
US$ 1,771 million (€ 1,531 million). The pre-tax gain related
to divestitures for Care Coordination activities was € 809 mil-
lion, which primarily related to this divestiture, the effect of
the six-month impact from the increase in valuation of Sound’s
share-based payment program, incentive compensation
expense, and other costs caused by the divestment of Sound.
ASSETS AND LIABILITIES
Asset and liability structureThe total assets of the Group rose by 7% to € 56,703 million
(Dec. 31, 2017: € 53,133 million). In constant currency, this
was an increase of 5%. The increase is mainly driven by busi-
ness expansion. Inflation had no significant impact on the
assets of Fresenius in 2018.
Current assets increased to € 14,790 million (Dec. 31,
2017: € 12,604 million). Within current assets, trade accounts
receivable increased by 4% to € 6,540 million (Dec. 31, 2017:
€ 6,260 million). At 74 days, average days sales outstanding was
above the previous year’s level (65).
Inventories decreased by 1% to € 3,218 million (Dec. 31,
2017: € 3,252 million). The scope of inventory in 2018 was 60
days (Dec. 31, 2017: 50 days). The ratio of inventories to total
assets decreased to 5.7% (Dec. 31, 2017: 6.1%).
ASSETS AND LIABILITIES – FIVE-YEAR OVERVIEW
€ in millions 2018 2017 2016 2015 2014
Total assets 56,703 53,133 46,697 43,233 39,955
Shareholders’ equity 1 25,008 21,720 20,849 18,453 15,860
as % of total assets 1 44 41 45 43 40
Shareholders’ equity 1 / non-current assets, in % 60 54 60 56 52
Debt 18,984 19,042 14,780 14,769 15,348
as % of total assets 33 36 32 34 38
Gearing in % 65 80 63 74 89
1 Including noncontrolling interest

Managem
ent Report
Group Management Report68
1 Pro forma closed acquisitions / divestitures, excluding NxStage transaction; before special items
For a detailed overview of special items and adjustments please see the reconciliation tables on pages 58 to 61.
Dec. 31, 2018 1, 2 Dec. 31, 2017 1, 2 Dec. 31, 2016 2 Dec. 31, 2015 1 Dec. 31, 2014 1, 2
Debt / EBITDA 3.2 3.1 2.7 2.9 3.7
Net debt / EBITDA 3 2.7 2.8 2.3 2.7 3.2
Net debt / EBITDA 4 2.7 2.8 2.4 2.7 3.4
EBITDA / net interest 1 10.5 9.6 9.5 8.4 6.8
1 Before special items2 Pro forma acquisitions / divestitures3 At LTM average exchange rates for both net debt and EBITDA4 Net debt at year-end exchange rate; EBITDA at LTM average exchange rates
For a detailed overview of special items and adjustments please see the reconciliation tables on pages 58 to 61.
FIVE-YEAR OVERVIEW FINANCING KEY FIGURES
Noncurrent assets increased by 3% to € 41,913 million
(Dec. 31, 2017: € 40,529 million). In constant currency, the
increase was 2%. Additions to property, plant and equip-
ment, and to goodwill had a strong effect. The goodwill and
intangible assets in the amount of € 28,843 million (Dec. 31,
2017: € 28,457 million) has proven sustainable and increased
mainly due to the acquisitions made in fiscal year 2018. The
addition to the goodwill from acquisitions was € 495 million
in fiscal year 2018. Please see page 203 ff. of the Notes for
further information.
Shareholders’ equity, including noncontrolling interest,
rose by 15% to € 25,008 million (Dec. 31, 2017: € 21,720
million). In constant currency, shareholders’ equity, including
noncontrolling interest, rose by 13%. Group net income
attributable to Fresenius SE & Co. KGaA increased sharehold-
ers’ equity by € 2,027 million. The equity ratio, including
noncontrolling interest, was 44.1% as of December 31, 2018
(Dec. 31, 2017: 40.9%).
The liabilities and equity side of the balance sheet shows
a solid financing structure. Total shareholders’ equity, includ-
ing noncontrolling interest, covers 60% of non-current assets
(Dec. 31, 2017: 54%). Shareholders’ equity, noncontrolling
interest, and long-term liabilities cover all non-current assets
and 47% of inventories.
Longterm liabilities decreased by 11% to € 18,420 mil-
lion as of December 31, 2018 (Dec. 31, 2017: € 20,748 mil-
lion). Shortterm liabilities increased by 24% to € 13,275
million (Dec. 31, 2017: € 10,665 million).
Besides the FCPA provision (for details please see page 206 f.),
the Group has no additional major other accruals that are of
major significance as individual items.
Group debt remained on the prior year’s level at € 18,984
million (decreased by 2% in constant currency). Its relative
weight in the balance sheet was 33% (Dec. 31, 2017: 36%).
Approximately 28% of the Group’s debt is denominated in
U.S. dollars. Liabilities due in less than one year were € 4,944
million (Dec. 31, 2017: € 2,899 million), while liabilities due
in more than one year were € 14,040 million (Dec. 31, 2017:
€ 16,143 million).
Group net debt decreased by 6% (- 8% in constant cur-
rency) to € 16,275 million (Dec. 31, 2017: € 17,406 million).
The net debt to equity ratio including noncontrolling inter-
est (gearing) is 65% (Dec. 31, 2017: 80%).
The return on equity after taxes 1 (equity attributable to
shareholders of Fresenius SE & Co. KGaA) increased to 12.1%
(Dec. 31, 2017: 13.3%). The return on total assets after
taxes and before noncontrolling interest 1 decreased to 5.5%
(2017: 5.7%).
Group ROIC was 8.3% 1 (2017: 8.0% 1), and Group ROOA
was 9.0% 1 (2017: 9.4% 1). Within the position invested capital,
the goodwill of € 25.7 billion had a significant effect on the
calculation of ROIC. It is important to take into account that
approximately 67% of the goodwill is attributable to the stra-
tegically significant acquisitions of National Medical Care
in 1996, Renal Care Group and HELIOS Kliniken in 2006, APP

Man
agem
ent
Rep
ort
Group Management Report Economic report 69
Pharmaceuticals in 2008, Liberty Dialysis Holdings in 2012,
hospitals of Rhön-Klinikum AG in 2014, and Quirónsalud and
the biosimilars business in 2017. Those have significantly
strengthened the competitive position of the Fresenius Group.
In 2018, the Fresenius Group’s return on invested capital
(ROIC) substantially exceeded our cost of capital. The WACC
(weighted average cost of capital) of Fresenius Medical Care
was 5.99%; the WACC of the other business segments was
5.79%.
Currency and interest risk managementThe nominal value of all foreign currency hedging contracts
was € 3,301 million as of December 31, 2018. These con-
tracts had a market value of - € 2 million. The nominal value
of interest rate hedging contracts was € 381 million. These
contracts had a market value of € 5 million. Please see the
Opportunities and Risk Report on pages 85 f. and the Notes
on pages 235 to 246.
ROIC AND ROOA BY BUSINESS SEGMENTS:
ROIC ROOA
in % 2018 2017 2018 2017
Fresenius Medical Care 1, 2 9.5 8.9 10.0 10.9
Fresenius Kabi 1, 2 10.2 9.0 11.1 10.8
Fresenius Helios 1 5.8 6.2 6.8 6.9
Fresenius Vamed 3 – – 9.1 9.8
Group 1, 2 8.3 8.0 9.0 9.4
1 Pro forma acquisitions2 Before special items3 ROIC: invested capital is insignificant due to prepayments, cash, and cash equivalents
CORPORATE RATING
The credit quality of Fresenius is assessed and regularly
reviewed by the leading rating agencies Moody’s, Standard &
Poor’s, and Fitch. Fresenius continues to be rated investment
grade by all rating agencies.
The table below shows the company rating and the respective
outlook as of December 31, 2018.
RATING OF FRESENIUS SE & CO. KGAA
Dec. 31, 2018 Dec. 31, 2017
Standard & Poor’s
Corporate Credit Rating BBB BBB -
Outlook positive positive
Moody’s
Corporate Credit Rating Baa3 Baa3
Outlook stable stable
Fitch
Corporate Credit Rating BBB BBB -
Outlook stable stable

Managem
ent Report
Group Management Report70
OVERALL ASSESSMENT OF THE
BUSINESS SITUATION
At the time this Group Management Report was prepared,
the Management Board continued to assess the development
of the Fresenius Group as positive. Demand for our prod-
ucts and serv ices continues to grow steadily around the world.
OUTLOOK
This Group Management Report contains forward-looking
statements, including statements on future sales, expenses, and
investments, as well as potential changes in the health care
sector, our competitive environment, and our financial situa-
tion. These statements were made on the basis of the expec-
tations and assessments of the Management Board regarding
events that could affect the Company in the future, and on
the basis of our mid-term planning. Such forward-looking state-
ments are subject, as a matter of course, to risks, uncertain-
ties, assumptions, and other factors, so that the actual results,
including the financial position and profitability of Fresenius,
could therefore differ materially – positively or negatively –
from those expressly or implicitly assumed or described
in these statements. For further information, please see our
Opportunities and Risk Report on pages 77 ff.
GENERAL AND MID-TERM OUTLOOKThe outlook for the Fresenius Group for the coming years con-
tinues to be positive. We are able to treat patients and supply
customers reliably, continuously striving to optimize our costs,
to adjust our capacities, and to improve our product mix,
as well as to expand our products and services business. We
expect these efforts to increase our earnings in the coming
years. In addition, good growth opportunities for Fresenius
are, above all, presented by the following factors:
▶ The sustained growth of the markets in which we oper-
ate: Fresenius still sees very good opportunities to benefit
from the growing health care needs arising from aging
populations, with their growing demand for comprehensive
care, and technical advances, but driven also by the still
insufficient access to health care in the developing and
emerging countries. There are above-average growth
opportunities for us not only in the markets of Asia-Pacific
and Latin America, but also in Africa. Efficient health care
systems with appropriate reimbursement structures will
evolve over time in these countries, as economic condi-
tions improve. We will strengthen our activities in these
regions and introduce further products from our portfolio
into these markets successively.
▶ The expansion of our regional presence: The fast- growing
markets in Asia-Pacific, Latin America, and Africa espe-
cially offer further potential to strengthen our market posi-
tion. China, for instance, offers excellent growth opportu-
nities over the long-term, not only in infusion and nutrition
therapies, IV drugs, and medical devices for Fresenius
Kabi, but also for Fresenius Medical Care in dialysis. We
plan to further roll out additional products and therapies
from our existing portfolio in countries where we do not
yet offer a comprehensive range. The successful acquisi-
tion of the largest private hospital operator in Spain in 2017
gives Fresenius Helios a presence outside Germany.
Fresenius Helios sees, beyond that, good opportunities
for further international growth.
▶ The broadening of our services business: For Fresenius
Medical Care, opportunities to extend into new markets or
to expand its market share arise if a country opens up
to private dialysis providers or allows cooperation between
public and private providers through public-private part-
nerships. Whether or not private companies can offer dial-
ysis treatment, and in what form, depends on the health
care system of the country in which they operate and its
legal framework. Fresenius Helios has an extensive
nationwide hospital network in Germany and Spain. Based
on this platform, Fresenius Helios aims to develop and
offer innovative, integrated care offerings. In addition,
Helios Germany is expanding outpatient services in a
separate division. Patient care should be further improved
through the exchange of knowledge and experience
(best practice) between Helios Germany and Quirónsalud.

Man
agem
ent
Rep
ort
71Group Management Report Overall assessment of the business situation / Outlook
Growth opportunities in Spain arise from exploiting syn-
ergies, the expansion and construction of hospitals, and
further consolidation potential in the highly fragmented
Spanish private hospital market, in particular. The cross-
selling of Quirónsalud’s facilities for Occupational Risk
Prevention within the Spanish hospital network offers
additional growth opportunities. Helios Spain announced
the acquisition of Clínica Medellín in 2018. Fresenius
Helios was thus entering the attractive private hospital
market in Colombia.
▶ The broadening of our products business: At Fresenius
Medical Care, we see the planned expansion of the core
business with dialysis products as a growth driver. At
Fresenius Kabi, we plan to expand our IV drugs product
business. We develop generic drug formulations that are
ready to launch at the time of market formation, directly
after the patents of the branded products expire. We also
develop new formulations for non-patented drugs. Further-
more, we develop ready-to-use products that are espe-
cially convenient and safe, including, for example, pre-filled
syringes and ready-to-use solutions in our freeflex infusion
bags.
▶ The development of innovative products and therapies:
These will create the potential to further expand our
market position in the regions. In addition to innovation,
best-in-class quality, reliability, and the convenience of
our products and therapies are key factors here. In our
dialysis business, we expect home therapies to gain further
importance, leading to growth potential for Fresenius
Medical Care. In addition, Fresenius Kabi is developing
new dosage forms for its products. In the area of bio-
similars, Fresenius Kabi specializes in the development of
products for the treatment of oncology and autoimmune
diseases and has a pipeline of molecules at various
stages of development. Helios Germany has been devel-
oping innovative business areas such as digital offerings
in its own division.
▶ Selective acquisitions: Besides retaining organic sales
growth as the basis for our business, we will continue to
utilize oppor tunities to grow by making small and mid-
sized acquisitions that expand our product portfolio and
strengthen our regional presence.
We are also exploiting any opportunities for potential
within our operations for cost-management and efficiency-
enhancement measures. These include plans for cost-
efficient production and a further-optimized procurement
process.
The outlook takes account of all events known at the
time the annual financial statements were prepared that could
influence our operating performance in 2019 and beyond.
Significant risks are discussed in the Opportunities and Risk
Report. As in the past, we will do our utmost to achieve and –
if possible – exceed our targets.
FUTURE MARKETSWe expect the consolidation process to continue among com-
petitors in our markets in Europe, Asia-Pacific, and Latin
America. Consequently, we expect that there will be opportu-
nities for us to penetrate new markets, both by expanding
our regional presence and by extending our product portfolio.
New markets will open up as Fresenius Medical Care suc-
cessively rolls out its product and services portfolio, especially
in emerging countries. Fresenius Medical Care is committed
to preparing its business portfolio for further sustainable,
profitable growth by investing in future growth markets in its
product and service businesses, such as China.
Fresenius Kabi plans to introduce products already
offered outside the United States into that country as well. It
also aims to further roll out its product portfolio interna tionally,
especially in the fast-growing markets of Asia-Pacific and
Latin America. Market share is to be expanded further through
the launch of new products in the field of IV drugs and medi-
cal devices for infusion therapy and clinical nutrition. In
Fresenius Kabi’s biosimilars business, we are developing prod-
ucts focusing on oncology and autoimmune diseases, which
will be introduced to the market over the next few years.
With its broad hospital network across Germany,
Fresenius Helios is able to develop new patient care models.
In addition, Helios Germany is expanding outpatient services
in a separate division. The increasing number of privately
insured patients in Spain is opening up opportunities for pri-
vate operators like Helios Spain.

Managem
ent Report
Group Management Report72
Fresenius Vamed is expecting to grow in the life cycle and
PPP project areas, both with regard to the project and the
services business. Moreover, the company intends to further
expand its position with follow-up orders, as well as to enter
new target markets. Furthermore, with the transfer of the
German inpatient post-acute care business from Fresenius
Helios to Fresenius Vamed, the company has positioned itself
as a leading provider in that segment in central Europe.
HEALTH CARE SECTOR AND MARKETSThe health care sector is considered to be widely indepen-
dent of economic cycles. The demand, especially for life-
saving and life-sustaining products and services, is expected
to increase, given that they are medically needed and the
population is aging. Moreover, medical advances and the large
number of diseases that are still difficult to cure – or are
incurable – are expected to remain growth drivers.
In the emerging countries, the availability of basic health
care and the growing demand for high-quality medical treat-
ment is increasing. As per-capita income increases, individu-
als increasingly have to cope with the illnesses associated
with lifestyle diseases.
On the other hand, experts estimate that further financial
constraints in the public sector could result in more pricing
pressure and a slowdown in revenue for companies in the
health care industry. Some countries are experiencing signifi-
cant financing problems in the health care sector due to the
strained public finance situation. Especially in the industrial-
ized countries, increased pressure to encourage saving can
be expected as health care costs constitute a large portion of
the budget.
It will be increasingly important for companies in the health
care sector to increase patient benefit, to improve treatment
quality, and to offer preventive therapies. In addition, espe-
cially those products and therapies that are not only medi-
cally but also economically advantageous will be of increas-
ing importance.
THE DIALYSIS MARKET
The global dialysis market is expected to grow by about 4%
at constant exchange rates in 2019.
The number of dialysis patients worldwide is expected
to rise by approximately 6% in 2019, although significant
regional differences will remain. For the United States, Japan,
and the countries of Central and Western Europe, where
prevalence is already relatively high, we forecast patient
growth in the region by up to 4%. In economically weaker
regions, the growth rates are even higher.
Driven by the development of infrastructure, the estab-
lishment of health care reimbursement systems and the
growing number of chronically ill patients, over-proportional
growth is expected in some regions.
Overall, factors such as aging populations and the grow-
ing number of people suffering from diabetes and hyperten-
sion, which are ailments often preceding terminal kidney fail-
ure, are contributing toward continued growth of the dialysis
markets. The life expectancy of dialysis patients is also rising
thanks to ongoing advances in treatment quality and the ris-
ing standard of living, especially in the emerging countries.
Further information is provided on pages 49 f. of the
Group Management Report.
THE MARKET FOR GENERIC IV DRUGS,
BIO PHARMACEUTICALS, CLINICAL NUTRITION,
INFUSION THERAPY, AND MEDICAL DEVICES /
TRANSFUSION TECHNOLOGY 1
We expect the global market for generic IV drugs, biopharma-
ceuticals, clinical nutrition, infusion therapy, and medical
devices / transfusion technology to grow by around 7% in 2019.
In 2019, the market for generic IV drugs in Europe and
the United States is expected to grow by approximately 2% to
3%. The demand for generic drugs is likely to grow because
of their significantly lower price in comparison to the originator
drugs’ price. The growth dynamic will continue to be driven
by originator drugs going off-patent, as well as by original
off-patent products that are offered at steady prices due to a
unique selling proposition. A factor working in the opposite
direction is the price erosion for original off-patent drugs and
generic drugs that are already on the market.
We expect Fresenius Kabi’s relevant market for biophar-
maceuticals to grow by around 13% in 2019.
1 Market data refers to Fresenius Kabi’s addressable markets. Those are subject to annual volatility due to currency fluctuations and patent expiries of original drugs in the IV drug market, among other things. Market data for clinical nutrition refers to Fresenius Kabi’s addressable markets, excluding Japan. Percentage increase based on market value (price × volume).
Source: Company research

Man
agem
ent
Rep
ort
73
In 2019, growth of about 3% is expected for the clinical nutri-
tion market in Europe. However, given the financial con-
straints in many countries, the efforts to contain costs in the
health care sector are being pursued undiminished. Contin-
ued high growth potential is projected in Asia-Pacific, Latin
America, and Africa. We assume a growth of up to 10% in
individual countries.
We expect the market for infusion therapy in Europe to
remain at the prior year’s level in 2019. Besides a slightly
decreasing blood volume substitutes market due to restrictions
imposed on the use of these products, continuous price
pressure in the tender-driven standard-solutions business is
expected to affect growth. Outside Europe, we also estimate
the market for infusion therapy to remain at the prior year’s
level in 2019, whereby Latin America is expected to grow
by up to 4%.
The worldwide market for medical devices / transfusion
technology is expected to grow by up to 4% in 2019.
THE HOSPITAL MARKET
The number of hospital admissions in Germany declined
slightly in 2017. No reliable figures are available yet for 2018.
However, we assume that 2019 will see a further decline in
inpatient hospital admissions and an increase in outpatient
treatments as a result of the increasing provision of outpa-
tient services. The development of the market up to and includ-
ing 2017 shows that, contrary to the market trend, Helios was
able to increase its share of inpatient hospital treatment com-
pared with its competitors in percentage terms. On the basis of
the measures adopted in 2018 and currently being imple-
mented to consolidate hospital locations, the merging or cen-
tralizing of departments, joint management of several spe-
cialist departments by a responsible chief physician, the active
handling of the issue of center formation, the consistent
development of the outpatient sector, and the active handling
of patient services, we expect Helios Germany to record an
increase in inpatient hospital admissions in 2019.
The so-called change in value figure is relevant for the
increase in the reimbursement of hospital treatments in Ger-
many. For 2019 it was set at 2.65%. In addition, the hospital
funding system provides for various increases and reductions
for acute hospitals. For surplus services agreed in advance
with the health insurance companies, hospitals have to accept
the so-called fixed cost degression discount on surplus
services of up to 35%. The exact amount of the discount is
negotiated between the hospitals and the health insurance
companies.
Since 2017, the care supplement has replaced the extra
charge on invoiced hospital treatments. This is intended to
support care in hospitals and is granted based on the cost
of care at the individual hospitals. The funding volume for
2019 is around € 500 million. From 2020 onwards, the previous
supplement will be used to provide funding of € 200 million,
which will be included in the state base rates.
As a result of the Act To Enhance Nurse Staffing Levels
(PpSG), the nursing costs will be excluded from the DRG from
2020; instead, the costs for patient-oriented nursing care will
be fully reimbursed by the health insurance funds via separate
nursing budgets. As early as 2019, each additional or
increased care place at the bed will be completely refinanced
by the cost bearers. Unlike in the past, there is no upper
limit for the additional funds. Measures to relieve the burden
on nursing care are also to be financially supported to a cer-
tain extent from 2020.
In order to factor medical outcomes into the remuneration,
the Federal Joint Committee defines quality indicators. The
specific financial terms and details are currently being worked
out in a consistent overall concept. However, we do not
expect any adverse effects since the Helios Group is well pre-
pared for quality-based remuneration thanks to its clear focus
on quality and transparency of medical outcomes.
The future expectations with respect to their economic
situation vary among the German hospitals: according to the
Krankenhaus-Barometer 2018 survey by the German Hospital
Institute (DKI), only one sixth (18%) of the hospitals expect
their economic situation to improve in 2019, whereas 37%
expect it to worsen. Moreover, investment needs are growing
while government support is declining. The Rheinisch-
West fälisches Institut für Wirtschaftsforschung (RWI) fore-
casts that more hospitals will respond to economic pressures
by joining together into networks and bundling their ser-
vices. Networks offer oppor tunities for individual hospitals to
reduce costs, for example in purchasing.
We expect the private hospital market in Spain to continue
to grow by 2% to 3%. The continuing increase in the number
of privately insured patients should also open up opportunities
for private operators in the future. Relevant indicators, for
example nationwide health care spending and bed density,
Source: Company research; Rheinisch-Westfälisches Institut für Wirtschaftsforschung (RWI), Krankenhaus Rating Report 2013Source: Company research; Rheinisch-Westfälisches Institut für Wirtschaftsforschung (RWI), Krankenhaus Rating Report
Group Management Report Outlook

Managem
ent Report
Group Management Report74
indicate the further market development potential in the
Spanish health care system compared with other EU countries.
This also provides opportunities for the establishment of
new hospitals. In addition, the highly fragmented private Span-
ish hospital market offers further consolidation potential.
THE MARKET FOR PROJECTS AND SERVICES
FOR HOSPITALS AND OTHER HEALTH CARE
FACILITIES
For 2019, we expect the worldwide demand for projects and
services for hospitals and other health care facilities to grow
at a low single-digit rate.
In the Central European markets with established health
care systems, we expect solid growth. The demand for proj-
ects and services for hospitals and other health care facilities
will continue to grow due to demographic changes and the
rising investment and modernization needs of public health
facilities. The focus is on services ranging from the mainte-
nance and repair of medical and hospital equipment, facility
management, and technical operation, through to total oper-
ational management and infrastructure process optimization
– especially within the framework of public-private partner-
ship (PPP) models. Additional growth opportunities are pre-
sented by an increasing number of non-medical services,
which are outsourced from public facilities to private service
providers. In addition, an expansion of the range of post-
acute care services in Europe is expected.
In the emerging markets, we anticipate an overall dynamic
development. Growth in markets such as Africa, Latin Amer-
ica, and southeast Asia will initially be driven by the demand
for efficient, needs-oriented medical care. In China and the
Middle East, growth will be driven by the development of infra-
structure and the creation of new care services, as well as
research and training facilities.
GROUP SALES AND EARNINGSBased on the expected financial results for 2019, Group sales
are projected to grow organically with a compounded annual
growth rate (CAGR) of 4% to 7% in 2020 to 2023. Group net
income 1, 2 is projected to increase organically with a CAGR
of 5% to 9% in 2020 to 2023. Small and medium-sized acqui-
sitions are expected to contribute an incremental CAGR of
approx. 1%-point to both sales and net income growth.
In 2019, we expect to increase Group sales 3 by 3% to 6%
in constant currency. We project Group net income 1, 4 to
increase by ~ 0% in constant currency.
GROUP FINANCIAL MEDIUM-TERM TARGETS
1 Before special items2 Net income attributable to shareholders of Fresenius SE & Co. KGaA
GROUP FINANCIAL TARGETS 2019
Targets 2019 Fiscal year 2018 1
Sales growth (in constant currency) 3% – 6% 2 € 33,009 m
Net income 3 growth (in constant currency) ~ 0% 4 € 1,872 m
DividendFurther increase
intendedProposal
+ 7% per share
1 Before special items and after adjustments (see table on page 75)2 Adjusted for effects of IFRS 16, excluding effects from pending acquisition of NxStage by FMC3 Net income attributable to shareholders of Fresenius SE & Co. KGaA4 Before special items (before transaction-related expenses, expenses associated with the cost
optimization program at FMC, revaluations of biosimilars contingent liabilities), adjusted for IFRS 16 effects, excluding effects from pending acquisition of NxStage by FMC
CAGR 2020 – 2023 1
Organic sales growth 4% – 7%
Organic net income growth 2 5% – 9%
1 Net income attributable to shareholders of Fresenius SE & Co. KGaA2 Before special items3 Base 2018: €33,009 million; 2018 adjusted for divestitures of Care Coordination activities at FMC (H1 / 18); 2019 adjusted for IFRS 16 effects,
excluding effects from pending acquisition of NxStage by FMC4 Base 2018: € 1,872 million; 2018 before special items and adjusted for divestitures of Care Coordination activities at FMC (H1 /18);
2019 before special items (before transaction-related expenses, expenses associated with the cost optimization program at FMC, revaluations of biosimilars contingent liabilities), adjusted for IFRS 16 effects, excluding effects from pending acquisition of NxStage by FMC

Man
agem
ent
Rep
ort
75Group Management Report Outlook
SALES AND EARNINGS BY BUSINESS SEGMENTIn 2019, we expect sales and earnings development in our
business segments as shown below:
For 2019, Fresenius Medical Care expects adjusted sales to
grow by 3% to 7% 1, 2 in constant currency. Adjusted net
income attributable to shareholders of Fresenius Medical
Care AG & Co. KGaA is expected to develop in the range of - 2%
to + 2% 1, 2 in constant currency.
For 2019, Fresenius Kabi expects organic sales growth of
3% to 6% 1 and EBIT growth in constant currency of 3% to
6%1, 3.
For 2019, Fresenius Helios expects organic sales growth
of 2% to 5%, and EBIT decline of - 5% to - 2%.
For 2019, Fresenius Vamed expects to achieve organic
sales growth of ~ 10% and EBIT growth of 15% to 20%.
1 For details on the 2018 base please see table on page 752 2019 before special items (cost optimization program), adjusted for IFRS 16 effects, excluding effects from pending acquisition of NxStage by FMC 3 2019 before special items (before transaction-related expenses, revaluations of biosimilars contingent liabilities), adjusted for IFRS 16 effects
FINANCIAL TARGETS BY BUSINESS SEGMENT 2019
Targets 2019 1 Fiscal year 2018 2
Fresenius Medical Care
Sales growth
(in constant currency) 3% – 7% € 16,026 m
Net income 3 growth (in constant currency) - 2% – + 2% € 1,341 m
Fresenius Kabi
Sales growth (organic) 3% – 6% € 6,544 m
EBIT growth(in constant currency) 3% – 6% € 1,139 m
Fresenius Helios
Sales growth (organic) 2% – 5% € 8,993 m
EBIT growth - 5% – - 2% € 1,052 m
Fresenius Vamed
Sales growth (organic) ~ 10% € 1,688 m
EBIT growth 15% – 20% € 110 m
1 Before special items (before transaction-related expenses, expenses associated with the cost optimization program at FMC, revaluations of biosimilars contingent liabilities), adjusted for IFRS 16 effects, excluding effects from pending acquisition of NxStage by FMC
2 Before special items and after adjustments (see table on page 75)3 Net income attributable to shareholders of Fresenius Medical Care AG & Co. KGaA
€ in millions Fresenius GroupFresenius
Medical Care Fresenius Kabi
Sales (as reported) 33,530 16,547 6,544
Divestitures of Care Coordination activities at FMC (H1 / 2018) - 521 - 521
Sales (adjusted = base for guidance) 33,009 16,026 6,544
Transaction costs Akorn, biosimilars 34
Revaluations of biosimilars contingent liabilities 7
EBIT (before special items = base for Kabi guidance) 1,139
Net income (as reported) 2,027 1,982
Gain related to divestitures of Care Coordination activities - 207 - 673
Impact of FCPA-related charge + 9 + 28
Transaction Costs Akorn, biosimilars + 25
Bridge Financing Costs Akorn + 12
Revaluations of biosimilars contingent liabilities + 5
Net income (before special items) 1,871 1,337
Divestitures of Care Coordination activities at FMC (H1 / 2018) + 1 + 4
Net income (adjusted = base for FSE & FMC guidance) 1,872 1,341
FRESENIUS GROUP / FRESENIUS MEDICAL CARE / FRESENIUS KABI – 2018 BASE FOR GUIDANCE 2019

Managem
ent Report
Group Management Report76
FINANCINGFor 2019, we expect continued strong cash flow with a cash
flow margin between 10% and 12%.
In addition, unused credit lines under syndicated or
bilateral credit facilities from banks provide us with a suffi-
cient financial cushion.
The bonds of Fresenius SE & Co. KGaA maturing due in
2019 were already successfully refinanced in January 2019.
Bonds with a total volume of € 1,000 million were issued.
Furthermore, the financing activities in 2019 will mainly focus
on the refinancing of Fresenius Medical Care bonds and the
equity-neutral convertible bond of Fresenius SE & Co. KGaA.
Without acquisitions and adoption of IFRS 16 we expect
net debt / EBITDA 1 by year-end 2019 to be broadly stable
over the year-end 2018 figure.
INVESTMENTSIn 2019, we expect to invest about 7% of sales in property,
plant and equipment. About 45% of the capital expenditure
planned will be invested at Fresenius Medical Care, about
30% at Fresenius Kabi, and around 20% at Fresenius Helios.
The remaining funds are intended for other investments and
the expansion of the Group headquarters. At Fresenius Medical
Care, investments will primarily be used for the expansion
of production capacity, optimizing production costs, and the
establishment of new dialysis clinics.
Fresenius Kabi will primarily invest in expanding and main-
taining production facilities, as well as in introducing new
manufacturing technologies. At Fresenius Helios, we will pri-
marily invest in the new buildings, in the modernizing and
equipping of existing hospitals, and newly acquired hospitals.
The regional focus of the Group’s investment spending
will be on Europe and North America, which will account for
about 55% and 35%, respectively. The remainder will be
invested in Asia, Latin America, and Africa. About 30% of total
funds will be invested in Germany.
We assume that the return on operating assets 2 (ROOA)
and the return on invested capital 2 (ROIC) will be slightly below
the level of 2018.
ORGANIZATIONIn order to ensure future growth and to sharpen the profitabil-
ity of Fresenius Kabi, we will explore and evaluate strategic
options for Fresenius Kabi’s transfusion and cell tech nologies
business.
DIVIDENDThe dividend increases provided by Fresenius in the last
25 years show impressive continuity. Our dividend policy
aims to align dividends with earnings per share growth
(before special items) and thus broadly maintains a payout
ratio of 20% to 25%. Fresenius intends to further increase
its dividend for 2019.
1 Calculated at expected annual average exchange rates, for both net debt and EBITDA; excluding effects from pending acquisition of NxStage by FMC; excluding further potential acquisitions; adjusted for IFRS 16 effects
2 Excluding NxStage

Man
agem
ent
Rep
ort
Group Management Report Opportunities and risk report 77
OPPORTUNITIES AND RISK REPORT
The Fresenius Group is exposed to a number of risks due to
the complexity and the dynamics of its business. These risks
are inevitable consequences of entrepreneurial activities.
Opportunities can only be exploited when there is a will-
ingness to take risks.
As a provider of products and services for the severely
and chronically ill, we are relatively independent of economic
cycles. The diversification into four business segments,
which operate in different segments of the health care market,
and the global footprint further minimize the Group’s risk
profile. Our experience, as well as our strong market position,
serve as a solid basis for a reliable assessment of risks.
At the same time, we will continue to take advantage of
the wide-ranging opportunities for sustainable growth and
expansion that the health care market offers to the Fresenius
Group.
OPPORTUNITIES MANAGEMENT Managing opportunities is an ongoing, integral part of corpo-
rate activity aimed at securing the Company’s long-term
success. In this way, we can explore new prospects and con-
solidate and improve on what we have already achieved. The
organization and management of the Fresenius Group have a
decentralized, regional structure. This enables us to recog-
nize and analyze trends, requirements, and opportunities in
the often fragmented markets and to focus our actions
accordingly. We maintain regular contact and dialogue with
research groups and scientific institutions, and keep a close
watch on markets and competitors in order to identify oppor-
tunities. Within the Group, opportunities and synergies can
be exploited through continuous communication involving
the exchange of information and know-how between the
business segments. Anticipated future opportunities for the
Fresenius Group are discussed in the Outlook starting on
page 70.
RISK MANAGEMENT
FRESENIUS RISK MANAGEMENT SYSTEM
Risk management is a continuous process. Identifying, con-
trolling, and managing risks are key tools of solid corporate
governance. The Fresenius risk management system is
closely linked to its corporate strategy. Opportunities are not
recognized in the risk management system.
Markets are kept under constant observation and close con-
tact is maintained with customers, suppliers, and institutions.
These policies allow us to swiftly identify and react to changes
in our business environment.
Using standardized processes, risk situations are evalu-
ated regularly and compared with specified requirements. If
negative developments emerge, responses can be initiated at
an early stage.
Responsibilities for the risk management processes and the
monitoring of risks in the business segments have been
assigned as follows:
▶ The business areas and their operational business units are
responsible for identifying, assessing, and managing risks.
▶ The managers responsible are required to report any
relevant changes in the risk profile to the Management
Board without delay.
▶ The Management Board of the Fresenius Group has
overall responsibility for effective risk management and
regularly discusses the current risk situation.
▶ The audit committee of the Supervisory Board monitors
the quality and effectiveness of the risk management
system every six months.
STRUCTURE OF THE FRESENIUS RISK MANAGEMENT SYSTEM
Audit Committee of Supervisory Board
Risk management / risk controlling / control systems of business segments and Group segment
Management Board
Risk management information system (status reports)
Group ControllingGroup Risk Management
Ad-hoc reporting – relevant changes of risk profile and new risks
Supervisory Board

Managem
ent Report
Group Management Report78
The risk management system is supported both at Group level
and in the business segments by our risk controlling mea-
sures and our management information system. Detailed
monthly and quarterly reports are used to identify and analyze
deviations of actual versus planned business development.
In addition, the risk management system includes a control
system that consists of organizational safeguard ing mea-
sures, as well as internal controls and audits, with which we can
identify significant risks at an early stage and counteract
each one individually.
The functionality and effectiveness of our risk management
system is reviewed regularly by the Audit Committee of the
Supervisory Board, the Management Board and the Internal
Audit department. Conclusions arising from the audits are
taken into account in the ongoing refinement of the system, to
allow prompt reaction to changes in our environment. This
system has thus far proved effective. The control system is also
regularly reviewed by the Management Board and the Inter-
nal Audit department. Moreover, the external auditor reviews
whether the control system set up by the Management Board
is suitable for the early identification of risks that would put the
continued existence of the Company in danger. The insights
gained from the audit regarding the internal financial reporting
controls are also taken into account in the continued devel-
opment of the system.
Fresenius has ensured that the scope and focus of the
organizational structure and systems for identifying, assessing,
and controlling risks, and for developing countermeasures
and for the avoidance of risks, are aligned suitably with the
Company-specific requirements and that they are properly
functional. However, there can be no absolute certainty that
this will enable all risks to be fully identified and managed.
INTERNAL FINANCIAL REPORTING CONTROLS
Numerous measures and internal controls assure the correct-
ness and reliability of accounting processes and financial
reporting, and thus preparation of annual financial statements,
consolidated financial statements, and management reports
in compliance with applicable principles. Our four-tier report-
ing process especially promotes intensive discussion and
ensures control of the financial results. At each reporting
level, i. e.,
▶ the local entity,
▶ the region,
▶ the business segment, and
▶ the Group,
financial data and key figures are reported, discussed, and
compared on a regular monthly basis with the prior-year
figures, budget, and latest forecast. In addition, all parameters,
assumptions, and estimates that are of relevance for the
externally reported Group and segment results are discussed
intensively with the department responsible for preparing
the Group’s consolidated financial statements. These matters
are also reviewed and discussed quarterly by the Supervisory
Board’s Audit Committee.
Control mechanisms, such as automated and manual
reconciliation procedures, are further precautions put in
place to assure that financial reporting is reliable and that
trans actions are correctly accounted for. All consolidated
entities report according to Group-wide standards, which are
determined at the head office. These are regularly adjusted
to allow for changes made to the accounting regulations. The
con solidation proposals are supported by the IT system. In
this context, reference is made to the comprehensive consoli-
dation of internal Group balances. To prevent abuse, we
take care to maintain a strict separation of functions. Manage-
ment control and evaluations also help to ensure that risks
with a direct impact on financial reporting are identified and
that controls are in place to minimize them. Moreover,
changes in accounting principles are monitored and employees
involved in financial reporting are instructed regularly and
comprehensively. External experts and specialists are engaged
if necessary. The Treasury, Tax, Controlling, and Legal
departments are involved in supporting the preparation of the
financial statements. Finally, the information provided is
verified once again by the department responsible for prepar-
ing the consolidated financial statements.
Fresenius Medical Care is subject to the controls of Sec-
tion 404 of the Sarbanes-Oxley Act.

Man
agem
ent
Rep
ort
Group Management Report Opportunities and risk report 79
RISK AREAS
OVERALL ECONOMIC RISKS AND RISKS
DUE TO THE OPERATING FRAMEWORK
At present, the development of the global economy pres-
ents no significant risk to the Fresenius Group. In 2019, we
expect overall economic growth to continue. Moreover,
Fresenius is affected only to a small extent by general economic
fluctuations. We expect demand for our life-saving and life-
sustaining products and services to continue to grow. Further-
more, Fresenius is striving for the firm balance of its business
in the main regions and between established and emerging
markets.
The risk situation for each business segment depends in
particular on the development of its relevant markets. Country-
specific political, legal, and financial conditions are there-
fore monitored and evaluated carefully, particularly in the
current macroeconomic environment. This applies, for exam-
ple, to countries with budget problems as a result of their
debt burden, in particular with regard to our accounts receiv-
able. This also applies to the possible impact on our business
activities resulting from the decision by the United Kingdom
to leave the European Union and the continuing uncertainty
about the exit conditions. This further applies to Catalonia’s
quest for independence from Spain.
And it applies in particular to any initiatives by the
U.S. administration with regard to potential changes to the
current health care programs.
RISKS IN THE HEALTH CARE SECTOR
Risks related to changes in the health care market are of
major importance to the Fresenius Group. The main risks are
the financing of health care systems and the corresponding
reimbursement systems, as well as the development of new
products and therapies.
Financing of health care and reimbursement systemsIn our largely regulated business environment, changes in
the law – also with respect to reimbursement – can have a
major impact on our business success. This applies especially
in the United States, where a large portion of our sales are
generated, and where changes in the government reimburse-
ment system, in particular, for example in the reimburse-
ment of dialysis treatments, could have a considerable impact
on our business. In 2018, approximately 33% of Fresenius
Medical Care’s sales in the United States were attri butable to
U.S. federal health care benefit programs, such as Medicare
and Medicaid (CMS). A reduction in reimbursement rates or
reimbursed services could result in significantly lower sales
and operational results.
Medicare has implemented an end-stage renal disease
(ESRD) prospective payment system (ESRD PPS), which
expanded the scope of the products and services covered by
a bundled rate. Due to pressure to reduce health care costs,
increases in the reimbursement rate by the U.S. government
have been limited.
As part of the PPS, our dialysis clinics in the United States
participate in the Quality Improvement Program (QIP).
Medicare reimbursement benefits can be reduced by up to
2% based on the previous year’s benefits if clinics do not
meet the quality standards of the QIP. Underlying quality mea-
sures are reviewed, extended, and amended annually by the
CMS. A material failure by Fresenius Medical Care to achieve
the minimum client quality standards under the QIP could
materially and adversely affect its business, financial condition,
and results of operations.
In addition, Fresenius Medical Care participates in various
value-oriented compensation programs under which we
receive fixed compensation to cover all or a defined amount
of treatment costs for a defined number of patients:
▶ Under CMS’s Comprehensive ESRD Care Model, dialysis
providers and physicians can form entities known as ESRD
Seamless Care Organizations (ESCOs) as part of a new
payment and care delivery model that seeks to deliver bet-
ter health outcomes for Medicare ESRD patients while
lowering CMS’ costs. ESCOs that achieve the program’s
minimum quality thresholds and generate reductions in
costs of care above certain thresholds for the ESRD patients
covered by the ESCO will receive a share of the cost sav-
ings, which is adjusted based on the ESCO’s performance
on certain quality metrics. ESCOs that include dialysis
chains with more than 200 facilities are required to share
in the risk of cost increases and reimburse CMS a share
of any such increases if actual costs rise above set thresh-
olds.

Managem
ent Report
Group Management Report80
▶ Bundled Payment for Care Improvement (“BPCI”) is a CMS
pilot initiative, extended through September 30, 2018,
with bundled payments for the individual services furnished
to Medicare beneficiaries during a single episode of ill-
ness or course of treatment, including acute inpatient hos-
pital services, physician services, and post-acute services.
We commenced participation in several markets under
the BPCI in April 2015 through our majority- owned sub-
sidiary, Sound Inpatient Physicians, Inc. (“Sound”). On
June 28, 2018, we divested our controlling interest in
Sound. Under the BPCI, we had the ability to receive addi-
tional payments if we were able to deliver quality care
at a cost that was lower than certain established bench-
marks, but also had the risk of incurring financial penal-
ties if we were unsuccessful in doing so.
▶ Furthermore, Fresenius Medical Care provided Medicare
Advantage Chronic Special Needs Plan (MA-CSNP) prod-
ucts until December 31, 2018. MA-CSNPs are Medicare
health plans offered by private companies that contract
with Medicare to provide Medicare benefits to special
needs individuals with specific severe or disabling chronic
conditions such as ESRD, with a focus on improving the
coordination of care. As an MA-CSNP, Fresenius Medical
Care provided health care services and received set pay-
ments from CMS for the complete care of ESRD patients
who enrolled in our MA-CSNP.
▶ In addition, Fresenius Medical Care has entered into
sub-capitation and other risk-based and value-based
arrangements with certain payers to provide care to
Medicare Advantage ESRD patients.
Inadequate pricing of products or an unsuitable cost esti-
mate for the service portfolio for beneficiaries and ineffective
cost management may have a material adverse effect on our
financial position, net assets, and operational results.
Fresenius Medical Care mitigated the impact of the refer-
enced reimbursement models and other legislative initiatives
by two broad measures:
▶ First, Fresenius Medical Care works with medical directors
and treating physicians to generate options for efficiency
increases consistent with QIP and good clinical practice
and negotiates cost savings on the purchasing of pharma-
ceuticals;
▶ Second, Fresenius Medical Care introduces new initiatives
in order to achieve efficiency increases and better patient
outcomes by increasing patient care upon initiation of dial-
ysis, increasing the percentage of patients using home
therapies, and generating additional cost reductions in
its clinics.
The U.S. administration has publicly announced its intention
to pursue significant changes to existing health care insur-
ance programs, especially programs in connection with the
Affordable Care Act. In addition, options to restructure the
Medicare program in the direction of a defined-contribution,
“premium support” model and to shift Medicaid funding to a
block grant or per capita arrangement, with greater flexibility
for the states, are also likely to be considered.
The U.S. administration also announced its decision to
end subsidies, known as cost-sharing reduction (CSR) pay-
ments, to health insurance companies to help pay out-of-pocket
costs of low-income Americans. Some commercial insurers
have stated that they will need much higher premiums and
may withdraw from the insurance exchanges created under
the Affordable Care Act if the subsidies were eliminated. As
a result, significant increases in insurance premiums and
a reduction in the availability of insurance through such
exchanges could reduce the number of Fresenius Medical
Care’s commercially insured patients and shift such patients
to Medicare and Medicaid. Because Medicare and Medicaid
reimbursement rates are generally lower than the reim-
bursement rates paid by commercial insurers, a shift of com-
mercially insured patients to Medicare and Medicaid could
have a material adverse impact on the business, financial
conditions, and result of operations of Fresenius Medical Care.
Further federal or state legislation or regulations may be
enacted in the future through a public referendum process in
the United States that could substantially modify or reduce
the amounts paid for services and products offered by us and
our subsidiaries and / or implement new or alternative operat-
ing models and payment models that could present more risk
to our health care service operations. For example, the ballot
initiatives introduced at the state level could result in further
regulation of clinic staffing requirements, state inspection

Man
agem
ent
Rep
ort
Group Management Report Opportunities and risk report 81
requirements, and margins on commercial business. State
regulation at this level would introduce an unprecedented level
of oversight and additional expense at the clinic level
that could have a material adverse effect on the business of
Fresenius Medical Care in the impacted states.
In addition, a portion of dialysis treatment in the United
States is reimbursed by private health insurance companies
and integrated care organizations, with reimbursements
generally higher than the reimbursements provided by the gov-
ernment health care program. As a result, payments from
private health insurers contribute a significant portion to
Fresenius Medical Care’s profits. In 2018, approximately 34%
of Fresenius Medical Care’s sales from health care services
were attributable to private health insurance companies in the
North American segment. If these organizations in the
United States manage to push through a reduction in the reim-
bursement, or the share of reimbursements by private health
insurers, it would significantly reduce the revenues and oper-
ating earnings for the products and services of Fresenius
Medical Care.
A portion of Fresenius Medical Care’s patients who are
currently covered by private insurers may elect to transition
to government-funded reimbursement programs that reim-
burse us at lower rates for our services if efforts to restrict or
eliminate the charitable funding of patient insurance premi-
ums are successful.
Changes in reimbursement from government and private
insurers for our entire product and service portfolio in the
United States could have a material adverse effect on our
business and operating results.
The same applies to the hospital market in Germany, where
the DRG system (Diagnosis-Related Groups) is intended to
increase the efficiency of hospitals while reducing health care
spending. Patients are largely assigned to hospitals by the
public health and pension insurers. It is therefore important
for Helios Germany that the contracts between its hospitals
and the insurers and health care institutions are maintained.
We not only monitor legislative changes intensively, but also
work together with governmental health care institutions.
As a result of the Act to Enhance Nurse Staffing Levels (PpSG),
the nursing costs will be excluded from the DRG from 2020.
Instead, the costs for patient-oriented nursing care will be fully
reimbursed by the health insurance funds via separate nurs-
ing budgets. As early as 2019, each additional or increased
care place at the bed will be completely refinanced by the
cost bearers.
In the German market, Helios Germany sees a general
trend towards outpatient treatment, which could lead to lower
growth in the number of inpatient cases. To counter this
trend, Helios Germany is expanding outpatient services
offerings in a separate division. If Helios Germany does not
succeed in sustainably adapting its business model through
suitable measures, this could lead to a decline in the number
of cases and have a material adverse effect on our business,
financial condition, and result of operations.
Quirónsalud, our private chain of clinics in Spain, operates
hospitals through PPP contracts (public-private partner-
ship), among others methods. These are part of the public
health system in Spain. The company has thus been given
responsibility in certain areas of health care for the citizens of
Spain with statutory health insurance. Quirónsalud receives
compensation for its services in the form of a per capita lump
sum or remuneration for the specific service rendered. If
Quirónsalud were to lose the concession to operate hospitals
with PPP contracts or renegotiations with public or private
insurance companies resulted in worse conditions for doing so,
or if hospitals are not able to compensate for lower reim-
bursement rates by cutting costs, this could have a material
adverse effect on our net assets, financial position, and
results of operations.
Reductions in health care spending could also negatively
affect the pricing of Fresenius Kabi products.
Changes in the law, the reimbursement method, and the
health care program could affect the scope of payments for
services, as well as for insurance coverage and the product
business. This could have a significant adverse impact on
the assets and liabilities, financial position, and results of oper-
ations. Generally, our aim is to counter such possible regula-
tory risks through enhanced performance and cost reductions.

Managem
ent Report
Group Management Report82
Development of new products and therapiesThe introduction of new products and services, or the devel-
opment of new technologies by competitors, could render
one or more of our products and services less competitive or
even obsolete, and thus have a significant negative impact
on future sales, the prices of products, and our range of ser-
vices. This includes the introduction of generic or patented
drugs by competitors, which may have an impact on sales and
operational results.
Cooperation with medical doctors and scientists allows
us to identify and support relevant technological innovations
and to keep abreast of developments in alternative treatment
methods. These enable us to evaluate and adjust our corporate
strategy if necessary.
OPERATING RISKS
Our operational business around the world is exposed to a
number of risks and to extensive regulation, which include,
among others:
▶ the quality, safety, and efficacy of medical and pharmaceu-
tical products, supplies, and therapies;
▶ the operation and licensing of hospitals, other health care
facilities, manufacturing facilities, and laboratories;
▶ the planning, construction, equipment, and management
of pharmaceutical and medical-technological production
facilities;
▶ the planning, construction, equipment, and management
of health care facilities;
▶ permits from public authorities and monitoring of clinical
and non-clinical research and development activities;
▶ product releases and approvals for new products and
product modifications;
▶ the rate of, and accurate reporting and billing for, govern-
ment and third-party reimbursement;
▶ the labeling and designation of pharmaceutical products
and their marketing;
▶ attracting qualified personnel;
▶ compensation of medical directors and other financial
arrangements with physicians and other referral sources;
▶ access to, collection, publication, use, and security of
health information and other protected data.
If Fresenius fails to comply with laws or regulations, this may
give rise to a number of consequences, including monetary and
administrative penalties, increased compliance costs, exclusion
from governmental programs, or a complete or partial cur-
tailment of our authorization to conduct business, any of which
could have a material adverse effect on our business reputa-
tion, financial condition, or results of operations.
Significant risks of operations for the Fresenius Group are
described in the following sections.
Production, products, and servicesCompliance with product and manufacturing regulations is
ensured by our quality management systems, which are,
inter alia, structured in accordance with the internationally
recognized quality standards ISO 9001 and ISO 13485,
taking into account relevant national and international regu-
lations. These are implemented by internal standards such
as quality and work procedure manuals. Regular internal and
external audits are carried out at the Group’s production
sites, distribution companies, and dialysis clinics. These audits
test compliance with regulations in all areas – from man-
agement and administration to production and clinical services
and patient satisfaction. Our production facilities comply
with the Good Manufacturing Practice (GMP) of the markets
they supply. Our facilities are audited by local public health
authorities such as the U.S. Food and Drug Administration
(FDA) or the European Medicines Agency (EMA) and other
authorities. If an authority detects any deficiencies, Fresenius
will immediately take appropriate rectifying measures, as, for
example, following the inspections of our production facilities
in India in 2017.
Non-compliance with the requirements of these
authorities in our production facilities or at our suppliers
could lead to regulatory actions, such as warnings, product
recalls, production interruptions, monetary sanctions, or delays
in new product approvals. Any of these regulatory actions
could adversely affect our business reputation and our ability
to generate sales and result in significant expenses.

Man
agem
ent
Rep
ort
Group Management Report Opportunities and risk report 83
In addition, production could be adversely affected by events
such as natural disasters, infrastructure disruptions, regula-
tory rulings, or supply disruptions, e. g., of raw materials, or
technical failures.
Potential risks arising from the start-up of new production
sites or the introduction of new technologies are countered
through careful planning, regular analysis, and continual prog-
ress reviews.
Performing medical treatments on patients in our hospi-
tals, rehabilitation clinics, and dialysis clinics is subject to
inherent risks. For example, disruptions to processes, also
due to causes such as natural disasters or technical failures,
involve risks for patients and the clinic. In addition, there are
operational risks, for example regarding hygiene. We counter-
act these risks with strict operating procedures, continual per-
sonnel training, and patient-oriented working procedures.
Furthermore, we are constantly striving to improve the stan-
dard of patient treatment through our quality management
systems.
Performance risks associated with Fresenius Vamed’s
project business are countered through professional project
management and control, and with a proven system tailored
to each business activity for identifying, evaluating, and mini-
mizing these risks. This system consists of organizational
measures, such as standards for pricing-in risks when prepar-
ing quotations. Risks are assessed even before accepting
orders and are subsequently updated during regular project
controlling. To avert the risk of default, financial measures
are taken, such as checking creditworthiness and, as a rule,
safeguarding through prepayments, letters of credit, and
secured credits.
ProcurementOn the procurement side, we counter risks – which mainly
involve possible price increases and the availability of raw
materials and goods – by appropriately selecting and working
together with our suppliers through long-term framework
agreements in certain purchasing segments and by bundling
volumes within the Group.
We counter the risk of poor-quality purchased raw mate-
rials, semi-finished products, and components mainly by
requiring our suppliers to meet strict quality standards. This
includes a structured qualification process, which comprises
audits, document and advance sample inspections, as well as
regular quality controls of deliveries. We only purchase
high-quality products with proven safety and suitability from
qualified suppliers that conform to our specifications and
standards.
CompetitionGrowing competition, among other things induced by the
reentry of competitors into the U.S. market for generic IV
drugs after production halts, could materially affect the future
pricing and sale of our products and services adversely. The
introduction of generic or patented drugs by competitors may
have an impact on the sales and operational results of our
products.
Generally, the health care markets are characterized by
price pressure (including from tenders), competition, and
efforts to contain costs. These factors could result in lower
sales and adversely affect our business, our financial
position, and our operational results.
In the United States, almost all Fresenius Kabi injectable
pharmaceutical products are sold to customers through
arrangements with group purchasing organizations (GPOs)
and distributors. The majority of hospitals undertake con-
tracts with GPOs of their choice for their purchasing needs.
Currently, three GPOs control the large majority of sales in
the United States to hospital customers. Fresenius Kabi
derives a large percentage of its revenue in the United States
through a small number of GPOs and has purchasing agree-
ments with the most important of them. To maintain these
business relationships, Fresenius Kabi needs to be a reliable
supplier of a comprehensive and high-quality product line,
remain price-competitive, and comply with the regulations of
the U.S. Food and Drug Administration (FDA). The GPOs also
have purchasing agreements with other manufacturers and
the bidding process for products is highly competitive. Most
of the agreements Fresenius has with GPOs in the United
States can be terminated at short or medium notice. If
Fresenius Kabi does not succeed in fulfilling and maintaining
its existing contracts or if new contracts are concluded on
less favorable terms, this could have an adverse effect on our
sales, financial position, and operational results.

Managem
ent Report
Group Management Report84
The main customers in the area of transfusion technology are
plasma companies and blood centers. There are four major
plasma companies serving the United States. Blood centers
in the United States are consolidating in response to blood-
saving efforts at hospitals, which is having an effect on pricing.
We are countering this pricing development with efficiency
improvements and cost reductions.
Referrals from physiciansOur hospitals, rehabilitation clinics, and dialysis clinics are
dependent on patients selecting them for their medical
treatment. To a large extent, patients rely on the recommen-
dation of their attending physician. Physicians make their
recommendations based on various factors, including the qual-
ity of the medical treatment and the competence of the
hospital staff, as well as the distance to the hospital, and the
availability of appointments for treatment. If we are unable
to meet these criteria, physicians may recommend fewer or no
patients at all to our clinics. In addition, Fresenius Helios
could receive fewer referrals from physicians because they
increasingly perceive Fresenius Helios’ outpatient services
as competition or because they no longer take specialized hos-
pitals with a certain medical focus into account when making
their choice. These factors could result in lower sales and
adversely affect our business, our financial position, and our
operational results.
Payment defaultAs a rule, we assess the creditworthiness of new customers
in order to limit the risk of late payment and defaults by
customers. We also conduct follow-up assessments and review
credit lines on an ongoing basis. We monitor receivables
outstanding from existing customers, and assess the risk of
default. This particularly applies to countries with budgetary
problems and countries exposed to political risks. In 2018,
we again worked on the status of our receivables, by taking
measures such as factoring.
PersonnelThe Company addresses potential shortages of qualified
personnel through appropriate measures for employer brand-
ing, as well as recruitment, development, and retention of
qualified staff.
In order to increase the awareness and attractiveness of
the Fresenius Group, our employer branding relies on a mix
of university marketing, company-internal events (such as the
Fresenius Career Day “Meet the Board” involving our top
management), and digital employer branding (e. g., by expand-
ing our career website and our presence on social media
channels).
To ensure a sustainable supply of qualified staff, we offer,
for example, targeted programs for young academic talents
with subsequent retention programs, as well as comprehensive
apprenticeships for students.
With more than 4,000 apprentices and dual students,
Fresenius is one of the biggest training companies in Germany.
In order to meet the manifold demand for qualified person-
nel, we offer 1,300 apprenticeship places in more than 50
professions and dual study programs every year. We provide
information about our apprenticeship and study program
offers on our career website, as well as at our locations through
various marketing activities and vocational orientation offers
(e. g., vocational information days, Night of Apprenticeship,
student internships, Apprentices’ Navigation System).

Man
agem
ent
Rep
ort
Group Management Report Opportunities and risk report 85
Furthermore, we offer young academic talents the opportunity
to gain initial practical experience and to establish contacts
within our company in the context of internships before or dur-
ing their studies or in the context of their final papers.
Depending on their customer and market structure, our
business segments adopt different approaches and measures
for personnel development. We strengthen employee loyalty
to our company by offering our employees attractive develop-
ment opportunities and fringe benefits and variable com-
pensation and work time models. In addition, we promote
international and interdisciplinary cooperation.
By using target-group-specific measures, Fresenius
addresses the overall shortage of specialized hospital person-
nel. We thereby aim to recruit qualified and dedicated per-
sonnel, thus ensuring our high standard of treatment quality.
Effective January 1, 2019, the German hospital market will
also be subject to the “Verordnung zur Festlegung von Per-
sonaluntergrenzen in pflegeintensiven Bereichen in Kranken-
häusern” (PpUGV – Ordinance on the Minimum Require-
ments for Nursing Personnel in Hospitals). This ordinance
stipulates minimum staffing levels for nursing personnel in
certain areas of the hospital. Most of the hospitals of Helios
Germany already meet these requirements. Further planned
statutory regulations on minimum personnel levels in addi-
tional hospital departments with beds may further intensify
competition for qualified nursing staff. Helios Germany is
therefore working intensively on additional measures to make
it particu larly attractive as an employer for nursing staff.
These include the compatibility of family and career (e. g.,
through childcare facilities at hospital sites or the possi bility
of part-time work), attractive further and advanced training
opportunities, occupational risk prevention, and career
opportunities.
Additional information on our measures to recruit and
develop qualified personnel and to retain employees can
be found in our Group Non-financial Report from page 113
onwards.
FINANCIAL RISKS
Currency and interest-rate risksThe international operations of the Fresenius Group expose
us to a variety of currency risks. In addition, the financing of
the business exposes us to certain interest rate risks. We
use derivative financial instruments as part of our risk manage-
ment to avoid any possible negative impacts of these risks.
However, we limit ourselves to non-exchange-traded, market-
able instruments, used exclusively to hedge our operations
and not for trading or speculative purposes. The majority of
our transactions are conducted with banks that have a high
rating.
The Fresenius Group’s foreign exchange risk manage-
ment is based on a policy approved by the Management
Board that defines the targets, organization, and handling of
the risk management processes. In particular, the guidelines
assign responsibilities for currency risk determination, the
execution of hedging transactions, and the regular reporting
of risk management. These responsibilities are coordinated
with the management structures in the residual business pro-
cesses of the Group. Decisions on the use of derivative
financial instruments in interest rate management are taken
in close consultation with the Management Board. Hedging
transactions using derivatives are carried out by the Corporate
Treasury department of the Fresenius Group – apart from a
few exceptions in order to adhere to foreign currency regula-
tions. These transactions are subject to stringent internal
controls. This policy ensures that the Management Board is
fully informed of all significant risks and current hedging
activities.

Managem
ent Report
Group Management Report86
The Fresenius Group is protected, to a large extent, against
currency and interest rate risks. As of December 31, 2018,
approximately 64% of the Fresenius Group’s debt was pro-
tected against increases in interest rates either by fixed-rate
financing arrangements or by interest rate hedges; 36% was
exposed to interest rate risks. A sensitivity analysis shows that
a rise of 0.5 percentage points in the reference rates relevant
for Fresenius would have an impact of approximately 1.0%
on Group net income.
As a global company, Fresenius is widely exposed to trans-
lation effects due to foreign exchange rate fluctuations.
The exchange rate of the U.S. dollar to the euro is of partic ular
importance because of our extensive operations in the United
States. Translation risks are not hedged. A sensitivity analysis
shows that a one cent change in the exchange rate of the
U.S. dollar to the euro would have an annualized effect of about
€ 120 million on Group sales, about € 22 million on EBIT, and
about € 7 million on Group net income.
As a globally active company, we have production facilities
in all the main currency areas. In the service businesses, our
revenue and cost base largely coincide. The Fresenius Group
uses a Cash-Flow-at-Risk (CFaR) model in order to estimate
and quantify such transaction risks from foreign currencies.
The foreign currency cash flows that are reasonably expected
to arise within the following 12 months, less any hedges, form
the basis for the analysis of the currency risk. As of December
31, 2018, the Fresenius Group’s cash flow at risk was € 66 mil-
lion. Hence, with a probability of 95%, a potential loss in
relation to the forecast foreign exchange cash flows of the next
12 months will not be higher than € 66 million. Further details
on financial risks can be found on pages 235 to 246 in the
Notes.
Recoverability of assetsFinancial risks that could arise from acquisitions and invest-
ments in property, plant and equipment and in intangible
assets are assessed through careful and in-depth reviews
assisted by external consultants. The amount of intangible
assets, including goodwill, product rights, trade names, and
management contracts, represents a considerable part of
the total assets of the Fresenius Group. Goodwill and other
intangible assets with an indefinite useful life carried in the
Group’s consolidated balance sheet are tested for impairment
each year. A significant deterioration in our prospects for the
future or in the general economic environment could result in
additional depreciation being necessary. Further information
can be found on pages 203 ff. of the Notes.
Taxes and dutiesAs a global corporation, Fresenius is subject to numerous tax
laws and regulations. Risks arising therefrom are identified
and evaluated on an ongoing basis. The Fresenius Group’s
companies are subject to regular tax audits. Any changes in
tax regulations or resulting from tax audits and additional
import duties could lead to higher tax payments.
Debt and liquidity Fresenius’ debt was € 18,984 million as of December 31,
2018. The debt could limit the Company’s ability to pay divi-
dends, arrange refinancing, be in compliance with its credit
covenants, or implement the corporate strategy. If the condi-
tions on the relevant financial markets deteriorate signifi-
cantly, financing risks could arise for Fresenius. We reduce
these risks through a high proportion of mid- and long-term
funding with a balanced maturity profile.
Some of our major financing agreements contain cove-
nants requiring us to comply with certain financial ratios and
additional financial criteria. Non-compliance with these cove-
nants could result in a default and acceleration of the debt

Man
agem
ent
Rep
ort
Group Management Report Opportunities and risk report 87
under the respective agreements. We counteract this risk by
taking the relevant performance indicators into account in
our Group planning and continuously monitoring their develop-
ment. This enables us to take countermeasures at an early
stage.
Additional information on conditions and maturities can
be found on pages 208 ff. of the Notes and on pages 62 ff. of
the Group Management Report.
Inflation risksAs an international company, we are exposed to varying
inflation rates and price developments. We are also active
in high-inflation countries such as Argentina. Due to the
development of inflation in Argentina, our subsidiaries oper-
ating there have applied IAS 29, Financial Reporting in
Hyperinflationary Economies, since July 1, 2018. For the fiscal
year 2018, this resulted in an effect on net income (net
income attributable to the shareholders of Fresenius SE & Co.
KGaA) of - € 12 million. Furthermore, as of December 31, 2017,
there was an effect on the equity of the shareholders of
Fresenius SE & Co. KGaA of € 15 million.
RISKS ASSOCIATED WITH RESEARCH AND
DEVELOPMENT AND PRODUCT APPROVAL
The development of new products and therapies always car-
ries the risk that the ultimate goal might not be achieved, or
it might take longer than planned. This is particularly true for
the Fresenius Kabi biosimilar products. The development of
biosimilar products entails additional risks, such as significant
development costs and the still-developing regulatory and
approval processes. Regulatory approval of new products
requires comprehensive, cost-intensive preclinical and clinical
studies. Furthermore, there is a risk that regulatory authori-
ties either do not grant, or delay, product approval, or withdraw
an existing approval. In addition, adverse effects of our
products that may be discovered after regulatory approval or
registration may lead to a partial or complete withdrawal
from the market, either as a result of regulatory actions or
our voluntary decision to stop marketing a product.
In January 2018, for example, the Coordination Group
for Mutual Recognition and Decentralized Procedures –
human (CMDh) at the European Medicines Agency (EMA) rec-
ommended that drugs containing hydroxyethyl starch (HES)
be withdrawn from the market. This position was not taken
unanimously and has therefore been referred to the Euro-
pean Commission for a decision. In April 2018, the Standing
Committee of the European Commission referred the matter
back to the Pharmacovigilance Risk Assessment Committee
(PRAC) of the EMA. The PRAC maintained its recommenda-
tion to suspend regulatory approvals. As a result, the CMDh
of the EMA took the position in July 2018 that regulatory
approvals would be maintained under the condition that risk-
minimizing measures are implemented. These include con-
trolled distribution to accredited hospitals / centers, training and
direct communication with health care professionals, and
warnings on the packaging. In July 2018, the European Com-
mission approved this position. Similar measures could also
be taken by authorities in non-EU countries.
The Fresenius Group spreads its risk widely by conduct-
ing development activities in various product segments. We
also counteract risks from research and development projects
by regularly analyzing and assessing development trends and
examining the progress of research projects. We also strictly
comply with the legal regulations for clinical and chemical-
pharmaceutical research and development.

Managem
ent Report
Group Management Report88
With IV drugs, it is also crucial that new products are contin-
ually brought to the market in a timely manner. Therefore,
we monitor the development of new products on the basis of
detailed project plans and focus on achieving specific mile-
stones. In this way, we can take countermeasures if defined
targets are called into question.
RISKS FROM ACQUISITIONS
The acquisition and integration of companies carries risks
that can adversely affect the assets and liabilities, financial
position, and results of operations of Fresenius. Acquisition
processes often include closing conditions, including but not
limited to antitrust clearance, fulfillment of representations
and warranties, and adherence to laws and regulations. Non-
compliance with such closing conditions by either party to
an acquisition could lead to litigation between the parties or
with others and thus claims against Fresenius.
Following an acquisition, the acquired company’s struc-
ture must be integrated while clarifying legal questions and
contractual obligations. Marketing, patient services, and
logistics must also be unified. During the integration phase,
key managers can leave the company and both the course
of ongoing business processes and relationships with custom-
ers and employees can be harmed. In addition, change-of-
control clauses may be claimed. The integration process may
prove more difficult or require more time and resources than
expected. Risks can arise from the operations of the newly
acquired company that Fresenius regarded as insignificant or
was unaware of. An acquisition may also prove to be less
beneficial than initially expected. Future acquisitions may be
a strain on the finances and management of our business.
Moreover, as a consequence of an acquisition, Fresenius may
become directly or indirectly liable towards third parties, or
claims against third parties may turn out to be non-assertable.
We counter risks from acquisitions through detailed integra-
tion roadmaps and strict integration and project manage-
ment, so that countermeasures can be initiated in good time
if there are deviations from the expected development.
INFORMATION TECHNOLOGY RISKS
The Company’s processes are growing ever more complex as
a result of the Fresenius Group’s steady growth and increas-
ing internationalization. Correspondingly, the dependence on
information and communication technologies, and on the
systems used to structure procedures and – increasingly – har-
monize them internationally, intensifies. A failure of these
systems could temporarily lead to an interruption of other parts
of our business and thus cause serious damage. Fresenius
counters these risks with various security measures, controls,
and audits. In addition, we counter these risks with constant
investment in hardware and software, as well as by improving
our system know-how. Potential risks are covered by a
detailed contingency plan, which is regularly improved and
tested. Redundant systems are maintained for all key sys-
tems, such as IT systems or communications infrastructure.
The loss of sensitive data or the non-compliance with
data protection laws, regulations, and standards could dam-
age our competitive position, our reputation, and the entire
company. To comply with these requirements, we have imple-
mented comprehensive data protection management sys-
tems, which provide the appropriate technical and organiza-
tional measures and controls for the protection of personal
data. Fresenius SE & Co. KGaA and all business areas main-
tain data protection organizations, including a data protection
officer, based on their corporate structure. Data protection
guidelines describe the binding requirements for data pro-
tection and data handling in all business areas. Further infor-
mation about our Data Protection Management Systems can
be found in the Group Non-financial Report on pages 104 ff.
In addition, the increased integration of IT systems and
the use of new technologies such as cloud comput ing within
our business processes means that cyberattacks could
penetrate our internal and external systems, and attackers
could cause damage or gain sensitive information. The
existing IT security architecture, with various security mea-
sures at different levels, protects the systems in our data cen-
ters. Access to sensitive or critical data from outside the pro-
tected data center network is prevented by the use of secure

Man
agem
ent
Rep
ort
Group Management Report Opportunities and risk report 89
protocols and cryptographic measures. In addition, annual
penetration tests are carried out for applications with critical
data (for example, patient or personnel data).
A comprehensive access protection system, for example
procedures to assign and monitor authorizations and pass-
word guidelines, is in place to minimize organizational risks,
such as tampering or unauthorized access. In addition, there
are company guidelines regulating the granting of access
authorization, and compliance with these rules is monitored.
We also conduct operation- and security-related audits.
COMPLIANCE AND LEGAL RISKS
Compliance risksFresenius is subject to comprehensive government regulation
and control in nearly all countries. In addition, Fresenius
must comply with general rules of law, which differ from coun-
try to country. There could be far-reaching legal repercus-
sions or reputation damage should Fresenius fail to comply
with these laws or regulations.
We must comply with these rules and regulations, which
particularly monitor the safety and effectiveness of our medical
products and services. Corruption is a core risk area across
all business segments. Antitrust law, data protection, money
laundering, sanctions, and human rights are further signifi-
cant risk areas. Therefore, it is of special importance to us that
our compliance programs and guidelines are adhered to.
Through compliance, we aim to meet our own expectations
and those of our partners, and to orient our business activities
to generally accepted standards and local laws and regulations.
At Fresenius, we have implemented worldwide risk-
oriented Compliance Management Systems in all business
segments worldwide. These systems take into account the
respective markets in which Fresenius operates. They are
tailored to the specific requirements of each business segment.
Furthermore, we at Fresenius assess compliance risks using
a standardized methodology.
Each business segment has appointed a Chief Compliance
Officer to oversee the development, implementation, and
monitoring of the relevant business segment’s Compliance
Management System. Business segments have established
compliance responsibilities in line with their organizational
and corporate structure. The Corporate Compliance depart-
ment of Fresenius SE & Co. KGaA supports the compliance
officers in each business segment with standardized instru-
ments, processes, and methods, and reports to the Chief Com-
pliance Officer of Fresenius SE & Co. KGaA – the member
of the Management Board for Legal Affairs, Compliance, and
Human Resources.
Our compliance programs set binding rules of conduct for
our employees. We believe that we have taken adequate
measures to ensure that national and international rules are
observed and complied with.
Further information about our Compliance Management
Systems can be found in the Group Non-financial Report on
pages 109 ff.
Legal risksRisks that arise from legal disputes are continually identi-
fied, analyzed, and communicated within the Company. Com-
panies in the health care industry are regularly exposed to
actions for breach of their duties of due care, product liability,
breach of warranty obligations, patent infringements, treatment
errors, and other claims. This can result in high claims for
damages and substantial costs for legal defense, regardless of
whether a claim for damages is actually justified. Legal dis-
putes can also result in an inability to insure against risks of
this kind at acceptable terms in future. Products from the
health care industry can also be subject to recall actions. This
could have a negative effect on our reputation and on the
assets and liabilities, financial position, and results of opera-
tions of the Group.
The Fresenius Group is routinely involved in claims, law-
suits, investigations and other legal matters arising, for the
most part, in the ordinary course of its business of providing
health care services and products. The outcome of litigation
and other legal matters is always difficult to predict accurately.
However, we do not expect any material adverse effect on
our business, results of operations, and financial condition
from the legal matters currently pending.
Further information regarding legal matters and the FCPA
review at Fresenius Medical Care can be found on pages
225 to 234 of the Notes.

Managem
ent Report
Group Management Report90
OTHER RISKS
Our international orientation also gives rise to the following
risks, which could have an adverse effect on our business
and thus on our financial position, and operational results.
▶ Political, social, or economic instability, especially in
developing and emerging countries,
▶ civil unrest, armed conflict, outbreaks of disease,
▶ natural disasters, terrorist attacks, and other unforeseen
events,
▶ different labor law conditions and difficulties in meeting
the global demand for qualified personnel,
▶ different and less stable regulations protecting intellectual
property,
▶ delays in the transport and delivery of our products.
More detailed information on environmental management
at Fresenius and on assistance in the event of natural disasters
and other crises can be found in the Group Non-financial
Report on pages 121 ff. and / or 98 f. and 102.
Risks involving management and control systems, were,
based on our established risk management and controlling
processes, not considered to be significant.
ASSESSMENT OF OVERALL RISKThe basis for evaluating overall risk is the risk management
that is regularly audited by management. Potential risks for
the Group include factors beyond its control, such as the evo-
lution of economies, which are constantly monitored by
Fresenius. Risks also include factors immediately within its
control, such as operating risks, which the Company antici-
pates and reacts to appropriately, as required. There are cur-
rently no recognizable risks regarding future performance
that appear to present a long-term and material threat to the
Group’s assets and liabilities, financial position, and results
of operations. We have created organizational structures that
provide all the conditions needed to rapidly alert us to possi-
ble risk situations and to be able to take suitable countermea-
sures.
RISKS AFFECTING THE ONE-YEAR FORECAST PERIOD
Hig
h ▶ Currencies and interest rates
Med
ium ▶ Global economic
conditions and constitution of the financial markets
▶ Regulatory environment
▶ Quality▶ Reimbursement
rates and prices▶ Growth in number
of cases▶ Personnel
Low
▶ Procurement
▶ Litigations
▶ Tax
▶ Information technology
▶ Natural disasters
Low Medium High
Potential impact
Pro
babi
lity
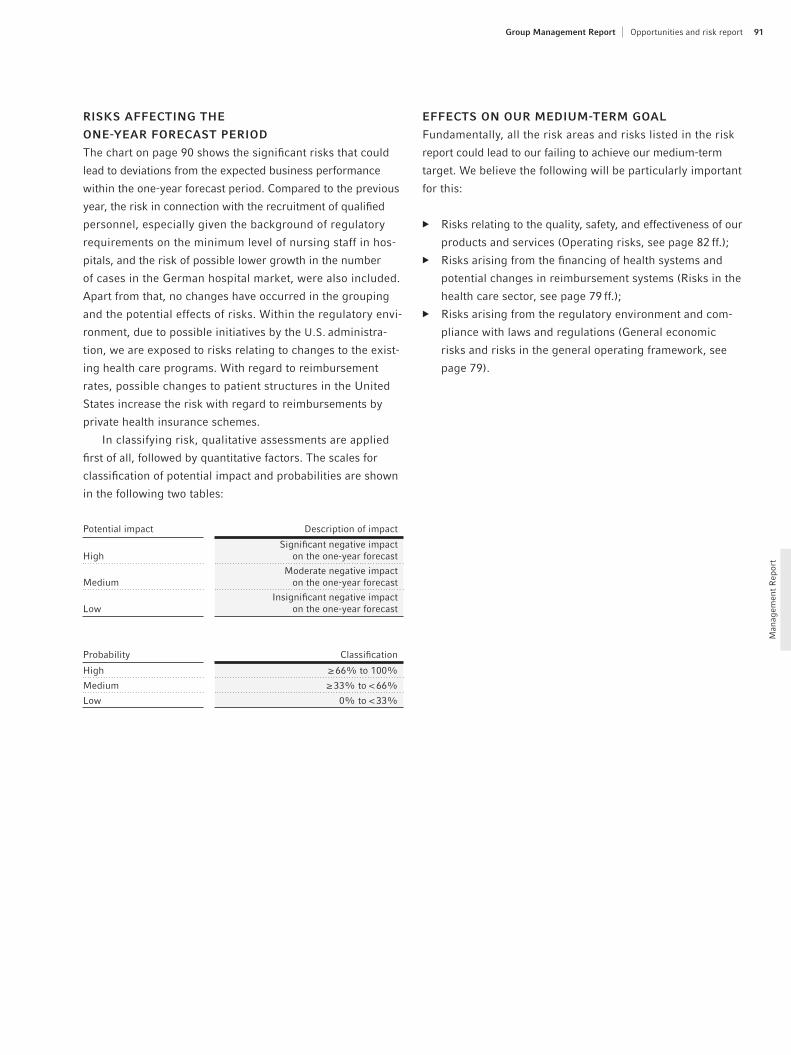
Man
agem
ent
Rep
ort
Group Management Report Opportunities and risk report 91
RISKS AFFECTING THE
ONE-YEAR FORECAST PERIOD
The chart on page 90 shows the significant risks that could
lead to deviations from the expected business performance
within the one-year forecast period. Compared to the previous
year, the risk in connection with the recruitment of qualified
personnel, especially given the background of regulatory
requirements on the minimum level of nursing staff in hos-
pitals, and the risk of possible lower growth in the number
of cases in the German hospital market, were also included.
Apart from that, no changes have occurred in the grouping
and the potential effects of risks. Within the regulatory envi-
ronment, due to possible initiatives by the U.S. administra-
tion, we are exposed to risks relating to changes to the exist-
ing health care programs. With regard to reimbursement
rates, possible changes to patient structures in the United
States increase the risk with regard to reimbursements by
private health insurance schemes.
In classifying risk, qualitative assessments are applied
first of all, followed by quantitative factors. The scales for
classification of potential impact and probabilities are shown
in the following two tables:
Potential impact Description of impact
HighSignificant negative impact
on the one-year forecast
MediumModerate negative impact
on the one-year forecast
LowInsignificant negative impact
on the one-year forecast
Probability Classification
High ≥ 66% to 100%
Medium ≥ 33% to < 66%
Low 0% to < 33%
EFFECTS ON OUR MEDIUM-TERM GOAL
Fundamentally, all the risk areas and risks listed in the risk
report could lead to our failing to achieve our medium-term
target. We believe the following will be particularly important
for this:
▶ Risks relating to the quality, safety, and effectiveness of our
products and services (Operating risks, see page 82 ff.);
▶ Risks arising from the financing of health systems and
potential changes in reimbursement systems (Risks in the
health care sector, see page 79 ff.);
▶ Risks arising from the regulatory environment and com-
pliance with laws and regulations (General economic
risks and risks in the general operating framework, see
page 79).

Non-F
inancial Report
Group Non-Financial Report92
93 Our responsibility
94 The Group’s business model
94 Structure of the Non-financial Report
95 Materiality analysis
95 Sustainability governance structure
96 Non-financial risks
96 Serving the well-being of the patient
108 Doing the right thing
113 Being an attractive employer
121 Protecting nature as the basis of life
125 Caring for human rights
128 Responsibility in the supply chain
129 Limited assurance report of the independent auditor
TABLE OF CONTENTS SEPARATE GROUP NON-FINANCIAL REPORT

93
Non
-Fin
anci
al R
epor
t
Group Non-Financial Report Our responsibilityGroup Non-Financial Report Our responsibility
OUR RESPONSIBILITY
At Fresenius, the patient always comes first. For more than
100 years, we have been working to save lives, promote health,
and improve the quality of life of our patients. Economic
success is not an end in itself for Fresenius; it rather enables
us to keep investing in better medicine.
Every business decision we make is consistently guided
by the well-being of our patients. It is at the center of every-
thing we do. We are committed to integrity in conducting
business with external partners and responsible action, as
well as reliability in our communication.
With the Fresenius Code of Conduct, we set binding
rules for our course of business that cover all employees of
Fresenius SE & Co. KGaA, managers, and board members.
The rules are intended to help us make the right decisions in
our daily work. In addition, the Code of Conduct is the frame-
work for the individual Codes of the business segments.
The structure of this Group Non-financial Report is therefore
aligned with our Code of Conduct and the Codes of the
business segments.
The Fresenius Code of Conduct defines material topics for
all our employees, which are mirrored in the materiality anal-
ysis conducted for this Group Non-financial Report:
▶ We take responsibility for the well-being of the patient
and commit to the highest quality in our products, thera-
pies, and services.
▶ We want to do the right thing and comply with all appli-
cable rules and laws. In addition to legal requirements,
we adhere to high ethical standards and rules of good cor-
porate governance.
▶ Our success and growth are based on the commitment
of our more than 276,000 employees worldwide. As an
attractive employer we want to attract talent, retain
employees, and develop them in the long term.
▶ With every business decision we make, we think and act
long term. Therefore, it is natural for us to protect nature
as a basis for life and to conserve resources.
▶ We care for human rights as they are defined by interna-
tional standards, e. g., the Declaration of Human Rights
of the United Nations.
GROUP NON-FINANCIAL REPORT. We are commit-ted to responsible management and ethical busi-ness principles as an integral part of the Fresenius corporate culture. These principles, which underpin our professionalism, include honesty and integrity in relations with our patients, customers, govern-ments, and the general public.

Non-F
inancial Report
Group Non-Financial Report94
▶ Fresenius Vamed manages projects and provides services
for hospitals and other health care facilities worldwide
and is a leading post-acute care provider in Central Europe.
The portfolio ranges along the entire value chain – from
project development, planning, and turnkey construction,
via maintenance and technical management, to total
operational management.
Fresenius has an international sales network and maintains
more than 90 production sites. Large production sites are
located in the United States, China, Japan, Germany, and
Sweden. Production plants are also located in other Euro-
pean countries and in Latin America, Asia-Pacific, and South
Africa. In total, Fresenius operates in about 90 countries
through its subsidiaries. The main markets are Europe with
43% and North America with 42% of sales, respectively.
For additional information on the Group’s business model,
especially legal and economic factors, as well as important
markets and competitive positions, please see page 37 f. of the
Group Management Report.
STRUCTURE OF THE NON-FINANCIAL REPORTThe separate Fresenius Group Non-financial Report was pre-
pared pursuant to Sections 315b and 315c in connection
with Sections 289c to 289e of the German Commercial Code
(HGB). Statements and key figures are reported in refer-
ence to internationally applicable standards for sustainability
reporting set out by the Global Reporting Initiative (GRI)
guidelines. This separate Group Non-financial Report has been
subject to a limited assurance engagement conducted by
KPMG AG Wirtschaftsprüfungsgesellschaft, Berlin.
Reference to data or information outside of the Group man-
agement report is further information and not part of the
separate Group Non-financial Report. References to additional
information are part of this Group Non-financial Report.
The report is published annually and is an integral part of
the Annual Report. The report encompasses all Fresenius
entities worldwide in which Fresenius SE & Co. KGaA has legal
or effective control, as in the consolidated financial statement.
The business models of the four segments place different
demands on effective management of key issues at the opera-
tional level. Fresenius ensures that global standards are imple-
mented as a framework, building the base for the specific
codes and standards tailored to the business segments’ nature
and market.
THE GROUP’S BUSINESS MODEL Fresenius is a global health care Group in the legal form of
an SE & Co. KGaA (a partnership limited by shares). We offer
products and services for dialysis, hospitals, and outpatient
medical care. In addition, Fresenius focuses on hospital oper-
ations. We also manage projects and provide services for
hospitals and other health care facilities worldwide.
The operating business comprises four business seg-
ments, all of which are legally independent entities managed
by the operating parent company Fresenius SE & Co. KGaA.
The business segments have a regional and decentralized
structure.
▶ Fresenius Medical Care offers services and products for
patients with chronic kidney failure. As of December 31,
2018, Fresenius Medical Care treated 333,331 patients at
3,928 dialysis clinics. Dialyzers and dialysis machines
are among the most important product lines. In addition,
Fresenius Medical Care offers dialysis-related services,
among others in the field of Care Coordination.
▶ Fresenius Kabi specializes in intra venously adminis-
tered generic drugs (IV drugs), clinical nutrition, and infu-
sion therapies. The company is also a supplier of medical
devices and products of transfusion technology. In addition,
we are developing products with a focus on oncology and
autoimmune diseases within the biosimilars segment of
Fresenius Kabi.
▶ Fresenius Helios is Europe’s leading private hospital oper-
ator. The company is part of the holding company Helios
Health, which comprises Helios Germany and Helios
Spain (Quirónsalud). At the end of 2018, Helios Germany
operated a total of 86 hospitals, 124 outpatient clinics,
and 10 prevention centers. Quirónsalud operated 47 hos-
pitals, 57 outpatient centers, and around 300 occupa-
tional risk prevention centers at the end of 2018.

Non
-Fin
anci
al R
epor
t
95Group Non-Financial Report Our responsibility
1 The standards developed by the Global Reporting Initiative (GRI) as an internationally acknowledged framework for sustainability reporting define social matters as the impact of companies’ activities on their customers’ health, among other items. The guidelines for non-financial reporting drawn up by the European Union demand, for example, that companies disclose material information regarding health, safety, and consumer satisfaction under the aspect of social matters.
The key topics identified and their specific management are
explained for the individual business segments. Group-wide
concepts such as data protection, compliance, and human
rights are not reported on a segment-specific basis.
SUSTAINABILITY GOVERNANCE STRUCTUREAt Fresenius, the Group CEO is responsible for sustainability.
The Investor Relations department directly reports to the
CEO, coordinates the operational implementation of sustain-
ability guidelines and standards, and is responsible for the
non-financial reporting of the Fresenius Group. In addition,
Investor Relations provides further guidance on the develop-
ment of sustainability policies and management concepts.
The Management Board and the Supervisory Board discuss
the results of the sustainability efforts in the form of the
Non-Financial Report. In this context, the Supervisory Board
reviews the Non-Financial Report and is supported by the
auditor’s limited assurance engagement.
Fresenius Medical Care is a separately listed company and
has its own sustainability governance structure. At Fresenius
Medical Care, sustainability is also firmly established at Man-
agement Board level. Responsibility for the Company’s sus-
tainability efforts lies with the Sustainability Decision Board,
Fresenius Medical Care’s highest decision-making body for
sustainable development, which is headed by the CEO.
The Sustainability Decision Board and the Corporate Sus-
tainability Committee enable the Corporate Sustainability Office
to manage Fresenius Medical Care’s sustainability program.
MATERIALITY ANALYSIS We want our reporting on non-financial topics to be closely
aligned with our business model, the interests of our stake-
holders, and legal requirements. In 2017, we defined the mate-
rial non-financial topics for the Fresenius Group in a three-
step process. This process consisted of an external analysis,
an internal analysis, and a final prioritization and validation
of the identified topics.
The non-financial aspects requiring disclosure pursuant
to Section 289c (3) HGB were determined based on the mate-
riality requirement of the Corporate Social Responsibility
Directive Implementation Act. The most important aspects are
those that are relevant for an understanding of Fresenius’
business performance, results of operations, and position, as
well as the effects of its own business activities on the non-
financial aspects. Thus, social matters 1 include: quality of
medical outcomes and patient satisfaction, quality and safety
of products, as well as data protection. As anti-corruption
and bribery are an integral part of the Compliance Manage-
ment System, Fresenius reports on the Code of Conduct, the
Compliance Organization, and the Compliance Management
Systems. A detailed list of the non-financial activity areas
identified as material can be found in the overview above.
There were no developments or events in the year under
review which require an adjustment of the activity areas and
the associated topics.
NON-FINANCIAL ACTIVITY AREAS AT FRESENIUS
Serving the well-being of the patient
Social matters
Doing the right thing
Anti-corruption and bribery
Being an attractive employer
Employee matters
Caring for human rights
Human rights
Protecting nature as the basis of life
Environmental matters
▶ �Quality of medical outcomes and patient satisfaction
▶ �Quality and safety of products
▶ �Data protection
▶ �Code of Conduct
▶ �Compliance Organization
▶ �Compliance Management Systems (Prevent, Detect, Respond)
▶ ��Personnel structure and diversity
▶ ��Attract talent, retain and develop employees
▶ ��Employee engagement and participation
▶ ��Profit-sharing scheme
▶ �Occupational health and safety
▶ �Water
▶ �Energy
▶ GHG emissions
▶ ��Waste
▶ ��Wastewater
▶ ��No exploitative nor illegal child or forced labor
▶ �Working conditions
▶ ��Non-discrimination
▶ ��Data protection

Non-F
inancial Report
Group Non-Financial Report96
The Corporate Sustainability Committee has an advisory and
steering role. It consists of senior representatives of all regions
and global functions who have been nominated so that regional
and functional interests are appropriately represented in the
company’s sustainability program.
The Corporate Sustainability Office has introduced a global
sustainability program in 2018 to further strengthen and har-
monize Fresenius Medical Care’s sustainability management
concepts.
NON-FINANCIAL RISKS
The Fresenius Group has not identified material risks related
to its own operations, business relationships, products, or
services that are very likely to have a material adverse effect on
the non-financial aspects or on the Group’s business opera-
tions. For a detailed overview of the Group’s risk management
please see pages 77 ff. of the Group Management Report.
SERVING THE WELL-BEING
OF THE PATIENT
At Fresenius, our aspiration is: better medicine for more
people. We commit ourselves to strive for the highest quality
in our products, services, and therapies. Our patients’ well-
being is the main non-financial aspect in the Fresenius Group
to measure our success. We achieve this through the medi-
cal quality of our treatments and services, product safety and
quality, as well as protection of personal data and patient
satisfaction.
QUALITY OF OUR PRODUCTS, SERVICES, AND THERAPIESWe place great importance on the high quality of our prod-
ucts, services, and therapies. The patients’ health depends on
it. All business segments make an overall contribution to
increasing the quality and efficiency of health care. This will
enable access to high-quality and affordable medical care
for a growing number of people.
It is important that every Fresenius employee ensures
that all applicable quality and safety regulations are consis-
tently adhered to in his or her area of responsibility. Our
employees in production plants, care centers, and clinics have
a special duty of care while working in the manufacturing
of products or providing medical services.
In our business segments, we focus on value-enhancing
processes oriented toward efficiency and the needs of our
customers. With our quality management, we aim to monitor
and manage them on the basis of performance indicators,
as well as to improve procedures.
The business segments adapt their quality management
systems to their respective business models, resulting in dif-
ferent approaches. We therefore present the specific require-
ments, management approaches, and results in separate
sub-sections for each business segment.
FRESENIUS MEDICAL CARE – QUALITY OF CARE
AND PATIENT SATISFACTION
Fresenius Medical Care is committed to providing exceptional
clinical care to its patients. To measure the quality of prod-
ucts and services, the company applies different frameworks
in clinics and production facilities. This section focuses on the
quality management system used in dialysis clinics. For infor-
mation on Fresenius Medical Care’s quality management sys-
tem at plant level, please refer to the section on “Customer
health and product safety”.
Fresenius Medical Care aims to improve patients’ quality
of life by offering them high-quality products and services.
For this reason, the company has set out clear and consistent
general principles regarding patient care for all members
of staff who interact with patients treated in the company’s own
dialysis centers. According to these principles, clinical care
must be consistent with national and international scientific
guidelines, Fresenius Medical Care’s policy, and the physi-
cian’s orders.
Among other things, Fresenius Medical Care expects all
staff to:
▶ act ethically, fairly, courteously, competently and timely,
when dealing with patients,
▶ treat all patients with dignity and respect,
▶ involve patients and families in treatment planning and
processes whenever appropriate,
▶ respond carefully and accurately to patients’ and families’
questions.

Non
-Fin
anci
al R
epor
t
97Group Non-Financial Report Our responsibility / Serving the well-being of the patient
Quality standards and guidelinesTo improve the quality of Fresenius Medical Care’s dialysis
care services, the company continuously measures and
assesses the quality of care at its dialysis clinics in all operat-
ing segments on the basis of generally recognized quality
standards and international guidelines 1, industry-specific clin-
ical benchmarks, and own quality targets. In each operating
segment, responsibility for this process lies with our Chief
Medical Officers (CMOs) and relevant specialist departments.
Together they develop and review internal quality policies,
standards, and guidelines based on the general standards and
international guidelines mentioned above. Fresenius Medical
Care’s specialists use various IT systems and algorithms in
line with local requirements to calculate, monitor, and review
key performance indicators (KPIs) relating to quality. In
addition, they use IT-supported systems and processes to
assess such data within the scope provided by the standards
and guidelines, aiming to continuously improve the quality
of patient care at Fresenius Medical Care.
Quality parametersAs a further indicator of Fresenius Medical Care’s culture
of quality improvement, the company implements and
monitors quality parameters so that the quality of care remains
on a consistently high level. As part of this approach, the
company regularly shares aggregated data on the quality
of care as well as financial results with executives in the indi-
vidual operating segments as well as with the Management
Board. In addition, Fresenius Medical Care publishes
selected results of its treatment analyses on a quarterly basis
to provide transparency on the quality of patient care and to
emphasize Fresenius Medical Care’s social responsibility
towards its patients. Fresenius Medical Care uses the follow-
ing global quality parameters for public reporting:
▶ Kt / V provides information about the effectiveness and
efficiency of dialysis. It is calculated by dividing the prod-
uct of urea clearance (K) and the duration of treatment
(dialysis time, t) by the volume of body space to be
cleaned of toxins (the urea distribution volume in the
patient, V).
1 Including “Kidney Disease: Improving Global Outcomes (KDIGO) foundation”, Kidney Disease Outcome Quality Initiative (KDOQI), European Renal Best Practice Guidelines (ERBP)
FRESENIUS MEDICAL CARE: QUALITY PARAMETERS BY OPERATING SEGMENT
Description Possible impact if too low
North America
Europe, Middle East,
Africa Latin America Asia-Pacific
2018 2017 2018 2017 2018 2017 2018 2017
Kt / V 1 ≥ 1.2
Effectiveness of dialysis: measures how well
the body is cleaned of uremic toxins
More days spent in hospital;
increased mortality 97% 97% 95% 95% 91% 93% 96% 96%
Hemoglobin 2, 3, 4 = 10 – 12 g / dl
Hemoglobin is respon-sible for transporting
oxygen around the body Indicator for anemia 72% 73% 83% 83% 53% 52% 58% 58%
Calcium 1 = 8.4 – 10.2 mg / dlAlbumin 5 ≥ 3.5 g / dlPhosphate 1, 6 ≤ 5.5 mg / dl
Measures the patient’s nutritional status and
mineral balanceMarker for increased
mortality
86%81%62%
85%79%63%
81%90%81%
80%88%81%
75%90%75%
77%90%76%
74%89%67%
75%88%70%
Patients without catheter(after 90 days) 7
Measures the number of patients with vascular access
More days spent in hospital 83% 83% 79% 80% 80% 81% 86% 88%
Days in hospital per patient year 8
Result of complications during dialysis
Restrictions in quality of life 10.2 10.7 7.5 7.7 4.2 4.1 3.3 3.8
1 KDOQI guidelines (Kidney Disease Outcomes Quality Initiative)2 KDIGO guidelines (Kidney Disease: Improving Global Outcomes)3 ERBP standard (European Renal Best Practice)4 EMEA data includes patients with Hb > 12 g / dl without erythropoiesis-stimulating agents (ESA)5 European Reference Material ERM ®-DA470k6 Phosphate specified as mg / dL of phosphorus7 Where we as the care provider are directly responsible, the proportion of patients with permanent vascular access serves as an indirect quality indicator8 Days spent in hospital over a 365-day dialysis treatment period per patient
Relating to the fourth quarter of the respective year

Non-F
inancial Report
Group Non-Financial Report98
▶ The hemoglobin value in patients’ blood should be kept
within a defined range. Hemoglobin is the component
of red blood cells that transports oxygen within the human
body. An insufficient level of hemoglobin in the blood
indicates anemia.
▶ Albumin, calcium, and phosphate levels in the blood are
indicative of a patient’s general nutritional status and
point to disorders in the mineral and bone metabolism of
patients with chronic kidney disease.
▶ Catheters are associated with a serious risk of infection
and an increase in the number of days spent in hospital.
In contrast, permanent vascular access is associated
with reduced risk and supports effective dialysis treatment.
Fresenius Medical Care records the number of patients
who do not use a catheter as vascular access for dialysis.
▶ The number of days patients are hospitalized is relevant
for determining the quality of care, because more days
spent in hospital significantly reduce the quality of life of
dialysis patients and are particularly cost-intensive for
health care systems.
In the reporting year, Fresenius Medical Care included the
quality parameters of 88% of its dialysis clinics worldwide
in its table of quality parameters by operating segment on
page 97.
Holistic dialysis care for patients worldwideFresenius Medical Care has identified a need for integrated
care for patients with advanced renal disease to optimize
care transition, develop cost-effective alternative therapies
and care structures, increase renal transplantation rates, and
reduce the costs associated with caring for patients. Based
on these considerations, the CMOs as well as other specialist
departments at Fresenius Medical Care and other dialysis
organizations have set up a global initiative to collaborate and
share their clinical expertise with the aim of aligning the
various definitions of clinical parameters used in quality man-
agement for end-stage renal disease. This group of experts
is also dedicated to improving care as well as outcomes for
dialysis patients worldwide. To this end, they analyze good
clinical practices, develop new guidelines, and promote their
distribution in the respective clinic networks.
Patient satisfactionPatient surveys are essential to measure, manage, and
improve the services and care Fresenius Medical Care offers
its patients. The company carries out patient surveys in
selected countries with the aim of collecting information on
the patients’ experience and finding out where further
improvements can be made and in which areas the company
should expand its services. The survey results are used to
identify process improvements and consequently to improve
patients’ quality of life and the care given to each individual
patient.
To improve local responsiveness, responsibility for the
patient surveys lies with each region. In the U.S. for example,
the state-run public health care authority, the Centers for
Medicare & Medicaid Services (CMS), determines the con-
tent of patient satisfaction surveys. The EMEA, Latin America,
and Asia-Pacific segments also conduct surveys to measure
and improve patient satisfaction. In EMEA and Latin Amer-
ica, the surveys are part of the quality management system. In
all three regions, the survey results are analyzed and dis-
cussed with central functions at country level to identify and
act upon strengths and weaknesses in the area of patient
care.
Patient support in emergency situationsFresenius Medical Care as a whole fulfills its social responsi-
bility in crisis situations or in the event of international disas-
ters. To continue providing patients with their vital dialysis
treatment even in extreme conditions such as severe storms
or floods, Fresenius Medical Care has established a system
of regionally organized emergency response teams. Their task
is to protect patients and employees in emergency situa-
tions and to give patients the best possible care, even under
extremely difficult conditions.
In addition to its disaster response activity, Fresenius
Medical Care donates funds, dialysis machines, and medical
supplies to organizations that urgently require help. In 2018,
the company’s response to the life-threatening conditions
caused by Hurricanes Michael and Florence in the United
Non
-Fin
anci
al R
epor
t
99Group Non-Financial Report Serving the well-being of the patient
States is a good example of Fresenius Medical Care’s social
responsibility and our strong commitment to patients. The
company’s Disaster Response Team prepared for the storm
well in advance and actively monitored its track so that the
company could continue caring for its patients as well as pro-
viding support and safety for the company’s employees.
Applying best practices from prior seasons, Fresenius Medical
Care made sure that all patients and staff were accounted for
after the storm and was happy to report only minor damages
to the facilities.
FRESENIUS MEDICAL CARE – CUSTOMER HEALTH
AND PRODUCT SAFETY
For Fresenius Medical Care, customer health and product
safety mean creating a safe and healthy clinical environment
to avoid potential harm caused by Fresenius Medical Care’s
products. The quality and safety of our products and services
are the foundation of the company’s business success.
Depending on the target market and the country of produc-
tion, Fresenius Medical Care is subject to different rules and
regulations. In the European Union, these include the Regis-
tration, Evaluation, Authorization and Restriction of Chemi-
cals (REACH), the Restriction of Hazardous Substances (RoHS)
legislation, and the Medical Device Directive 93 / 42 / EEC.
Furthermore, Fresenius Medical Care continuously strives to
meet the requirements of selected relevant standards, includ-
ing those of the Association for the Advancement of Medical
Instrumentation (AAMI), the International Organization for
Standardization (ISO), and the International Electrotechnical
Commission (IEC). To fulfill its commitment to customer
health and product safety while complying with the numer-
ous relevant regulatory requirements, Fresenius Medical
Care’s processes are embedded in comprehensive quality
management systems (QMS). These QMS enable all of the
company’s products and procedures to comply with quality
and safety standards from their development to market
approval, manufacturing, and use in clinics through to train-
ing customers and dealing with complaints.
Global Quality Policy and quality manualsTo allow the company to provide its products and processes
with a high quality, Fresenius Medical Care is committed to
adhering to its Global Quality Policy, which is a key compo-
nent of the QMS. The policy reflects Fresenius Medical Care’s
commitment to providing uncompromised product and ser-
vice quality, while maintaining compliance with relevant regu-
lations. By approving the Global Quality Policy, the heads of
the Global Research & Development (GRD) and Global Manu-
facturing & Quality (GMQ), who are also members of the
Management Board, confirmed their commitment to imple-
menting a harmonized quality management system and
maintaining its effectiveness.
Aside from quality policies, quality manuals are a vital
framework for describing Fresenius Medical Care’s quality
systems. For this reason, the North America segment has
developed a quality manual to satisfy applicable regulatory
requirements and internal policies and procedures. In 2018,
the GMQ and GRD functions in EMEA, Latin America, and
Asia-Pacific have also introduced a quality manual. This man-
ual identifies key policies and procedures, describes corporate
oversight responsibilities, and includes sub-system policies
according to ISO 13485 and ISO 9001 as well as other docu-
ments needed by the organization to allow effective process
planning, operation, and control.
Quality management systems and quality inspectionsQuality management systems and quality inspections play an
important role when it comes to the quality, safety, and efficacy
of medical and pharmaceutical products and supplies. It is
therefore of great importance to Fresenius Medical Care that
all plants have successfully passed the annual ISO 13485,
ISO 9001, or Good Manufacturing Practice (GMP) inspections
required for recertification.

Non-F
inancial Report
Group Non-Financial Report100
As regulatory requirements vary around the world, the QMS
are managed at a regional or local level. Responsibility
always lies with the Head of Quality of the corresponding
region. As part of this approach, local sites are subject to man-
agement reviews and regular internal quality audits per-
formed by personnel who are not directly involved in the pro-
cesses. Furthermore, the company’s manufacturing sites
in all regions undergo external audits by notified bodies and
authorities such as the U.S. Food and Drug Administration
(FDA) or the German Ministry of Health. Any cases of non-
conformance are forwarded to the respective department
to determine and implement appropriate corrective and pre-
ventive actions in due time.
As a result of this management concept, all of our sites
in North America are GMP-compliant and four out of eight
sites are certified according to ISO 13485. In EMEA, all sites
coordinated by GMQ are certified according to ISO 9001
and ISO 13485. In Asia-Pacific, three out of eight sites are
GMP-compliant. Furthermore, all plants that produce medical
devices or pharmaceuticals are certified in accordance with
ISO 9001 and / or ISO 13485. In Latin America, one plant is cer-
tified in accordance with ISO 13485. Furthermore, all pro-
duction sites are GMP-compliant and have the applicable cer-
tifications required by law to manufacture, import, distribute,
and export pharmaceutical products and medical devices.
Reporting adverse events and product complaintsPatient safety is given top priority at Fresenius Medical Care.
To continuously improve the quality and safety of its products
and services, the company reviews adverse events and ana-
lyzes product complaints. It uses this information to maxi-
mize safety in its facilities. Furthermore, Fresenius Medical
Care requires all staff involved in the relevant tasks to
understand, be familiar with, and follow Fresenius Medical
Care’s policies regarding the reporting of adverse events and
product complaints.
FRESENIUS KABI – QUALITY AND PRODUCT
SAFETY
Fresenius Kabi’s corporate philosophy “caring for life”
describes the company’s commitment to improving the qual-
ity of life of its patients. The quality and safety of its products
and services is of paramount importance to Fresenius Kabi.
The overarching goals of the quality management at
Fresenius Kabi are to ensure the well-being of patients, as well
as the quality and safety of products, services, and thera-
pies. In its quality management, Fresenius Kabi establishes
quality processes and standards and has defined the follow-
ing principles:
▶ clear assignment of responsibilities
▶ educated and well-trained employees
▶ monitoring of product and patient safety
▶ transparent and documented processes and procedures
▶ achieving full regulatory compliance
▶ continuous improvement
▶ maintaining an effective Quality Management System
The importance of quality management is reflected within the
organization of Fresenius Kabi. The global quality managers
report directly to the respective member of the Management
Board. The Management Board is thus directly responsible
for quality management.
Fresenius Kabi’s quality management system is organized
in accordance with the ISO 9001 standard and is binding for
all Fresenius Kabi organizations. Compliance with the standard
is certified by TÜV Süd in annual audits at the global level.
It also covers local sites through a matrix certification. More
than 115 Fresenius Kabi organizations are included in the
matrix certification process and are certified according to the
ISO 9001 standard. The quality management system also
covers applicable national and international regulations, includ-
ing Good Clinical Practice (GCP), Good Manufacturing Prac-
tice (GMP), Good Distribution Practice (GDP), the Code of
Federal Regulations (CFR) of the U.S. Food and Drug Adminis-
tration (FDA), as well as the ISO 13485 quality management
standard for medical devices.
In 2018, more than 90 audits and inspections were per-
formed at Fresenius Kabi by regulatory authorities or certi-
fying bodies, and more than 70 global internal audits were
carried out.
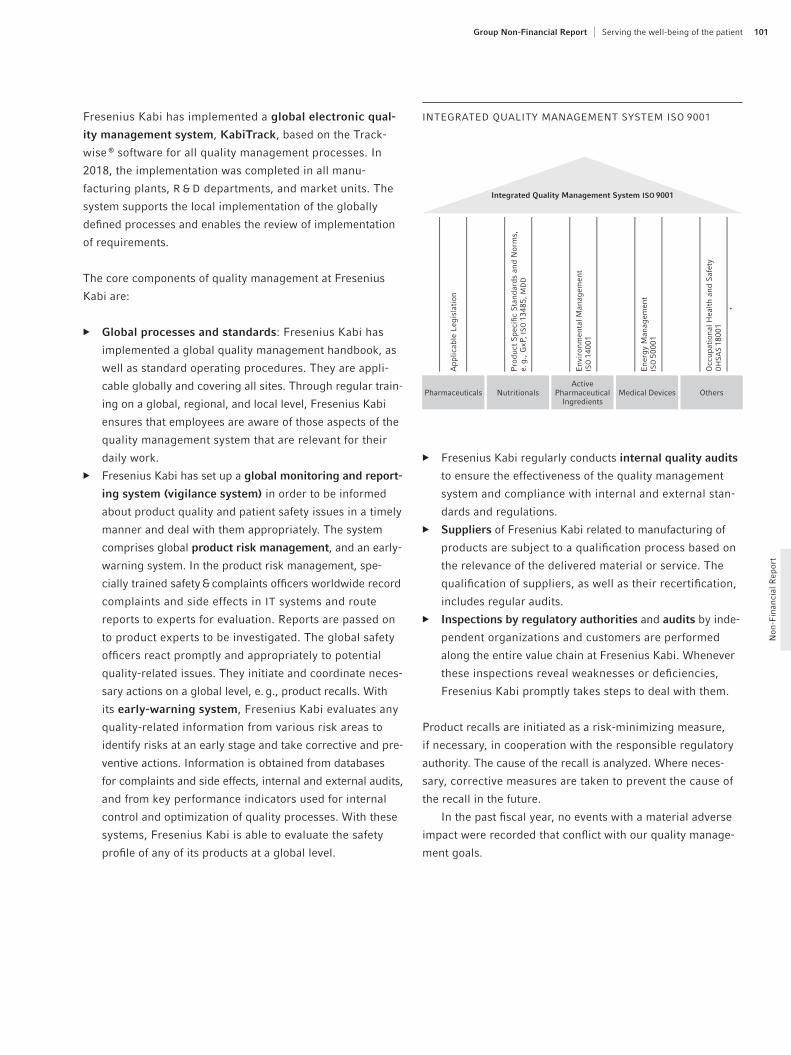
Non
-Fin
anci
al R
epor
t
101Group Non-Financial Report Serving the well-being of the patient
Fresenius Kabi has implemented a global electronic qual-
ity management system, KabiTrack, based on the Track-
wise ® software for all quality management processes. In
2018, the implementation was completed in all manu-
facturing plants, R & D departments, and market units. The
system supports the local implementation of the globally
defined processes and enables the review of implementation
of requirements.
The core components of quality management at Fresenius
Kabi are:
▶ Global processes and standards: Fresenius Kabi has
implemented a global quality management handbook, as
well as standard operating procedures. They are appli-
cable globally and covering all sites. Through regular train-
ing on a global, regional, and local level, Fresenius Kabi
ensures that employees are aware of those aspects of the
quality management system that are relevant for their
daily work.
▶ Fresenius Kabi has set up a global monitoring and report-
ing system (vigilance system) in order to be informed
about product quality and patient safety issues in a timely
manner and deal with them appropriately. The system
comprises global product risk management, and an early-
warning system. In the product risk management, spe-
cially trained safety & complaints officers worldwide record
complaints and side effects in IT systems and route
reports to experts for evaluation. Reports are passed on
to product experts to be investigated. The global safety
officers react promptly and appropriately to potential
quality-related issues. They initiate and coordinate neces-
sary actions on a global level, e. g., product recalls. With
its early-warning system, Fresenius Kabi evaluates any
quality-related information from various risk areas to
identify risks at an early stage and take corrective and pre-
ventive actions. Information is obtained from databases
for complaints and side effects, internal and external audits,
and from key performance indicators used for internal
control and optimization of quality processes. With these
systems, Fresenius Kabi is able to evaluate the safety
profile of any of its products at a global level.
▶ Fresenius Kabi regularly conducts internal quality audits
to ensure the effectiveness of the quality management
system and compliance with internal and external stan-
dards and regulations.
▶ Suppliers of Fresenius Kabi related to manufacturing of
products are subject to a qualification process based on
the relevance of the delivered material or service. The
qualification of suppliers, as well as their recertification,
includes regular audits.
▶ Inspections by regulatory authorities and audits by inde-
pendent organizations and customers are performed
along the entire value chain at Fresenius Kabi. Whenever
these inspections reveal weaknesses or deficiencies,
Fresenius Kabi promptly takes steps to deal with them.
Product recalls are initiated as a risk-minimizing measure,
if necessary, in cooperation with the responsible regulatory
authority. The cause of the recall is analyzed. Where neces-
sary, corrective measures are taken to prevent the cause of
the recall in the future.
In the past fiscal year, no events with a material adverse
impact were recorded that conflict with our quality manage-
ment goals.
INTEGRATED QUALITY MANAGEMENT SYSTEM ISO 9001
Pharmaceuticals NutritionalsActive
Pharmaceutical Ingredients
Medical Devices Others
App
licab
le L
egis
lati
on
Pro
duct
Spe
cific
Sta
ndar
ds a
nd N
orm
s,
e. g
., G
xP, I
SO
134
85, M
DD
Env
iron
men
tal M
anag
emen
t IS
O 1
4001
Ene
rgy
Man
agem
ent
ISO
500
01
Occ
upat
iona
l Hea
lth
and
Saf
ety
OH
SA
S 1
8001
Integrated Quality Management System ISO 9001

Non-F
inancial Report
Group Non-Financial Report102
Crisis managementIn 2018, Fresenius Kabi responded swiftly in crisis situations.
In the United States, employees who work at the Wilson
plant and our field-based staff in the region affected in the
Carolinas withstood tropical storm Florence without signifi-
cant personal damage or injury. In preparation for Florence,
the plant allowed employees to prepare their homes for the
storm and the facility was closed briefly after the company
had completed established hurricane preparedness and
safety procedures.
FRESENIUS HELIOS – QUALITY OF MEDICAL
OUTCOME, PATIENT SATISFACTION, AND PATIENT
SAFETY
Fresenius Helios places great importance on high standards
of treatment quality, hygiene, patient safety, and care in its
hospitals. With the acquisition of Quirónsalud (Helios Spain),
the company fosters mutual knowledge and best practice
sharing to expand competencies across borders: in medicine
and care, Fresenius Helios brings together colleagues in
specialist groups. Helios Germany’s quality management
and peer review approaches will be implemented at Helios
Spain. At Helios Germany, management would like to use
Helios Spain’s experience with regard to the close coopera-
tion between outpatient and inpatient care. More informa-
tion on the structure of the German and Spanish hospital
markets can be found on pages 51 f. of the Group Manage-
ment Report.
Helios Germany
Helios measures the quality of medical outcomes using key
indicators on the basis of G-IQIs (German Inpatient Quality
Indicators). These G-IQIs are not only used in the Helios hos-
pitals. In more than 450 German hospitals, different hospital
operators have implemented these key indicators. Clinically
relevant indications and surgical procedures are documented
with the help of more than 1,500 key figures derived from
routine administrative data. Helios Germany uses the latest
reference data from the German Federal Statistics Office to
benchmark its own performance. Helios Germany has defined
specific targets for 46 G-IQIs. These targets are set at a level
above the national average for Germany. In 2018, Helios Ger-
many achieved the targets for 41 quality indi cators, a success
rate of 89% (2017: 98%). For the five targets that the com-
pany did not meet, it will analyze all cases in the respective
hospitals and initiate corrective measures.
Head doctors and hospital managers receive monthly
reports on the medical quality of each department. Helios ana-
lyzes the cases – including treatments and medical routines –
in hospitals where target values were not achieved, to identify
improvement opportunities. The peer review is of great
importance in this process. In Germany, this review is a dis-
cussion between specially trained medical experts from
Helios and from the Initiative of Quality Medicine (IQM). They
question statistical abnormalities and systematically search
for improvements. Insights can be translated into concrete
recommendations for action in the hospital to increase patient
safety. In 2018, a total of 55 peer reviews were conducted in
our German hospitals.
Helios Germany is involved in the IQM to exchange ideas
and knowledge with other hospital operators. IQM members
are committed to observing three basic principles: quality
measurement with administrative data, publication of results,
and peer review processes. IQM members provide acute care
for approximately 7.7 million inpatients in more than 450 hos-
pitals in Germany and Switzerland. In Germany, their share
of acute care is 40%.
Helios Spain
The quality of clinical practice and patient safety are key for
Helios Spain. The quality management is aligned with the
Joint Commission International and European Foundation for
Quality Management (EFQM). Further, the quality standards
of the ISO norms help to ensure high quality levels. The first
hospitals were certified according to ISO 14001 in 2018. In
2019, further hospitals will be included in this certification.
Germany 2018 2017 2016
Key indicators, total > 1,500 > 1,500 > 1,500
G-IQI targets 46 45 46
Targets achieved 89% 98% 93%
Peer reviews 55 69 58
Further information can be found at: www.helios-gesundheit.de/unternehmen/was-wir-tun/medizin/qualitaet/qualitaetskennzahlen/
HELIOS QUALITY PERFORMANCE INDICATORS

Non
-Fin
anci
al R
epor
t
103Group Non-Financial Report Serving the well-being of the patient
In addition to the already existing ISO certifications, Helios
Spain has initiated the implementation of quality indicators
aligned to the G-IQI used by Helios Germany. Helios Spain
reached an agreement with Fundación IDIS (Instituto para el
Desarrollo e Integración para la Sanidad) to calculate the
G-IQIs based on Spanish medical routine data and make them
comparable using public reference statistical data. Further-
more, Helios Spain has conducted four peer reviews in the
reporting period.
For 2019, Helios Spain aims to increase the number of
G-IQIs for which targets will be set as well as the number
of peer reviews.
Hygiene management and patient safetyThe principal goal of hygiene management at Fresenius Helios
is to prevent the spread of infections by pathogens in a clinic.
At Helios Germany the Helios Group Hygiene Regula-
tion (Helios Konzernregelung Hygiene) is based on the recom-
mendations of the Robert Koch Institute and is binding for
all employees and clinics. Helios Germany conducts regular
training courses on hygiene management. In daily operations,
hygiene management is conducted locally by specially quali-
fied nurses and hospital hygienists. It differentiates between
nosocomial (i. e., acquired in the hospital) infections and
those brought from the outside by patients.
Further data on the most common pathogens 1 are pub-
lished in the Helios Germany publication Hygiene EinBlick
(Hygiene InSight) and on the Internet.
Complementing its quality management, Helios Germany
plans to further develop a system of indicators for patient
safety, which is already internally reported. Internationally
established indicators – Patient Safety Indicators (PSI) of the
U.S. Agency for Healthcare Research and Quality (AHRQ) –
will be combined with internal indicators. Helios has already
had very good experience with this: the quality indicators
of the AHRQ were used as international reference values in
the development of the G-IQIs.
In its hospitals, Helios Spain aims to achieve the following:
▶ to promote continuous hand hygiene to prevent infections
associated with care in health care facilities,
▶ to monitor perioperative antibiotic prophylaxis use to
prevent surgical site infections, and
▶ to enhance the implementation of good biosafety prac-
tices in the operating theater
In 2018, the Corporate Safety Committee of Helios Spain
approved the Patient Safety Strategy. The strategy is based
on the principles of international reference bodies in patient
safety such as WHO and Joint Commission International.
It includes the certification of hospitals according to the stan-
dards of the Spanish Association for Standardization (Aso-
ciación Española de Normalización – UNE). The first hospi-
tals have already been certified in accordance with the
standard UNE 179003 Health Services Risk Management for
Patient Safety. Further, Helios Spain aims to certify its hos-
pitals according to UNE standard 179006 System for surveil-
lance, prevention, and control of infections related to health
care in hospitals. The standards support the hospitals in their
daily work to prevent and control infections in health care
facilities.
Patient satisfaction At Helios Germany employees conduct weekly inpatient
interviews at the hospital sites and electronically and anony-
mously record the information. The surveys are evaluated
locally. Through the questionnaire, patients can ask for more
transparency on their treatment and request more support
throughout the daily hospital routine. The feedback also facil-
itates a more intense dialogue between the nurses and the
patients. Helios can measure how satisfied patients are with
treatment, care, and services in order to initiate improvement
processes without delay. The overall goal is to react to patients’
feedback within 24 hours.
For Helios Spain, the main causes of dissatisfaction among
patients are waiting times and lack of information. To moni-
tor this, Helios Spain implemented a “15 / 15” target in all hos-
pitals. A patient must get an appointment within 15 days,
and the waiting time before the appointment starts has to be
below 15 minutes. In emergency departments, 30 minutes
is the maximum waiting time.
1 The most relevant pathogens published are: MRSA (methicillin-resistant Staphylococcus aureus), VRE (vancomycin-resistant Enterococcus), and MRGN (multiresistant gram-negative rods).

Non-F
inancial Report
Group Non-Financial Report104
Handling of patient complaints is based on standard operating
procedures and monitored internally through an IT-based
management system. 48 hours after hospital attendance,
an e-mail is sent to patients asking if they would recommend
Helios Spain services or not, and the reasons. Unsatisfied
patients are specifically interviewed to gain a better under-
standing of the criticism they raised.
Helios is convinced that transparency creates the best
incentive for improvement. In addition, the results for medical
treatment quality, key indicators in the field of hygiene, and
results of patient surveys in Germany are published on the
website www.helios-gesundheit.de.
FRESENIUS VAMED – QUALITY MANAGEMENT AND
PATIENT SATISFACTION
Fresenius Vamed designs its quality processes based on
established standards such as ISO 9001, ISO 14001, and
ISO 13485, as well as the European Foundation for Quality
Management (EFQM) standards. In addition, Fresenius
Vamed has certified health care facilities according to the
Joint Commission International (JCI), ISO, or QMS Reha mod-
els. To ensure its quality standards, Fresenius Vamed uses
regular internal audits as well as external recertifications.
Fresenius Vamed uses performance indicators in the qual-
ity management system of its health care facilities. These
are exclusively used for the optimization of local and internal
processes.
Patient satisfaction Fresenius Vamed has implemented a continuous and struc-
tured process for patient satisfaction surveys in its health care
facilities. The company evaluates data internally and imple-
ments improvement measures in the respective facilities.
PROTECTING DATAAs a globally operating company, we process personal data
of our customers, business partners, employees, and patients.
We take responsibility for the careful handling of their data.
This has priority for Fresenius as a trusted partner. We con-
tinuously develop our data protection measures to fulfill
our responsibility towards our patients, employees, and other
partners.
Fresenius respects the right to informational self-deter-
mination and the privacy of all persons of whom we receive
data as part of our business. This includes processing of
personal data by third parties on our behalf. This commitment
is voiced in the Fresenius Code of Conduct.
To implement the requirements of the EU General Data
Protection Regulation (GDPR), effective since May 25, 2018,
we have improved our data protection management system
through a number of measures. We have strengthened our
data protection organization and continuously developed
our data protection management system. From a Fresenius
Group perspective, data protection is a focus risk area in
compliance. In this context, operational measures of data
protection management are the responsibility of the functional
departments. Basic measures, such as risk assessments or
monitoring, are supported by the Compliance Management
Systems.
The following sections describe the way data protection is
handled at Fresenius SE & Co. KGaA, Fresenius Kabi, Fresenius
Vamed, and Fresenius Helios. For information on Fresenius
Medical Care’s Global Privacy Program, Global Privacy Orga-
nization, and Privacy Organization Team, please refer to
pages 107 f.
ORGANIZATION
Fresenius SE & Co. KGaA and all business segments have
implemented data protection organizations based on their
corporate structure. These include appointed independent
data protection officers reporting to the respective company’s
management. The data protection organization supports the
management of the respective companies in complying with
and monitoring of applicable legal data protection require-
ments. Fresenius Netcare also maintains its own data protec-
tion organization in order to fulfill its particular responsibility
as a regular data processor for the business segments. All

Non
-Fin
anci
al R
epor
t
105Group Non-Financial Report Serving the well-being of the patient
data protection organizations have both advisory and moni-
toring functions, which complement each other in their
respective tasks.
The data protection officers are contact persons for national
and international supervisory authorities and are supported
by expert data protection advisors and coordinators who
are organized both centrally and locally, reflecting the com-
pany structure. In total, Fresenius employs more than 200
employees who are entrusted with data protection tasks.
Our goal is to establish comparable and effective data pro-
tection measures wherever we process personal data. For
this, data protection colleagues from all business segments
regularly exchange experience and best practices, e. g., within
Group Coordination Meetings and peer-to-peer reviews.
RISK ASSESSMENT
We regularly assess risks related to data protection and IT
security in every business segment and Fresenius SE & Co.
KGaA using standardized methods in a top-down approach.
We record data processing activities in all business seg-
ments and Fresenius SE & Co. KGaA in central tools and put
them under a data protection review, including a risk assess-
ment. For this purpose, we organize business processes in
such a way that data protection is integrated into the design
of new data processing activities as early as possible to carry
out assessments under data protection law. In this way, we
can implement the data protection principles and the neces-
sary technical and organizational measures included in the
processing to meet the requirements of the GDPR and mini-
mize potential risks. New or significantly changed IT systems
operated by Fresenius Netcare are subject to a standardized
review process in which implementation of data protection and
IT security requirements are reviewed.
DATA SUBJECT RIGHTS
We at Fresenius respect and protect the rights of all persons
from whom we collect or process data. This applies to employ-
ees, patients, and customers as well as to our business part-
ners. We process, collect, and store data only to the extent and
as long as it is appropriate and necessary for the respective
purpose. Likewise, we process the data collected only for the
lawful purposes specified in each case.
All business segments and Fresenius SE & Co. KGaA support
the rights of data subjects by appropriately informing data
subjects on their rights and responding to their requests in
a timely manner. We inform our employees on their rights
through appropriate privacy employee notices. In addition,
we have established an organization to protect data subject
rights according to the GDPR requirements.
In addition, we give data subjects, external and employ-
ees, an additional easy way to request information on their
data that is processed by us. Fresenius SE & Co. KGaA and
Fresenius Kabi have developed easily accessible technical
solutions for sending data subject requests to the companies.
The requests will be handled and answered centrally.
PATIENT DATA
The patient always comes first at Fresenius. This also and
especially applies to handling the data of our patients. We are
aware of our responsibility within the especially trusted rela-
tionship with our patients. Our patients expect adequate pro-
tection in handling of their data. This guides our procedures
in handling patient data.
We inform every patient of whom we take care and
thereby process data about their rights in an adequate man-
ner. We process data of our patients only after obtaining con-
sent or based on a legal basis and to the extent necessary.
A privacy impact assessment is conducted for processing
activities that involve processing of patient data. We protect
patient data by minimizing access to this data according to
the principles of minimum right to the responsibilities neces-
sary for processing.
INTERNATIONAL DATA TRANSFER
As a globally operating company, ensuring an appropriate
level of data protection in international data transfers as
defined by the GDPR is our priority.
All business segments and Fresenius SE & Co. KGaA trans-
fer data to third countries outside the European Union only
based on the adequacy decision of the European Commis-
sion, generally recognized certifications, or sufficient guaran-
tees. To do so, we conclude contracts with the data recipients.
These contain EU model clauses provided by the European
Commission.

Non-F
inancial Report
Group Non-Financial Report106
In addition, Fresenius SE & Co. KGaA and Fresenius Kabi
intend to submit Binding Corporate Rules (BCR) to the
respective data protection authorities for review and approval
and implement them subsequently. These will drive the har-
monization of the level of data protection in countries outside
the European Union.
Fresenius Helios processes personal data – especially
patient data – preferably within internal networks. If data is
processed in countries outside the European Union, the
contractor will be reviewed diligently and protection measures
will be implemented.
DATA PROTECTION & CYBERSECURITY
Fresenius takes responsibility for future-oriented health
care. This includes the use of information and communication
technologies. This requires us to act with special care when
handling the data of our patients, employees, customers, and
partners. We ensure this by continuously working to improve
our cybersecurity measures.
The data protection organizations of the Fresenius Group
are in close cooperation with the respective IT security
departments when carrying out the risk assessments. Based
on the risk analysis, the respective data protection and IT
security specialists develop and implement suitable measures
to further minimize the identified risks. These measures are
supplemented by data protection impact assessments and
resulting security measures for processing activities that are
likely to lead to a high risk for the rights of individuals.
We want to prevent loss of data and to ensure its confiden-
tiality, availability, and integrity. We thereby focus on all
areas within the Group, where cybersecurity risks can occur.
This includes the protection of IT within our clinics, produc-
tion sites, and medical devices against potential attacks.
All business segments and Fresenius SE & Co. KGaA col-
laborate in order to set a common cybersecurity baseline
for the Group. These standards are adopted, implemented,
and continuously monitored within the respective business
segments.
To minimize cybersecurity risks, such as tampering or
unauthorized access to critical information assets, we have
implemented security concepts. These include access con-
trols, perimeter security measures, and adequate protection
of Fresenius endpoints (e. g. desktop, server, mobile devices,
etc.). We carry out regular penetration tests for information
assets with sensitive data (for example, patient or employee
data). We maintain redundant systems for all critical systems,
e. g., communications infrastructure or clinical information
systems. A central Cybersecurity Dashboard acts as a platform
to monitor current and emerging threats to our information
assets. We introduce further automated response capabilities
to increase the efficiency when responding to cybersecurity
incidents.
Our own Cyber Emergency Response Team (CERT)
follow up on potential attacks against our information assets,
suspected violations, and inquiries from people who have
been affected by incidents or from the authorities. We take
all identified weaknesses or potential violations and new
developments as an opportunity to improve our internal pro-
cesses. If current developments require it, we take further
ad hoc measures to respond to cyber incidents in an effective
and timely manner.
In November 2017, the Management Board of Fresenius
SE & Co. KGaA approved a new global Cybersecurity Strategy.
Based on a cross-business-segment governance model, the
program’s intent is to identify cyber risks, establish common
and agreed upon security policies to shape the global secu-
rity baseline, and to monitor the global security level. Within
the CARE governance model, every business segment and
their respective regions are responsible for determining and
reporting on the effectiveness of proper risk mitigation strat-
egies based on their context, strategic objectives, and syner-
gies to already established security capabilities.
AWARENESS
Data protection is a shared effort of all employees of the
Fresenius Group. The foundation is the joint commitment of
all business segments and Fresenius SE & Co. KGaA toward
data protection, which is voiced in the codes of conduct.
All business segments and Fresenius SE & Co. KGaA have
created policies for protection and processing of personal data.
These support our employees to implement GDPR require-
ments and other relevant legal regulations within their respon-
sibility. Guidelines, principles, and operating procedures
complement the data protection policies.

Non
-Fin
anci
al R
epor
t
107Group Non-Financial Report Serving the well-being of the patient
In addition, we train employees on current requirements and
threats in relation to data protection and IT security. For
this, we offer a comprehensive range of e-learnings, classroom
training, and additional training to employees. Thereby, we
combine general training with targeted training measures for
specific employee groups. This ensures that employees
responsible for data processing activities are aware of current
legal and internal requirements.
New employees are informed about confidentiality in
handling sensitive data and bound to secrecy.
In addition, new employees of Fresenius Helios in Ger-
many need to undergo mandatory data protection training
within a defined time period. Every Helios entity needs to
prove training of their employees on data protection every
two years.
Fresenius Vamed conducts training on dealing with critical
incidents, which were recently focused on data protection.
AUDIT AND MONITORING
A number of governance functions regularly perform controls
with different focus areas to ensure compliance with data
protection regulations in all business segments.
As part of this, Internal Audit conducts independent audits
in all business segments and entities, also regarding relevant
aspects of data protection and IT security. These focus on
implementation of principles and procedures. In addition, there
are reviews in cooperation with the responsible data protec-
tion officer. All business segments and Fresenius SE & Co. KGaA
have defined respective audit concepts.
Furthermore, relevant data protection controls are part
of the different internal controls frameworks of the business
segments and reviewed by the responsible internal control
departments. We use insights and identified improvement
potential from audits and reviews to continuously improve
our data protection processes. In addition, the data protec-
tion officers of the business segments and Fresenius SE &
Co. KGaA review compliance with data protection principles
and regulations as an independent supervisory function.
The audit concept of Fresenius Helios foresees a regular audit,
minimum every one to two years, of every entity regarding
data protection and IT security.
All employees of the Fresenius Group have the opportunity
to report potential violations of data protection regulations or
internal guidelines via existing whistleblowing systems or
dedicated e-mail addresses. We take all reports on potential
violations as an opportunity to clarify the facts quickly and to
review and adjust our company processes where needed.
PROTECTION OF PATIENTS’ MEDICAL INFORMATION
AT FRESENIUS MEDICAL CARE
As a company in the health care sector, Fresenius Medical
Care is entrusted with sensitive personal data on patients’
treatment. Fresenius Medical Care uses this data to continu-
ously optimize the quality of care it provides and fulfill its
social responsibility towards the company’s patients.
Fresenius Medical Care takes data privacy and security
seriously and respects the privacy of all its stakeholders.
Fresenius Medical Care is committed to maintaining the trust of
its stakeholders and protecting patients’ medical information.
As the company highly values quality, honesty, and integrity,
it uses its best efforts to handle patient data with the expected
and appropriate care. This includes continuous attention and
dedication to the protection of personal data that we process.
Fresenius Medical Care aims to apply adequate and
global minimum privacy standards relating to the way we
handle patient data at Fresenius Medical Care, and its affili-
ates, subsidiaries, and majority-controlled joint ventures. As
legal requirements differ throughout the world, Fresenius
Medical Care has established the Global Privacy Foundation,
which specifies a consistent set of minimum requirements
so that personal data is used appropriately throughout its life
cycle. While the Global Privacy Foundation creates a base-
line requirement for all affiliates to comply with, Fresenius
Medical Care is also committed to adhering to applicable
local laws that may impose stricter standards.
Non-F
inancial Report
Group Non-Financial Report108
Fresenius Medical Care’s global privacy program is overseen
by its Management Board, which is informed on a bi-annual
basis of the program status and any privacy-related issues that
need to be addressed. Through the Global Head of Data Pro-
tection and Cybersecurity Laws, as well as the Global Pri-
vacy Team, the Fresenius Medical Care affiliates are guided
in order to meet their compliance with the global privacy
program. The Global Privacy Team maintains the Global Pri-
vacy Foundation by developing policies, procedures, and
guidelines, planning training and awareness programs, moni-
toring and reporting on compliance, collecting, investigating,
and resolving privacy inquiries, concerns, and complaints,
as well as determining and updating appropriate sanctions for
violations of these rules. Each Fresenius Medical Care affili-
ate is accountable for establishing and implementing at the
minimum the baseline global privacy program for its opera-
tions. They shall, as deemed appropriate, designate resources
qualified to serve in such capacity by virtue of their back-
ground, experience, education, and training.
In 2018, Fresenius Medical Care continued to further
develop its global privacy program with a focus on its General
Data Protection Regulation (GDPR) readiness program, so that
our systems, databases, and applications meet GDPR
requirements.
As expressed in the company’s Code of Ethics and Busi-
ness Conduct, Fresenius Medical Care is committed to protect-
ing the privacy of its patients and only uses information col-
lected in accordance with local data protection and privacy
rules. Furthermore, Fresenius Medical Care’s employees are
expected to promptly report lost, stolen, or damaged devices
owned by the company or containing company information.
To safeguard the confidentiality of sensitive patient informa-
tion, all relevant employees of Fresenius Medical Care with
access to patient data are instructed to never disclose per-
sonal information to any unauthorized persons, either inside
or outside the company, who do not have a legal right of
access to this information.
DOING THE RIGHT THING
For us, compliance means more than acting in accordance
with laws and regulations. Compliance means doing the right
thing. This means: we adhere to all rules, including legal
requirements, internal guidelines, our commitments, and ethi-
cal principles. Compliance is an integral part of our corporate
culture and our daily work. Our Fresenius Code of Conduct
defines the framework of our rules. All Fresenius business seg-
ments have implemented Codes of Conduct. They cover the
specifics of their businesses and reflect the values of the
Fresenius Code of Conduct. Underlying guidelines, instruc-
tions, and process descriptions complement and specify the
rules of the Code of Conduct. Our Compliance Management
Systems are designed to achieve the implementation of these
rules within the company.
We take even possible misconduct seriously. Any illegal
actions or violations of the rules may harm the individual and
Fresenius. We do not tolerate non-compliance. If a violation
of applicable regulations is detected, we will take the neces-
sary actions to remediate the violation and prevent any recur-
rence. We also take all reports as an opportunity to review our
company processes for possible improvements.
COMPLIANCE MANAGEMENT
COMPLIANCE ORGANIZATION
OrganizationEach of our business segments has appointed a Chief Compli-
ance Officer who oversees the development, implementation,
and monitoring of the Compliance Management System (CMS)
of the business segment. In line with the business structure
and organization, the business segments have established
compliance responsibilities at the respective organizational
levels. Within these structures, local management is responsi-
ble for compliance in the legal entities. Besides this, more
than 400 employees are working on compliance topics within
the Fresenius Group. They support management and employ-
ees in all compliance-related questions.

Non
-Fin
anci
al R
epor
t
109Group Non-Financial Report Serving the well-being of the patient / Doing the right thing
Corporate Compliance departmentThe Corporate Compliance department of Fresenius SE & Co.
KGaA supports the compliance functions of the business seg-
ments with standardized tools, processes, and methodologies.
To further develop the Group’s Compliance Management
Systems, Corporate Compliance develops global compliance
initiatives in consultation with the compliance functions of
the business segments. The Compliance departments on the
corporate level of the business segments develop further seg-
ment-specific global compliance initiatives and support the
responsible compliance colleagues in the regions and divi-
sions. In addition, the Corporate Compliance department of
Fresenius SE & Co. KGaA is responsible for developing, imple-
menting, and monitoring the CMS of Fresenius SE & Co. KGaA
and its corporate functions. The Corporate Compliance depart-
ment reports to the Chief Compliance Officer of Fresenius
SE & Co. KGaA – the member of the Management Board respon-
sible for Legal, Compliance, and Labor Relations.
Compliance Steering CommitteeThe Compliance Steering Committee (CSC) is the central
consultative committee at Fresenius SE & Co. KGaA for com-
pliance topics. It facilitates exchange with other relevant
governance functions. The committee consults on the devel-
opments of the Group’s CMS and important compliance ini-
tiatives, current key risk areas as well as compliance-relevant
topics of other governance functions, such as Internal Audit
planning and Internal Audit reports. In addition, participants
discuss severe cases of potential misconduct and remedia-
tion actions. The CSC comprises the following participants of
Fresenius SE & Co. KGaA: the Chief Compliance Officer, the
Chief Financial Officer, and the Heads of Legal, Internal Audit,
and the Corporate Compliance department. All business
segments provide the CSC with an annual update on their Com-
pliance Management Systems. CSC meetings are held every
six to eight weeks, minimum six times per year.
Supervisory BoardThe Supervisory Boards of Fresenius SE & Co. KGaA and the
general partner, Fresenius Management SE, are regularly
informed – at least once per year – about compliance within
the Group.
Conference and group exchangeTo ensure ethical conduct, we continuously review and ques-
tion current practices and try to learn from best practices. In
our annual Compliance Conference, the compliance functions
of the business segments regularly share their experience.
This dialogue enables us to learn from each other. In the
course of the year, the Compliance Conference is comple-
mented by telephone conferences every two months, and
regular jour fixes. In addition, subject matter experts of all
business segments work together on relevant topics in regu-
lar group exchanges.
COMPLIANCE MANAGEMENT SYSTEMS
We have implemented risk-based Compliance Management
Systems in all our business segments and at Fresenius SE &
Co. KGaA’s corporate level. They comprise three pillars: Pre-
vent, Detect, and Respond. Emphasis is placed on preventing
any acts of non-compliance before they occur. Such systems
consider the markets Fresenius is operating in. They are tai-
lored to the specific requirements of each business segment.
COMPLIANCE MANAGEMENT SYSTEMS (CMS)
▶� Risk Assessment
▶� �Code of Conduct, Policies and Procedures
��▶� Communication and Training
▶� �Continuous Advice
COMPLIANCE
D
etec
t
Respond
Prevent
▶ �Audits and Reviews
▶ �Internal Control Structures
▶ ��Reporting
▶ �Report Handling and Investigations
▶ �Remediation
▶ �Continuous Improvement

Non-F
inancial Report
Group Non-Financial Report110
PreventEssential measures for prevention include a thorough risk
assessment, adequate and effective policies and procedures,
regular training, and continuous advice.
Risk assessment
We assess compliance risks regularly using standardized meth-
odologies in each business segment and at Fresenius SE &
Co. KGaA. These risk assessments include up to 21 compliance
risk groups depending on the business structure and are con-
ducted in a top-down approach. Once per year, the compliance
functions of the business segments and Fresenius SE & Co.
KGaA share significant insights from the individual risk assess-
ments. Thereby, they identify relevant risk areas and material
changes that are relevant for the Group.
In 2018, Fresenius Kabi has implemented an integrated
risk management system. This system consolidates risk assess-
ment processes within the business segment in one tool using
a bottom-up approach and thereby enhancing risk analysis.
We use the experiences of Fresenius Kabi for successful imple-
mentation of the tool within the whole Group. Thereby, we
harmonize the risk assessment processes in one tool to achieve
development risk management by analyzing risks across all
reporting and risk areas.
Across all business segments, bribery and anti-corruption
is one of the focus risk areas. From a Fresenius Group per-
spective, antitrust, data protection, anti-money laundering,
foreign trade, and human rights are additional focus risk
areas.
Internal controls, policies and procedures
In all our business segments and at Fresenius SE & Co. KGaA,
the compliance functions support the management in estab-
lishing adequate internal controls to ensure compliant busi-
ness transactions in daily business. The internal controls are
described in compliance policies and procedures on business
segment and corporate level.
Training
We support our employees through regular classroom and
online training. Training covers the Codes of Conduct, com-
pany policies, or specific topics, such as anti-corruption,
antitrust, or data protection. Training has a high priority for
Fresenius. We plan and conduct training tailored to the rele-
vant employee groups based on their function and risk. Key
compliance training, such as the Fresenius Code of Conduct,
is mandatory. To foster a risk-conscious and value-based
company culture, we conduct targeted training for managers.
We conduct job-specific compliance training for high-risk
areas. In addition, we have processes in place to ensure that
all employees join relevant compliance training on a regular
basis. All compliance functions provide continuous advice to
employees in compliance-related questions.
Anti-corruption measures
All business segments have defined anti-corruption measures
as a central element of their Compliance Management Sys-
tems. The trust of our patients, business partners, and the
public must not be compromised by non-compliant conduct.
We do not tolerate any business that is initiated or carried out
in an unfair manner, and we strictly oppose corruption and
bribery. Our codes of conduct strictly prohibit every form of
influence through undue practices.
The following four principles help us to act with integrity
at Fresenius:
▶ We set appropriate remunerations: performance and
reward must be equivalent – for us as well as for third
parties.
▶ We document business arrangements transparently in
agreements.
▶ We strictly separate sales transactions and transfers of
value, received or granted: transfers of value must not be
related to a potential sales transaction through timing
or cause.
▶ We observe approval and disclosure requirements.
Non
-Fin
anci
al R
epor
t
111Group Non-Financial Report Doing the right thing
Cooperating with health care professionals and patient
organizations
We especially care for cooperating with health care profes-
sionals and organizations as well as patient organizations and
public customers in a transparent way. Therefore, we set
high standards for interaction with these partners, which we
have outlined in various guidelines in our business segments.
We are actively engaged in different organizations, such as
Medicines for Europe and MedTech Europe, aiming to contin-
uously enhance transparency in the health care sector and
commit ourselves to the corresponding codes and principles.
Furthermore, we disclose value transfers to health care pro-
fessionals and patient organizations in our business segments
according to applicable disclosure requirements.
Managing third-party risk
Our anti-corruption measures include selecting our partners
carefully and according to objective criteria. In all our busi-
ness segments and at Fresenius SE & Co. KGaA’s corporate
level, we have risk-based due diligence processes in place to
determine the risks related to our business partners. Based on
the risk profile of the business partner, we implement neces-
sary mitigation measures, such as contractual commitments,
to prevent corruption at the business partner and the right to
terminate the contract in case of breaches. If we detect poten-
tial misconduct on the part of our business partners, we will
react adequately, e. g., with additional control measures,
depending on the severity of the misconduct.
Acquisitions and investments
We also take compliance risks into account for acquisition
and investment decisions. For this, specific due diligence pro-
cedures are performed in all business segments to identify
potential compliance risks. The results are considered in the
decision making and relevant safeguards, such as compliance
representations and warranties in the contracts, are imple-
mented. After an acquisition, we integrate the new entity into
our Compliance Management Systems as soon as possible.
Antitrust
We have addressed the need for compliance with worldwide
antitrust regulations in a guideline for all business segments.
The guideline details principles of antitrust compliance and
important elements of the antitrust compliance program, such
as training, specific controls, and monitoring concepts. The
business segments have continuously worked to implement
the guideline and related measures taking into account local
regulatory requirements and the characteristics of their busi-
ness models in the past year.
Money laundering
In line with the risk profiles of our business segments, we have
established relevant measures to address money laundering
risks across the Fresenius Group, implementing requirements
of the anti-money laundering law for companies trading in
goods. This includes internal controls, such as prohibiting
certain cash transactions, as well as risk assessment and due
diligence processes for relevant transactions. Implemented
controls will be outlined in policies and trained respectively.
Foreign trade
We also deliver our life-saving products to countries that are
subject to trade restrictions. Thereby, we take special care
and aim to ensure that we comply with all currently applicable
legal requirements, including sanctions and export controls.
We have implemented risk-based measures in the relevant
business segments, such as monitoring processes and dedi-
cated IT system checks for deliveries that are subject to
export or import controls. Thereby, we aim to ensure compli-
ance with applicable sanctions and export control require-
ments, including for short-term legal changes.
Detect
Risk detection
Through objective indicators we try to detect potential compli-
ance risks early on. With the Compliance Cockpit, Fresenius
Kabi has a tool in place to give an overview on compliance-
relevant indicators of each legal entity. For this, it uses objec-
tive internal and external indicators. Fresenius Kabi reviews
the Compliance Cockpit of all entities annually and determines
required monitoring measures for entities with a higher risk
profile.

Non-F
inancial Report
Group Non-Financial Report112
Cash controls
For cash and bank transactions, we have implemented con-
trols such as the four-eyes principle, as well as complete mon-
itoring of cash payments above certain thresholds. Thereby,
we ensure that all financial transactions are based on a legiti-
mate purpose and are properly authorized and executed.
Automated procedures and analyses of the adherence to value
limits enable us to detect compliance risks early on.
Reviews
In addition, the Corporate Compliance functions of Fresenius
SE & Co. KGaA and Fresenius Kabi regularly perform functional
reviews of compliance initiatives in the form of workshops.
The compliance organization of Fresenius Kabi performed a
number of international workshops in 2018, also supported by
the Corporate Compliance Department of Fresenius SE &
Co. KGaA.
Helios Germany has introduced a compliance indicator,
measuring the implementation of relevant company guide-
lines through a self-assessment in all clinics. The compliance
indicator is used to plan further compliance measures, such
as the regular transparency review, in selected hospitals. In this
review, the adherence to the regulations in the transparency
guideline is tested on a sample basis.
Internal Audit
The Internal Audit departments of Fresenius perform inde-
pendent audits of the Compliance Management Systems by
auditing business segments and Group companies regard-
ing implementation of policies and procedures and the effec-
tiveness of the CMS. If the results of reviews or audits reveal
any potential for improvement, necessary actions are defined
in consultation with the responsible management. In 2018,
the Internal Audit departments performed multiple compli-
ance-related audits at Fresenius SE & Co. KGaA and in the busi-
ness segments across the world, also with particular focus on
data protection and IT security.
Reporting channels
If Fresenius employees are aware of potential misconduct,
e. g., non-compliance with laws, regulations, or internal policies,
they can contact their superior or the responsible compliance
function to report a potential compliance case. In addition,
they can report compliance cases anonymously, e. g., via
whistleblowing systems or dedicated e-mail addresses.
Most whistleblowing systems are open not only to employ-
ees, but also to third parties, such as customers, suppliers,
and other partners, via the corporate website.
Respond
Handling of potential compliance cases
We follow up on all reported or otherwise detected compli-
ance cases. To this end, we objectively assess all cases of
potential misconduct for their plausibility and potential sever-
ity first, in order to manage all potential misconduct consis-
tently, fairly, and comprehensively. The severity of the case
determines who is responsible for handling the case. If neces-
sary, an investigation is performed either by an internal
investigation team or with external support.
We take all reports as an opportunity to review our com-
pany processes for possible improvements. The implementa-
tion of measures is performed in a timely manner by the
responsible management in cooperation with the responsible
compliance function. Depending on the type and severity of
misconduct, potential sanctions, such as actions under employ-
ment, civil, and criminal law, can be imposed. After finishing
the investigation, we define and implement necessary reme-
diation measures that prevent or at least impede future mis-
conduct.
Continuous improvement
In addition, we analyze audit findings to identify and realize
additional improvement potential in our compliance mea-
sures. Our aim is the continuous improvement of the compli-
ance measures to fulfill our commitment to the highest quality
of our products and services, integrity in dealing with our
partners, responsible conduct, and reliability in our commu-
nication for the well-being of our patients in the future.
Further relevant information regarding legal and regula-
tory matters can be found on pages 225 ff. of the Notes.

Non
-Fin
anci
al R
epor
t
113
1 Data of Fresenius Medical Care based on country data representing 96% all employees. Prior year information was adjusted to reflect the increased scope and to conform to the current year's presentation. Fresenius Kabi’s data encompass employees globally. Data of Helios Germany in 2016 and 2017 inlcude the post-acute care business in Germany. Data of Fresenius Vamed also include temporary staff in 2017 and as of 2018 the German post-acute care business transferred from Fresenius Helios to Fresenius Vamed.
Group Non-Financial Report Doing the right thing / Being an attractive employer
BEING AN ATTRACTIVE EMPLOYER
The commitment of our more than 276,000 employees world-
wide is the basis for the success and sustained growth of
Fresenius. With their achievements and skills, our employees
are helping our businesses occupy leading positions in their
markets. We want to attract, retain, and develop talent at
Fresenius. That is why we offer them a variety of attractive
development opportunities. Furthermore, we promote inter-
national and interdisciplinary cooperation, as well as diversity
in the business areas and regions. In the Group Management
Board, the member of the Management Board responsible
for Legal and Compliance and Labor Relations is responsible
for all central employee matters.
Reporting on employee matters includes the key topics:
personnel structure and diversity, employee engagement,
profit-sharing schemes, how Fresenius attracts, retains, and
develops talents, as well as occupational health and safety.
The business models of our segments are adjusted to the indi-
vidual needs of the health care markets we operate in. There-
fore, we report on Group personnel concepts as well as on
specific measures within our business segments.
PERSONNEL STRUCTURE AND DIVERSITYAt the end of fiscal year 2018, the Fresenius Group employed
276,750 employees. That was 3,501 people or 1% more than
in the previous year (December 31, 2017: 273,249).
Our employee structure by function remained fairly
unchanged compared to the previous year’s figure. About
15% of our employees work in production while 70% are
engaged in service.
The proportion of female employees in the Fresenius
Group was again 68% as of December 31, 2018 (December 31,
2017: 68%). The number of women who participate in the
Group-wide Long Term Incentive Plan (LTIP 2018) is a good
indication for the women’s share in management positions
worldwide. The female quota among these approximately
1,400 top executives amounted to 30.3% as of December 31,
2018.
The average age 1 of an employee was 41.6 years in 2018
(2017: 41.5 years). The majority (55%) of our employees is
between the age of 30 and 50.
The length of service 1 within the Group may vary due to
acquisitions in the business segments. In 2018 it was 7.4 years
(2017: 8.2 years).
In 2018, the voluntary turnover rate 1 was 9.6% (2017:
9.9%). On page 120, we provide an overview of key personnel
structure and diversity figures per business segment.
Fresenius respects and promotes a culture of diversity.
We are convinced that the combination of different perspec-
tives, opinions, cultural impressions, experiences, and values
will enable us to exploit the potential that will make us suc-
cessful as a global company. The knowledge and social skills
of our employees of different ethnic, social, and religious
backgrounds support us in developing a high sensitivity for
local needs of our customers and patients. The Fresenius Code
of Conduct is the foundation of this company culture charac-
terized by collaboration and mutual respect. It is binding for
all Fresenius employees.
For further information on our diversity concept for the
Management Board and the Supervisory Board, please see
our Corporate Governance Declaration and Report on pages
137 ff. of our Annual Report.
ATTRACT TALENT, RETAIN AND DEVELOP EMPLOYEESThe ongoing globalization of our markets remains a challenge
for our human resources management. Since needs differ
in the various business segments, all employee development
concepts are formulated and implemented according to
specific market requirements and cultural differences. Our
human resources management focuses on three topics:
▶ Attract talent: To ensure that our long-term needs for
highly qualified employees are met, and to recruit new
employees, we make use of online personnel marketing,
regularly participate in recruiting events and careers fairs,
and organize our own recruiting events. Over recent
years, we significantly broadened our personnel market-
ing activities and expanded our global career website. In
fiscal year 2018, the market research institute Potential-
park named Fresenius as the best German company in the
category “Online appeal to applicants” for the seventh
consecutive year.

Non-F
inancial Report
Group Non-Financial Report114
▶ Retain employees: As an international health care Group,
our human resources management and accompanying
activities are designed for local needs, e. g., flexible work-
ing time models or incentive programs to participate in
the company’s success.
▶ Develop employees: We offer our employees the opportu-
nity to develop their career in an international, dynamic
environment. Our personnel management instruments are
continuously adjusted to meet future challenges. The
Group-wide binding trainings on our Code of Conduct are
accompanied by mandatory training in the business seg-
ments, e. g., in quality management, environmental man-
agement, or occupational health and safety management.
Further individual training courses for employees and
executives, as well as training relevant to the respective
departments, complement our personnel development
measures. Depending on the customer and market struc-
ture, our business segments place very different demands
on concepts and measures for personnel development.
The Fresenius Group devotes a lot of attention to vocational
training. We trained more than 4,150 young people in 53
different occupations at our German locations in 2018 and
also put more than 150 university students through 31 degree
programs in cooper ation with dual institutions of higher
learning. In order to meet the challenges of the digitization of
its work processes, Fresenius has further increased the num-
ber of training and study places it offers in IT and IT-related
professions. In 2018 we added dual courses of study in
Information Technology, specializing in Cybersecurity, as
well as in Electrical Engineering, specializing in Medical
Technology, and training programs as an electronics techni-
cian in Industrial Engineering as well as Automation Tech-
nology. Alongside the traditional channel of direct job entry,
Fresenius offers trainee programs for university graduates.
The Group-wide training catalog is available to all employees.
It includes, for example, programs for communication and
presentation, self-management, project management, and tar-
get-group-specific learning content.
In addition to the training catalog, Fresenius documents
training activities through the learning management system
Fresenius Learning Center (FLC). Those training activities
are conducted in cooperation with a business segment or a
department. Depending on the subject, these training pro-
grams may consist of one or more modules. Most training pro-
grams are provided as e-learning, as traditional web-based
training, but may also include webinars or classroom training
sessions. Employees in Germany who do not have access to a
company computer, or who do not have a quiet work environ-
ment, can carry out the necessary training at specially designed
learning places. Employees who have been enrolled into a
training module are required to start and successfully finish
the training within a defined period. Fresenius Medical Care,
Fresenius Kabi, and the Group departments of Fresenius SE &
Co. KGaA manage and document the majority of their e-learn-
ing programs in the FLC system from the headquarters in
Bad Homburg. Fresenius Helios and Fresenius Vamed offer
e-learning independently and document the training activities
in their own management systems. Group-wide compliance
training, for example on the Code of Conduct, is compulsory
for all employees and conducted on a regular basis. Further-
more, Fresenius conducts management-specific training for
high-risk compliance areas. Fresenius has implemented
control processes to ensure that all employees are trained on
topics relevant for their work on a regular basis. In 2018,
the focus was on compliance-specific training modules. The
training will continue in 2019. Further information can be
found in the compliance section, see page 110.
Fresenius has established two Group-wide programs for
executives. The Top Executive Program Maximizing Leader-
ship Impact in cooperation with the Harvard Business School
targets senior executives. The Executive Program with the
University of St. Gallen, Switzerland, focuses on strategy and
change management, and is designed for executives in mid-
dle and upper management.
FRESENIUS MEDICAL CARE
Lifelong learning and education as well as personal and pro-
fessional development are crucial elements of employee
motivation and prerequisites for a successful career. In addi-
tion, they are critical for giving the company a competitive
2018 2017 2016
Trainees 1 4,354 4,019 3,743
Training ratio 4.94 4.64 4.45
1 includes vocational training and university students
TRAINEES AND TRAINING RATIO FOR GERMANY

Non
-Fin
anci
al R
epor
t
115Group Non-Financial Report Being an attractive employer
edge. Fresenius Medical Care invests in its employees and
provides them with attractive development opportunities, tak-
ing their roles and individual strengths into consideration.
This is reflected in various local, regional, and global devel-
opment programs. For instance, in the reporting year, the
company developed and started to implement a global lead-
ership development program for the top 400 leaders, built
around specified leadership expectations. It also runs the
Clinical Advancement Program (CAP), a development program
designed specifically for state-registered nurses in the U.S,
and the new FAME program with a focus on providing manage-
ment essentials in the Asia-Pacific region. Another aspect
of this investment is the use of online training, which is avail-
able in all countries in which Fresenius Medical Care employs
staff.
To further boost its global talent management, the com-
pany continued to refine the process for regularly reviewing
leadership talent and succession planning and expanded its
scope, including a focus on female talent. The results support
managers and HR colleagues in recognizing and delivering
“best-fit” solutions in the future; they are the basis for identi-
fying, promoting, and developing future leaders at Fresenius
Medical Care.
FRESENIUS KABI
Fresenius Kabi has created global, regional, and local struc-
tures for the training and development of employees. All
employees are trained and qualified according to their func-
tions and / or tasks. All new employees receive mandatory
training on the Code of Conduct. Furthermore, data protec-
tion and information security training has been mandatory
for our employees since the end of 2018. In addition, our
employees in production receive obligatory training with
respect to good manufacturing practice, as well as occupa-
tional health and safety and environmental protection. In
2018, Fresenius Kabi documented training activities in more
than 50 countries in the FLC.
Management development at Fresenius Kabi aims to sup-
port the corporate strategy and to achieve the growth targets.
This is why Fresenius Kabi aims to identify talents, retain them
within the company, and develop them further. The develop-
ment of executives requires continuous learning and is focused
on the company values of Fresenius Kabi. The company sup-
ports the development of its executives with an annual talent
review, a dialogue on performance, competences, and devel-
opment potential. This talent review is the basis for identify-
ing, evaluating, and developing talents in all of Fresenius
Kabi’s regions, divisions, and central functions worldwide.
FRESENIUS HELIOS
Knowledge is one of the four strategic corporate goals of
Fresenius Helios: we want to share and increase our knowl-
edge. It directly influences the quality of medical services
and supports our ambition to present Fresenius Helios as an
attractive employer in the health care market. All employee
development programs support Fresenius Helios in reaching
its other three corporate strategic goals: patient benefit,
profitability, and growth. In 2018, recruitment of new person-
nel was a challenge in the hospital business. The company’s
focus was on attracting new employees and retaining those
we have.
In Germany, the Helios Academy and the Helios train-
ing centers offer extensive opportunities for competence-
oriented education and further education to all professional
groups in the hospitals. In 2018, a new training center was
opened in Berlin. Up to 300 employees will be trained there
for nursing care in the future. Helios is also increasing the
number of training places at its other nursing schools. Start-
ing in 2019, a comprehensive training program with the
focus on “patient-centered communication” is to be rolled out.
A multi-year program is planned with the aim of imparting
communication skills. A pilot project in our clinic in Erfurt
showed initial success.
Helios Germany supports young talents in medical care and
nursing care through a central talent management system.
We offer a special development program to leading executives
in the medical service. Thanks to its trainee programs and
management training, Helios Germany enjoys a reputation as
an attractive employer among university graduates.
Helios Spain has implemented a corporate talent plan
to develop its employees. This contains a talent pool for inter-
nal exchange and training activities. The company continues
to expand the training program, focusing specifically on
occupational health and safety, patient information, patient

Non-F
inancial Report
Group Non-Financial Report116
safety, and patient care improvements. In our hospitals we
have implemented a training program on the topic of “Dialogue
and Nursing” for doctors. In 2018, we focused on emergency
units and developed classes tailored to this area. More than
940 employees were trained.
FRESENIUS VAMED
One of Fresenius Vamed’s key success factors is the individ-
ual performance of its employees based on training, exper-
tise, and project experience. The focus is on the further devel-
opment of this success factor. Fresenius Vamed therefore
offers its employees tailored programs for professional train-
ing and development. Key to all personnel development pro-
grams is keeping employees updated with regard to health
care developments. The VAMED Human Capital Management
(HCM) program is a leadership and development program
for the identification of those with potential and their individ-
ual further development in order to be able to take on man-
agement and performance functions in the future.
Fresenius Vamed is also dedicated to the qualification
and training of young employees through its various trainee
programs. The trainee programs offer young employees with
above-average development potential the opportunity to
acquire comprehensive specialist know-how and profes-
sional experience for a particular job profile. In addition, all
employees are entitled to participate in courses and training
offered by the VAMED Academy. Besides specialist topics,
training is offered for self-development, leadership, and social
and methodological competence. Various knowledge plat-
forms, such as the International Medical Board (IMB), bundle
the know-how of more than 1,200 health care professionals
who work for Fresenius Vamed.
EMPLOYEE ENGAGEMENT AND PARTICIPATION
EXCHANGE WITH EMPLOYEE REPRESENTATIVES
Fresenius acts responsibly towards its employees. This
includes the voluntary commitment to comply with interna-
tional labor and social standards, which are contained in
our Code of Conduct and in the Human Rights Statement. For
more information, see pages 125 ff.
Employees engage in dialogue with their supervisors, but can
also contact their human resources or compliance officers,
as well as the works council, their union representatives, or
other employee representatives. In Europe, more than 70%
of our employees are covered by a collective bargaining
agreement 1.
In European countries, workplace representations of inter-
ests are organized according to national law. When dealing
with local employee representatives and trade unions, the main
responsibility lies with the divisions at the country or site
level. The focus of our discussions is on local and regional
conditions. Together with the employee representatives we
want to find tailor-made solutions for the different challenges
for each location.
DIALOGUE AT EUROPEAN LEVEL
Fresenius SE & Co. KGaA has a European Works Council (EWC)
consisting of 22 employee representatives as of December 31,
2018. They come from the member states of the EU and the
EEA (European Economic Area) in which Fresenius employs
workers.
The EWC is responsible for the participation of Fresenius
employees in cross-border actions, insofar as they have a
significant impact on the interests of Fresenius workers and
cover at least two countries within its area of responsibility,
such as relocation or closure of companies or collective redun-
dancies. The management informs and consults the EWC,
for example, about the structure and the economic and finan-
cial situation of the Group and its expected development,
employment situation, investments, organizational changes,
and introduction of new work and production processes.
The EWC meets once, its executive committee three times
a year. The European trade union federations IndustriAll and
European Public Services Union attend the meetings at the
invitation of the EWC. The main areas of discussion of the EWC
in the reporting period were the integration of Quirónsalud,
digital transformation projects in the Group, and the EU Gen-
eral Data Protection Regulation. The EWC elects six employee
representatives to the supervisory board of Fresenius SE &
Co. KGaA, including at least one representative from trade
unions.
1 Number of employees covered by collective agreements or other collective agreements with unions or comparable social partners in total. This does not include agreements with works councils or other local representatives.

Non
-Fin
anci
al R
epor
t
117Group Non-Financial Report Being an attractive employer
The trusting cooperation between company management and
employee representatives is an established practice at
Fresenius.
PROFIT-SHARING SCHEME AND
STOCK OPTION PLAN
For many years, Fresenius has paid a stock-based profit-
sharing bonus, which is distributed when the Fresenius
Group’s EBIT and earnings targets defined in the program
have been achieved. The table above shows the develop ment
in the profit-sharing bonus over the last several years. In
2018, the Group targets for this program were not achieved.
The share-based Long Term Incentive Plan 2018 (LTIP
2018) is a global compensation instrument linking manage-
ment’s entrepreneurial responsibility to future opportunities
and risks. For additional information, please see pages 251 ff.
of the Notes.
Fresenius Medical Care has its own share-based compen-
sation plans.
OCCUPATIONAL HEALTH AND SAFETYEnsuring the health and safety of our employees is part of our
corporate responsibility. The Fresenius Code of Conduct
bindingly stipulates that all necessary measures for employee
safety are taken to prevent work-related incidents. All busi-
ness segments focus on preventive measures in the field of
occupational health and safety and on the individual respon-
sibility of the employees. The safety concepts are adapted to
the business models of the four business segments and cover
production-related occupational health and safety as well as
corporate health initiatives for employees in health care facil-
ities and administration. We aim to secure the occupational
safety of our employees, as well as the safety of our patients.
All Fresenius business segments record data on occupational
health and safety in line with regulatory provisions. Those
which are consolidated at the business segment level are
published in the following section.
FRESENIUS MEDICAL CARE
The company aims to foster a culture of continuous improve-
ment in the work environment with the goal of minimizing
injuries and reducing incident rates. This includes:
▶ reporting and analyzing work-related accidents and
injuries,
▶ identifying their root causes,
▶ implementing corrective action as appropriate.
As part of this concept, Fresenius Medical Care has intro-
duced KPIs for occupational health and safety to production
sites and dialysis clinics to provide information, as required
by governmental authorities. To further strengthen and har-
monize management concepts and KPIs in this context,
Fresenius Medical Care launched an occupational health and
safety initiative in 2018 as part of our global sustainability
program.
At Fresenius Medical Care, the topic of occupational health
and safety is managed locally, allowing the company to meet
local and regional legislative requirements. In many countries,
medical facilities are obliged to fulfill country-specific occu-
pational health and safety requirements to achieve certification.
In North America, operational activities related to occupa-
tional health and safety are monitored and evaluated by a
specialized department. This function also assesses external
regulatory and legal requirements and incorporates them
into our internal policies and guidelines together with regional
and local management.
Every year, Fresenius Medical Care’s production sites
and laboratories in the U.S. are put through a formal program
to monitor environmental protection and occupational
safety standards. Audits are carried out to check compliance
with the regulations of the U.S. Occupational Safety & Health
Administration, the Department of Transportation, and the
PROFIT-SHARING BONUS
2017 2016 2015
Profit-sharing bonus 1 in € 2,200 2,200 2,200
Eligible employees 6,228 6,130 5,934
Total of profit-sharing bonus 1 payment, € in millions 12.5 12.2 11.9
1 The profit participation is paid retroactively for the respective fiscal year. It forms part of the compensation in some German Group companies.
Non-F
inancial Report
Group Non-Financial Report118
Environmental Protection Agency, as well as state and local
statutes. In the EMEA region, we have established an Environ-
mental Health & Safety (EHS) Basic System that focuses on
compliance and risk control in connection with environmental
and employee matters. The EHS Basic System applies to all
operational units within the Integrated Management System
(IMS) that have a certified quality management system in
place. Aside from the EHS Basic System, all operational
units in EMEA are required to file an annual declaration of
responsible management confirming their compliance with
environmental and occupational health and safety regulations
(Declaration of EHS Compliance). Fresenius Medical Care’s
occupational health and safety procedures in the EMEA region
are bundled in a central management system for occupa-
tional health and safety based on the British Standards for
Occupational Health and Safety Assessment Series 18001
(BS OHSAS 18001), which is incorporated into the company’s
IMS. As a result, Fresenius Medical Care conducts internal
reviews and audits as part of its regional QMS to monitor com-
pliance with occupational health and safety policies and
procedures in the dialysis care business.
In Latin America, the company has established occupa-
tional health and safety management systems under local
responsibility. In the GMQ-managed production sites, dedicated
functions like work safety officers or EHS officers are respon-
sible for introducing OHS guidelines, policies, and procedures
in accordance with local regulations. These functions record
and report work-related injuries to local authorities, the local
OHS committee, or local management. The dialysis care busi-
ness in Latin America has introduced OHS guidelines, policies,
or procedures in accordance with local regulations. All of
these sites are subject to regular internal reviews as well as
external audits from government agencies or national regu-
latory bodies.
In Asia-Pacific, occupational health and safety manage-
ment in production sites is under local responsibility. All pro-
duction sites have dedicated personnel including OHS Com-
mittees, and HR or EHS departments responsible for overseeing
the application of OHS laws and regulations. As part of this
management approach, the production sites have established
OHS guidelines, policies, or procedures in accordance with
the applicable local regulations. In the provider business, the
clinical quality team has introduced a risk management sys-
tem that covers occupational health and safety aspects. This
includes infection prevention and control, medication man-
agement, and the safe use of sharps and disposables, as well
as other clinical quality tools. Fresenius Medical Care pro-
vides a clinical framework including guidelines, standards,
operating procedures, and policies. To monitor compliance
with the clinical framework as well as country, state, and fed-
eral legislation, we regularly perform internal clinical quality
audits.
FRESENIUS KABI
Fresenius Kabi has implemented binding occupational health
and safety guidelines. The guidelines on occupational
health and safety focus on the following principles:
▶� Avoidance of work-related injuries, illnesses, and other
incidents
▶ Performing hazard and risk assessments for all routine
and non-routine activities
▶ Compliance with applicable legal requirements and other
occupational health and safety requirements
▶ Avoiding unsafe activities
▶ Provision and continuous safe operation of facilities,
machinery, and equipment
▶ Safe handling, use, storage, and proper disposal of haz-
ardous substances
The aim is to avoid all work-related accidents. To achieve
this goal, standard operating procedures (SOPs) and standard
process guidelines were implemented to provide a global
framework for occupational health and safety. In addition,
Fresenius Kabi uses a management system for occupational
health and safety in accordance with the international stan-
dard OHSAS 18001. This management system will be rolled
out globally. Fresenius Kabi aims to improve occupational
health and safety processes and control mechanisms at all loca-
tions to align them with internationally recognized standards.
The employees at Fresenius Kabi’s Global Work and
Environmental Safety department analyze and evaluate work-
ing procedures, risks, and processes and enable the exchange

Non
-Fin
anci
al R
epor
t
119Group Non-Financial Report Being an attractive employer
of best practices within the business segment. Fresenius Kabi
performs internal audits at its locations to identify potential for
improvement. To exploit this potential, measures are defined
together with local employees responsible for occupational
health and safety. Fresenius Kabi documents all occupational
health and safety incidents and accidents that lead to lost work-
ing time for its employees or temporary workers worldwide.
Reported cases are categorized according to their severity and
might lead to technical improvements, further training, or,
in some cases, the adjustment of the existing standard operat-
ing procedures, to avoid future work-related incidents and
improve occupational health and safety of employees.
All recorded incidents are transferred into the key per-
formance indicator LTIFR (Lost Time Injury Frequency Rate)
to evaluate the occupational health and safety. This KPI
improved in 2018, compared to the previous year’s figure.
Further, in 2018, no work-related fatalities or severe acci-
dents were recorded at Fresenius Kabi.
FRESENIUS HELIOS
Helios Germany is subject to various laws and regulations
regarding occupational health and safety. Throughout 2018,
the health and safety indicator (GSI) developed by the com-
pany has made a contribution to identifying and exploiting
the status quo and potential for improvement in occupational
health and safety. The department for employee health and
safety held responsibility for occupational health and safety
at Helios Germany. As Helios Germany wants this issue to
carry more weight beyond the company itself, this internal
area was merged into the new AMAGS division (Occupational
Medicine, Employee Health and Safety – Arbeitsmedizin,
Mitarbeitergesundheit und Sicherheit ). In the future, AMAGS
will also be a provider of occupational health and safety ser-
vices outside the German Helios hospitals and will continue
to develop these areas.
Irrespective of this, Helios Germany works internally with
time management reports, which focus on trends in absen-
teeism. If Helios Germany identifies weak points in its own
hospitals, measures are taken and programs are offered, for
example to promote occupational health or for occupational
integration management. Helios Germany is developing addi-
tional online training courses and will roll them out throughout
the company in order to strengthen its expertise in the area
of occupational health and safety.
Helios Spain strives to develop a role-model culture of
prevention within the health care sector focused on caring for
health, preventing occupational health risks, and promoting
healthy habits among its employees. Helios Spain unified the
joint OHS service of its private hospitals and companies and
developed a corporate training platform for specific, work-
place-related risks to train employees.
FRESENIUS VAMED
The management of the local entities of Fresenius Vamed is
responsible for the implementation of occu pational health
and safety measures and procedures, in compliance with the
applicable laws and regulations. Occupational health and
safety is a corporate res ponsibility of Fresenius Vamed and
included in its corporate culture and the vision statement of
the company.
All locations are subject to regular occupational health
and safety inspections. Furthermore, the employees of
Fresenius Vamed are provided with occupational medical
care and a related offer of checkups.
Fresenius Vamed offers all employees a wide range of
health promotion offers through its occupational health
management.

Non-F
inancial Report
Group Non-Financial Report120
2018 2017 2016
as of Dec. 31 Below 30Between
30 and 50 Above 50 Below 30Between
30 and 50 Above 50 Below 30Between
30 and 50 Above 50
Fresenius Medical Care 17% 56% 27% 18% 56% 26% n. a. n. a. n. a.
Fresenius Kabi 23% 60% 17% 25% 59% 16% 24% 60% 16%
Helios Germany 18% 49% 33% 19% 49% 32% 19% 50% 32%
Helios Spain 19% 61% 20% n. a. n. a. n. a. n. a. n. a. n. a.
Fresenius Vamed 15% 50% 35% 18% 54% 28% 18% 54% 29%
Corporate / Other 25% 54% 21% 24% 55% 21% 23% 57% 20%
Total 18% 55% 26% 19% 55% 26% 20% 53% 27%
AGE STRUCTURE 1
2018 2017 2016
Fresenius Medical Care 112,658 114,000 109,319
Fresenius Kabi 36,423 34,923 33,476
Helios Germany 1 51,429 57,719 56,596
Helios Spain (Quirónsalud) 31,094 27,858 n. a.
Fresenius Vamed 13,665 7,215 6,909
Corporate / Other 1,060 969 889
Total (FTE) as of Dec. 31 246,329 242,684 207,189
1 Number of employees converted to the full collectively agreed working time on monthly average (Vollkräfte)
EMPLOYEES (FTE) BY BUSINESS SEGMENT
EMPLOYEES BY FUNCTION
2018 2017 2016
Europe 158,939 154,172 119,434
thereof Germany 88,086 86,613 84,165
Europe excl. Germany 70,853 67,559 35,269
North America 72,672 75,083 72,803
Asia-Pacific 25,575 24,381 22,441
Latin America 17,610 17,709 16,283
Africa 1,954 1,904 1,912
Total as of Dec. 31 276,750 273,249 232,873
as of Dec. 31 2018 2017 2016
Production 41,100 40,189 38,069
Service 194,868 194,117 161,495
Administration 26,112 25,015 19,955
Sales and marketing 11,628 11,156 10,584
Research and development 3,042 2,772 2,770
EMPLOYEES (HEADCOUNT) BY REGION
FEMALE EMPLOYEES IN THE BUSINESS SEGMENTS
as of Dec. 31 2018 2017 2016
Fresenius Medical Care 69% 69% 69%
Fresenius Kabi 50% 51% 51%
Fresenius Helios 75% 76% 76%
Fresenius Vamed 64% 56% 56%
Corporate / Other 39% 39% 39%
AVERAGE AGE 1
2018 2017 2016
Fresenius Medical Care 42.1 41.7 n. a.
Fresenius Kabi 38.4 38.5 38.7
Helios Germany 42.6 42.7 42.6
Helios Spain 40.0 n. a. n. a.
Fresenius Vamed 43.6 43.0 43.5
Corporate / Other 38.9 39.2 39.2
Total 41.6 41.5 41.5
AVERAGE LENGTH OF SERVICE 1
in years 2018 2017 2016
Fresenius Medical Care 7.4 7.0 n. a.
Fresenius Kabi 7.5 7.4 7.6
Helios Germany 10.8 10.5 10.8
Helios Spain 8.2 n. a. n. a.
Fresenius Vamed 7.8 6.1 6.0
Corporate / Other 7.3 7.6 7.6
Total 7.4 8.1 8.4
in % 2018 2017 2016
Fresenius Medical Care 12.9 12.2 n. a.
Fresenius Kabi 9.4 11.3 10.7
Helios Germany 6.9 6.0 5.3
Helios Spain 3.8 n. a. n. a.
Fresenius Vamed 9.5 8.0 n. a.
Corporate / Other 3.8 2.7 2.5
Total 9.6 9.9 10.4
Calculated as the number of employees who left the organization voluntarily in relation to the number of employees at the end of the year.
VOLUNTARY TURNOVER RATE 1
1 Data of Fresenius Medical Care based on country data representing 96% all employees. Prior year information was adjusted to reflect the increased scope and to conform to the current year's presentation. Fresenius Kabi’s data encompass employees globally. Data of Helios Germany in 2016 and 2017 inlcude the post-acute care business in Germany. Data of Fresenius Vamed also include temporary staff in 2017 and as of 2018 the German post-acute care business transferred from Fresenius Helios to Fresenius Vamed.

Non
-Fin
anci
al R
epor
t
121Group Non-Financial Report Being an attractive employer / Protecting nature as the basis for life
PROTECTING NATURE
AS THE BASIS OF LIFE
Fresenius is committed to protecting nature as the basis of life
and using its resources responsibly. We comply with legal
requirements and aim to improve the safety of our plants and
our performance in the areas of environmental protection,
product responsibility, and logistics. The four Fresenius busi-
ness segments manage environmental matters differently to
meet their individual business requirements. Therefore, we
present the corresponding environmental management
approaches separately for each business segment.
Fresenius Medical Care, Fresenius Kabi, and Fresenius
Vamed use the ISO 14001 standard as the basis for their
environmental management and have locations certified
according to this standard. Furthermore, they have certified
locations according to the energy management standard
ISO 50001.
Energy consumption, water consumption, and green-
house gas emissions (GHG) data are collected in all business
segments. To comply with the interests of external stake-
holders, we have been reporting key figures 1 since 2017.
External stakeholders, such as investors and environmental
associations, frequently inquire about information on waste
and effluents for the Group. Therefore, we also include infor-
mation on these topics.
Water is an important resource for all of the four Fresenius
business segments. Fresenius operates in highly regulated
markets with regard to hygiene, sterility, and product qual-
ity. Water used in our health care facilities and production
sites has to meet regulatory requirements. To safeguard our
patients’ and employees’ health, we have to ensure that ade-
quate management and control systems are in place.
Water management and water treatment is coordinated
and controlled locally within the Fresenius Group. The busi-
ness segments have to ensure compliance with all applicable
laws and regulations. In fiscal year 2018, Fresenius 1 con-
sumed a total of approximately 56 million m³ of water. The
same applies to wastewater: the business segments are
expected to treat wastewater from production or health care
facilities in compliance with local laws and regulations
and implement relevant management provisions, if necessary.
FRESENIUS GROUP 1 WATER CONSUMPTION
m3 in millions 2018 2017 2016
Fresenius Medical Care 41.8 n. a. n. a.
Fresenius Kabi 9.7 9.8 9.8
Fresenius Helios 3.7 3.2 3.0
Fresenius Vamed 0.7 0.3 0.3
Total 55.9 n. a. n. a.
Production processes and patient treatments in hospitals or
other health care facilities require a high amount of energy.
The structural condition of health care facilities also influences
energy consumption. Fresenius continuously invests in envi-
ronmental protection through structural measures, such as
new construction projects and modernizations in line with the
latest standards of efficient heat insulation and applicable
energy savings regulations. In fiscal year 2018, Fresenius 1
consumed a total of approximately 5.3 million MWh of energy.
As with water consumption, our patients’ well-being and
product safety are the focus of energy management. Safe and
uninterruptible power supply is therefore a top priority.
Measures for saving energy are always considered with the
utmost care. We continually optimize our energy procurement
and generate energy ourselves at numerous locations. This
makes us independent and shall secure the energy supply in
the long term.
FRESENIUS GROUP 1 ENERGY CONSUMPTION
MWh in millions 2018 2017 2016
Fresenius Medical Care 2.35 n. a. n. a.
Fresenius Kabi 1.65 1.57 1.49
Fresenius Helios 1.14 0.95 0.96
Fresenius Vamed 0.16 0.05 0.05
Total 5.30 n. a. n. a.
In fiscal year 2018, Fresenius 1 caused a total of 1,523
thousand t CO2 equivalents.
1 Fresenius Medical Care figures include data on energy and water consumption provided by GMQ-coordinated manufacturing sites as well as data on electricity and water consumption from dialysis centers. Greenhouse gases are calculated based on energy data. Due to the timing of this publication and the availability of data sources such as energy or water bills, the company has performed a limited amount of extrapolations to complete this reporting year’s dataset. The data from Fresenius Helios contain all company-owned hospitals in Germany and Spain. Fresenius Kabi’s data include all facilities worldwide. Fresenius Vamed’s data include all fully consolidated health care facilities, and as of 2018 the German post-acute care busi-ness transferred from Fresenius Helios to Fresenius Vamed.
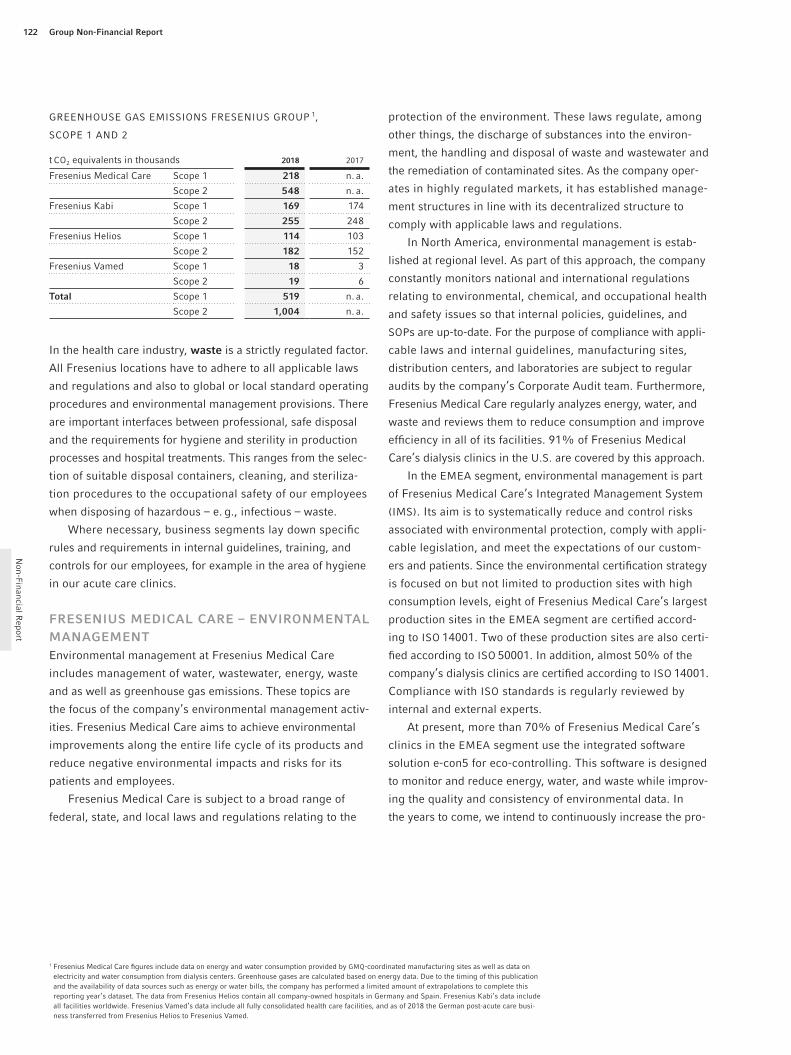
Non-F
inancial Report
Group Non-Financial Report122
GREENHOUSE GAS EMISSIONS FRESENIUS GROUP 1,
SCOPE 1 AND 2
t CO2 equivalents in thousands 2018 2017
Fresenius Medical Care Scope 1 218 n. a.
Scope 2 548 n. a.
Fresenius Kabi Scope 1 169 174
Scope 2 255 248
Fresenius Helios Scope 1 114 103
Scope 2 182 152
Fresenius Vamed Scope 1 18 3
Scope 2 19 6
Total Scope 1 519 n. a.
Scope 2 1,004 n. a.
In the health care industry, waste is a strictly regulated factor.
All Fresenius locations have to adhere to all applicable laws
and regulations and also to global or local standard operating
procedures and environmental management provisions. There
are important interfaces between professional, safe disposal
and the requirements for hygiene and sterility in production
processes and hospital treatments. This ranges from the selec-
tion of suitable disposal containers, cleaning, and steriliza-
tion procedures to the occupational safety of our employees
when disposing of hazardous – e. g., infectious – waste.
Where necessary, business segments lay down specific
rules and requirements in internal guidelines, training, and
controls for our employees, for example in the area of hygiene
in our acute care clinics .
FRESENIUS MEDICAL CARE – ENVIRONMENTAL MANAGEMENTEnvironmental management at Fresenius Medical Care
includes management of water, wastewater, energy, waste
and as well as greenhouse gas emissions. These topics are
the focus of the company’s environmental management activ-
ities. Fresenius Medical Care aims to achieve environmental
improvements along the entire life cycle of its products and
reduce negative environmental impacts and risks for its
patients and employees.
Fresenius Medical Care is subject to a broad range of
federal, state, and local laws and regulations relating to the
protection of the environment. These laws regulate, among
other things, the discharge of substances into the environ-
ment, the handling and disposal of waste and wastewater and
the remediation of contaminated sites. As the company oper-
ates in highly regulated markets, it has established manage-
ment structures in line with its decentralized structure to
comply with applicable laws and regulations.
In North America, environmental management is estab-
lished at regional level. As part of this approach, the company
constantly monitors national and international regulations
relating to environmental, chemical, and occupational health
and safety issues so that internal policies, guidelines, and
SOPs are up-to-date. For the purpose of compliance with appli-
cable laws and internal guidelines, manufacturing sites,
distribution centers, and laboratories are subject to regular
audits by the company’s Corporate Audit team. Furthermore,
Fresenius Medical Care regularly analyzes energy, water, and
waste and reviews them to reduce consumption and improve
efficiency in all of its facilities. 91% of Fresenius Medical
Care’s dialysis clinics in the U.S. are covered by this approach.
In the EMEA segment, environmental management is part
of Fresenius Medical Care’s Integrated Management System
(IMS). Its aim is to systematically reduce and control risks
associated with environmental protection, comply with appli-
cable legislation, and meet the expectations of our custom-
ers and patients. Since the environmental certification strategy
is focused on but not limited to production sites with high
consumption levels, eight of Fresenius Medical Care’s largest
production sites in the EMEA segment are certified accord-
ing to ISO 14001. Two of these production sites are also certi-
fied according to ISO 50001. In addition, almost 50% of the
company’s dialysis clinics are certified according to ISO 14001.
Compliance with ISO standards is regularly reviewed by
internal and external experts.
At present, more than 70% of Fresenius Medical Care’s
clinics in the EMEA segment use the integrated software
solution e-con5 for eco-controlling. This software is designed
to monitor and reduce energy, water, and waste while improv-
ing the quality and consistency of environmental data. In
the years to come, we intend to continuously increase the pro-
1 Fresenius Medical Care figures include data on energy and water consumption provided by GMQ-coordinated manufacturing sites as well as data on electricity and water consumption from dialysis centers. Greenhouse gases are calculated based on energy data. Due to the timing of this publication and the availability of data sources such as energy or water bills, the company has performed a limited amount of extrapolations to complete this reporting year’s dataset. The data from Fresenius Helios contain all company-owned hospitals in Germany and Spain. Fresenius Kabi’s data include all facilities worldwide. Fresenius Vamed’s data include all fully consolidated health care facilities, and as of 2018 the German post-acute care busi-ness transferred from Fresenius Helios to Fresenius Vamed.

Non
-Fin
anci
al R
epor
t
123Group Non-Financial Report Protecting nature as the basis for life
portion of clinics using e-con5. For further information on
our Environmental Health & Safety (EHS) Basic System
and the Declaration of EHS compliance, please refer to the
section on “Occupational health and safety” on page 117.
In Latin America, Fresenius Medical Care has imple-
mented an environmental management program to control
and improve its environmental performance in terms of
energy, water, and waste in dialysis clinics. More than 92%
of the company’s clinics are covered by the integrated soft-
ware solution e-con5 for eco-controlling. The environmental
data is reviewed on a regular basis to control developments
as well as target achievements and define measurements and
activities for improvement.
ENVIRONMENTALLY SOUND AND EFFICIENT
OPERATIONS IN GMQ AND GRD
Fresenius Medical Care’s corporate GMQ function encourages
local sustainability projects as part of the Green & Lean ini-
tiatives with the aim of continuously improving the company’s
environmental performance and incorporating environmental
management best practices into its business operations. This
means that each plant is responsible for defining, planning,
and implementing environmental initiatives.
Green & Lean reporting enables best practices to be shared
between plants with a view to reducing emissions, promoting
the responsible and efficient use of natural resources and
recycling waste and wastewater. The key objectives of the
initiatives are compliance with applicable environmental
regulations, managing and reducing environmental risks,
and implementing environmentally sustainable operations. In
2018, the Green & Lean initiatives included the conversion to
LED lighting in warehouses and production areas, wastewater
heat recovery, the replacement of production chillers and
boilers to adapt to environmental conditions, and the increased
use of solar power. Fresenius Medical Care also saved water
and wastewater by implementing and optimizing reverse
osmosis systems, autoclaves, and purification systems. Further-
more, the company improved its production processes and
recycling activities and was consequently able to reduce waste
produced at its manufacturing sites.
Fresenius Medical Care’s commitment to using natural
resources efficiently is also part of the environmental policy
set out by the GMQ function in EMEA and Latin America as
well as by GRD. In this policy, the company pledges to mini-
mize the impact of our activities on the environment, comply
with applicable laws and regulations, and provide safe and
healthy working conditions for all employees. Using natural
resources efficiently, preventing environmental pollution,
recycling waste efficiently, and enhancing our environmental
performance are core elements of the company’s efforts to
continually improve its environmental management system.
REDUCING ENVIRONMENTAL IMPACT
ALONG THE PRODUCT LIFE CYCLE
At Fresenius Medical Care, innovations and new technologies
help to reduce the company’s impact on the environment and
the use of resources. Most of the water utilized by Fresenius
Medical Care is needed to produce dialysate during life-saving
dialysis treatment in our dialysis centers around the world.
The amount of dialysate and consequently the amount of water
required per dialysis treatment is determined by a variety of
factors including the blood flow rate, the selected dialyzer, and
the treatment method, most of which are the direct responsi-
bility of the physician.
In its efforts to save resources, it is of utmost importance
to Fresenius Medical Care that resource efficiency does not
compromise the quality of care or product quality. With the
latest machine generations, the 5008 and 6008 series, the com-
pany has developed a dialysis machine that supports patient
safety while at the same time being eco-friendly by auto-
matically adjusting the dialysate flow to the effective blood
flow. This allows the saving of substantial amounts of dialy-
sate, water, and energy while maintaining a constant dialysis
quality. Fresenius Medical Care is continuously increasing
sales of these machines worldwide. In 2018, more than one
in five dialysis machines produced belonged to one of these
resource-friendly machine generations.

Non-F
inancial Report
Group Non-Financial Report124
With the aim of reducing its environmental impact, Fresenius
Medical Care takes a life cycle approach that takes into
consideration all significant environmental impacts along
the entire product life cycle. To this end, the company has
established a simplified, lean product life cycle assessment
(Screening LCA) as part of its EMEA environment, health,
and safety program. Based on international guidelines, we
calculate the environmental impact caused during the differ-
ent stages of a product’s life cycle in order to meet the require-
ments of ISO 14001 and IEC 60601-1-9. The Screening LCA
covers the majority of the company’s active medical device
product lines.
FRESENIUS KABI – ENVIRONMENTAL MANAGEMENTFresenius Kabi has implemented binding global environmental
guidelines. In addition, Fresenius Kabi uses an environmen-
tal management system in line with the international standard
ISO 14001 as well as an energy management system in line
with the international standard ISO 50001. An environmental
and energy management handbook as well as standard pro-
cess guidelines are the framework for the environmental and
energy management of all certified local units. Both the envi-
ronmental and energy management systems are certified by
TÜV Rheinland and audited annually. Both in its environ-
mental and energy management, Fresenius Kabi focuses on
the continuous improvement of energy and water usage, as
well as the reduction of wastewater, waste, and emissions –
depending on the overall production volume. Fresenius Kabi
also expects careful and responsible handling of nature
and its resources from its suppliers. This is implemented in
Fresenius Kabi’s Supplier Code of Conduct.
Responsibility for environmental and energy management
is allocated to global, divisional, and local organizations ulti-
mately reporting to Fresenius Kabi’s CEO. Employees in the
Global Work and Environmental Safety division analyze and
evaluate processes centrally and at the sites. They facilitate
the exchange of best practices. With internal audits, Fresenius
Kabi identifies improvement opportunities at its own sites
and develops appropriate measures with locally responsible
managers to tap these potentials.
The production sites place special importance on the
improvement of energy performance and environmental
impact. At our plant in Wuxi, China, we have installed a
solar thermal-based preheating system to support the central
heating. With this measure, we were able to achieve annual
savings of 58.4 t CO2 and 27,000 m³ natural gas.
FRESENIUS HELIOS – ENVIRONMENTAL MANAGEMENTAt Helios Germany, the business unit Infrastructure 1 is respon-
sible for environmental management. The business unit
reports directly to the manager responsible for operating
the company’s international business (COO).
The business unit Infrastructure supports purchasing acti-
vities and the exchange of best practices at the clinics. On an
operational level, environmental topics are managed by the
individual hospitals. For them, the energy consumption and
drinking water quality are of particular importance in envi-
ronmental management. However, as drinking water quality
has to be ensured at all times and microbiological contami-
nation must be prevented, Helios can only control the water
consumption in hospitals and clinics to a small extent.
The business unit has also established a central purchas-
ing and management system to control energy consumption
at all sites and clinics. It allows the company to regularly
and promptly compare targets with actual values and to derive
improvement measures. In addition to this system, all Helios
Germany hospitals are certified according to the German
Energy Saving Act (EDL-G). Through this certification, we ful-
fill the DIN EN 16247 standard.
Helios Spain uses the ISO 50001 standard for the certifica-
tion of its hospitals’ energy management and aims to increase
their energy efficiency. By 2018, some hospitals had already
been certified, with other hospitals scheduled to be certified
in 2019. In 2016, the company started the exchange of best
practices and experience in the company through an energy
management committee. Furthermore, it controls its green-
house gas emissions and plans to reduce them through energy
efficiency measures. Helios Spain also uses the ISO 14001
standard for environmental management. By 2018, some hos-
pitals had already been certified, with other hospitals sched-
uled to be certified in 2019.
Waste and sewage in the German and Spanish hospitals
are disposed of according to legal requirements, for example
the German Recycling and Waste Management Act (Kreislauf-
wirtschaftsgesetz) or the Spanish Ley 10 / 1998, RD 952 / 1997.
1 On August 15, 2018, Helios Germany established the business area infrastructure. Main responsibilities are construction and project control, industrial engineering, sterilization processes, and authorized representatives units including environmental management at Helios Germany.

Non
-Fin
anci
al R
epor
t
125Group Non-Financial Report Protecting nature as the basis for life / Caring for human rights
Helios Spain uses authorized service providers to manage
hazardous waste. Wherever possible, the company encourages
the reuse and recycling of waste. In Germany, local munici-
palities and rural districts also set spe cifications in wastewater
regulations. Proper waste disposal is of great importance to
hospitals. Helios views waste disposal management as a pro-
cess: it starts with avoiding any future waste, and ends with
the consistent recycling or environmentally friendly disposal
of the same. Requirements pertaining to environmental pro-
tection, occupational health and safety, and infection protec-
tion and hospital hygiene are taken into account. That relates
particularly to major waste groups such as clinical waste,
i. e., from the diagnosis and treatment of human diseases.
FRESENIUS VAMED – ENVIRONMENTAL MANAGEMENTAt Fresenius Vamed, the responsibility for the environmental
management of the consolidated health facilities is anchored
directly to the respective management. In environmental
management, the resource-efficient handling of energy sources
and fresh water is of particular importance. State-of-the-art
construction and installation techniques are used in health
care facilities built by Fresenius Vamed, to ensure optimal
resource management.
Fresenius Vamed’s energy management in Austria is cer-
tified for companies with a majority stake in accordance with
ISO 50001 and is regularly audited. In 2016, an energy man-
agement system in line with ISO 50001 was introduced in
the thermal baths managed by Fresenius Vamed on a voluntary
basis. It is certified by Quality Austria. The local units are
provided by Fresenius Vamed with the framework conditions
for energy management. On this basis, measures to improve
energy efficiency are defined and implemented locally.
CARING FOR HUMAN RIGHTS
As a global health care company, we improve access to afford-
able, high-quality health care in many countries and thereby
contribute to respecting human rights.
▶ Every 0.7 seconds, Fresenius Medical Care provides a
dialysis treatment somewhere around the globe.
▶ With a broad range of generic products, Fresenius Kabi
enables patients with medical needs to access modern
therapies and affordable health care.
▶ In the past five years, Fresenius Helios has invested more
than € 1 billion in the modernization and development
of clinical services in Germany and Spain and thereby
contributes to comprehensive high-quality health care.
▶ Fresenius Vamed has completed more than 900 projects
in around 90 countries, many of these in regions in
which the development of health care infrastructure is
still at an early stage. Through this, Fresenius Vamed
contributes decisively to facilitating access to health care
facilities for patients.
HOW WE CONTRIBUTEWe are committed to respecting and supporting human rights
as they are defined by international standards, such as the
United Nations Universal Declaration of Human Rights and
the Fundamental Principles as published by the Interna-
tional Labor Organization (ILO) 1. We consider this part of
our responsibility as a company.
In 2018, we have adopted a Group-wide statement
regarding human rights. It contains aspects of human rights
that are of special importance for Fresenius. Our activities
serve to respect human rights and shall support their protec-
tion. We strive to continuously develop these activities.
1 ILO Declaration on Fundamental Principles and Rights at Work, adopted June 1, 1998.

Non-F
inancial Report
Group Non-Financial Report126
In our human rights statement, we express our position on
the following areas in relation to human rights:
▶ No exploitative nor illegal child nor forced labor
We do not tolerate the use or threat of violence, or any
other form of coercion. In particular, we are dedicated to
protecting children from exploitation. We strictly forbid
using, supporting, or approving of exploitative and illegal
child or forced labor.
Taking responsibility for our employees is part of the
corporate responsibility of the whole Fresenius Group.
Processes in local entities of all business segments serve
to adhere to applicable laws on the prevention of exploit-
ative and illegal child or forced labor. We expect our
business partners to comply with these laws. Where it is
required by local laws, such as the UK Modern Slavery
Act, we confirm compliance with these laws on the web-
sites of our local entities. 1
▶ Standing against discrimination and promoting equal
opportunity
We support equal opportunities and take a clear stand
against discrimination. No one may ever be discriminated
against, e. g., for their skin color, race, gender, religion,
political views, age, physical constitution, sexual orienta-
tion, appearance, or other personal characteristics. We
also do not tolerate discrimination due to membership in
unions or works councils.
We interact openly, fairly, and appreciatively. All
business segments have embedded these principles in
their codes of conduct.
Fresenius Kabi has established shared company values
for all employees that form a worldwide common under-
standing of its corporate culture. They emphasize the
importance of respectful collaboration among all employ-
ees. The values are part of the quality management
handbook and the Code of Conduct at Fresenius Kabi.
To promote equal opportunity, Fresenius Helios particu-
larly emphasizes the compatibility of family and work,
especially for employees working in shifts and on-call duty,
and offers or supports child care. With these and other
exemplary initiatives, we foster a company culture without
discrimination at Fresenius. Further information and fig-
ures regarding our employee structure and diversity can
be found on page 113.
▶ Creating safe working conditions
We are committed to ensuring that the necessary safety
measures are taken and that working conditions are fair
and safe for all our employees. We want to provide a
healthy and productive place to work to our employees.
We report in detail on occupational health and safety
on pages 117 ff.
▶ Respecting the right of freedom of association and
collective bargaining
Fresenius respects the freedom of association and the right
to collective bargaining. Our employees can join labor
unions, seek representation, and engage in collective bar-
gaining in accordance with local laws. We foster open and
direct communication within our workforce and strictly
oppose any discrimination, as stated in our Code of Con-
duct. No one shall be discriminated against at the work-
place due to membership of unions or works councils.
You will find further information on employee participation
and collective bargaining on pages 116 f.
1 For further information, please see: www.freseniusmedicalcare.co.uk/about-us/statement-modern-slavery www.fresenius-kabi.co.uk/7266.htm www.calea.co.uk/about/compliance/calea-modern-slavery-act-2015-statement

Non
-Fin
anci
al R
epor
t
127Group Non-Financial Report Caring for human rights
▶ Protecting personal data
We respect the privacy of every person. We feel account-
able for the personal data of our patients, employees,
customers, and suppliers. We are aware of our responsi-
bility within the especially trusted relationship with our
patients. Our patients expect adequate protection of their
data. This guides our procedures in handling patient data.
All business segments and Fresenius SE & Co. KGaA have
implemented comprehensive Data Protection Management
Systems, which ensure responsible handling of the data
we receive. Details on this are described in the section on
Data Protection Management Systems on pages 104 ff.
▶ Considering the influence on our environment
It is also part of our joint responsibility to protect nature
as the basis of life, to preserve resources, and to reduce
our impact on the environment. It is our mutual duty to
protect resources for future generations.
We aim to comply with legal requirements and to
improve the safety of our plants and our performance in
the areas of environmental protection, product responsi-
bility, and logistics. You will find additional information
on pages 121 ff.
▶ Taking responsibility in our supply chain
We expect our suppliers and business partners to commit
to ethical standards of conduct in daily business, towards
employees, society, and the environment. This also includes
the described areas in relation to respecting human rights.
You can find more information on how we take responsi-
bility in our supply chain on page 128.
The statement on human rights is a self-commitment, which
is valid for all business segments and Fresenius SE & Co. KGaA.
It complements the commitments and principles regarding
respecting human rights, which all business segments have
included in their Codes of Conduct.
Beyond that, the safety of our products and therapies is
our priority. Millions of patients worldwide rely on the quality
of our care. Therefore, the following applies for all business
segments: when we recognize indications for deficiencies and
limitations in our products, therapies, or processes, we make
them transparent and take necessary actions. When conduct-
ing clinical studies, too, our first priority is the safety of
our patients. We observe ethical, medical, and legal require-
ments. When we recognize any indications for deviations,
we respond immediately. We keep awareness of our employ-
ees and managers for our values and principles of conduct
up to date through regular classroom or online training on the
respective Code of Conduct.
Operational implementation and assessment of our activi-
ties are the responsibility of the respective functions, such
as Human Resources and Occupational Health and Safety,
within the business segments. Measures such as training on
the Codes of Conduct or reporting mechanisms are supported
by the Compliance Management Systems. You will find details
on this on pages 109 ff. In addition, sample checks are also
conducted as part of internal audits.
Employees of all business segments and Fresenius SE &
Co. KGaA as well as external partners can report potential
violations, also related to human rights aspects, via whis-
tleblower hotlines or e-mail addresses. In addition, employees
can report their concerns directly to their superiors. Addi-
tional information on reporting possibilities is described in
the chapter on the Compliance Management Systems on
page 112. If we have information on potential violations, we
take necessary measures.
In case current developments require it, we implement
appropriate measures to fulfill our responsibility to respect
human rights in our company activities.
We take the results of internal reviews and reports as an
opportunity to review our company processes for improve-
ments of our internal processes and implement corrective or
improvement measures.
No events with a material adverse impact were recorded
in the business year that conflict with our goal of respecting
human rights.

Non-F
inancial Report
128 Group Non-Financial Report
RESPONSIBILITY IN THE
SUPPLY CHAIN
Our business segments cover a large part of their value chain
and thereby ensure the highest quality standards. Beyond that,
we work with suppliers and other business partners world-
wide to care for our patients.
Thereby, we expect our suppliers and business partners
to commit to ethical standards of conduct in daily business,
towards employees, society, and the environment. This also
includes areas described in our human rights statement.
We specify and communicate our expectations toward
suppliers, service providers, and other partners. Fresenius
Medical Care has enshrined these in Sustainability Principles
for suppliers of the Global Manufacturing and Quality func-
tion in the regions EMEA, Latin America, and Asia-Pacific.
Fresenius Kabi, Fresenius Vamed, and Fresenius SE & Co. KGaA
specify these expectations in the respective Supplier Codes
of Conduct. Both the Sustainability Principles and the Supplier
Codes of Conduct are used as attachments for procurement
contracts in the business segments.
With this, we want to achieve that our partners commit
to our standards of conduct. Responsibility for selection and
contracting lies within the dedicated responsible functions
within the business segments. Basic measures, such as assess-
ments or reporting mechanisms, are supported by the Com-
pliance Management Systems.
We expect from our partners in supply to implement ade-
quate processes, which ensure compliance with relevant
standards. If we detect potential misconduct on the part of
them, we will react, e. g., with additional control measures,
depending on the severity of the misconduct.
In addition, Fresenius Kabi has identified strategic sup-
pliers, which are under dedicated supervision by the global
strategic procurement organization. First, a risk-based quali-
fication is conducted according to defined global processes.
Afterwards, strategic suppliers are regularly assessed accord-
ing to criteria such as quality and workplace health and
safety, as well as environmental factors and compliance. This
process also includes audits at suppliers.
To further strengthen and harmonize its commitment
to sustainable procurement practices, Fresenius Medical Care
has launched an initiative to promote sustainable supply
as part of a global sustainability program. The global, cross-
functional working group set up in this context will focus on
supplier relationship management, risk management within
our supply chain, and a sustainable supply strategy.

Non
-Fin
anci
al R
epor
t
129
LIMITED ASSURANCE REPORT OF THE
INDEPENDENT AUDITOR REGARDING
THE SEPARATE NON-FINANCIAL GROUP
REPORT 1
To the Supervisory Board of Fresenius SE & Co. KGaA,
Bad Homburg v. d. Höhe
We have performed an independent limited assurance engage-
ment on the separate non-financial group report as well as
the by reference qualified part of the group management
report “Group’s business model”, (further “non-financial group
report“), of Fresenius SE & Co. KGaA, Bad Homburg v. d. Höhe
(further “Fresenius”) according to § 315b, 315c in connec-
tion with 289c to 289e of the German Commercial Code (HGB)
for the period from January 1 to December 31, 2018.
MANAGEMENT’S RESPONSIBILITYThe legal representatives of Fresenius are responsible for the
preparation of the non-financial group report in accordance
with §§ 315b, 315c in connection with 289c to 289e HGB.
This responsibility of the legal representatives includes the
selection and application of appropriate methods to prepare
the non-financial group report and the use of assumptions
and estimates for individual disclosures which are reasonable
under the given circumstances. Furthermore, this responsi-
bility includes designing, implementing and maintaining sys-
tems and processes relevant for the preparation of the non-
financial group report in a way that is free of – intended or
unintended – material misstatements.
INDEPENDENCE AND QUALITY ASSURANCE ON THE PART OF THE AUDITING FIRMWe are independent from the company in accordance with
the requirements of independence and quality assurance set
out in legal provisions and professional pronouncements
and have fulfilled our additional professional obligations in
accordance with these requirements.
Our audit firm applies the legal provisions and professional
pronouncements for quality assurance, in particular the
Professional Code for German Public Auditors and Chartered
Accountants (in Germany) and the quality assurance stan-
dard of the German Institute of Public Auditors (Institut der
Wirtschaftsprüfer, IDW) regarding quality assurance require-
ments in audit practice (IDW QS 1).
PRACTITIONER’S RESPONSIBILITYOur responsibility is to express a conclusion on the non-finan-
cial group report based on our work performed within a lim-
ited assurance engagement.
We conducted our work in accordance with the Interna-
tional Standard on Assurance Engagements (ISAE) 3000
(Revised): “Assurance Engagements other than Audits or
Reviews of Historical Financial Information” published by
IAASB. This standard requires that we plan and perform the
assurance engagement to obtain limited assurance whether
any matters have come to our attention that cause us to
believe that the non-financial group report, has not been pre-
pared, in all material respects in accordance with §§ 315b
and 315c in conjunction with 289c to 289e HGB. We do not,
however, issue a separate conclusion for each disclosure.
In a limited assurance engagement the evidence gathering
procedures are more limited than in a reasonable assurance
engagement and therefore significantly less assurance is
obtained than in a reasonable assurance engagement. The
choice of audit procedures is subject to the auditor’s own
judgement.
1 Our engagement applied to the German version of the separate non-financial group report. This text is a translation of the Independent Assurance Report issued in German, whereas the German text is authoritative.
Group Non-Financial Report Responsibility in the supply chain / Limited assurance report

Non-F
inancial Report
Group Non-Financial Report130
Within the scope of our engagement, we performed amongst
others the following procedures:
▶ Inquiries of personnel of the CSR core team who are
responsible for the materiality analysis to get an under-
standing of the process for identifying material topics
and respective report boundaries for FSE
▶ A risk analysis, including a media research, to identify
relevant information on Fresenius’ sustainability perfor-
mance in the reporting period
▶ Evaluation of the design and implementation of the systems
and processes for the collection, processing and control
of disclosure on environmental, employee and social mat-
ters, respect for human rights as well as anti-corruption
and bribery matters, including the collection and consoli-
dation of quantitative data
▶ Inquiries of personnel who are responsible for determin-
ing disclosures and for compiling the disclosures on
concepts, due diligence processes, results and risks, the
conduction of internal controls and consolidation of the
disclosures
▶ Evaluation of selected internal and external documents
▶ Analytical evaluation of data and trends of quantitative
disclosures which are reported by all sites on group level
▶ Assessment of local data collection and reporting pro-
cesses and reliability of reported data via a sampling sur-
vey at the sites Friedberg of Fresenius Kabi Deutschland
GmbH, at Helios Klinikum Hildesheim GmbH and at the
site of Lyon of the Fresenius Medical Care SMAD, S. A. S.,
Savigny (France)
▶ Assessment of the overall presentation of the disclosures
CONCLUSIONBased on the procedures performed and the evidence obtained,
nothing has come to our attention that causes us to believe
that the non-financial group report of Fresenius for the period
from January 1 to December 31, 2018 is not prepared, in all
material respects, in accordance with §§ 315b and 315c in con-
junction with 289c to 289e HGB.
RESTRICTION OF USE / CLAUSE ON GENERAL ENGAGEMENT TERMSThis assurance report is issued for purposes of the Supervisory
Board of Fresenius SE & Co. KGaA, Bad Homburg v. d. Höhe,
only. We assume no responsibility with regard to any third
parties.
Our assignment for the Supervisory Board of Fresenius
SE & Co. KGaA, Bad Homburg v. d. Höhe, and professional
liability is governed by the General Engagement Terms for
Wirtschaftsprüfer and Wirtschaftsprüfungsgesellschaften
(Allgemeine Auftragsbedingungen für Wirtschaftsprüfer und
Wirtschaftsprüfungsgesellschaften) in the version dated
January 1, 2017 (https://www.kpmg.de/bescheinigungen/lib/
aab_english.pdf). By reading and using the information con-
tained in this report, each recipient confirms notice of pro-
visions of the General Engagement Terms (including the
limitation of our liability for negligence to EUR 4 million as
stipulated in No. 9) and accepts the validity of the General
Engagement Terms with respect to us.
Frankfurt am Main, February 19, 2019
KPMG AG
Wirtschaftsprüfungsgesellschaft
[Original German version signed by:]
Hell Glöckner
Wirtschaftsprüfer
[German Public Auditor]

Cor
pora
te G
over
nanc
e
Corporate Governance Corporate Governance Declaration 131
In this Corporate Governance Declaration, the Supervisory
Board of Fresenius SE & Co. KGaA and the Management
Board of the general partner of Fresenius SE & Co. KGaA,
Fresenius Management SE (Management Board), report,
pursuant to Sections 289 f and 315 d of the German Commer-
cial Code (HGB), on corporate management and, pursuant
to number 3.10 of the German Corporate Govern ance Code,
on the Corporate Governance at the Company (Corporate
Governance Report). The Corporate Governance Declaration
and the Corporate Governance Report are published on our
website, see www.fresenius.com/corporate-governance.
CORPORATE GOVERNANCE
DECLARATION
GROUP MANAGEMENT AND SUPERVISION STRUCTURE AND CORPORATE BODIES
GROUP MANAGEMENT AND SUPERVISION
STRUCTURE
The Company has the legal form of a KGaA (Kommanditge-
sellschaft auf Aktien – partnership limited by shares). The
Annual General Meeting, the Supervisory Board, and the
general partner Fresenius Management SE are the legal
corporate bodies. There have been no changes in the Group
management and the super vision structure in the reporting
period. The chart on the following page provides an overview
of the Group structure.
The articles of association of Fresenius SE & Co. KGaA,
which, in addition to legal provisions, further define the
responsibilities of the individual corporate bodies, can be
downloaded from our website, see www.fresenius.com/
corporate-governance.
CORPORATE GOVERNANCE DECLARATIONAND REPORT. The Supervisory Board and the Management Board are committed to responsible management that is focused on achieving a sus tainable increase in the value of the Company. Long-term corporate strategies, solid financial management, strict adherence to legal and ethical business standards, and transparency in corporate communication are key factors.
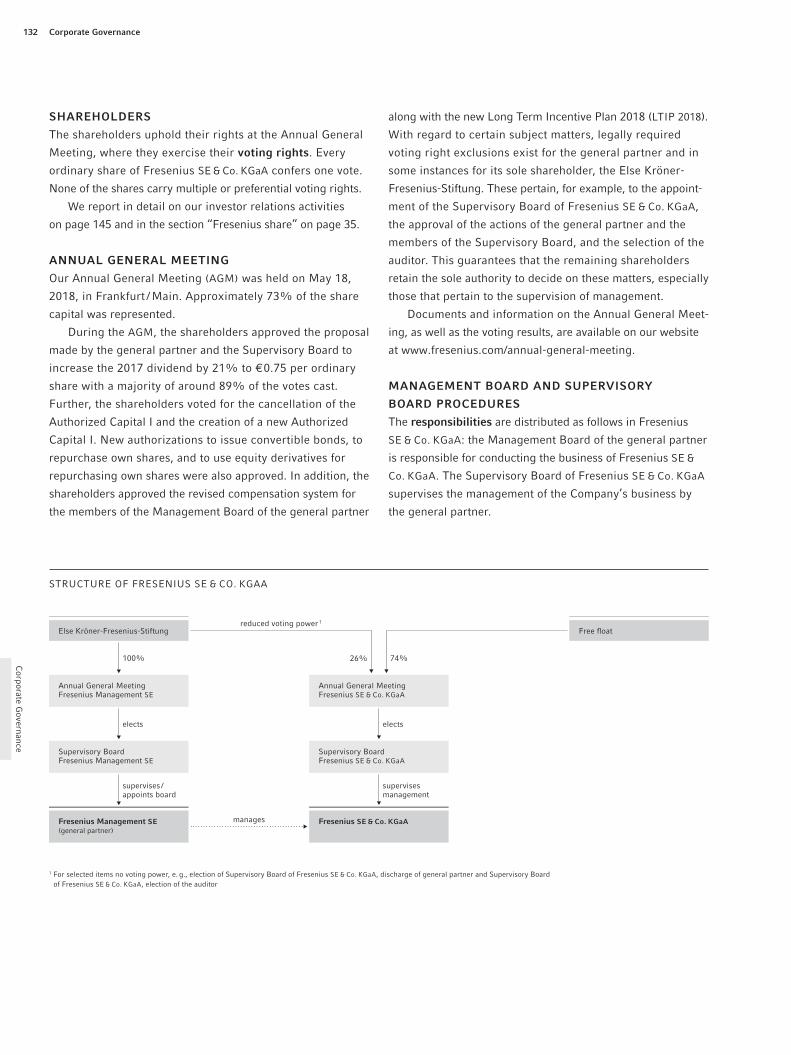
Corporate G
overnance
Corporate Governance132
SHAREHOLDERS
The shareholders uphold their rights at the Annual General
Meeting, where they exercise their voting rights. Every
ordi nary share of Fresenius SE & Co. KGaA confers one vote.
None of the shares carry multiple or preferential voting rights.
We report in detail on our investor relations activities
on page 145 and in the section “Fresenius share” on page 35.
ANNUAL GENERAL MEETING
Our Annual General Meeting (AGM) was held on May 18,
2018, in Frankfurt / Main. Approximately 73% of the share
capital was represented.
During the AGM, the shareholders approved the proposal
made by the general partner and the Supervisory Board to
increase the 2017 dividend by 21% to € 0.75 per ordinary
share with a majority of around 89% of the votes cast.
Further, the shareholders voted for the cancellation of the
Authorized Capital I and the creation of a new Authorized
Capital I. New authorizations to issue convertible bonds, to
repurchase own shares, and to use equity derivatives for
repurchasing own shares were also approved. In addition, the
shareholders approved the revised compensation system for
the members of the Management Board of the general partner
along with the new Long Term Incentive Plan 2018 (LTIP 2018).
With regard to certain subject matters, legally required
voting right exclusions exist for the general partner and in
some instances for its sole shareholder, the Else Kröner-
Fresenius-Stiftung. These pertain, for example, to the appoint-
ment of the Supervisory Board of Fresenius SE & Co. KGaA,
the approval of the actions of the general partner and the
members of the Supervisory Board, and the selection of the
auditor. This guarantees that the remaining shareholders
retain the sole authority to decide on these matters, especially
those that pertain to the super vision of management.
Documents and information on the Annual General Meet-
ing, as well as the voting results, are available on our website
at www.fresenius.com/annual-general-meeting.
MANAGEMENT BOARD AND SUPERVISORY
BOARD PROCEDURES
The responsibilities are distributed as follows in Fresenius
SE & Co. KGaA: the Management Board of the general partner
is responsible for conducting the business of Fresenius SE &
Co. KGaA. The Supervisory Board of Fresenius SE & Co. KGaA
supervises the management of the Company’s business by
the general partner.
STRUCTURE OF FRESENIUS SE & CO. KGAA
Else Kröner-Fresenius-Stiftung
Fresenius Management SE (general partner)
Fresenius SE & Co. KGaA
Annual General Meeting Fresenius Management SE
Annual General Meeting Fresenius SE & Co. KGaA
Supervisory Board Fresenius Management SE
Supervisory Board Fresenius SE & Co. KGaA
Free float
100%
reduced voting power 1
manages
74%26%
elects elects
supervises / appoints board
supervises management
1 For selected items no voting power, e. g., election of Supervisory Board of Fresenius SE & Co. KGaA, discharge of general partner and Supervisory Board of Fresenius SE & Co. KGaA, election of the auditor

Cor
pora
te G
over
nanc
e
Corporate Governance Corporate Governance Declaration 133
General partner – Management and Supervisory BoardsThe general partner, Fresenius Management SE, represented
by its Management Board, manages Fresenius SE & Co. KGaA
at its own responsibility and conducts its business. The Man-
agement Board formulates the Company’s strategy, discusses
it with the Supervisory Boards of Fresenius Management SE
and Fresenius SE & Co. KGaA, and oversees its implementa-
tion. Its actions and decisions are aligned with the best inter-
ests of Fresenius SE & Co. KGaA. The Management Board is
committed to increasing the value of the Company on a sus-
tainable basis. The rules of procedure for the Management
Board were established by the Supervisory Board of Fresenius
Management SE. They define the activities within the board
more specifically, especially with regard to the individual
duties and responsibilities of the members, matters reserved
for the full Management Board, and resolutions to be passed
by the full Management Board. Sustainability is a Group
responsibility and directly reported to the CEO. Further
information can be found in the Group Non-financial Report
on pages 92 ff.
The meetings of the Management Board are convened
as required, but at least once a month, and are chaired by the
Chairman of the Management Board or, if he is incapacitated,
by the Chief Financial Officer or, if she is also incapacitated,
by the Management Board member present who is most
senior in age. However, Management Board meetings are usu-
ally held twice a month. The person chairing the meeting
decides the order in which the items on the agenda are dealt
with and the form in which the voting is conducted. The
Management Board passes its resolutions by a simple major-
ity of the votes cast or, outside its meetings, by a simple
majority of its members, except in cases where mandatory
provisions of law impose stricter requirements. The Chair-
man of the Management Board has the casting vote if a vote
is tied. If the Chairman is incapacitated or absent, the motion
is deemed rejected if a vote is tied. The rules of procedure for
the Management Board also govern the relations between
the Management Board and the Supervisory Board of the
general partner, as well as between the general partner and
the Supervisory Board of Fresenius SE & Co. KGaA, and also
matters that require approval of the general partner’s
Supervisory Board.
The Management Board generally consists of seven mem-
bers: the Chairman, the Chief Financial Officer, the Chief
Legal and Compliance Officer and Labor Relations Director,
and the chief executive officers of the four business seg-
ments. This ensures that the full Management Board is kept
constantly informed about important events, plans, develop-
ments, and measures within the business segments. There
are no Management Board committees owing to Fresenius
SE & Co. KGaA’s role as an operating holding company. The
Management Board is listed on page 272 of the Annual Report.
Members of the Management Board are appointed for a
maximum period of five years. Following the recommenda-
tion of the Code, a first-time appointment period of five years is
not the rule. In principle, first-time appointments are rather
for a three-year period.
As a European company (SE – Societas Europaea),
Fresenius Management SE has its own Supervisory Board.
It consists of six members, and its Chairman is Dr. Gerd
Krick. The Super visory Board appoints the members of the
Management Board of Fresenius Management SE and
supervises and advises the Management Board by conducting
the business. If necessary, e. g., in order to discuss or decide
on matters concerning the Management Board, the Super-
visory Board meets without the Management Board. It estab-
lished its rules of procedure following the recommendation
in number 5.1.3 of the Code.
The Supervisory Board members of Fresenius Management
SE can be found on page 273 of the Annual Report.

Corporate G
overnance
Corporate Governance134
The Supervisory Board of Fresenius SE & Co. KGaA
The Supervisory Board of Fresenius SE & Co. KGaA supervises
the management of the Company’s business by the general
partner. It supervises business operations to ensure that corpo-
rate decisions are compliant, suitable, and financially sound.
The members of the Management Board of the general partner
are appointed by the Supervisory Board of Fresenius Man-
agement SE, not – as already explained – by the Super visory
Board of Fresenius SE & Co. KGaA.
The Supervisory Board of Fresenius SE & Co. KGaA con-
sists of 12 members. Half of its members are elected by the
AGM. The proposals for the members of the Supervisory Board
primarily take account of the knowledge, ability, and expert
experience required to perform the tasks. The election propos-
als provided by the Supervisory Board will reflect its desig-
nated objectives as well as its profile of expertise and skills.
In 2018, the objectives for the composition and profile of
skills and expertise of the Board were met. Further informa-
tion can be found on pages 137 ff.
For the Supervisory Board of Fresenius SE & Co. KGaA, the
law requires a quota of at least 30% women and 30% men.
These mandatory quotas were met by the Super visory Board
in fiscal year 2018 and are still met. As it is in the Company’s
interest not to limit the selection of qualified candidates in a
general way, the Supervisory Board confines itself to a gen-
eral declaration of intent and particularly refrains from an age
limit, as well as a regular limit on length of membership. The
statutorily required declaration of conformity concerning the
Code accordingly includes a justified limitation. A Nomina-
tion Committee has been instituted for election proposals for
the shareholder representatives. Its activities are aligned
with the provisions of law and the Code. The European Works
Council elects the employee representatives to the Super-
visory Board of Fresenius SE & Co. KGaA. If an employee rep-
resentative retires within their term of office, the substitute
member will become a member of the Supervisory Board.
Rainer Stein retired as of August 31, 2018 and his substitute
member Bernd Behlert became the new member of the
Supervisory Board as of September 1, 2018.
The Supervisory Board is of the opinion that all its members
are independent. The Supervisory Board shall include what it
deems to be an appropriate number of independent mem-
bers who do not have any business or personal relationship
with the Company, its corporate bodies, a controlling share-
holder, or a party related to the latter that may give grounds
for a material and not merely temporary conflict of interest.
The articles of association of Fresenius SE & Co. KGaA regulate
the details with regard to the Supervisory Board’s election,
constitution, term of office, meetings and resolutions, and
rights and duties. They are published on our website, see
www.fresenius.com/corporate-governance.
The Supervisory Board of Fresenius SE & Co. KGaA has
established its rules of procedure in accordance with number
5.1.3 of the Code. The Chairman of the Supervisory Board is
responsible for coordinating the activities of the Supervisory
Board, chairing the meetings, and representing its interests
externally. The Supervisory Board should convene once each
calendar quarter, and must convene twice each calendar
half-year. The meetings are convened and chaired by the Chair-
man or, if he is incapacitated, by a chairperson named by the
Chairman. The person chairing the meeting decides the order
in which the items on the agenda are dealt with and the form
in which the voting is conducted. Unless other majorities are
mandatory by law, the Supervisory Board passes its resolu-
tions by a simple majority of the votes submitted in the voting.
If a vote is tied, the Chairman has the casting vote or, if he
does not take part in the voting, the matter is decided by the
vote of the Deputy Chairman, who is a shareholder repre-
sentative. The shareholder representatives and the employee
representatives within the Supervisory Board conduct sepa-
rate meetings on a regular basis.
The Supervisory Board of Fresenius SE & Co. KGaA conducts
its business in accordance with the provisions of law, the
articles of association of Fresenius SE & Co. KGaA, and its rules
of procedure. The Management Board of the general partner
Fresenius Management SE continuously informs the Super-
visory Board of the corporate development, planning, and
strategy. The Supervisory Board supervises the Company’s
management and, taking into account the auditor’s reports,
reviews the Group’s annual financial statements. Another im-
portant part of the Supervisory Board’s activities is the work
conducted within the committees formed in accord ance with
the requirements of the German Stock Corporation Act and
the recommendations of the Code.
Cor
pora
te G
over
nanc
e
Corporate Governance Corporate Governance Declaration 135
Supervisory Board training and further education measuresThe members of the Supervisory Board independently take on
necessary training and further education measures required
for their tasks. They keep themselves regularly informed,
through internal and external sources, about the latest require-
ments with regard to their supervisory activ ities. The Super-
visory Board at all times ensures that its members are suitably
qualified, keep their professional knowledge up to date, and
further develop their judgment and expertise. They are sup-
ported appropriately by the Company in accordance with
number 5.4.5 paragraph 2 of the Code. Various external
experts as well as experts from the Company provide infor-
mation about important developments, for example about
the strategic orientation of the Company in growth markets,
relevant new laws and precedents, or changes in the IFRS
accounting and auditing standards. In addition, the Company
holds an onboarding event for new members of the Super-
visory Board.
The members of the Supervisory Board of Fresenius SE &
Co. KGaA can be found on pages 270 to 271 of the Annual
Report. On pages 16 to 23 of the Annual Report, the Supervi-
sory Board reports on the main focuses of its activities and
those of its committees in 2018.
Supervisory Board efficiency evaluationThe Supervisory Board of Fresenius SE & Co. KGaA deliberated
on the efficiency evaluation in accordance with number 5.6
of the Code at its meeting in March 2018.
It reviewed the efficiency of its activities through an open
discussion within the full Supervisory Board. A company-
specific questionnaire covering the salient points for a self-
evaluation served as the basis for the discussion. Among
other things, this included the organization and structuring
of the meetings, the amount of information, and how this
information was provided. The self-evaluation showed that
the Supervisory Board assesses its organization as well as
its work as efficient.
Cooperation between general partner and Supervisory Board of Fresenius SE & Co. KGaA
Good corporate governance requires trusting and efficient
cooperation between the Management and the Supervisory
Board. The Management Board of the general partner and the
Supervisory Board of Fresenius SE & Co. KGaA closely cooper-
ate for the benefit of the Company. Open communication is
essential. The common goal is to sustainably increase the
company value in line with the corporate govern ance and
compliance principles. The Management Board of the gen-
eral partner and the Supervisory Board of Fresenius SE &
Co. KGaA coordinate with each other, especially with regard
to the Company’s strategic focus. As the monitoring body,
the Supervisory Board of Fresenius SE & Co. KGaA also needs
to be fully informed about operating performance and cor-
porate planning, as well as the risk situation, risk management,
and compliance. The Management Board of the general part-
ner provided this information in full and in compliance with its
duties.
The representatives of the shareholders and of the
employees may prepare the Supervisory Board meetings sep-
arately, and, if applicable, with members of the Management
Board. Pre-meetings of the employee representatives as well
as consultations of the shareholder representatives take place
on a regular basis. If necessary, the Supervisory Board meets
without the Management Board.
COMPOSITION AND PROCEDURES OF THE
SUPERVISORY BOARD COMMITTEES
The Supervisory Board of Fresenius SE & Co. KGaA forms two
permanent committees from among its members: the Audit
Committee, consisting of five members, and the Nomination
Committee, consisting of three members. The committee
members were elected for the duration of their term as a mem-
ber of the Supervisory Board of Fresenius SE & Co. KGaA. In
accordance with the articles of association of Fresenius SE &
Co. KGaA, only members of the Audit Committee receive
additional compensation (Section 13 (5) and Section 13 (2)
(old version)). There is no Personnel Committee in the KGaA
because the Supervisory Board of Fresenius SE & Co. KGaA is
not responsible for appointing members of the Management
Board of the general partner or for their contracts. Responsi-
bility for these personnel matters lies with the Supervisory
Board of the general partner.
The provisions for the Supervisory Board of Fresenius SE &
Co. KGaA apply analogously to the committees. The commit-
tees hold meetings as required. The meetings are convened by

Corporate G
overnance
Corporate Governance136
the committee chairmen. They report during the following
Supervisory Board meeting about the work of the respective
committee. The rules of procedure for the committees are
regulated in the rules of procedure of the Supervisory Board of
Fresenius SE & Co. KGaA. The committees do not have their
own rules of procedure.
The members of the Supervisory Board’s committees are
listed on page 271 of the Annual Report.
Audit CommitteeThe Audit Committee’s function is, among other things, to
prepare the Supervisory Board’s approval of the financial
statements – and the consolidated financial statements – and
the Supervisory Board’s proposal to the AGM on the appoint-
ment of the auditor for the financial statements, and to make
a preliminary review of the proposal on the allocation of dis-
tributable profits. It also reviews the quarterly reports before
they are published and – following discussions with the
Management Board – engages the auditor for the financial
statements (and concludes the agreement on the auditor’s
fees), determines the main focuses of the audit, and defines
the auditor’s reporting duties in relation to the Supervisory
Board of Fresenius SE & Co. KGaA. Other matters within its
remit are to review the effectiveness of the internal controls
system, of the risk management system, of the internal audit
system, and of the compliance.
The Audit Committee consists of Klaus-Peter Müller
(Chairman), Konrad Kölbl, Dr. Gerd Krick, Hauke Stars, and
Niko Stumpfögger (since September 1, 2018), as successor
of Rainer Stein who left the committee as of August 31, 2018.
Klaus-Peter Müller is independent and has the required
expertise in the fields stated in Section 100 (5) of the German
Stock Corporation Act (AktG), as well as specialist knowledge
and experience in the application of accounting principles
and internal control processes.
The Audit Committee also examined in detail the non-
audit services rendered additionally by the auditor KPMG AG
Wirtschaftsprüfungsgesellschaft, Berlin, as well as the audit
firm rotation in 2020.
Nomination CommitteeThe Nomination Committee proposes suitable candidates
to the Supervisory Board for the nominations it makes to the
AGM for the election of Supervisory Board members on the
shareholders’ side. It consists solely of shareholder represen-
tatives. In making its proposals, the Nomination Committee
is guided by the requirements of the Code.
The Nomination Committee consists of Dr. Gerd Krick
(Chairman), Michael Diekmann, and Klaus-Peter Müller.
Mediation CommitteeFresenius SE & Co. KGaA does not have a Mediation Commit-
tee because the provisions of the German Co-Determination
Act that require such a committee do not apply to a partner-
ship limited by shares and because the Code does not require
such a committee either.
Joint CommitteeFor some matters, which are defined in further detail in Section
13c (1) of the articles of association of Fresenius SE &
Co. KGaA, the general partner requires the approval of the Joint
Committee if 40% of the consolidated sales, the consoli-
dated balance sheet total, and the consolidated profit are
affected by the matter. These include, for example, the dives-
titure and acquisition of large investments and business units
or the divestiture of large business units from the assets of
Fresenius SE & Co. KGaA or a wholly owned company. The
approval of the Joint Committee is also required for certain
legal transactions between Fresenius SE & Co. KGaA or its
affiliates and the Else Kröner-Fresenius-Stiftung.
Dr. Gerd Krick and Michael Diekmann are members of
the Joint Committee. The other members are Dr. Dieter Schenk
(Chairman) and Dr. Karl Schneider, who were appointed
by the general partner. The Joint Committee did not meet
in 2018.
Information on positions held by committee members on stat-
utorily required supervisory boards and comparable domes-
tic and foreign control bodies of other business enterprises can
be found on pages 270 to 273 of the Annual Report.

Cor
pora
te G
over
nanc
e
Corporate Governance Corporate Governance Declaration 137
OBJECTIVES FOR THE COMPOSITION, PROFILE OF SKILLS AND EXPERTISE, AND DIVERSITY CONCEPTThe Supervisory Board of Fresenius SE & Co. KGaA deter-
mined in accordance with number 5.4.1 of the German Corpo-
rate Governance Code concrete objec tives for its composition
and prepared a profile of skills and expertise for the entire
board. Furthermore, it resolved on a diversity concept for the
Management Board of Fresenius Management SE and the
Supervisory Board of Fresenius SE & Co. KGaA.
OBJECTIVES FOR THE COMPOSITION OF THE
SUPERVISORY BOARD AND PROFILE OF SKILLS
AND EXPERTISE FOR THE ENTIRE BOARD
The Supervisory Board of Fresenius SE & Co. KGaA is to be
composed in such a way that its members in entirety have
the required knowledge, skills, and professional experiences
for duly observing the tasks. Thereby, it is necessary to dif-
ferentiate between the requirements for the individual Super-
visory Board members and the requirements for the com-
position of the entire Board.
Requirements for the individual Supervisory Board membersThe Supervisory Board members have to be professionally
as well as personally qualified to advise and supervise the
Management Board of a globally active health care Group.
Good corporate governance
Each Supervisory Board member is to have the knowledge
of good corporate governance of a capital-market-oriented
company required for duly observing its tasks. This includes
knowledge of the main features of accounting, risk manage-
ment, internal control mechanisms, and of compliance matters.
Sector experience and internationality
Each Supervisory Board member is to have general knowl-
edge of the health care sector, as well as a basic understand-
ing of the global activities of Fresenius.
Independence
A minimum of half of the Supervisory Board members and a
minimum of the half of the shareholder representatives in the
Supervisory Board are to be independent within the meaning
of the German Corporate Governance Code. Independent in
this meaning is someone who does not have a personal or busi-
ness relationship with the Company, its governing bodies, a
controlling shareholder, or a company affiliated with such that
may cause a substantial and not merely temporary conflict
of interest. The shareholder structure may be appropriately
taken into account.
When assessing independence, in the view of the Super-
visory Board, neither an appointment to the Management
Board lapsed for more than two years nor the duration of the
membership to the Supervisory Board exclude the classifi-
cation as independent per se.
With regard to the employee representatives, the indepen-
dence is not contested by the fact of representing employees
nor by the employment relationship.
Individuals exercising an office in a body of a significant
competitor of Fresenius or who hold, directly or indirectly,
more than 3% of the voting capital in such are not to be a
member of the Supervisory Board.
In cases where a Supervisory Board member is active
for another company having business relationships with
Fresenius, this activity is described in the section “Legal rela-
tionships with members of the corporate bodies” of the
Annual Report.
Time availability and limit to the numbers of offices held
Each Supervisory Board member is to have sufficient time
available for duly observing the office as Supervisory Board
member and to comply with the limit to the offices held as
recommended by the German Corporate Governance Code.
Under the assumption of four meetings annually, the expected
time expenditure of new members generally amounts to
approximately 12 to 24 days a year. This includes the prepara-
tion and follow-up of the Supervisory Board’s meetings, the
review of reports to the Supervisory Board, the participation in
the Annual General Meeting, and regular training. Thereby,
it is to be considered that the time expenditure also depends
on the membership of one or several Supervisory Board
committees.

Corporate G
overnance
Corporate Governance138
Age limit and duration limit on the term of membership
In order to not unduly limit the selection of qualified candi-
dates, the Supervisory Board refrains from an age limit and a
duration limit on the term of membership. The statutorily
required declaration on the German Corporate Governance
Code therefore includes a reasoned exception. The Super-
visory Board is rather to include members with long-term
experience and therefore generally older members. A bal-
anced ratio of Supervisory Board members of various ages
and various durations of term of membership is essential.
Requirements for the entire Board
Sector experience
The Supervisory Board in its entirety needs to be familiar
with the health care sector. An appropriate number of Super-
visory Board members are to have in-depth knowledge and /
or experience in the important sectors of the Company’s
operations:
▶ dialysis products, dialysis services, and Care Coordination
▶ essential medicines, medical products, and services for
the critically and chronically ill
▶ operation of hospitals
▶ planning, construction, and management of health care
institutions
The Supervisory Board is to include an appropriate number
of members with management experience in the health care
sector.
Financial knowledge
The Supervisory Board in its entirety needs to have financial
knowledge, in particular in the fields of accounting, report-
ing, and auditing. At least one member needs to have expert
knowledge in the fields of accounting or annual auditing.
Knowledge of relevant legal issues as well as relevant
regulatory and compliance matters
The Supervisory Board in its entirety is to be familiar with
the relevant legal issues, as well as relevant regulatory and
compliance matters.
Experience in the field of digitalization
The Supervisory Board in its entirety is to have the required
understanding of the requirements of digitalization.
Internationality
Fresenius is present in more than 100 countries. Therefore,
the Supervisory Board in its entirety is to have knowledge
and experience in the regions important for Fresenius. The
Supervisory Board is to include an appropriate number of
members with, due to their origin or business experience, a
particular relation to the international markets relevant for
Fresenius.
Management experience
The Supervisory Board is to include an appropriate number
of members with experience in managing or supervising a
medium-sized or large company.
Diversity and appropriate representation of women
The Supervisory Board is to rely on as different as possible
expert knowledge, skills, and experiences. Therefore, diversity
is to be appropriately considered for its composition, and
when making election proposals, in the Company’s interest,
attention should be paid to ensuring that the candidates’
profiles reasonably complement each other.
At least 30% of the Supervisory Board are women and
at least 30% are men. In general, the participation of women
is a joint responsibility of the shareholder and employee sides.
For nominations, both the shareholder and employee sides
will consider, to the extent possible, whether the proportion
of women can be increased with qualified female candidates.
Please note that the responsibility for electing employee rep-
resentatives is with the European Works Council. Therefore,
the Supervisory Board cannot provide a recommendation.
In fiscal year 2018, there were no changes with regard to
the objectives for the composition and profile of skills and
expertise of the Board. Rainer Stein retired and his substitute
member Bernd Behlert became the new member of the
Supervisory Board of Fresenius SE & Co. KGaA. The current
composition of the Supervisory Board of Fresenius SE &
Co. KGaA still fulfills the designated objectives. Furthermore,
the current composition complies with the profile of compe-
tence. The Supervisory Board is of the opinion that all of its
members are currently independent.
Cor
pora
te G
over
nanc
e
Corporate Governance Corporate Governance Declaration 139
DIVERSITY CONCEPT
A diversity concept applies for the Management Board of
Fresenius Management SE and the Supervisory Board of
Fresenius SE & Co. KGaA. The concept is outlined below. The
objectives of the diversity concept, the way in which they
are implemented, and the results achieved in the fiscal year
are also explained. Diversity enables us to look at matters
from different perspectives and against the background of
different experiences. Fresenius seeks diversity in the
M anagement Board of Fresenius Management SE as well as
in the Supervisory Board of Fresenius SE & Co. KGaA in
terms of age, gender, education, professional background,
and international experience.
AgeFinding a balance between expertise and novel approaches is
important for the Management Board of Fresenius Manage-
ment SE and the Supervisory Board of Fresenius SE &
Co. KGaA. Therefore, both the Management Board of Fresenius
Management SE and the Supervisory Board of Fresenius SE &
Co. KGaA should have a balanced mix of experienced and new
members, ensuring that different perspectives are taken into
consideration in the decision-making processes and a continu-
ous transfer of knowledge is fostered. Therefore, there is no
age limit for members of the Management Board and Super-
visory Board and also no duration limit for the term of mem-
bership of those serving on the Supervisory Board.
GenderFresenius believes that a mix of women and men on both the
Management Board of Fresenius Management SE and the
Supervisory Board of Fresenius SE & Co. KGaA is desirable. At
least 30% of the Supervisory Board are women and at least
30% are men. In general, the participation of women is a
joint responsibility of the shareholder and employee sides. For
nominations, both the shareholder and employee sides will
consider, to the extent possible, whether the proportion of
women can be increased with qualified female candidates.
Please note that the responsibility for electing employee rep-
resentatives is with the European Works Council. Therefore,
the Supervisory Board cannot provide a recommendation.
Besides, qualification is the decisive criterion for filling board
positions.
Professional background For each one of the Company’s key business areas, one
member of the Management Board of Fresenius Management
SE shall have longstanding experience:
▶ dialysis products, dialysis services, and Care Coordination
▶ essential medicines, medical devices, and services for the
critically and chronically ill
▶ operation of hospitals
▶ planning, construction, and management of health care
institutions
In addition, one of the members shall have longstanding
experience and expertise in finance and one in corporate gov-
ernance, law, and compliance. This takes into account the
special requirements of a capital-market-oriented company.
The Supervisory Board of Fresenius SE & Co. KGaA shall have
a reasonable number of members experienced in the manage-
ment or supervision of a medium-sized or large company.
A reasonable number of Supervisory Board members should
have leadership experience in the health care industry. At
least one member of the Supervisory Board shall have exper-
tise in accounting or auditing.
International experienceFresenius is present in more than 100 countries. Against this
background, the majority of the members of the Management
Board of Fresenius Management SE are expected to have
international experience in at least one of the markets relevant
to Fresenius, based on their background, professional training,
or career.
An appropriate number of members of the Supervisory
Board of Fresenius SE & Co. KGaA should also have a special
connection to international markets relevant to Fresenius
as a result of their origin or business experience.
Implementation of objectivesThe implementation of the objectives of the Diversity Concept
with regard to the composition of the Management Board of
Fresenius Management SE will be reflected by future personnel
decisions of the Supervisory Board of Fresenius Management
SE. The Diversity Concept will be reflected in the proposals of
candidates by the Supervisory Board of Fresenius SE &
Co. KGaA to the Annual General Meeting of Fresenius SE &
Co. KGaA.

Corporate G
overnance
Corporate Governance140
As far as possible, this should be taken into account by the
European Works Council in the election of employee represen-
tatives to the Supervisory Board of Fresenius SE & Co. KGaA.
In fiscal year 2018, Bernd Behlert, as substitute member
of Rainer Stein, became new member of the Supervisory
Board of Fresenius SE & Co. KGaA.
In the past fiscal year, the Management Board has
remained unchanged.
Overall, the objectives of the diversity concept continue
to be fulfilled.
RELEVANT DISCLOSURES ON CORPORATE GOVERNANCE PRACTICESThe general partner, represented by its Management Board,
manages the Company’s business with the due care and dili-
gence of a prudent and conscientious company director in
compliance with the provisions of the law, the articles of asso-
ciation, the rules of procedure for the Management Board,
the resolutions passed by the full Management Board, and the
Supervisory Board of the general partner. Corporate gover-
nance practices extending beyond the requirements of law are
defined in the Fresenius Code of Conduct. This Code of Con-
duct contains the key principles and rules for our conduct
within the Company and in our relations with external partners
and with the public. We have published the Fresenius Code
of Conduct on our website at www.fresenius.com/compliance.
The Code of Conduct is binding for all Company employees
and must be complied with regarding any type of business
relationship. Our executives regard ensuring compliance
with the principles of the Code of Conduct as part of their man-
agerial responsibilities.
COMPLIANCE MANAGEMENT SYSTEM
For us, compliance means more than acting in accordance
with laws and regulations. Compliance means doing the right
thing. This means: we adhere to all rules, including legal
requirements, internal guidelines, our commitments, and eth-
ical principles. Compliance is an integral part of our corpo-
rate culture and our daily work.
Our Fresenius Code of Conduct defines the framework of
our rules. All Fresenius business segments have implemented
Codes of Conduct. They cover the specifics of their businesses
and reflect the values of the Fresenius Code of Conduct.
Underlying guidelines, instructions, and process descriptions
complement and specify the rules of the Code of Conduct.
Our Compliance Management Systems are designed to
achieve the implementation of these rules within the Company.
We have implemented risk-based Compliance Management
Systems in all our business segments and at Fresenius SE &
Co. KGaA’s corporate level. They comprise three pillars: Pre-
vent, Detect, and Respond. Emphasis is placed on preventing
any acts of non-compliance before they occur. Such systems
consider the markets Fresenius is operating in. They are tai-
lored to the specific requirements of each business segment.
Each of our business segments has appointed a Chief
Compliance Officer who is in charge of developing, implement-
ing, and monitoring the Compliance Management System
(CMS) of the business segment. In line with the business
structure and organization, the business segments have estab-
lished compliance responsibilities at the respective orga-
nizational levels. The Corporate Compliance department of
Fresenius SE & Co. KGaA supports the compliance functions
of the business segments with standardized tools, processes,
and methodologies and reports to the Chief Compliance Offi-
cer of Fresenius SE & Co. KGaA – the member of the Manage-
ment Board responsible for Legal, Compliance, and Labor
Relations.
We take even possible misconduct seriously. This is why
Fresenius employees who are aware of potential misconduct,
e. g., non-compliance with laws, regulations, or internal pol-
icies, can contact their superior or the responsible compli-
ance function or report a potential compliance case anony-
mously through whistleblowing systems or dedicated e-mail
addresses. Fresenius SE & Co. KGaA and Fresenius Kabi have
opened the whistleblowing system not only to employees,
but also to third parties, such as customers, suppliers, and
other partners, via the corporate website.
Any illegal actions or violations of the rules may harm the
individual and Fresenius. We do not tolerate non-compliance.
If a violation of applicable regulations is detected, we will
take the necessary actions to remediate the violation and pre-
vent any recurrence. We also take all reports as an opportunity
to review our company processes for possible improvements.
In 2018, the Management Board approved a Statement
on Human Rights which is published on our website, see
www.fresenius.com/compliance. Further information on human
rights can be found on pages 125 ff. of our Group Non-
financial Report.

Cor
pora
te G
over
nanc
e
Corporate Governance Corporate Governance Declaration 141
Further information on Compliance and the Compliance
Management Systems can be found on pages 109 ff. of our
Group Non-financial Report.
RISK MANAGEMENT AND CONTROL SYSTEM
In our view, responsible risk management is a crucial element
of good corporate governance. Fresenius has a systematic
risk management and control system that allows the Manage-
ment Board to identify risks and market trends at an early
stage and to react promptly to relevant changes in our risk
profile. It consists of the following elements:
▶ early warning system for risks,
▶ steering of financial, operational, and strategic risks,
▶ quality management systems,
▶ compliance management systems,
▶ reporting on legal risks, and
▶ risk assessment in investment and acquisition processes.
The well-being of our patients is important to us. Our risk
management and control system, as well as efficiently
designed processes, help to enhance the Company’s perfor-
mance. Our risk management is reviewed as part of the
annual audit of the financial statements. The control system
is regularly reviewed by the Management Board and the
Internal Audit department. The Audit committee of the
Supervisory Board supervises the quality and effectiveness
of the risk management system. Further information can be
found in the Report of the Supervisory Board on pages 16 to
23 in the Annual Report 2018 and on pages 77 to 78 of the
Management Report.
The Internal Audit department supports the Management
Board as an independent function outside the Company’s
day-to-day operations. The department assesses internal pro-
cesses from an objective viewpoint and with the necessary
distance. Our goal is to create added value for Fresenius, and
thus to help achieve organizational goals through improved
internal controls, optimized business processes, cost reduction,
and efficiency increases. Results from internal audits are
evaluated both by the business segments and by the Compli-
ance organization to continuously improve preventive mea-
sures, for example to prevent corruption.
Fresenius Medical Care AG & Co. KGaA has its own inter-
nal risk management and control system.
GERMAN CORPORATE GOVERNANCE AND DECLARATION OF CONFORMITYThe German Corporate Governance Code aims to provide more
transparency for investors with regard to existing regula-
tions covering the management and monitoring of companies.
Our value-enhancing strategies, as well as the majority of
the guidelines, recommendations, and suggestions for respon-
sible management contained in the Code, have been basic
components of our activities for many years. Extensive infor-
mation on Corporate Governance can be found on our website
at www.fresenius.com/corporate-governance.
The Management Board of the general partner of Fresenius
SE & Co. KGaA, Fresenius Management SE, and the Supervi-
sory Board of Fresenius SE & Co. KGaA have issued the required
Declaration of Conformity pursuant to Section 161 of the
German Stock Corporation Act (AktG) and have made it avail-
able to shareholders on the website of the Company:
“Declaration by the Management Board of the General
Partner of Fresenius SE & Co. KGaA, Fresenius Management
SE, and the Supervisory Board of Fresenius SE & Co. KGaA
on the German Corporate Governance Code pursuant to
Section 161 German Stock Corporation Act (Aktiengesetz)
The Management Board of the General Partner of Fresenius
SE & Co. KGaA, Fresenius Management SE (hereafter the
Management Board), and the Supervisory Board of Fresenius
SE & Co. KGaA declare that since the issuance of the last
Declaration of Conformity in December 2017, the recommen-
dations of the “Government Commission on the German
Corporate Governance Code” published by the Federal Minis-
try of Justice and Consumer Protection (Bundesministerium
der Justiz und für Verbraucherschutz) in the official section of
the Federal Gazette (Bundesanzeiger) (hereafter the Code)
in the version of February 7, 2017 have been met and will also
be met in the future. Only the following recommendations
of the Code in the version of February 7, 2017 have not and
will not be met as explained in the following:

Corporate G
overnance
Corporate Governance142
▶ Code number 4.2.3 paragraph 2 sentence 6:
Compensation caps by specific amount
Pursuant to Code number 4.2.3 paragraph 2 sentence 6,
the compensation amount for Management Board mem-
bers shall be capped by a specific amount, both overall and
for variable compensation components.
This recommendation was only partly met with regard
to the compensation of the Management Board members
guaranteed for the fiscal years through 2017. Until FY 2017,
stock options and phantom stocks as compensation com-
ponents with long-term incentive and therefore the overall
compensation have not provided for a cap by specific
amount as the setting of these types of caps for equity-
based compensation components contradicts the basic
idea of letting the Management Board members adequately
take part in the economic risks and opportunities of the
company. As part of updating the long-term equity-based
compensation in 2018, a cap was introduced for this com-
ponent. Starting 2018, the compensation for Management
Board members granted by Fresenius Management SE as
indicated in the Management Board contracts will include
caps by specific amount for each individual variable com-
pensation component and thus for overall compensation.
The compensation promised by the Fresenius Manage-
ment Board as of FY 2018 will thus fully meet the Code
recommendation.
▶ Code number 4.2.3 paragraph 4:
Severance payment cap
Pursuant to Code number 4.2.3 paragraph 4, when con-
tracts are entered into with Management Board mem-
bers, it shall be ensured that payments, including fringe
benefits, made to a Management Board member due to
early termination of their contract do not exceed twice the
annual remuneration (severance cap) and do not consti-
tute remuneration for more than the remaining term of the
employment contract. If the employment contract of a
Management Board member is terminated for good cause
for which the Management Board member is responsible,
no payments will be made to that Management Board
member. The severance cap shall be calculated on the
basis of the total remuneration paid for the previous
financial year and, if appropriate, shall take into account
the expected total remuneration for the current fiscal year.
This recommendation was not complied with until
the end of FY 2017 as uniform severance payment arrange-
ments of this kind contradict the concept practiced by
Fresenius in accordance with the German Stock Corpo-
ration Act (Aktiengesetz), according to which service
agreements of the members of the Management Board
are, in principle, concluded for the duration of their
appointment. The employment contracts of Fresenius
Management SE with the Management Board members
were adjusted and contain a severance payment cap
effective as of FY 2018. The Code recommendation will
thus be met as of FY 2018.
▶ Code number 4.2.5 paragraph 3:
Presentation in the compensation report
Pursuant to Code number 4.2.5 paragraph 3, the presenta-
tion of the compensation for each individual member of
the Management Board in the compensation report shall
include information on the maximum and minimum
achievable compensation for variable compensation com-
ponents by using model tables.
This recommendation was not met in view of the
compensation that was promised to the members of the
Management Board for the fiscal years through 2017 as
until that point in time, no caps by specific amount had
been set for the variable compensation components and
thus the overall compensation.
As already explained with regards to Code number
4.2.3 paragraph 2 sentence 6, caps by specific amount
exist for compensation granted to the Management Board
members by Fresenius Management SE as of FY 2018
for each individual variable compensation component and
thus for the overall compensation. This meets the Code
recommendation for the compensation granted to the Man-
agement Board members by Fresenius Management SE as
of FY 2018.
Cor
pora
te G
over
nanc
e
Corporate Governance Corporate Governance Declaration 143
▶ Code number 5.1.2 paragraph 2 sentence 3:
Age limit of Management Board members
Pursuant to Code number 5.1.2 paragraph 2 sentence 3,
an age limit shall be specified for the members of the
Management Board.
As in the past, Fresenius will refrain from specifying
an age limit for Management Board members. Following
this recommendation would unduly limit the selection of
qualified candidates.
▶ Code number 5.4.1 paragraph 2 and paragraph 4:
Specification of concrete objectives regarding the
composition of the Supervisory Board, preparation of
a profile of skills and expertise and their consideration
when making election proposals
Pursuant to Code number 5.4.1 paragraph 2 and paragraph
4, the Supervisory Board shall specify specific goals for
its composition and prepare a competency profile for the
entire Board. The targets shall be considered when mak-
ing election proposals to the Annual General Meeting and
at the same time aim to fulfill the competency profile for
the entire Board. The status of the implementation shall
be published in the Corporate Governance Report.
The Supervisory Board has specified concrete goals for
its composition and has prepared a competency profile
for the entire Board. In the interest of the company and to
avoid unduly limiting the selection of qualified candi-
dates, it has refrained from specifying an age limit and a
regular limit for a member’s tenure. Instead, the Supervi-
sory Board should also consist of members with long-term
experience and thus individuals who are generally older.
The balanced ratio of Supervisory Board members of
various ages and with varying tenures is crucial. With this
exception, the recommendations pursuant to Code num-
ber 5.4.1 paragraph 2 and paragraph 4 are met.
▶ Code number 5.4.6 paragraph 2 sentence 2:
A Performance-related compensation of the members
of the Supervisory Board oriented toward sustainable
growth of the enterprise
Pursuant to code number 5.4.6 paragraph 2 sentence 2, a
performance-related compensation component, if prom-
ised to the Supervisory Board members, shall be oriented
toward the sustainable growth of the enterprise.
For the last time in FY 2017, the members of the
Supervisory Board received variable compensation that
did not have a multi-year calculation basis and therefore
was not oriented toward the sustainable growth of the
enterprise within the meaning of the Code. On the con-
trary, it was linked to the dividend.
On May 12, 2017 the Annual General Meeting of
Fresenius SE & Co. KGaA adopted a Supervisory Board com-
pensation system that meets the recommendation of the
Code. This compensation system applied for the first time
in FY 2018. This Code recommendation will thus be met
as of FY 2018.
Bad Homburg v. d. H., December 2018
Management Board of the General Partner of
Fresenius SE & Co. KGaA, of Fresenius Management SE,
and Supervisory Board of Fresenius SE & Co. KGaA”
In accordance with Section 161 para. 2 AktG and number
3.10 sentence 3 of the Code, this declaration and
all past decla rations are published on our website, see
www.fresenius.com/corporate-governance.

Corporate G
overnance
Corporate Governance144
FURTHER INFORMATION ON
CORPORATE GOVERNANCE
DIVERSITYThe Management Board takes diversity into account when
filling executive positions. At Fresenius, the individual’s qual-
ifications are the paramount consideration in all hiring and
promotion decisions. This means that women and men with
comparable qualifications and suitability have the same
career opportunities. Fresenius will continue to consistently
act upon this principle, and will of course comply with the
law on the equal participation of women and men in executive
positions in private companies and the public service:
For the Supervisory Board of Fresenius SE & Co. KGaA,
the law requires a quota of at least 30% women and 30%
men. These mandatory quotas were met by the Supervisory
Board elections in 2016.
The legally stipulated targets for the Management Board
do not apply to Fresenius Management SE or to Fresenius
SE & Co. KGaA. Due to its legal form, Fresenius SE & Co. KGaA
does not have a Management Board. Fresenius Manage-
ment SE is not listed on the stock exchange and is also not
subject to codetermination.
In accordance with the legal requirements, the Manage-
ment Board specifies composition of the two management
levels directly below the Management Board as follows:
The first management level includes all Senior Vice Pres-
idents and Vice Presidents who have an employment con-
tract with Fresenius SE & Co. KGaA and who report directly to
a Member of the Management Board. Through a decision
effective January 1, 2016, the Management Board has set a
target, which has to be met by December 31, 2020, and calls
for a proportion of women of 33.3% at the first management
level. This target corresponds with the proportion as of
December 31, 2015.
The second management level includes all Vice Presidents
who have an employment contract with Fresenius SE &
Co. KGaA and who report directly to a member of the first man-
agement level. Through the decision effective January 1,
2016, the Management Board has set a target, which has to
be met by December 31, 2020, and calls for a proportion of
women of 37.5% at the second management level. This target
corresponds with the proportion as of December 31, 2015.
The Management Board believes that inclusion in the company-
wide long-term incentive programs is a strong indicator that
an individual holds a leading executive position. The propor-
tion of women in this group of our top 1,400 executives was
30.3% as of December 31, 2018.
Further information on diversity as well as personnel
development and personnel management are included in the
Group Management Report on page 46 f. and in the Group
Non-financial Report on pages 113 ff.
LEGAL RELATIONSHIPS WITH MEMBERS OF THE CORPORATE BODIESThe general partner and the Supervisory Board of Fresenius
SE & Co. KGaA have a duty to act in the best interests of the
Company. In performing their activities, they do not pursue
personal interests or bestow unjustified benefits on others.
Any sideline activities or transactions with the Company by
members of the corporate bodies must be reported to, and
approved by, the Supervisory Board. The Supervisory Board
of Fresenius SE & Co. KGaA reports to the AGM on any con-
flicts of interest and how they are dealt with.
Fresenius SE & Co. KGaA reports the following relation-
ships existing between Fresenius Group companies and
companies in which members of the Supervisory Board of
Fresenius SE & Co. KGaA or members of the Supervisory
or Management Board of Fresenius Management SE held an
executive or other function in 2018:
Prof. Dr. med. D. Michael Albrecht is a member of the
Supervisory Board of Fresenius SE & Co. KGaA and medical
director and spokesman for the management board of the
University Hospital Carl Gustav Carus Dresden, as well as a
member of the supervisory board of the University Hospital
in Aachen. The Fresenius Group maintains business relations
with these hospitals in the ordinary course of business under
customary conditions. Klaus-Peter Müller is a member of the
Supervisory Boards of Fresenius Management SE and of
Fresenius SE & Co. KGaA and was Chairman of the Supervisory

Cor
pora
te G
over
nanc
e
Corporate Governance Further information on Corporate Governance 145
Board of Commerzbank AG until May 8, 2018, with which the
Fresenius Group maintains business relationships under
customary conditions. Michael Diekmann is a member of the
Supervisory Board of Fresenius Management SE and Deputy
Chairman of the Supervisory Board of Fresenius SE & Co. KGaA,
and is Chairman of the Supervisory Board of Allianz SE. In
2018, the Fresenius Group paid insurance premiums to Allianz
under customary conditions.
There are no other consulting or service contracts –
neither directly nor indirectly – between Supervisory Board
members and the Company.
Fresenius has disclosed the information on related parties
in its 2018 quarterly reports and on page 258 of the Annual
Report.
DISCLOSURES ON DIRECTORS’ DEALINGS/MANAGERS’ TRANSACTIONS AND SHAREHOLDINGS IN 2018According to the provisions of Art. 19 Market Abuse Regu-
lation (MAR) regarding managers’ transactions, persons
discharging managerial responsibilities, as well as persons
closely asso ciated with them, shall notify of transactions
conducted on their own account relating to the shares or debt
instruments of Fresenius SE & Co. KGaA or to derivatives or
other financial instruments linked thereto.
Managers’ transactions in 2018 are disclosed on our web-
site at www.fresenius.com/corporate-governance.
None of the Management or Supervisory Board members
of the general partner or of the Supervisory Board of Fresenius
SE & Co. KGaA directly or indirectly holds more than 1%
of the shares issued by Fresenius or any related financial
instruments.
The members of the Management and Supervisory Boards
of Fresenius Management SE and the members of the Super-
visory Board of Fresenius SE & Co. KGaA together hold 0.30%
of the shares of Fresenius SE & Co. KGaA outstanding as of
December 31, 2018, in the form of shares or related financial
instruments and stock options under the Fresenius SE &
Co. KGaA stock option plans. 0.28% are held by members of
the Management Board of Fresenius Management SE,
0.02% by members of the Supervisory Board of Fresenius
Management SE, and 0.01% by members of the Supervisory
Board of Fresenius SE & Co. KGaA. Due to the fact that some
persons are members of both Supervisory Boards, the
amount of shares or related financial instruments and stock
options held by the Boards of Fresenius SE & Co. KGaA and
Fresenius Management SE in total can be smaller than the
cumulative holdings of the three Boards as reported herein.
There were no notifications that the shareholdings of
members of the Management and Supervisory Boards had
reached, exceeded, or fallen below the reporting thresholds
stipulated in the German Securities Trading Act.
TRANSPARENCY AND COMMUNICATIONFresenius adheres to all recommendations under number 6 of
the Code. Transparency is guaranteed by continuous com-
munication with the public. In that way we are able to validate
and deepen the trust given to us. Of particular importance
to us is the equal treatment of all recipients. To ensure that
all market participants receive the same information at the
same time, we post all important publications on our website
at www.fresenius.com. We report in detail on investor rela-
tions activities on page 35 of the Annual Report.
FINANCIAL ACCOUNTING AND REPORTINGFresenius, as a publicly traded company based in a member
country of the European Union, has to prepare and publish
its consolidated financial statements, as required, in accord-
ance with International Financial Reporting Standards
(IFRS) pursuant to Section 315e of the German Commercial
Code (HGB).
The leading auditor Thomas Rodemer, KPMG AG Wirt-
schafts prüfungsgesellschaft, has been responsible for the audit
of the consolidated financial statements since 2018.

Corporate G
overnance
Corporate Governance146
COMPENSATION REPORTThe compensation report summarizes the main elements of the
compensation system for the members of the Management
Board of Fresenius Management SE as the general partner of
Fresenius SE & Co. KGaA, and in this regard notably explains
the amounts and structure of the compensation paid to the
Management Board as well as the principles for determining
the compensation of the Supervisory Board and the amounts
of the compensation. The compensation report is part of the
Management Report of the annual financial statements and
the annual consolidated financial statements of Fresenius SE &
Co. KGaA. The compensation report is prepared on the basis
of the recommendations of the German Corporate Governance
Code as well as under consideration of the declaration of
conformity of Fresenius SE & Co. KGaA of December 2018, and
also includes the disclosures as required pursuant to the
applicable statutory regulations, notably in accordance with
the German Commercial Code.
COMPENSATION OF THE MANAGEMENT BOARD
The Supervisory Board of Fresenius Management SE is
responsible for determining the compensation of the Man-
agement Board. The Supervisory Board is assisted in this
task by a personnel committee which is also responsible for
the tasks of a compensation committee. The personnel
committee of Fresenius Management SE was composed of
Dr. Gerd Krick, Dr. Dieter Schenk, and Dr. Karl Schneider.
The Annual General Meeting of Fresenius SE & Co. KGaA
approved the compensation system for the members of the
Management Board of the general partner on May 18, 2018
with an approval rate of approximately 63%. In this con-
text, the shareholders’ suggestions for changes related to the
discretionary bonus and the structure of the short-term
performance-based compensation (bonus). In response to
this, the discretionary bonus – as described in this compen-
sation report – was abolished as of the 2019 fiscal year. The
short-term performance-based compensation (bonus) for
each future service agreement to be extended or newly con-
cluded for a member of the Management Board of the gene -
ral partner will be subject to discussion in the Supervisory
Board. The next Annual General Meeting vote on the com-
pensation system is planned for the Annual General Meeting
in 2020.
The objective of the compensation system is to enable the
members of the Management Board to participate reason-
ably in the sustainable development of the company’s business
and to reward them based on their duties and performance
as well as their successes in managing the company’s eco-
nomic and financial position, giving due regard to the peer
environment.
The compensation of the Management Board is, as a
whole, performance-based and geared towards promoting
sustainable corporate development. It is composed of three
elements:
▶ Non-performance-based compensation (fixed compensa-
tion and fringe benefits)
▶ Short-term performance-based compensation (one-year
variable compensation (bonus))
▶ Components with long-term incentive effects (multi-year
variable compensation comprising performance shares
(instead of stock options and share-based compensation
with cash settlement (phantom stocks) granted hitherto),
and postponed payments of the one-year variable compen-
sation / of the bonus)
In addition, there are pension commitments for the members
of the Management Board.
The design of the individual elements is based on the
following criteria:
COMPENSATION ELEMENTS
Non-performance-based compensation
Performance-based compensation
Fixed compensation
Fringe benefits
Short-term
Long-term
Bonus
Postponed payment of the bonus
Long Term Incentive Plan 2018

Cor
pora
te G
over
nanc
e
Corporate Governance Further information on Corporate Governance 147
the case of the members of the Management Board with
functional responsibility for the entire Group – such members
being Mr. Stephan Sturm, Ms. Rachel Empey, and Dr. Jürgen
Götz – the amount of the one-year variable compensation is
based in its entirety on the respective net income attributable
to Fresenius SE & Co. KGaA (after deduction of noncontrolling
interest). For Mr. Mats Henriksson and Dr. Francesco De Meo,
approximately half of the amount of the one-year variable
compensation depends on the development of the net income
attributable to Fresenius SE & Co. KGaA and for the remainder
on the development of the net income of the business seg-
ment (in each case after deduction of noncontrolling interest)
for which the respective member of the Management Board is
responsible. Approximately half of the amount of the one-
year variable compensation of Dr. Ernst Wastler is oriented on
the net income attributable to Fresenius SE & Co. KGaA (after
deduction of non controlling interest), as well as on the net
income before tax and extraordinary income / expenditures of
the VAMED Group. Mr. Rice Powell receives his compensation
exclusively from Fresenius Medical Care. Furthermore, the
Supervisory Board could grant members of the Management
Board a discretionary bonus for extraordinary performance.
Until fiscal year 2018, the service agreements of the Manage-
ment Board members with Fresenius Management SE pro-
vided that the total compensation granted to a Management
Board member including a possible discretionary bonus shall
not exceed the sum of the fixed compensation and the maxi-
mum amounts for the variable compensation components
(one-year variable and multi-year variable compensation).
During fiscal year 2018, no discretionary bonus was granted.
Starting fiscal year 2019, the service agreements of the
Management Board members with Fresenius Management SE
no longer provide the granting of a discretionary bonus.
The fixed compensation was generally paid in monthly install-
ments in the fiscal year 2018. Mr. Rice Powell was paid a
part of his fixed compensation from Fresenius Medical Care
North America in 24 installments. Moreover, the members
of the Management Board received fringe benefits. These con-
sisted mainly of insurance premiums, the private use of a
company car, special payments such as rent supplements and
reimbursement of certain other charges, tuition fees, and
costs for the operation of intrusion detection systems, as well
as contributions to pension and health insurance.
The performance-based compensation will be granted for
the fiscal year 2018 as a short-term cash component (one-
year variable compensation) and as compensation components
with long-term incentive effects (performance shares and
postponed payments of the one-year variable compensation).
Mr. Stephan Sturm has agreed with the Supervisory Board of
Fresenius Management SE to acquire shares of the company
in the value of the net amount of the one-year variable com-
pensation paid to him and to hold them for at least three
years. Thereby, the orientation of his compensation towards
sustainable corporate development is enhanced voluntarily.
In order to appropriately take into account the business
development of Fresenius Medical Care during the fiscal
year, Mr. Rice Powell has agreed to acquire shares in Fresenius
Medical Care AG & Co. KGaA for a portion of the bonus and
to hold them for at least three years.
The amount of the one-year variable compensation in
each case is dependent on certain target parameters oriented
on the net income attributable to Fresenius SE & Co. KGaA
and / or to the relevant business segments being achieved. In
PERFORMANCE-BASED COMPENSATION
Short-term Bonus
Postponed payments of the bonus
LTIP 2018
Long-term
▶ �Annual cash payment after the end of the fiscal year▶ ��Depending on the achievement of certain target parameters based on the net income attributable to
Fresenius SE & Co. KGaA or the relevant business segments
▶ �The maturity of the one-year variable compensation can be postponed by two years.
▶ ��Payment only if (i) no subsequent adjustment is made to the relevant consolidated net income outside a tolerance range and (ii) the consolidated net income in the two relevant years is not significantly lower than the consolidated net income in the respective preceding years.
▶ �Performance Share Plan with a vesting period of four years and cash payment
▶ �Two performance targets: growth rate of adjusted net income and relative total shareholder return based on the STOXX Europe 600 Health Care Index
▶ ��Overall target achievement: 0 – 200%

Corporate G
overnance
Corporate Governance148
In the fiscal year 2018, the one-year variable compensation,
excluding the payment to Mr. Rice Powell, amounted to € 7,333
thousand. This equals 98% of the total one-year variable
compensation. The remaining part in an amount of € 171 thou-
sand was converted into a component based on a multi-year
assessment and the payment was postponed by two years.
To ensure that the overall system of compensation of the
members of the Management Board is oriented towards long-
term and sustained corporate development, the compensation
system provides that the share of long-term variable com-
pensation components is at least equal in its amount to half
of the total variable compensation components granted to
the respective member of the Management Board. As a means
of ensuring this minimum ratio in favor of the compensation
components oriented towards the long term, it is expressly
provided that the Supervisory Board may determine that the
one-year variable compensation to be paid as a rule annually is
converted (pro rata) into a variable compensation com ponent
based on a multi-year assessment, in order to also take account
of any negative developments within the performance period.
This is done in such a way that the maturity of the yearly one-
year variable compensation earned on a variable basis is
postponed at the discretion of the Supervisory Board, either
on a pro rata basis or in its entirety, by two years. At the
same time, it is ensured that any payment is made to the
member of the Management Board after expiration of such
multi-year period only if (i) no subsequent adjustment of
the net income (adjusted for extraordinary effects) attributable
to Fresenius SE & Co. KGaA (after deduction of noncontrolling
interest) decisive for assessing the one-year variable compen-
sation beyond an amount equal to a tolerance range of 10%
is made, and (ii) the amount of net income attributable to
Fresenius SE & Co. KGaA (adjusted for extraordinary effects)
in the two relevant sub sequent years is not substantially less
than the net income attributable to Fresenius SE & Co. KGaA
(adjusted for extra ordinary effects, after deduction of non-
controlling interest) of the respective preceding fiscal years.
In the event of the aforementioned conditions for payment
being missed only to a minor and / or partial extent, the Super-
visory Board may resolve on a corresponding pro rata pay-
ment of the converted portion of the one-year variable com-
pensation. No interest is payable on the converted one-year
variable compensation claim from the time when it first arises
until the time of its effective payment. In this way, the one-
year variable compensation can be converted pro rata or in
its entirety into a genuine variable compensation component
on a multi-year assessment basis, which also participates in
any negative developments during the relevant performance
period.
For the fiscal years 2018 and 2017, the amount of cash payment to the Management Board of the general partner of
Fresenius SE & Co. KGaA consisted of the following:
Non-performance-basedcompensation
Short-term performance-based
compensation
Cash compensation(without long-term
incentive components)
Fixed compensation Fringe benefits 2 Bonus
€ in thousands 2018 2017 2018 2017 2018 2017 2018 2017
Stephan Sturm 1,100 1,100 102 79 1,868 3 1,866 3,070 3,045
Dr. Francesco De Meo 630 630 25 24 1,415 1,412 2,070 2,066
Rachel Empey (since August 1, 2017) 600 250 231 16 812 338 1,643 604
Dr. Jürgen Götz 490 490 41 41 950 950 1,481 1,481
Mats Henriksson 660 630 107 157 1,356 1,250 2,123 2,037
Rice Powell 1 1,270 1,217 195 173 2,376 4 2,297 3,841 3,687
Dr. Ernst Wastler 525 525 75 75 932 858 1,532 1,458
Total 5,275 4,842 776 565 9,709 8,971 15,760 14,378
1 Mr. Rice Powell received his compensation only from Fresenius Medical Care, of which Fresenius SE & Co. KGaA held around 30.75% of the total subscribed capital. As a member of the Management Board of Fresenius Management SE, his compensation has to be included in the compensation report of the Fresenius Group.
2 Includes insurance premiums, private use of a company car, contributions to pension and health insurance, as well as other benefits. As compensation for long-term incentives from her former employer that were forfeited due to her change to Fresenius, Ms. Rachel Empey receives a fixed, additional special payment of € 166,667 for each full year of service, limited to three such payments.
3 Mr. Stephan Sturm has agreed with the Supervisory Board of Fresenius Management SE to acquire shares of the company in the value of the net amount of the one-year variable compensation paid to him and to hold them for at least three years. Thereby, the orientation of his compensation towards sustainable corporate development is enhanced voluntarily.
4 In order to appropriately take into account the business development of Fresenius Medical Care during the fiscal year, Mr. Rice Powell has agreed to acquire shares in Fresenius Medical Care AG & Co. KGaA for a portion of the bonus and to hold them for at least three years.

Cor
pora
te G
over
nanc
e
Corporate Governance Further information on Corporate Governance 149
In the fiscal year 2018, as a further component with long-
term incentive effect, the Management Board members were
granted performance shares under the new Fresenius SE &
Co. KGaA Long Term Incentive Plan 2018 (LTIP 2018). Mr. Rice
Powell was granted performance shares under the Long
Term Incentive Plan 2016 (LTIP 2016) of Fresenius Medical
Care AG & Co. KGaA. Based on the LTIP 2018, both members
of the Management Board and other executives were granted
performance shares. In accordance with the division of pow-
ers under stock corporation law, grants to members of the
Management Board were made by the Supervisory Board of
Fresenius Management SE, and grants to other executives
were made by the Management Board. The number of per-
formance shares for Management Board members to be
granted was determined by the Supervisory Board at the
Supervisory Board’s own due discretion, provided that gener-
ally all Management Board members received the same
amount of performance shares, with the exception of the Chair-
man of the Management Board, who received approximately
double the respective amount of performance shares.
The vesting of the performance shares granted under
the LTIP 2018 is subject to several conditions, such as the
expiration of a four-year performance period, the absence of
a compliance violation, the achievement or exceeding of two
performance targets and the continuation of the service or
employment relationship. The number of performance shares
may change over a period of four years, depending on the
level of achievement of the performance targets. This could
entail the entire loss of all performance shares or also – at
maximum – the doubling of their number.
The LTIP 2018 has two equally weighted performance
targets: firstly, the growth rate of the adjusted net income
(adjusted for currency effects) and, secondly, the relative Total
Shareholder Return based on the STOXX Europe 600 Health
Care Index. Disbursement entitlement requires that at least one
of the two performance targets must be reached or surpassed
over the four-year performance period.
For the performance target “Net Income Growth Rate”,
a level of target achievement of 100% is reached when the
same is at least 8% p. a. over the four-year performance
period. If the growth rate falls below or corresponds to only
5% p. a., the level of target achievement is 0%. If the growth
rate is between 5% p. a. and 8% p. a., the level of target
achievement is between 0% and 100%, while, where the
growth rate is between 8% p. a. and 20% p. a., the level of
target achievement will be between 100% and 200%. Inter-
mediate values are calculated through linear interpolation.
The following table shows the degree of target achievement
between the threshold of 5% p. a. and the limit of 20% p. a.
For the “Total Shareholder Return” performance target, a tar-
get achievement of 100% is met when the Total Shareholder
Return of Fresenius SE & Co. KGaA in comparison with the
Total Shareholder Return of the other companies of the STOXX
Europe 600 Health Care Index achieves an average ranking
within the benchmark companies, i. e., exactly in the middle
(50th percentile), over the four-year performance period. If
the ranking corresponds to the 25th percentile or less, the level
of target achievement is 0%. Where the ranking is between
the 25th percentile and the 50th percentile, the level of target
achievement is between 0% and 100%; and, for a ranking
between the 50th percentile and the 75th percentile, between
100% and 200%. Intermediate values will also be calculated
through linear interpolation.
The degree of target achievement between the threshold
at the 25th percentile and the limit at the 75th percentile is
presented in the following table.
GROWTH RATE OF
ADJUSTED GROUP NET INCOME
ADJUSTED FOR CURRENCY EFFECTS
0% 2% 4% 6% 8% 10% 12% 14% 16% 18% 20%
0%
20%
40%
60%
80%
100%
120%
140%
160%
180%
200%
Target achievement
Growth rate of adjusted Group net income adjusted for currency effects
Target value: 8%
Threshold: 5%
Limit: 20%

Corporate G
overnance
Corporate Governance150
Until the end of the fiscal year 2017, benefits under LTIP
2013 of Fresenius SE & Co. KGaA were granted as another
component with long-term incentive effect, which resulted in
an inflow in the 2018 fiscal year and may result in an inflow
in the future. The benefits consisted, on the one hand, of
share-based compensation with cash settlement (phantom
stocks) and on the other hand of stock options on the basis
of the Stock Option Plan 2013 of Fresenius SE & Co. KGaA.
Based on the LTIP 2013, both members of the Management
Board and other executives were granted stock options and
phantom stocks. In accordance with the division of powers
under stock corporation law, grants to members of the Man-
agement Board were made by the Supervisory Board of
Fresenius Management SE, and grants to other executives
were made by the Management Board. The number of stock
options and phantom stocks for Management Board mem-
bers to be granted was determined by the Supervisory Board
at the Supervisory Board’s own due discretion, provided that
generally all Management Board members received the same
amount of stock options and phantom stocks, with the excep-
tion of the Chairman of the Management Board, who received
double the respective amount of stock options and phantom
stocks. At the time of the grant, the participants in LTIP 2013
had the right to elect whether they wished to receive stock
options and phantom stocks in a ratio of 75 : 25, or in a ratio
of 50 : 50.
Exercise of the stock options and the phantom stocks
granted under LTIP 2013 of Fresenius SE & Co. KGaA is sub-
ject to several conditions, such as expiry of a four-year
waiting period, observance of blackout periods, achievement
of the specified performance target, and continuance of the
service or employment relationship. The vested stock options
can be exercised within a period of four years. The vested
phantom stocks are settled on March 1 of the year following
the end of the waiting period.
The amount of the cash settlement pursuant to the Phan-
tom Stock Plan 2013 is based on the volume-weighted aver-
age market price of the share of Fresenius SE & Co. KGaA
during the three months preceding the exercise date.
The respective performance target has been reached if
the adjusted consolidated net income of the company (net
income attributable to the shareholders of the company) has
increased by a minimum of 8% per year in com parison to
the previous year within the waiting period, after adjustment
for foreign currency effects. The performance target has
also been achieved if the average annual growth rate of the
adjusted consolidated net income of the company during the
four-year waiting period is at least 8%, adjusted for foreign
RELATIVE TOTAL SHAREHOLDER RETURN
(STOXX EUROPE 600 HEALTH CARE)
0% 25% 50% 75% 100%
0%
20%
40%
60%
80%
100%
120%
140%
160%
180%
200%
Target achievement
rTSR
Target value: linear increase,
i. e., 50th percentile
Threshold: 25th percentile
Limit: 75th percentile
Total Shareholder Return denotes the percentage change in
the stock market price within the performance period includ-
ing reinvested dividends and all capital measures, whereby
capital measures are to be calculated through rounding down
to the fourth decimal place.
To calculate the level of overall target achievement, the
level of target achievement of the two performance targets
are given equal weighting. The total number of performance
shares vested on each plan participant is calculated through
multiplying the number of performance shares granted by the
overall target achievement. Four years after the grant, the
vested performance shares will be paid out in cash. The num-
ber of vested performance shares is then multiplied by the
average stock exchange price of Fresenius SE & Co. KGaA’s
share over a period of 60 stock exchange trading days prior
to the lapse of this vesting period plus the total of the divi-
dends per share of Fresenius SE & Co. KGaA paid by Fresenius
SE & Co. KGaA between the grant date and the vesting date.
The possible disbursement entitlement of a Management Board
member is limited to a maximum of 250% of the grant value
(cap).
In the event of violation of compliance rules, the Supervi-
sory Board, in due exercise of its discretion, is entitled to
reduce the number of performance shares vested on a member
of the Management Board to zero. Furthermore, Fresenius
SE & Co. KGaA is entitled to a complete or partial reimburse-
ment in the event of violation of compliance rules in the
period of three years following disbursement.
If a member of the Management Board leaves the com-
pany, the performance shares are forfeited as a matter of
principle.

Cor
pora
te G
over
nanc
e
Corporate Governance Further information on Corporate Governance 151
currency effects. If, with respect to one or more of the four ref-
erence periods within the waiting period, neither the adjusted
consolidated net income of the company has increased by a
minimum of 8% per year in comparison to the previous year,
after adjustment for foreign currency effects, nor the average
annual growth rate of the adjusted consolidated net income
of the company during the four-year waiting period is at least
8%, adjusted for foreign currency effects, the respective
granted stock options and phantom stocks are forfeited on a
pro-rata basis according to the proportion of the performance
target that has not been achieved within the waiting period,
i. e., by one fourth, by two fourths, by three fourths, or com-
pletely. If a member of the Management Board leaves the com-
pany, the stock options and phantom stocks are forfeited as
a matter of principle.
The principles of the LTIP 2018 and the LTIP 2013 of
Fresenius SE & Co. KGaA and of the LTIP 2016 of Fresenius
Medical Care AG & Co. KGaA are described in more detail
in note 34 of the notes of the Fresenius Group, Share-based
compensation plans.
Furthermore, through fiscal year 2017, the members of
the Management Board, with the exception of Ms. Rachel
Empey and Mr. Rice Powell, were granted an entitlement to
further share-based compensation with cash settlement
( further phantom stocks) in the equivalent value of € 100
thousand per Management Board member. With regard to the
performance tar get and waiting period, the same conditions
that pertain to the phantom stocks granted under LTIP 2013
apply to them.
For the fiscal years 2018 and 2017, the value of perfor-
mance shares issued, i. e., for the year 2017 the value of stock
options and phantom stocks issued and the value of the post-
poned performance-based compensation, is shown in the
following table.
The stated values for the year 2018 correspond to the fair
value of the performance shares at the time of grant, namely
a value of € 67.45 per performance share of Fresenius SE &
Co. KGaA and a value of US$ 94.11 per performance share of
Fresenius Medical Care AG & Co. KGaA (2017: € 12.59 per
stock option of Fresenius SE & Co. KGaA and € 10.61 per stock
option granted to Ms. Rachel Empey 1; exercise price of the
granted stock options of Fresenius SE & Co. KGaA was € 74.77
and € 64.69 for stock options granted to Ms. Rachel Empey;
fair value of phantom stocks granted to members of the Man-
agement Board in the fiscal year 2017: € 68.21, € 59.37 with
regard to phantom stocks granted to Ms. Rachel Empey, and
US$ 86.39 per performance share of Fresenius Medical
Care AG & Co. KGaA).
LONG-TERM INCENTIVE COMPONENTS
Performance shares 1 Phantom stocks 2
Postponed payment of the
one-year variable compensation Stock options 3 Total
Value, € in thousands Value, € in thousands Value, € in thousands Value, € in thousands
2018 2017 2018 2017 2018 2017 2018 2017 2018 2017
Stephan Sturm 2,500 n. a. n. a. 728 0 0 n. a. 1,700 2,500 2,428
Dr. Francesco De Meo 1,300 n. a. n. a. 414 115 148 n. a. 850 1,415 1,412
Rachel Empey (since August 1, 2017) 1,300 n. a. n. a. 109 0 0 n. a. 298 1,300 407
Dr. Jürgen Götz 1,300 n. a. n. a. 414 0 0 n. a. 850 1,300 1,264
Mats Henriksson 1,300 n. a. n. a. 414 56 0 n. a. 850 1,356 1,264
Rice Powell 2,391 n. a. n. a. 2,247 0 0 n. a. 0 2,391 2,247
Dr. Ernst Wastler 1,300 n. a. n. a. 414 0 0 n. a. 850 1,300 1,264
Total 11,391 n. a. n. a. 4,740 171 148 n. a. 5,398 11,562 10,286
1 The amounts comprise all performance shares including performance shares of Fresenius Medical Care AG & Co. KGaA that were granted in 2018.2 The amounts comprise all phantom stocks including performance shares of Fresenius Medical Care AG & Co. KGaA that were granted in 2017.3 Stock options that were granted in 2017 under the Fresenius SE & Co. KGaA stock option plan.
At the end of the fiscal year 2018, the members of the Man-
agement Board held a total of 133,434 performance shares
(2017: 0) and 211,302 phantom stocks (2017: 285,057) of
Fresenius SE & Co. KGaA and 55,463 performance shares
(2017: 37,915) and 15,586 (2017: 16,888) phantom stocks
of Fresenius Medical Care AG & Co. KGaA. Furthermore, they
held a total of 1,519,515 (2017: 1,612,515) stock options
of Fresenius SE & Co. KGaA as well as 256,781 stock options
(2017: 284,793) of Fresenius Medical Care AG & Co. KGaA.
1 As Ms. Rachel Empey was only appointed as Management Board member of Fresenius Management SE effective August 1, 2017, she was granted stock options and phantom stocks only in December 2017 and not in July 2017 like the other Management Board members. The different amounts result from this fact.

Corporate G
overnance
Corporate Governance152
The development and the status of the stock options of the Management Board in the fiscal year 2018
are shown in the following table:
StephanSturm
Dr. FrancescoDe Meo
Rachel Empey
Dr. JürgenGötz
MatsHenriksson
RicePowell 1
Dr. ErnstWastler Total 2
Options outstanding on January 1, 2018
Number 456,390 292,500 28,125 270,000 295,500 284,793 270,000 1,612,515
Average exercise price in € 54.52 57.26 64.69 56.97 51.27 64.73 56.97 55.42
Options exercised during the fiscal year
Number 0 45,000 0 0 48,000 28,012 0 93,000
Average exercise price in € 33.10 26.11 52.48 29.49
Average stock price in € 68.22 68.07 90.53 68.14
Options outstanding on December 31, 2018
Number 456,390 247,500 28,125 270,000 247,500 256,781 270,000 1,519,515
Average exercise price in € 54.52 61.65 64.69 56.97 56.15 66.06 56.97 57.01
Average remaining life in years 4.4 5.2 6.9 4.9 4.8 4.0 4.9 4.8
Range of exercise prices in €
26.11 to 74.77
36.92 to 74.77 64.69
33.10 to 74.77
33.10 to 74.77
49.76 to 76.99
33.10 to 74.77
26.11 to 74.77
Exercisable options on December 31, 2018
Number 175,140 45,000 0 90,000 90,000 107,381 90,000 490,140
Average exercise price in € 30.68 36.92 35.01 35.01 50.86 35.01 33.64
1 Mr. Rice Powell holds stock options under the Fresenius Medical Care Stock Option Plan 2011.2 Only stock options of Fresenius SE & Co. KGaA, excluding stock options of Mr. Rice Powell
The following table shows the total compensation of the Management Board of the general partner of
Fresenius SE & Co. KGaA for the years 2018 and 2017:
Cash compensation (without long-term
incentive components)Long-term
incentive components
Total compensation (including long-term
incentive components)
€ in thousands 2018 2017 2018 2017 2018 2017
Stephan Sturm 3,070 3,045 2,500 2,428 5,570 5,473
Dr. Francesco De Meo 2,070 2,066 1,415 1,412 3,485 3,478
Rachel Empey (since August 1, 2017) 1,643 604 1,300 407 2,943 1,011
Dr. Jürgen Götz 1,481 1,481 1,300 1,264 2,781 2,745
Mats Henriksson 2,123 2,037 1,356 1,264 3,479 3,301
Rice Powell 3,841 3,687 2,391 2,247 6,232 5,934
Dr. Ernst Wastler 1,532 1,458 1,300 1,264 2,832 2,722
Total 15,760 14,378 11,562 10,286 27,322 24,664
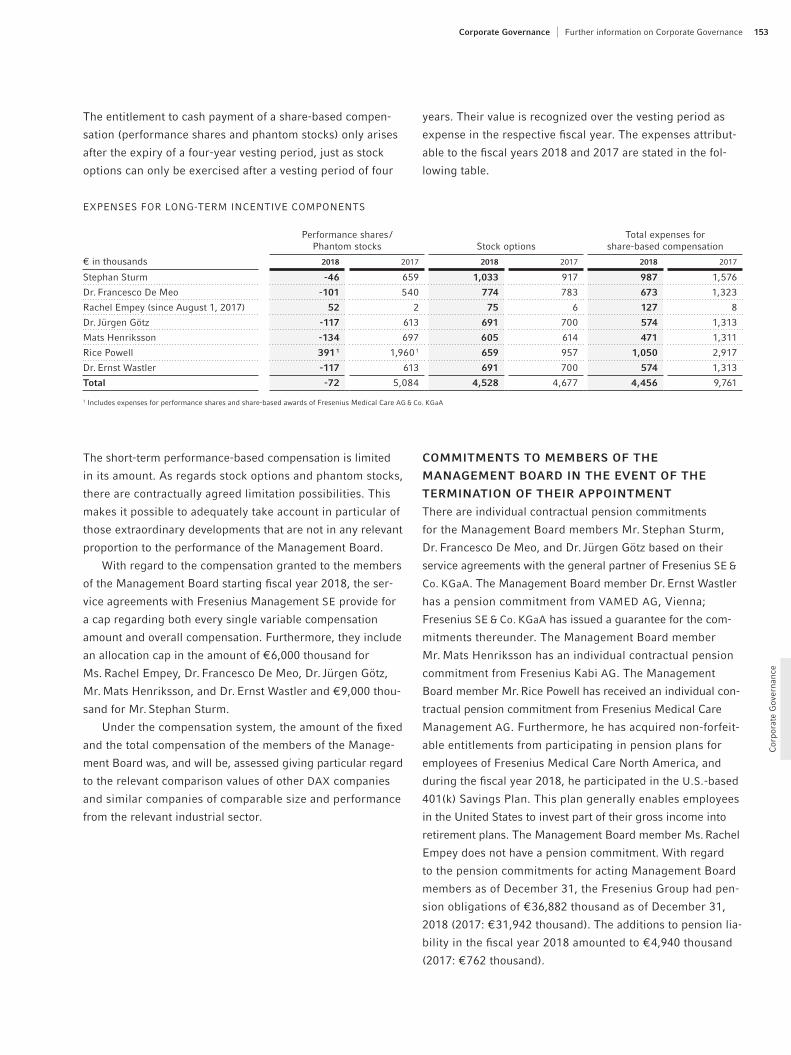
Cor
pora
te G
over
nanc
e
Corporate Governance Further information on Corporate Governance 153
The entitlement to cash payment of a share-based compen-
sation (performance shares and phantom stocks) only arises
after the expiry of a four-year vesting period, just as stock
options can only be exercised after a vesting period of four
years. Their value is recognized over the vesting period as
expense in the respective fiscal year. The expenses attribut-
able to the fiscal years 2018 and 2017 are stated in the fol-
lowing table.
EXPENSES FOR LONG-TERM INCENTIVE COMPONENTS
Performance shares / Phantom stocks Stock options
Total expenses for share-based compensation
€ in thousands 2018 2017 2018 2017 2018 2017
Stephan Sturm - 46 659 1,033 917 987 1,576
Dr. Francesco De Meo - 101 540 774 783 673 1,323
Rachel Empey (since August 1, 2017) 52 2 75 6 127 8
Dr. Jürgen Götz - 117 613 691 700 574 1,313
Mats Henriksson - 134 697 605 614 471 1,311
Rice Powell 391 1 1,960 1 659 957 1,050 2,917
Dr. Ernst Wastler - 117 613 691 700 574 1,313
Total - 72 5,084 4,528 4,677 4,456 9,761
1 Includes expenses for performance shares and share-based awards of Fresenius Medical Care AG & Co. KGaA
The short-term performance-based compensation is limited
in its amount. As regards stock options and phantom stocks,
there are contractually agreed limitation possibilities. This
makes it possible to adequately take account in particular of
those extraordinary developments that are not in any relevant
proportion to the performance of the Management Board.
With regard to the compensation granted to the members
of the Management Board starting fiscal year 2018, the ser-
vice agreements with Fresenius Management SE provide for
a cap regarding both every single variable compensation
amount and overall compensation. Furthermore, they include
an allocation cap in the amount of € 6,000 thousand for
Ms. Rachel Empey, Dr. Francesco De Meo, Dr. Jürgen Götz,
Mr. Mats Henriksson, and Dr. Ernst Wastler and € 9,000 thou-
sand for Mr. Stephan Sturm.
Under the compensation system, the amount of the fixed
and the total compensation of the members of the Manage-
ment Board was, and will be, assessed giving particular regard
to the relevant comparison values of other DAX companies
and similar companies of comparable size and performance
from the relevant industrial sector.
COMMITMENTS TO MEMBERS OF THE
MANAGEMENT BOARD IN THE EVENT OF THE
TERMINATION OF THEIR APPOINTMENT
There are individual contractual pension commitments
for the Management Board members Mr. Stephan Sturm,
Dr. Francesco De Meo, and Dr. Jürgen Götz based on their
serv ice agreements with the general partner of Fresenius SE &
Co. KGaA. The Management Board member Dr. Ernst Wastler
has a pension commitment from VAMED AG, Vienna;
Fresenius SE & Co. KGaA has issued a guarantee for the com-
mitments thereunder. The Management Board member
Mr. Mats Henriksson has an individual contractual pension
commitment from Fresenius Kabi AG. The Management
Board member Mr. Rice Powell has received an individual con-
tractual pension commitment from Fresenius Medical Care
Management AG. Furthermore, he has acquired non-forfeit-
able entitlements from participating in pension plans for
employees of Fresenius Medical Care North America, and
during the fiscal year 2018, he participated in the U.S.-based
401(k) Savings Plan. This plan generally enables employees
in the United States to invest part of their gross income into
retirement plans. The Management Board member Ms. Rachel
Empey does not have a pension commitment. With regard
to the pension commitments for acting Management Board
members as of December 31, the Fresenius Group had pen-
sion obligations of € 36,882 thousand as of December 31,
2018 (2017: € 31,942 thousand). The additions to pension lia-
bility in the fiscal year 2018 amounted to € 4,940 thousand
(2017: € 762 thousand).

Corporate G
overnance
Corporate Governance154
The pension commitments are as follows:
€ in thousandsAs of
January 1, 2018 AdditionsAs of
December 31, 2018
Stephan Sturm 5,866 652 6,518
Dr. Francesco De Meo 3,271 442 3,713
Rachel Empey (since August 1, 2017) 0 0 0
Dr. Jürgen Götz 2,796 462 3,258
Mats Henriksson 5,048 368 5,416
Rice Powell 10,004 2,936 12,940
Dr. Ernst Wastler 4,957 80 5,037
Total 31,942 4,940 36,882
Each of the pension commitments provides for a pension and
survivor benefit, depending on the amount of the most recent
fixed compensation, from the 63rd year of life (or 65th year
for Mr. Rice Powell), or, in the case of termination because of
professional or occupational incapacity, from the time of end-
ing active work. In deviation from this, Mr. Rice Powell has
this entitlement already upon reaching the age of 63 if he
has been a member of the Management Board of Fresenius
Medical Care Management AG for at least ten years at the time
of his final retirement from active employment; in this case,
the benefits are reduced by 0.5% per calendar month that he
leaves active employment before reaching the age of 65.
The pension’s starting percentage of 30% of the last fixed
compensation increases with every full year of service as a
Management Board member by 1.5 percentage points, 45%
being the attainable maximum.
Current pensions increase according to legal requirements
(Section 16 of the German law to improve company pension
plans, BetrAVG).
30% of the gross amount of any post-retirement income
from an occupation of the Management Board member is
offset against the pension for professional or occupational
incapacity.
In the event of the death of one of the Management
Board members, the widow receives a pension equivalent to
60% of the pension entitlement accruing at the time of death.
In addition, biological children of the deceased Management
Board member and / or, in individual cases, biological children
of the deceased Management Board member’s wife who
were adopted by the deceased Management Board member
as children, receive an orphan’s pension equiv alent to 20%
of the pension entitlement accruing at the time of death until
completion of their vocational training, but at the most until
the age of 25 years. However, all surviving dependents’ pen-
sions are capped at an aggregate 90% of the Management
Board member’s pension entitlement.
If a Management Board member’s service as a member
of the Management Board of Fresenius Management SE (or
Mr. Rice Powell as a member of the Management Board of
Fresenius Medical Care Management AG) ends before the age
of 63 years (or 65 years for Mr. Rice Powell) for reasons other
than professional or occupational incapacity, the rights to the
said pension ben efits vest, but the pension payable upon the
occurrence of a pensionable event is reduced pro rata accord-
ing to the actual length of service as a Management Board
member compared to the potential length of service until the
age of 63 years (or 65 years for Mr. Rice Powell).
The pension commitment for Dr. Ernst Wastler provides
for a normal pension, an early retirement pension, a profes-
sional incapacity pension, and a widow’s and orphan’s pen-
sion. The normal pension is payable at the earliest at the age
of 60 years and the early retirement pension at the earliest
at the age of 55 years. The pension benefits are equivalent to
1.2% per year of service based on the last fixed compensa-
tion, with a cap of 40%. The widow’s pension (60%) and the
orphan’s pension (20% each) are capped in aggregate at
not more than Dr. Ernst Wastler’s pension entitlement at the
time of death. Pensions, retirement, and other benefits from
third parties are set off against the pension benefit if the
credited periods of service overlap.
The Management Board member Mr. Mats Henriksson
has solely a pension commitment from Fresenius Kabi AG
from the period of his previous service. This pension commit-
ment remained unaffected by the service agreement with
Fresenius Management SE, beginning on January 1, 2013.
It is based on the pension policy of the Fresenius companies,
and provides for retirement, incapacity, and survivors’ pen-
sions. It does not set forth any deduction of other income or
pension benefits. The widow’s pension amounts to 60%
of the incapacity or retirement pension to be granted at the
time of death; the orphan’s pension amounts to 10% (half-
orphans) or 20% (orphans) of the incapacity or retirement

Cor
pora
te G
over
nanc
e
Corporate Governance Further information on Corporate Governance 155
pension to be granted at the time of death. The total entitle-
ments of widows and orphans are limited to 100% of Mr. Mats
Henriksson’s pension entitlements.
A post-employment non-competition covenant was agreed
upon for all Management Board members. If such a cove-
nant becomes applicable, the Management Board members
receive a waiting allowance that is generally equivalent to
half of the respective annual fixed compensation for each year
of respective application of the non-competition covenant,
up to a maximum of two years.
The service agreements of the Management Board mem-
bers do not contain any explicit provision for the event of a
change of control.
Payments in the event of premature termination of a
member’s services for the Management Board, including fringe
benefits, are limited to two years’ compensation, at maximum
no more than the compensation due for the remain ing term of
the respective service agreement (severance payment cap).
No severance payments will be due in the event of termi-
nation of the service agreement for cause on grounds attrib-
utable to the relevant member of the Management Board.
The calculation of the severance payment cap is based on the
total compensation within the meaning of Section 285 (1)
No. 9a of the German Commercial Code (HGB) for the past
fiscal year as well as the anticipated total compensation for
the fiscal year in which the termination occurs (or for Mr. Rice
Powell on the non-performance-based compensation compo-
nents).
MISCELLANEOUS
All members of the Management Board have received individ-
ual contractual commitments for the continuation of their com-
pensation in the event of sickness for a maximum period of
12 months, provided that, after 6 months of sickness-related
absence, any insurance benefits that may be paid are to be
deducted from such continued compensation. In the event of
death of a member of the Management Board, the surviving
dependents will receive three monthly payments after the
month in which the death occurred, at maximum, however,
until the expiry of the respective employment agreement.
During the fiscal year 2018, no loans or advance pay-
ment on future compensation components were granted to
any member of the Management Board of Fresenius
Management SE.
Fresenius SE & Co. KGaA undertook to indemnify the Manage-
ment Board members, to the legally permitted extent, against
any claims that may be asserted against them in the course
of their service for the company and its affiliated Group com-
panies to the extent that such claims exceed their liability
under German law. To cover such obligations, the company
purchased a directors & officers insurance, the deductible
complying with the requirements of stock corporation law.
The indemnification covers the period during which the
respective member of the Management Board holds office, as
well as any claim in this regard after termination of the ser-
vice on the Management Board.
Based on pension commitments to former members of
the Management Board, € 1,101 thousand were paid in the
fiscal year 2018 (2017: € 1,099 thousand) and € 522 thou-
sand (2017: € 580 thousand) were paid to Dr. Ben Lipps as a
result of a consultancy agreement entered into with Fresenius
Medical Care Management AG. The benefit obligation for
these persons amounted to € 22,319 thousand (2017: € 21,848
thousand).
TABLES DISPLAYING THE VALUE OF BENEFITS GRANTED AND ALLOCATIONSThe German Corporate Governance Code stipulates that spe-
cific information shall be presented in the compensation
report pertaining to the benefits granted for the year under
review as well as the allocations and service costs in / for
the year under review. The model tables provided in the
appendix of the German Corporate Governance Code shall be
used to present the information.
The following tables contain disclosures on both the value
of the benefits granted and on the allocations. They conform
to the structure and to the specification of the model tables of
the German Corporate Governance Code. The table displaying
allocations additionally shows the allocation for the fiscal
year, that is, without multi-year variable compensation /
components with long-term incentive effect. This illustrates
clearly which allocation is to be attributed to the activity in
the respective year under review and which allocation results
from the compensation components that were granted in
the previous reporting year – or even several years. Through
differentiation, the comparability of the respective develop-
ment in compensation is also increased.

Corporate G
overnance
Corporate Governance156
Benefits grantedValue € in thousands
Stephan SturmChairman of the Management Board
(since July 1, 2016)Board member since January 1, 2005
Dr. Francesco De MeoCEO Fresenius Helios
Board member since January 1, 2008
Rachel EmpeyChief Financial Officer
Board member since August 1, 2017
Dr. Jürgen GötzChief Legal and Compliance Officer,
and Labor Relations DirectorBoard member since July 1, 2007
Mats HenrikssonCEO Fresenius Kabi
Board member since January 1, 2013
Rice PowellCEO Fresenius Medical Care
Board member since January 1, 2013
Dr. Ernst WastlerCEO Fresenius Vamed
Board member since January 1, 2008
20182018min.
2018max. 2017 2018
2018min.
2018max. 2017 2018
2018min.
2018max. 2017 2018
2018min.
2018max. 2017 2018
2018min.
2018max. 2017 2018
2018min.
2018max. 2017 2018
2018min.
2018max. 2017
Fixed compensation 1,100 1,100 1,100 1,100 630 630 630 630 600 600 600 250 490 490 490 490 660 660 660 630 1,270 1,270 1,270 1,217 525 525 525 525
Fringe benefits 102 102 102 79 25 25 25 24 231 231 231 16 41 41 41 41 107 107 107 157 195 195 195 173 75 75 75 75
Total non-performance-based compensation 1,202 1,202 1,202 1,179 655 655 655 654 831 831 831 266 531 531 531 531 767 767 767 787 1,465 1,465 1,465 1,390 600 600 600 600
One-year variable compensation 1 1,868 2 1,750 2,300 1,866 1,415 1,050 1,750 1,412 812 760 1,000 338 950 700 950 950 1,356 1,300 1,800 1,250 2,096 3 191 2,515 2,008 932 650 950 858
Multi-year variable compensation / components with long-term incentive effect 2,500 0 6,250 2,428 1,415 0 3,250 1,412 1,300 0 3,250 407 1,300 0 3,250 1,264 1,356 0 3,250 1,264 2,390 4 0 n. a. 2,247 4 1,300 0 3,250 1,264
Thereof postponed one-year variable compensation 0 0 n. a. 0 115 0 n. a. 148 0 0 n. a. 0 0 0 n. a. 0 56 0 n. a. 0 0 0 n. a. 0
Thereof Stock Option Plan 2013 (part of LTIP 2013) (five-year term) n. a. n. a. n. a. 1,700 n. a. n. a. n. a. 850 n. a. n. a. n. a. 298 n. a. n. a. n. a. 850 n. a. n. a. n. a. 850 n. a. n. a. n. a. 850
Thereof phantom stocks (part of LTIP 2013) (five-year term) n. a. n. a. n. a. 628 n. a. n. a. n. a. 314 n. a. n. a. n. a. 109 n. a. n. a. n. a. 314 n. a. n. a. n. a. 314 n. a. n. a. n. a. 314
Thereof further phantom stocks n. a. n. a. n. a. 100 n. a. n. a. n. a. 100 n. a. n. a. n. a. 0 n. a. n. a. n. a. 100 n. a. n. a. n. a. 100 n. a. n. a. n. a. 100
Thereof performance shares (LTIP 2018) (five-year term) 2,500 0 6,250 n. a. 1,300 0 3,250 n. a. 1,300 0 3,250 n. a. 1,300 0 3,250 n. a. 1,300 0 3,250 n. a. 1,300 0 3,250 n. a.
Total non-performance-based and performance-based compensation 5,570 2,952 9,752 5,473 3,485 1,705 5,655 3,478 2,943 1,591 5,081 1,011 2,781 1,231 4,731 2,745 3,479 2,067 5,817 3,301 5,951 1,656 n. a. 5,645 2,832 1,250 4,800 2,722
Service cost 455 455 455 455 325 325 325 325 0 0 0 0 234 234 234 234 210 210 210 210 674 674 674 773 153 153 153 160
Value of benefits granted 5 6,025 3,407 10,207 5,928 3,810 2,030 5,980 3,803 2,943 1,591 5,081 1,011 3,015 1,465 4,965 2,979 3,689 2,277 6,027 3,511 6,625 2,330 n. a. 6,418 2,985 1,403 4,953 2,882
1 For the one-year variable compensation, there are no target values or comparable values for Board members who receive their compensation from Fresenius Management SE. The one-year variable compensation is calculated on the basis of bonus curves that are valid for several years. For this reason, the allocation from the one-year variable compensation is stated for the years 2018 and 2017.
2 Mr. Stephan Sturm has agreed with the Supervisory Board of Fresenius Management SE to acquire shares of the company in the value of the net amount of the one-year variable compensation paid to him and to hold them for at least three years. Thereby, the orientation of his compensation towards sustainable corporate development is enhanced voluntarily.
3 In order to appropriately take into account the business development of Fresenius Medical Care during the fiscal year, Mr. Rice Powell has agreed to acquire shares in Fresenius Medical Care AG & Co. KGaA for a portion of the bonus and to hold them for at least three years.
4 Mr. Rice Powell was granted stock options, phantom stocks, and performance shares from the program of Fresenius Medical Care as follows: in 2018: € 977 thousand from the Share Based Award – New Incentive Bonus Plan 2010 and € 1,413 thousand from the Long Term Incentive Program 2016 – Performance Share Plan 2016, in 2017: € 916 thousand from the Share Based Award – New Incentive Bonus Plan 2010 and € 1,331 thousand from the Long Term Incentive Program 2016 – Performance Share Plan 2016.
5 Furthermore, an allocation cap in the amount of € 6,000 thousand for Ms. Rachel Empey, Dr. Francesco De Meo, Dr. Jürgen Götz, Mr. Mats Henriksson, and Dr. Ernst Wastler and € 9,000 thousand for Mr. Stephan Sturm applies.

Cor
pora
te G
over
nanc
e
Corporate Governance Further information on Corporate Governance 157
Benefits grantedValue € in thousands
Stephan SturmChairman of the Management Board
(since July 1, 2016)Board member since January 1, 2005
Dr. Francesco De MeoCEO Fresenius Helios
Board member since January 1, 2008
Rachel EmpeyChief Financial Officer
Board member since August 1, 2017
Dr. Jürgen GötzChief Legal and Compliance Officer,
and Labor Relations DirectorBoard member since July 1, 2007
Mats HenrikssonCEO Fresenius Kabi
Board member since January 1, 2013
Rice PowellCEO Fresenius Medical Care
Board member since January 1, 2013
Dr. Ernst WastlerCEO Fresenius Vamed
Board member since January 1, 2008
20182018min.
2018max. 2017 2018
2018min.
2018max. 2017 2018
2018min.
2018max. 2017 2018
2018min.
2018max. 2017 2018
2018min.
2018max. 2017 2018
2018min.
2018max. 2017 2018
2018min.
2018max. 2017
Fixed compensation 1,100 1,100 1,100 1,100 630 630 630 630 600 600 600 250 490 490 490 490 660 660 660 630 1,270 1,270 1,270 1,217 525 525 525 525
Fringe benefits 102 102 102 79 25 25 25 24 231 231 231 16 41 41 41 41 107 107 107 157 195 195 195 173 75 75 75 75
Total non-performance-based compensation 1,202 1,202 1,202 1,179 655 655 655 654 831 831 831 266 531 531 531 531 767 767 767 787 1,465 1,465 1,465 1,390 600 600 600 600
One-year variable compensation 1 1,868 2 1,750 2,300 1,866 1,415 1,050 1,750 1,412 812 760 1,000 338 950 700 950 950 1,356 1,300 1,800 1,250 2,096 3 191 2,515 2,008 932 650 950 858
Multi-year variable compensation / components with long-term incentive effect 2,500 0 6,250 2,428 1,415 0 3,250 1,412 1,300 0 3,250 407 1,300 0 3,250 1,264 1,356 0 3,250 1,264 2,390 4 0 n. a. 2,247 4 1,300 0 3,250 1,264
Thereof postponed one-year variable compensation 0 0 n. a. 0 115 0 n. a. 148 0 0 n. a. 0 0 0 n. a. 0 56 0 n. a. 0 0 0 n. a. 0
Thereof Stock Option Plan 2013 (part of LTIP 2013) (five-year term) n. a. n. a. n. a. 1,700 n. a. n. a. n. a. 850 n. a. n. a. n. a. 298 n. a. n. a. n. a. 850 n. a. n. a. n. a. 850 n. a. n. a. n. a. 850
Thereof phantom stocks (part of LTIP 2013) (five-year term) n. a. n. a. n. a. 628 n. a. n. a. n. a. 314 n. a. n. a. n. a. 109 n. a. n. a. n. a. 314 n. a. n. a. n. a. 314 n. a. n. a. n. a. 314
Thereof further phantom stocks n. a. n. a. n. a. 100 n. a. n. a. n. a. 100 n. a. n. a. n. a. 0 n. a. n. a. n. a. 100 n. a. n. a. n. a. 100 n. a. n. a. n. a. 100
Thereof performance shares (LTIP 2018) (five-year term) 2,500 0 6,250 n. a. 1,300 0 3,250 n. a. 1,300 0 3,250 n. a. 1,300 0 3,250 n. a. 1,300 0 3,250 n. a. 1,300 0 3,250 n. a.
Total non-performance-based and performance-based compensation 5,570 2,952 9,752 5,473 3,485 1,705 5,655 3,478 2,943 1,591 5,081 1,011 2,781 1,231 4,731 2,745 3,479 2,067 5,817 3,301 5,951 1,656 n. a. 5,645 2,832 1,250 4,800 2,722
Service cost 455 455 455 455 325 325 325 325 0 0 0 0 234 234 234 234 210 210 210 210 674 674 674 773 153 153 153 160
Value of benefits granted 5 6,025 3,407 10,207 5,928 3,810 2,030 5,980 3,803 2,943 1,591 5,081 1,011 3,015 1,465 4,965 2,979 3,689 2,277 6,027 3,511 6,625 2,330 n. a. 6,418 2,985 1,403 4,953 2,882
1 For the one-year variable compensation, there are no target values or comparable values for Board members who receive their compensation from Fresenius Management SE. The one-year variable compensation is calculated on the basis of bonus curves that are valid for several years. For this reason, the allocation from the one-year variable compensation is stated for the years 2018 and 2017.
2 Mr. Stephan Sturm has agreed with the Supervisory Board of Fresenius Management SE to acquire shares of the company in the value of the net amount of the one-year variable compensation paid to him and to hold them for at least three years. Thereby, the orientation of his compensation towards sustainable corporate development is enhanced voluntarily.
3 In order to appropriately take into account the business development of Fresenius Medical Care during the fiscal year, Mr. Rice Powell has agreed to acquire shares in Fresenius Medical Care AG & Co. KGaA for a portion of the bonus and to hold them for at least three years.
4 Mr. Rice Powell was granted stock options, phantom stocks, and performance shares from the program of Fresenius Medical Care as follows: in 2018: € 977 thousand from the Share Based Award – New Incentive Bonus Plan 2010 and € 1,413 thousand from the Long Term Incentive Program 2016 – Performance Share Plan 2016, in 2017: € 916 thousand from the Share Based Award – New Incentive Bonus Plan 2010 and € 1,331 thousand from the Long Term Incentive Program 2016 – Performance Share Plan 2016.
5 Furthermore, an allocation cap in the amount of € 6,000 thousand for Ms. Rachel Empey, Dr. Francesco De Meo, Dr. Jürgen Götz, Mr. Mats Henriksson, and Dr. Ernst Wastler and € 9,000 thousand for Mr. Stephan Sturm applies.

Corporate G
overnance
Corporate Governance158
Allocations Value € in thousands
Stephan SturmChairman of the Management Board
(since July 1, 2016)Board member since January 1, 2005
Dr. Francesco De MeoCEO Fresenius Helios
Board member since January 1, 2008
Rachel EmpeyChief Financial Officer
Board member since August 1, 2017
Dr. Jürgen GötzChief Legal and Compliance Officer,
and Labor Relations DirectorBoard member since July 1, 2007
Mats HenrikssonCEO Fresenius Kabi
Board member since January 1, 2013
Rice PowellCEO Fresenius Medical Care
Board member since January 1, 2013
Dr. Ernst WastlerCEO Fresenius Vamed
Board member since January 1, 2008
2018 2017 2018 2017 2018 2017 2018 2017 2018 2017 2018 2017 2018 2017
Fixed compensation 1,100 1,100 630 630 600 250 490 490 660 630 1,270 1,217 525 525
Fringe benefits 102 79 25 24 231 16 41 41 107 157 195 173 75 75
Total non-performance-based compensation 1,202 1,179 655 654 831 266 531 531 767 787 1,465 1,390 600 600
One-year variable compensation 1,868 1,866 1,415 1,412 812 338 950 950 1,356 1,250 2,376 2,297 932 858
Multi-year variable compensation / components with long-term incentive effect 965 317 2,545 4,806 0 0 965 260 2,979 1,659 2,777 1 2,787 1 965 260
Thereof postponed one-year variable compensation 0 57 0 143 0 0 0 0 0 71 0 0
Thereof Stock Option Plan 2008 (five-year term)
Issue 2011 1,588
Issue 2012 4,403 2,014
Thereof Stock Option Plan 2013 (five-year term)
Issue 2013 1,580
Thereof Phantom Stock Plan 2013 (five-year term)
Issue 2013 765 765 765 765 765
Thereof further phantom stocks
Issue 2012 260 260 260 260
Issue 2013 200 200 200 200 200
Other 0 0 0 0 0 0 0 0 0 0 0 0 0 0
Total non-performance-based and performance-based compensation 4,035 3,362 4,615 6,872 1,643 604 2,446 1,741 5,102 3,696 6,618 6,474 2,497 1,718
Service cost 455 455 325 325 0 0 234 234 210 210 674 773 153 160Allocation including multi-year variable compensation / compo-nents with long-term incentive effect 4,490 3,817 4,940 7,197 1,643 604 2,680 1,975 5,312 3,906 7,292 7,247 2,650 1,878Allocation for the year under review (not including multi-year variable compensation / compo-nents with long-term incentive effect) 3,525 3,500 2,395 2,391 1,643 604 1,715 1,715 2,333 2,247 4,515 4,460 1,685 1,618
1 Mr. Rice Powell had this allocation from stock options from the Fresenius Medical Care Stock Option Program: in 2018: € 131 thousand from the Share Based Award – New Incentive Bonus Plan 2010 issue 2014, € 2,536 thousand from the Long Term Incentive Program 2011 – Stock Option Plan 2011 issue 2011, and € 110 thousand from the Long Term Incentive Program 2011 – Phantom Stock Plan 2011 issue 2013, in 2017: € 205 thousand from the Share Based Award – New Incentive Bonus Plan 2010 issue 2013, € 2,506 thousand from the Stock Option Plan 2006 issue 2010, and € 76 thousand from the Long Term Incentive Program 2011 – Phantom Stock Plan 2011 issue 2012.

Cor
pora
te G
over
nanc
e
Corporate Governance Further information on Corporate Governance 159
Allocations Value € in thousands
Stephan SturmChairman of the Management Board
(since July 1, 2016)Board member since January 1, 2005
Dr. Francesco De MeoCEO Fresenius Helios
Board member since January 1, 2008
Rachel EmpeyChief Financial Officer
Board member since August 1, 2017
Dr. Jürgen GötzChief Legal and Compliance Officer,
and Labor Relations DirectorBoard member since July 1, 2007
Mats HenrikssonCEO Fresenius Kabi
Board member since January 1, 2013
Rice PowellCEO Fresenius Medical Care
Board member since January 1, 2013
Dr. Ernst WastlerCEO Fresenius Vamed
Board member since January 1, 2008
2018 2017 2018 2017 2018 2017 2018 2017 2018 2017 2018 2017 2018 2017
Fixed compensation 1,100 1,100 630 630 600 250 490 490 660 630 1,270 1,217 525 525
Fringe benefits 102 79 25 24 231 16 41 41 107 157 195 173 75 75
Total non-performance-based compensation 1,202 1,179 655 654 831 266 531 531 767 787 1,465 1,390 600 600
One-year variable compensation 1,868 1,866 1,415 1,412 812 338 950 950 1,356 1,250 2,376 2,297 932 858
Multi-year variable compensation / components with long-term incentive effect 965 317 2,545 4,806 0 0 965 260 2,979 1,659 2,777 1 2,787 1 965 260
Thereof postponed one-year variable compensation 0 57 0 143 0 0 0 0 0 71 0 0
Thereof Stock Option Plan 2008 (five-year term)
Issue 2011 1,588
Issue 2012 4,403 2,014
Thereof Stock Option Plan 2013 (five-year term)
Issue 2013 1,580
Thereof Phantom Stock Plan 2013 (five-year term)
Issue 2013 765 765 765 765 765
Thereof further phantom stocks
Issue 2012 260 260 260 260
Issue 2013 200 200 200 200 200
Other 0 0 0 0 0 0 0 0 0 0 0 0 0 0
Total non-performance-based and performance-based compensation 4,035 3,362 4,615 6,872 1,643 604 2,446 1,741 5,102 3,696 6,618 6,474 2,497 1,718
Service cost 455 455 325 325 0 0 234 234 210 210 674 773 153 160Allocation including multi-year variable compensation / compo-nents with long-term incentive effect 4,490 3,817 4,940 7,197 1,643 604 2,680 1,975 5,312 3,906 7,292 7,247 2,650 1,878Allocation for the year under review (not including multi-year variable compensation / compo-nents with long-term incentive effect) 3,525 3,500 2,395 2,391 1,643 604 1,715 1,715 2,333 2,247 4,515 4,460 1,685 1,618
1 Mr. Rice Powell had this allocation from stock options from the Fresenius Medical Care Stock Option Program: in 2018: € 131 thousand from the Share Based Award – New Incentive Bonus Plan 2010 issue 2014, € 2,536 thousand from the Long Term Incentive Program 2011 – Stock Option Plan 2011 issue 2011, and € 110 thousand from the Long Term Incentive Program 2011 – Phantom Stock Plan 2011 issue 2013, in 2017: € 205 thousand from the Share Based Award – New Incentive Bonus Plan 2010 issue 2013, € 2,506 thousand from the Stock Option Plan 2006 issue 2010, and € 76 thousand from the Long Term Incentive Program 2011 – Phantom Stock Plan 2011 issue 2012.

Corporate G
overnance
Corporate Governance160
COMPENSATION OF THE SUPERVISORY BOARD
The compensation of the Supervisory Board is determined
by the Annual General Meeting and is subject to the provi-
sions contained in Section 13 of the articles of association of
Fresenius SE & Co. KGaA.
Each member of the Supervisory Board shall receive an
amount of € 150 thousand annually for each full fiscal year
as fixed compensation, payable after the end of the fiscal year.
In addition, each member of the Supervisory Board shall
receive variable success-oriented compensation for each full
fiscal year that is oriented on the respective average growth
rate of the net income attributable to shareholders of Fresenius
SE & Co. KGaA for the compensation year and the two preced-
ing fiscal years (three-year average growth of the net income
attributable to shareholders of Fresenius SE & Co. KGaA).
The calculation of the amount of this variable compensa-
tion shall be made in accordance with the following formula:
Three-year average growth of net income attributable to shareholders of Fresenius SE & Co. KGaA Variable compensation
> 0 to 2.5% € 30,000
> 2.5 to 5% € 60,000
> 5 to 7.5% € 90,000
> 7.5 to 10% € 120,000
> 10% € 150,000
A claim to grant variable compensation shall only accrue from
the achievement of three-year annual growth of the net income
attributable to shareholders of Fresenius SE & Co. KGaA of
more than 0%. On the achievement of the five percentage
corridors described above, the amounts of variable compen-
sation shall each be provided in full, i. e., no interpolation
shall take place within these corridors. The net income attrib-
utable to shareholders of Fresenius SE & Co. KGaA disclosed in
the consolidated annual financial statements shall be authorita-
tive in each case. This variable compensation is limited to a
maximum amount of € 150 thousand p. a. The disbursement
of variable compensation shall generally be made annually,
provided targets have been reached and in each case at the
end of the calendar quarter in which the annual financial state-
ments of the company are approved by the Annual General
Meeting. If the Annual General Meeting approves a resolution
providing higher compensation, this shall apply.
The Chairman of the Supervisory Board receives three
times and his deputies one and a half times the fixed compen-
sation of a member of the Supervisory Board.
A member of the Audit Committee of the Supervisory
Board shall for their membership receive additional fixed com-
pensation of € 20 thousand and the Chairman of the Audit
Committee twice this amount.
If a fiscal year does not encompass a full calendar year
or if a member of the Supervisory Board is on the Supervisory
Board only for a part of the fiscal year, the compensation
shall be paid on a pro rata temporis basis. This applies accord-
ingly to membership of the Audit Committee of the Super-
visory Board.
The members of the Supervisory Board shall be refunded
expenses incurred when exercising their functions, which
also includes applicable value-added tax due for payment.
Fresenius SE & Co. KGaA shall provide members of the Super-
visory Board with insurance coverage to an appropriate
extent for exercising Supervisory Board activities.
Cor
pora
te G
over
nanc
e
Corporate Governance Further information on Corporate Governance 161
If a member of the Supervisory Board of Fresenius SE &
Co. KGaA is at the same time a member of the Supervisory
Board of the general partner Fresenius Management SE and
receives compensation for his services on the Supervisory
Board of Fresenius Management SE, compensation shall be
reduced by half. The same applies with respect to the addi-
tional part of compensation for the Chairman, provided he is
simultaneously the Chairman of the Supervisory Board of
Fresenius Management SE; this applies to his deputies accord-
ingly, provided the deputies are at the same time the depu-
ties of the Chairman of the Supervisory Board of Fresenius
Management SE. If a deputy of the Chairman of the Supervi-
sory Board of Fresenius SE & Co. KGaA is at the same time
the Chairman of the Supervisory Board of Fresenius Manage-
ment SE, he shall not receive compensation for his service as
Deputy Chairman of the Supervisory Board of Fresenius SE &
Co. KGaA. According to Section 7 of the articles of associa-
tion of Fresenius SE & Co. KGaA, the compensation of the
Supervisory Board of Fresenius Management SE will be
charged to Fresenius SE & Co. KGaA.
Additionally, in his capacity as Chairman of the Supervi-
sory Board of Fresenius Management SE, Dr. Gerd Krick was
reimbursed for the costs for the operation of an intrusion
detection system in the amount of € 1.2 thousand.
Up to the end of the fiscal year 2017, the compensation
of the Supervisory Board was calculated according to the
then relevant version of the articles of association.
Each member of the Supervisory Board received a fixed
compensation of € 13 thousand for the full fiscal year 2017.
The members of the Audit Committee of Fresenius SE &
Co. KGaA received an additional € 10 thousand each and the
Chairman of the committee a further € 10 thousand. For the
full fiscal year 2017, the compensation increases by 10% for
each percentage point that three times the dividend paid on
each ordinary share for that year (gross dividend according
to the resolution of the Annual General Meeting) exceeded
3.6% of the amount equal to the subscribed capital divided
by the number of non-par value shares; residual amounts
were interpolated. The Chairman received twice this amount
and the deputies to the Chairman one and a half times the
amount of a Supervisory Board member. All members of the
Supervisory Board received appropriate compensation for
costs of travel and accommodation incurred in connection with
their duties as members of the Supervisory Board, including
any applicable value-added tax. Fresenius SE & Co. KGaA pro-
vided to the members of the Supervisory Board insurance
coverage in an adequate amount (relating to their function)
with an excess equal to those of the Management Board.
If a member of the Supervisory Board of Fresenius SE &
Co. KGaA was, at the same time, a member of the Supervisory
Board of the general partner Fresenius Management SE and
received compensation for his service on the Supervisory
Board of Fresenius Management SE, the compensation was
reduced by half. The same applied with respect to the addi-
tional part of the compensation for the Chairman or one of
his deputies if they were, at the same time, the Chairman or
one of his deputies on the Supervisory Board of Fresenius
Management SE. If the deputy of the Chairman of the Super-
visory Board of Fresenius SE & Co. KGaA was, at the same
time, the Chairman of the Supervisory Board of Fresenius Man-
agement SE, he did not receive compensation for his service
as Deputy Chairman of the Supervisory Board of Fresenius
SE & Co. KGaA. In accordance with Section 7 of the articles of
association of Fresenius SE & Co. KGaA, the compensation
of the Supervisory Board of Fresenius Management SE was
charged to Fresenius SE & Co. KGaA.
For the fiscal years 2018 and 2017, the compensation for
the members of the Supervisory Boards of Fresenius SE &
Co. KGaA and Fresenius Management SE (excluding expenses
and reimbursements), including compensation for committee
services, was as follows:

Corporate G
overnance
Corporate Governance162
DIRECTORS & OFFICERS INSURANCE Fresenius SE & Co. KGaA has taken out a consequential loss
liability insurance policy (D & O insurance), on an excess
amount basis, for the members of the Management Board and
the Super visory Board of the general partner of Fresenius SE &
Co. KGaA and for the Supervisory Board of Fresenius SE &
Co. KGaA as well as for all representative bodies of affiliates
in Germany and elsewhere. The D & O policy applies through-
out the world and runs until the end of June 2019. The policy
covers the legal defense costs of a member of a representative
body when a claim is made and, where relevant, any dam-
ages to be paid that are covered by the policy.
Fixed compensationCompensation for
committee servicesVariable
compensationTotal
compensation
Fresenius SE & Co. KGaA
Fresenius Management SE
Fresenius SE & Co. KGaA
Fresenius Management SE
Fresenius SE & Co. KGaA
Fresenius Management SE
€ in thousands 2018 2017 2018 2017 2018 2017 2018 2017 2018 2017 1 2018 2017 1 2018 2017
Dr. Gerd Krick 225 13 225 13 20 10 20 20 75 288 75 288 640 632
Michael Diekmann 150 13 75 6 0 0 0 0 75 288 75 144 375 451
Dr. Dieter Schenk 0 0 225 19 0 0 10 10 0 0 150 432 385 461
Niko Stumpfögger 225 19 0 0 7 0 0 0 150 432 0 0 382 451
Prof. Dr. med. D. Michael Albrecht 150 13 0 0 0 0 0 0 150 288 0 0 300 301
Bernd Behlert (since September 1, 2018) 50 0 0 0 0 0 0 0 50 0 0 0 100 0
Dr. Kurt Bock 0 0 150 13 0 0 0 0 0 0 150 288 300 301
Konrad Kölbl 150 13 0 0 20 10 0 0 150 288 0 0 320 311
Stefanie Lang 150 13 0 0 0 0 0 0 150 288 0 0 300 301
Frauke Lehmann 150 13 0 0 0 0 0 0 150 288 0 0 300 301
Prof. Dr. med. Iris Löw-Friedrich 150 13 0 0 0 0 0 0 150 288 0 0 300 301
Klaus-Peter Müller 75 7 75 6 40 20 0 0 75 143 75 144 340 320
Oscar Romero de Paco 150 13 0 0 0 0 0 0 150 288 0 0 300 301
Dr. Karl Schneider 0 0 150 13 0 0 10 10 0 0 150 288 310 311
Hauke Stars 150 13 0 0 20 10 0 0 150 288 0 0 320 311
Rainer Stein(up to August 31, 2018) 100 13 0 0 13 10 0 0 100 288 0 0 213 311
Total 1,875 156 900 70 120 60 40 40 1,575 3,455 675 1,584 5,185 5,365
1 Based on the proposed dividend

163
Fin
anci
al S
tate
men
ts
164 Consolidated statement of income
164 Consolidated statement of comprehensive income
165 Consolidated statement of financial position
166 Consolidated statement of cash flows
168 Consolidated statement of changes in equity
170 Consolidated segment reporting
172 Notes
TABLE OF CONTENTS CONSOLIDATED FINANCIAL STATEMENTS
Consolidated Financial Statements

Consolidated Financial Statements164
Financial S
tatements
FRESENIUS SE & CO. KGAA
CONSOLIDATED STATEMENT OF INCOME
FRESENIUS SE & CO. KGAA
CONSOLIDATED STATEMENT OF COMPREHENSIVE INCOME
€ in millions Note 2018 2017
Sales 4 33,530 33,886
Cost of sales - 23,696 - 23,395
Gross profit 9,834 10,491
Selling expenses - 1,016 - 948
General and administrative expenses 8 - 3,857 - 4,606
Other operating income 9 441 367
Other operating expenses 9 - 287 - 183
Gain related to divestitures of Care Coordination activities 2, 3 809 26
Research and development expenses 7 - 673 - 558
Operating income (EBIT) 5,251 4,589
Interest income 10 355 207
Interest expenses 10 - 942 - 874
Income before income taxes 4,664 3,922
Income taxes 11 - 950 - 889
Net income 3,714 3,033
Noncontrolling interest 12 1,687 1,219
Net income attributable to shareholders of Fresenius SE & Co. KGaA 2,027 1,814
Earnings per share in € 13 3.65 3.27
Fully diluted earnings per share in € 13 3.63 3.25
The following notes are an integral part of the consolidated financial statements.
€ in millions Note 2018 2017
Net income 3,714 3,033
Other comprehensive income (loss)
Positions which will be reclassified into net income in subsequent years
Foreign currency translation 28, 30 268 - 1,965
Cash flow hedges 28, 30 15 44
Change of fair value of debt instruments 28, 30 0 0
Income taxes on positions which will be reclassified 28 - 12 15
Positions which will not be reclassified into net income in subsequent years
Change of fair value of equity investments 30 5 0
Actuarial gains / losses on defined benefit pension plans 25, 28 - 62 43
Income taxes on positions which will not be reclassified 28 15 - 35
Other comprehensive income (loss), net 229 - 1,898
Total comprehensive income 3,943 1,135
Comprehensive income attributable to noncontrolling interest 1,848 292
Comprehensive income attributable to shareholders of Fresenius SE & Co. KGaA 2,095 843
The following notes are an integral part of the consolidated financial statements.

165
Fin
anci
al S
tate
men
ts
Consolidated Financial Statements Consolidated statement of income / Consolidated statement of comprehensive income / Consolidated statement of financial position
FRESENIUS SE & CO. KGAA
CONSOLIDATED STATEMENT OF FINANCIAL POSITION
ASSETS
LIABILITIES AND SHAREHOLDERS’ EQUITY
as of December 31, € in millions Note 2018 2017
Cash and cash equivalents 14 2,709 1,636
Trade accounts and other receivables, less allowance for doubtful accounts 15 6,540 6,260
Accounts receivable from and loans to related parties 29 17
Inventories 16 3,218 3,252
Other current assets 17 2,294 1,439
I. Total current assets 14,790 12,604
Property, plant and equipment 18 10,366 9,555
Goodwill 19 25,713 25,285
Other intangible assets 19 3,130 3,172
Other non-current assets 17 1,927 1,773
Deferred taxes 11 777 744
II. Total non-current assets 41,913 40,529
Total assets 56,703 53,133
as of December 31, € in millions Note 2018 2017
Trade accounts payable 1,823 1,688
Short-term accounts payable to related parties 67 42
Short-term provisions and other short-term liabilities 20, 21 6,240 5,869
Short-term debt 22 2,354 1,550
Short-term debt from related parties – –
Current portion of long-term debt and capital lease obligations 22 353 618
Current portion of bonds 23 1,744 731
Current portion of convertible bonds 24 493 0
Short-term accruals for income taxes 201 167
A. Total short-term liabilities 13,275 10,665
Long-term debt and capital lease obligations, less current portion 22 5,944 6,487
Bonds, less current portion 23 7,246 8,338
Convertible bonds, less current portion 24 850 1,318
Long-term provisions and other long-term liabilities 20, 21 1,634 2,138
Pension liabilities 25 1,235 1,163
Long-term accruals for income taxes 227 194
Deferred taxes 11 1,284 1,110
B. Total long-term liabilities 18,420 20,748
I. Total liabilities 31,695 31,413
A. Noncontrolling interest 26 9,597 8,059
Subscribed capital 27 556 555
Capital reserve 27 3,933 3,848
Other reserves 27 11,252 9,656
Accumulated other comprehensive loss 28 - 330 - 398
B. Total Fresenius SE & Co. KGaA shareholders’ equity 15,411 13,661
II. Total shareholders’ equity 25,008 21,720
Total liabilities and shareholders’ equity 56,703 53,133
The following notes are an integral part of the consolidated financial statements.

Consolidated Financial Statements166
Financial S
tatements
FRESENIUS SE & CO. KGAA
CONSOLIDATED STATEMENT OF CASH FLOWS
January 1 to December 31, € in millions Note 2018 2017
Operating activities
Net income 3,714 3,033
Adjustments to reconcile net income to cash and cash equivalents provided by operating activities
Depreciation and amortization 17, 18, 19 1,430 1,437
Gain on sale of investments and divestitures 2 - 807 - 96
Change in deferred taxes 11 100 - 230
Gain on sale of fixed assets - 4 - 3
Changes in assets and liabilities, net of amounts from businesses acquired or disposed of
Trade accounts and other receivables, net 15 - 556 - 644
Inventories 16 - 279 - 228
Other current and non-current assets 17 - 281 28
Accounts receivable from / payable to related parties 12 - 25
Trade accounts payable, provisions and other short-term and long-term liabilities 20, 21 223 720
Accruals for income taxes 190 - 55
Net cash provided by operating activities 3,742 3,937
Investing activities
Purchase of property, plant and equipment 18 - 2,149 - 1,823
Proceeds from sales of property, plant and equipment 72 118
Acquisitions and investments, net of cash acquired and net purchases of intangible assets 2, 32 - 1,070 - 6,289
Proceeds from sale of investments and divestitures 2 1,683 424
Net cash used in investing activities - 1,464 - 7,570
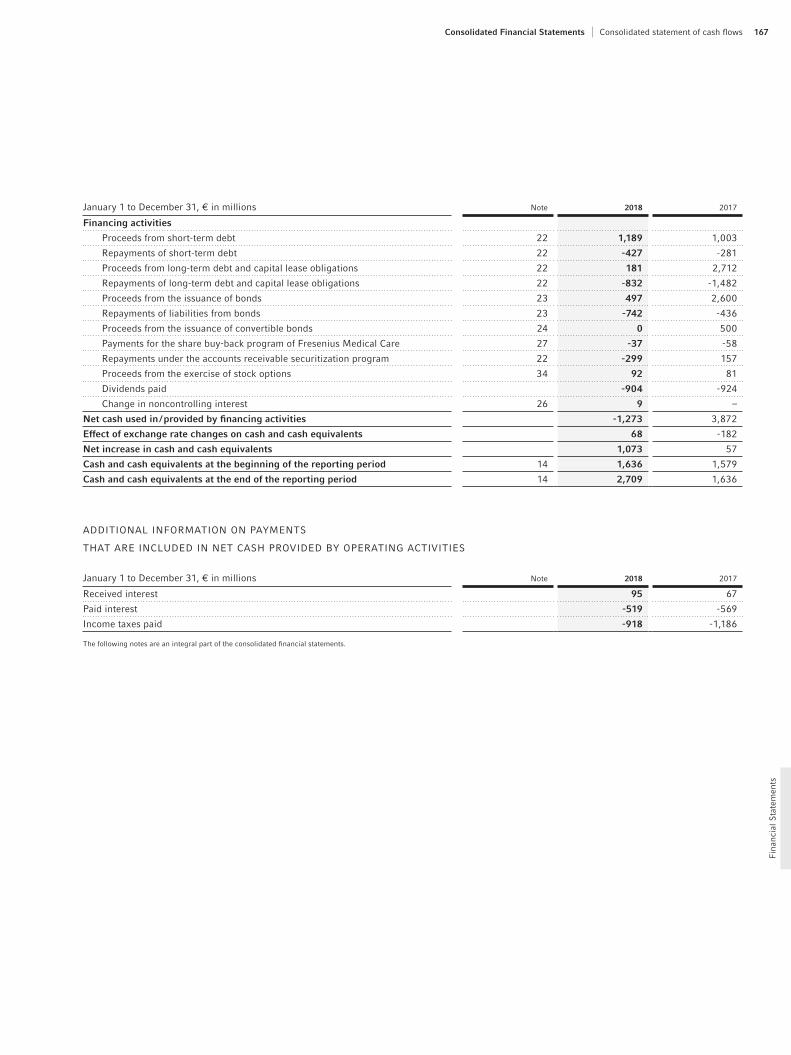
167
Fin
anci
al S
tate
men
ts
Consolidated Financial Statements Consolidated statement of cash flows
January 1 to December 31, € in millions Note 2018 2017
Financing activities
Proceeds from short-term debt 22 1,189 1,003
Repayments of short-term debt 22 - 427 - 281
Proceeds from long-term debt and capital lease obligations 22 181 2,712
Repayments of long-term debt and capital lease obligations 22 - 832 - 1,482
Proceeds from the issuance of bonds 23 497 2,600
Repayments of liabilities from bonds 23 - 742 - 436
Proceeds from the issuance of convertible bonds 24 0 500
Payments for the share buy-back program of Fresenius Medical Care 27 - 37 - 58
Repayments under the accounts receivable securitization program 22 - 299 157
Proceeds from the exercise of stock options 34 92 81
Dividends paid - 904 - 924
Change in noncontrolling interest 26 9 –
Net cash used in / provided by financing activities - 1,273 3,872
Effect of exchange rate changes on cash and cash equivalents 68 - 182
Net increase in cash and cash equivalents 1,073 57
Cash and cash equivalents at the beginning of the reporting period 14 1,636 1,579
Cash and cash equivalents at the end of the reporting period 14 2,709 1,636
ADDITIONAL INFORMATION ON PAYMENTS
THAT ARE INCLUDED IN NET CASH PROVIDED BY OPERATING ACTIVITIES
January 1 to December 31, € in millions Note 2018 2017
Received interest 95 67
Paid interest - 519 - 569
Income taxes paid - 918 - 1,186
The following notes are an integral part of the consolidated financial statements.
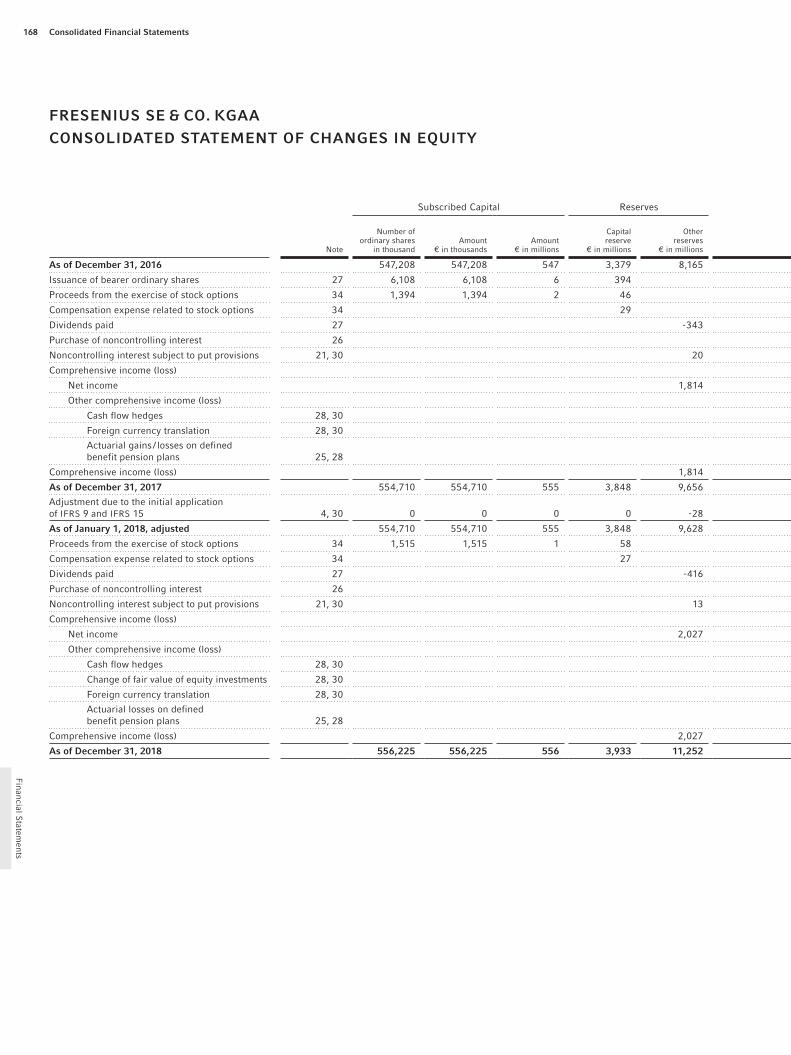
Consolidated Financial Statements168
Financial S
tatements
FRESENIUS SE & CO. KGAA
CONSOLIDATED STATEMENT OF CHANGES IN EQUITY
Subscribed Capital Reserves Accumulated other com prehensive income (loss)
Note
Number of ordinary shares
in thousandAmount
€ in thousandsAmount
€ in millions
Capital reserve
€ in millions
Other reserves
€ in millions
Foreign currency translation
€ in millions
Cash flow hedges
€ in millionsPensions
€ in millionsEquity
investments
Total Fresenius SE & Co. KGaA shareholders’
equity € in millions
Non controlling interest
€ in millions
Total shareholders’
equity € in millions
As of December 31, 2016 547,208 547,208 547 3,379 8,165 960 - 79 - 308 0 12,664 8,185 20,849
Issuance of bearer ordinary shares 27 6,108 6,108 6 394 400 0 400
Proceeds from the exercise of stock options 34 1,394 1,394 2 46 48 33 81
Compensation expense related to stock options 34 29 29 8 37
Dividends paid 27 - 343 - 343 - 582 - 925
Purchase of noncontrolling interest 26 0 77 77
Noncontrolling interest subject to put provisions 21, 30 20 20 46 66
Comprehensive income (loss)
Net income 1,814 1,814 1,219 3,033
Other comprehensive income (loss)
Cash flow hedges 28, 30 19 19 14 33
Foreign currency translation 28, 30 - 1,021 – 8 - 1,013 - 926 - 1,939
Actuarial gains / losses on defined benefit pension plans 25, 28 23 23 - 15 8
Comprehensive income (loss) 1,814 - 1,021 19 31 843 292 1,135
As of December 31, 2017 554,710 554,710 555 3,848 9,656 - 61 - 60 - 277 0 13,661 8,059 21,720
Adjustment due to the initial application of IFRS 9 and IFRS 15 4, 30 0 0 0 0 - 28 0 0 0 0 - 28 - 2 - 30
As of January 1, 2018, adjusted 554,710 554,710 555 3,848 9,628 - 61 - 60 - 277 0 13,633 8,057 21,690
Proceeds from the exercise of stock options 34 1,515 1,515 1 58 59 33 92
Compensation expense related to stock options 34 27 27 5 32
Dividends paid 27 - 416 - 416 - 488 - 904
Purchase of noncontrolling interest 26 0 112 112
Noncontrolling interest subject to put provisions 21, 30 13 13 30 43
Comprehensive income (loss)
Net income 2,027 2,027 1,687 3,714
Other comprehensive income (loss)
Cash flow hedges 28, 30 - 1 - 1 12 11
Change of fair value of equity investments 28, 30 4 4 0 4
Foreign currency translation 28, 30 99 – - 2 97 163 260
Actuarial losses on defined benefit pension plans 25, 28 - 32 - 32 - 14 - 46
Comprehensive income (loss) 2,027 99 - 1 - 34 4 2,095 1,848 3,943
As of December 31, 2018 556,225 556,225 556 3,933 11,252 38 - 61 - 311 4 15,411 9,597 25,008

169
Fin
anci
al S
tate
men
ts
Consolidated Financial Statements Consolidated statement of changes in equity
Subscribed Capital Reserves Accumulated other com prehensive income (loss)
Note
Number of ordinary shares
in thousandAmount
€ in thousandsAmount
€ in millions
Capital reserve
€ in millions
Other reserves
€ in millions
Foreign currency translation
€ in millions
Cash flow hedges
€ in millionsPensions
€ in millionsEquity
investments
Total Fresenius SE & Co. KGaA shareholders’
equity € in millions
Non controlling interest
€ in millions
Total shareholders’
equity € in millions
As of December 31, 2016 547,208 547,208 547 3,379 8,165 960 - 79 - 308 0 12,664 8,185 20,849
Issuance of bearer ordinary shares 27 6,108 6,108 6 394 400 0 400
Proceeds from the exercise of stock options 34 1,394 1,394 2 46 48 33 81
Compensation expense related to stock options 34 29 29 8 37
Dividends paid 27 - 343 - 343 - 582 - 925
Purchase of noncontrolling interest 26 0 77 77
Noncontrolling interest subject to put provisions 21, 30 20 20 46 66
Comprehensive income (loss)
Net income 1,814 1,814 1,219 3,033
Other comprehensive income (loss)
Cash flow hedges 28, 30 19 19 14 33
Foreign currency translation 28, 30 - 1,021 – 8 - 1,013 - 926 - 1,939
Actuarial gains / losses on defined benefit pension plans 25, 28 23 23 - 15 8
Comprehensive income (loss) 1,814 - 1,021 19 31 843 292 1,135
As of December 31, 2017 554,710 554,710 555 3,848 9,656 - 61 - 60 - 277 0 13,661 8,059 21,720
Adjustment due to the initial application of IFRS 9 and IFRS 15 4, 30 0 0 0 0 - 28 0 0 0 0 - 28 - 2 - 30
As of January 1, 2018, adjusted 554,710 554,710 555 3,848 9,628 - 61 - 60 - 277 0 13,633 8,057 21,690
Proceeds from the exercise of stock options 34 1,515 1,515 1 58 59 33 92
Compensation expense related to stock options 34 27 27 5 32
Dividends paid 27 - 416 - 416 - 488 - 904
Purchase of noncontrolling interest 26 0 112 112
Noncontrolling interest subject to put provisions 21, 30 13 13 30 43
Comprehensive income (loss)
Net income 2,027 2,027 1,687 3,714
Other comprehensive income (loss)
Cash flow hedges 28, 30 - 1 - 1 12 11
Change of fair value of equity investments 28, 30 4 4 0 4
Foreign currency translation 28, 30 99 – - 2 97 163 260
Actuarial losses on defined benefit pension plans 25, 28 - 32 - 32 - 14 - 46
Comprehensive income (loss) 2,027 99 - 1 - 34 4 2,095 1,848 3,943
As of December 31, 2018 556,225 556,225 556 3,933 11,252 38 - 61 - 311 4 15,411 9,597 25,008

Consolidated Financial Statements170
Financial S
tatements
FRESENIUS SE & CO. KGAA
CONSOLIDATED SEGMENT REPORTING
BY BUSINESS SEGMENT
BY REGIONEurope North America Asia-Pacific Latin America Africa Fresenius Group
€ in millions 2018 2017 Change 2018 2017 Change 2018 2017 Change 2018 2017 Change 2018 2017 Change 2018 2017 Change
Sales 14,484 13,767 5% 13,861 15,093 - 8% 3,366 3,182 6% 1,387 1,431 - 3% 432 413 5% 33,530 33,886 - 1%
contribution to consolidated sales 43% 41% 42% 45% 10% 9% 4% 4% 1% 1% 100% 100%
EBIT 1,029 1,030 0% 3,422 2,762 24% 648 627 3% 92 117 - 21% 60 53 13% 5,251 4,589 14%
Depreciation and amortization 725 698 4% 540 576 - 6% 106 105 1% 52 49 6% 7 9 - 22% 1,430 1,437 0%
Total assets 25,963 24,807 5% 24,806 22,772 9% 4,246 3,874 10% 1,452 1,464 - 1% 236 216 9% 56,703 53,133 7%
Capital expenditure, gross 1,095 913 20% 852 708 20% 138 113 22% 67 82 - 18% 11 12 - 8% 2,163 1,828 18%
Acquisitions, gross / investments 239 6,241 - 96% 772 339 128% 30 263 - 89% 45 9 -- – – -- 1,086 6,852 - 84%
Employees (per capita on balance sheet date) 158,939 154,172 3% 72,672 75,083 - 3% 25,575 24,381 5% 17,610 17,709 - 1% 1,954 1,904 3% 276,750 273,249 1%
The consolidated segment reporting by region is an integral part of the notes.The following notes are an integral part of the consolidated financial statements.
Fresenius Medical Care Fresenius Kabi Fresenius Helios Fresenius Vamed Corporate / Other Fresenius Group
€ in millions 2018 1 2017 2 Change 2018 3 2017 4 Change 2018 2017 Change 2018 2017 Change 2018 5 2017 6 Change 2018 2017 Change
Sales 16,547 17,784 - 7% 6,544 6,358 3% 8,993 8,668 4% 1,688 1,228 37% - 242 - 152 - 59% 33,530 33,886 - 1%
thereof contribution to consolidated sales 16,515 17,754 - 7% 6,489 6,301 3% 8,983 8,652 4% 1,541 1,174 31% 2 5 - 60% 33,530 33,886 - 1%
thereof intercompany sales 32 30 7% 55 57 - 4% 10 16 - 38% 147 54 172% - 244 - 157 - 55% 0 0
contribution to consolidated sales 49% 52% 19% 19% 27% 26% 5% 3% 0% 0% 100% 100%
EBITDA 3,031 3,298 - 8% 1,434 1,483 - 3% 1,429 1,426 0% 133 87 53% 654 - 268 -- 6,681 6,026 11%
Depreciation and amortization 725 736 - 1% 295 306 - 4% 377 374 1% 23 11 109% 10 10 0% 1,430 1,437 0%
EBIT 2,306 2,562 - 10% 1,139 1,177 - 3% 1,052 1,052 0% 110 76 45% 644 - 278 -- 5,251 4,589 14%
Net interest - 301 - 365 17% - 108 - 119 9% - 167 - 155 - 8% - 9 - 2 -- - 2 - 26 92% - 587 - 667 12%
Income taxes - 424 - 679 37% - 246 - 317 22% - 189 - 164 - 15% - 28 - 23 - 22% - 63 294 - 121% - 950 - 889 - 7%
Net income attributable to shareholders of Fresenius SE & Co. KGaA 1,337 1,244 7% 742 702 6% 686 728 - 6% 72 50 44% - 810 - 910 11% 2,027 1,814 12%
Operating cash flow 2,062 2,192 - 6% 1,040 1,010 3% 554 733 - 24% 106 42 152% - 20 - 40 50% 3,742 3,937 - 5%
Cash flow before acquisitions and dividends 1,059 1,351 - 22% 487 590 - 17% 120 322 - 63% 77 35 120% - 78 - 66 - 18% 1,665 2,232 - 25%
Total assets 26,242 24,025 9% 12,638 11,792 7% 16,504 16,583 0% 2,160 1,282 68% - 841 - 549 - 53% 56,703 53,133 7%
Debt 7,546 7,448 1% 3,867 4,806 - 20% 6,219 6,665 - 7% 535 245 118% 817 - 122 -- 18,984 19,042 0%
Other operating liabilities 5,168 5,282 - 2% 3,107 2,879 8% 2,051 2,027 1% 912 621 47% 189 452 - 58% 11,427 11,261 1%
Capital expenditure, gross 1,057 944 12% 572 428 34% 441 415 6% 44 16 175% 49 25 96% 2,163 1,828 18%
Acquisitions, gross / investments 957 683 40% 43 157 - 73% 60 5,979 - 99% 496 33 -- - 470 0 1,086 6,852 - 84%
Research and development expenses 134 131 2% 534 427 25% - – -- 0 0 5 0 673 558 21%
Employees (per capita on balance sheet date) 120,328 121,245 - 1% 37,843 36,380 4% 100,144 105,927 - 5% 17,299 8,667 100% 1,136 1,030 10% 276,750 273,249 1%
Key figures
EBITDA margin 18.3% 18.5% 21.9% 23.3% 15.9% 16.5% 7.9% 7.1% 17.9% 7 18.5% 1
EBIT margin 13.9% 14.4% 17.4% 18.5% 11.7% 12.1% 6.5% 6.2% 13.6% 7 14.3% 1
Depreciation and amortization in % of sales 4.4% 4.1% 4.5% 4.8% 4.2% 4.3% 1.4% 0.9% 4.3% 4.2%
Operating cash flow in % of sales 12.5% 12.3% 15.9% 15.9% 6.2% 8.5% 6.3% 3.4% 11.2% 11.6%
ROOA 10.0% 10.9% 11.1% 10.8% 6.8% 6.9% 9.1% 9.8% 9.0% 9 9.4% 8
1 Before transaction-related effects and FCPA provision2 Before FCPA provision and book gain from U.S. tax reform3 Before transaction-related effects and revaluations of biosimilars contingent liabilities4 Before transaction-related effects and book gain from U.S. tax reform5 After transaction-related effects, revaluations of biosimilars contingent liabilities and FCPA provision6 After transaction-related effects, FCPA provision and book gain from U.S. tax reform7 Before transaction-related effects, revaluations of biosimilars contingent liabilities and FCPA provision8 The underlying pro forma EBIT does not include transaction-related expenses and FCPA provision.9 The underlying pro forma EBIT does not include transaction-related expenses, revaluations of biosimilars contingent liabilities and FCPA provision.
The consolidated segment reporting by business segment is an integral part of the notes.The following notes are an integral part of the consolidated financial statements.

171
Fin
anci
al S
tate
men
ts
Consolidated Financial Statements Consolidated segment reporting
Europe North America Asia-Pacific Latin America Africa Fresenius Group
€ in millions 2018 2017 Change 2018 2017 Change 2018 2017 Change 2018 2017 Change 2018 2017 Change 2018 2017 Change
Sales 14,484 13,767 5% 13,861 15,093 - 8% 3,366 3,182 6% 1,387 1,431 - 3% 432 413 5% 33,530 33,886 - 1%
contribution to consolidated sales 43% 41% 42% 45% 10% 9% 4% 4% 1% 1% 100% 100%
EBIT 1,029 1,030 0% 3,422 2,762 24% 648 627 3% 92 117 - 21% 60 53 13% 5,251 4,589 14%
Depreciation and amortization 725 698 4% 540 576 - 6% 106 105 1% 52 49 6% 7 9 - 22% 1,430 1,437 0%
Total assets 25,963 24,807 5% 24,806 22,772 9% 4,246 3,874 10% 1,452 1,464 - 1% 236 216 9% 56,703 53,133 7%
Capital expenditure, gross 1,095 913 20% 852 708 20% 138 113 22% 67 82 - 18% 11 12 - 8% 2,163 1,828 18%
Acquisitions, gross / investments 239 6,241 - 96% 772 339 128% 30 263 - 89% 45 9 -- – – -- 1,086 6,852 - 84%
Employees (per capita on balance sheet date) 158,939 154,172 3% 72,672 75,083 - 3% 25,575 24,381 5% 17,610 17,709 - 1% 1,954 1,904 3% 276,750 273,249 1%
The consolidated segment reporting by region is an integral part of the notes.The following notes are an integral part of the consolidated financial statements.
Fresenius Medical Care Fresenius Kabi Fresenius Helios Fresenius Vamed Corporate / Other Fresenius Group
€ in millions 2018 1 2017 2 Change 2018 3 2017 4 Change 2018 2017 Change 2018 2017 Change 2018 5 2017 6 Change 2018 2017 Change
Sales 16,547 17,784 - 7% 6,544 6,358 3% 8,993 8,668 4% 1,688 1,228 37% - 242 - 152 - 59% 33,530 33,886 - 1%
thereof contribution to consolidated sales 16,515 17,754 - 7% 6,489 6,301 3% 8,983 8,652 4% 1,541 1,174 31% 2 5 - 60% 33,530 33,886 - 1%
thereof intercompany sales 32 30 7% 55 57 - 4% 10 16 - 38% 147 54 172% - 244 - 157 - 55% 0 0
contribution to consolidated sales 49% 52% 19% 19% 27% 26% 5% 3% 0% 0% 100% 100%
EBITDA 3,031 3,298 - 8% 1,434 1,483 - 3% 1,429 1,426 0% 133 87 53% 654 - 268 -- 6,681 6,026 11%
Depreciation and amortization 725 736 - 1% 295 306 - 4% 377 374 1% 23 11 109% 10 10 0% 1,430 1,437 0%
EBIT 2,306 2,562 - 10% 1,139 1,177 - 3% 1,052 1,052 0% 110 76 45% 644 - 278 -- 5,251 4,589 14%
Net interest - 301 - 365 17% - 108 - 119 9% - 167 - 155 - 8% - 9 - 2 -- - 2 - 26 92% - 587 - 667 12%
Income taxes - 424 - 679 37% - 246 - 317 22% - 189 - 164 - 15% - 28 - 23 - 22% - 63 294 - 121% - 950 - 889 - 7%
Net income attributable to shareholders of Fresenius SE & Co. KGaA 1,337 1,244 7% 742 702 6% 686 728 - 6% 72 50 44% - 810 - 910 11% 2,027 1,814 12%
Operating cash flow 2,062 2,192 - 6% 1,040 1,010 3% 554 733 - 24% 106 42 152% - 20 - 40 50% 3,742 3,937 - 5%
Cash flow before acquisitions and dividends 1,059 1,351 - 22% 487 590 - 17% 120 322 - 63% 77 35 120% - 78 - 66 - 18% 1,665 2,232 - 25%
Total assets 26,242 24,025 9% 12,638 11,792 7% 16,504 16,583 0% 2,160 1,282 68% - 841 - 549 - 53% 56,703 53,133 7%
Debt 7,546 7,448 1% 3,867 4,806 - 20% 6,219 6,665 - 7% 535 245 118% 817 - 122 -- 18,984 19,042 0%
Other operating liabilities 5,168 5,282 - 2% 3,107 2,879 8% 2,051 2,027 1% 912 621 47% 189 452 - 58% 11,427 11,261 1%
Capital expenditure, gross 1,057 944 12% 572 428 34% 441 415 6% 44 16 175% 49 25 96% 2,163 1,828 18%
Acquisitions, gross / investments 957 683 40% 43 157 - 73% 60 5,979 - 99% 496 33 -- - 470 0 1,086 6,852 - 84%
Research and development expenses 134 131 2% 534 427 25% - – -- 0 0 5 0 673 558 21%
Employees (per capita on balance sheet date) 120,328 121,245 - 1% 37,843 36,380 4% 100,144 105,927 - 5% 17,299 8,667 100% 1,136 1,030 10% 276,750 273,249 1%
Key figures
EBITDA margin 18.3% 18.5% 21.9% 23.3% 15.9% 16.5% 7.9% 7.1% 17.9% 7 18.5% 1
EBIT margin 13.9% 14.4% 17.4% 18.5% 11.7% 12.1% 6.5% 6.2% 13.6% 7 14.3% 1
Depreciation and amortization in % of sales 4.4% 4.1% 4.5% 4.8% 4.2% 4.3% 1.4% 0.9% 4.3% 4.2%
Operating cash flow in % of sales 12.5% 12.3% 15.9% 15.9% 6.2% 8.5% 6.3% 3.4% 11.2% 11.6%
ROOA 10.0% 10.9% 11.1% 10.8% 6.8% 6.9% 9.1% 9.8% 9.0% 9 9.4% 8
1 Before transaction-related effects and FCPA provision2 Before FCPA provision and book gain from U.S. tax reform3 Before transaction-related effects and revaluations of biosimilars contingent liabilities4 Before transaction-related effects and book gain from U.S. tax reform5 After transaction-related effects, revaluations of biosimilars contingent liabilities and FCPA provision6 After transaction-related effects, FCPA provision and book gain from U.S. tax reform7 Before transaction-related effects, revaluations of biosimilars contingent liabilities and FCPA provision8 The underlying pro forma EBIT does not include transaction-related expenses and FCPA provision.9 The underlying pro forma EBIT does not include transaction-related expenses, revaluations of biosimilars contingent liabilities and FCPA provision.
The consolidated segment reporting by business segment is an integral part of the notes.The following notes are an integral part of the consolidated financial statements.

Consolidated Financial Statements172
Financial S
tatements
173 General notes
173 1. Principles
173 I. Group structure
173 II. Basis of presentation
174 III. Summary of significant accounting policies
188 IV. Critical accounting policies
191 2. Acquisitions, divestitures and investments
194 Notes on the consolidated statement of income
194 3. Special items
194 4. Sales
195 5. Cost of materials
195 6. Personnel expenses
195 7. Research and development expenses
195 8. General and administrative expenses
196 9. Other operating income and expenses
196 10. Net interest
196 11. Taxes
198 12. Noncontrolling interest
198 13. Earnings per share
199 Notes on the consolidated statement of financial position
199 14. Cash and cash equivalents
199 15. Trade accounts and other receivables
200 16. Inventories
201 17. Other current and non-current assets
202 18. Property, plant and equipment
203 19. Goodwill and other intangible assets
206 20. Provisions
207 21. Other liabilities
208 22. Debt and capital lease obligations
214 23. Bonds
216 24. Convertible bonds
216 25. Pensions and similar obligations
222 26. Noncontrolling interest
222 27. Fresenius SE & Co. KGaA shareholders’ equity
224 28. Other comprehensive income (loss)
225 Other notes
225 29. Commitments and contingencies
235 30. Financial instruments
246 31. Supplementary information on capital management
247 32. Supplementary information on the consolidated
statement of cash flows
249 33. Notes on the consolidated segment reporting
250 34. Share-based compensation plans
258 35. Related party transactions
258 36. Subsequent events
259 Notes in accordance with the German Commercial Code (HGB)
259 37. Compensation of the Management Board and
the Supervisory Board
260 38. Auditor’s fees
260 39. Corporate Governance
260 40. Proposal for the distribution of earnings
261 41. Responsibility statement
TABLE OF CONTENTS NOTES

Consolidated Financial Statements General notes 173
Fin
anci
al S
tate
men
ts
GENERAL NOTES
1. PRINCIPLES
I. GROUP STRUCTURE
Fresenius is a global health care group with products and ser-
vices for dialysis, hospitals and outpatient medical care. In
addition, the Fresenius Group focuses on hospital operations
and also manages projects and provides services for hospi-
tals and other health care facilities worldwide. Besides the
activities of the parent company Fresenius SE & Co. KGaA,
Bad Homburg v. d. H., the operating activities were split into
the following legally independent business segments in the
fiscal year 2018:
▶ Fresenius Medical Care
▶ Fresenius Kabi
▶ Fresenius Helios
▶ Fresenius Vamed
Fresenius Medical Care offers services and products for
patients with chronic kidney failure. As of December 31, 2018,
Fresenius Medical Care treated 333,331 patients at 3,928 dial-
ysis clinics. Dialyzers and dialysis machines are among the
most important product lines. In addition, Fresenius Medical
Care offers dialysis-related services, among others in the
field of Care Coordination.
Fresenius Kabi specializes in intravenously administered
generic drugs (IV drugs), clinical nutrition, and infusion ther-
apies. The company is also a supplier of medical devices and
products of transfusion technology. In addition, Fresenius
Kabi is developing products with a focus on oncology and auto-
immune diseases within its biosimilars segment.
Fresenius Helios is Europe’s leading private hospital oper-
ator. The company comprises Helios Germany and Helios
Spain (Quirónsalud); both are part of the holding company
Helios Health. At the end of 2018, Helios Germany operated
a total of 86 hospitals, around 125 outpatient clinics, and
10 prevention centers. Quirónsalud operated 47 hospitals,
57 outpatient centers, and around 300 occupational risk
prevention centers at the end of 2018.
Fresenius Vamed manages projects, provides services for
hospitals and other health care facilities worldwide and is a
leading post-acute care provider in Central Europe. The port-
folio ranges along the entire value chain – from project devel-
opment, planning, and turnkey construction, via maintenance
and technical management, to total operational management.
Fresenius SE & Co. KGaA owned 30.75% of the subscribed
capital of Fresenius Medical Care AG & Co. KGaA (FMC-AG &
Co. KGaA) at the end of the fiscal year 2018. Fresenius Medical
Care Management AG, the general partner of FMC-AG &
Co. KGaA, is a wholly owned subsidiary of Fresenius SE &
Co. KGaA. Through this structure, Fresenius SE & Co. KGaA
has rights that give Fresenius SE & Co. KGaA the ability to
direct the relevant activities and, hence, the earnings of
FMC-AG & Co. KGaA. Therefore, FMC-AG & Co. KGaA is fully
consolidated in the consolidated financial statements of the
Fresenius Group.
Fresenius SE & Co. KGaA continued to hold 100% of the
management companies of the business segments Fresenius
Kabi ( Fresenius Kabi AG) as well as Fresenius Helios and
Fresenius Vamed (both held through Fresenius ProServe
GmbH) on December 31, 2018. Through Fresenius ProServe
GmbH, Fresenius SE & Co. KGaA holds 100% in HELIOS
Kliniken GmbH and Helios Healthcare Spain S.L. (Quirón-
salud) as well as a 77% stake in VAMED AG. In addition,
Fresenius SE & Co. KGaA holds interests in companies with
holding functions regarding real estate, financing and insur-
ance, as well as in Fresenius Netcare GmbH which offers ser-
vices in the field of information technology.
The reporting currency in the Fresenius Group is the
euro. In order to make the presentation clearer, amounts are
mostly shown in million euros. Amounts under € 1 million
after rounding are marked with “–”.
II. BASIS OF PRESENTATION
Fresenius SE & Co. KGaA, as a stock exchange listed com-
pany with a domicile in a member state of the European
Union (EU), fulfills its obligation to prepare and publish the
consolidated financial statements in accordance with the
International Fi nan cial Reporting Standards (IFRS) applying
Section 315e of the German Commercial Code (HGB). The
consolidated fi nan cial statements of Fresenius SE & Co. KGaA
at December 31, 2018 have been prepared and are published
in accordance with the Standards valid on the date of the

Consolidated Financial Statements174
Financial S
tatements
statement of financial position issued by the International
Accounting Standards Board (IASB) and the mandatory Inter-
pretations of the International Financial Reporting Interpreta-
tions Committee (IFRIC), which are binding to be applied in
the EU. The financial statements are also in accordance with
IFRS as issued by the IASB.
The Fresenius Group has applied IFRS 15, Revenue from
Contracts with Customers, and IFRS 9, Financial Instruments,
since January 1, 2018. As a result of the implementation, the
Fresenius Group has updated its accounting policies accord-
ingly. Changes in the accounting policies due to the imple-
mentation of IFRS 15 and IFRS 9 are described in note
1. III. cc, Recent pronouncements, applied. For all other issues,
the accounting policies applied in the accompanying con-
solidated financial statements are the same as those applied
in the consolidated financial statements as of December 31,
2017.
In order to improve readability, various items are aggre-
gated in the consolidated statement of financial position and
in the consolidated statement of income. These items are
shown separately in the notes to provide useful information
to the readers of the consolidated financial statements.
Moreover, the notes include information required by HGB
according to Section 315e (1) HGB. The consolidated finan-
cial statements include a management report according to
Section 315e HGB in conjunction with Section 315 HGB.
The consolidated statement of financial position contains
all information required to be disclosed by International
Accounting Standard (IAS) 1, Presentation of Financial State-
ments, and is classified on the basis of the maturity of assets
and liabilities. The consolidated statement of income is classi-
fied using the cost-of-sales accounting format.
The general partner of Fresenius SE & Co. KGaA is
Fresenius Management SE. Fresenius Management SE pre-
pares its own consolidated financial statements.
At February 19, 2019, the Management Board of Fresenius
Management SE authorized the consolidated financial state-
ments for issue and passed it to the Supervisory Board of
Fresenius SE & Co. KGaA. The Supervisory Board has to review
the consolidated financial statements.
III. SUMMARY OF SIGNIFICANT ACCOUNTING
POLICIES
a) Principles of consolidationThe financial statements of consolidated entities have been
prepared using uniform accounting methods. The acquisi-
tions of companies are accounted for applying the purchase
method.
Capital consolidation is performed by offsetting invest-
ments in subsidiaries against the underlying revaluated equity
at the date of acquisition. The identifiable assets and liabili-
ties of subsidiaries as well as the noncontrolling interest are
recognized at their fair values. Any remaining debit balance
between the investments in subsidiaries plus the non con trol-
ling interest and the revaluated equity is recognized as good-
will and is tested at least once a year for impairment.
All significant intercompany sales, expenses, income,
receivables and payables are eliminated. Profits and losses on
items of property, plant and equipment and inventory acquired
from other Group entities are also eliminated. Deferred tax
assets and liabilities are recognized on temporary differences
resulting from consolidation procedures.
Noncontrolling interest is comprised of the interest of non-
controlling shareholders in the consolidated equity of Group
entities and is recognized at its fair value at date of first consol-
idation. Profits and losses attributable to the non controlling
interests are separately disclosed in the consolidated statement
of income. As far as the Fresenius Group, as option writer
on behalf of existing put options, can be obliged to purchase
noncontrolling interests held by third parties, the potential
purchase price liability is recorded in long-term provisions
and other long-term liabilities as well as short-term provisions
and other short-term liabilities at fair value at the date of the
consolidated financial statements. According to the present
access method, non con trolling interests are further recorded
in equity as noncontrolling interests. The initial recognition
of the purchase price liability as well as valuation differences
are recorded neutral to profit or loss through equity.
Generally, entities in which Fresenius SE & Co. KGaA,
directly or indirectly, holds more than 20% and less than 50%
of the voting rights and can exercise a significant influence
over their financial and operating policies are associated com-
panies. These companies are consolidated using the equity
method. Investments that are not classified as in associated
companies are recorded at acquisition costs or at fair value,
respectively.

Consolidated Financial Statements General notes 175
Fin
anci
al S
tate
men
ts
b) Composition of the GroupBesides Fresenius SE & Co. KGaA, the consolidated financial
statements include all material subsidiaries according to
IFRS 10 and IFRS 11, over which Fresenius SE & Co. KGaA has
control or significant influence. Fresenius SE & Co. KGaA con-
trols an entity if it has power over the entity. That is, Fresenius
SE & Co. KGaA has existing rights that give Fresenius SE &
Co. KGaA the current ability to direct the relevant activities,
which are the activities that significantly affect Fresenius SE &
Co. KGaA’s return. In addition, Fresenius SE & Co. KGaA is
exposed to, or has rights to, variable returns from the involve-
ment with the entity and Fresenius SE & Co. KGaA has the
ability to use its power over the entity to affect the amount of
Fresenius SE & Co. KGaA’s return.
Fresenius Vamed participates in project entities which are
set up for long-term defined periods of time and for the spe-
cific purpose of constructing and operating thermal centers.
These project entities are not controlled by Fresenius Vamed
and therefore are not consolidated. The project entities gen-
erated approximately € 123 million in sales in 2018 (2017:
€ 119 million). The project entities finance themselves mainly
through debt, profit participation rights and investment grants.
Assets and liabilities relating to the project entities are not
material. Fresenius Vamed made no payments to the project
entities other than contractually stipulated. From today’s
perspective and due to the contractual situation, Fresenius
Vamed is not exposed to any material risk of loss from these
project entities.
The consolidated financial statements of 2018 included,
in addition to Fresenius SE & Co. KGaA, 2,594 (2017: 2,733)
fully consolidated companies and 49 (2017: 50) companies
were accounted for under the equity method. In 2018, there
were no material changes in the scope of consolidated enti-
ties, except for those mentioned in note 2, Acquisitions,
divestitures and investments.
The complete list of the investments of Fresenius SE &
Co. KGaA, registered office in 61352 Bad Homburg v. d. H.,
Else-Kröner-Straße 1, registered in the Commercial Register
of the local court in Bad Homburg v. d. H. under B11852,
will be submitted to the electronic Federal Gazette and the
electronic companies register.
For the fiscal year 2018, the following fully consolidated
German subsidiaries of the Fresenius Group will apply the
exemption provided in Sections 264 (3) and 264b, respec-
tively, of the German Commercial Code (HGB):
Name of the company Registered office
Corporate / Other
Fresenius Biotech Beteiligungs GmbH Bad Homburg v. d. H.
Fresenius Immobilien-Verwaltungs-GmbH & Co. Objekt Friedberg KG Bad Homburg v. d. H.
Fresenius Immobilien-Verwaltungs-GmbH & Co. Objekt St. Wendel KG Bad Homburg v. d. H.
Fresenius Immobilien-Verwaltungs-GmbH & Co. Objekt Schweinfurt KG Bad Homburg v. d. H.
Fresenius Netcare GmbH Bad Homburg v. d. H.
Fresenius ProServe GmbH Bad Homburg v. d. H.
FPS Immobilien VerwaltungsGmbH & Co. Reichenbach KG Bad Homburg v. d. H.
ProServe Krankenhaus Beteiligungs-gesellschaft mbH & Co. KG München
Fresenius Kabi
Fresenius HemoCare GmbH Bad Homburg v. d. H.
Fresenius HemoCare Beteiligungs GmbH Bad Homburg v. d. H.
Fresenius Kabi AG Bad Homburg v. d. H.
Fresenius Kabi Deutschland GmbH Bad Homburg v. d. H.
Fresenius Kabi Digital Lab GmbH Berlin
Fresenius Kabi Logistik GmbH Friedberg
MC Medizintechnik GmbH Alzenau
medi1one medical gmbh Waiblingen
Fresenius Helios
Gesundheitsmanagement Elbe-Fläming GmbH Burg
Helios Agnes-Karll Krankenhaus GmbH Bad Schwartau
Helios Aukamm-Klinik Wiesbaden GmbH Wiesbaden
Helios Beteiligungs Aktiengesellschaft Berlin
Helios Bördeklinik GmbH Oschersleben
Helios Fachklinik Schleswig GmbH Schleswig
Helios Fachklinik Vogelsang-Gommern GmbH Gommern
Helios Fachkliniken Hildburghausen GmbH Hildburghausen
Helios Hanseklinikum Stralsund GmbH Stralsund
Helios Health GmbH Berlin
Helios Klinik Blankenhain GmbH Blankenhain
Helios Klinik Bleicherode GmbH Bleicherode
Helios Klinik für Herzchirurgie Karlsruhe GmbH Karlsruhe
Helios Klinik Jerichower Land GmbH Burg
Helios Klinik Leezen GmbH Leezen
Helios Klinik Leisnig GmbH Leisnig
Helios Klinik Lengerich GmbH Lengerich
Helios Klinik Rottweil GmbH Rottweil
Helios Klinik Schkeuditz GmbH Schkeuditz
Helios Klinik Schleswig GmbH Schleswig
Helios Klinik Volkach GmbH Volkach
Helios Klinik Wipperfürth GmbH Wipperfürth
Helios Klinik Zerbst / Anhalt GmbH Zerbst
Helios Kliniken GmbH Berlin
Helios Kliniken Breisgau Hochschwarzwald GmbH Müllheim

Consolidated Financial Statements176
Financial S
tatements
c) ClassificationsCertain items in the consolidated financial statements of
2017 have been reclassified to conform with the presentation
in 2018.
In the prior year’s comparative consolidated financial
statements, finance lease receivables in the amount of € 58 mil-
lion have been reclassified from other currents assets (see
note 17, Other current and non-current assets) to trade
accounts and other receivables (see note 15, Trade accounts
and other receivables) to conform to the current year’s
presentation.
The International Financial Reporting Interpretations
Committee (IFRIC) issued an agenda decision in September
2017 relating to the applicability of IAS 12, Income Taxes, to
the accounting for interest and penalties related to income
taxes. The IFRIC observed in the agenda decision that entities
do not have an accounting policy choice between applying
IAS 12 and applying IAS 37, Provisions, Contingent Liabilities
and Contingent Assets, to interest and penalties. In September
2018, the Accounting Standards Committee of Germany
(DRSC) approved this interpretation regarding the accounting
for interest and penalties related to German income taxes. The
effects identified on the Fresenius Group financial positions
are as follows: an increase of interest expense of € 26 million,
an increase of interest income of € 10 million and a decrease
of income taxes of € 16 million for 2017, an increase of long-
term provisions and other long-term liabilities of € 44 million,
a decrease of long-term accruals for income taxes of € 44 mil-
lion, an increase of short-term provisions and other short-term
liabilities of € 15 million and a decrease of short-term accruals
for income taxes of € 15 million as of December 31, 2017.
d) Hyperinflationary accountingStarting on July 1, 2018, the Fresenius Group’s subsidiaries
operating in Argentina applied IAS 29, Financial Reporting
in Hyperinflationary Economies, due to the inflationary devel-
opment in Argentina. For the fiscal year 2018, the adoption of
IAS 29 resulted in an effect on net income attributable to share-
holders of Fresenius SE & Co. KGaA of - € 12 million. As of
December 31, 2017, this adoption had an effect on Fresenius
SE & Co. KGaA shareholders’ equity of € 15 million.
Name of the company Registered office
Fresenius Helios
Helios Kliniken Mansfeld-Südharz GmbH Sangerhausen
Helios Kliniken Mittelweser GmbH Nienburg
Helios Kliniken Taunus GmbH Bad Schwalbach
Helios Klinikum Aue GmbH Aue
Helios Klinikum Bad Saarow GmbH Bad Saarow
Helios Klinikum Berlin-Buch GmbH Berlin
Helios Klinikum Erfurt GmbH Erfurt
Helios Klinikum Gifhorn GmbH Gifhorn
Helios Klinikum Gotha GmbH Gotha
Helios Klinikum Hildesheim GmbH Hildesheim
Helios Klinikum Meiningen GmbH Meiningen
Helios Klinikum Pirna GmbH Pirna
Helios Klinikum Schwelm GmbH Schwelm
Helios Klinikum Siegburg GmbH Siegburg
Helios Klinikum Uelzen GmbH Uelzen
Helios Klinikum Wuppertal GmbH Wuppertal
Helios Park-Klinikum Leipzig GmbH Leipzig
Helios Privatkliniken GmbH Bad Homburg v. d. H.
Helios-SERVICE GmbH Wiesbaden
Helios Spital Überlingen GmbH Überlingen
Helios St. Elisabeth Klinik Oberhausen GmbH Oberhausen
Helios St. Elisabeth-Krankenhaus Bad Kissingen GmbH Bad Kissingen
Helios St. Josefs-Hospital GmbH Bochum
Helios St. Marienberg Klinik Helmstedt GmbH Helmstedt
Helios Versorgungszentren GmbH Berlin
Helios Vogtland-Klinikum Plauen GmbH Plauen
Helios Weißeritztal-Kliniken GmbH Freital
Herzzentrum Leipzig GmbH Leipzig
Kliniken Miltenberg-Erlenbach GmbH Erlenbach
Medizinisches Versorgungszentrum am Helios Klinikum Bad Saarow GmbH Bad Saarow
MVZ Campus Gifhorn GmbH Gifhorn
Poliklinik am Helios Klinikum Buch GmbH Berlin

Consolidated Financial Statements General notes 177
Fin
anci
al S
tate
men
ts
e) Sales recognition policyRevenue is recognized in accordance with IFRS 15, Revenue
from Contracts with Customers.
Revenues from services and products are billed according
to the usual contract arrangements with customers, patients
and related third parties. For services performed for patients,
the transaction price is estimated based on either Fresenius
Group’s standard rates, rates determined under reimburse-
ment arrangements or by government regulations. These
arrangements are generally with third party payors, such as
U.S. Medicare, U.S. Medicaid, German health insurance
funds or commercial insurers. Deductions from rebates and
discounts that are contractually agreed are taken into
account to determine the expected recoverable amount
which is calculated on the basis of historical data.
If the collection of the billed amount or a portion of the
billed amount for services performed for patients is consid-
ered to be uncertain at the time services are performed, the
Fresenius Group concludes that the consideration is variable
(implicit price concession) and records the difference between
the billed amount and the amount estimated to be collect-
ible as a reduction to health care services revenue. Implicit
price concessions include such items as amounts due from
patients without adequate in surance coverage and patient co-
payment and deductible amounts due from patients with
health care coverage. The Fresenius Group determines implicit
price concessions primarily upon past collection history.
Revenue from services is generally recognized on the date
the service is performed. At this point of time the payor is
obliged to pay for the performed services.
Revenue from product sales is recognized when the
customer obtains control of the product, either after posses-
sion is transferred or upon installation and provision of the
necessary technical instructions or at another point in time
that better defines transfer of control.
A portion of revenues is generated from contracts which
on the one hand give the customer the right to use dialysis
machines and on the other hand provide the customer with
disposables and services. In this case, the transaction price
is allocated in accordance with IFRS 15, and revenue is rec-
ognized separately for the lease and the non-lease compo-
nents of the contract in accordance with IAS 17 and IFRS 15,
respectively.
Fresenius Vamed has performance obligations from long-
term production contracts that are satisfied over time. Reve-
nue is recognized according to progress towards completion.
This progress towards completion of the performance obli-
gation is measured based on the costs incurred in relation to
expected total costs of fulfilling the contract, contractually
defined milestones or performance completed to date which-
ever better reflects the progress towards completion of the
performance obligation.
IFRS 15 does not apply to lease and insurance contracts.
Revenue from leasing components and insurance contracts is
determined according to IAS 17 and IFRS 4, respectively.
Sales are reported net of sales tax.
f) Government grantsThe Fresenius Group primarily receives governmental fund-
ing for hospitals in Germany to finance buildings and medical
equipment. Public sector grants are not recognized until
there is reasonable assurance that the respective conditions
are met and the grants will be received. Initially, the grant is
recorded as a liability and as soon as the asset is acquired, the
grant is offset against the acquisition costs. Expense-related
grants are recognized as income in the periods in which related
costs occur.
g) Research and development expensesResearch is the independent and planned investigation under-
taken with the prospect of gaining new scientific or tech-
nical knowledge and understanding. Development is the
technical and commercial implementation of research results
and occurs before the start of the commercial production or
use. The research and development phase of pharmaceutical
products normally ends with the regulatory approval by the
relevant authorities on the market of the particular country.

Consolidated Financial Statements178
Financial S
tatements
Generally, a new pharmaceutical product is primarily approved
on an established market, as such are considered Europe,
the United States, China and Japan.
Research expenses are expensed as incurred. Develop-
ment expenses that fully meet the criteria for the recognition
of an intangible asset are capitalized as intangible asset.
h) ImpairmentThe Fresenius Group reviews the carrying amounts of its prop-
erty, plant and equipment, intangible assets and other non-
current assets for impairment whenever events or changes
in circumstances indicate that the carrying amount is higher
than the asset’s recoverable amount. The recoverable amount
is the higher of the net realizable value and its value in use.
The net realizable value of an asset is defined as its fair value
less costs to sell. The value in use is the present value of
future cash flows expected to be derived from the relevant
asset. If it is not possible to estimate the future cash flows
from the individual assets, impairment is tested on the basis
of the future cash flows of the corresponding cash generat-
ing units.
Impairment losses, except impairment losses recognized
on goodwill, are reversed as soon as the reasons for impair-
ment no longer exist. This reversal shall not exceed the carry-
ing amount that would have been determined had no impair-
ment loss been recognized before.
Assets held for sale are reported at the lower of their car-
rying amount and fair value less costs to sell. As long as the
company intends to sell the asset, it is not depreciated.
i) Capitalized interestThe Fresenius Group includes capitalized interest as part of
the cost of the asset if it is directly attributable to the acquisi-
tion, construction or manufacture of qualifying assets. For
the fiscal years 2018 and 2017, interest of € 8 million and
€ 5 million, based on an average interest rate of 3.51% and
4.12%, respectively, was recognized as a component of the
cost of assets.
j) Income taxesCurrent taxes are calculated based on the earnings of the
fiscal year and in accordance with local tax rules of the respec-
tive tax jurisdictions. Expected and executed additional tax
payments and tax refunds for prior years are also taken into
account.
Deferred tax assets and liabilities are recognized for the
future consequences attributable to temporary differences
between the financial statement carrying amounts of existing
assets and liabilities and their respective tax basis. Further-
more, deferred taxes are recognized on certain consolidation
procedures affecting net income attributable to shareholders
of Fresenius SE & Co. KGaA. Deferred tax assets also include
claims to future tax reductions which arise from the probably
expected usage of existing tax losses available for carryfor-
ward. The recognition of deferred tax assets from net operat-
ing losses and their utilization is based on the budget planning
of the Fresenius Group and implemented tax strategies.
Deferred tax assets and liabilities are measured at the tax
rates that are expected to apply to the period when the asset
is realized or the liability is settled, based on tax rates that
have been enacted or substantially enacted by the end of the
reporting period. A change in tax rate for the calculation of
deferred tax assets and liabilities is recognized in the period
the new laws are enacted or substantively enacted. The
effects of the adjustment are generally recognized in the
income statement. The effects of the adjustment are recog-
nized in equity, if the temporary differences are related to
items directly recognized in equity.
The realizability of the carrying amount of a deferred tax
asset is reviewed at each date of the statement of financial
position. In assessing the realizability of deferred tax assets,
the Management considers to which extent it is probable
that the deferred tax asset will be realized. The ultimate real-
ization of deferred tax assets is dependent upon the gen-
eration of future taxable income during the periods in which
those temporary differences and tax loss carryforwards
become deductible. The Management considers the expected
reversal of deferred tax liabilities and projected future
taxable income in making this assessment.

Consolidated Financial Statements General notes 179
Fin
anci
al S
tate
men
ts
If it is probable that sufficient taxable income will be avail-
able for the utilization of parts or of the entire deferred tax
asset, the deferred tax asset is recognized to this certain
extent.
The Fresenius Group recognizes assets and liabilities for
uncertain tax treatments to the extent it is probable the tax
will be recovered or that the tax will be payable, respectively.
The Fresenius Group recognizes interest related to its income
tax positions as interest expense and penalties as general and
administrative expenses.
The Fresenius Group is subject to ongoing and future tax
audits in the United States, Germany and other jurisdictions.
Different interpretations of tax laws may lead to potential addi-
tional tax payments or tax refunds for prior years. To con-
sider income tax accruals or income tax receivables of uncer-
tain tax assessments, management’s estimations are based
on local tax rules of the respective tax jurisdiction and the
interpretation of such. Estimates are adjusted in the period in
which there is sufficient evidence which legitimates the
adjustment of the assumption.
k) Earnings per shareBasic earnings per share are computed by dividing net income
attributable to shareholders of Fresenius SE & Co. KGaA by
the weighted-average number of ordinary shares outstanding
during the year. Diluted earnings per share include the effect
of all potentially dilutive instruments on ordinary shares that
would have been outstanding during the fiscal year. The
equity-settled awards granted under Fresenius’ and Fresenius
Medical Care’s stock option plans can result in a dilutive effect.
l) InventoriesInventories are comprised of all assets which are held for sale
in the ordinary course of business (finished goods), in the
process of production for such sale (work in process) or con-
sumed in the production process or in the rendering of ser-
vices (raw materials and purchased components).
Inventories are measured at the lower of acquisition and manu-
facturing cost (determined by using the average or first-in,
first-out method) or net realizable value. Manufacturing costs
are comprised of direct costs, production and material over-
head, including depreciation charges.
m) Property, plant and equipmentProperty, plant and equipment are stated at acquisition and
manufacturing cost less accumulated depreciation. Repairs
and maintenance costs are recognized in profit and loss as
in curred. The costs for the replacement of components or the
general overhaul of property, plant and equipment are recog-
nized, if it is probable that future economic benefits will flow
to the Fresenius Group and these costs can be measured reli-
ably. Depreciation on property, plant and equipment is calcu-
lated using the straight-line method over the estimated useful
lives of the assets ranging from 3 to 50 years for buildings
and improvements (with a weighted-average life of 16 years)
and 2 to 15 years for machinery and equipment (with a
weighted-average life of 11 years).
n) Intangible assets with finite useful livesIntangible assets with finite useful lives, such as patents, prod-
uct and distribution rights, non-compete agreements, tech-
nology as well as licenses to manufacture, distribute and sell
pharmaceutical drugs are recognized and reported apart from
goodwill and are amortized using the straight-line method
over their respective useful lives to their residual values and
reviewed for impairment (see note 1. III. h, Impairment).
Patient relationships however are not reported as separate
intangible assets due to the missing contractual basis but are
part of goodwill. The useful lives of patents, product and
distribution rights range from 5 to 20 years, the average use-
ful life is 13 years. The useful lives of customer relationships
vary from 6 to 15 years, the average useful life is 10 years.
Non- compete agreements with finite useful lives have useful
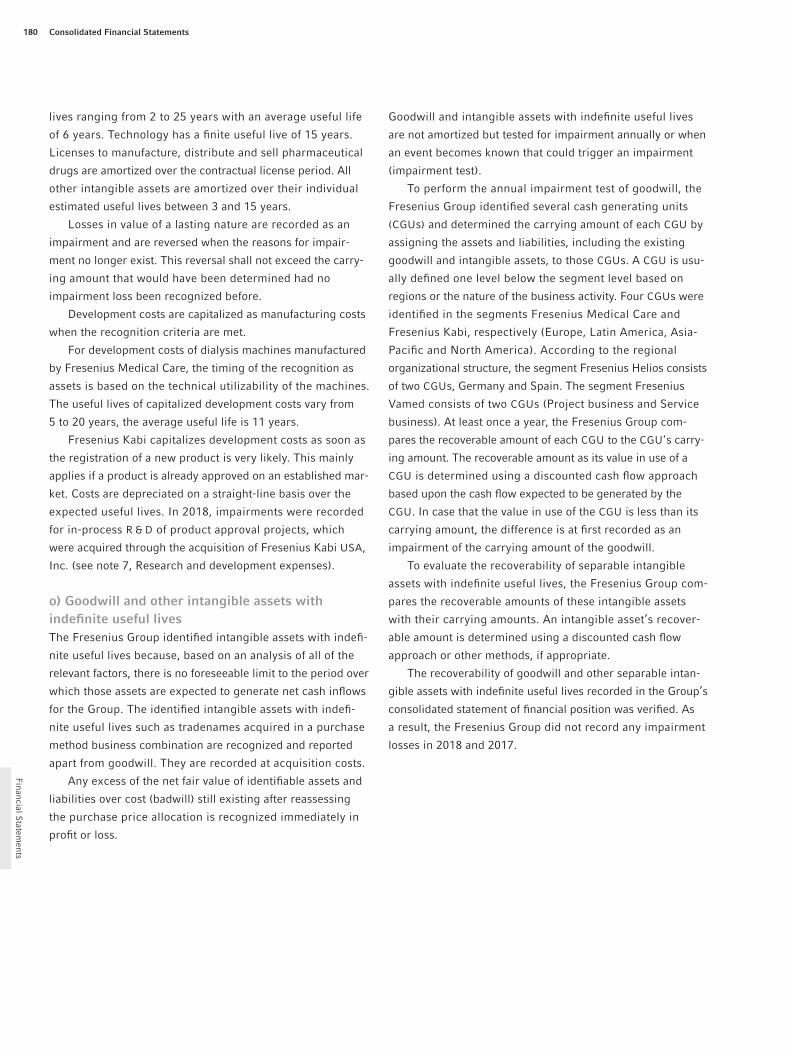
Consolidated Financial Statements180
Financial S
tatements
lives ranging from 2 to 25 years with an average useful life
of 6 years. Technology has a finite useful live of 15 years.
Licenses to manufacture, distribute and sell pharmaceutical
drugs are amortized over the contractual license period. All
other intangible assets are amortized over their individual
estimated useful lives between 3 and 15 years.
Losses in value of a lasting nature are recorded as an
impairment and are reversed when the reasons for impair-
ment no longer exist. This reversal shall not exceed the carry-
ing amount that would have been determined had no
impairment loss been recognized before.
Development costs are capitalized as manufacturing costs
when the recognition criteria are met.
For development costs of dialysis machines manufactured
by Fresenius Medical Care, the timing of the recognition as
assets is based on the technical utilizability of the machines.
The useful lives of capitalized development costs vary from
5 to 20 years, the average useful life is 11 years.
Fresenius Kabi capitalizes development costs as soon as
the registration of a new product is very likely. This mainly
applies if a product is already approved on an established mar-
ket. Costs are depreciated on a straight-line basis over the
expected useful lives. In 2018, impairments were recorded
for in-process R & D of product approval projects, which
were acquired through the acquisition of Fresenius Kabi USA,
Inc. (see note 7, Research and development expenses).
o) Goodwill and other intangible assets with indefinite useful livesThe Fresenius Group identified intangible assets with indefi-
nite useful lives because, based on an analysis of all of the
relevant factors, there is no foreseeable limit to the period over
which those assets are expected to generate net cash inflows
for the Group. The identified intangible assets with indefi-
nite useful lives such as tradenames acquired in a purchase
method business combination are recognized and reported
apart from goodwill. They are recorded at acquisition costs.
Any excess of the net fair value of identifiable assets and
liabilities over cost (badwill) still existing after reassessing
the purchase price allocation is recognized immediately in
profit or loss.
Goodwill and intangible assets with indefinite useful lives
are not amortized but tested for impairment annually or when
an event becomes known that could trigger an impairment
(impairment test).
To perform the annual impairment test of goodwill, the
Fresenius Group identified several cash generating units
(CGUs) and determined the carrying amount of each CGU by
assigning the assets and liabilities, including the existing
goodwill and intangible assets, to those CGUs. A CGU is usu-
ally defined one level below the segment level based on
regions or the nature of the business activity. Four CGUs were
identified in the segments Fresenius Medical Care and
Fresenius Kabi, respectively (Europe, Latin America, Asia-
Pacific and North America). According to the regional
organizational structure, the segment Fresenius Helios consists
of two CGUs, Germany and Spain. The segment Fresenius
Vamed consists of two CGUs (Project business and Service
business). At least once a year, the Fresenius Group com-
pares the recoverable amount of each CGU to the CGU’s carry-
ing amount. The recoverable amount as its value in use of a
CGU is determined using a discounted cash flow approach
based upon the cash flow expected to be generated by the
CGU. In case that the value in use of the CGU is less than its
carrying amount, the difference is at first recorded as an
impairment of the carrying amount of the goodwill.
To evaluate the recoverability of separable intangible
assets with indefinite useful lives, the Fresenius Group com-
pares the recoverable amounts of these intangible assets
with their carrying amounts. An intangible asset’s recover-
able amount is determined using a discounted cash flow
approach or other methods, if appropriate.
The recoverability of goodwill and other separable intan-
gible assets with indefinite useful lives recorded in the Group’s
consolidated statement of financial position was verified. As
a result, the Fresenius Group did not record any impairment
losses in 2018 and 2017.

Consolidated Financial Statements General notes 181
Fin
anci
al S
tate
men
ts
p) LeasesLeased assets assigned to the Fresenius Group based on the
risk and rewards approach (finance leases) are recognized as
property, plant and equipment and measured on receipt date
at the present values of lease payments as long as their fair val-
ues are not lower. Leased assets are depreciated in straight-
line over their useful lives. If there is doubt as to whether title
to the asset passes at a later stage and there is no opportune
purchase option, the asset is depreciated over the lease term
if this is shorter. An impairment loss is recognized if the
recoverable amount is lower than the amortized cost of the
leased asset. The impairment loss is reversed if the reasons
for impairment no longer exist.
Finance lease liabilities are measured at the present value
of the future lease payments and are recognized as a finan-
cial liability.
Property, plant and equipment that is rented by the
Fresenius Group, is accounted for at its purchase cost. Depre-
ciation is calculated using the straight-line method over the
leasing time and its expected residual value.
q) Financial instrumentsA financial instrument is any contract that gives rise to a
financial asset of one entity and a financial liability or equity
instrument of another entity.
Purchases and sales of financial assets are accounted for
on the trading day. Furthermore, the Fresenius Group does not
make use of the fair value option, which allows financial lia-
bilities to be classified at fair value through profit or loss
upon initial recognition. The Fresenius Group elects to repre-
sent changes in the fair value of selected equity investments
that are not held for trading in other comprehensive income
(loss).
Financial instruments are allocated to categories following
the analysis of the business model and cash flow characteris-
tics as required by IFRS 9, Financial Instruments. The follow-
ing categories are relevant for the Fresenius Group: financial
assets and liabilities measured at amortized cost, financial
assets and liabilities measured at fair value through profit
and loss and financial assets measured at fair value through
other comprehensive income (loss). The reconciliation of the
categories to the positions in the consolidated statement of
financial position is shown in tabular form in note 30, Finan-
cial instruments.
Cash and cash equivalents
Cash and cash equivalents comprise cash funds and all short-
term investments with maturities of up to three months.
Short-term investments are highly liquid and readily convert-
ible into known amounts of cash. The risk of changes in
value is insignificant.
Trade accounts and other receivables
Trade accounts and other receivables are stated at their
nominal value less lifetime expected credit losses.
Impairments
According to IFRS 9, impairments are recognized on the
basis of expected credit losses (expected credit loss model).
The Fresenius Group recognizes a loss allowance for
expected credit losses on financial assets measured at amor-
tized cost, contract assets and lease receivables as well as
for investments in debt instruments measured at fair value
through other comprehensive income.
The Fresenius Group recognizes loss allowances for expec-
ted credit losses (allowance for doubtful accounts) mainly for
trade accounts receivable and cash and cash equivalents. The
amount of expected credit losses is updated at each report-
ing date to reflect changes in credit risk since initial recogni-
tion of the respective instrument.
For trade accounts receivable, the Fresenius Group uses
the simplified method which requires recognizing lifetime
expected credit losses.
Expected credit losses on cash and cash equivalents are
measured according to the general method which is based on
12-month expected credit losses. Due to the short maturity
term of the financial instruments, this corresponds with the

Consolidated Financial Statements182
Financial S
tatements
lifetime expected loss. A significant increase in credit risk is
calculated on the basis of available quantitative and qualita-
tive information. Based on external credit ratings of the
counterparties, the Fresenius Group considers that its cash
and cash equivalents have a low credit risk.
The Fresenius Group does not expect any material credit
losses from financial instruments that are measured accord-
ing to the general approach.
The allowances are estimates comprised of customer
and financial asset specific evaluations regarding payment
history, current financial stability, and applicable future
economic conditions.
Financial assets whose expected credit loss is not assessed
individually are allocated to geographical regions. The
impairment is generally assessed on the basis of regional mac-
roeconomic indicators such as credit default swaps or
scoring models.
In case of objective evidence of a detrimental impact on
the estimated future cash flows of a financial asset, the asset
is considered to be credit impaired. This is generally the case
after more than 360 days overdue, at the latest.
When a counterpart defaults, all financial assets against
this counterpart are considered impaired. The definition of
default is mainly based on payment practices specific to indi-
vidual regions and businesses.
Non controlling interest subject to put provisions
The Fresenius Group, as option writer on behalf of existing
put options, can be obliged to purchase noncontrolling inter-
ests held by third parties. If these put provisions were exer-
cised, the Fresenius Group would be required to purchase all
or part of the third-party owners’ noncontrolling interests at
the appraised fair value at the time of exercise.
To estimate the fair values of the non controlling interest
subject to put provisions, the Fresenius Group recognizes the
higher of net book value or a multiple of earnings, based on
historical earnings, the development stage of the underlying
business and other factors. Additionally, there are put provi-
sions that are valued by an external valuation firm. The exter-
nal valuation estimates the fair values using a combination
of discounted cash flows and a multiple of earnings and / or rev-
enue. When applicable, the obligations are discounted at a
pre-tax discount rate which reflects the market valuation of
the interest effect and the specific risk of the obligation.
Depending on the market conditions, the estimated fair values
of the non controlling interest subject to these put provisions
can also fluctuate, the discounted cash flows and the implicit
multiple of earnings and / or revenue at which the noncon-
trolling interest subject to put provisions may ultimately be
settled could vary significantly from Fresenius Group’s
current estimates.
Derivative financial instruments
Derivative financial instruments, which primarily include for-
eign currency forward contracts and interest rate swaps, are
recognized at fair value as assets or liabilities in the consoli-
dated statement of financial position. The effective portion of
changes in fair value of cash flow hedges is recognized in accu-
mulated other comprehensive income (loss) in shareholders’
equity until the secured underlying transaction is realized (see
note 30, Financial instruments). The ineffective portion of
cash flow hedges is recognized in current earnings. Changes in
the fair value of derivatives that are not designated as hedging
instruments are recognized periodically in earnings.
Derivatives embedded in host contracts with a financial
liability as host contract are accounted for as separate deriva-
tives if their economic characteristics and risks are not closely
related to those of the host contracts. These embedded deriva-
tives are measured at fair value with changes in fair value
recognized in the income statement.
r) LiabilitiesAt the date of the statement of financial position, liabilities
are generally stated at amortized cost, which normally corre-
sponds to the settlement amount.

Consolidated Financial Statements General notes 183
Fin
anci
al S
tate
men
ts
s) Legal contingenciesIn the ordinary course of Fresenius Group’s operations, the
Fresenius Group is party to litigation and arbitration and
is subject to investigations relating to various aspects of its
business. The Fresenius Group regularly analyzes current
information about such claims for probable losses and pro-
vides accruals for such matters, including the estimated legal
expenses and consulting services in connection with these
matters, as appropriate. The Fresenius Group utilizes its inter-
nal legal department as well as external resources for these
assessments. In making the decision regarding the need for a
loss accrual, the Fresenius Group considers the degree of
probability of an unfavorable outcome and its ability to make
a reasonable estimate of the amount of loss.
The filing of a suit or formal assertion of a claim or assess-
ment, or the disclosure of any such suit or assertion, does not
necessarily indicate that accrual of a loss is appropriate.
t) ProvisionsAccruals for taxes and other obligations are recognized when
there is a present obligation to a third party arising from past
events, it is probable that the obligation will be settled in the
future and the amount can be reliably estimated.
Provisions for warranties and complaints are estimated
based on historical experience.
Tax accruals include obligations for the current year and
for prior years.
Non-current provisions with a remaining period of more
than one year are discounted to the present value of the
expenditures expected to settle the obligation.
u) Pension liabilities and similar obligationsPension obligations for post-employment benefits are mea-
sured in accordance with IAS 19 (revised 2011), Employee
Benefits, using the projected unit credit method, taking into
account future salary and trends for pension increase.
The Fresenius Group uses December 31 as the measure-
ment date when measuring the funded status of all plans.
Net interest costs are calculated by multiplying the pension lia-
bility at the beginning of the year with the discount rate
utilized in determining the benefit obligation. The pension lia-
bility results from the benefit obligation less the fair value of
plan assets.
Remeasurements include actuarial gains and losses result-
ing from the evaluation of the defined benefit obligation as
well as from the difference between actual return on plan
assets and the expected return on plan assets at the beginning
of the year used to calculate the net interest costs. In the
event of a surplus for a defined benefit pension plan, remea-
surements can also contain the effect from Asset Ceiling, as
far as this effect is not included in net interest costs.
Remeasurements are recognized in accumulated other
comprehensive income (loss) completely. It is not allowed to
reclassify the remeasurements in subsequent periods. Com-
ponents of net periodic benefit cost are recognized in profit
and loss of the period.
v) Debt issuance costsDebt issuance costs related to a recognized debt liability are
presented in the consolidated statement of financial position
as a direct deduction from the carrying amount of that debt
liability. These costs are amortized over the term of the
related obligation.
w) Share-based compensation plansThe total cost of stock options granted to members of the
Management Board and executive employees of the Fresenius
Group at the grant date were measured using an option
pricing model and are recognized as expense over the vesting
period of the stock option plans.
The measurement date fair value of cash-settled phan-
tom stocks granted to members of the Management Board
and executive employees of the Fresenius Group (except for
Fresenius Medical Care) and of cash-settled performance
shares granted to members of the Management Board and
executive employees of the Fresenius Group is calculated

Consolidated Financial Statements184
Financial S
tatements
using the Monte Carlo simulation. The corresponding liability
based on the measurement date fair value is accrued over the
vesting period of the phantom stock and performance share
plans.
The measurement date fair value of cash-settled phantom
stocks granted to members of the Management Board and
executive employees of Fresenius Medical Care is calculated
using a binomial model. The corresponding liability based
on the measurement date fair value is accrued over the vesting
period of the phantom stock plans.
x) Self-insurance programsUnder the insurance programs for professional, product and
general liability, auto liability, worker’s compensation claims
and medical malpractice claims, the largest subsidiary of
Fresenius Medical Care AG & Co. KGaA (FMC-AG & Co. KGaA),
located in the United States, is partially self-insured for pro-
fessional liability claims. For all other coverage, FMC-AG & Co.
KGaA assumes responsibility for incurred claims up to pre-
determined amounts, above which third party insurance
applies. Reported liabilities for the year represent estimated
future payments of the anticipated expense for claims incurred
(both reported and incurred but not reported) based on his-
torical experience and existing claim activity. This experience
includes both the rate of claims incidence (number) and
claim severity (cost) and is combined with individual claim
expectations to estimate the reported amounts.
y) Foreign currency translationThe reporting currency is the euro. Substantially all assets
and liabilities of the foreign subsidiaries that use a functional
currency other than the euro are translated at year-end
exchange rates, while income and expense are translated at
annual average exchange rates of the fiscal year. Adjust-
ments due to foreign currency translation fluctuations are
excluded from net earnings and are reported in accumulated
other com prehensive income (loss). In addition, the transla-
tion adjust ments of certain intercompany borrowings, which
are of a long-term nature, are also reported in accumulated
other comprehensive income (loss).
Gains and losses arising from the translation of foreign
currency positions as well as those arising from the elimina-
tion of foreign currency intercompany loans are recorded as
other operating income or expenses, as far as they are not
considered foreign equity instruments. In the fiscal year 2018,
only immaterial losses resulted out of this translation.
The exchange rates of the main currencies affecting for-
eign currency translation developed as follows:
Year-end exchange rate Average exchange rate
Dec. 31, 2018 Dec. 31, 2017 2018 2017
U.S. dollar per € 1.145 1.199 1.181 1.130
Chinese renminbi per € 7.875 7.804 7.808 7.629
Argentinean peso per € 43.039 22.639 32.984 18.754
Australian dollar per € 1.622 1.535 1.580 1.473
Brazilian real per € 4.444 3.973 4.308 3.605
Japanese yen per € 125.850 135.010 130.396 126.711
Korean won per € 1,277.930 1,279.610 1,299.071 1,276.738
Pound sterling per € 0.895 0.887 0.885 0.877
Russian ruble per € 79.715 69.392 74.026 65.938
Swedish krona per € 10.255 9.844 10.258 9.635

Consolidated Financial Statements General notes 185
Fin
anci
al S
tate
men
ts
In 2018, the Fresenius Group applied the following new stan-
dards relevant for its business for the first time:
IFRS 15
In May 2014, the International Accounting Standards Board
(IASB) issued IFRS 15, Revenue from Contracts with Cus-
tomers. This new standard specifies how and when companies
reporting under IFRS will recognize revenue and provides
users of financial statements with more informative and rele-
vant disclosures. IFRS 15 supersedes IAS 18, Revenue, IAS 11,
Construction Contracts, and a number of revenue-related
interpretations. This standard applies to nearly all contracts
with customers, the main exceptions are leases, financial
instruments and insurance con tracts. In September 2015, the
IASB issued the amendment Effective Date of IFRS 15, which
defers the effective date of IFRS 15 by one year to fiscal
years beginning on or after January 1, 2018. The Fresenius
Group adopted this standard as of January 1, 2018. In accor-
dance with the transition provisions in IFRS 15, the new prin-
ciples have been adopted only to those contracts that were
not completed contracts as of January 1, 2018 following the
cumulative effect method with no restatement of the compar-
ative periods presented.
IFRS 15 requires the consideration of implicit price con-
cessions when determining the transaction price which, upon
adoption, resulted in the implicit price concessions in the
business segment Fresenius Medical Care directly reducing
revenue in the amount of € 468 million for the fiscal year
2018. Prior to the adoption of IFRS 15, these price concessions
were included in the general and administrative expenses
as an allowance for doubtful accounts in the amount of € 486
million for the fiscal year 2017. Consequently, there is no
effect on net income as the implicit price concessions are
merely presented in different lines within the consolidated
statement of income.
In the business segment Fresenius Vamed, sales from
long-term production contracts are no longer recognized
using the percentage of completion method (PoC method) but
according to the IFRS 15 guidance for performance obliga-
tions satisfied over time, which did not result in any changes
z) Fair value hierarchyThe three-tier fair value hierarchy as defined in IFRS 13, Fair
Value Measurement, classifies financial assets and liabilities
recognized at fair value based on the inputs used in estimat-
ing the fair value. Level 1 is defined as observable inputs,
such as quoted prices in active markets. Level 2 is defined as
inputs other than quoted prices in active markets that are
directly or indirectly observable. Level 3 is defined as unob-
servable inputs for which little or no market data exists, there-
fore requiring the company to develop its own assumptions.
The three-tier fair value hierarchy is used in note 30, Financial
instruments.
aa) Use of estimatesThe preparation of consolidated financial statements in con-
formity with IFRS requires management to make estimates and
assumptions that affect the reported amounts of assets and
liabilities, the disclosure of contingent assets and liabilities at
the date of the consolidated financial statements and the
reported amounts of income and expenses during the report-
ing period. Actual results could differ from those estimates.
Estimates and discretionary decisions are required in particu-
lar for the positions trade accounts receivable, deferred tax
assets and pension liabilities as well as when examining the
recoverability of goodwill.
bb) Receivables managementThe entities of the Fresenius Group perform ongoing eval-
uations of the financial situation of their customers and gen-
erally do not require a collateral from the customers for the
supply of products and provision of services. Approximately
16% and 18% of Fresenius Group’s sales were earned and
subject to the regulations under governmental health care pro-
grams, Medicare and Medicaid, administered by the United
States government in 2018 and 2017, respectively.
cc) Recent pronouncements, appliedThe Fresenius Group has prepared its consolidated finan-
cial statements at December 31, 2018 in conformity with
IFRS that have to be applied for fiscal years beginning on
January 1, 2018.

Consolidated Financial Statements186
Financial S
tatements
to the consolidated statement of income. In the consolidated
statement of financial position, the amounts that were included
in inventory under the PoC method will generally be recog-
nized as contract assets according to IFRS 15. Contract assets
are included in other current and other non-current assets
in the consolidated statement of financial position. At the end
of the reporting period, € 430 million were included in other
current assets that would have been included in inventories
according to the former principle.
Other contract assets relate to medical treatments that
have been started but not completed at the respective report-
ing date. They were previously recognized as trade accounts
receivable. The reported contract liabilities primarily relate to
advance payments from customers and to sales of dialysis
machines.
IFRS 9
In July 2014, the IASB issued a new version of IFRS 9, Finan-
cial Instruments. This IFRS 9 version is considered the final
and complete version, thus, mainly replacing IAS 39 as soon
as IFRS 9 is applied. It includes all prior guidance on the
classification and measurement of financial assets and finan-
cial liabilities as well as hedge accounting and introduces
requirements for impairment of financial instruments as well
as modified requirements for the measurement categories
of financial assets. The impairment provisions reflect a model
that relies on expected losses (expected loss model). This
model comprises a three stage approach: Upon recognition,
an entity shall recognize losses that are expected within the
next 12 months. If credit risk deteriorates significantly, from
that point in time impairment losses shall amount to lifetime
expected losses. In case of objective evidence of impairment,
there is an assignment to stage 3. The provisions for classifi-
cation and measurement are amended by introducing an addi-
tional third measurement category for certain debt instru-
ments. Such instruments shall be measured at fair value with
changes recognized in other comprehensive income (loss)
(fair value through other comprehensive income). The stan-
dard is accompanied by additional disclosure requirements
and is effective for fiscal years beginning on or after
January 1, 2018.
In accordance with IAS 39 and IFRS 9, the majority of the
non-derivative financial assets are measured at amortized
costs. The impact on the measurement of non-derivative finan-
cial assets under IFRS 9 has not been significant. For indi-
vidual equity instruments, the Fresenius Group has opted to
present changes in fair value in other comprehensive income
(loss). The requirements for the classification and measure-
ment of non-derivative financial liabilities have not changed
significantly. Thus, IFRS 9 has a limited impact on the consol-
idated financial statements. Derivatives not designated as
hedging instruments will continue to be classified and mea-
sured at fair value through profit and loss.
The Fresenius Group follows the modified retrospective
method without restatement of previous periods for adopting
IFRS 9.
Differences in the carrying amounts of financial assets and
financial liabilities as of December 31, 2017, according to
IAS 39 and as of January 1, 2018, according to IFRS 9 are rec-
ognized in other reserves in the amount of - € 19 million (see
note 30, Financial instruments).
IFRS 9 has an impact on the accounting policies for clas-
sifying financial instruments, on the methodology to assess
the impairment of financial instruments and on the hedge
accounting requirements.
dd) Recent pronouncements, not yet appliedThe International Accounting Standards Board (IASB) issued
the following new standards, which are relevant for the
Fresenius Group and mandatory for fiscal years commencing
on or after January 1, 2019:
IFRS 17
In May 2017, the IASB issued IFRS 17, Insurance Contracts.
IFRS 17 establishes principles for the recognition, measure-
ment, presentation and disclosure related to the issuance of
insurance contracts. IFRS 17 replaces IFRS 4, Insurance
Contracts, which was brought in as an interim standard in

Consolidated Financial Statements General notes 187
Fin
anci
al S
tate
men
ts
2004. IFRS 4 permitted the use of national accounting stan-
dards for the accounting of insurance contracts under IFRS.
As a result of the varied application for insurance contracts,
there was a lack of comparability among peer groups. IFRS 17
eliminates this diversity in practice by requiring all insurance
contracts to be accounted for using current values. The fre-
quent updates to the insurance values are expected to pro-
vide more useful information to users of financial statements.
IFRS 17 is effective for fiscal years beginning on or after
January 1, 2022. Earlier adoption is permitted for entities that
have also adopted IFRS 9, Financial Instruments, and IFRS 15,
Revenue from Contracts with Customers. The Fresenius Group
is currently evaluating the impact of IFRS 17 on the consoli-
dated financial statements.
The EU Commission’s endorsement of IFRS 17 is still
outstanding.
IFRS 16
In January 2016, the IASB issued IFRS 16, Leases, which
supersedes the current standard on lease accounting, IAS 17,
as well as the interpretations IFRIC 4, SIC-15 and SIC-27.
IFRS 16 significantly changes lessee accounting. For almost all
leases, a lessee is required to recognize a right-of-use asset
representing its right to use the underlying leased asset and a
lease liability representing its obligation to make lease pay-
ments. Only leases with a total maximum term of 12 months
(short-term leases) and leases for underlying assets of low-
value are exempted from balance sheet recognition. Depreci-
ation of the right-of-use asset and interest on the lease liabil-
ity must be recognized in the income statement for every
lease contract. Therefore, straight-line rental expenses will
no longer be shown for the vast majority of the leases. The
lessor accounting requirements in IAS 17 are substantially
carried forward. In this regard, no material effects are expected
for the Fresenius Group. The standard is effective for fiscal
years beginning on or after January 1, 2019. Earlier application
is permitted for entities that have also adopted IFRS 15,
Revenue from Contracts with Cus tomers. The Fresenius Group
decided that IFRS 16 will not be adopted early. The Fresenius
Group expects a balance sheet extension due to the on balance
sheet recognition of right-of-use assets and liabilities for
agreed lease payment obligations, currently classified as oper-
ating leases, resulting in particular from leased clinics and
buildings. Based on an impact analysis, using certain options
and exemptions, the Fresenius Group expects a financial debt
increase of approximately € 5.5 billion, additional right-of-
use assets of approximately € 5.2 billion and a reduction of
equity by € 0.3 billion.
Referring to the consolidated statement of income, the
Fresenius Group expects an EBITDA (Earnings before
Interest, Taxes, Depreciation and Amortization) improvement
of approximately € 1.0 billion as well as an operating income
improvement of approximately € 0.1 billion due to the split of
rent expenses of approximately € 1.0 billion in depreciation
of approximately € 0.9 billion and interest expenses of approx-
imately €0.2 billion, by having unchanged cash outflows.
The net income attributable to shareholders of Fresenius SE &
Co. KGaA is expected to decrease by approximately € 30 mil-
lion. In addition, the Fresenius Group anticipates for Fresenius
Medical Care a reduction of sales by € 0.1 billion due to
changes in the accounting treatment of sale and leaseback
transactions.
The Fresenius Group also expects that its Leverage Ratio
will increase by about 0.3 to 0.4.
The change in presentation of the repayment component
of operate lease payments will result in a corresponding
improvement of cash flows from operating activities and a
decline in cash flows from financing activities.
The Fresenius Group applies the modified retrospective
method in accordance with IFRS 16 as the transition method.
Accordingly, the cumulative effect from first-time application

Consolidated Financial Statements188
Financial S
tatements
Right-of-use assets from lease contracts are classified in
accordance with the Fresenius Group’s classification of prop-
erty plant and equipment:
▶ Right-of-use assets: land
▶ Right-of-use assets: buildings and improvements
▶ Right-of-use assets: machinery and equipment
In addition to the right-of-use asset categories above, prepay-
ments on right-of-use assets are presented separately. Right-
of-use assets from lease contracts and lease obligations are
presented separately from property, plant and equipment and
other financial debt in the consolidated statement of finan-
cial position.
For lease contracts that include both lease and non-lease
components that are not separable from lease components,
no allocation is performed. Each lease component and any
associated non-lease components are accounted for as a
single lease.
In the Fresenius Group’s view, all other pronouncements
issued by the IASB do not have a material impact on the con-
solidated financial statements, as expected.
IV. CRITICAL ACCOUNTING POLICIES
In the opinion of the Management of the Fresenius Group, the
following accounting policies and topics are critical for the
consolidated financial statements in the present economic
environment. The influences and judgments as well as the
uncertainties which affect them are also important factors to
be considered when looking at present and future operating
earnings of the Fresenius Group.
a) Recoverability of goodwill and intangible assets with indefinite useful livesThe amount of goodwill and other non-amortizable intangible
assets with indefinite useful lives represents a considerable
part of the total assets of the Fresenius Group. At December 31,
2018 and December 31, 2017, the carrying amount of these
was € 25,915 million and € 25,480 million, respectively. This
represented 46% and 48%, respectively, of total assets.
is recognized in the opening balance of retained earnings as
of January 1, 2019 without adjustments to the comparative
information of the previous period.
In the application of the modified retrospective method, the
carrying amount of the lease liability at the date of the initial
application is determined by discounting the remaining lease
payments of lease agreements that were classified as operating
leases under IAS 17 using the incremental borrowing rate at
date of initial application. Furthermore, right-of-use assets
are to be recognized. In the application of the modified
retrospective method, the carrying amount of the right-of-use
asset equals the carrying amount of the lease liability (adjusted
for any prepaid or accrued lease payments). For a part of
the existing contracts, the Fresenius Group recognizes the
right-of-use asset with its carrying amount assuming the
new standard had been applied since the commencement date
of the lease discounted using its incremental borrowing rate
at the date of initial application.
Regarding the options and exemptions available upon the
initial application of IFRS 16 the Fresenius Group adopted
the following approach:
▶ IFRS 16 is only applied to contracts that were previously
identified as leases under IAS 17 and IFRIC 4.
▶ Recognition, valuation and disclosure principles of
IFRS 16 are not applied to lease contracts with a lease
term ending in less than 12 months from the date of the
initial application. The respective lease contracts are
accounted for as if they were short-term leases and rec-
ognized as an expense accordingly.
▶ Material initial direct costs are included in the measure-
ment of a right-of-use asset with the carrying amount
assuming the new standard was applied since the com-
mencement date of the lease.
▶ Upon initial recognition, no impairment review is per-
formed. The right-of-use assets are adjusted for onerous
contract provisions, recognized on the consolidated
statement of financial position immediately before the
date of initial application.

Consolidated Financial Statements General notes 189
Fin
anci
al S
tate
men
ts
An impairment test of goodwill and non-amortizable intangible
assets with indefinite useful lives is performed at least once
a year, or if events occur or circumstances change that would
indicate the carrying amount may not be recoverable.
To determine possible impairments of these assets, the
recoverable amount as its value in use of the cash generat-
ing units (CGUs) is compared to their carrying amount. The
value in use of each CGU is determined using estimated future
cash flows for the unit discounted by a weighted-average
cost of capital (WACC) specific to that CGU. Estimating the
discounted future cash flows involves significant assump-
tions, especially regarding future reimbursement rates and
sales prices, number of treatments, sales volumes and costs.
In determining discounted cash flows, the Fresenius Group
utilizes for every CGU its approved three-year budget, projec-
tions for years 4 to 10 and a corresponding growth rate for
all remaining years. Projections for up to 10 years are possible
due to historical experience and the stability of Fresenius
Group’s business, which is largely independent from the eco-
nomic cycle. Except for the CGUs in Asia-Pacific, the CGUs’
average revenue growth for the 10-year planning period is
between 3% and 7%. In Asia-Pacific, the average growth is in
the upper single-digit range for Fresenius Medical Care and
in the low double-digit range for Fresenius Kabi. A signifi-
cant part of goodwill is assigned to the CGUs of Fresenius
Medical Care and Fresenius Kabi in North America (carrying
amounts of goodwill as of December 31, 2018: € 10,128
million and € 4,167 million, respectively) as well as the CGUs
of Fresenius Helios in Germany and Spain (carrying amounts
of goodwill as of December 31, 2018: € 4,443 million and
€ 3,414 million, respectively). A significant part of the operat-
ing income is also achieved in these CGUs. For the 10-year
planning period, the average growth of the operating income
is in the low to mid single-digit range for these CGUs. For
the period after 10 years, the growth rates are 1% to 4% for
Fresenius Medical Care, 3% for Fresenius Kabi, 1% for
Fresenius Helios (Germany), 1.5% for Fresenius Helios (Spain)
and 1% for Fresenius Vamed. The growth rates of the main
CGUs of Fresenius Medical Care and Fresenius Kabi in North
America were 1% and 3%, respectively. The discount
factor is determined by the WACC of the respective CGU.
Fresenius Medical Care’s WACC consisted of a basic rate of
5.99% and the WACC in the business segment Fresenius
Kabi consisted of a basic rate of 5.79% for 2018, respectively.
This basic rate is then adjusted by a country-specific risk
premium and, if appropriate, by a factor to reflect higher
risks associated with the cash flows from recent material
acquisitions, until they are appropriately integrated, within
each CGU. In 2018, WACCs (after tax) for the CGUs of
Fresenius Medical Care ranged from 5.99% to 13.52% and
WACCs (after tax) for the CGUs of Fresenius Kabi ranged from
6.40% to 12.08%. In the CGU Fresenius Helios (Germany)
and the business segment Fresenius Vamed, the WACC (after
tax) was 5.79%, country-specific adjustments did not occur.
In the CGU Fresenius Helios (Spain), the WACC (after tax)
was 7.11%. The WACCs (after tax) of the main CGUs of
Fresenius Medical Care and Fresenius Kabi in North America
were 5.99% and 6.66%, respectively. If the value in use of
the CGU is less than its carrying amount, the difference is
recorded as an impairment of the fair value of the goodwill at
first. An increase of the WACC (after tax) by 0.5 percentage
points would not have resulted in the recognition of an impair-
ment loss in 2018.
Additional sensitivity analyses were carried out for the
CGUs in Latin America. An increase of the WACC of the CGU
Fresenius Medical Care Latin America (carrying amount of
goodwill as of December 31, 2018: € 137 million) by 0.27 per-
centage points would have led to the fair value being equal
to the carrying amount. An increase of the WACC of the CGU
Fresenius Kabi Latin America (carrying amount of goodwill
as of December 31, 2018: € 146 million) by 1 percentage
point would not have led to the recognition of an impairment
loss. An increase of the WACC by 3.29 percentage points
would have led to the fair value being equal to the carrying
amount.
A prolonged downturn in the health care industry with
lower than expected increases in reimbursement rates and
prices and / or higher than expected costs for providing
health care services and the manufacture of products could

Consolidated Financial Statements190
Financial S
tatements
adversely affect the estimated future cash flows of certain
countries or segments. Future adverse changes in a reporting
unit’s economic environment could affect the discount rate.
A decrease in the estimated future cash flows and / or a decline
in the reporting unit’s economic environment could result
in impairment charges to goodwill and other intangible
assets with indefinite useful lives which could materially and
adversely affect Fresenius Group’s future operating results.
b) Legal contingenciesThe Fresenius Group is involved in several legal matters
arising from the ordinary course of its business. The outcome
of these matters may have a material effect on the financial
position, results of operations or cash flows of the Fresenius
Group. For details, please see note 29, Commitments and
contingencies.
The Fresenius Group regularly analyzes current information
about such claims for probable losses and provides accruals
for such matters, including the estimated legal expenses and
consulting services in connection with these matters, as
appropriate. The Fresenius Group utilizes its internal legal
department as well as external resources for these assess-
ments. In making the decision regarding the need for a pro-
vision for legal matters, the Fresenius Group considers the
degree of probability of an unfavorable outcome and its abil-
ity to make a reasonable estimate of the amount of loss.
The filing of a suit or formal assertion of a claim or assess-
ment, or the disclosure of any such suit or assertion, does not
necessarily indicate that a provision for a loss is appropriate.
c) Allowance for doubtful accountsTrade accounts receivable are a significant asset and the allow-
ance for doubtful accounts is a significant estimate made by
the Management. Trade accounts receivable were € 6,540 mil-
lion and € 6,260 million in 2018 and 2017, respectively, net
of allowance. Approximately 51% of receivables derive from
the business segment Fresenius Medical Care and mainly
relate to the dialysis care business in North America.
The major debtors or debtor groups of trade accounts
receivable were U.S. Medicare and Medicaid health care pro-
grams with 17%, private insurers in the United States with
7% as well as the public health authority of the region of
Madrid with 12%, at December 31, 2018. Other than that,
the Fresenius Group has no significant risk concentration,
due to its international and heterogeneous customer structure.
The allowance for doubtful accounts was € 323 million
and € 741 million as of December 31, 2018 and December 31,
2017, respectively.
A valuation allowance is calculated if specific circum-
stances indicate that amounts will not be collectible. When all
efforts to collect a receivable, including the use of outside
sources where required and allowed, have been exhausted,
and after appropriate management review, a receivable
deemed to be uncollectible is considered a bad debt and
written off.
Deterioration in the aging of receivables and collection
difficulties could require that the Fresenius Group increases
the estimates of allowances for doubtful accounts. Additional
expenses for uncollectible receivables could have a signifi-
cant negative impact on future operating results.
d) Self-insurance programsUnder the insurance programs for professional, product and
general liability, auto liability, worker’s compensation claims
and medical malpractice claims, the largest subsidiary of
Fresenius Medical Care AG & Co. KGaA, located in the United
States, is partially self-insured for professional liability claims.
For further details regarding the accounting policies for self-
insurance programs, please see note 1. III. x, Self-insurance
programs.

Consolidated Financial Statements General notes 191
Fin
anci
al S
tate
men
ts
2. ACQUISITIONS, DIVESTITURES AND INVESTMENTS
ACQUISITIONS, DIVESTITURES AND INVESTMENTS
The Fresenius Group made acquisitions, investments and
purchases of intangible assets of € 1,086 million and € 6,852
million in 2018 and 2017, respectively. In 2018, of this
amount, € 1,070 million was paid in cash and € 16 million was
assumed obligations.
Fresenius Medical CareIn 2018, Fresenius Medical Care spent € 957 million on
acquisitions, mainly on investments in financial assets, the
purchase of dialysis clinics as well as an equity investment
in Humacyte, Inc., a medical research, discovery and develop-
ment company, to gain a 19% ownership stake as well as a
related exclusive global distribution right to Humacyte’s
bioengineered human acellular vessels.
Divestment of Sound Inpatient Physicians
Holdings, LLC, United States
On June 28, 2018, Fresenius Medical Care completed the
divestment of its controlling interest in Sound Inpatient
Physicians Holdings, LLC to an investment consortium led by
Summit Partners, L.P. The total transaction proceeds were
US$ 1,771 million (€ 1,531 million), net of related tax pay-
ments. The pre-tax gain related to divestitures for care coordi-
nation activities was € 809 million, which primarily related
to this divestiture, the effect of the six month impact from the
increase in valuation of Sound’s share based payment pro-
gram, incentive compensation expense and other costs caused
by the divestment of Sound.
Acquisition of NxStage Medical, Inc.
On August 7, 2017, Fresenius Medical Care announced the
acquisition of NxStage Medical, Inc. (NxStage), a U.S.-based
medical technology and services company, for a total trans-
action value of approximately US$ 2.0 billion (€ 1.7 billion). On
October 27, 2017, the shareholders of NxStage approved the
acquisition. The transaction remains subject to regulatory
approvals and other customary closing conditions. Fresenius
Medical Care expects the closing of the transaction to occur
at the beginning of 2019.
In 2017, Fresenius Medical Care spent € 683 million on acqui-
sitions, mainly on the purchase of dialysis clinics as well as
the acquisition of an operator of day hospitals in Australia.
Fresenius KabiIn 2018, Fresenius Kabi spent € 43 million on acquisitions,
mainly for already planned acquisition related milestone
payments relating to the acquisition of the biosimilars business
as well as one acquisition in the areas of medical technology
and IV drugs, respectively.
Termination of the merger agreement with Akorn, Inc.
On April 24, 2017, Fresenius announced that Fresenius
Kabi has agreed to acquire Akorn, Inc. (Akorn), a U.S.-based
manufacturer and marketer of prescription and over-the-
counter pharmaceutical products, for approximately US$ 4.3
billion, or US$ 34 per share, plus the prevailing net debt at
closing of the transaction.
Fresenius conducted an independent investigation, using
external experts, into alleged breaches of FDA data integrity
requirements relating to product development at Akorn.
Fresenius decided on April 22, 2018 to terminate the
merger agreement with Akorn, due to Akorn’s failure to fulfill
several closing conditions.
Fresenius’ decision was based on, among other factors,
material breaches of FDA data integrity requirements relating
to Akorn’s operations found during Fresenius’ independent
investigation. Fresenius offered to delay its decision in order
to allow Akorn additional opportunity to complete its own
investigation and present any information it wished Fresenius
to consider, but Akorn declined that offer.
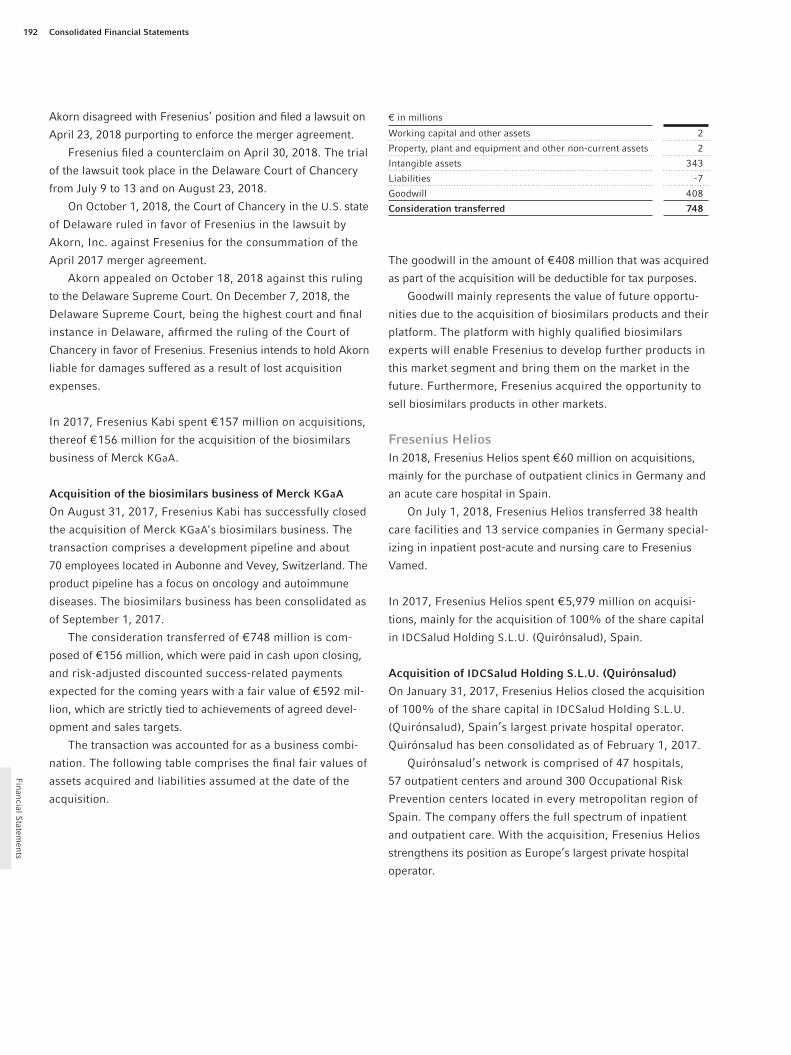
Consolidated Financial Statements192
Financial S
tatements
Akorn disagreed with Fresenius’ position and filed a lawsuit on
April 23, 2018 purporting to enforce the merger agreement.
Fresenius filed a counterclaim on April 30, 2018. The trial
of the lawsuit took place in the Delaware Court of Chancery
from July 9 to 13 and on August 23, 2018.
On October 1, 2018, the Court of Chancery in the U.S. state
of Delaware ruled in favor of Fresenius in the lawsuit by
Akorn, Inc. against Fresenius for the consummation of the
April 2017 merger agreement.
Akorn appealed on October 18, 2018 against this ruling
to the Delaware Supreme Court. On December 7, 2018, the
Delaware Supreme Court, being the highest court and final
instance in Delaware, affirmed the ruling of the Court of
Chancery in favor of Fresenius. Fresenius intends to hold Akorn
liable for damages suffered as a result of lost acquisition
expenses.
In 2017, Fresenius Kabi spent € 157 million on acquisitions,
thereof € 156 million for the acquisition of the biosimilars
business of Merck KGaA.
Acquisition of the biosimilars business of Merck KGaA
On August 31, 2017, Fresenius Kabi has successfully closed
the acquisition of Merck KGaA’s biosimilars business. The
transaction comprises a development pipeline and about
70 employees located in Aubonne and Vevey, Switzerland. The
product pipeline has a focus on oncology and autoimmune
diseases. The biosimilars business has been consolidated as
of September 1, 2017.
The consideration transferred of € 748 million is com-
posed of € 156 million, which were paid in cash upon closing,
and risk-adjusted discounted success-related payments
expected for the coming years with a fair value of € 592 mil-
lion, which are strictly tied to achievements of agreed devel-
opment and sales targets.
The transaction was accounted for as a business combi-
nation. The following table comprises the final fair values of
assets acquired and liabilities assumed at the date of the
acquisition.
€ in millions
Working capital and other assets 2
Property, plant and equipment and other non-current assets 2
Intangible assets 343
Liabilities - 7
Goodwill 408
Consideration transferred 748
The goodwill in the amount of € 408 million that was acquired
as part of the acquisition will be deductible for tax purposes.
Goodwill mainly represents the value of future opportu-
nities due to the acquisition of biosimilars products and their
platform. The platform with highly qualified biosimilars
experts will enable Fresenius to develop further products in
this market segment and bring them on the market in the
future. Furthermore, Fresenius acquired the opportunity to
sell biosimilars products in other markets.
Fresenius HeliosIn 2018, Fresenius Helios spent € 60 million on acquisitions,
mainly for the purchase of outpatient clinics in Germany and
an acute care hospital in Spain.
On July 1, 2018, Fresenius Helios transferred 38 health
care facilities and 13 service companies in Germany special-
izing in inpatient post-acute and nursing care to Fresenius
Vamed.
In 2017, Fresenius Helios spent € 5,979 million on acquisi-
tions, mainly for the acquisition of 100% of the share capital
in IDCSalud Holding S.L.U. (Quirónsalud), Spain.
Acquisition of IDCSalud Holding S.L.U. (Quirónsalud)
On January 31, 2017, Fresenius Helios closed the acquisition
of 100% of the share capital in IDCSalud Holding S.L.U.
(Quirónsalud), Spain’s largest private hospital operator.
Quirónsalud has been consolidated as of February 1, 2017.
Quirónsalud’s network is comprised of 47 hospitals,
57 out patient centers and around 300 Occupational Risk
Preven tion centers located in every metropolitan region of
Spain. The company offers the full spectrum of inpatient
and outpatient care. With the acquisition, Fresenius Helios
strengthens its position as Europe’s largest private hospital
operator.

Consolidated Financial Statements General notes 193
Fin
anci
al S
tate
men
ts
€ 5.36 billion of the total purchase price in the amount of
€ 5.76 billion had already been financed by means of different
debt instruments and paid in cash on January 31, 2017. The
balance of € 400 million was paid in the form of 6,108,176 new
shares of Fresenius SE & Co. KGaA issued on January 31,
2017 from Authorized Capital excluding sub scription rights.
In April 2017, a compensation payment in the amount of
€ 174 million was made for working capital taken over.
The transaction was accounted for as a business combina-
tion. The following table comprises the final fair values of
assets acquired and liabilities assumed at the date of the
acquisition.
€ in millions
Trade accounts receivable 776
Working capital and other assets 74
Property, plant and equipment and other non-current assets 1,775
Intangible assets 1,306
Liabilities - 1,315
Goodwill 3,336
Noncontrolling interest - 21
Consideration transferred 5,931
The goodwill in the amount of € 3,336 million that was
acquired as part of the acquisition is not deductible for tax
purposes.
Goodwill mainly represents the market position of the
acquired hospitals, health centers and health care facilities,
the economies of scale of the significantly grown largest
private European hospital operator and the know-how of the
employees.
The noncontrolling interests acquired as part of the acqui-
sition are stated at fair value.
Fresenius VamedIn 2018, Fresenius Vamed spent € 496 million on acquisi-
tions, mainly for 38 health care facilities and 13 service com-
panies in Germany specializing in inpatient post-acute and
nursing care which Fresenius Helios transferred to Fresenius
Vamed on July 1, 2018. The transaction had a total volume
of € 468 million. It was financed within the Group.
In 2017, Fresenius Vamed spent € 33 million on acquisitions
for the puchase of a service provider for the decontamination
of sterile medical devices in Germany and a post-acute care
clinic in Switzerland.
IMPACTS ON FRESENIUS GROUP’S
CONSOLIDATED FINANCIAL STATEMENTS
RESULTING FROM ACQUISITIONS
In the fiscal year 2018, all acquisitions have been accounted
for applying the purchase method and accordingly have been
consolidated starting with the date of acquisition. The excess
of the total acquisition costs over the fair value of the net
assets acquired was € 777 million and € 6,135 million in 2018
and 2017, respectively.
The purchase price allocations are not yet finalized for all
acquisitions of the current year. Based on preliminary purchase
price allocations, the recognized goodwill was € 495 million
and the other intangible assets were € 282 million. Of this
goodwill, € 328 million is attributable to the acquisitions of
Fresenius Medical Care, € 44 million to Fresenius Kabi’s
acquisitions, € 102 million to the acquisitions of Fresenius
Helios and € 21 million to the acquisitions of Fresenius
Vamed.
Goodwill is an asset representing the future economic ben-
efits arising from other assets acquired in a business combi-
nation that are not individually identified and separately rec-
ognized. Goodwill arises principally due to the fair value
placed on an established stream of future cash flows versus
building a similar business.
The acquisitions completed in 2018 or included in the
consolidated financial statements for the first time for a full
year contributed the following amounts to the development
of sales and earnings:
€ in millions 2018
Sales 370
EBITDA 68
EBIT 46
Net interest - 12
Net income attributable to shareholders of Fresenius SE & Co. KGaA 21
The acquisitions increased the total assets of the Fresenius
Group by € 466 million.

Consolidated Financial Statements194
Financial S
tatements
NOTES ON THE CONSOLIDATED
STATEMENT OF INCOME
3. SPECIAL ITEMSNet income attributable to shareholders of Fresenius SE &
Co. KGaA for the year 2018 in the amount of € 2,027 million
includes special items relating to divestitures of Care Coordi-
nation activities (mainly Sound Inpatient Physicians) and
the terminated merger agreement with Akorn, Inc. With regard
to the latter, these mainly comprise transaction costs in the
form of legal and consulting expenses as well as financing
commitment expenses for the Akorn transaction. Furthermore,
special items due to FCPA (Foreign Corrupt Practices Act)
investigations and revaluations of biosimilars contingent liabil-
ities are included in net income attributable to shareholders
of Fresenius SE & Co. KGaA.
The special items had the following impact on the con-
solidated statement of income of 2018:
€ in millions EBITInterest
expenses
Net income attributable to share holders of Fresenius
SE & Co. KGaA
Earnings 2018, before special items 4,561 - 570 1,871
Gain related to divestitures of Care Coordination activities 809 0 207
Transaction-related effects of Akorn - 35 - 17 - 37
FCPA related expenses - 77 0 - 9
Revaluations of biosimilars contingent liabilities - 7 0 - 5
Earnings 2018 according to IFRS 5,251 - 587 2,027
Net income attributable to shareholders of Fresenius SE &
Co. KGaA for the year 2017 in the amount of € 1,814 million
included special items due to the acquisition of Merck KGaA’s
biosimilars business and the announced acquisition of shares
of Akorn, Inc. Furthermore, the impact of FCPA (Foreign Cor-
rupt Practices Act) related expenses and a book gain from
the remeasurement of deferred tax assets and liabilities due
to the U.S. tax reform were included in net income attribut-
able to shareholders of Fresenius SE & Co. KGaA.
The special items had the following impact on the consoli-
dated statement of income:
€ in millions EBITInterest
expenses
Net income attributable to share holders of Fresenius
SE & Co. KGaA
Earnings 2017, before special items 4,830 - 652 1,816
Acquisition-related expenses - 41 - 15 - 43
FCPA related expenses - 200 0 - 62
Book gain from U.S. tax reform 0 0 103
Earnings 2017 according to IFRS 4,589 - 667 1,814
4. SALESIn the year 2018, sales by activity according to the IFRS 15
categorization were as follows:
€ in millions 2018
Sales from contracts with customers 33,206
thereof sales of services 22,898
thereof sales of products and related services 9,590
thereof sales from long-term production contracts 710
thereof further sales from contracts with customers 8
Other sales 324
Sales 33,530
Other sales include sales from insurance and lease contracts.
In the year 2017, sales by activity according to the catego-
rization used until year end 2017 were as follows:
€ in millions 2017
Sales of services 23,792
Sales of products and related goods 9,480
Sales from long-term production contracts 607
Other sales 7
Sales 33,886
The changes in activity classification are due to the first time
use of the new IFRS 15 classification in the first quarter
of 2018.

195
Fin
anci
al S
tate
men
ts
Consolidated Financial Statements Notes on the consolidated statement of income
As of December 31, 2018 the Group had performance obligations that are unsatisfied or partially unsatisfied and that are
expected to be satisfied and recorded in sales in the following years.
€ in millions 2019 2020 2021 2022 2023 thereafter Total
Transaction price of the unsatisfied or partially unsatisfied performance obligations 1,197 953 809 556 348 432 4,295
A sales analysis by business segment and region is shown in
the segment information on pages 170 to 171.
5. COST OF MATERIALSCost of materials included in cost of sales was comprised of
cost of raw materials, supplies and purchased components and
cost of purchased services:
6. PERSONNEL EXPENSESCost of sales, selling expenses, general and administrative
expenses and research and development expenses included
personnel expenses of € 13,426 million and € 13,496 million
in 2018 and 2017, respectively.
Personnel expenses were comprised of the following:
€ in millions 2018 2017
Wages and salaries 10,753 10,811
Social security contributions, cost of retirement pensions and social assistance 2,673 2,685
thereof retirement pensions 338 317
Personnel expenses 13,426 13,496
Fresenius Group’s annual average number of employees by
function is shown below:
2018 2017
Production 40,825 39,207
Service 194,691 191,706
Administration 25,973 24,772
Sales and marketing 11,587 10,985
Research and development 2,927 2,679
Total employees (per capita) 276,003 269,349
€ in millions 2018 2017
Cost of raw materials, supplies and purchased components 7,899 7,766
Cost of purchased services 1,467 1,266
Cost of materials 9,366 9,032
7. RESEARCH AND DEVELOPMENT EXPENSESResearch and development expenses of € 673 million (2017:
€ 558 million) included expenditures for research and non-
capitalizable development costs as well as regular deprecia-
tion and amortization expenses relating to capitalized develop-
ment costs of € 16 million (2017: € 15 million). Furthermore,
in 2018, research and development expenses included impair-
ments on capitalized development expenses of € 7 million.
These related to in-process R & D of product approval projects,
which were acquired through the acquisition of Fresenius
Kabi USA, Inc. The expenses for the further development of
the biosimilars business included in the research and develop-
ment expenses amounted to € 153 million (2017: € 59 million).
8. GENERAL AND ADMINISTRATIVE EXPENSESGeneral and administrative expenses amounted to € 3,857 mil-
lion (2017: € 4,606 million) and were related to expenditures
for administrative functions not attributable to research and
development, production or selling. Furthermore, in 2018,
general and administrative expenses included expenses of
€ 77 million (2017: € 200 million) in regards to Foreign Cor-
rupt Practices Act (FCPA) investigations.
In 2017, general and administrative expenses included
impairment expenses due to implicit price concessions of
€ 486 million. The adoption of IFRS 15 resulted in the implicit
price concessions directly reducing revenue as from the fis-
cal year 2018.

Consolidated Financial Statements196
Financial S
tatements
9. OTHER OPERATING INCOME AND EXPENSES Other operating income and expenses mainly included foreign
exchange gains and losses, as well as income from at equity
valuations and the release of provisions.
10. NET INTERESTNet interest of - € 587 million included interest expenses of
€ 942 million and interest income of € 355 million. The main
portion of the interest expenses resulted from Fresenius
Group’s financial liabilities, which are recognized at amor-
tized cost (see note 30, Financial instruments). The main
portion of interest income resulted from the valuation of the
derivatives embedded in the convertible bonds of Fresenius
SE & Co. KGaA and of Fresenius Medical Care AG & Co. KGaA
(see note 24, Convertible bonds).
11. TAXES
INCOME TAXES
Income before income taxes was attributable to the following
geographic regions:
€ in millions 2018 2017
Germany 476 492
International 4,188 3,430
Total 4,664 3,922
Income tax expenses (benefits) for 2018 and 2017 consisted
of the following:
€ in millionsCurrent
taxesDeferred
taxesIncome
taxes
2018
Germany 153 - 65 88
International 697 165 862
Total 850 100 950
2017
Germany 163 - 13 150
International 956 - 217 739
Total 1,119 - 230 889
A reconciliation between the expected and actual income tax
expense is shown in the following table. The expected corpo-
rate income tax expense is computed by applying the German
corporation tax rate (including the solidarity surcharge) and
the effective trade tax rate on income before income taxes. The
respective combined tax rate was 30.6% for the fiscal year
2018 (2017: 30.7%).
€ in millions 2018 2017
Computed “expected” income tax expense 1,427 1,203
Increase (reduction) in income taxes resulting from:
Items not recognized for tax purposes 80 140
Tax rate differential - 396 3
Tax rate changes - 2 - 270
Tax-free income - 51 - 67
Taxes for prior years - 88 - 38
Noncontrolling interests - 62 - 106
Other 42 24
Income tax 950 889
Effective tax rate 20.4% 22.7%
In the United States, the tax reform was enacted by signature
of the president of the Tax Cuts and Jobs Act on December 22,
2017. The Act reduces the U.S. corporate income tax rate
from 35% to 21% effective from January 1, 2018. Deferred
tax assets and liabilities expected to reverse in 2018 and
beyond have been remeasured using the corporate income tax
rate that was enacted by the balance sheet date and will apply
for future fiscal years. For the year ended December 31,
2017, the remeasurement of deferred tax assets and liabili-
ties resulted in a deferred tax benefit of € 266 million, which
was recognized in tax expense, affecting profit and loss and
included in the balance of € 270 million in the reconciling
item tax rate changes.

197
Fin
anci
al S
tate
men
ts
Consolidated Financial Statements Notes on the consolidated statement of income
DEFERRED TAXES
The tax effects of the temporary differences and losses carried
forward from prior years that gave rise to deferred tax assets
and liabilities at December 31 are presented below:
€ in millions 2018 2017
Deferred tax assets
Accounts receivable 50 42
Inventories 170 136
Other current assets 102 127
Other non-current assets 134 136
Provisions and other liabilities 262 278
Benefit obligations 204 187
Losses carried forward from prior years 177 222
Deferred tax assets 1,099 1,128
Deferred tax liabilities
Accounts receivable 35 22
Inventories 28 36
Other current assets 163 117
Other non-current assets 857 779
Provisions and other liabilities 523 540
Deferred tax liabilities 1,606 1,494
Net deferred taxes - 507 - 366
In the consolidated statement of financial position, the net
amounts of deferred tax assets and liabilities are included as
follows:
€ in millions 2018 2017
Deferred tax assets 777 744
Deferred tax liabilities 1,284 1,110
Net deferred taxes - 507 - 366
As of December 31, 2018, Fresenius Medical Care has not
recognized a deferred tax liability on approximately € 8 billion
of undistributed earnings of its foreign subsidiaries, because
those earnings are considered indefinitely reinvested.
NET OPERATING LOSSES
The expiration of net operating losses is as follows:
for the fiscal years € in millions
2019 35
2020 36
2021 26
2022 46
2023 38
2024 6
2025 9
2026 10
2027 10
2028 and thereafter 66
Total 282
The total remaining operating losses of € 1,080 million can
mainly be carried forward for an unlimited period. The total
amount of the existing operating losses as of December 31,
2018 includes an amount of € 860 million (2017: € 823 million)
that will probably not be realizable. For these operating losses,
deferred tax assets were not recognized.
Based upon the level of historical taxable income and
projections for future taxable income, the Management of the
Fresenius Group believes it is more likely than not that the
Fresenius Group will realize the benefits of these deductible
differences, net of the existing valuation allowances, at
December 31, 2018.

Consolidated Financial Statements198
Financial S
tatements
12. NONCONTROLLING INTERESTAs of December 31, noncontrolling interest in net income in
the Fresenius Group was as follows:
€ in millions 2018 2017
Noncontrolling interest in Fresenius Medical Care 1,372 889
Noncontrolling interest in Fresenius Vamed 17 11
Noncontrolling interest in the business segments
Fresenius Medical Care 244 274
Fresenius Kabi 43 39
Fresenius Helios 10 5
Fresenius Vamed 1 1
Total noncontrolling interest 1,687 1,219
In the fiscal year 2018, Fresenius Medical Care AG & Co. KGaA
paid dividends to noncontrolling interests in the amount of
€ 225 million (2017: € 203 million).
13. EARNINGS PER SHAREThe following table shows the earnings per share including
and excluding the dilutive effect from stock options issued:
2018 2017
Numerators, € in millions
Net income attributable to shareholders of Fresenius SE & Co. KGaA 2,027 1,814
less effect from dilution due to Fresenius Medical Care shares 2 1
Income available to all ordinary shares 2,025 1,813
Denominators in number of shares
Weighted-average number of ordinary shares outstanding 555,543,954 554,124,656
Potentially dilutive ordinary shares 1,760,548 3,382,324
Weighted-average number of ordinary shares outstanding assuming dilution 557,304,502 557,506,980
Basic earnings per share in € 3.65 3.27
Fully diluted earnings per share in € 3.63 3.25
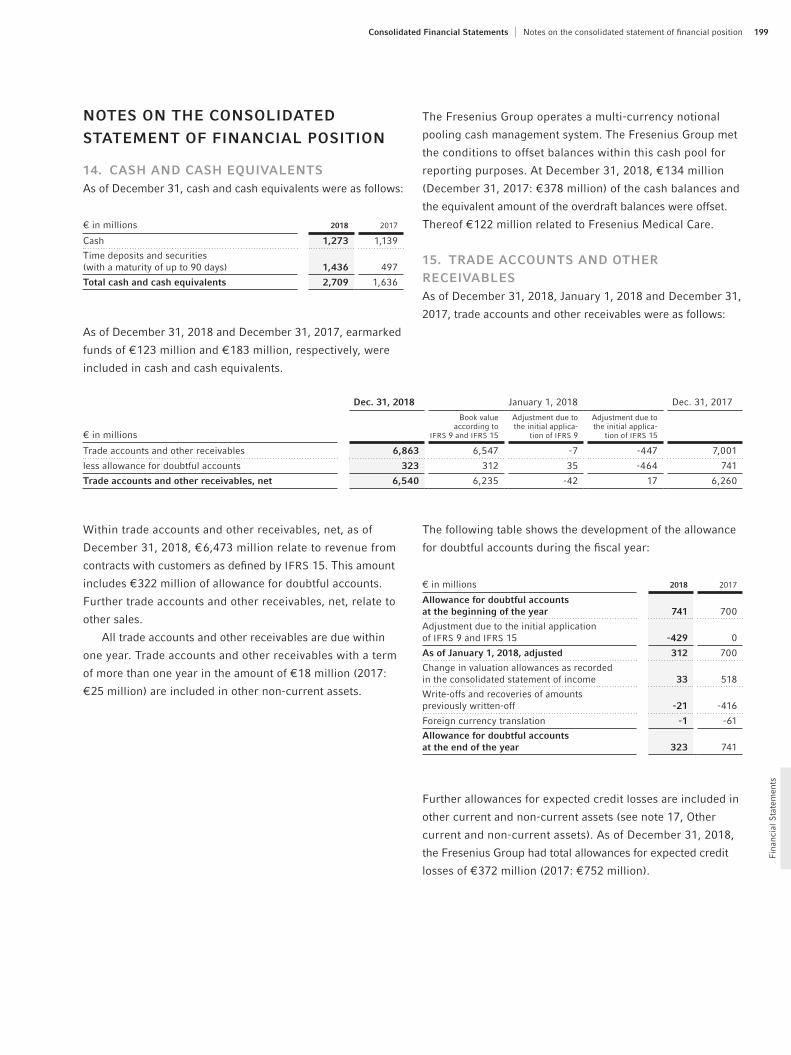
199
Fin
anci
al S
tate
men
ts
Consolidated Financial Statements Notes on the consolidated statement of financial position
NOTES ON THE CONSOLIDATED
STATEMENT OF FINANCIAL POSITION
14. CASH AND CASH EQUIVALENTSAs of December 31, cash and cash equivalents were as follows:
€ in millions 2018 2017
Cash 1,273 1,139
Time deposits and securities (with a maturity of up to 90 days) 1,436 497
Total cash and cash equivalents 2,709 1,636
As of December 31, 2018 and December 31, 2017, earmarked
funds of € 123 million and € 183 million, respectively, were
included in cash and cash equivalents.
The Fresenius Group operates a multi-currency notional
pooling cash management system. The Fresenius Group met
the conditions to offset balances within this cash pool for
reporting purposes. At December 31, 2018, € 134 million
(Decem ber 31, 2017: € 378 million) of the cash balances and
the equivalent amount of the overdraft balances were offset.
Thereof € 122 million related to Fresenius Medical Care.
15. TRADE ACCOUNTS AND OTHER RECEIVABLESAs of December 31, 2018, January 1, 2018 and December 31,
2017, trade accounts and other receivables were as follows:
Within trade accounts and other receivables, net, as of
December 31, 2018, € 6,473 million relate to revenue from
contracts with customers as defined by IFRS 15. This amount
includes € 322 million of allowance for doubtful accounts.
Further trade accounts and other receivables, net, relate to
other sales.
All trade accounts and other receivables are due within
one year. Trade accounts and other receivables with a term
of more than one year in the amount of € 18 million (2017:
€ 25 million) are included in other non-current assets.
The following table shows the development of the allowance
for doubtful accounts during the fiscal year:
€ in millions 2018 2017
Allowance for doubtful accounts at the beginning of the year 741 700
Adjustment due to the initial application of IFRS 9 and IFRS 15 - 429 0
As of January 1, 2018, adjusted 312 700
Change in valuation allowances as recorded in the consolidated statement of income 33 518
Write-offs and recoveries of amounts previously written-off - 21 - 416
Foreign currency translation - 1 - 61
Allowance for doubtful accounts at the end of the year 323 741
Further allowances for expected credit losses are included in
other current and non-current assets (see note 17, Other
current and non-current assets). As of December 31, 2018,
the Fresenius Group had total allowances for expected credit
losses of € 372 million (2017: € 752 million).
Dec. 31, 2018 January 1, 2018 Dec. 31, 2017
€ in millions
Book value according to
IFRS 9 and IFRS 15
Adjustment due to the initial applica-
tion of IFRS 9
Adjustment due to the initial applica-
tion of IFRS 15
Trade accounts and other receivables 6,863 6,547 - 7 - 447 7,001
less allowance for doubtful accounts 323 312 35 - 464 741
Trade accounts and other receivables, net 6,540 6,235 - 42 17 6,260

Consolidated Financial Statements200
Financial S
tatements
The following table shows the credit risk rating grades of trade accounts receivable and their allowance for doubtful accounts:
December 31, 2018 January 1, 2018
€ in millions Totalthereof
overduethereof credit
impaired Total thereof overdue
Trade accounts and other receivables 6,863 2,446 671 7,001 2,657
less allowance for doubtful accounts 323 284 253 741 667
Trade accounts and other receivables, net 6,540 2,162 418 6,260 1,990
16. INVENTORIESAs of December 31, inventories consisted of the following:
€ in millions 2018 2017
Raw materials and purchased components 761 653
Work in process 326 715
Finished goods 2,245 2,024
less reserves 114 140
Inventories, net 3,218 3,252
In 2018 and in 2017, no reversals of write-downs of inventory
were made.
The companies of the Fresenius Group are obliged to purchase
approximately € 1,030 million of raw materials and purchased
components under fixed terms, of which € 597 million was
committed at December 31, 2018 for 2019. The terms of these
agreements run 1 to 11 years. Advance payments from cus-
tomers of € 682 million (2017: € 560 million) have been offset
against inventories. These exclusively related to long-term
construction contracts.
Upon implementation of IFRS 15, € 311 million relating
to long-term production contracts from Fresenius Vamed have
been reclassified from work in process within inventory to
contract assets within other current and non-current assets.

201
Fin
anci
al S
tate
men
ts
Consolidated Financial Statements Notes on the consolidated statement of financial position
17. OTHER CURRENT AND NON-CURRENT ASSETSAs of December 31, other current and non-current assets were comprised of the following:
2018 2017
€ in millionsthereof
short-termthereof
short-term
At equity investments 650 0 647 0
Tax receivables 615 586 418 378
Contract assets 535 535 0 0
Accounts receivable resulting from German hospital law 150 137 175 143
Advances made 102 88 99 86
Prepaid rent and insurance 86 86 78 78
Prepaid expenses 76 43 73 43
Other assets 517 381 595 446
Other non-financial assets, net 2,731 1,856 2,085 1,174
Debt instruments 334 100 3 3
Equity investments 245 0 88 6
Compensation receivable resulting from German hospital law 154 147 124 121
Leasing receivables 108 0 79 0
Long-term loans 92 18 93 19
Deposits 87 31 78 25
Derivative financial instruments 77 45 335 22
Discounts 68 68 49 49
Other assets 325 29 278 20
Other financial assets, net 1,490 438 1,127 265
Other assets, net 4,221 2,294 3,212 1,439
Allowances 49 45 11 8
Other assets, gross 4,270 2,339 3,223 1,447
At equity investments mainly related to the joint venture named
Vifor Fresenius Medical Care Renal Pharma Ltd. between
Fresenius Medical Care and Galenica Ltd. In 2018, income of
€ 73 million (2017: € 67 million) resulting from this valuation
was included in other operating income in the con solidated
statement of income.
The accounts receivable resulting from German hospital
law contain approved but not yet received earmarked subsidies
of the Fresenius Helios operations. The approval is evidenced
in a letter written by the granting authorities that Fresenius
Helios has already received.
Since the implementation of IFRS 15 on January 1, 2018,
other current and non-current assets also include contract
assets within non-financial assets. As of December 31, 2018,
they amount to € 535 million. Thereof, € 311 million relating
to long-term production contracts from Fresenius Vamed
have been reclassified from inventory (work in process) upon
the initial application of IFRS 15 as of January 1, 2018.
Contract assets mainly relate to long-term production
contracts for which revenue is recognized over time. As of
December 31, 2018, they include € 0.1 million of allowance
for doubtful accounts. Moreover, in the fiscal years 2018 and
2017, depreciation in an immaterial amount was recognized
on other non-current assets.
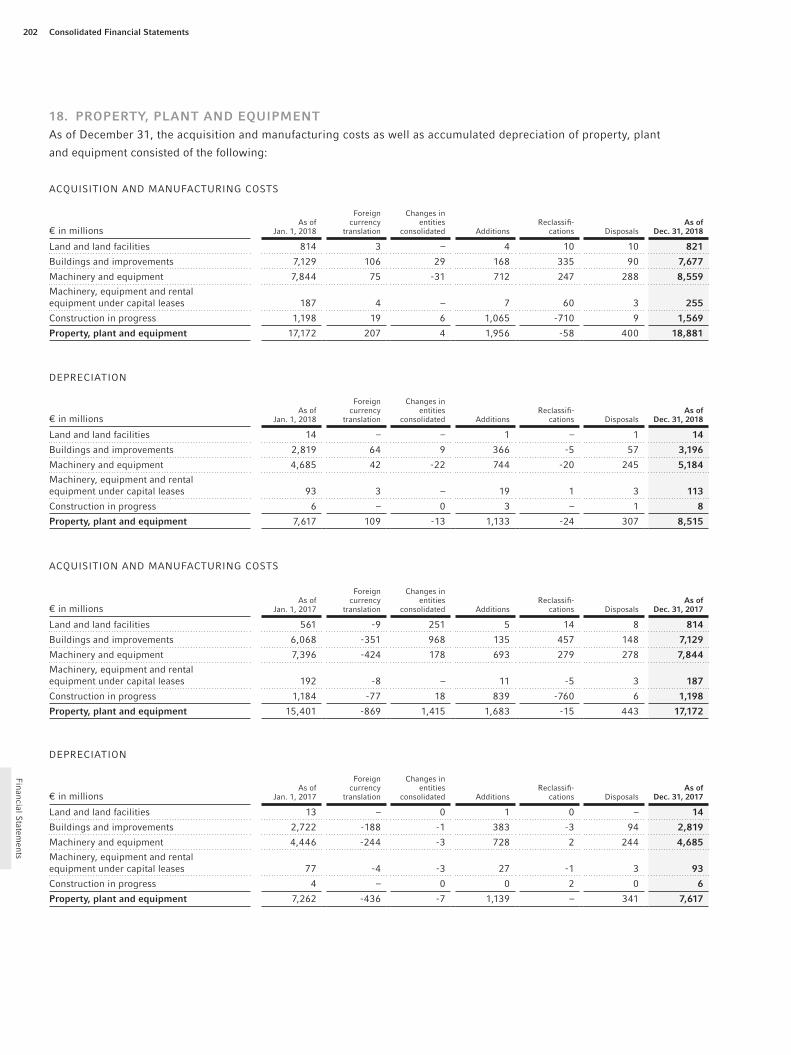
Consolidated Financial Statements202
Financial S
tatements
18. PROPERTY, PLANT AND EQUIPMENTAs of December 31, the acquisition and manufacturing costs as well as accumulated depreciation of property, plant
and equipment consisted of the following:
ACQUISITION AND MANUFACTURING COSTS
€ in millionsAs of
Jan. 1, 2018
Foreign currency
translation
Changes in entities
consolidated AdditionsReclassifi-
cations DisposalsAs of
Dec. 31, 2018
Land and land facilities 814 3 – 4 10 10 821
Buildings and improvements 7,129 106 29 168 335 90 7,677
Machinery and equipment 7,844 75 - 31 712 247 288 8,559
Machinery, equipment and rental equipment under capital leases 187 4 – 7 60 3 255
Construction in progress 1,198 19 6 1,065 - 710 9 1,569
Property, plant and equipment 17,172 207 4 1,956 - 58 400 18,881
DEPRECIATION
€ in millionsAs of
Jan. 1, 2018
Foreign currency
translation
Changes in entities
consolidated AdditionsReclassifi-
cations DisposalsAs of
Dec. 31, 2018
Land and land facilities 14 – – 1 – 1 14
Buildings and improvements 2,819 64 9 366 - 5 57 3,196
Machinery and equipment 4,685 42 - 22 744 - 20 245 5,184
Machinery, equipment and rental equipment under capital leases 93 3 – 19 1 3 113
Construction in progress 6 – 0 3 – 1 8
Property, plant and equipment 7,617 109 - 13 1,133 - 24 307 8,515
ACQUISITION AND MANUFACTURING COSTS
€ in millionsAs of
Jan. 1, 2017
Foreign currency
translation
Changes in entities
consolidated AdditionsReclassifi-
cations DisposalsAs of
Dec. 31, 2017
Land and land facilities 561 - 9 251 5 14 8 814
Buildings and improvements 6,068 - 351 968 135 457 148 7,129
Machinery and equipment 7,396 - 424 178 693 279 278 7,844
Machinery, equipment and rental equipment under capital leases 192 - 8 – 11 - 5 3 187
Construction in progress 1,184 - 77 18 839 - 760 6 1,198
Property, plant and equipment 15,401 - 869 1,415 1,683 - 15 443 17,172
DEPRECIATION
€ in millionsAs of
Jan. 1, 2017
Foreign currency
translation
Changes in entities
consolidated AdditionsReclassifi-
cations DisposalsAs of
Dec. 31, 2017
Land and land facilities 13 – 0 1 0 – 14
Buildings and improvements 2,722 - 188 - 1 383 - 3 94 2,819
Machinery and equipment 4,446 - 244 - 3 728 2 244 4,685
Machinery, equipment and rental equipment under capital leases 77 - 4 - 3 27 - 1 3 93
Construction in progress 4 – 0 0 2 0 6
Property, plant and equipment 7,262 - 436 - 7 1,139 – 341 7,617

203
Fin
anci
al S
tate
men
ts
Consolidated Financial Statements Notes on the consolidated statement of financial position
CARRYING AMOUNTS
€ in millions Dec. 31, 2018 Dec. 31, 2017
Land and land facilities 807 800
Buildings and improvements 4,481 4,310
Machinery and equipment 3,375 3,159
Machinery, equipment and rental equipment under capital leases 142 94
Construction in progress 1,561 1,192
Property, plant and equipment 10,366 9,555
Depreciation on property, plant and equipment for the years
2018 and 2017 was € 1,133 million and € 1,139 million, respec-
tively. It is allocated within cost of sales, selling expenses,
general and administrative expenses and research and devel-
opment expenses, depending upon the use of the asset.
LEASING
Machinery and equipment as of December 31, 2018 and
2017 included medical devices which Fresenius Medical Care
and Fresenius Kabi lease to customers, patients and physi-
cians under operating leases in an amount of € 868 million and
€ 788 million, respectively.
19. GOODWILL AND OTHER INTANGIBLE ASSETSAs of December 31, the acquisition cost and accumulated amortization of intangible assets consisted of the following:
ACQUISITION COST
€ in millionsAs of
Jan. 1, 2018
Foreign currency
translation
Changes in entities
consolidated AdditionsReclassifi-
cations DisposalsAs of
Dec. 31, 2018
Goodwill 25,285 598 - 200 31 0 1 25,713
Customer relationships 840 5 - 125 0 - 3 0 717
Tradenames with finite useful lives 699 2 - 7 – 5 0 699
Capitalized development costs 828 12 3 53 2 3 895
Patents, product and distribution rights 674 28 0 62 – 5 759
Software 599 8 - 11 175 60 10 821
Technology 415 13 0 0 0 0 428
Tradenames with indefinite useful lives 192 7 0 – 0 0 199
Non-compete agreements 314 13 6 1 – 5 329
Management contracts 3 – 0 0 0 0 3
Other 418 4 6 35 - 24 21 418
Goodwill and other intangible assets 30,267 690 - 328 357 40 45 30,981
AMORTIZATION
€ in millionsAs of
Jan. 1, 2018
Foreign currency
translation
Changes in entities
consolidated AdditionsReclassifi-
cations DisposalsAs of
Dec. 31, 2018
Goodwill 0 0 0 0 0 0 0
Customer relationships 123 2 - 53 50 – – 122
Tradenames with finite useful lives 48 – - 6 42 6 0 90
Capitalized development costs 229 6 0 23 – 3 255
Patents, product and distribution rights 386 15 0 34 – 3 432
Software 337 6 - 4 88 15 9 433
Technology 154 6 – 75 0 0 235
Tradenames with indefinite useful lives 0 0 0 0 0 0 0
Non-compete agreements 262 11 - 1 15 – 5 282
Management contracts 0 0 0 0 0 0 0
Other 271 4 - 1 35 - 1 19 289
Goodwill and other intangible assets 1,810 50 - 65 362 20 39 2,138
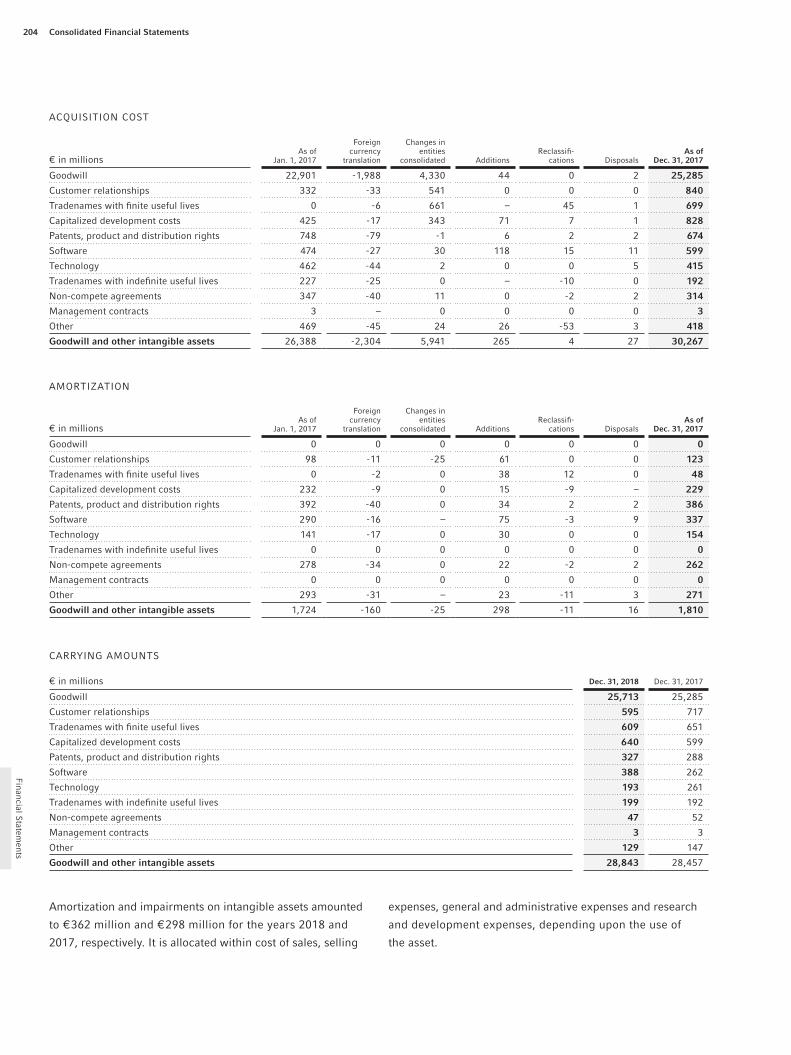
Consolidated Financial Statements204
Financial S
tatements
ACQUISITION COST
€ in millionsAs of
Jan. 1, 2017
Foreign currency
translation
Changes in entities
consolidated AdditionsReclassifi-
cations DisposalsAs of
Dec. 31, 2017
Goodwill 22,901 - 1,988 4,330 44 0 2 25,285
Customer relationships 332 - 33 541 0 0 0 840
Tradenames with finite useful lives 0 - 6 661 – 45 1 699
Capitalized development costs 425 - 17 343 71 7 1 828
Patents, product and distribution rights 748 - 79 - 1 6 2 2 674
Software 474 - 27 30 118 15 11 599
Technology 462 - 44 2 0 0 5 415
Tradenames with indefinite useful lives 227 - 25 0 – - 10 0 192
Non-compete agreements 347 - 40 11 0 - 2 2 314
Management contracts 3 – 0 0 0 0 3
Other 469 - 45 24 26 - 53 3 418
Goodwill and other intangible assets 26,388 - 2,304 5,941 265 4 27 30,267
AMORTIZATION
€ in millionsAs of
Jan. 1, 2017
Foreign currency
translation
Changes in entities
consolidated AdditionsReclassifi-
cations DisposalsAs of
Dec. 31, 2017
Goodwill 0 0 0 0 0 0 0
Customer relationships 98 - 11 - 25 61 0 0 123
Tradenames with finite useful lives 0 - 2 0 38 12 0 48
Capitalized development costs 232 - 9 0 15 - 9 – 229
Patents, product and distribution rights 392 - 40 0 34 2 2 386
Software 290 - 16 – 75 - 3 9 337
Technology 141 - 17 0 30 0 0 154
Tradenames with indefinite useful lives 0 0 0 0 0 0 0
Non-compete agreements 278 - 34 0 22 - 2 2 262
Management contracts 0 0 0 0 0 0 0
Other 293 - 31 – 23 - 11 3 271
Goodwill and other intangible assets 1,724 - 160 - 25 298 - 11 16 1,810
CARRYING AMOUNTS
€ in millions Dec. 31, 2018 Dec. 31, 2017
Goodwill 25,713 25,285
Customer relationships 595 717
Tradenames with finite useful lives 609 651
Capitalized development costs 640 599
Patents, product and distribution rights 327 288
Software 388 262
Technology 193 261
Tradenames with indefinite useful lives 199 192
Non-compete agreements 47 52
Management contracts 3 3
Other 129 147
Goodwill and other intangible assets 28,843 28,457
Amortization and impairments on intangible assets amounted
to € 362 million and € 298 million for the years 2018 and
2017, respectively. It is allocated within cost of sales, selling
expenses, general and administrative expenses and research
and development expenses, depending upon the use of
the asset.

205
Fin
anci
al S
tate
men
ts
Consolidated Financial Statements Notes on the consolidated statement of financial position
The split of intangible assets into amortizable and non-amortizable intangible assets is shown in the following tables:
AMORTIZABLE INTANGIBLE ASSETS
Dec. 31, 2018 Dec. 31, 2017
€ in millionsAcquisition
costAccumulated amortization
Carrying amount
Acquisition cost
Accumulated amortization
Carrying amount
Customer relationships 717 122 595 840 123 717
Tradenames 699 90 609 699 48 651
Capitalized development costs 895 255 640 828 229 599
Patents, product and distribution rights 759 432 327 674 386 288
Software 821 433 388 599 337 262
Technology 428 235 193 415 154 261
Non-compete agreements 329 282 47 314 262 52
Other 418 289 129 418 271 147
Total 5,066 2,138 2,928 4,787 1,810 2,977
Fresenius Medical Care capitalized development costs in an
amount of € 2 million for the fiscal year 2018 (2017: € 3 mil-
lion). Capitalized development costs are amortized on a
straight-line basis over a useful life of 11 years. The amortiza-
tion expense for the fiscal year 2018 amounted to € 0.3 million
(2017: € 0.4 million). Moreover, in 2018, technology and other
intangible assets contain impairments of € 65 million. These
are included in the preceding amortization tables in the col-
umns additions. In the case of Fresenius Kabi, development
costs capitalized amounted to € 638 million at December 31,
2018 (December 31, 2017: € 596 million). The amortization
is recorded on a straight-line basis over a useful life of 5 to 20
years and amounted to € 16 million for the fiscal year 2018
(2017: € 15 million). Furthermore, in 2018, research and devel-
opment expenses included impairments on capitalized devel-
opment expenses of € 7 million (see note 7, Research and
development expenses). These are included in the preceding
amortization tables in the columns additions.
NON-AMORTIZABLE INTANGIBLE ASSETS
Dec. 31, 2018 Dec. 31, 2017
€ in millionsAcquisition
costAccumulated amortization
Carrying amount
Acquisition cost
Accumulated amortization
Carrying amount
Goodwill 25,713 0 25,713 25,285 0 25,285
Tradenames 199 0 199 192 0 192
Management contracts 3 0 3 3 0 3
Total 25,915 0 25,915 25,480 0 25,480
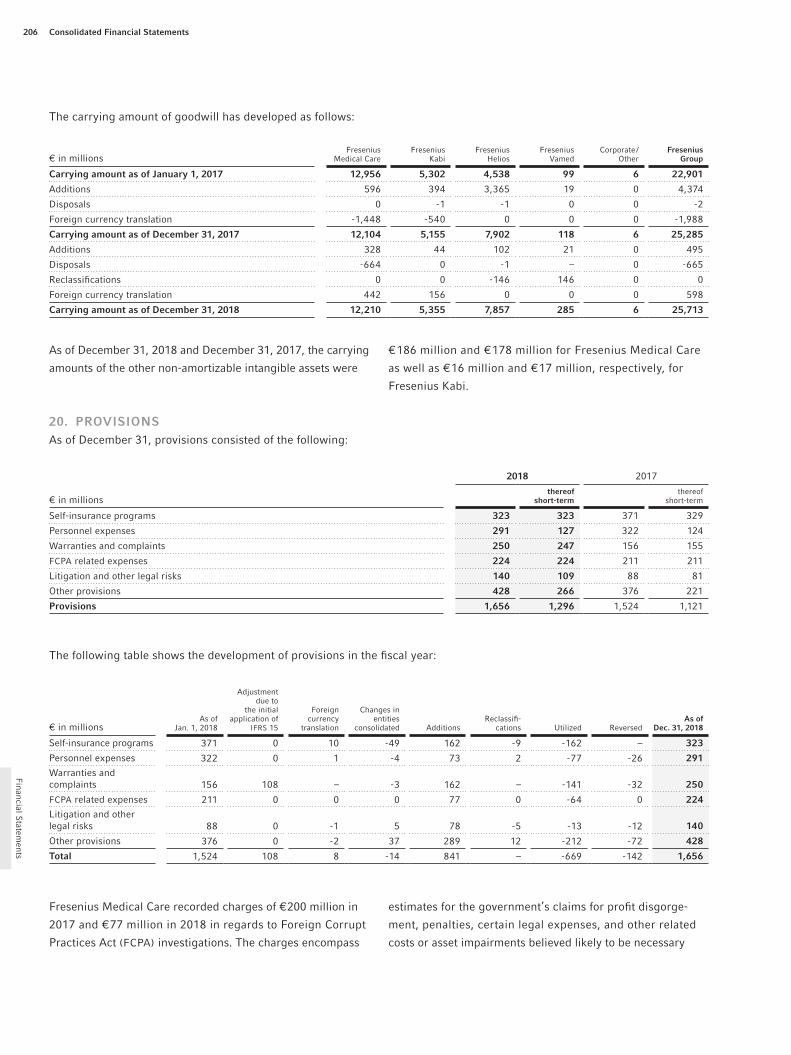
Consolidated Financial Statements206
Financial S
tatements
The carrying amount of goodwill has developed as follows:
€ in millionsFresenius
Medical CareFresenius
KabiFresenius
HeliosFresenius
VamedCorporate /
OtherFresenius
Group
Carrying amount as of January 1, 2017 12,956 5,302 4,538 99 6 22,901
Additions 596 394 3,365 19 0 4,374
Disposals 0 - 1 - 1 0 0 - 2
Foreign currency translation - 1,448 - 540 0 0 0 - 1,988
Carrying amount as of December 31, 2017 12,104 5,155 7,902 118 6 25,285
Additions 328 44 102 21 0 495
Disposals - 664 0 - 1 – 0 - 665
Reclassifications 0 0 - 146 146 0 0
Foreign currency translation 442 156 0 0 0 598
Carrying amount as of December 31, 2018 12,210 5,355 7,857 285 6 25,713
As of December 31, 2018 and December 31, 2017, the carrying
amounts of the other non-amortizable intangible assets were
€ 186 million and € 178 million for Fresenius Medical Care
as well as € 16 million and € 17 million, respectively, for
Fresenius Kabi.
20. PROVISIONSAs of December 31, provisions consisted of the following:
2018 2017
€ in millionsthereof
short-termthereof
short-term
Self-insurance programs 323 323 371 329
Personnel expenses 291 127 322 124
Warranties and complaints 250 247 156 155
FCPA related expenses 224 224 211 211
Litigation and other legal risks 140 109 88 81
Other provisions 428 266 376 221
Provisions 1,656 1,296 1,524 1,121
The following table shows the development of provisions in the fiscal year:
€ in millionsAs of
Jan. 1, 2018
Adjustment due to
the initial application of
IFRS 15
Foreign currency
translation
Changes in entities
consolidated AdditionsReclassifi-
cations Utilized ReversedAs of
Dec. 31, 2018
Self-insurance programs 371 0 10 - 49 162 - 9 - 162 – 323
Personnel expenses 322 0 1 - 4 73 2 - 77 - 26 291
Warranties and complaints 156 108 – - 3 162 – - 141 - 32 250
FCPA related expenses 211 0 0 0 77 0 - 64 0 224
Litigation and other legal risks 88 0 - 1 5 78 - 5 - 13 - 12 140
Other provisions 376 0 - 2 37 289 12 - 212 - 72 428
Total 1,524 108 8 - 14 841 – - 669 - 142 1,656
Fresenius Medical Care recorded charges of € 200 million in
2017 and € 77 million in 2018 in regards to Foreign Corrupt
Practices Act (FCPA) investigations. The charges encompass
estimates for the government’s claims for profit disgorge-
ment, penalties, certain legal expenses, and other related
costs or asset impairments believed likely to be necessary
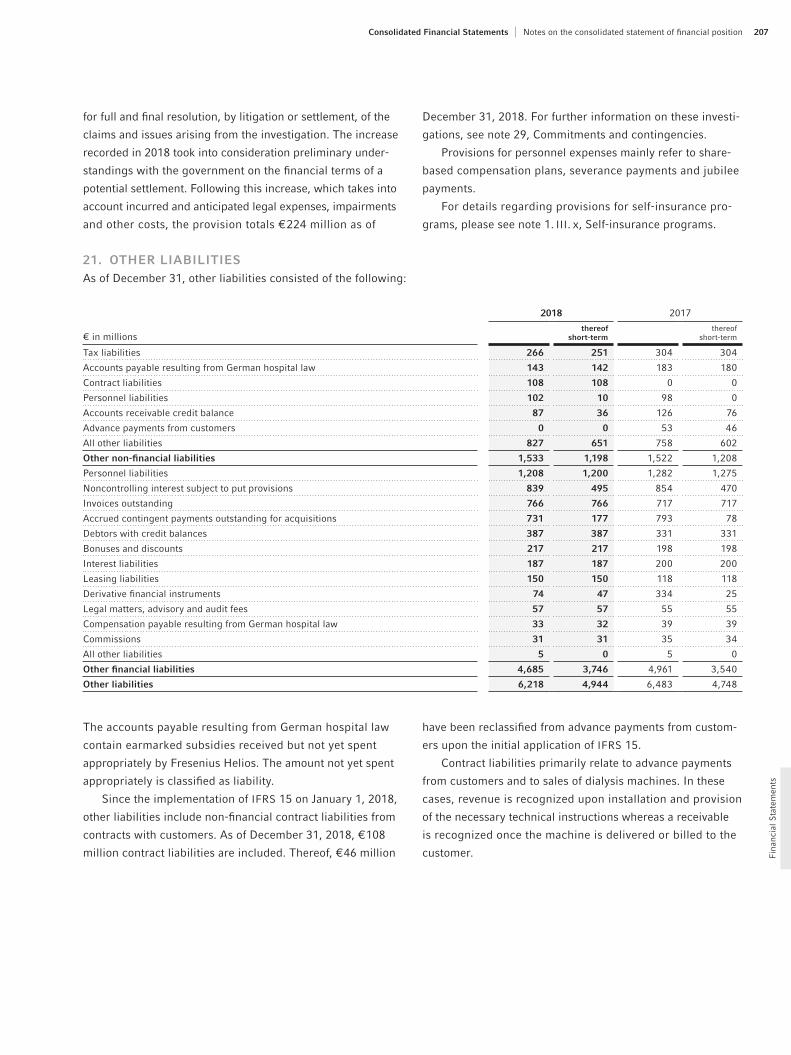
207
Fin
anci
al S
tate
men
ts
Consolidated Financial Statements Notes on the consolidated statement of financial position
21. OTHER LIABILITIESAs of December 31, other liabilities consisted of the following:
2018 2017
€ in millionsthereof
short-termthereof
short-term
Tax liabilities 266 251 304 304
Accounts payable resulting from German hospital law 143 142 183 180
Contract liabilities 108 108 0 0
Personnel liabilities 102 10 98 0
Accounts receivable credit balance 87 36 126 76
Advance payments from customers 0 0 53 46
All other liabilities 827 651 758 602
Other non-financial liabilities 1,533 1,198 1,522 1,208
Personnel liabilities 1,208 1,200 1,282 1,275
Noncontrolling interest subject to put provisions 839 495 854 470
Invoices outstanding 766 766 717 717
Accrued contingent payments outstanding for acquisitions 731 177 793 78
Debtors with credit balances 387 387 331 331
Bonuses and discounts 217 217 198 198
Interest liabilities 187 187 200 200
Leasing liabilities 150 150 118 118
Derivative financial instruments 74 47 334 25
Legal matters, advisory and audit fees 57 57 55 55
Compensation payable resulting from German hospital law 33 32 39 39
Commissions 31 31 35 34
All other liabilities 5 0 5 0
Other financial liabilities 4,685 3,746 4,961 3,540
Other liabilities 6,218 4,944 6,483 4,748
for full and final resolution, by litigation or settlement, of the
claims and issues arising from the investigation. The increase
recorded in 2018 took into consideration preliminary under-
standings with the government on the financial terms of a
potential settlement. Following this increase, which takes into
account incurred and anticipated legal expenses, impairments
and other costs, the provision totals € 224 million as of
December 31, 2018. For further information on these investi-
gations, see note 29, Commitments and contingencies.
Provisions for personnel expenses mainly refer to share-
based compensation plans, sev erance payments and jubilee
payments.
For details regarding provisions for self-insurance pro-
grams, please see note 1. III. x, Self-insurance programs.
The accounts payable resulting from German hospital law
contain earmarked subsidies received but not yet spent
appropriately by Fresenius Helios. The amount not yet spent
appropriately is classified as liability.
Since the implementation of IFRS 15 on January 1, 2018,
other liabilities include non-financial contract liabilities from
contracts with customers. As of December 31, 2018, € 108
million contract liabilities are included. Thereof, € 46 million
have been reclassified from advance payments from custom-
ers upon the initial application of IFRS 15.
Contract liabilities primarily relate to advance payments
from customers and to sales of dialysis machines. In these
cases, revenue is recognized upon installation and provision
of the necessary technical instructions whereas a receivable
is recognized once the machine is delivered or billed to the
customer.

Consolidated Financial Statements208
Financial S
tatements
22. DEBT AND CAPITAL LEASE OBLIGATIONS
SHORT-TERM DEBT
As of December 31, short-term debt consisted of the following:
Book value
€ in millions 2018 2017
Fresenius SE & Co. KGaA Commercial Paper 973 715
Fresenius Medical Care AG & Co. KGaA Commercial Paper 1,000 680
Other short-term debt 381 155
Short-term debt 2,354 1,550
Other short-term debt mainly consists of borrowings by cer-
tain entities of the Fresenius Group under lines of credit
with commercial banks. The average interest rates on the
borrowings at December 31, 2018 and 2017 were 1.62% and
5.81%, respectively.
LONG-TERM DEBT AND CAPITAL LEASE OBLIGATIONS
As of December 31, long-term debt and capital lease obligations net of debt issuance costs consisted of the following:
€ in millions 2018 2017
Fresenius Medical Care Credit Agreement 1,887 2,018
Fresenius Credit Agreement 2,116 2,238
Schuldschein Loans 1,629 1,873
Accounts Receivable Facility of Fresenius Medical Care 0 294
Capital lease obligations 219 234
Other 446 448
Subtotal 6,297 7,105
less current portion 353 618
Long-term debt and capital lease obligations, less current portion 5,944 6,487
The Fresenius Group, as option writer on behalf of existing
put options, has potential obligations to purchase non con-
trolling interests held by third parties in certain of its consoli-
dated subsidiaries. If these put provisions were exercised, the
Fresenius Group would be required to purchase all or part of
third-party owners’ noncontrolling interests at already defined
purchase prices or the appraised fair value at the time of
exercise.
The accrued contingent payments outstanding for acquisitions
include € 540 million at December 31, 2018 for the acquisi-
tion of the biosimilars business.
At December 31, 2018, the total amount of other long-
term liabilities was € 1,274 million, thereof € 844 million was
due between one and five years and € 430 million was due
after five years. The statement of financial position line item
long-term provisions and other long-term liabilities of € 1,634
million also included long-term provisions of € 360 million
as of December 31, 2018.

209
Fin
anci
al S
tate
men
ts
Consolidated Financial Statements Notes on the consolidated statement of financial position
Maturities of long-term debt and capital lease obligations including debt issuance costs are shown in the following table:
€ in millions up to 1 year 1 to 3 years 3 to 5 years more than 5 years
Fresenius Medical Care Credit Agreement 133 665 1,096 0
Fresenius Credit Agreement 152 1,055 920 0
Schuldschein Loans 0 561 443 628
Accounts Receivable Facility of Fresenius Medical Care 0 0 0 0
Capital lease obligations 22 41 28 128
Other 55 243 45 105
Long-term debt and capital lease obligations 362 2,565 2,532 861
Aggregate annual repayments applicable to the above listed
long-term debt and capital lease obligations for the years
subsequent to December 31, 2018 are:
for the fiscal years € in millions
2019 362
2020 1,146
2021 1,419
2022 2,449
2023 83
Subsequent years 861
Total 6,320
Fresenius Medical Care Credit AgreementFresenius Medical Care AG & Co. KGaA (FMC-AG & Co. KGaA)
originally entered into a syndicated credit facility ( Fresenius
Medical Care 2012 Credit Agreement) of US$ 3,850 million and
a 5-year tenor on October 30, 2012.
In the years 2014 and 2017, various amendments of the
Fresenius Medical Care Credit Agreement were made. These
related to the amount and structure of the available tranches,
among other items. In addition, the terms have been
extended.
The following tables show the available and outstanding
amounts under the Fresenius Medical Care Credit Agree-
ment at December 31:
2018
Maximum amount available Balance outstanding
€ in millions € in millions
Revolving Credit Facility (in US$) 2017 / 2022 US$ 900 million 786 US$ 0 million 0
Revolving Credit Facility (in €) 2017 / 2022 € 600 million 600 € 0 million 0
Term Loan (in US$) 2017 / 2022 US$ 1,350 million 1,179 US$ 1,350 million 1,179
Term Loan (in €) 2017 / 2020 € 400 million 400 € 400 million 400
Term Loan (in €) 2017 / 2022 € 315 million 315 € 315 million 315
Total 3,280 1,894
less financing cost 7
Total 1,887
2017
Maximum amount available Balance outstanding
€ in millions € in millions
Revolving Credit Facility (in US$) 2017 / 2022 US$ 900 million 750 US$ 70 million 58
Revolving Credit Facility (in €) 2017 / 2022 € 600 million 600 € 0 million 0
Term Loan (in US$) 2017 / 2022 US$ 1,470 million 1,226 US$ 1,470 million 1,226
Term Loan (in €) 2017 / 2020 € 400 million 400 € 400 million 400
Term Loan (in €) 2017 / 2022 € 343 million 343 € 343 million 343
Total 3,319 2,027
less financing cost 9
Total 2,018

Consolidated Financial Statements210
Financial S
tatements
As of December 31, 2018, the Fresenius Medical Care Credit
Agreement consisted of:
▶ Revolving credit facilities of US$ 900 million and € 600 mil-
lion which will be due on July 31, 2022.
▶ A term loan of US$ 1,350 million, also scheduled to mature
on July 31, 2022. Quarterly repayments of US$ 30 million
began on October 31, 2017 with the remaining balance
outstanding due on the maturity date.
▶ A term loan of € 315 million, also scheduled to mature on
July 31, 2022. Quarterly repayments of € 7 million began
on October 31, 2017 with the remaining balance out-
standing due on the maturity date.
▶ A non-amortizing term loan of € 400 million which is
scheduled to mature on July 30, 2020.
Interest on the credit facilities is floating at a rate equal to
EURIBOR / LIBOR (as applicable) plus an applicable margin.
The applicable margin is variable and depends on Fresenius
Medical Care’s consolidated leverage ratio which is a ratio
of its consolidated funded debt less cash and cash equivalents
to consolidated EBITDA (as these terms are defined in the
Fresenius Medical Care Credit Agreement). As of Decem-
ber 31, 2018 and 2017, the U.S. dollar denominated tranches
outstanding under the Fresenius Medical Care Credit Agree-
ment had a weighted-average interest rate of 3.53% and
2.48%, respectively. As of December 31, 2018 and 2017,
the euro denominated tranches had a weighted-average
interest rate of 0.81%.
The Fresenius Medical Care Credit Agreement contains affir-
mative and negative covenants with respect to FMC-AG &
Co. KGaA and its subsidiaries. Under certain circumstances,
these covenants limit indebtedness and restrict the creation
of liens. Under the Fresenius Medical Care Credit Agreement,
FMC-AG & Co. KGaA is required to comply with a maximum
leverage ratio (ratio of net debt to EBITDA).
As of December 31, 2018, FMC-AG & Co. KGaA and its sub-
sidi aries were in compliance with all covenants under the
Fresenius Medical Care Credit Agreement.
Fresenius Credit AgreementOn December 20, 2012, Fresenius SE & Co. KGaA and various
subsidiaries entered into a delayed draw syndicated credit
agreement (2013 Credit Agreement) in the original amount
of US$ 1,300 million and € 1,250 million. Since the initial
funding of the Credit Agreement in June 2013, additional
tranches were added. Furthermore, scheduled amortization
payments as well as voluntary repayments have been made.
In August 2017, the Credit Agreement was refinanced and
replaced by new tranches with a total amount of approxi-
mately € 3,800 million.
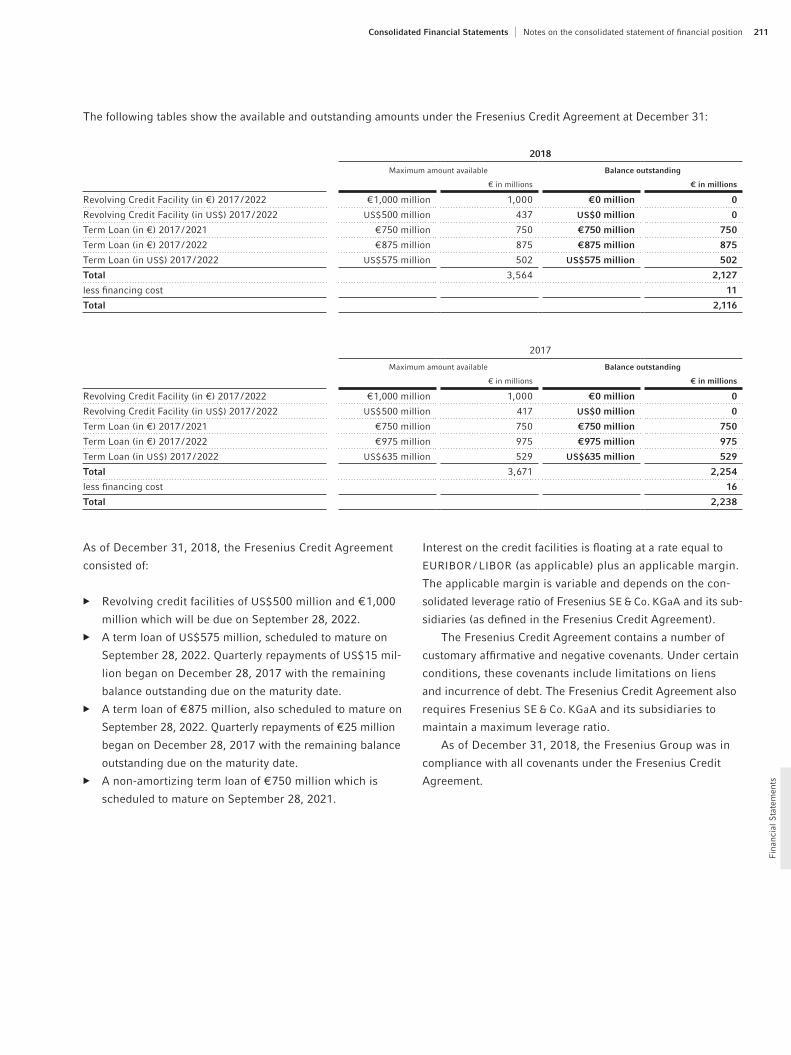
211
Fin
anci
al S
tate
men
ts
Consolidated Financial Statements Notes on the consolidated statement of financial position
The following tables show the available and outstanding amounts under the Fresenius Credit Agreement at December 31:
2018
Maximum amount available Balance outstanding
€ in millions € in millions
Revolving Credit Facility (in €) 2017 / 2022 € 1,000 million 1,000 € 0 million 0
Revolving Credit Facility (in US$) 2017 / 2022 US$ 500 million 437 US$ 0 million 0
Term Loan (in €) 2017 / 2021 € 750 million 750 € 750 million 750
Term Loan (in €) 2017 / 2022 € 875 million 875 € 875 million 875
Term Loan (in US$) 2017 / 2022 US$ 575 million 502 US$ 575 million 502
Total 3,564 2,127
less financing cost 11
Total 2,116
2017
Maximum amount available Balance outstanding
€ in millions € in millions
Revolving Credit Facility (in €) 2017 / 2022 € 1,000 million 1,000 € 0 million 0
Revolving Credit Facility (in US$) 2017 / 2022 US$ 500 million 417 US$ 0 million 0
Term Loan (in €) 2017 / 2021 € 750 million 750 € 750 million 750
Term Loan (in €) 2017 / 2022 € 975 million 975 € 975 million 975
Term Loan (in US$) 2017 / 2022 US$ 635 million 529 US$ 635 million 529
Total 3,671 2,254
less financing cost 16
Total 2,238
As of December 31, 2018, the Fresenius Credit Agreement
consisted of:
▶ Revolving credit facilities of US$ 500 million and € 1,000
million which will be due on September 28, 2022.
▶ A term loan of US$ 575 million, scheduled to mature on
September 28, 2022. Quarterly repayments of US$ 15 mil-
lion began on December 28, 2017 with the remaining
balance outstanding due on the maturity date.
▶ A term loan of € 875 million, also scheduled to mature on
September 28, 2022. Quarterly repayments of € 25 million
began on December 28, 2017 with the remaining balance
outstanding due on the maturity date.
▶ A non-amortizing term loan of € 750 million which is
scheduled to mature on September 28, 2021.
Interest on the credit facilities is floating at a rate equal to
EURIBOR / LIBOR (as applicable) plus an applicable margin.
The applicable margin is variable and depends on the con-
solidated leverage ratio of Fresenius SE & Co. KGaA and its sub-
sidiaries (as defined in the Fresenius Credit Agreement).
The Fresenius Credit Agreement contains a number of
customary affirmative and negative covenants. Under certain
conditions, these covenants include limitations on liens
and incurrence of debt. The Fresenius Credit Agreement also
requires Fresenius SE & Co. KGaA and its subsidiaries to
maintain a maximum leverage ratio.
As of December 31, 2018, the Fresenius Group was in
compliance with all covenants under the Fresenius Credit
Agreement.
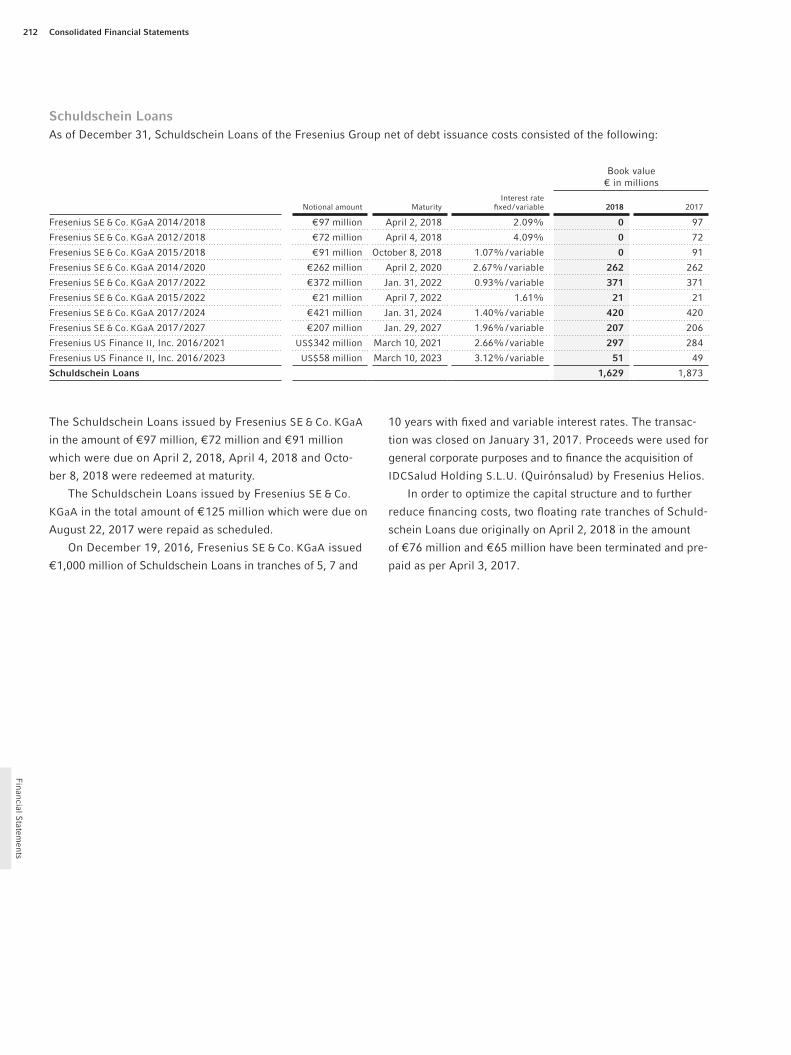
Consolidated Financial Statements212
Financial S
tatements
Schuldschein LoansAs of December 31, Schuldschein Loans of the Fresenius Group net of debt issuance costs consisted of the following:
Book value€ in millions
Notional amount MaturityInterest rate
fixed / variable 2018 2017
Fresenius SE & Co. KGaA 2014 / 2018 € 97 million April 2, 2018 2.09% 0 97
Fresenius SE & Co. KGaA 2012 / 2018 € 72 million April 4, 2018 4.09% 0 72
Fresenius SE & Co. KGaA 2015 / 2018 € 91 million October 8, 2018 1.07% / variable 0 91
Fresenius SE & Co. KGaA 2014 / 2020 € 262 million April 2, 2020 2.67% / variable 262 262
Fresenius SE & Co. KGaA 2017 / 2022 € 372 million Jan. 31, 2022 0.93% / variable 371 371
Fresenius SE & Co. KGaA 2015 / 2022 € 21 million April 7, 2022 1.61% 21 21
Fresenius SE & Co. KGaA 2017 / 2024 € 421 million Jan. 31, 2024 1.40% / variable 420 420
Fresenius SE & Co. KGaA 2017 / 2027 € 207 million Jan. 29, 2027 1.96% / variable 207 206
Fresenius US Finance II, Inc. 2016 / 2021 US$ 342 million March 10, 2021 2.66% / variable 297 284
Fresenius US Finance II, Inc. 2016 / 2023 US$ 58 million March 10, 2023 3.12% / variable 51 49
Schuldschein Loans 1,629 1,873
The Schuldschein Loans issued by Fresenius SE & Co. KGaA
in the amount of € 97 million, € 72 million and € 91 million
which were due on April 2, 2018, April 4, 2018 and Octo-
ber 8, 2018 were redeemed at maturity.
The Schuldschein Loans issued by Fresenius SE & Co.
KGaA in the total amount of € 125 million which were due on
August 22, 2017 were repaid as scheduled.
On December 19, 2016, Fresenius SE & Co. KGaA issued
€ 1,000 million of Schuldschein Loans in tranches of 5, 7 and
10 years with fixed and variable interest rates. The transac-
tion was closed on January 31, 2017. Proceeds were used for
general corporate purposes and to finance the acquisition of
IDCSalud Holding S.L.U. (Quirónsalud) by Fresenius Helios.
In order to optimize the capital structure and to further
reduce financing costs, two floating rate tranches of Schuld-
schein Loans due originally on April 2, 2018 in the amount
of € 76 million and € 65 million have been terminated and pre-
paid as per April 3, 2017.

213
Fin
anci
al S
tate
men
ts
Consolidated Financial Statements Notes on the consolidated statement of financial position
The Schuldschein Loans of Fresenius SE & Co. KGaA are guar-
anteed by Fresenius Kabi AG and Fresenius ProServe GmbH.
The Schuldschein Loans of Fresenius US Finance II, Inc. are
guaranteed by Fresenius SE & Co. KGaA, Fresenius Kabi AG
and Fresenius ProServe GmbH.
As of December 31, 2018, the Fresenius Group was in
compliance with all of its covenants under the Schuld schein
Loans.
Accounts Receivable Facility of Fresenius Medical CareOn December 20, 2018, the asset securitization facility
(Accounts Receivable Facility) of Fresenius Medical Care was
refinanced, increasing the facility to US$ 900 million (€ 786
million) and extending it until December 20, 2021.
At December 31, 2018, there were no outstanding bor-
rowings under the Accounts Receivable Facility (2017:
US$ 353 million (€ 294 million)). In the amounts shown, debt
issuance costs are not included. Fresenius Medical Care had
letters of credit outstanding under the Accounts Receivable
Facility in the amount of US$ 27 million (€ 23 million) at
December 31, 2018 and US$ 71 million (€ 59 million) at Decem-
ber 31, 2017. These letters of credit are not included above
as part of the balance outstanding at December 31, 2018,
however, they reduce available borrowings under the Accounts
Receivable Facility.
Under the Accounts Receivable Facility, certain receivables
are sold to NMC Funding Corp. (NMC Funding), a wholly
owned subsidiary of Fresenius Medical Care. NMC Funding
then assigns percentage ownership interests in the accounts
receivable to certain bank investors. Under the terms of the
Accounts Receivable Facility, NMC Funding retains the right,
at any time, to recall all the then outstanding transferred inter-
ests in the accounts receivable. Con sequently, the receivables
remain on the consolidated statement of financial position
and the proceeds from the trans fer of percentage ownership
interests are recorded as long-term debt.
NMC Funding pays interest to the bank investors, calcu-
lated based on the commercial paper rates for the particular
tranches selected. At December 31, 2018, this facility was
not utilized. At December 31, 2017, the interest rate on the
utilized borrowings was 1.40%. Refinancing fees, which
include legal costs and bank fees, are amortized over the term
of the facility.
CREDIT LINES AND OTHER SOURCES OF LIQUIDITY
In addition to the financial liabilities described before, the
Fresenius Group maintains additional credit facilities which
have not been utilized, or have only been utilized in part, as
of the reporting date. At December 31, 2018, the additional
financial cushion resulting from unutilized credit facilities
was approximately € 3.8 billion.
Syndicated credit facilities accounted for € 2.8 billion.
This portion is comprised of the Fresenius Medical Care
Credit Agreement in the amount of € 1,385 million and the
Fresenius Credit Agreement in the amount of € 1,437 million.
Furthermore, bilateral facili ties of approximately € 1,000 million
were available. They include credit facilities which certain
entities of the Fresenius Group have arranged with commercial
banks. These credit facilities are used for general corporate
purposes and are usually unsecured.
In addition, Fresenius SE & Co. KGaA has a commercial
paper program under which up to € 1,000 million in short-term
notes can be issued. As of December 31, 2018, the commer-
cial paper program of Fresenius SE & Co. KGaA was utilized in
the amount of € 973 million.
Fresenius Medical Care can also issue short-term notes
of up to € 1,000 million under a commercial paper program.
As of December 31, 2018, the commercial paper program
of Fresenius Medical Care AG & Co. KGaA was utilized in the
amount of € 1,000 million.
Additional financing of up to US$ 900 million (€ 786 million)
can be provided using the Fresenius Medical Care Accounts
Receivable Facility which had been utilized in the amount of
US$ 27 million (€ 23 million) as of December 31, 2018.

Consolidated Financial Statements214
Financial S
tatements
Bridge Financing FacilityOn April 25, 2017, Fresenius SE & Co. KGaA entered into a
Bridge Financing Facility in the amount of US$ 4,200 million
with a tenor of 18 months for the purpose of the acquisition
of Akorn, Inc. In October 2018, the Bridge Financing Facility
was amended and extended until April 2019. On Decem-
ber 10, 2018, the Bridge Financing Facility was prematurely
cancelled by Fresenius SE & Co. KGaA without having been
utilized.
23. BONDSAs of December 31, bonds of the Fresenius Group net of debt issuance costs consisted of the following:
Book value € in millions
Notional amount Maturity Interest rate 2018 2017
Fresenius Finance Ireland PLC 2017 / 2022 € 700 million Jan. 31, 2022 0.875% 697 695
Fresenius Finance Ireland PLC 2017 / 2024 € 700 million Jan. 30, 2024 1.50% 696 696
Fresenius Finance Ireland PLC 2017 / 2027 € 700 million Feb. 1, 2027 2.125% 692 692
Fresenius Finance Ireland PLC 2017 / 2032 € 500 million Jan. 30, 2032 3.00% 494 494
Fresenius SE & Co. KGaA 2014 / 2019 € 300 million Feb. 1, 2019 2.375% 300 299
Fresenius SE & Co. KGaA 2012 / 2019 € 500 million Apr. 15, 2019 4.25% 500 499
Fresenius SE & Co. KGaA 2013 / 2020 € 500 million July 15, 2020 2.875% 499 498
Fresenius SE & Co. KGaA 2014 / 2021 € 450 million Feb. 1, 2021 3.00% 447 446
Fresenius SE & Co. KGaA 2014 / 2024 € 450 million Feb. 1, 2024 4.00% 450 449
Fresenius US Finance II, Inc. 2014 / 2021 US$ 300 million Feb. 1, 2021 4.25% 261 249
Fresenius US Finance II, Inc. 2015 / 2023 US$ 300 million Jan. 15, 2023 4.50% 260 248
FMC Finance VII S.A. 2011 / 2021 € 300 million Feb. 15, 2021 5.25% 297 297
FMC Finance VIII S.A. 2011 / 2018 € 400 million Sept. 15, 2018 6.50% 0 399
FMC Finance VIII S.A. 2012 / 2019 € 250 million July 31, 2019 5.25% 246 245
Fresenius Medical Care AG & Co. KGaA 2018 / 2025 € 500 million July 11, 2025 1.50% 496 0
Fresenius Medical Care US Finance, Inc. 2011 / 2021 US$ 650 million Feb. 15, 2021 5.75% 565 538
Fresenius Medical Care US Finance II, Inc. 2011 / 2018 US$ 400 million Sept. 15, 2018 6.50% 0 332
Fresenius Medical Care US Finance II, Inc. 2012 / 2019 US$ 800 million July 31, 2019 5.625% 698 666
Fresenius Medical Care US Finance II, Inc. 2014 / 2020 US$ 500 million Oct. 15, 2020 4.125% 435 415
Fresenius Medical Care US Finance II, Inc. 2012 / 2022 US$ 700 million Jan. 31, 2022 5.875% 610 581
Fresenius Medical Care US Finance II, Inc. 2014 / 2024 US$ 400 million Oct. 15, 2024 4.75% 347 331
Bonds 8,990 9,069
FRESENIUS SE & CO. KGAA
As of December 31, 2018, the bonds issued by Fresenius SE &
Co. KGaA in the amount of € 300 million due on February 1,
2019 and € 500 million due on April 15, 2019 are shown as
current portion of bonds in the consolidated statement of
financial position. Mainly to refinance these bonds, on Janu-
ary 21, 2019, Fresenius SE & Co. KGaA issued bonds with
an aggregate volume of € 1.0 billion. The bonds consist of
2 tranches with maturities of 6 and 10 years. The coupon of
the 6-year tranche of € 500 million is 1.875% and was issued
at a price of 99.257%. The € 500 million tranche with a
10-year maturity has a coupon of 2.875% and was issued at
a price of 99.164%. The proceeds will be used for general
corporate purposes including refinancing of maturing notes.
On January 30, 2017, Fresenius Finance Ireland PLC, a
subsidiary of Fresenius SE & Co. KGaA, issued bonds with an
aggregate volume of € 2.6 billion. The bonds consist of
tranches with maturities of 5, 7, 10 and 15 years. The pro-
ceeds were used to fund the acquisition of IDCSalud Holding
S.L.U. (Quirónsalud) and for general corporate purposes.
All bonds of Fresenius US Finance II, Inc. and of
Fresenius Finance Ireland PLC are guaranteed by Fresenius
SE & Co. KGaA. The holders have the right to request that the
issuers repurchase the bonds at 101% of principal plus
accrued interest upon the occurrence of a change of control
followed by a decline in the rating of the respective bonds. All
bonds of Fresenius US Finance II, Inc., Fresenius Finance Ire-
land PLC and the bonds issued by Fresenius SE & Co. KGaA
before 2019, may be redeemed prior to their maturity at the

215
Fin
anci
al S
tate
men
ts
Consolidated Financial Statements Notes on the consolidated statement of financial position
option of the issuers at a price of 100% plus accrued
interest and a premium calculated pursuant to the terms of
the indentures under observ ance of certain notice periods.
Fresenius SE & Co. KGaA has agreed to a number of
cove nants to provide protection to the holders of bonds
issued before 2017, which partly restrict the scope of action
of Fresenius SE & Co. KGaA and its sub sidiaries (excluding
Fresenius Medical Care AG & Co. KGaA (FMC-AG & Co. KGaA)
and its subsidiaries). These covenants include restrictions
on further debt that can be raised, the mort gaging or sale of
assets, the entering into sale and leaseback transactions as
well as mergers and consolidations with other companies.
Some of these restrictions were suspended auto matically
as the rating of the respective bonds reached investment grade
status. As of December 31, 2018, the Fresenius Group was
in compliance with all of its covenants.
FRESENIUS MEDICAL CARE AG & CO. KGAA
On July 11, 2018, Fresenius Medical Care AG & Co. KGaA
issued bonds with an aggregate principal amount of € 500 mil-
lion. The bonds have a maturity of seven years and an annual
coupon of 1.5%. The issue price was 99.704%. The pro-
ceeds were used for general corporate purposes, including
the refinancing of maturities.
The bonds issued by FMC Finance VIII S.A. in the
amount of € 400 million and by Fresenius Medical Care US
Finance II, Inc. in the amount of US$ 400 million which were
due on September 15, 2018 were redeemed at maturity. As of
December 31, 2018, the bonds issued by FMC Finance VIII
S.A. in the amount of € 250 million and the bonds issued by
Fresenius Medical Care US Finance II, Inc. in the amount of
of US$ 800, due on July 31, 2019 are shown as current portion
of bonds in the consolidated statement of financial position.
The bonds issued by Fresenius Medical Care US Finance,
Inc. were redeemed at maturity on July 17, 2017.
The bonds of Fresenius Medical Care US Finance, Inc.,
Fresenius Medical Care US Finance II, Inc., FMC Finance VII
S.A. and FMC Finance VIII S.A. (wholly owned subsidiaries
of FMC-AG & Co. KGaA) are guaranteed jointly and severally by
FMC-AG & Co. KGaA and Fresenius Medical Care Holdings, Inc.
The holders have the right to request that the respective
issuers repurchase the respective bonds at 101% of principal
plus accrued interest upon the occurrence of a change of con-
trol of FMC-AG & Co. KGaA followed by a decline in the rating
of the res pec tive bonds. The issuers may redeem the bonds
issued before 2018 at any time at 100% of principal plus
accrued interest and a premium calculated pursuant to the
terms of the indentures.
FMC-AG & Co. KGaA has agreed to a number of covenants
to provide protection to the holders of bonds issued before
2018 which, under certain circumstances, restrict the scope
of action of FMC-AG & Co. KGaA and its subsidiaries. These
covenants include restrictions on further debt that can be
raised, the mortgaging or sale of assets, the entering into sale
and leaseback transactions as well as mergers and consoli-
dations with other companies. Some of these restrictions
were suspended auto matically as the rating of the respective
bonds reached investment grade status. As of December 31,
2018, FMC-AG & Co. KGaA and its subsidiaries were in com-
pliance with all of their covenants under the bonds.

Consolidated Financial Statements216
Financial S
tatements
The fair value of the derivatives embedded in the convertible
bonds of Fresenius SE & Co. KGaA was € 39 million at Decem-
ber 31, 2018. The derivative embedded in the convertible
bonds of Fresenius Medical Care AG & Co. KGaA (FMC-AG &
Co. KGaA) was recognized with a fair value of € 12 million at
December 31, 2018. Fresenius SE & Co. KGaA and FMC-AG &
Co. KGaA have purchased stock options (call options) to
hedge future fair value fluctuations of these derivatives. As
of December 31, 2018, the call options had a corresponding
aggregate fair value of € 39 million and € 12 million,
respectively.
The conversions will be cash-settled. Any increase of
Fresenius’ share price and of Fresenius Medical Care’s share
price above the conversion price would be offset by a corre-
sponding value increase of the call options.
The derivatives embedded in the convertible bonds and
the call options are recognized in other current and other
non-current liabilities / assets in the consolidated statement of
financial position.
The convertible bonds issued by Fresenius SE & Co. KGaA
in the amount of € 500 million due on September 24, 2019
are shown as current portion of convertible bonds in the con-
solidated statement of financial position.
On January 31, 2017, Fresenius SE & Co. KGaA issued
€ 500 million of equity-neutral convertible bonds due 2024.
The convertible bonds will not bear any interest. The pro-
ceeds were used to fund the acquisition of IDCSalud Holding
S.L.U. (Quirónsalud) and for general corporate purposes.
25. PENSIONS AND SIMILAR OBLIGATIONS
GENERAL
The Fresenius Group recognizes pension costs and related
pension liabilities for current and future benefits to quali-
fied current and former employees of the Fresenius Group.
Fresenius Group’s pension plans are structured in accor-
dance with the differing legal, economic and fiscal circum-
stances in each country. The Fresenius Group currently has
two types of plans, defined benefit and defined contribution
plans. In general, plan benefits in defined benefit plans are
based on all or a portion of the employees’ years of services
and final salary. Plan benefits in defined contribution plans
are determined by the amount of contribution by the employee
and the employer, both of which may be limited by legis-
lation, and the returns earned on the investment of those
contributions.
Upon retirement under defined benefit plans, the Fresenius
Group is required to pay defined benefits to former employ-
ees when the defined benefits become due. Defined benefit
plans may be funded or unfunded. The Fresenius Group has
funded defined benefit plans in particular in the United States,
Norway, the United Kingdom, the Netherlands and Austria.
Unfunded defined benefit plans are located in Germany and
France.
24. CONVERTIBLE BONDSAs of December 31, the convertible bonds of the Fresenius Group net of debt issuance costs consisted of the following:
Book value € in millions
Notional amount Maturity CouponCurrent
conversion price 2018 2017
Fresenius SE & Co. KGaA 2014 / 2019 € 500 million Sept. 24, 2019 0.000% € 49.0848 493 483
Fresenius SE & Co. KGaA 2017 / 2024 € 500 million Jan. 31, 2024 0.000% € 106.8947 457 448
Fresenius Medical Care AG & Co. KGaA 2014 / 2020 € 400 million Jan. 31, 2020 1.125% € 73.1980 393 387
Convertible bonds 1,343 1,318

217
Fin
anci
al S
tate
men
ts
Consolidated Financial Statements Notes on the consolidated statement of financial position
Actuarial assumptions generally determine benefit obliga-
tions under defined benefit plans. The actuarial calculations
require the use of estimates. The main factors used in the
actuarial calculations affecting the level of the benefit obliga-
tions are: assumptions on life expectancy, the discount rate
and future salary and benefit levels. Under Fresenius Group’s
funded plans, assets are set aside to meet future payment
obligations. An estimated return on the plan assets is recog-
nized as income in the respective period. Actuarial gains and
losses are generated when there are variations in the actu-
arial assumptions and by differences between the actual and
the estimated projected benefit obligations and the return
on plan assets for that year. A company’s pension liability is
impacted by these actuarial gains or losses.
Related to defined benefit plans, the Fresenius Group is
exposed to certain risks. Besides general actuarial risks, e. g.
the longevity risk and the interest rate risk, the Fresenius
Group is exposed to market risk as well as to investment risk.
In the case of Fresenius Group’s funded plans, the defined
benefit obligation is offset against the fair value of plan assets
(funded status). A pension liability is recognized in the consoli-
dated statement of financial position if the defined benefit
obligation exceeds the fair value of plan assets. An asset is
recognized and reported under other assets in the consoli-
dated statement of financial position if the fair value of plan
assets exceeds the defined benefit obligation and if the
Fresenius Group has a right of reimbursement against the
fund or a right to reduce future payments to the fund.
Under defined contribution plans, the Fresenius Group
pays defined contributions to an independent third party as
directed by the employee during the employee’s service life
which satisfies all obligations of the Fresenius Group to the
employee. The employee retains all rights to the contribu-
tions made by the employee and to the vested portion of the
Fresenius Group paid contributions upon leaving the Fresenius
Group. The Fresenius Group has a main defined contribu-
tion plan in the United States.
DEFINED BENEFIT PENSION PLANS
At December 31, 2018, the defined benefit obligation (DBO) of
the Fresenius Group of € 1,787 million (2017: € 1,671 million)
included € 565 million (2017: € 526 million) funded by plan
assets and € 1,222 million (2017: € 1,145 million) covered
by pension provisions. Furthermore, the pension liability con-
tains benefit obligations offered by other sub sidiaries of
Fresenius Medical Care in an amount of € 35 million (2017:
€ 37 million). The current portion of the pension liability in an
amount of € 22 million (2017: € 19 million) is recognized in
the con solidated statement of financial position within short-
term provisions and other short-term liabilities. The non-
current portion of € 1,235 million (2017: € 1,163 million) is
recorded as pension liability.
The major part of pension liabilities relates to Germany.
At December 31, 2018, 82% of the pension liabilities were
recognized in Germany and 16% predominantly in the rest of
Europe and North America. 49% of the beneficiaries were
located in North America, 35% in Germany and the remainder
throughout the rest of Europe and other continents.
74% of the pension liabilities in an amount of € 1,257 mil-
lion relate to the “Versorgungsordnung der Fresenius-
Unternehmen” established in 2016 (Pension Plan 2016), which
applies for most of the German entities of the Fresenius Group
except Fresenius Helios. The remaining pension liabili ties
relate to individual plans from Fresenius Helios entities in
Germany and non-German Group entities.
Plan benefits are generally based on an employee’s years
of service and final salary. Consistent with predominant prac-
tice in Germany, the benefit obligations of the German entities
of the Fresenius Group are unfunded. The German Pen sion
Plan 2016 does not have a separate pension fund.
Fresenius Medical Care Holdings, Inc. (FMCH), a subsid-
iary of Fresenius Medical Care AG & Co. KGaA, has a defined
ben efit pension plan for its employees in the United States
and supplemental executive retirement plans. During the first
quarter of 2002, FMCH curtailed these pension plans. Under
the curtailment amendment for substantially all employees eli-
gible to participate in the plan, benefits have been frozen as
of the curtailment date and no additional defined benefits for

Consolidated Financial Statements218
Financial S
tatements
future services will be earned. FMCH has retained all employee
benefit obligations as of the curtailment date. Each year,
FMCH contributes to the plan covering United States employ-
ees at least the minimum amount required by the Employee
Retirement Income Security Act of 1974, as amended. In 2018,
there was no minimum funding requirement for the defined
benefit plan. FMCH voluntarily provided € 43 million. Expected
funding for 2019 is € 1 million.
Benefit plans offered by other subsidiaries of Fresenius
Medical Care outside of the United States, Germany and
France contain separate benefit obligations. The total pension
liability for these other plans was € 35 million and € 37 million
at December 31, 2018 and 2017, respectively. The current
pension liability of € 3 million (2017: € 3 million) is recognized
as a current liability in the line item short-term provisions
and other short-term liabilities. The non-current pension lia-
bility of € 32 million (2017: € 34 million) for these plans is
recorded as pension liability in the consolidated statement of
financial position.
Fresenius Group’s benefit obligations relating to fully or
partly funded pension plans were € 687 million. Benefit obliga-
tions relating to unfunded pension plans were € 1,100 million.
The following table shows the changes in benefit obliga-
tions, the changes in plan assets, the funded status of the
pension plans and the pension liability. Benefits paid as shown
in the changes in benefit obligations represent payments made
from both the funded and unfunded plans while the benefits
paid as shown in the changes in plan assets include only ben-
efit payments from Fresenius Group’s funded benefit plans.
The pension liability has developed as follows:
€ in millions 2018 2017
Benefit obligations at the beginning of the year 1,671 1,671
Changes in entities consolidated 0 28
Foreign currency translation 22 - 63
Service cost 59 63
Past service cost - 5 –
Settlements 0 - 1
Net interest cost 42 40
Contributions by plan participants 4 3
Transfer of plan participants 7 3
Remeasurements 31 - 29
Actuarial losses (gains) arising from changes in financial assumptions - 1 - 33
Actuarial losses (gains) arising from changes in demographic assumptions 11 - 4
Actuarial losses (gains) arising from experience adjustments 21 8
Benefits paid - 44 - 44
Benefit obligations at the end of the year 1,787 1,671
thereof vested 1,464 1,392
Fair value of plan assets at the beginning of the year 526 532
Changes in entities consolidated 0 22
Foreign currency translation 17 - 47
Actual return (cost) on plan assets - 16 31
Interest income from plan assets 15 17
Actuarial gains (losses) arising from experience adjustments - 31 14
Contributions by the employer 55 10
Contributions by plan participants 4 3
Settlements 0 - 1
Transfer of plan participants 8 4
Gains from divestitures - 1 - 1
Benefits paid - 28 - 27
Fair value of plan assets at the end of the year 565 526
Funded status as of December 31 1,222 1,145
Benefit plans offered by other subsidiaries 35 37
Pension liability as of December 31 1,257 1,182
The plan assets are neither invested in the Fresenius Group
nor in related parties of the Fresenius Group.
As of December 31, 2018 and 2017, the fair value of
plan assets did not exceed the benefit obligations in any
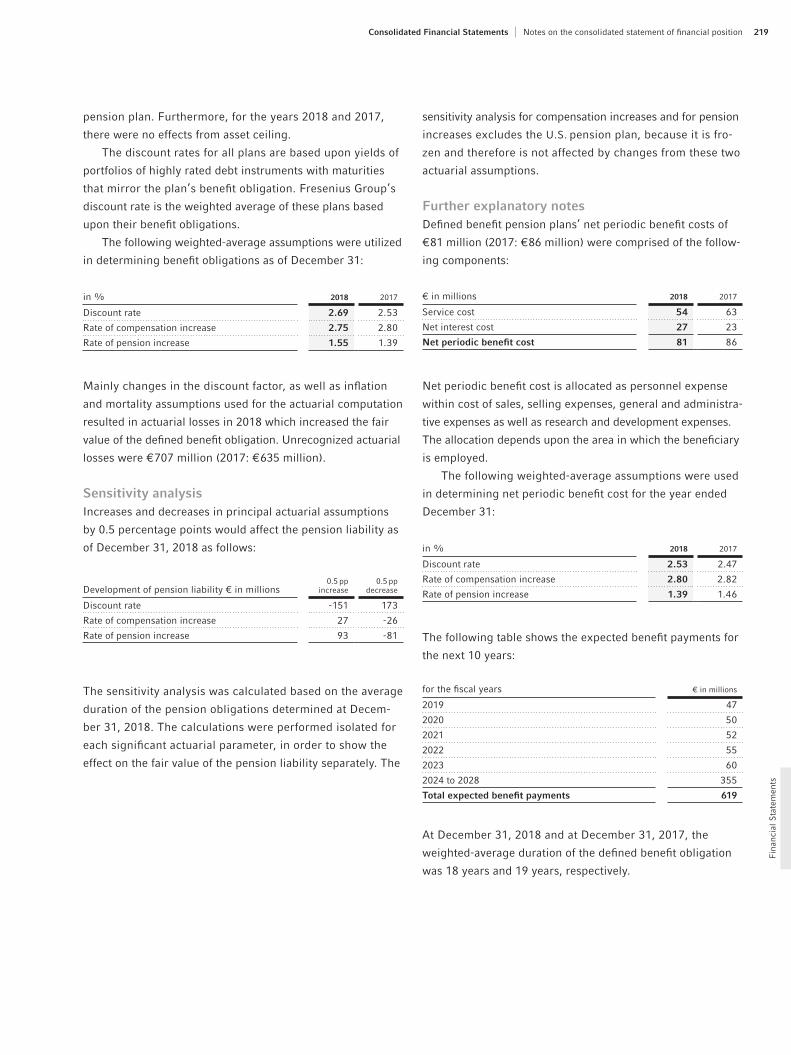
219
Fin
anci
al S
tate
men
ts
Consolidated Financial Statements Notes on the consolidated statement of financial position
pension plan. Furthermore, for the years 2018 and 2017,
there were no effects from asset ceiling.
The discount rates for all plans are based upon yields of
portfolios of highly rated debt instruments with matur ities
that mirror the plan’s benefit obligation. Fresenius Group’s
discount rate is the weighted average of these plans based
upon their benefit obligations.
The following weighted-average assumptions were utilized
in determining benefit obligations as of December 31:
in % 2018 2017
Discount rate 2.69 2.53
Rate of compensation increase 2.75 2.80
Rate of pension increase 1.55 1.39
Mainly changes in the discount factor, as well as inflation
and mortality assumptions used for the actuarial computation
resulted in actuarial losses in 2018 which increased the fair
value of the defined benefit obligation. Unrecognized actu arial
losses were € 707 million (2017: € 635 million).
Sensitivity analysisIncreases and decreases in principal actuarial assumptions
by 0.5 percentage points would affect the pension liability as
of December 31, 2018 as follows:
Development of pension liability € in millions0.5 pp
increase0.5 pp
decrease
Discount rate - 151 173
Rate of compensation increase 27 - 26
Rate of pension increase 93 - 81
The sensitivity analysis was calculated based on the average
duration of the pension obligations determined at Decem-
ber 31, 2018. The calculations were performed isolated for
each significant actuarial parameter, in order to show the
effect on the fair value of the pension liability separately. The
sensitivity analysis for compensation increases and for pension
increases excludes the U.S. pension plan, because it is fro-
zen and therefore is not affected by changes from these two
actuarial assumptions.
Further explanatory notesDefined benefit pension plans’ net periodic benefit costs of
€ 81 million (2017: € 86 million) were comprised of the follow-
ing components:
€ in millions 2018 2017
Service cost 54 63
Net interest cost 27 23
Net periodic benefit cost 81 86
Net periodic benefit cost is allocated as personnel expense
within cost of sales, selling expenses, general and administra-
tive expenses as well as research and development expenses.
The allocation depends upon the area in which the beneficiary
is employed.
The following weighted-average assumptions were used
in determining net periodic benefit cost for the year ended
December 31:
in % 2018 2017
Discount rate 2.53 2.47
Rate of compensation increase 2.80 2.82
Rate of pension increase 1.39 1.46
The following table shows the expected benefit payments for
the next 10 years:
for the fiscal years € in millions
2019 47
2020 50
2021 52
2022 55
2023 60
2024 to 2028 355
Total expected benefit payments 619
At December 31, 2018 and at December 31, 2017, the
weighted-average duration of the defined benefit obligation
was 18 years and 19 years, respectively.

Consolidated Financial Statements220
Financial S
tatements
The methods and inputs used to measure the fair value of plan
assets are as follows:
Index funds are valued based on market quotes.
Other equity investments are valued at their market prices
as of the date of the statement of financial position.
Government bonds are valued based on both market
prices (Level 1) and market quotes (Level 2).
Corporate bonds and other bonds are valued based on
market quotes as of the date of the statement of financial
position.
Cash is stated at nominal value which equals the fair value.
U.S. Treasury money market funds as well as other
money market and mutual funds are valued at their market
prices.
Plan investment policy and strategy in the United StatesThe Fresenius Group periodically reviews the assumptions
for long-term expected return on pension plan assets. As part
of the assumptions review, a range of reasonable expected
investment returns for the pension plan as a whole was deter-
mined based on an analysis of expected future returns for
each asset class weighted by the allocation of the assets. The
range of returns developed relies both on forecasts, which
include the actuarial firm’s expected long-term rates of return
for each significant asset class or economic indicator, and on
broad-market historical benchmarks for expected return,
correlation, and volatility for each asset class.
The overall investment strategy for the U.S. pension plan
is to achieve a mix of approximately 99% of investments for
long-term growth and income and 1% in cash or cash equiv-
alents. Investment income and cash or cash equivalents are
used for near-term benefit payments. Investments are gov-
erned by the plan investment policy and include well diversi-
fied index funds or funds targeting index performance.
The fair values of plan assets by categories were as follows:
December 31, 2018 December 31, 2017
€ in millions
Quoted prices in active markets
for identical assets
Level 1
Significant observable
inputsLevel 2 Total
Quoted prices in active markets for
identical assets Level 1
Significant observable
inputsLevel 2 Total
Categories of plan assets
Equity investments 73 76 149 72 72 144
Index funds 1 43 76 119 47 72 119
Other equity investments 30 0 30 25 0 25
Fixed income investments 160 190 350 117 204 321
Government securities 2 16 0 16 10 1 11
Corporate bonds 3 69 187 256 69 199 268
Other fixed income investments 4 75 3 78 38 4 42
Other 5 55 11 66 46 15 61
Total 288 277 565 235 291 526
1 This category is mainly comprised of low-cost equity index funds not actively managed that track the S & P 500, S & P 400, Russell 2000, the MSCI Emerging Markets Index and the Morgan Stanley International EAFE Index.
2 This category is primarily comprised of fixed income investments by the U.S. government and government sponsored entities.3 This category primarily represents investment grade bonds of U.S. issuers from diverse industries.4 This category is mainly comprised of private placement bonds as well as collateralized mortgage obligations as well as cash and
funds that invest in U.S. treasury obligations directly or in U.S. treasury backed obligations.5 This category mainly represents cash, money market funds as well as mutual funds comprised of high grade corporate bonds.

221
Fin
anci
al S
tate
men
ts
Consolidated Financial Statements Notes on the consolidated statement of financial position
The plan investment policy, utilizing a revised target invest-
ment allocation in a range around 26% equity and 74% fixed
income investments, considers that there will be a time hori-
zon for invested funds of more than five years. The total port-
folio will be measured against a custom index that reflects
the asset class benchmarks and the target asset allocation. The
plan investment policy does not allow investments in securi-
ties of Fresenius Medical Care AG & Co. KGaA or other related
party securities. The performance benchmarks for the sepa-
rate asset classes include: S & P 500 Index, S & P 400 Mid-Cap
Index, Russell 2000 Index, MSCI EAFE Index, MSCI Emerg-
ing Markets Index, Barclays Capital Long-Corporate Bond
Index, Bloomberg Barclays U.S. Corporate High Yield Index,
and Bloomberg Barclays U.S. High Yield Fallen Angel 3%
Capped Index.
The following schedule describes Fresenius Group’s
allocation for its funded plans.
in %Allocation
2018Allocation
2017Target
allocation
Equity investments 26.39 27.31 27.55
Fixed income investments 61.89 60.97 60.90
Other incl. real estate 11.72 11.72 11.55
Total 100.00 100.00 100.00
Contributions to plan assets for the fiscal year 2019 are
expec ted to amount to € 13 million.
DEFINED CONTRIBUTION PLANS
Fresenius Group’s total expense under defined contribution
plans for 2018 was € 157 million (2017: € 146 million). Of this
amount, € 95 million related to contributions by the Fresenius
Group to several public supplementary pension funds for
employees of Fresenius Helios. Further € 54 million related to
contributions to the U.S. savings plan, which employees of
Fresenius Medical Care Holdings, Inc. can join.
Following applicable collective bargaining agreements, the
Fresenius Group pays contributions for a given number of
employees of Fresenius Helios to the Rheinische Zusatz ver sor-
gungskasse (a supplementary pension fund) and to other
public supplementary pension funds (together referred to as
ZVK ÖD) to complement statutory retirement pensions. Given
that employees from multiple participating entities are insured
by these ZVK ÖDs, these plans are Multi-Employer plans.
ZVK ÖDs are defined benefit plans according to IAS 19
since employees are entitled to the statutory benefits regard-
less of the amounts contributed. The plan assets of the fund
necessary to evaluate and calculate the funded status of the
Group cannot be obtained from the supplementary pension
funds. The calculation of a pension liability according to IAS 19
is not possible due to missing information about future
payment obligations. Therefore, the obligation is accounted
for as defined contribution plan according to IAS 19.34a.
The plan operates on a pay-as-you-earn system based on
applying a collection rate to given parts of gross remuner ation.
Paid contributions are accounted for as personnel
expenses within cost of sales, selling expenses as well as gen-
eral and admin istrative expenses and amounted to € 95 mil-
lion in 2018 (2017: € 90 million). Thereof, € 49 million (2017:
€ 48 million) were payments to Rheinische Zusatzversorgungs-
kasse, to Versorgungsanstalt des Bundes und der Länder
and to Zusatzversorgungskasse Wiesbaden (supplementary
pension funds). The Group expects to contribute € 97 million
in 2019.
Under the U.S. savings plan, employees can deposit up
to 75% of their pay up to an annual maximum of US$ 18,500
if under 50 years old (US$ 24,500 if 50 or over). Fresenius
Medical Care will match 50% of the employee deposit up to
a maximum company contribution of 3% of the employee’s
pay. Fresenius Medical Care’s total expense under this defined
contribution plan for the years ended December 31, 2018 and
2017 was € 54 million and € 49 million, respectively.

Consolidated Financial Statements222
Financial S
tatements
26. NONCONTROLLING INTERESTAs of December 31, noncontrolling interest in the Fresenius
Group was as follows:
€ in millions 2018 2017
Noncontrolling interest in Fresenius Medical Care AG & Co. KGaA 8,143 6,796
Noncontrolling interest in VAMED AG 83 66
Noncontrolling interest in the business segments
Fresenius Medical Care 1,144 1,008
Fresenius Kabi 102 89
Fresenius Helios 113 92
Fresenius Vamed 12 8
Total noncontrolling interest 9,597 8,059
For further financial information relating to Fresenius
Medical Care see the consolidated segment reporting on
pages 170 to 171.
Noncontrolling interest changed as follows:
€ in millions 2018
Noncontrolling interest as of December 31, 2017 8,059
Adjustment due to the initial application of IFRS 9 and IFRS 15 - 2
As of January 1, 2018, adjusted 8,057
Noncontrolling interest in profit 1,687
Purchase of noncontrolling interest 112
Stock options 38
Dividend payments - 488
Currency effects and other changes 191
Noncontrolling interest as of December 31, 2018 9,597
27. FRESENIUS SE & CO. KGAA SHAREHOLDERS’ EQUITY
SUBSCRIBED CAPITAL
Development of subscribed capitalAs of January 1, 2018, the subscribed capital of Fresenius SE &
Co. KGaA consisted of 554,710,473 bearer ordinary shares.
During the fiscal year 2018, 1,514,681 stock options
were exercised. Consequently, as of December 31, 2018, the
subscribed capital of Fresenius SE & Co. KGaA consisted of
556,225,154 bearer ordinary shares. The shares are issued as
non-par value shares. The proportionate amount of the sub-
scribed capital is € 1.00 per share.
AUTHORIZED CAPITAL
By resolution of the Annual General Meeting on May 18,
2018, the previous Authorized Capital I was revoked and a
new Authorized Capital I was created.
Accordingly, the general partner, Fresenius Management
SE, is authorized, with the approval of the Supervisory Board,
until May 17, 2023, to increase Fresenius SE & Co. KGaA’s
share capital (subscribed capital) by a total amount of up to
€ 125,000,000 through a single or multiple issues of new
bearer ordinary shares against cash contributions and / or
contributions in kind (Authorized Capital I).
The number of shares must increase in the same propor-
tion as the subscribed capital. A subscription right must be
granted to the shareholders in principle. In defined cases, the
general partner is authorized, with the consent of the Super-
visory Board, to decide on the exclusion of the shareholders’
subscription right (e. g. to eliminate fractional amounts). For
cash contributions, the authorization can only be exercised if
the issue price is not significantly below the stock exchange
price of the already listed shares at the time the issue price is
fixed with final effect by the general partner. Furthermore, in
case of a capital increase against cash contributions, the pro-
portionate amount of the shares issued with exclusion of
subscription rights may not exceed 10% of the subscribed
capital. An exclusion of subscription rights in the context of
the use of other authorizations concerning the issuance or the
sale of the shares of Fresenius SE & Co. KGaA or the issuance
of rights which authorize or bind to the subscription of shares
of Fresenius SE & Co. KGaA has to be taken into consideration
during the duration of the Authorized Capital until its utiliza-
tion. In the case of a subscription in kind, the subscription
right can be excluded only in order to acquire a company,
parts of a company or a participation in a company.
The authorizations granted concerning the exclusion of
subscription rights can be used by Fresenius Management SE
only to such extent that the proportional amount of the total
number of shares issued with exclusion of the subscription
rights does not exceed 10% of the subscribed capital. An
exclusion of subscription rights in the context of the use of
other authorizations concerning the issuance or the sale of
the shares of Fresenius SE & Co. KGaA or the issuance of rights
which authorize or bind to the subscription of shares of
Fresenius SE & Co. KGaA has to be taken into consideration dur-
ing the duration of the Authorized Capital until its utilization.

223
Fin
anci
al S
tate
men
ts
Consolidated Financial Statements Notes on the consolidated statement of financial position
The following table shows the development of the Conditional Capital:
in € Ordinary shares
Conditional Capital I Fresenius AG Stock Option Plan 2003 4,735,083
Conditional Capital II Fresenius SE Stock Option Plan 2008 5,141,264
Conditional Capital III option bearer bonds and / or convertible bonds 48,971,202
Conditional Capital IV Fresenius SE & Co. KGaA Stock Option Plan 2013 24,928,200
Total Conditional Capital as of January 1, 2018 83,775,749
Fresenius SE Stock Option Plan 2008 – options exercised - 844,450
Fresenius SE & Co. KGaA Stock Option Plan 2013 – options exercised - 670,231
Total Conditional Capital as of December 31, 2018 82,261,068
As of December 31, 2018, the Conditional Capital was composed as follows:
in € Ordinary shares
Conditional Capital I Fresenius AG Stock Option Plan 2003 4,735,083
Conditional Capital II Fresenius SE Stock Option Plan 2008 4,296,814
Conditional Capital III option bearer bonds and / or convertible bonds 48,971,202
Conditional Capital IV Fresenius SE & Co. KGaA Stock Option Plan 2013 24,257,969
Total Conditional Capital as of December 31, 2018 82,261,068
The changes to the Authorized Capital I became effective upon
registration with the commercial register on June 18, 2018.
CONDITIONAL CAPITAL
The following Conditional Capitals exist in order to fulfill the
subscription rights under the stock option plans of Fresenius
SE & Co. KGaA: Conditional Capital II (Stock Option Plan
2008) and Conditional Capital IV (Stock Option Plan 2013)
(see note 34, Share-based compensation plans).
The previous authorization to issue option bearer bonds
and / or convertible bonds (Conditional Capital III) dated
May 16, 2014 was revoked by resolution of the Annual General
Meeting of Fresenius SE & Co. KGaA on May 18, 2018. Simul-
taneously, a new Conditional Capital III with a five-year term
was approved.
Accordingly, the general partner is authorized, with the
approval of the Supervisory Board, until May 17, 2023, to
issue option bearer bonds and / or convertible bearer bonds,
once or several times, for a total nominal amount of up to
€ 2.5 billion. To fulfill the granted subscription rights, the
subscribed capital of Fresenius SE & Co. KGaA is increased
conditionally by up to € 48,971,202 through issuing of up to
48,971,202 new bearer ordinary shares. The conditional
capital increase shall only be implemented to the extent that
the holders of cash issued convertible bonds or of cash
issued warrants from option bonds exercise their conversion
or option rights and as long as no other forms of settlement
are used. The new bearer ordinary shares shall participate in
the profits from the start of the fiscal year in which they are
issued.
The new Conditional Capital III became effective upon
registration with the commercial register on June 18, 2018.
CAPITAL RESERVES
Capital reserves are comprised of the premium paid on the
issue of shares and the exercise of stock options (additional
paid-in capital).
OTHER RESERVES
Other reserves are comprised of earnings generated by
Group entities in prior years to the extent that they have not
been distributed.
DIVIDENDS
Under the German Stock Corporation Act (AktG), the
amount of dividends available for distribution to sharehold-
ers is based upon the unconsolidated retained earnings of
Fresenius SE & Co. KGaA as reported in its statement of
financial position determined in accordance with the Ger-
man Commercial Code (HGB).

Consolidated Financial Statements224
Financial S
tatements
In May 2018, a dividend of € 0.75 per bearer ordinary share
was approved by Fresenius SE & Co. KGaA’s shareholders at
the Annual General Meeting and paid afterwards. The total
dividend payment was € 416 million.
TREASURY STOCK OF FRESENIUS MEDICAL CARE
In 2018, Fresenius Medical Care repurchased 431,000 ordinary
shares for an amount of € 37 million.
28. OTHER COMPREHENSIVE INCOME (LOSS)Other comprehensive income (loss) is comprised of all amounts
recognized directly in equity (net of tax) resulting from the
currency translation of foreign subsidiaries’ financial state-
ments and the effects of measuring financial instruments at
their fair value as well as the change in benefit obligation.
Changes in the components of other comprehensive income (loss) in 2018 and 2017 were as follows:
€ in millionsAmount
before taxes Tax effectAmount
after taxes
Positions which will be reclassified into net income in subsequent years
Cash flow hedges 44 - 11 33
Change in unrealized gains / losses 6 - 1 5
Realized gains / losses due to reclassifications 38 - 10 28
Foreign currency translation - 1,965 26 - 1,939
Positions which will not be reclassified into net income in subsequent years
Actuarial gains / losses on defined benefit pension plans 43 - 35 8
Total changes 2017 - 1,878 - 20 - 1,898
Positions which will be reclassified into net income in subsequent years
Cash flow hedges 15 - 4 11
Change in unrealized gains / losses - 1 0 - 1
Realized gains / losses due to reclassifications 16 - 4 12
Foreign currency translation 268 - 8 260
Positions which will not be reclassified into net income in subsequent years
Change of fair value of equity investments 5 - 1 4
Actuarial gains / losses on defined benefit pension plans - 62 16 - 46
Total changes 2018 226 3 229

Consolidated Financial Statements Other notes 225
Fin
anci
al S
tate
men
ts
OTHER NOTES
29. COMMITMENTS AND CONTINGENCIES
OPERATING LEASES AND RENTAL PAYMENTS
Fresenius Group’s subsidiaries lease hospitals, office and
manufacturing buildings as well as machinery and equipment
under various lease agreements. Rental expense recorded
for operating leases for the years ended December 31, 2018
and 2017 was € 1,060 million and € 1,043 million, respectively.
Future minimum rental payments under non-cancellable
operating leases for the years subsequent to December 31,
2018 are:
for the fiscal years € in millions
2019 995
2020 925
2021 821
2022 710
2023 599
Thereafter 3,339
Total 7,389
As of December 31, 2018, future investment commitments
existed up to the year 2023 from the acquisition contracts for
hospitals at projected costs of up to € 255 million. Thereof
€ 113 million relate to the year 2019.
Besides the above mentioned contingent liabilities, the
current estimated amount of Fresenius Group’s other known
individual contingent liabilities is immaterial.
LEGAL AND REGULATORY MATTERS
The Fresenius Group is routinely involved in claims, lawsuits,
regulatory and tax audits, investigations and other legal
matters arising, for the most part, in the ordinary course of its
business of providing health care services and products.
Legal matters that the Fresenius Group currently deems to
be material or noteworthy are described below. For the mat-
ters described below in which the Fresenius Group believes a
loss is both reasonably possible and estimable, an estimate
of the loss or range of loss exposure is provided. For the other
matters described below, the Fresenius Group believes that
the loss probability is remote and / or the loss or range of pos-
sible losses cannot be reasonably estimated at this time. The
outcome of litigation and other legal matters is always diffi-
cult to predict accurately and outcomes that are not consis-
tent with Fresenius Group’s view of the merits can occur. The
Fresenius Group believes that it has valid defenses to the
legal matters pending against it and is defending itself vigor-
ously. Nevertheless, it is possible that the resolution of one
or more of the legal matters currently pending or threatened
could have a material adverse effect on its business, results
of operations and financial condition.
Termination of the merger agreement with Akorn, Inc.On April 24, 2017, Fresenius announced that Fresenius Kabi
has agreed to acquire Akorn, Inc. (Akorn), a U.S.-based man-
ufacturer and marketer of prescription and over-the-counter
pharmaceutical products, for approximately US$ 4.3 billion,
or US$ 34 per share, plus the prevailing net debt at closing of
the transaction.
Fresenius has been conducting an independent investiga-
tion, using external experts, into alleged breaches of FDA
data integrity requirements relating to product development
at Akorn.
Fresenius decided on April 22, 2018 to terminate the
merger agreement with Akorn, due to Akorn’s failure to ful-
fill several closing conditions.
Fresenius’ decision was based on, among other factors,
material breaches of FDA data integrity requirements relating
to Akorn’s operations found during Fresenius’ independent
Consolidated Financial Statements226
Financial S
tatements
reimbursement from government payors for serum ferritin
and multiple forms of hepatitis B laboratory tests that were
medically unnecessary or not properly ordered by a physi-
cian. Discovery on the relator’s complaint closed in May 2015.
Although the United States initially declined to intervene in
the case, the government subsequently changed position. On
April 3, 2017, the court allowed the government to intervene
with respect only to certain hepatitis B surface antigen tests
performed prior to 2011, when Medicare reimbursement
rules for such tests changed. The court has subsequently
rejected government requests to conduct new discovery and
to add counts to its complaint-in-intervention that would
expand upon the relator’s complaint, but has allowed FMCH
to take discovery against the government as if the govern-
ment had intervened at the outset.
Internal reviewBeginning in 2012, Fresenius Medical Care AG & Co. KGaA
(FMC-AG & Co. KGaA) received certain communications
alleging conduct in countries outside the United States that
might violate the Foreign Corrupt Practices Act or other
anti-bribery laws. FMC-AG & Co. KGaA’s Supervisory Board,
through its Audit and Corporate Governance Committee, con-
ducted investigations with the assistance of independent
counsel. In a continuing dialogue, FMC-AG & Co. KGaA volun-
tarily advised the Securities and Exchange Commission and
the United States Department of Justice (collectively and
interchangeably the government) about these investigations.
The government also conducted its own investigations, in
which FMC-AG & Co. KGaA cooperated.
In the course of this dialogue, FMC-AG & Co. KGaA identi-
fied and reported to the government, and took remedial
actions including employee disciplinary actions with respect to,
conduct that resulted in the government seeking monetary
penalties and other remedies against FMC-AG & Co. KGaA and
investigation. Fresenius offered to delay its decision in order
to allow Akorn additional opportunity to complete its own
investigation and present any information it wished Fresenius
to consider, but Akorn declined that offer.
Akorn disagreed with Fresenius’ position and filed a law-
suit on April 23, 2018 purporting to enforce the merger
agreement.
Fresenius filed a counterclaim on April 30, 2018. The trial
of the lawsuit took place in the Delaware Court of Chancery
from July 9 to 13 and on August 23, 2018.
On October 1, 2018, the Court of Chancery in the U.S. state
of Delaware ruled in favor of Fresenius in the lawsuit by
Akorn, Inc. against Fresenius for the consummation of the
April 2017 merger agreement.
Akorn appealed on October 18, 2018 against this ruling
to the Delaware Supreme Court. On December 7, 2018, the
Delaware Supreme Court, being the highest court and final
instance in Delaware, affirmed the ruling of the Court of
Chancery in favor of Fresenius. Fresenius intends to hold
Akorn liable for damages suffered as a result of lost acquisi-
tion expenses.
Fresenius Medical Care Holdings – Qui tam complaint (Massachusetts)On February 15, 2011, a whistleblower (relator) action under
the False Claims Act against Fresenius Medical Care Hold-
ings, Inc. (FMCH) was unsealed by order of the United States
District Court for the District of Massachusetts and served by
the relator. United States ex rel. Chris Drennen v. Fresenius
Medical Care Holdings, Inc., 2009 Civ. 10179 (D. Mass.).
The relator’s complaint, which was first filed under seal in
February 2009, alleged that FMCH sought and received

Consolidated Financial Statements Other notes 227
Fin
anci
al S
tate
men
ts
disgorgement of related profits revolving principally around
conduct in FMC-AG & Co. KGaA’s products business in a lim-
ited number of countries outside the United States.
FMC-AG & Co. KGaA recorded charges of € 200 million in
2017 and € 77 million in 2018 encompassing estimates for the
government’s claims for profit disgorgement, penalties, cer-
tain legal expenses, and other related costs or asset impair-
ments believed likely to be necessary for full and final resolu-
tion, by litigation or settlement, of the claims and issues
arising from the investigation. The increase recorded in 2018
took into consideration preliminary understandings with the
government on the financial terms of a potential settlement.
Following this increase, which takes into account incurred
and anticipated legal expenses, impairments and other costs,
the provision totals € 224 million as of December 31, 2018.
FMC-AG & Co. KGaA has reached an agreement in princi-
ple with the government agencies encompassing the terms
understood to be necessary for settlement. FMC-AG & Co. KGaA
believes that the previously-recorded charge appropriately
accounts for the consequences of the resolution as related to
its financial statements. The agreement in principle remains
subject to memorialization in fully integrated documents and
final approval by authorized officials of the government and
FMC-AG & Co. KGaA.
FMC-AG & Co. KGaA continues to implement enhance-
ments to its anti-corruption compliance program, including
internal controls related to compliance with international
anti-bribery laws. FMC-AG & Co. KGaA continues to be fully
committed to compliance with the Foreign Corrupt Practices
Act and other applicable anti-bribery laws.
Product liability litigationPersonal injury litigation involving Fresenius Medical Care
AG & Co. KGaA’s (FMC-AG & Co. KGaA) acid concentrate prod-
uct, labeled as GranuFlo ® or NaturaLyte ®, first arose in 2012
and was substantially resolved by settlement agreed in princi-
ple in February 2016 and consummated in November 2017,
as previously disclosed. Remaining individual personal injury
cases do not present material risk and discussion of them is
therefore discontinued.
FMC-AG & Co. KGaA’s affected insurers agreed to the settle-
ment of the acid concentrate personal injury litigation and
funded US$ 220 million of the settlement fund under a recip-
rocal reservation of rights encompassing certain coverage
issues raised by insurers and FMC-AG & Co. KGaA’s claims for
indemnification of defense costs. FMC-AG & Co. KGaA accrued
a net expense of US$ 60 million in connection with the set-
tlement, including legal fees and other anticipated costs.
Following entry into the settlement, FMC-AG & Co. KGaA’s
insurers in the AIG group and FMC-AG & Co. KGaA each initi-
ated litigation against the other relating to the AIG group’s
coverage obligations under applicable policies. In the coverage
litigation, the AIG group seeks to be indemnified by FMC-
AG & Co. KGaA for a portion of its US$ 220 million outlay; FMC-
AG & Co. KGaA seeks to confirm the AIG group’s US$ 220
million funding obligation, to recover defense costs already
incurred by FMC-AG & Co. KGaA, and to compel the AIG group
to honor defense and indemnification obligations, if any,
required for resolution of cases not participating in the settle-
ment. As a result of decisions on issues of venue, the cover-
age litigation is proceeding in the New York state trial court
for Manhattan. (National Union Fire Insurance v. Fresenius
Medical Care, 2016 Index No. 653108 (Supreme Court of New
York for New York County)).

Consolidated Financial Statements228
Financial S
tatements
Four institutional plaintiffs filed complaints against Fresenius
Medical Care Holdings, Inc. (FMCH) or its affiliates under state
deceptive practices statutes resting on certain background
allegations common to the GranuFlo ® / NaturaLyte ® personal
injury litigation, but seeking as remedy the repayment of
sums paid to FMCH attributable to the GranuFlo ® / NaturaLyte ®
products. These cases implicate different legal standards,
theories of liability and forms of potential recovery from those
in the personal injury litigation and their claims were not
extinguished by the personal injury litigation settlement
described above. The four plaintiffs are the Attorneys General
for the States of Kentucky, Louisiana and Mississippi and
the commercial insurance company Blue Cross Blue Shield of
Louisiana in its private capacity. State of Mississippi ex rel.
Hood, v. Fresenius Medical Care Holdings, Inc., No. 14-cv-152
(Chancery Court, DeSoto County); State of Louisiana ex re.
Caldwell and Louisiana Health Service & Indemnity Company
v. Fresenius Medical Care Airline, 2016 Civ. 11035 (U.S.D.C.
D. Mass.); Commonwealth of Kentucky ex rel. Beshear v.
Fresenius Medical Care Holdings, Inc. et al., No. 16-CI-00946
(Circuit Court, Franklin County).
On September 6, 2018, a special-purpose entity organized
under Delaware law for the purpose of pursuing litigation
filed a Pure Bill of Discovery in a Florida county court seek-
ing discovery from FMCH related to the personal injury set-
tlement, but no other relief. MSP Recovery Claims Series LLC
v. Fresenius Medical Care Holdings, No. 2018-030366-CA-01
(11th Judicial Circuit, Dade County, Florida). The Pure Bill was
thereafter removed to federal court and transferred into the
multidistrict Fresenius Granuflo ® / Naturalyte ® Dialysate Prod-
ucts Liability Litigation in Boston. No. 1:13-MD-02428-DPW
(D. Mass. 2013). On February 7, 2019, the Boston court
announced that it would not require FMCH to respond to the
Pure Bill but allowed plaintiffs to file a pleading satisfying
the requirements of a complaint under the Federal Rules of
Procedure. Plaintiffs advised the court that they would file a
complaint seeking monetary damages for specified payors in
the health care system.
The jury trial scheduled to begin in the Kentucky case
(Beshear) on January 22, 2019 was postponed. On February 12,
2019, an agreement in principle was reached to settle and
resolve the state claims in exchange for FMCH’s payment of
US$ 10.3 million.
FMC-AG & Co. KGaA has additionally increased its litigation
reserves to account for anticipated settlement of some, but
not all, of the remaining payor cases. However, at the present
time there are no agreements in principle for resolving the
remaining cases and litigation through final adjudication may
be required in all of them. The Mississippi case has been set
for trial on September 3, 2019. There is no trial date for the
Louisiana case.
Subpoena “Maryland”In August 2014, Fresenius Medical Care Holdings, Inc.
(FMCH) received a subpoena from the United States Attorney
for the District of Maryland inquiring into FMCH’s contractual
arrangements with hospitals and physicians, involving con-
tracts relating to the management of in-patient acute dialysis
services. FMCH is cooperating in the investigation.
Civil complaint “Hawaii”In July 2015, the Attorney General for Hawaii issued a civil
complaint under the Hawaii False Claims Act alleging a con-
spiracy pursuant to which certain Liberty Dialysis subsidi-
aries of Fresenius Medical Care Holdings, Inc. (FMCH) over-
billed Hawaii Medicaid for Liberty’s Epogen ® administrations
to Hawaii Medicaid patients during the period from 2006
through 2010, prior to the time of FMCH’s acquisition of

Consolidated Financial Statements Other notes 229
Fin
anci
al S
tate
men
ts
Liberty. Hawaii v. Liberty Dialysis – Hawaii, LLC et al., Case
No. 15-1-1357-07 (Hawaii 1st Circuit). The State alleges that
Liberty acted unlawfully by relying on incorrect and unautho-
rized billing guidance provided to Liberty by Xerox State
Healthcare, LLC, which acted as Hawaii’s contracted admin-
istrator for its Medicaid program reimbursement operations
during the relevant period. The amount of the overpayment
claimed by the State is approximately US$ 8 million, but the
State seeks civil remedies, interest, fines, and penalties
against Liberty and FMCH under the Hawaii False Claims Act
substantially in excess of the overpayment. After prevailing
on motions by Xerox to preclude it from doing so, FMCH is
pursuing third-party claims for contribution and indemnifica-
tion against Xerox. The State’s False Claims Act complaint
was filed after Liberty initiated an administrative action chal-
lenging the State’s recoupment of alleged overpayments
from sums currently owed to Liberty. The civil litigation and
administrative action are proceeding in parallel. Trial in the
civil litigation, which had been scheduled for April 2019, has
been postponed to allow the completion of discovery and
remains to be rescheduled.
Subpoenas “Colorado and New York”On August 31, 2015, Fresenius Medical Care Holdings, Inc.
(FMCH) received a subpoena under the False Claims Act
from the United States Attorney for the District of Colorado
(Denver) inquiring into FMCH’s participation in and manage-
ment of dialysis facility joint ventures in which physicians
are partners. Fresenius continues to cooperate in the Denver
United States Attorney’s Office (USAO) investigation, which
has come to focus on purchases and sales of minority inter-
ests in ongoing outpatient facilities between FMCH and
physician groups.
On November 25, 2015, FMCH received a subpoena under
the False Claims Act from the United States Attorney for the
Eastern District of New York (Brooklyn) also inquiring into
FMCH’s involvement in certain dialysis facility joint ventures
in New York.
On September 26, 2018, the Brooklyn USAO declined to inter-
vene on the qui tam complaint filed under seal in 2014 that
gave rise to this investigation. CKD Project LLC v. Fresenius
Medical Care, 2014 Civ. 6646 (E.D.N.Y. November 12, 2014).
The court unsealed the complaint, allowing the relator to
serve and proceed on its own. The relator, a special-purpose
entity formed by law firms to pursue qui tam proceedings,
has served its complaint and litigation is proceeding.
Subpoena “Fresenius Vascular Care”Beginning October 6, 2015, the United States Attorney for the
Eastern District of New York (Brooklyn) has led an investiga-
tion through subpoenas issued under the False Claims Act, uti-
lization and invoicing by Fresenius Medical Care AG & Co.
KGaA’s (FMC-AG & Co. KGaA) subsidiary Azura Vascular Care,
for a period beginning after FMC-AG & Co. KGaA’s acquisition
of American Access Care, LLC (AAC) in October 2011. FMC-
AG & Co. KGaA has cooperated in the Brooklyn United States
Attorney’s Office (USAO) investigation, which is continuing.
Allegations against AAC arising in districts in Connecticut,
Florida and Rhode Island relating to utilization and invoicing
were settled in 2015.
On October 22, 2018, the United States Attorney for the
Southern District of New York (Manhattan) announced a
False Claims Act settlement for up to US$ 18.4 million with
Vascular Access Centers LP, a competitor of AAC and Azura.
Simultaneously, the 2012 qui tam (whistleblower) com-
plaint that gave rise to the investigation was unsealed. Levine
v. Vascular Access Centers, 2012 Civ. 5103 (S.D.N.Y.). That
qui tam complaint names as defendants, among others in
the dialysis industry, subsidiaries and employees of FMC-
AG & Co. KGaA engaged in the vascular access business. The
Manhattan USAO did not intervene against non- settling

Consolidated Financial Statements230
Financial S
tatements
defendants, allowing the relator to proceed on his own against
those defendants. Defendants related to FMC-AG & Co. KGaA
have been served and the litigation is proceeding.
Subpoena “Texas (Dallas)”On June 30, 2016, Fresenius Medical Care Holdings, Inc.
(FMCH) received a subpoena from the United States Attorney
for the Northern District of Texas (Dallas) seeking information
under the False Claims Act about the use and management
of pharmaceuticals including Velphoro ®. The investigation
encompasses DaVita, Amgen, Sanofi, and other pharmaceuti-
cal manufacturers and includes inquiries into whether cer-
tain compensation transfers between manufacturers and
pharmacy vendors constituted unlawful kickbacks. FMC-AG &
Co. KGaA understands that this investigation is substantively
independent of the US$ 63.7 million settlement by DaVita Rx
announced on December 14, 2017 in the matter styled
United States ex rel. Gallian v. DaVita Rx, 2016 Civ. 0943
(N.D. Tex.). FMCH is cooperating in the investigation.
Subpoena “New York”On November 18, 2016, Fresenius Medical Care Holdings,
Inc. (FMCH) received a subpoena under the False Claims Act
from the United States Attorney for the Eastern District of
New York (Brooklyn) seeking documents and information relat-
ing to the operations of Shiel Medical Laboratory, Inc., which
FMCH acquired in October 2013. In the course of cooperating
in the investigation and preparing to respond to the sub-
poena, FMCH identified falsifications and misrepresentations
in documents submitted by a Shiel salesperson that relate
to the integrity of certain invoices submitted by Shiel for labo-
ratory testing for patients in long-term care facilities. On
February 21, 2017, FMCH terminated the employee and noti-
fied the United States Attorney of the termination and its cir-
cumstances. The terminated employee’s conduct is expected
to result in demands for Fresenius Medical Care AG & Co.
KGaA (FMC-AG & Co. KGaA) to refund overpayments and to
pay related penalties under applicable laws, but the monetary
value of such payment demands cannot yet be reasonably
estimated.
The Brooklyn United States Attorney’s Office continues to
investigate a range of issues involving Shiel, including allega-
tions of improper compensation (kickbacks) to physicians, and
has disclosed that multiple sealed qui tam complaints underlie
the investigation.
On December 12, 2017, FMC-AG & Co. KGaA sold to Quest
Diagnostics certain Shiel operations that are the subject of
this Brooklyn subpoena, including the misconduct reported
to the United States Attorney. Under the sale agreement,
FMC-AG & Co. KGaA retains responsibility for the Brooklyn
investigation and its outcome. FMC-AG & Co. KGaA continues
to cooperate in the ongoing investigation.
Subpoena “American Kidney Fund” / CMS LitigationOn December 14, 2016, the Center for Medicare & Medicaid
Services (CMS), which administers the federal Medicare pro-
gram, published an Interim Final Rule (IFR) titled “Medicare
Program; Conditions for Coverage for End-Stage Renal
Disease Facilities-Third Party Payment.” The IFR would have
amended the Conditions for Coverage for dialysis providers,
like Fresenius Medical Care Holdings, Inc. (FMCH) and would
have effectively enabled insurers to reject premium payments
made by or on behalf of patients who received grants for
individual market coverage from the American Kidney Fund
(AKF or the Fund). The IFR could thus have resulted in those

Consolidated Financial Statements Other notes 231
Fin
anci
al S
tate
men
ts
patients losing individual insurance market coverage. The
loss of coverage for these patients would have had a material
and adverse impact on the operating results of FMCH.
On January 25, 2017, a federal district court in Texas
responsible for litigation initiated by a patient advocacy group
and dialysis providers including FMCH preliminarily enjoined
CMS from implementing the IFR. Dialysis Patient Citizens v.
Burwell, 2017 Civ. 0016 (E.D. Texas, Sherman Div.). The pre-
liminary injunction was based on CMS’ failure to follow
appropriate notice-and-comment procedures in adopting the
IFR. The injunction remains in place and the court retains
jurisdiction over the dispute.
On June 22, 2017, CMS requested a stay of proceedings
in the litigation pending further rulemaking concerning the
IFR. CMS stated, in support of its request, that it expects to
publish a Notice of Proposed Rulemaking in the Federal
Register and otherwise pursue a notice-and-comment process.
Plaintiffs in the litigation, including FMCH, consented to the
stay, which was granted by the court on June 27, 2017.
On January 3, 2017, Fresenius Medical Care AG & Co. KGaA
(FMC-AG & Co. KGaA) received a subpoena from the United
States Attorney for the District of Massachusetts under the
False Claims Act inquiring into FMC-AG & Co. KGaA’s interac-
tions and relationships with the AKF, including FMC-AG & Co.
KGaA’s charitable contributions to the Fund and the Fund’s
financial assistance to patients for insurance premiums. FMCH
is cooperating in the investigation, which is part of a broader
investigation into charitable contributions in the medical
industry. FMC-AG & Co. KGaA believes that the investigation
revolves around conduct alleged to be unlawful in United
Healthcare v. American Renal Associates, 2018 Civ. 10622
(D. Mass.), but believes that such unlawful conduct was not
undertaken by FMCH. On July 2, 2018, American Renal Asso-
ciates announced that it had reached a settlement in princi-
ple of the United Healthcare litigation. FMC-AG & Co. KGaA
lacks information necessary to assess how the American Renal
Associates settlement may impact the United States Attor-
ney’s investigation.
In early May 2017, the United States Attorney for the
Middle District of Tennessee (Nashville) issued identical sub-
poenas to FMCH and two subsidiaries under the False Claims
Act concerning FMC-AG & Co. KGaA’s retail pharmaceutical
business. The investigation is exploring allegations related
to improper inducements to dialysis patients to fill oral pre-
scriptions through FMCH’s pharmacy service, improper bill-
ing for returned pharmacy products and other allegations
similar to those underlying the US$ 63.7 million settlement by
DaVita Rx in Texas announced on December 14, 2017. United
States ex rel. Gallian, 2016 Civ. 0943 (N.D. Tex.). FMCH is
cooperating in the investigation.
Subpoena "Colorado (Denver)"On December 17, 2018, Fresenius Medical Care Holdings, Inc.
(FMCH) was served with a subpoena under the False Claims
Act from the United States Attorney for the District of Colorado
(Denver) as part of an investigation of allegations against
DaVita, Inc. involving transactions between FMCH and DaVita.
The subject transactions include sales and purchases of dialy-
sis facilities, dialysis-related products and pharmaceuticals,
including dialysis machines and dialyzers, and contracts for
certain administrative services. FMCH is cooperating in the
investigation.

Consolidated Financial Statements232
Financial S
tatements
Vifor patent infringement Fresenius Medical Care (Delaware)On March 12, 2018, Vifor Fresenius Medical Care Renal
Pharma Ltd. and Vifor Fresenius Medical Care Renal Pharma
France S.A.S. (collectively VFMCRP) (the joint venture between
Galenica (Vifor) and Fresenius Medical Care AG & Co. KGaA),
filed a complaint for patent infringement against Lupin Atlan-
tis Holdings SA and Lupin Pharmaceuticals, Inc. (collectively
Lupin), and Teva Pharmaceuticals USA, Inc. (Teva) in the
U.S. District Court for the District of Delaware (Case 1:18-cv-
00390-LPS). The patent infringement action is in response
to Lupin and Teva’s filings of Abbreviated New Drug Applica-
tions (ANDA) with the FDA for generic versions of Velphoro ®.
Velphoro ® is protected by patents listed in the FDA’s Approved
Drug Products with Therapeutic Equivalence Evaluations,
also known as the Orange Book. The complaint was filed
within the 45-day period provided for under the Hatch-Wax-
man legislation, and triggered a stay of FDA approval of the
ANDAs for 30 months (2.5 years) (specifically, up to July 29,
2020 for Lupin’s ANDA; and August 6, 2020 for Teva’s ANDA),
or a shorter time if a decision in the infringement suit is
reached that the patents-at-issue are invalid or not infringed.
Recently, in response to another ANDA being filed for a generic
Velphoro ®, VFMCRP filed a complaint for patent infringe-
ment against Annora Pharma Private Ltd., and Hetero Labs
Ltd. (collectively Annora), in the U.S. District Court for the
District of Delaware on December 17, 2018. A 30-month stay
of FDA approval of Annora’s ANDA will run through to
May 30, 2021.
Subpoena “Nevada”In November 2014, Fresenius Kabi Oncology Limited (FKOL)
received a subpoena from the U.S. Department of Justice
(DOJ), U.S. Attorney for the District of Nevada. The subpoena
requests documents in connection with the January 2013
inspection by the U.S. Food and Drug Administration (FDA) of
FKOL’s plant for active pharmaceutical ingredients in Kalyani,
India. That inspection resulted in a warning letter from the FDA
in July 2013. The subpoena marks the DOJ’s criminal and / or
civil investigation in this connection and seeks information
from throughout the Fresenius Kabi group. Through an
ancillary subpoena of January 2016, the DOJ has requested
additional historic information and data. Through further
ancillary subpoenas of June 2016 and November 2016, the
DOJ has requested further information from Fresenius Kabi
USA and Fresenius Kabi AG without changing the focus of
the investigation. Fresenius Kabi fully cooperates with the
governmental investigation. Fresenius Kabi has entered into a
Tolling Agreement with the DOJ, thereby waiving its statute
of limitation defense until July 2018. The Tolling Agreement
was again extended by mutual agreement until July 2019.
From time to time, the Fresenius Group is a party to or may
be threatened with other litigation or arbitration, claims or
assessments arising in the ordinary course of its business.
Management regularly analyzes current information including,
as applicable, the Fresenius Group’s defenses and insurance
coverage and, as necessary, provides accruals for probable lia-
bilities for the eventual disposition of these matters.
The Fresenius Group, like other health care providers,
insurance plans and suppliers, conducts its operations under
intense government regulation and scrutiny. It must comply
with regulations which relate to or govern the safety and effi-
cacy of medical products and supplies, the marketing and
distribution of such products, the operation of manufacturing

Consolidated Financial Statements Other notes 233
Fin
anci
al S
tate
men
ts
facilities, laboratories, dialysis clinics and other health care
facilities, and environmental and occupational health and
safety. With respect to its development, manufacture, market-
ing and distribution of medical products, if such compliance
is not maintained, the Fresenius Group could be subject to
significant adverse regulatory actions by the U.S. Food and
Drug Administration (FDA) and comparable regulatory author-
ities outside the United States. These regulatory actions could
include warning letters or other enforcement notices from
the FDA, and / or comparable foreign regulatory authorities
which may require the Fresenius Group to expend significant
time and resources in order to implement appropriate correc-
tive actions. If the Fresenius Group does not address matters
raised in warning letters or other enforcement notices to the
satisfaction of the FDA and / or comparable regulatory author-
ities outside the United States, these regulatory authorities
could take additional actions, including product recalls, injunc-
tions against the distribution of products or operation of
manufacturing plants, civil penalties, seizures of the Fresenius
Group’s products and / or criminal prosecution. Fresenius
Medical Care Holdings, Inc. is currently engaged in remedia-
tion efforts with respect to one pending FDA warning letter,
Fresenius Kabi with respect to three pending FDA warning
letters. The Fresenius Group must also comply with the laws
of the United States, including the federal Anti-Kickback Stat-
ute, the federal False Claims Act, the federal Stark Law, the
federal Civil Monetary Penalties Law and the federal Foreign
Corrupt Practices Act as well as other federal and state
fraud and abuse laws. Applicable laws or regulations may be
amended, or enforcement agencies or courts may make
interpretations that differ from the Fresenius Group’s inter-
pretations or the manner in which it conducts its business.
Enforcement has become a high priority for the federal
government and some states. In addition, the provisions of
the False Claims Act authorizing payment of a portion of any
recovery to the party bringing the suit encourage private
plaintiffs to commence whistleblower actions. By virtue of
this regulatory environment, the Fresenius Group’s business
activities and practices are subject to extensive review by
regulatory authorities and private parties, and continuing
audits, subpoenas, other inquiries, claims and litigation relat-
ing to the Fresenius Group’s compliance with applicable
laws and regulations. The Fresenius Group may not always
be aware that an inquiry or action has begun, particularly
in the case of whistleblower actions, which are initially filed
under court seal.
The Fresenius Group operates many facilities and han-
dles the personal data (PD) of its patients and ben e ficiaries
throughout the United States and other parts of the world,
and engages with other business associates to help it carry
out its health care activities. In such a decentralized system,
it is often difficult to maintain the desired level of oversight
and control over the thousands of individuals employed by
many affiliated companies and its business associates. On
occasion, the Fresenius Group or its business associates may
experience a breach under the Health Insurance Portability
and Accountability Act Privacy Rule and Security Rules, the
EU’s General Data Protection Regulation and / or other similar
laws (Data Protection Laws) when there has been impermis-
sible use, access, or disclosure of unsecured PD or when the
Fresenius Group or its business associates neglect to imple-
ment the required administrative, technical and physical
safeguards of its electronic systems and devices, or a data
breach that results in impermissible use, access or disclosure
of personal identifying information of its employees, patients
and beneficiaries. On those occasions, the Fresenius Group
must comply with applicable breach notification requirements.
Consolidated Financial Statements234
Financial S
tatements
The Fresenius Group relies upon its management structure,
regulatory and legal resources, and the effective operation of
its compliance program to direct, manage and monitor the
activities of its employees. On occasion, the Fresenius Group
may identify instances where employees or other agents delib-
erately, recklessly or inadvertently contravene the Fresenius
Group’s policies or violate applicable law. The actions of such
persons may subject the Fresenius Group and its subsidiaries
to liability under the Anti-Kickback Statute, the Stark Law,
the False Claims Act, Data Protection Laws, the Health Infor-
mation Technology for Economic and Clinical Health Act and
the Foreign Corrupt Practices Act, among other laws and com-
parable state laws or laws of other countries.
Physicians, hospitals and other participants in the health
care industry are also subject to a large number of lawsuits
alleging professional negligence, malpractice, product lia-
bility, worker’s compensation or related claims, many of
which involve large claims and significant defense costs. The
Fresenius Group has been and is currently subject to these
suits due to the nature of its business and expects that those
types of lawsuits may continue. Although the Fresenius
Group maintains insurance at a level which it believes to be
prudent, it cannot assure that the coverage limits will be
adequate or that insurance will cover all asserted claims.
A successful claim against the Fresenius Group or any of its
subsidiaries in excess of insurance coverage could have a
material adverse effect upon it and the results of its operations.
Any claims, regardless of their merit or eventual outcome,
could have a material adverse effect on the Fresenius Group’s
reputation and business.
The Fresenius Group has also had claims asserted against
it and has had lawsuits filed against it relating to alleged patent
infringements or businesses that it has acquired or divested.
These claims and suits relate both to operation of the busi-
nesses and to the acquisition and divestiture transactions.
The Fresenius Group has, when appropriate, asserted its own
claims, and claims for indemnification. A successful claim
against the Fresenius Group or any of its subsidiaries could
have a material adverse effect upon its business, financial
condition, and the results of its operations. Any claims, regard-
less of their merit or eventual outcome, could have a material
adverse effect on the Fresenius Group’s reputation and
business.

Consolidated Financial Statements Other notes 235
Fin
anci
al S
tate
men
ts
30. FINANCIAL INSTRUMENTS
VALUATION OF FINANCIAL INSTRUMENTS
Carrying amounts of financial instruments as of the initial application of IFRS 9The impact on the measurement categories and the mea-
surement of financial assets and liabilities according to
IFRS 9 has not been significant. The original measurement
categories under IAS 39 as of December 31, 2017 and the
new measurement categories according to IFRS 9 upon
implementation on January 1, 2018 as well as their respec-
tive carrying amounts were as follows:
Dec. 31, 2017 Jan. 1, 2018
€ in millions Category according to IAS 39 Category according to IFRS 9
Carrying amount according to
IAS 39
Carrying amount according to
IFRS 9
Financial assets
Cash and cash equivalentsRelating to no category Amortized cost 1,152 1,152
Relating to no category Fair value through profit and loss 484 484 3
Trade accounts and other receivables, less allowance for doubtful accounts
Loans and receivables Amortized cost 6,157 6,115 1
Loans and receivablesFair value through other comprehensive income 45 45 2
Relating to no category Relating to no category 58 58
Receivables from and loans to related parties Loans and receivables Amortized cost 17 17
Other financial assets
Debt instruments Available for sale financial assetsFair value through other comprehensive income 3 3 2
Equity investmentsAvailable for sale financial assets
Fair value through other comprehensive income 16 16 2, 4
Loans and receivablesFair value through other comprehensive income 54 85 1, 2, 4
Loans and receivables Fair value through profit and loss 18 18 2
Derivatives designated as cash flow hedging instruments Relating to no category Relating to no category 14 14
Derivatives not designated as hedging instruments
Financial assets measured at fair value though profit and loss Fair value through profit and loss 321 321
Leasing receivables Relating to no category Relating to no category 79 79
All other financial assets Loans and receivables Amortized cost 622 620 1
Financial assets 9,040 9,027
1 Changes in the carrying amounts from remeasurements of - € 13 million are included in the items of the consolidated statement of financial position as follows: - € 42 million trade accounts and other receivables, € 31 million equity investments, - € 2 million all other financial assets.
2 Reclassification3 The option to measure debt instruments at fair value through profit and loss was not used.4 The option to measure equity instruments at fair value through other comprehensive income upon implementation of IFRS 9 has been exercised.
The option has been used for € 101 million (included in other financial assets).

Consolidated Financial Statements236
Financial S
tatements
Dec. 31, 2017 Jan. 1, 2018
€ in millions Category according to IAS 39 Category according to IFRS 9
Carrying amount according to
IAS 39
Carrying amount according to
IFRS 9
Financial liabilities
Trade accounts payableFinancial liabilities measured at amortized cost Amortized cost 1,688 1,688
Short-term accounts payable to related parties
Financial liabilities measured at amortized cost Amortized cost 42 42
Short-term debtFinancial liabilities measured at amortized cost Amortized cost 1,550 1,550
Short-term debt from related partiesFinancial liabilities measured at amortized cost Amortized cost – –
Long-term debt and capital lease obligations
Financial liabilities measured at amortized cost Amortized cost 6,871 6,871
Relating to no category Relating to no category 234 234
BondsFinancial liabilities measured at amortized cost Amortized cost 9,069 9,069
Convertible bondsFinancial liabilities measured at amortized cost Amortized cost 1,318 1,318
Other financial liabilities
Noncontrolling interest subject to put provisions Relating to no category Relating to no category 854 854
Derivatives in cash flow hedging relationships Relating to no category Relating to no category 9 9
Derivatives not designated as hedging instruments
Liabilities measured at fair value through profit and loss Fair value through profit and loss 325 325
Accrued contingent payments outstanding for acquisitions
Liabilities measured at fair value through profit and loss Fair value through profit and loss 793 793
All other financial liabilitiesFinancial liabilities measured at amortized cost Amortized cost 2,965 2,965
Financial liabilities 25,718 25,718
As of January 1, 2018, the adjustments due to the initial application of IFRS 9 on the components of shareholders’ equity
were as follows:
€ in millions Other reservesNoncontrolling
interest Total
Remeasurement of equity investments due to reclassification 24 7 31
Remeasurement of the allowance for bad debt for trade accounts and other receivables and other financial assets - 39 - 5 - 44
Deferred tax on adjustments - 4 - 2 - 6
Total - 19 – - 19

Consolidated Financial Statements Other notes 237
Fin
anci
al S
tate
men
ts
Carrying amounts of financial instruments as of December 31, 2018As of December 31, 2018, the carrying amounts of financial instruments by item of the statement of financial position and
structured according to IFRS 9 categories were as follows:
Relating to no category
€ in millions Carrying amount Amortized cost
Fair value through profit
and loss 1
Fair value through other
comprehensive income 2
Derivatives designated as
cash flow hedg-ing instruments
at fair value
Noncontrolling interest subject
to put provi-sions measured
at fair value
Valuation according to
IAS 17 for leas-ing receivables
and liabilities
Financial assets
Cash and cash equivalents 2,709 1,291 1,418
Trade accounts and other receivables, less allowance for doubtful accounts 6,540 6,445 4 41 50Accounts receivable from and loans to related parties 29 29
Other financial assets 3 1,490 726 262 375 19 108
Financial assets 10,768 8,491 1,684 416 19 0 158
Financial liabilities
Trade accounts payable 1,823 1,823
Short-term accounts payable to related parties 67 67
Short-term debt 2,354 2,354
Short-term debt from related parties – –
Long-term debt and capital lease obligations 6,297 6,078 219
Bonds 8,990 8,990
Convertible bonds 1,343 1,343
Other financial liabilities 4 4,685 3,041 793 12 839
Financial liabilities 25,559 23,696 793 0 12 839 219
1 All included financial assets and liabilities are mandatorily measured at fair value through profit and loss according to IFRS 9.2 The option to measure equity instruments at fair value through other comprehensive income upon implementation of IFRS 9 has been exercised.
The option has been used for € 124 million (included in other financial assets).3 Other financial assets are included in the item other current and non-current assets in the consolidated statement of financial position.4 Other financial liabilities are included in the items short-term provisions and other short-term liabilities and long-term provisions and other long-term liabilities in the
consolidated statement of financial position.
During the fiscal year 2018, no material reclassifications of financial instruments were required.

Consolidated Financial Statements238
Financial S
tatements
Fair value of financial instrumentsThe following table shows the carrying amounts and the fair value hierarchy levels according to IFRS 13 as of December 31,
2018 and as of January 1, 2018:
December 31, 2018 January 1, 2018
Fair value Fair value
€ in millionsCarrying amount Level 1 Level 2 Level 3
Carrying amount Level 1 Level 2 Level 3
Financial assets
Cash and cash equivalents 1 1,418 1,418 484 484
Trade accounts and other receivables, less allowance for doubtful accounts 1 45 45 45 45
Other financial assets 1
Debt instruments 334 330 4 3 3
Equity investments 245 14 231 119 16 103
Derivatives designated as cash flow hedging instruments 19 19 14 14
Derivatives not designated as hedging instruments 58 58 321 321
Financial liabilities
Long-term debt and capital lease obligations 6,297 6,294 7,105 7,154
Bonds 8,990 9,245 9,069 9,707
Convertible bonds 1,343 1,416 1,318 1,716
Other financial liabilities 1
Noncontrolling interest subject to put provisions 839 839 854 854
Accrued contingent payments outstanding for acquisitions 731 731 793 793
Derivatives designated as cash flow hedging instruments 12 12 9 9
Derivatives not designated as hedging instruments 62 62 325 325
1 Fair value information is not provided for financial instruments, if the carrying amount is a reasonable estimate of the fair value due to the relatively short period of maturity of these instruments.

Consolidated Financial Statements Other notes 239
Fin
anci
al S
tate
men
ts
The significant methods and assumptions used to estimate
the fair values of financial instruments as well as classification
of fair value measurements according to the three-tier fair
value hierarchy are as follows:
Cash and cash equivalents include short-term financial
investments that are measured at fair value through profit
and loss. The fair value of these assets, which are quoted in
an active market is based on price quotations at the date of
the consolidated financial statements (Level 1).
Trade accounts receivable from factoring contracts are
measured on the basis of observable market information
(Level 2).
The majority of debt instruments included in other finan-
cial assets are bonds that are quoted in an active market
and therefore measured at fair value (Level 1) which is based
on price quotations at the date of the consolidated financial
statements. Further debt instruments give rise to cash flows
on specified dates (Level 2).
The fair values of equity investments are based on observ-
able market information (Level 2). The fair values of other
equity investments that are traded in an active market, are
based on price quotations at the date of the consolidated
financial statements (Level 1).
The fair values of major long-term financial instruments are
calculated on the basis of market information. Financial
instruments for which market quotes are available are mea-
sured with the market quotes at the reporting date (Level 1).
The fair values of the other long-term financial liabilities are
calculated at the present value of respective future cash flows.
To determine these present values, the prevailing interest
rates and credit spreads for the Fresenius Group as of the date
of the statement of financial position are used (Level 2).
The valuation of the noncontrolling interest subject to put
provisions is determined using significant unobservable
inputs (Level 3). The method for calculating the fair value is
described in note 1. III. q, Financial instruments. 97.6% of
noncontrolling interest subject to put provisions applied to
Fresenius Medical Care at December 31, 2018.
Contingent payments outstanding for acquisitions are
recognized at their fair value. The estimation of the individual
fair values is based on the key inputs of the arrangement
that determine the future contingent payment as well as the
Fresenius Group’s expectation of these factors (Level 3).
The Fresenius Group assesses the likelihood and timing of
achieving the relevant objectives. The underlying assump-
tions are reviewed regularly.
The following table shows the changes of the fair values
of financial instruments classified as Level 3 in the fiscal
year 2018:
€ in millions
Accrued contingent payments outstand-ing for acquisitions
Noncontrolling interest subject to
put provisions
As of January 1, 2018 793 854
Additions 35 54
Disposals - 81 - 51
Gain / loss recognized in profit or loss - 27 142
Gain / loss recognized in equity 12 - 50
Dividend payments 0 - 140
Currency effects and other changes - 1 30
As of December 31, 2018 731 839
Derivatives, mainly consisting of interest rate swaps and
foreign exchange forward contracts, are valued as follows:
The fair value of interest rate swaps is calculated by discount-
ing the future cash flows on the basis of the market interest
rates applicable for the remaining term of the contract as of
the date of the statement of financial position. To determine
the fair value of foreign exchange forward contracts, the con-
tracted forward rate is compared to the current forward rate
for the remaining term of the contract as of the date of the
statement of financial position. The result is then discounted
on the basis of the market interest rates prevailing at the
date of the statement of financial position for the respective
currency.

Consolidated Financial Statements240
Financial S
tatements
Fresenius Group’s own credit risk is incorporated in the fair
value estimation of derivatives that are liabilities. Counter-
party credit risk adjustments are factored into the valuation
of derivatives that are assets. The Fresenius Group monitors
and analyses the credit risk from derivative financial instru-
ments on a regular basis. For the valuation of derivative finan-
cial instruments, the credit risk is considered in the fair
value of every individual instrument. The basis for the default
probability are Credit Default Swap Spreads of each counter-
party appropriate for the duration. The calculation of the
credit risk considered in the valuation is done by multiplying
the default probability appropriate for the duration with the
expected discounted cash flows of the derivative financial
instrument.
Derivatives not designated as hedging instruments comprise
derivatives embedded in convertible bonds and call options
which have been purchased to hedge the convertible bonds.
The fair value of the embedded derivatives is calculated using
the difference between the market value of the particular
convertible bonds and the market value of an adequate straight
bond discounted with the market interest rates as of the
reporting date. The fair value of the call options is based on
price quotations.
The calculation of the fair value of derivative financial
instruments is based on other observable inputs. Therefore,
these are classified as Level 2 in accordance with the defined
fair value hierarchy levels.
Derivative financial instruments are marked to market
each reporting period, resulting in carrying amounts equal
to fair values at the reporting date.
FAIR VALUES OF DERIVATIVE FINANCIAL INSTRUMENTS
December 31, 2018 December 31, 2017
€ in millions Assets Liabilities Assets Liabilities
Interest rate contracts (current) 0 – 0 0
Interest rate contracts (non-current) 5 0 5 1
Foreign exchange contracts (current) 14 12 9 8
Foreign exchange contracts (non-current) – 0 – –
Derivatives in cash flow hedging relationships 19 12 14 9
Interest rate contracts (current) 0 0 0 –
Interest rate contracts (non-current) 0 – 0 –
Foreign exchange contracts (current) 7 11 13 17
Foreign exchange contracts (non-current) – – – 0
Derivatives embedded in the convertible bonds 0 51 0 308
Call options to secure the convertible bonds 51 0 308 0
Derivatives not designated as hedging instruments 58 62 321 325
Derivatives not designated as hedging instruments, which
are derivatives that do not qualify for hedge accounting, are
also solely entered into to hedge economic business transac-
tions and not for speculative purposes.
The current portion of derivatives indicated as assets in
the preceding table is recognized within other current assets
in the consolidated statement of financial position, while the
current portion of those indicated as liabilities is included in
short-term provisions and other short-term liabilities. The non-
current portions indicated as assets or liabilities are recog-
nized in other non-current assets or in long-term provisions
and other long-term liabilities, respectively. The derivatives
embedded in the convertible bonds and the call options to
secure the convertible bonds are recognized in other cur-
rent and non-current liabilities / assets in the consolidated
statement of financial position.

Consolidated Financial Statements Other notes 241
Fin
anci
al S
tate
men
ts
To reduce the credit risk arising from derivatives, the
Fresenius Group concluded master netting agreements with
banks. Through such agreements, positive and negative fair
values of the derivative contracts could be offset against one
another if a partner becomes insolvent. This offsetting is
valid for transactions where the aggregate amount of obliga-
tions owed to and receivable from are not equal. If insol vency
occurs, the party which owes the larger amount is obliged
to pay the other party the difference between the amounts
owed in the form of one net payment.
These master netting agreements do not provide a basis
for offsetting the fair values of derivative financial instru-
ments in the consolidated statement of financial position as
the offsetting criteria under International Financial Reporting
Standards are not satisfied.
At December 31, 2018 and December 31, 2017, the
Fresenius Group had € 25 million and € 27 million of deriva-
tive financial assets subject to netting arrangements and
€ 22 million and € 25 million of derivative financial liabilities
subject to netting arrangements. Offsetting these derivative
financial instruments would have resulted in net assets of € 15
million and € 17 million as well as net liabilities of € 12 mil-
lion and € 15 million at December 31, 2018 and December 31,
2017, respectively.
The following table shows when the cash flow from deriv-
ative financial instruments is expected to occur.
CASH FLOW FROM DERIVATIVE FINANCIAL INSTRUMENTS
expected in period of
€ in millions 1 year 1 to 3 years 3 to 5 years over 5 years
Interest rate contracts 2 3 0 0
Foreign exchange contracts 3 – 0 0
Derivatives in cash flow hedging relationships 5 3 0 0
Interest rate contracts – – – 0
Foreign exchange contracts - 5 – 0 0
Derivatives not designated as hedging instruments - 5 – – 0
Effects of financial instruments recorded in the consolidated statement of incomeThe net gains and losses from financial instruments consisted
of allowances for doubtful accounts and other receivables
in an amount of € 33 million and foreign currency transactions
of - € 23 million. Interest income of € 355 million resulted
mainly from the valuation of the derivatives embedded in the
convertible bonds of Fresenius SE & Co. KGaA and of
Fresenius Medical Care AG & Co. KGaA, trade accounts and
other receivables and loans to related parties. Interest
expense of € 942 million resulted mainly from financial liabili-
ties, which are not recognized at fair value in the consoli-
dated statement of income.

Consolidated Financial Statements242
Financial S
tatements
Income and expense from financial instruments recorded in
other comprehensive income (loss) related solely to deriva-
tives in cash flow hedging relationships. The changes of cash
flow hedges on the consolidated statement of comprehensive
income (loss) before tax for the years 2018 and 2017 are as
follows:
EFFECT OF DERIVATIVES ON THE CUMULATED OTHER COMPREHENSIVE INCOME (LOSS)
2018
Cash Flow Hedge Reserve Costs of Hedging Reserve
€ in millions
Changes of the unrealized gains / losses in other comprehensive
income (loss)
Reclassifications from other comprehensive
income (loss) 1
Changes of the unrealized gains / losses in other comprehensive
income (loss)
Reclassifications from other comprehensive
income (loss) 1
Affected line item in the consolidated statement of
income / consolidated statement of financial position
Interest rate contracts – 23 Interest income / expense
Foreign exchange contracts 6 - 9 - 7 2
thereof – – Sales
- 8 2 Cost of sales
- 1 –General and administrative
expenses
– –Other operating income /
expenses
0 – Interest income / expense
– – Inventories
Derivatives in cash flow hedging relationships 6 14 - 7 2
1 In the consolidated statement of income, no gains or losses from ineffectiveness and only immaterial gains / losses from a hedged underlying transaction, that is no longer expected to occur, are recognized. Gains are shown with a negative sign and losses with a positive sign.
2017
€ in millions
Gain or loss recognized in other comprehensive
income (loss) (effective portion)
Gain or loss reclassified from accumulated other comprehensive income
(loss) (effective portion) 2
Affected line item in the consolidated statement
of income
Interest rate contracts – 36 Interest income / expense
Foreign exchange contracts 6 2
thereof 1 Cost of sales
1Selling expenses, general and
administrative expenses
Derivatives in cash flow hedging relationships 1 6 38
1 In the consolidated statement of income, no gains or losses from ineffectiveness or from a hedged underlying transaction, that is no longer expected to occur, are recognized.2 Gains are shown with a negative sign, losses with a positive sign.
In accordance with IFRS 9, both the fair value of the spot ele-
ment and the forward points are recorded within other com-
prehensive income (loss). According to IAS 39, the fair value
of the spot element and the forward points were recorded
together in other comprehensive income (loss). This results
in the different schematic presentations above.
The effective portion of changes in fair value of the spot
element of the hedging instruments is accumulated in a cash
flow hedge reserve as a separate component within other
comprehensive income (loss). The forward points of the for-
eign exchange forward contract is separately accounted for
as cost of hedging reserve within other comprehensive
income (loss).

Consolidated Financial Statements Other notes 243
Fin
anci
al S
tate
men
ts
associated with forecast purchases of non-financial assets,
the amounts accumulated in the cash flow hedge reserve are
instead included directly in the initial cost of the asset when
it is recognized. The same approach applies to the amounts
accumulated in the costs of hedging reserve.
For all cash flow hedges, except for foreign currency risk
associated with forecast purchases of non-financial assets, the
amounts accumulated in the cash flow hedge reserve are
reclassified to profit or loss as a reclassification adjustment in
the same period as the hedged forecasted cash flows affect
profit or loss. For cash flow hedges of foreign currency risk
EFFECT OF DERIVATIVES ON THE CONSOLIDATED STATEMENT OF INCOME
Gain or loss recognized in the consolidated statement of income
€ in millions 2018 2017Affected line item in the
consolidated statement of income
Interest rate contracts – – Interest income / expense
Foreign exchange contracts 41 - 21Other operating income /
expense
Foreign exchange contracts – - 6 Interest income / expense
Derivatives embedded in the convertible bonds 257 116 Interest income / expense
Call options to secure the convertible bonds - 257 - 116 Interest income / expense
Derivatives not designated as hedging instruments 41 - 27
Losses from foreign exchange contracts not designated as
hedging instruments recognized in the consolidated statement
of income are faced by gains from the under lying transac-
tions in the corresponding amount.
MARKET RISK
The Fresenius Group is exposed to effects related to foreign
exchange fluctuations in connection with its international
business activities that are denominated in various currencies.
In order to finance its business operations, the Fresenius
Group issues bonds and commercial papers and enters into
mainly long-term credit agreements and Schuldschein Loans
with banks. Due to these financing activities, the Fresenius
Group is exposed to interest risk caused by changes in vari-
able interest rates and the risk of changes in the fair value
of statement of financial position items bearing fixed interest
rates.
In order to manage the risk of interest rate and foreign
exchange rate fluctuations, the Fresenius Group enters into
certain hedging transactions with highly rated financial institu-
tions as authorized by the Management Board. Derivative
financial instruments are not entered into for trading purposes.
The Fresenius Group makes sure that hedge accounting rela-
tionships are aligned with its Group risk management objec-
tives and strategy and that a qualitative and forward-looking
approach is used for assessing hedge effectiveness.
In general, the Fresenius Group conducts its derivative
financial instrument activities under the control of a single cen-
tralized department. The Fresenius Group has established
guidelines derived from best practice standards in the bank-
ing industry for risk assessment procedures and supervi sion
concerning the use of financial derivatives. These guidelines
require amongst other things a clear segregation of duties
in the areas of execution, administration, accounting and con-
trolling. Risk limits are continuously monitored and, where
appropriate, the use of hedging instruments is adjusted to
that extent.
The Fresenius Group defines benchmarks for individual
exposures in order to quantify interest and foreign exchange
risks. The benchmarks are derived from achievable and sus-
tainable market rates. Depending on the individual bench-
marks, hedging strategies are determined and generally imple-
mented by means of micro hedges.

Consolidated Financial Statements244
Financial S
tatements
The Fresenius Group makes sure there is an economic rela-
tionship between the hedged item and the hedging instrument
and ensures reasonable hedge ratios of the designated hedged
items with interest and currency risks. This is achieved by
matching to a large extent the critical terms of the interest
and foreign exchange derivatives with the critical terms
of the underlying exposures. Therefore, the earnings of the
Fresenius Group were not materially affected by hedge inef-
fectiveness in the reporting period. In principle, sources of
inefficiency are risk of credit default and time lags of under-
lying exposures.
Foreign exchange risk managementThe Fresenius Group has determined the euro as its financial
reporting currency. Therefore, foreign exchange translation
risks resulting from the fluctuation of exchange rates between
the euro and the local currencies, in which the financial state-
ments of the foreign subsidiaries are prepared, have an impact
on results of operations and financial positions reported in
the consolidated financial statements.
Besides translation risks, foreign exchange transaction
risks exist. These mainly relate to transactions denominated
in foreign currencies, such as purchases and sales, projects
and services as well as intragroup sales of products to other
Fresenius Group entities in different currency areas. Therefore,
the subsidiaries are affected by changes of foreign exchange
rates between the invoicing currencies and the local curren-
cies in which they conduct their businesses. Solely for the
purpose of hedging existing and foreseeable foreign exchange
transaction exposures, the Fresenius Group enters into for-
eign exchange forward contracts and, on a small scale, foreign
exchange options. To ensure that no foreign exchange risks
result from loans in foreign currencies, the Fresenius Group
enters into foreign exchange swap contracts. The Fresenius
Group solely designates the spot element of the foreign
exchange forward contract as hedging instrument in cash flow
hedges and uses a hedge ratio for designated risks of 1 : 1.
The fair value of foreign exchange contracts designated as
cash flow hedges used to hedge operating transaction risks
was - € 2 million and in relation with loans in foreign curren-
cies € 5 million.
As of December 31, 2018, the notional amounts of foreign
exchange contracts totaled € 3,301 million. Thereof € 3,299 mil-
lion were due in less than 12 months. As of December 31,
2018, the Fresenius Group was party to foreign exchange con-
tracts with a maximum maturity of 18 months. The Fresenius
Group uses a Cash-Flow-at-Risk (CFaR) model in order to
estimate and quantify such transaction risks from foreign cur-
rencies. The basis for the analysis of the currency risks are
the foreign currency cash flows that are reasonably expected
to arise within the following 12 months, less any hedges.
Under the CFaR approach, the potential currency fluctuations
of these net exposures are shown as prob ability distribu-
tions based on historical volatilities and correlations of the
preceding 250 business days. The calculation is made assum-
ing a confidence level of 95% and a holding period of up to
one year. The aggregation of currency risks has risk-mitigat-
ing effects due to correlations between the transactions con-
cerned, i. e. the overall portfolio’s risk exposure is generally
less than the sum total of the underlying individual risks.
As of December 31, 2018, the Fresenius Group’s cash flow
at risk amounted to € 66 million based on a net exposure of
€ 1,882 million. This means, with a probability of 95%, a
potential loss in relation to the forecasted foreign exchange
cash flows of the next 12 months will be not higher than
€ 66 million.
The following table shows the average hedging rates and
nominal amounts of foreign exchange contracts for material
currency pairs at December 31, 2018.
Nominal amount in € millions
Average hedging rate
Euro / U.S. dollar 750 1.1847
Euro / Australian dollar 188 1.6149
Euro / Chinese renminbi 158 7.9792
Interest rate risk management Fresenius Group’s interest rate risks mainly arise from money
market and capital market transactions of the Group for
financing its business activities.
The Fresenius Group enters into interest rate swaps and,
on a small scale, into interest rate options in order to protect
against the risk of rising interest rates. These interest rate
derivatives are mainly designated as cash flow hedges and
have been entered into in order to convert payments based
Consolidated Financial Statements Other notes 245
Fin
anci
al S
tate
men
ts
on variable interest rates into payments at a fixed interest rate
and in anticipation of future long-term debt issuances (pre-
hedges). As of December 31, 2018, euro denominated interest
rate swaps had a notional volume of € 206 million. Thereof
€ 204 million were due in less than 12 months. The fair value
was - € 0.6 thousand. The euro interest rate swaps expire in
the years 2019 to 2022. They bear an average interest rate of
0.37%. Furthermore, the Fresenius Group had U.S. dollar
denominated interest rate swaps in the amount of US$ 200 mil-
lion (€ 175 million) with a fair value of US$ 6 million (€ 5 mil-
lion). They expire in 2021 and bear an average interest rate
of 1.22%.
The pre-hedges are used to hedge interest rate exposures
with regard to interest rates which are relevant for the future
long-term debt issuance and which could rise until the respec-
tive debt is actually issued. These pre-hedges are settled at
the issuance date of the corresponding long-term debt with
the settlement amount recorded in accumulated other com-
prehensive income (loss) amortized to interest expense over
the life of the debt. At December 31, 2018 and December 31,
2017, the Fresenius Group had a loss of € 3 million and € 19
million, respectively, related to such settlements of pre-hedges
deferred in accumulated other comprehensive income (loss),
net of tax.
Interest payables and interest receivables in connection
with the swap agreements are accrued and recorded as an
adjustment to the interest expense at each reporting date.
Concerning interest rate contracts, unscheduled repayments
or the renegotiation of hedged items may in some cases
lead to the de-designation of the hedging instrument, which
existed up to that point. From that date, the respective hedg-
ing transactions are recognized in the consolidated statement
of income.
For purposes of analyzing the impact of changes in the rel-
evant reference interest rates on Fresenius Group’s results of
operations, the Group calculates the portion of financial debt
which bears variable interest rates and which has not been
hedged by means of interest rate swaps or options against ris-
ing interest rates. For this particular part of its liabilities, the
Fresenius Group assumes an increase in the reference rates
of 0.5% compared to the actual rates as of the date of the
statement of financial position. The corresponding additional
annual interest expense is then compared to the net income
attributable to shareholders of Fresenius SE & Co. KGaA. This
analysis shows that an increase of 0.5% in the relevant
ref erence rates would have an effect of approximately 1.0%
on the consolidated net income attributable to shareholders
of Fresenius SE & Co. KGaA and an effect of less than 1.0%
on Fresenius SE & Co. KGaA shareholders’ equity.
CREDIT RISK
The Fresenius Group is exposed to potential losses regard-
ing financial instruments in the event of non-performance by
counterparties. With respect to derivative financial instru-
ments, it is not expected that any counterparty fails to meet its
obli gations as the counterparties are highly rated financial
institutions. The maximum credit exposure of deri v atives is
represented by the fair value of those contracts with a positive
fair value amounting to € 21 million for foreign exchange
deriv atives. The maximum credit exposure from interest rate
derivatives was € 5 million. The maximum credit risk result-
ing from the use of non-derivative financial instruments is
defined as the total amount of all receivables. In order to con-
trol this credit risk, the Management of the Fresenius Group
performs an aging analysis of trade accounts receivable. For
details on the aging analysis and on the allowance for doubt-
ful accounts, please see note 15, Trade accounts and other
receivables.
LIQUIDITY RISK
The liquidity risk is defined as the risk that a company is
potentially unable to meet its financial obligations. The Man-
agement of the Fresenius Group manages the liquidity of
the Group by means of effective working capital and cash
management as well as an anticipatory evaluation of refinanc-
ing alternatives. The Management of the Fresenius Group
believes that existing credit facilities as well as the cash gener-
ated by operating activities and additional short-term borrow-
ings are sufficient to meet the company’s foreseeable demand
for liquidity (see note 22, Debt and capital lease obligations).
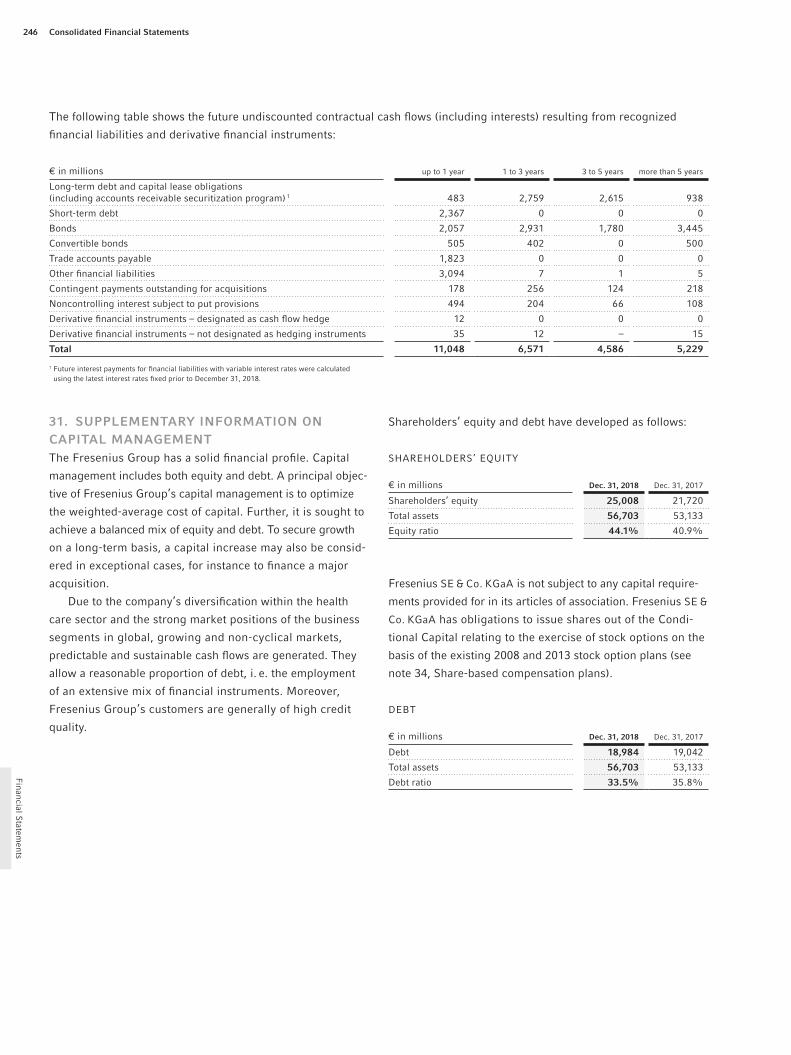
Consolidated Financial Statements246
Financial S
tatements
The following table shows the future undiscounted contractual cash flows (including interests) resulting from recognized
financial liabilities and derivative financial instruments:
€ in millions up to 1 year 1 to 3 years 3 to 5 years more than 5 years
Long-term debt and capital lease obligations (including accounts receivable securitization program) 1 483 2,759 2,615 938
Short-term debt 2,367 0 0 0
Bonds 2,057 2,931 1,780 3,445
Convertible bonds 505 402 0 500
Trade accounts payable 1,823 0 0 0
Other financial liabilities 3,094 7 1 5
Contingent payments outstanding for acquisitions 178 256 124 218
Noncontrolling interest subject to put provisions 494 204 66 108
Derivative financial instruments – designated as cash flow hedge 12 0 0 0
Derivative financial instruments – not designated as hedging instruments 35 12 – 15
Total 11,048 6,571 4,586 5,229
1 Future interest payments for financial liabilities with variable interest rates were calculated using the latest interest rates fixed prior to December 31, 2018.
31. SUPPLEMENTARY INFORMATION ON CAPITAL MANAGEMENTThe Fresenius Group has a solid financial profile. Capital
management includes both equity and debt. A principal objec-
tive of Fresenius Group’s capital management is to optimize
the weighted-average cost of capital. Further, it is sought to
achieve a balanced mix of equity and debt. To secure growth
on a long-term basis, a capital increase may also be con sid-
ered in exceptional cases, for instance to finance a major
acquisition.
Due to the company’s diversification within the health
care sector and the strong market positions of the business
segments in global, growing and non-cyclical markets,
predictable and sustainable cash flows are generated. They
allow a reasonable proportion of debt, i. e. the employment
of an extensive mix of financial instruments. Moreover,
Fresenius Group’s customers are generally of high credit
quality.
Shareholders’ equity and debt have developed as follows:
SHAREHOLDERS’ EQUITY
€ in millions Dec. 31, 2018 Dec. 31, 2017
Shareholders’ equity 25,008 21,720
Total assets 56,703 53,133
Equity ratio 44.1% 40.9%
Fresenius SE & Co. KGaA is not subject to any capital require-
ments provided for in its articles of association. Fresenius SE &
Co. KGaA has obligations to issue shares out of the Condi-
tional Capital relating to the exercise of stock options on the
basis of the existing 2008 and 2013 stock option plans (see
note 34, Share-based compensation plans).
DEBT
€ in millions Dec. 31, 2018 Dec. 31, 2017
Debt 18,984 19,042
Total assets 56,703 53,133
Debt ratio 33.5% 35.8%

Consolidated Financial Statements Other notes 247
Fin
anci
al S
tate
men
ts
Assuring financial flexibility is the top priority in the Group’s
financing strategy. This flexibility is achieved through a wide
range of financing instruments and a high degree of diver-
sification of the investors. Fresenius Group’s maturity profile
displays a broad spread of maturities with a high proportion
of medium- and long-term financing. In the choice of financ-
ing instruments, market capacity, investor diversi fication,
flexibility, credit conditions and the existing maturity profile
are taken into account.
The leverage ratio on the basis of net debt / EBITDA is a key
financial figure for the Fresenius Group. As of December 31,
2018, the leverage ratio (before special items) was 2.7.
Fresenius Group’s financing strategy is reflected in its
credit ratings. The Fresenius Group is covered by the rating
agencies Moody’s, Standard & Poor’s and Fitch.
The following table shows the company rating of
Fresenius SE & Co. KGaA:
RATING OF FRESENIUS SE & CO. KGAA
Dec. 31, 2018 Dec. 31, 2017
Standard & Poor’s
Corporate Credit Rating BBB - BBB -
Outlook positive positive
Moody’s
Corporate Credit Rating Baa3 Baa3
Outlook stable stable
Fitch
Corporate Credit Rating BBB - BBB -
Outlook stable stable
32. SUPPLEMENTARY INFORMATION ON THE CONSOLIDATED STATEMENT OF CASH FLOWSThe consolidated statements of cash flows of the Fresenius
Group for the fiscal years 2018 and 2017 are shown on
pages 166 and 167.
Cash funds reported in the consolidated statement of cash
flows and in the consolidated statement of financial position
are comprised of cash on hand, checks, securities and cash at
bank which are readily convertible within three months and
are subject to insignificant risk of changes in value.
In 2018, Fresenius Helios has used subsidies for invest-
ments in property, plant and equipment in the amount of
€ 133 million (2017: € 114 million), that were offset in purchase
of property, plant and equipment in the consolidated state-
ment of cash flows.
Cash paid for acquisitions (without investments in licenses)
consisted of the following:
€ in millions 2018 2017
Assets acquired 513 8,220
Liabilities assumed - 39 - 1,287
Noncontrolling interest - 57 - 103
Notes assumed in connection with acquisitions - 17 - 163
Issuance of shares 0 - 400
Cash paid 400 6,267
Cash acquired - 5 - 22
Cash paid for acquisitions, net 395 6,245
Cash paid for investments, net of cash acquired 590 18
Cash paid for intangible assets, net 85 26
Total cash paid for acquisitions and investments, net of cash acquired, and net purchases of intangible assets 1,070 6,289
In 2018, € 480 million of cash paid for investments, net of cash
acquired, related to investments in securities in the business
segment Fresenius Medical Care.
Proceeds from the sale of subsidiaries were € 1,533 million
in 2018 (2017: € 153 million).

Consolidated Financial Statements248
Financial S
tatements
The following table shows a reconciliation of debt to cash flow from financing activities in 2018 and 2017:
cash- effective changes non-cash-effective changes
€ in millions Jan. 1, 2018 Cash flow
Assumed as part of
acquisitions
Foreign currency
translation
Depreciation on financing
costsNew lease contracts Other Dec. 31, 2018
Short-term debt 1,550 762 4 - 3 0 0 41 2,354
Long-term debt and capital lease obligations, less accounts receivable securitization program 6,811 - 651 6 111 10 9 1 6,297
Bonds 9,069 - 245 0 145 12 0 9 8,990
Convertible bonds 1,318 0 0 0 25 0 0 1,343
Accounts receivable securitization program 294 - 299 0 5 0 0 0 0
cash- effective changes non-cash-effective changes
€ in millions Jan. 1, 2017 Cash flow
Assumed as part of
acquisitions
Foreign currency
translation
Depreciation on financing
costsNew lease contracts Other Dec. 31, 2017
Short-term debt 847 722 - 5 - 13 0 0 - 1 1,550
Long-term debt and capital lease obligations, less accounts receivable securitization program 5,494 1,230 303 - 405 9 12 168 6,811
Bonds 7,414 2,164 0 - 463 18 0 - 64 9,069
Convertible bonds 854 500 0 0 24 0 - 60 1,318
Accounts receivable securitization program 165 157 0 - 28 0 0 0 294

Consolidated Financial Statements Other notes 249
Fin
anci
al S
tate
men
ts
33. NOTES ON THE CONSOLIDATED SEGMENT REPORTING
GENERAL
The consolidated segment reporting tables shown on pages
170 to 171 of this Annual Report are an integral part of
the notes.
The Fresenius Group has identified the business segments
Fresenius Medical Care, Fresenius Kabi, Fresenius Helios
and Fresenius Vamed, which corresponds to the internal orga-
nizational and reporting structures (Management Approach)
at December 31, 2018.
The key data disclosed in conjunction with the consolidated
segment reporting correspond to the key data of the internal
reporting system of the Fresenius Group. Internal and external
reporting and accounting correspond to each other; the same
key data and definitions are used.
Sales and proceeds between the segments are indicative
of the actual sales and proceeds agreed with third parties.
Administrative services are billed in accordance with service
level agreements.
The business segments were identified in accordance with
IFRS 8, Operating Segments, which defines the segment
reporting requirements in the annual financial statements and
interim reports with regard to the operating business, product
and service businesses and regions.
The business segments of the Fresenius Group are as
follows:
▶ Fresenius Medical Care
▶ Fresenius Kabi
▶ Fresenius Helios
▶ Fresenius Vamed
▶ Corporate / Other
The segment Corporate / Other is mainly comprised of the
holding functions of Fresenius SE & Co. KGaA as well as
Fresenius Netcare GmbH, which provides services in the field
of information technology. In addition, the segment Corpo-
rate / Other includes inter segment consolidation adjustments
as well as special items (see note 3, Special items).
Details on the business segments are shown on page 173
of the notes.
Segment reporting by region takes account of geographical
factors and the similarity of markets in terms of opportu nities
and risks. The allocation to a particular region is based on the
domicile of the customers.
NOTES ON THE BUSINESS SEGMENTS
The key figures used by the Management Board to assess
segment performance, have been selected in such a way that
they include all items of income and expenses which fall
under the area of responsibility of the business segments. The
Management Board is convinced that the most suitable per-
form ance indicator is the operating income (EBIT). The Man-
agement Board believes that, in addition to the operating
income, the figure for earnings before interest, taxes and
depreciation / amortization (EBITDA) can also help investors to
assess the ability of the Fresenius Group to generate cash
flows and to meet its financial obligations. The EBITDA figure
is also the basis for assessing Fresenius Group’s compliance
with the terms of its credit agreements (e. g. the Fresenius
Medical Care Credit Agreement or the Fresenius Credit
Agreement).
Depreciation and amortization is presented for property,
plant and equipment and intangible assets with definite useful
lives of the respective business segment.
Net interest is comprised of interest expenses and interest
income.
Net income attributable to shareholders of Fresenius SE &
Co. KGaA is defined as earnings after income taxes and non-
controlling interest.
The operating cash flow is the cash provided by / used in
operating activities.
The cash flow before acquisitions and dividends is the
operating cash flow less net capital expenditure.
Debt is comprised of bank loans, bonds, convertible bonds,
capital lease obligations, liabilities relating to outstanding
acquisitions as well as intercompany liabilities.
Capital expenditure mainly includes additions to property,
plant and equipment.
Acquisitions refer to the purchase of shares in legally
inde pendent companies and the acquisition of business divi-
sions and intangible assets (e. g. licenses). The key figures
shown with regard to acquisitions present the contractual pur-
chase prices comprising amounts paid in cash (less cash
acquired), debts assumed and the issuance of shares, whereas
for the purposes of the statement of cash flows, only cash
purchase price components less acquired cash and cash equiv-
alents are reported.

Consolidated Financial Statements250
Financial S
tatements
The EBITDA margin is calculated as a ratio of EBITDA
to sales.
The EBIT margin is calculated as a ratio of EBIT to sales.
The return on operating assets (ROOA) is defined as the
ratio of EBIT to average operating assets. Operating assets are
defined as total assets less deferred tax assets, trade accounts
payable and advance payments from customers as well as
guaranteed subsidies.
In addition, the key indicators “Depreciation and amorti-
zation in % of sales” and “Operating cash flow in % of sales”
are also disclosed.
RECONCILIATION OF KEY FIGURES
TO CONSOLIDATED EARNINGS
€ in millions 2018 2017
Total EBIT of reporting segments 4,607 4,867
Special items 690 - 241
General corporate expenses Corporate / Other (EBIT) - 46 - 37
Group EBIT 5,251 4,589
Interest expenses - 942 - 874
Interest income 355 207
Income before income taxes 4,664 3,922
RECONCILIATION OF NET DEBT WITH THE CONSOLIDATED
STATEMENT OF FINANCIAL POSITION
€ in millions Dec. 31, 2018 Dec. 31, 2017
Short-term debt 2,354 1,550
Short-term debt from related parties – –
Current portion of long-term debt and capital lease obligations 353 618
Current portion of bonds 1,744 731
Current portion of convertible bonds 493 0
Long-term debt and capital lease obligations, less current portion 5,944 6,487
Bonds, less current portion 7,246 8,338
Convertible bonds, less current portion 850 1,318
Debt 18,984 19,042
less cash and cash equivalents 2,709 1,636
Net debt 16,275 17,406
The following table shows the non-current assets by geo-
graphical region:
€ in millions Dec. 31, 2018 Dec. 31, 2017
Germany 9,212 8,922
Spain 6,225 6,086
Europe (excluding Germany and Spain) 2,914 2,872
North America 19,033 18,452
Asia-Pacific 1,951 1,893
Latin America 701 648
Africa 48 50
Total non-current assets 1 40,084 38,923
1 The aggregate amount of net non-current assets is the sum of non-current assets less deferred tax assets and less other non-current financial assets.
In 2018, the Fresenius Group generated sales of € 7,359 million
(2017: € 7,192 million) in Germany. Sales in the United States
were € 13,652 million at actual rates (2017: € 14,894 million)
and € 14,272 million in constant currency in 2018.
In 2018, the segment Fresenius Medical Care generated
other sales in the amount of € 314 million, Fresenius Kabi € 5
million and Fresenius Vamed € 5 million. All other sales are
sales from contracts with customers.
34. SHARE-BASED COMPENSATION PLANS
COMPENSATION COST IN CONNECTION WITH THE
SHARE-BASED COMPENSATION PLANS OF THE
FRESENIUS GROUP
In 2018, the Fresenius Group recognized compensation cost in
an amount of € 35 million for stock options granted since
2014. For stock incentive plans which are performance-based,
the Fresenius Group recognizes compensation cost over the
vesting periods, based on the market values of the underlying
stock at the grant date.
The expenses related to cash-settled share-based pay-
ment transactions are determined based upon the fair value
at measurement date and the number of phantom stocks or
performance shares granted which will be recognized over
the vesting period. In 2018, the Fresenius Group recognized
expenses of - € 7 million (income) in connection with cash-
settled share-based payment transactions.
FAIR VALUE OF STOCK OPTIONS
The Fresenius Group uses a binomial option pricing model in
determining the fair value of stock options granted under the
stock option plans of Fresenius SE & Co. KGaA and Fresenius
Medical Care AG & Co. KGaA. Option valuation models require

Consolidated Financial Statements Other notes 251
Fin
anci
al S
tate
men
ts
the input of highly subjective assumptions including expected
stock price volatility. Fresenius Group’s assumptions are
based upon its past experiences, market trends and the expe-
riences of other entities of the same size and in similar indus-
tries. To incorporate the effects of expected early exercise
in the model, an early exercise of vested options was assumed
as soon as the share price exceeds 150% of the exercise
price. Fresenius Group’s stock options have characteristics
that vary significantly from traded options and changes in
subjective assumptions can materially affect the fair value of
the option.
The weighted-average assumptions for the calculation of
the fair value of grants of the Fresenius SE & Co. KGaA Stock
Option Plan 2013 made during 2017 are as follows:
2017
€ in millionsJuly
GrantDecember
Grant
Expected dividend yield 1.25% 1.39%
Risk-free interest rate 0.26% 0.13%
Expected volatility 21.91% 21.69%
Life of options 8 years 8 years
Exercise price per option in € 74.77 64.69
The expected volatility results from the historical volatility cal-
culated over the expected life of options. The volatility was
determined when the fair value of stock options was calculated
for the first time and since then has been controlled every
year upon issuance of a new tranche.
SHARE-BASED COMPENSATION PLANS OF
FRESENIUS SE & CO. KGAA
Description of the Fresenius SE & Co. KGaA share-based compensation plans in placeAs of December 31, 2018, Fresenius SE & Co. KGaA had three
share-based compensation plans in place: the stock option
based Fresenius SE Stock Option Plan 2008 (2008 Plan), the
Fresenius SE & Co. KGaA Long Term Incentive Program 2013
(2013 LTIP) which is based on stock options and phantom
stocks and the Long Term Incentive Plan 2018 (LTIP 2018)
which is solely based on performance shares. On June 30,
2017, the term of the options granted under the Fresenius AG
Stock Option Plan 2003 expired. Currently, solely LTIP 2018
can be used to grant performance shares.
LTIP 2018
On April 12, 2018 and March 15, 2018, respectively, the Man-
agement Board and Supervisory Board of the general partner,
Fresenius Management SE, resolved the Long Term Incentive
Plan 2018 (LTIP 2018).
The LTIP 2018 is based solely on virtual stocks (perfor-
mance shares). The performance shares issued through the
plan are non-equity-backed, virtual compensation instruments.
When performance targets are reached and other prerequi-
sites are met, they guarantee the entitlement to a cash payment
by Fresenius SE & Co. KGaA or one of its affiliated companies.
The new plan is available both for members of the Man-
agement Board (with the exception of Mr. Rice Powell, who
receives his compensation from Fresenius Medical Care
Management AG) and other executives. Performance shares
may be granted once annually over a period of five years.
The grant to the members of the Management Board is made
by the Supervisory Board of the general partner, Fresenius
Management SE, the grant to the other executives is made by
the Management Board of Fresenius Management SE, in
each case on the basis of a grant value determined at its dis-
cretion. The grant value is determined in consideration of
the personal performance and the responsibilities of the con-
cerned plan participant. The number of performance shares
granted is calculated through applying the grant value and
the average stock market price of the Fresenius share over
the period of 60 stock exchange trading days prior to the
grant date.
The number of performance shares may change over a
period of four years, depending on the level of achievement
of the performance targets described in more detail below.
This could entail the entire loss of all performance shares or
also – at maximum – the doubling of their number. The
resulting number of performance shares, which is determined
after a performance period of four years and based on the
respective level of target achievement, is deemed finally
earned four years after the date of the respective grant. The
number of vested performance shares is then multiplied by
the average stock exchange price of Fresenius SE & Co. KGaA’s

Consolidated Financial Statements252
Financial S
tatements
share over a period of 60 stock exchange trading days prior
to the lapse of this vesting period plus the total of the dividends
per share of Fresenius SE & Co. KGaA paid by Fresenius SE &
Co. KGaA between the grant date and the vesting date. The
resulting amount will be paid to the respective plan participant
in cash. The potential disbursement entitlement of each mem-
ber of the Management Board is limited to a maximum value
of 250% of the grant value, the entitlement of all other plan
participants is limited to a maximum value of 400%.
The LTIP 2018 has two equally weighted performance tar-
gets: firstly, the growth rate of the adjusted consolidated net
income (adjusted for currency effects) and, secondly, the rela-
tive Total Shareholder Return based on the STOXX Europe 600
Health Care Index. Disbursement entitlement requires that
at least one of the two performance targets must be reached
or surpassed over the four-year performance period.
For the performance target “Net Income Growth Rate” a
level of target achievement of 100% is reached when the
same is at least 8% over the four-year performance period.
If the growth rate falls below or corresponds to only 5%,
the level of target achievement is 0%. If the growth rate is
between 5% and 8%, the level of target achievement is
between 0% and 100%, while, where the growth rate is
between 8% and 20%, the level of target achievement will
be between 100% and 200%. Intermediate values are cal-
culated through linear interpolation. The net income is the
consolidated net income attributable to shareholders of
Fresenius SE & Co. KGaA reported in the consolidated finan-
cial statements of Fresenius SE & Co. KGaA prepared in accor-
dance with IFRS, adjusted for extraordinary effects.
The determination of the adjusted net income (adjusted
for currency effects) and the change in comparison with the
adjusted net income (not adjusted for currency effects) of the
previous Fresenius Group fiscal year will be verified in a
binding manner by the auditors of Fresenius SE & Co. KGaA on
the basis of the audited consolidated financial statements.
For the ascertainment of the currency translation effects, all
line items of the income statements of the companies that are
included in the consolidated financial statements and which
have a functional currency other than the reporting currency
(Euro) of the Fresenius Group are translated with the average
exchange rates of the Fresenius Group fiscal year of the
consolidated financial statements that are the basis for the
comparison.
For the “Total Shareholder Return” performance target, a
target achievement of 100% is met when the Total Share-
holder Return of Fresenius SE & Co. KGaA in comparison with
the Total Shareholder Return of the other companies of the
STOXX Europe 600 Health Care Index achieves an average
ranking within the benchmark companies, i. e. exactly in the
middle (50th percentile), over the four-year performance period.
If the ranking corresponds to the 25th percentile or less, the
level of target achievement is 0%. Where the ranking is
between the 25th percentile and the 50th percentile, the level
of target achievement is between 0% and 100%; and, for a
ranking between the 50th percentile and the 75th percentile,
between 100% and 200%. Intermediate values will also be
calculated through linear interpolation. Total Shareholder
Return denotes the percentage change in the stock market
price within the performance period including re-invested
dividends and all capital measures, whereby capital measures
are to be calculated through rounding down to the fourth
decimal place.
The ranking values are determined using the composition
of STOXX Europe 600 Health Care on the grant date. For
equalization purposes, the relevant market price is the average
market price in the period of 60 stock exchange trading days
prior to the beginning and end of a performance period; the
relevant currency is that of the main stock exchange of a
company, which was listed in STOXX Europe 600 Health Care
on the grant date.
A level of target achievement in excess of 200% is not
possible for both performance targets.
To calculate the level of overall target achievement, the
level of target achievement of the two performance targets
are given equal weighting. The total number of performance
shares vested on each plan participant is calculated through
multiplying the number of performance shares granted by the
overall target achievement.
In the event of violation of compliance rules, the Supervi-
sory Board of Fresenius Management SE, in due exercise of
its discretion, is entitled to reduce the number of perfor-
mance shares vested on a member of the Management Board
to zero. Regarding all other plan participants, such decision is
made by the Management Board of Fresenius Management SE.
Furthermore, Fresenius SE & Co. KGaA is entitled to a com-
plete or partial reimbursement in the event of violation of
compliance rules in the period of three years following
disbursement.

Consolidated Financial Statements Other notes 253
Fin
anci
al S
tate
men
ts
2013 LTIP
The 2013 LTIP is comprised of the Fresenius SE & Co. KGaA
Stock Option Plan 2013 (2013 SOP) and the Fresenius SE &
Co. KGaA Phantom Stock Plan 2013 (2013 PSP). It combines
the granting of stock options with the granting of phantom
stock awards which entitle the holder to receive cash payments
upon exercising the phantom stock. Each of the 2013 SOP
and 2013 PSP making up the 2013 LTIP have been established
under a stand-alone legal documentation.
2013 SOP
Under the 2013 SOP, which was approved by the Annual Gen-
eral Meeting of Fresenius SE & Co. KGaA on May 17, 2013,
Fresenius Management SE was originally authorized to issue
up to 8.4 million subscription rights for an amount of 8.4 mil-
lion non-par value ordinary bearer shares of Fresenius SE &
Co. KGaA until May 16, 2018.
Of the up to 8.4 million options, up to 1.6 million options
were designated for members of the Management Board of
Fresenius Management SE; up to 4.4 million options were
designated for members of the management of directly or indi-
rectly affiliated companies (except for Fresenius Medical
Care) and up to 2.4 million options were designated for exec-
utive employees of Fresenius SE & Co. KGaA and its affiliated
companies (except for Fresenius Medical Care).
In connection with the stock split in 2014, the total volume
of not yet granted subscription rights increased in the same
proportion as the subscribed capital (factor 3) as far as options
have not yet been granted under the 2013 SOP. The same
applies to the subsets of the subscription rights that are attrib-
utable to individual groups of participants. For stock options
that were granted before the stock split 2014 came into effect,
the entitlement of the participants to receive new shares
through the exercise of stock options increased in the same
proportion as the subscribed capital (factor 3). The partici-
pants are now entitled to receive three bearer ordinary shares
of Fresenius SE & Co. KGaA. The exercise price was reduced
proportionally.
The granting of the options occurred in five annual
tranches, each to the last Monday in July or the first Monday
in December. With respect to new options, the Supervisory
Board of Fresenius Management SE determined the stock
options granted to members of Fresenius Management SE’s
Management Board, whereas the Management Board of
Fresenius Management SE determined the other participants
in the 2013 SOP and the stock options granted to them.
The exercise price of an option equals the volume-weighted
average stock market price (closing price) of the non-par
value ordinary bearer share of Fresenius SE & Co. KGaA in the
electronic Xetra trading of Deutsche Börse AG in Frankfurt
am Main, or a comparable successor system, on the last
30 calendar days prior to the respective grant date.
Options granted have an eight-year term but can be exer-
cised only after a four-year vesting period. The exercise of
options is subject to the condition precedent, in each case,
that the annual success target within a four-year waiting period
is achieved. The success target is achieved in each case if,
after the granting of the options to the respective entitled per-
son, either (i) the consolidated net income attributable to
shareholders of Fresenius SE & Co. KGaA according to IFRS,
adjusted for extraordinary effects and on a constant currency
basis, has increased by at least 8% per annum in compari-
son to the previous year in each case within the waiting period,
or (ii) – if this is not the case – the compounded annual growth
rate of the consolidated net income attributable to share-
holders of Fresenius SE & Co. KGaA according to IFRS, adjusted
for extraordinary effects and on a constant currency basis,
during the four years of the waiting period amounts to at least
8%. In the event that the success target within the four-year
waiting period is not achieved for the individual years or for
the compounded annual growth rate, the options issued in
each case are forfeited in proportion to the non-achievement of
the success target within the waiting period, i. e. by one
quarter, two quarters, three quarters, or completely. The per-
formance targets for 2013, 2014, 2015, 2016, 2017 and 2018
were met.
The adjusted net income attributable to shareholders of
Fresenius SE & Co. KGaA according to IFRS (currency adjusted)
and changes thereto compared to the adjusted net income
according to IFRS (without currency adjustment) of the rele-
vant comparison year shall be verified with binding effect in
each case by the auditors of Fresenius SE & Co. KGaA on the
basis of the audited consolidated financial statements. Upon
exercise of vested options, Fresenius SE & Co. KGaA has the
right to grant treasury shares in lieu of increasing capital by
the issuance of new shares.

Consolidated Financial Statements254
Financial S
tatements
After the expiration of the waiting period, all options in
respect of which the success target has been achieved may
be exercised at any time outside the designated blackout
periods.
The last options were granted in 2017.
2013 PSP
Fresenius SE & Co. KGaA’s 2013 PSP was established in May
2013, together with the 2013 SOP in line with the 2013 LTIP.
Awards of phantom stock can be granted on each stock option
grant date. Phantom stock awarded under the 2013 PSP may
be granted to the members of Fresenius Management SE’s
Management Board, the members of the management of
directly or indirectly affiliated companies (except for Fresenius
Medical Care) and to executive employees of Fresenius SE &
Co. KGaA and its affiliated companies (except for Fresenius
Medical Care).
The holders of phantom stocks, that were issued before
the stock split 2014 came into effect, were granted an eco-
nomic compensation through retroactively tripling the number
of phantom stocks granted before the stock split 2014 came
into effect.
As under the 2013 SOP, the Supervisory Board of Fresenius
Management SE determined the phantom stocks granted to
members of Fresenius Management SE’s Management Board,
whereas the Management Board of Fresenius Management
SE determined the other participants in the 2013 PSP and the
phantom stocks granted to them.
Phantom stock awards under the 2013 PSP entitle the
holder to receive a cash payment. Each phantom stock award
shall entitle the holder to receive the volume-weighted aver-
age stock market price (closing price) of the non-par value
ordinary bearer share of Fresenius SE & Co. KGaA in the elec-
tronic Xetra trading of Deutsche Börse AG in Frankfurt am
Main, or a comparable successor system, during the last three
months prior to the date the phantom stock is exercised.
The exercise of phantom stock is subject to the condition
precedent, in each case, that the annual success target within
a four-year waiting period is achieved. The success target is
achieved in each case if, after the granting of the subscription
rights to the respective entitled person, either (i) the consoli-
dated net income attributable to shareholders of Fresenius SE &
Co. KGaA according to IFRS, adjusted for extraordinary effects
and on a constant currency basis, has increased by at least
8% per annum in comparison to the previous year in each
case within the waiting period, or (ii) – if this is not the case –
the compounded annual growth rate of the consolidated
net income attributable to shareholders of Fresenius SE &
Co. KGaA according to IFRS, adjusted for extraordinary
effects and on a constant currency basis, during the four years
of the waiting period amounts to at least 8%. In the event
that the success target within the four-year waiting period
is not achieved for the individual years or for the compounded
annual growth rate, the phantom stock awards issued in each
case are forfeited in proportion to the non-achievement of the
success target within the waiting-period, i. e. by one quarter,
two quarters, three quarters, or completely. The performance
targets for 2013, 2014, 2015, 2016, 2017 and 2018 were met.
The adjusted net income attributable to shareholders of
Fresenius SE & Co. KGaA according to IFRS (currency adjusted)
and changes thereto compared to the adjusted net income
according to IFRS (without currency adjustment) of the rele-
vant comparison year shall be verified with binding effect in
each case by the auditors of Fresenius SE & Co. KGaA on the
basis of the audited consolidated financial statements.
After the expiration of the waiting period, all exercisable
phantom stock will be deemed to be exercised and cashed
out on March 1 following the end of the waiting period (or the
following banking day).
The last phantom stocks were granted in 2017.
Stock Option Plan 2008
During 2008, Fresenius SE adopted the 2008 Plan to grant
subscription rights to members of the Management Board
and executive employees of the company and affiliated com-
panies. Under the 2008 Plan, originally, up to 6.2 million
options could be issued, which carried the entitlement to
exclusively obtain 6.2 million ordinary shares.
For stock options that were granted before the stock
split 2014 came into effect, the entitlement of the participants
to receive new shares through the exercise of stock options
increased in the same proportion as the subscribed capital
(factor 3). The participants are now entitled to receive three
bearer ordinary shares of Fresenius SE & Co. KGaA. The
maximum number of ordinary shares to be issued increased
accordingly. The exercise price was reduced proportionally.
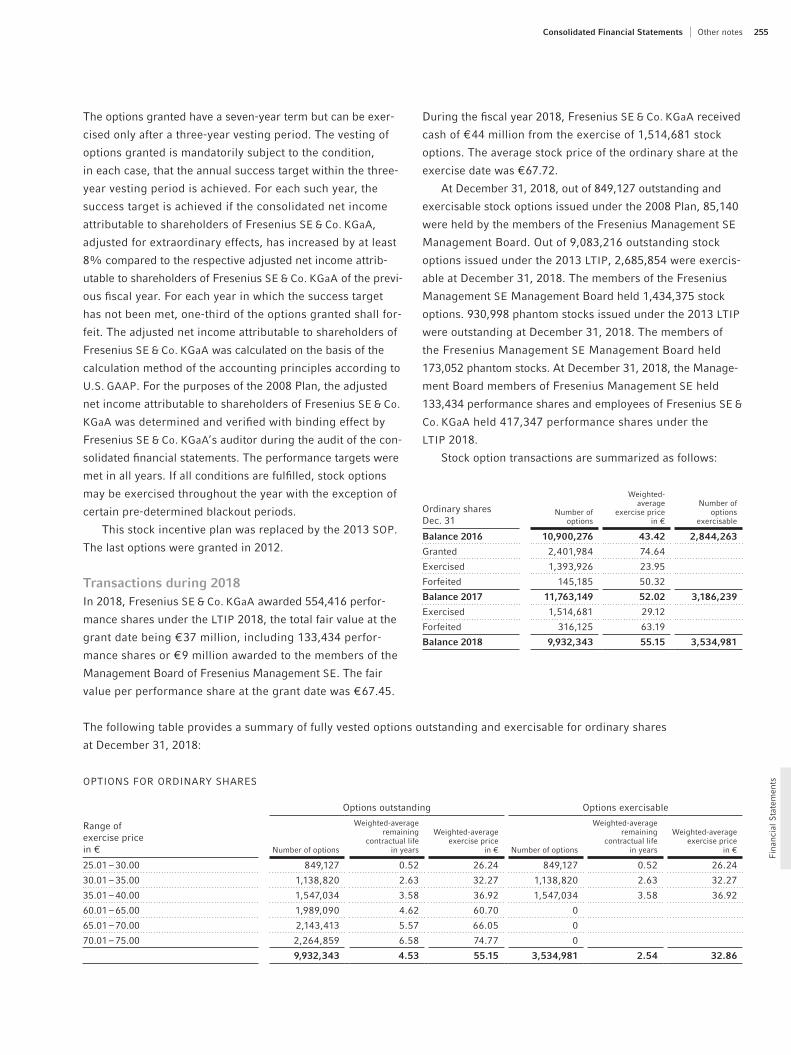
Consolidated Financial Statements Other notes 255
Fin
anci
al S
tate
men
ts
The options granted have a seven-year term but can be exer-
cised only after a three-year vesting period. The vesting of
options granted is mandatorily subject to the condition,
in each case, that the annual success target within the three-
year vesting period is achieved. For each such year, the
success target is achieved if the consolidated net income
attributable to shareholders of Fresenius SE & Co. KGaA,
adjusted for extraordinary effects, has increased by at least
8% compared to the respective adjusted net income attrib-
utable to shareholders of Fresenius SE & Co. KGaA of the previ-
ous fiscal year. For each year in which the success target
has not been met, one-third of the options granted shall for-
feit. The adjusted net income attributable to shareholders of
Fresenius SE & Co. KGaA was calculated on the basis of the
calculation method of the accounting principles according to
U.S. GAAP. For the purposes of the 2008 Plan, the adjusted
net income attributable to shareholders of Fresenius SE & Co.
KGaA was determined and verified with binding effect by
Fresenius SE & Co. KGaA’s auditor during the audit of the con-
solidated financial statements. The performance targets were
met in all years. If all conditions are fulfilled, stock options
may be exercised throughout the year with the exception of
certain pre-determined blackout periods.
This stock incentive plan was replaced by the 2013 SOP.
The last options were granted in 2012.
Transactions during 2018In 2018, Fresenius SE & Co. KGaA awarded 554,416 perfor-
mance shares under the LTIP 2018, the total fair value at the
grant date being € 37 million, including 133,434 perfor-
mance shares or € 9 million awarded to the members of the
Management Board of Fresenius Management SE. The fair
value per performance share at the grant date was € 67.45.
During the fiscal year 2018, Fresenius SE & Co. KGaA received
cash of € 44 million from the exercise of 1,514,681 stock
options. The average stock price of the ordinary share at the
exercise date was € 67.72.
At December 31, 2018, out of 849,127 outstanding and
exercisable stock options issued under the 2008 Plan, 85,140
were held by the members of the Fresenius Management SE
Management Board. Out of 9,083,216 outstanding stock
options issued under the 2013 LTIP, 2,685,854 were exercis-
able at December 31, 2018. The members of the Fresenius
Management SE Management Board held 1,434,375 stock
options. 930,998 phantom stocks issued under the 2013 LTIP
were out standing at December 31, 2018. The members of
the Fresenius Management SE Management Board held
173,052 phantom stocks. At December 31, 2018, the Manage-
ment Board members of Fresenius Management SE held
133,434 performance shares and employees of Fresenius SE &
Co. KGaA held 417,347 performance shares under the
LTIP 2018.
Stock option transactions are summarized as follows:
Ordinary shares Dec. 31
Number of options
Weighted- average
exercise price in €
Number of options
exercisable
Balance 2016 10,900,276 43.42 2,844,263
Granted 2,401,984 74.64
Exercised 1,393,926 23.95
Forfeited 145,185 50.32
Balance 2017 11,763,149 52.02 3,186,239
Exercised 1,514,681 29.12
Forfeited 316,125 63.19
Balance 2018 9,932,343 55.15 3,534,981
The following table provides a summary of fully vested options outstanding and exercisable for ordinary shares
at December 31, 2018:
OPTIONS FOR ORDINARY SHARES
Options outstanding Options exercisable
Range of exercise price in € Number of options
Weighted-average remaining
contractual life in years
Weighted-average exercise price
in € Number of options
Weighted-average remaining
contractual life in years
Weighted-average exercise price
in €
25.01 – 30.00 849,127 0.52 26.24 849,127 0.52 26.24
30.01 – 35.00 1,138,820 2.63 32.27 1,138,820 2.63 32.27
35.01 – 40.00 1,547,034 3.58 36.92 1,547,034 3.58 36.92
60.01 – 65.00 1,989,090 4.62 60.70 0
65.01 – 70.00 2,143,413 5.57 66.05 0
70.01 – 75.00 2,264,859 6.58 74.77 0
9,932,343 4.53 55.15 3,534,981 2.54 32.86

Consolidated Financial Statements256
Financial S
tatements
At December 31, 2018, the aggregate intrinsic value of exer-
cisable options for ordinary shares was € 34 million.
At December 31, 2018, total unrecognized compensation
cost related to non-vested options granted under the 2013
LTIP was € 34 million. This cost is expected to be recognized
over a weighted-average period of 2.0 years.
FRESENIUS MEDICAL CARE AG & CO. KGAA
SHARE-BASED COMPENSATION PLANS
At December 31, 2018, Fresenius Medical Care AG & Co.
KGaA (FMC-AG & Co. KGaA) has various share-based compen-
sation plans, which may either be equity- or cash-settled.
Fresenius Medical Care AG & Co. KGaA Long-Term Incentive Plan 2016As of May 11, 2016, the issuance of stock options and phan-
tom stocks under the FMC-AG & Co. KGaA Long-Term Incen-
tive Program 2011 (LTIP 2011) is no longer possible. In order
to continue to enable the members of the Management
Board, the members of the management boards of affiliated
companies and managerial staff members to adequately
participate in the long-term, sustained success of Fresenius
Medical Care, the Management Board and the Supervisory
Board of Fresenius Medical Care Management AG have
approved and adopted the FMC-AG & Co. KGaA Long-Term
Incentive Plan 2016 (LTIP 2016) as a successor program
effective January 1, 2016.
The LTIP 2016 is a variable compensation program with
long-term incentive effects. Pursuant to the LTIP 2016, the plan
participants may be granted so-called performance shares
annually or semiannually during 2016 to 2018. Performance
shares are non-equity, cash-settled virtual compensation
instruments which may entitle plan participants to receive a
cash payment depending on the achievement of pre-defined
performance targets further defined below as well as FMC-
AG & Co. KGaA’s share price development.
For members of the Management Board, the Supervisory
Board will, in due exercise of its discretion and taking into
account the individual responsibility and performance of each
Management Board member, determine an initial value for
each grant for any awards to Management Board members.
For plan participants other than the members of the Man-
agement Board, such determination will be made by the Man-
agement Board. The initial grant value is determined in the
currency in which the respective participant receives their base
salary at the time of grant. In order to determine the number
of performance shares each plan participant receives, their
respective grant value will be divided by the value per per-
formance share at the time of the grant, which is mainly deter-
mined based on the average price of FMC-AG & Co. KGaA’s
shares over a period of 30 calendar days prior to the respec-
tive grant date.
The number of granted performance shares may change
over the performance period of three years, depending on the
level of achievement of the following: (i) revenue growth,
(ii) growth in net income attributable to shareholders of
FMC-AG & Co. KGaA (net income growth) and (iii) return on
invested capital (ROIC) improvement.
Revenue, net income and ROIC are determined according
to IFRS in euro based on full year results. Revenue growth
and net income growth, for the purpose of this plan, are deter-
mined at constant currency.
An annual target achievement level of 100% will be
reached for the revenue growth performance target if revenue
growth is 7% in each individual year of the three-year per-
formance period; revenue growth of 0% will lead to a target
achievement level of 0% and the maximum target achieve-
ment level of 200% will be reached in the case of revenue
growth of at least 16%. If revenue growth ranges between
these values, the degree of target achievement will be linearly
interpolated between these values.
An annual target achievement level of 100% for the net
income growth performance target will be reached if net
income growth is 7% in each individual year of the three-year
performance period. In the case of net income growth of 0%,
the target achievement level will also be 0%; the maximum
target achievement of 200% will be reached in the case of net
income growth of at least 14%. Between these values, the
degree of target achievement will be determined by means of
linear interpolation.
With regard to ROIC improvement, an annual target
achievement level of 100% will be reached if the target ROIC
as defined for the respective year is reached. In 2016, the
target ROIC was 7.3% and will increase by 0.2% each subse-
quent year until 2020. A target achievement level of 0% will
be reached if the ROIC falls below the target ROIC for the
respective year by 0.2 percentage points or more, whereas

Consolidated Financial Statements Other notes 257
Fin
anci
al S
tate
men
ts
the maximum target achievement level of 200% will be
reached if the target ROIC for the respective year is exceeded
by 0.2 percentage points or more. The degree of target
achievement will be determined by means of linear interpola-
tion if the ROIC ranges between these values. In case the
annual ROIC target achievement level in the third year of a
performance period is equal or higher than the ROIC target
achievement level in each of the two previous years of such
performance period, the ROIC target achievement level of the
third year is deemed to be achieved for all years of the respec-
tive performance period.
The achievement level for each of the three performance
targets will be weighted annually at one-third to determine
the yearly target achievement for each year of the three-year
performance period. The level of overall target achievement
over the three-year performance period will then be deter-
mined on the basis of the mean of these three average yearly
target achievements. The overall target achievement can be
in a range of 0% to 200%.
The number of performance shares granted to the plan
participants at the beginning of the performance period will
each be multiplied by the level of overall target achievement
in order to determine the final number of performance shares.
The final number of performance shares is generally
deemed earned four years after the day of a respective grant
(the vesting period). The number of such vested performance
shares is then multiplied by the average FMC-AG & Co. KGaA
share price over a period of 30 days prior to the lapse of this
four-year vesting period. The respective resulting amount will
then be paid to the plan participants as cash compensation.
Fresenius Medical Care AG & Co. KGaA Long-Term Incentive Program 2011On May 12, 2011, the Fresenius Medical Care AG & Co. KGaA
Stock Option Plan 2011 (2011 SOP) was established by reso-
lution of Fresenius Medical Care AG & Co. KGaA’s (FMC-AG &
Co. KGaA) Annual General Meeting. The 2011 SOP, together
with the Phantom Stock Plan 2011, which was established
by resolution of FMC Management AG’s Management and
Supervisory Boards, forms FMC-AG & Co. KGaA’s Long-Term
Incentive Program 2011 (LTIP 2011). Under the LTIP 2011,
participants were granted awards, which consisted of a com-
bination of stock options and phantom stocks. The final grant
under the LTIP 2011 was made in December 2015. Awards
under the LTIP 2011 are subject to a four-year vesting period.
Vesting of the awards granted is subject to achievement of pre-
defined performance targets. The 2011 SOP was established
with a conditional capi tal increase up to € 12 million subject
to the issue of up to 12 million non-par value bearer ordinary
shares with a nominal value of € 1.00, each of which can be
exercised to obtain one ordinary share.
Stock options granted under the LTIP 2011 have an eight-
year term and can be exercised for the first time after a four-
year vesting period. The exercise price of stock options granted
under the LTIP 2011 shall be the average stock exchange price
on the Frankfurt Stock Exchange of FMC-AG & Co. KGaA’s
shares during the 30 calendar days immediately prior to each
grant date. Stock options granted under the LTIP 2011 to U.S.
participants are non-qualified stock options under the United
States Internal Revenue Code of 1986, as amended. Stock
options under the LTIP 2011 are not transferable by a partici-
pant or a participant’s heirs, and may not be pledged, assigned,
or disposed of otherwise.
Phantom stock awards under the LTIP 2011 entitle the
holders to receive payment in euro from FMC-AG & Co. KGaA
upon exercise of the phantom stock. The payment per phan-
tom share in lieu of the issuance of such stock shall be based
upon the share price on the Frankfurt Stock Exchange of one
of FMC-AG & Co. KGaA’s shares on the exercise date. Phan-
tom stock awards have a five-year term and can be exercised
for the first time after a four-year vesting period. For partici-
pants who are U.S. tax payers, the phantom stock is deemed
to be exercised in any event in the month of March following
the end of the vesting period.
Transactions during 2018During 2018, under the LTIP 2016, FMC-AG & Co. KGaA
awarded 632,804 performance shares, including 73,315 per-
formance shares awarded to the members of the Manage-
ment Board of FMC Management AG at a measurement date
weighted-average fair value of € 51.99 each and a total fair
value of € 33 million, which will be revalued if the fair value
changes. The total fair value will be amortized over the four-
year vesting period.

Consolidated Financial Statements258
Financial S
tatements
During 2018, FMC-AG & Co. KGaA received cash of € 44 mil-
lion from the exercise of stock options. The intrinsic value
of stock options exercised in 2018 was € 29 million. In connec-
tion with cash-settled share-based payment trans actions
under the LTIP 2011 and the LTIP 2016, FMC-AG & Co. KGaA
recognized compensation expense of - € 5 million (income)
and € 60 million for the years ending December 31, 2018 and
2017, respectively.
At December 31, 2018, the Management Board mem-
bers of FMC Management AG held 602,389 stock options and
employees of FMC-AG & Co. KGaA held 3,294,189 stock
options under the various stock-based compensation plans of
Fresenius Medical Care.
At December 31, 2018, the Management Board mem-
bers of FMC Management AG held 54,711 phantom stocks
and employees of FMC-AG & Co. KGaA held 581,816 phantom
stocks under the LTIP 2011.
At December 31, 2018, the Management Board members
of FMC Management AG held 204,693 performance shares
and employees of FMC-AG & Co. KGaA held 1,570,813 perfor-
mance shares under the LTIP 2016.
The table below provides reconciliations for options outstanding at December 31, 2018
as compared to December 31, 2017:
Number of options in thousands
Weighted-average exercise price
in €
Balance at December 31, 2017 (options for ordinary shares) 4,827 65.67
Exercised 859 50.67
Forfeited 72 72.45
Balance at December 31, 2018 (options for ordinary shares) 3,896 68.85
At December 31, 2018, total unrecognized compensation
cost related to non-vested options granted under all plans was
€ 3 million. This cost is expected to be recognized over a
weighted-average period of one year.
35. RELATED PARTY TRANSACTIONSUntil December 31, 2017, Dr. Dieter Schenk, deputy chair-
man of the Supervisory Board of Fresenius Management SE,
was a partner in the international law firm Noerr LLP, which
provides legal services to the Fresenius Group. In 2017,
after discussion and approval of each mandate by the Super-
visory Board of Fresenius Management SE, the Fresenius
Group paid about € 2.9 million to this law firm for legal ser-
vices rendered.
In 2018, € 12 million (2017: € 13 million) were paid to
Fresenius Management SE as compensation for the Manage-
ment Board and the Supervisory Board, general partners’ fees
and other reimbursements of out-of pocket expenses. At
December 31, 2018, there were outstanding liabilities payable
to Fresenius Management SE in the amount of € 38 million
(December 31, 2017: € 40 million), consisting mainly of pen-
sion obligations and Management Board compensation.
The aforementioned payments are net amounts. In addition,
VAT and insurance tax were paid.
Fresenius Medical Care has entered into exclusive supply
agreements to purchase certain pharmaceuticals from its
equity method investee Vifor Fresenius Medical Care Renal
Pharma Ltd. Under the terms of a certain unconditional pur-
chase agreement, Fresenius Medical Care is obligated to
purchase approximately € 2.2 billion of pharmaceuticals, of
which € 305 million is committed at December 31, 2018 for
2019. The term of this agreement runs until 2025.
36. SUBSEQUENT EVENTSThere have been no significant changes in the Fresenius
Group’s operating environment following the end of the fiscal
year 2018 until February 19, 2019. No other events of mate-
rial importance on the assets and liabilities, financial position,
and results of operations of the Group have occurred follow-
ing the end of the fiscal year.
259
Fin
anci
al S
tate
men
ts
Consolidated Financial Statements Notes in accordance with the German Commercial Code (HGB)
NOTES IN ACCORDANCE WITH THE
GERMAN COMMERCIAL CODE (HGB)
37. COMPENSATION OF THE MANAGEMENT BOARD AND THE SUPERVISORY BOARDIndividualized information regarding the compensation of the
members of the Management Board and of the Supervisory
Board is disclosed in the audited Compensation Report (see
page 146 ff.), which is part of the Group Management Report.
The compensation of the Management Board is, as a whole,
performance-based and geared towards promoting sustain-
able corporate development. It is composed of three elements:
▶ non-performance-based compensation
(fixed compen sation and fringe benefits)
▶ short-term performance-based compensation
(one-year variable compensation (bonus))
▶ components with long-term incentive effects
(multi-year variable compensation comprising
performance shares and postponed payments
of the one-year variable compensation / of the bonus)
The cash compensation paid to the Management Board for
the performance of its responsibilities was € 15,760 thousand
(2017: € 14,378 thousand). Thereof, € 6,051 thousand (2017:
€ 5,407 thousand) is not performance-based and € 9,709 thou-
sand (2017: € 8,971 thousand) is performance-based. The
amount of the performance-based compensation depends
on the achievement of targets relating to the net income of
the Fresenius Group and business segments. As a long-term
incentive component, the members of the Management
Board received performance shares in the equivalent value
of € 11,391 thousand.
The total compensation of the Management Board was
€ 27,322 thousand (2017: € 24,664 thousand).
The total compensation paid to the Supervisory Boards of
Fresenius SE & Co. KGaA and Fresenius Management SE
and their committees was € 5,185 thousand in 2018 (2017:
€ 5,365 thousand). Of this amount, € 2,775 thousand was
fixed compensation (2017: € 226 thousand), € 160 thousand
was compensation for committees services (2017: € 100 thou-
sand), and € 2,250 thousand was variable compensation
(2017: € 5,039 thousand).
In 2018, based on pension commitments to former mem-
bers of the Management Board, € 1,101 thousand (2017:
€ 1,099 thousand) was paid. The pension obligation for these
persons amounted to € 22,319 thousand in 2018 (2017:
€ 21,848 thousand).
In the fiscal years 2018 and 2017, no loans or advance
payments of future compensation components were made
to members of the Management Board of Fresenius
Management SE.

Consolidated Financial Statements260
Financial S
tatements
38. AUDITOR’S FEESIn 2018 and 2017, fees for the auditor KPMG AG Wirtschafts prüfungsgesellschaft, Berlin (KPMG), and its affiliates
were expensed as follows:
2018 2017
€ in millions Total Germany Total Germany
Audit fees 18 7 19 7
Audit-related fees 3 3 2 2
Tax consulting fees 1 – 1 –
Other fees 2 0 2 1
Total auditor’s fees 24 10 24 10
The leading auditor has been responsible for the audit of the
consolidated financial statements since 2018.
In the fiscal year 2018, both worldwide and in Germany,
audit-related fees and other fees mainly related to the review
of quarterly financial statements and audit services in con-
nection with financing activities.
39. CORPORATE GOVERNANCEFor each consolidated stock exchange listed entity, the decla-
ration pursuant to Section 161 of the German Stock Corpo-
ration Act (Aktiengesetz) has been issued and made available
to shareholders on the website of Fresenius SE & Co. KGaA
(www.fresenius.com / corporate-governance), and of Fresenius
Medical Care AG & Co. KGaA (www.freseniusmedicalcare.com).
40. PROPOSAL FOR THE DISTRIBUTION OF EARNINGSThe general partner and the Supervisory Board of
Fresenius SE & Co. KGaA propose to the Annual General
Meeting that the earnings for 2018 of Fresenius SE &
Co. KGaA are distributed as follows:
in €
Payment of a dividend of € 0.80 per bearer ordinary share on the 556,225,154 ordinary shares entitled to dividend 444,980,123.20
Balance to be carried forward 936,346.29
Retained earnings 445,916,469.49

261
Fin
anci
al S
tate
men
ts
Consolidated Financial Statements Notes in accordance with the German Commercial Code (HGB)
Bad Homburg v. d. H., February 19, 2019
Fresenius SE & Co. KGaA,
represented by:
Fresenius Management SE, its general partner
The Management Board
S. Sturm Dr. F. De Meo R. Empey Dr. J. Götz
M. Henriksson R. Powell Dr. E. Wastler
41. RESPONSIBILITY STATEMENT“To the best of our knowledge, and in accordance with the
applicable reporting principles, the consolidated financial
statements give a true and fair view of the assets, liabilities,
financial position and profit or loss of the Group, and the
Group management report includes a fair review of the devel-
opment and performance of the business and the position of
the Group, together with a description of the principal oppor-
tunities and risks associated with the expected development
of the Group.”

262 Auditor’s Report
Auditor's R
eport
Note: This is a translation of the German original. Solely the
original text in German language is authoritative.
INDEPENDENT AUDITOR’S REPORT
To Fresenius SE & Co. KGaA, Bad Homburg v. d. Höhe
REPORT ON THE AUDIT OF THE CONSOLIDATED FINANCIAL STATEMENTS AND OF THE GROUP MANAGEMENT REPORT
OPINIONS
We have audited the consolidated financial statements of
Fresenius SE & Co. KGaA, Bad Homburg v. d. Höhe and its sub-
sidiaries (the Group), which comprise the consolidated state-
ment of financial position as at December 31, 2018, and the
consolidated statement of income, the consolidated statement
of comprehensive income, consolidated statement of changes
in equity and consolidated statement of cash flows for the
financial year from January 1, 2018 to December 31, 2018, and
notes to the consolidated financial statements, including a
summary of significant accounting policies. In addition, we
have audited the group management report of Fresenius
SE & Co. KGaA for the financial year from January 1, 2018 to
December 31, 2018.
In our opinion, on the basis of the knowledge obtained in
the audit,
▶ the accompanying consolidated financial statements com-
ply, in all material respects, with the IFRSs as adopted by
the EU, and the additional requirements of German com-
mercial law pursuant to Section 315e (1) HGB [Handels-
gesetzbuch: German Commercial Code] and, in compliance
with these requirements, give a true and fair view of the
assets, liabilities, and financial position of the Group as at
December 31, 2018, and of its financial performance for
the financial year from January 1, 2018 to December 31,
2018, and
▶ the accompanying group management report as a whole
provides an appropriate view of the Group’s position. In
all material respects, this group management report is con-
sistent with the consolidated financial statements, com-
plies with German legal requirements and appropriately
presents the opportunities and risks of future development.
Pursuant to Section 322 (3) sentence 1 HGB, we declare that
our audit has not led to any reservations relating to the legal
compliance of the consolidated financial statements and of
the group management report.
BASIS FOR THE OPINIONS
We conducted our audit of the consolidated financial state-
ments and of the group management report in accordance with
Section 317 HGB and the EU Audit Regulation No. 537 / 2014
(referred to subsequently as “EU Audit Regulation”) and in
compliance with German Generally Accepted Standards for
Financial Statement Audits promulgated by the Institut der
Wirtschaftsprüfer [Institute of Public Auditors in Germany]
(IDW). Our responsibilities under those requirements and
principles are further described in the “Auditor’s Responsibili-
ties for the Audit of the Consolidated Financial Statements
and of the Group Management Report” section of our auditor’s
report. We are independent of the group entities in accordance
with the requirements of European law and German commer-
cial and professional law, and we have fulfilled our other Ger-
man professional responsibilities in accordance with these
requirements. In addition, in accordance with Article 10 (2)
point (f) of the EU Audit Regulation, we declare that we have
not provided non-audit services prohibited under Article 5 (1)
of the EU Audit Regulation. We believe that the evidence we
have obtained is sufficient and appropriate to provide a basis
for our opinions on the consolidated financial statements and
on the group management report.
KEY AUDIT MATTERS IN THE AUDIT OF THE
CONSOLIDATED FINANCIAL STATEMENTS
Key audit matters are those matters that, in our professional
judgment, were of most significance in our audit of the con-
solidated financial statements for the financial year from
January 1, 2018 to December 31, 2018. These matters were
addressed in the context of our audit of the consolidated
financial statements as a whole, and in forming our opinion
thereon, we do not provide a separate opinion on these
matters.

263
Aud
itor
's R
epor
t
Auditor’s Report
Impairment of goodwillFor details of the accounting and valuation principles used
and the assumptions used, please refer to Note 1. IVa. Informa-
tion on the amount of goodwill can be found in Note 19 to
the consolidated financial statements.
The financial statement risk
The goodwill reported in the consolidated financial state-
ments of Fresenius SE & Co. KGaA as at December 31, 2018,
at € 25.7 billion, represents around 45% of the balance sheet
total and thus has a material significance for the net assets of
the Group.
The goodwill impairment test is complex and largely
dependent on estimates of future business performance by the
legal representatives of the company, the interest rate used
to discount future cash inflows, and other estimates. These
assumptions are inherently subject to uncertainties. There is
a risk for the consolidated financial statements that appropri-
ate impairments are not recognized.
In addition, there is a risk that the required information for
the impairment test of goodwill, provided within the notes to
the consolidated financial statements, may not be appropriate.
Our approach during the audit
When testing for impairment of goodwill, we have convinced
ourselves of the reasonableness of significant value-determin-
ing assumptions and parameters. We have assessed the ade-
quacy of the controls established by the company to ensure
that the assumptions and parameters used, including the
budget and projections, based on developments in the relevant
markets are regularly updated by the legal representatives,
and approved by the Supervisory Board. We have reconciled
the budgetary calculations underlying the Discounted Cash
Flow calculations with the budget for the years 2019 – 2021
and the mid-term planning for the following years.
Furthermore, we have convinced ourselves of the com -
pany’s previous forecasting quality by comparing plans from
previous financial years with the actual results achieved and
analyzing deviations.
We evaluated the material value assumptions and parame-
ters of the underlying discount rate (WACC) and growth rates,
using our valuation specialists taking into account market
data and tracking the underlying valuation methods. Since
even small changes in the parameters used can have a signifi-
cant impact on the valuation result, we conducted our own
sensitivity analyzes, in particular for the cash-generating units
with a tendency to be low, in order to simulate the effects of
changing individual parameters.
Finally, we assessed whether the disclosures within the
notes to the consolidated financial statements on the fair value
of goodwill are appropriate.
Our observations
The valuation method is consistent with the valuation princi-
ples to be applied. The assumptions and parameters under-
lying the valuation are in total appropriate.
The disclosures within the notes to the consolidated finan-
cial statements required for the impairment test of goodwill
are appropriate.
264
Auditor's R
eport
Auditor’s Report
Financial reporting of significant company transactions in the financial year.Please refer to the note 1 IIIa) in the notes to the consolidated
financial statements for more information on the accounting
policies applied. Disclosures on significant acquisitions and
sales of the Fresenius Group can be found in the notes to
the consolidated financial statements under note 2. For infor-
mation on the risks associated with acquisitions and divesti-
tures, please refer to the description of the financial position
(in the "Investments and acquisitions" section), as well as
the risk report (in the "Risks from acquisitions" section) in
the group management report.
The financial statement risk
On April 20, 2018 Fresenius Medical Care concluded an agree-
ment for the sale of the shares in Sound Inpatient Physicians
Holdings, LLC (“Sound”) to a consortium involving Summit
Partners L.P. The transaction proceeds less the tax payments
relating to the transaction amount to USD 1,771 million (EUR
1,531 million). Closing of the transaction was on June 28,
2018. The pre-tax income resulting from this combined with
the income from other disposals is presented in the conso-
lidated statement of income in the item “(Gain) loss related to
divestiture of Care Coordination activities”.
The calculation of the gain on disposal is of a complex
nature. Furthermore, the disclosure requirements in the
notes to the consolidated financial statements in respect of
the transaction are complex.
There is a risk for the consolidated financial statements
that the assets and liabilities sold were not appropriately iden-
tified as such and thus the gain on disposal presented in the
consolidated statement of income is incorrect. As regards
the explanatory disclosures on the transaction in the notes to
the consolidated financial statements, there is a risk that the
explanatory notes are not sufficiently detailed and insofar not
appropriate.
On April 24, 2017, Fresenius announced the conclusion of
a merger agreement with Akorn Inc. (’Akorn’), which stipu-
lated a purchase price of USD 4.3 billion plus the net financial
liabilities existing at the time the transaction was concluded.
Fresenius decided on April 22, 2018 to terminate the merger
agreement with Akorn, due to Akorn’s failure to fulfill several
closing conditions. Following this, Akorn filed a lawsuit on
April 23, 2018, purporting to enforce the merger agreement.
Fresenius filed a counterclaim on April 30, 2018. On Decem-
ber 7, 2018, Akorn’s lawsuit against Fresenius to enforce the
merger agreement was dismissed by the Delaware Supreme
Court in the final instance.
The explanatory disclosures in the notes to the consolida-
ted financial statements and the group management report
on the planned merger agreement with Akorn, which was ter-
minated in financial year 2018, are complex. There is a risk
that the explanations are not appropriate.
Our approach during the audit
With regard to the sale of Sound we initially assessed whether
the outgoing assets and liabilities were correctly determined.
This also included a review of the related group entries. We
verified the determination of the gain on disposal and assessed
whether this determination is appropriate in respect of the
requirements of IFRS 10.
We assessed whether the explanatory notes in the notes to
the consolidated financial statements concerning the trans-
action were sufficiently detailed and appropriate.
We assessed whether the explanatory notes in the notes to
the consolidated financial statements and the group man-
agement report on the planned merger agreement with Akorn,
which was terminated in financial year 2018, are appropriate.
Our observations
The determination of the sold assets and liabilities and of the
gain on disposal and the related consolidation entries related
to the sale of Sound is appropriate as a whole and consistent
with the requirements to be applied.
The explanatory notes in the notes to the consolidated
financial statements concerning the sale of Sound are suffi-
ciently detailed and appropriate.
The disclosures in the notes to the consolidated financial
statements and the group management report on the planned
merger agreement with Akorn, which was terminated in
financial year 2018, are appropriate.

265
Aud
itor
's R
epor
t
Auditor’s Report
Measurement of the provision relating to the U.S. Foreign Corrupt Practices Act investigationsPlease refer to note 1 IIIs) to the consolidated financial state-
ments for information on the accounting policies applied.
For the provision please refer to the note 20 to the consolidated
financial statements. Explanatory notes on the proceedings
and investigations can be found in note 29 to the consolidated
financial statements and in the group management report in
the section “Legal risks”.
The financial statement risk
Some aspects of the Company’s business involve competing
for contracts with customers that are directly or indirectly
related to government. This type of business and the tender
processes that typically accompany it entail risks of non-
compliance with legal requirements. The Company also oper-
ates in a number of countries where it is normal business
practice to deploy external sales representatives.
Beginning in 2012, the division Fresenius Medical Care
(FMC) received certain communications alleging conduct in
countries outside the United States that might violate the U.S.
Foreign Corrupt Practices Act (FCPA) or other anti-bribery
laws. FMC’s Supervisory Board, through its Audit & Corporate
Governance Committee, conducted investigations with the
assistance of independent counsel. In a continuing dialogue,
FMC advised the Securities and Exchange Commission and
the United States Department of Justice (collectively and inter-
changeably the “government”) about these investigations.
The government also conducted its own investigations. In the
course of this dialogue, FMC identified and reported to the
government, and took remedial actions with respect to, con-
duct that resulted in the government seeking monetary penal-
ties and other remedies against FMC and disgorgement of
related profits revolving principally around conduct in FMC’s
products business in a limited number of countries outside
the United States.
FMC reached an agreement in principle with the government
agencies encompassing the terms understood to be neces-
sary for settlement.
FMC recorded charges of EUR 200 million in 2017 and
EUR 77 million in 2018 encompassing estimates for the govern-
ment’s claims for profit disgorgement, penalties, certain
legal expenses, and other related costs or asset impairments
believed likely to be necessary for full and final resolution,
by litigation or settlement, of the claims and issues arising
from the investigation.
The increase recorded in 2018 took into consideration
preliminary understandings with the government on the finan-
cial terms of a potential settlement. Following this increase,
which takes into account incurred and anticipated legal expen-
ses, impairments and other costs, the provision totals
EUR 224 million as of December 31, 2018.
Measurement of this provision is based on estimates of
FMC’s management that require judgment. There is the risk
for the financial statements that the provision recognized
for this purpose is insufficient or excessive.
There is also the risk that the required disclosures in the
notes are not appropriate.
Our audit approach
We received regular updates on the findings of the internal
investigations and on the progress of the meetings with the
government. For this purpose, we mainly consulted the client
representatives of Global Legal and Global Compliance and
obtained information from the lawyers who had carried out the
investigation for FMC. Moreover, FMC provided us with
written confirmation of the current state of affairs.
We also held discussions with the Chairman of the Super-
visory Board of FMC, the Chairman of the Audit & Corporate
Governance Committee of FMC, members of the Management

266
Auditor's R
eport
Auditor’s Report
Board of FMC and contact persons at FMC from Corporate
Accounting, Global Compliance and Global Legal. We assessed
written correspondence with relevant authorities with the
involvement of external lawyers and evaluated underlying docu-
ments and minutes.
On the basis of this information, we assessed the assump-
tions made by FMC overall to determine the provision and
reviewed the calculation of the provision for computational
accuracy.
We also assessed the appropriateness of the disclosures in
the notes relating to the matter.
Our observations
The provision amount has been accurately calculated and the
assumptions of FMC underlying this calculation are appro-
priate.
The required disclosures in the notes are appropriate.
OTHER INFORMATION
Management is responsible for the other information. The
Other information includes the other parts of the annual report,
with the exception of the audited consolidated financial
statements and the group management report as well as our
auditor’s report.
Our opinions on the consolidated financial statements and
on the group management report do not cover the other
information, and consequently we do not express an opinion
or any other form of assurance conclusion thereon.
In connection with our audit, our responsibility is to read
the other information and, in so doing, to consider whether
the other information
▶ is materially inconsistent with the consolidated financial
statements, with the group management report or our
knowledge obtained in the audit, or
▶ otherwise appears to be materially misstated.
In accordance with our engagement, we conducted a separate
assurance engagement of the separate Group non-financial
report. Please refer to our assurance report dated February 19,
2019, for information on the nature, scope and findings of
this assurance engagement.
RESPONSIBILITIES OF MANAGEMENT AND THE
SUPERVISORY BOARD FOR THE CONSOLIDATED
FINANCIAL STATEMENTS AND THE GROUP
MANAGEMENT REPORT
Management is responsible for the preparation of the con-
solidated financial statements that comply, in all material
respects, with IFRSs as adopted by the EU and the additional
requirements of German commercial law pursuant to Section
315e (1) HGB and that the consolidated financial statements,
in compliance with these requirements, give a true and fair
view of the assets, liabilities, financial position, and financial
performance of the Group. In addition, management is respon-
sible for such internal control as they have determined neces-
sary to enable the preparation of consolidated financial state-
ments that are free from material misstatement, whether due
to fraud or error.
In preparing the consolidated financial statements, man-
agement is responsible for assessing the Group’s ability to con-
tinue as a going concern. They also have the responsibility for
disclosing, as applicable, matters related to going concern.

267
Aud
itor
's R
epor
t
Auditor’s Report
In addition, they are responsible for financial reporting based
on the going concern basis of accounting unless there is an
intention to liquidate the Group or to cease operations, or there
is no realistic alternative but to do so.
Furthermore, management is responsible for the prepa-
ration of the group management report that, as a whole, pro-
vides an appropriate view of the Group’s position and is, in
all material respects, consistent with the consolidated finan-
cial statements, complies with German legal requirements,
and appropriately presents the opportunities and risks of
future development. In addition, management is responsible
for such arrangements and measures (systems) as they have
considered necessary to enable the preparation of a group
management report that is in accordance with the applicable
German legal requirements, and to be able to provide suffi-
cient appropriate evidence for the assertions in the group
management report.
The supervisory board is responsible for overseeing the
Group’s financial reporting process for the preparation of the
consolidated financial statements and of the group manage-
ment report.
AUDITOR’S RESPONSIBILITIES FOR THE AUDIT
OF THE CONSOLIDATED FINANCIAL STATEMENTS
AND OF THE GROUP MANAGEMENT REPORT
Our objectives are to obtain reasonable assurance about
whether the consolidated financial statements as a whole are
free from material misstatement, whether due to fraud or
error, and whether the group management report as a whole
provides an appropriate view of the Group’s position and, in
all material respects, is consistent with the consolidated finan-
cial statements and the knowledge obtained in the audit,
complies with the German legal requirements and appropri-
ately presents the opportunities and risks of future develop-
ment, as well as to issue an auditor’s report that includes our
opinions on the consolidated financial statements and on
the group management report.
Reasonable assurance is a high level of assurance, but is not a
guarantee that an audit conducted in accordance with Sec-
tion 317 HGB and the EU Audit Regulation and in compliance
with German Generally Accepted Standards for Financial
Statement Audits promulgated by the Institut der Wirt schafts-
prüfer (IDW) will always detect a material misstatement.
Misstatements can arise from fraud or error and are considered
material if, individually or in the aggregate, they could rea-
sonably be expected to influence the economic decisions of
users taken on the basis of these consolidated financial
statements and this group management report.
We exercise professional judgment and maintain profes-
sional skepticism throughout the audit. We also:
▶ Identify and assess the risks of material misstatement of
the consolidated financial statements and of the group
management report, whether due to fraud or error, design
and perform audit procedures responsive to those risks,
and obtain audit evidence that is sufficient and appropri-
ate to provide a basis for our opinions. The risk of not
detecting a material misstatement resulting from fraud is
higher than for one resulting from error, as fraud may
involve collusion, forgery, intentional omissions, misrep-
resentations, or the override of internal controls.

268
Auditor's R
eport
Auditor’s Report
▶ Obtain an understanding of internal control relevant to
the audit of the consolidated financial statements and of
arrangements and measures (systems) relevant to the audit
of the group management report in order to design audit
procedures that are appropriate in the circumstances, but
not for the purpose of expressing an opinion on the effec-
tiveness of these systems.
▶ Evaluate the appropriateness of accounting policies used
by management and the reasonableness of estimates
made by management and related disclosures.
▶ Conclude on the appropriateness of management’s use of
the going concern basis of accounting and, based on the
audit evidence obtained, whether a material uncertainty
exists related to events or conditions that may cast signif-
icant doubt on the Group’s ability to continue as a going
concern. If we conclude that a material uncertainty exists,
we are required to draw attention in the auditor’s report to
the related disclosures in the consolidated financial state-
ments and in the group management report or, if such
disclosures are inadequate, to modify our respective opin-
ions. Our conclusions are based on the audit evidence
obtained up to the date of our auditor’s report. However,
future events or conditions may cause the Group to
cease to be able to continue as a going concern.
▶ Evaluate the overall presentation, structure and content
of the consolidated financial statements, including the
disclosures, and whether the consolidated financial state-
ments present the underlying transactions and events in
a manner that the consolidated financial statements give
a true and fair view of the assets, liabilities, financial posi-
tion and financial performance of the Group in compli-
ance with IFRSs as adopted by the EU and the additional
requirements of German commercial law pursuant to
Section 315e (1) HGB.
▶ Obtain sufficient appropriate audit evidence regarding
the financial information of the entities or business activi-
ties within the Group to express opinions on the consoli-
dated financial statements and on the group management
report. We are responsible for the direction, supervision
and performance of the group audit. We remain solely
responsible for our opinions.
▶ Evaluate the consistency of the group management report
with the consolidated financial statements, its conformity
with [German] law, and the view of the Group’s position it
provides.
▶ Perform audit procedures on the prospective information
presented by management in the group management
report. On the basis of sufficient appropriate audit evidence
we evaluate, in particular, the significant assumptions
used by management as a basis for the prospective infor-
mation, and evaluate the proper derivation of the pro-
spective information from these assumptions. We do not
express a separate opinion on the prospective information
and on the assumptions used as a basis. There is a sub-
stantial unavoidable risk that future events will differ mate-
rially from the prospective information.
269
Aud
itor
's R
epor
t
Auditor’s Report
We communicate with those charged with governance regard-
ing, among other matters, the planned scope and timing of
the audit and significant audit findings, including any signifi-
cant deficiencies in internal control that we identify during
our audit.
We also provide those charged with governance with a
statement that we have complied with the relevant indepen-
dence requirements, and communicate with them all relation-
ships and other matters that may reasonably be thought to
bear on our independence, and where applicable, the related
safeguards.
From the matters communicated with those charged
with governance, we determine those matters that were of
most significance in the audit of the consolidated financial
statements of the current period and are therefore the key
audit matters. We describe these matters in our auditor’s
report unless law or regulation precludes public disclosure
about the matter.
OTHER LEGAL AND REGULATORY REQUIREMENTS
FURTHER INFORMATION PURSUANT TO
ARTICLE 10 OF THE EU AUDIT REGULATION
We were elected as Group auditors by the Annual General
Meeting on May 18, 2018. We were engaged by the Super-
visory Board on December 6, 2018. We have been working
continuously for more than 25 years for Fresenius SE & Co.
KGaA and its legal predecessor as Group auditors.
We declare that the opinions expressed in this auditor’s
report are consistent with the additional report to the audit
committee pursuant to Article 11 of the EU Audit Regulation
(long-form audit report).
GERMAN PUBLIC AUDITOR RESPONSIBLE FOR THE ENGAGEMENTThe German Public Auditor responsible for the engagement
is Thomas Rodemer.
Frankfurt am Main, February 19, 2019
KPMG AG
Wirtschaftsprüfungsgesellschaft
[Original German version signed by:]
Rodemer Walter
Wirtschaftsprüfer Wirtschaftsprüfer
[German Public Auditor] [German Public Auditor]
Boards
Boards270
SUPERVISORY BOARD FRESENIUS SE & CO. KGAA
Dr. Gerd Krick
Chairman of the Supervisory Board of
Fresenius SE & Co. KGaA
Chair
Statutory supervisory boardsFresenius Group mandateFresenius Management SE (Chair)Fresenius Medical Care AG & Co. KGaA 1 (until May 17, 2018; Chair)Fresenius Medical Care Management AG
Comparable German or foreign supervisory bodiesFresenius Group mandateVAMED AG, Austria (Chair)
Prof. Dr. med. D. Michael Albrecht
Medical Director and Spokesman of the
Management Board of the Universitäts
klinikum Carl Gustav Carus Dresden
Statutory supervisory boardsDresden International University (DIU)GÖK Consulting AGUniversitätsklinikum Aachen
Bernd Behlert (since Sept. 1, 2018)
Fulltime Works Council Member
Helios VogtlandKlinikum Plauen
GmbH
Statutory supervisory boardsFresenius Group mandateHelios VogtlandKlinikum Plauen GmbH
Michael Diekmann
Member of various Supervisory Boards
Deputy Chair
Statutory supervisory boardsAllianz SE 1 (Chair)BASF SE 1 (Deputy Chair)Fresenius Management SE (Fresenius Group mandate)Siemens AG 1
Konrad Kölbl
Fulltime Works Council Member
VAMEDKMB Krankenhausmanage
ment und Betriebsführungs ges. m.b.H.
Comparable German or foreign supervisory bodiesFresenius Group mandateVAMEDKMB Krankenhausmanagement und Betriebsführungsges. m.b.H., Austria
Stefanie Lang
Fulltime Works Council Member
Fresenius Medical Care Deutschland
GmbH
Frauke Lehmann
Fulltime Works Council Member
Helios Kliniken Schwerin GmbH
Statutory supervisory boardsFresenius Group mandateHelios Kliniken Schwerin GmbH (Deputy Chair)
Prof. Dr. med. Iris Löw-Friedrich
Chief Medical Officer and Executive
Vice President, Head of Development
and Medical Patient Value Practices,
UCB S.A.
Statutory supervisory boardsEvotec AG 1
Klaus-Peter Müller
Honorary Chairman of the Supervisory
Board of Commerzbank AG
Statutory supervisory boardsCommerzbank AG (until May 8, 2018; Chair)Fresenius Management SE (Fresenius Group mandate)
Comparable German or foreign supervisory bodiesParker Hannifin Corporation, USA 1
(until October 24, 2018)
Oscar Romero de Paco
Production staff member
Fresenius Kabi España S.A.U.
BOARDS
1 Stock listed company

Boa
rds
Boards 271
SUPERVISORY BOARD FRESENIUS SE & CO. KGAA
Hauke Stars
Member of the Executive Board
Deutsche Börse AG
Statutory supervisory boardsEurex Frankfurt AG (Deutsche Börse AG Group mandate)
Comparable German or foreign supervisory bodiesClearstream International S.A. (Deutsche Börse AG Group mandate)Eurex Zürich AG (Deutsche Börse AG Group mandate)Kühne + Nagel International AG 1
Rainer Stein (until August 31, 2018)
Fulltime Works Council Member
Helios Klinikum BerlinBuch GmbH
(until August 31, 2018)
Statutory supervisory boardsFresenius Group mandateHelios Klinikum BerlinBuch GmbH (until August 31, 2018)
Niko Stumpfögger
Secretary of the Trade Union ver.di,
Head of Company and Industry Politics
in Health Care and Social Affairs
Deputy Chair
Nomination Committee
Dr. Gerd Krick (Chair)
Michael Diekmann
KlausPeter Müller
Audit Committee
KlausPeter Müller (Chair)
Konrad Kölbl
Dr. Gerd Krick
Hauke Stars
Rainer Stein (until Aug. 31, 2018)
Niko Stumpfögger (as of Sept. 1, 2018)
Joint Committee 2
Dr. Dieter Schenk (Chair)
Michael Diekmann
Dr. Gerd Krick
Dr. Karl Schneider
COMMITTEES OF THE SUPERVISORY BOARD
1 Stock listed company 2 The committee consists equally of two members each of the Supervisory Board of Fresenius SE & Co. KGaA and of Fresenius Management SE.
Boards
Boards272
Stephan Sturm
Chairman
Statutory supervisory boardsDeutsche Lufthansa AG 1
Fresenius Group mandateFresenius Kabi AG (Chair)Fresenius Medical Care Management AG (Chair)
Comparable German or foreign supervisory bodiesFresenius Group mandateVAMED AG, Austria (Deputy Chair)
Dr. Francesco De Meo
Business Segment Fresenius Helios
Statutory supervisory boardsFresenius Group mandateHelios Beteiligungs AG (until June 15, 2018; Chair)Helios Kliniken Schwerin GmbH (until May 8, 2018; Chair)
Rachel Empey
Chief Financial Officer
Statutory supervisory boardsFresenius Group mandateFresenius Kabi AG (Deputy Chair)Fresenius Medical Care Management AG
Comparable German or foreign supervisory bodiesInchcape plc 1 (NonExecutive Director)
Dr. Jürgen Götz
Chief Legal and Compliance Officer,
and Labor Relations Director
Mats Henriksson
Business Segment Fresenius Kabi
Comparable German or foreign supervisory bodiesFresenius Group mandateFenwal, Inc., USAFHC (Holdings) Ltd., Great Britain Fresenius Kabi, LLC, USAFresenius Kabi Austria GmbH, Austria (Chair)Fresenius Kabi España S.A.U., Spain Fresenius Kabi Pharmaceuticals Holding, Inc., USA Fresenius Kabi SinoSwed Pharmaceutical Corp. Ltd., China (until November 1, 2018)Fresenius Kabi USA, Inc., USA Labesfal – Laboratórios Almiro, S.A., Portugal Quercus Acquisition, Inc., USA
Rice Powell
Business Segment
Fresenius Medical Care
Comparable German or foreign supervisory bodiesFresenius Group mandateFresenius Medical Care Holdings, Inc., USA (Chair)Vifor Fresenius Medical Care Renal Pharma Ltd., Switzerland 1 (Vice Chair)
Dr. Ernst Wastler
Business Segment Fresenius Vamed
Statutory supervisory boardsFresenius Group mandateCharité CFM Facility Management GmbH (Deputy Chair)
Comparable German or foreign supervisory bodiesFresenius Group mandateVAMEDKMB Krankenhausmanagement und Betriebsführungsges. m.b.H., Austria (Chair)
MANAGEMENT BOARD FRESENIUS MANAGEMENT SE(General partner of Fresenius SE & Co. KGaA)
1 Stock listed company

Boa
rds
Boards 273
Dr. Gerd Krick
Chairman of the Supervisory Board of
Fresenius SE & Co. KGaA
Chair
Statutory supervisory boardsFresenius Group mandateFresenius SE & Co. KGaA 1 (Chair)Fresenius Medical Care AG & Co. KGaA 1 (until May 17, 2018; Chair)Fresenius Medical Care Management AG
Comparable German or foreign supervisory bodiesFresenius Group mandateVAMED AG, Austria (Chair)
Dr. Kurt Bock
Former Chief Executive Officer
BASF SE
Statutory supervisory boardsBMW Group 1 (since May 17, 2018)Münchener RückversicherungsGesellschaft 1 (since April 25, 2018)
Michael Diekmann
Member of various Supervisory Boards
Statutory supervisory boardsSupervisory BoardAllianz SE 1 (Chair)BASF SE 1 (Deputy Chair)Fresenius SE & Co. KGaA 1 (Deputy Chair; Fresenius Group mandate)Siemens AG 1
Klaus-Peter Müller
Honorary Chairman of the Supervisory
Board of Commerzbank AG
Statutory supervisory boardsCommerzbank AG (until May 8, 2018; Chair)Fresenius SE & Co. KGaA 1 (Fresenius Group mandate)
Comparable German or foreign supervisory bodiesParker Hannifin Corporation, USA 1
(until October 24, 2018)
Dr. Dieter Schenk
Lawyer and Tax Consultant
Deputy Chair
Statutory supervisory boardsBank Schilling & Co. AG (Chair) Fresenius Medical Care AG & Co. KGaA 1 (Chair; Deputy Chair until May 17, 2018; Fresenius Group mandate)Fresenius Medical Care Management AG (Deputy Chair; (Fresenius Group mandate)Gabor Shoes AG (Chair)TOPTICA Photonics AG (Chair)
Foundation BoardElse KrönerFreseniusStiftung (Chair)
Dr. Karl Schneider
Former Spokesman of Südzucker AG
Foundation BoardElse KrönerFreseniusStiftung (Deputy Chair)
SUPERVISORY BOARD FRESENIUS MANAGEMENT SE(General partner of Fresenius SE & Co. KGaA)
1 Stock listed company

274 Glossary
Glossary
Health care terms / Products and services
Administrative data Data transmitted to sickness funds as part of the billing process or to federal agencies like the German Federal Statistical Office due to legal requirements. In Germany, this includes information about coded diagnoses and procedures.
ApheresisA medical technology in which the blood of a person is passed through a device that separates out one particular blood component and returns the remainder to the circulation. This technology is used for the collection of various blood components by donors, as well as for therapeutic applications for patients.
BiosimilarsA biosimilar is a drug that is “similar” to another biologic drug already approved.
Blood volume substitutesThey are used for the temporary stabilization and / or maintenance of blood volume, for example, in the event of major blood loss.
Catalog effectChange in severity applied to own case number portfolio.
DialysisForm of renal replacement therapy where a semipermeable membrane – in peritoneal dialysis the peritoneum of the patient, in hemodialysis the membrane of the dialyzer – is used to clean a patient’s blood.
Dialysis machineThe hemodialysis process is controlled by a dialysis machine, which pumps blood, adds anticoagulants, regulates the cleansing process, and controls the mixture of dialysate and its flow rate through the system.
Dialysis solution / Dialysate Fluid used in the process of dialysis in order to remove the filtered out substances and excess water from the blood.
Dialyzer Special filter used in hemodialysis for removing toxic substances, waste products of metabolic processes, and excess water from the blood. The dialyzer is sometimes referred to as the “artificial kidney”.
Enteral nutrition Application of liquid nutrition as a tube or sip feed via the gastrointestinal tract.
EPO (Erythropoietin) Hormone that stimulates red blood cell production. Recombinant (i. e., artificially produced) human EPO is commonly prescribed to patients on dialysis who suffer from anemia.
FDA (U.S. Food & Drug Administration)Official authority for food observation and drug registration in the United States.
HD (Hemodialysis) A treatment method for dialysis patients where the blood of the patient is cleansed by a dialyzer. The solute exchange between blood and dialysate is dominated by diffusive processes.
GLOSSARY
275
Glo
ssar
y
Glossary
Health care terms / Products and services
HemoglobinComponent of red blood cells that transports oxygen around the body. An insufficient level of hemoglobin is indicative of anemia, which typically occurs in patients with chronic kidney failure. Besides dialysis, anemia is treated with iron supplements and the hormone compound erythropoietin (EPO).
Medicare / MedicaidA program developed by the federal U.S. Social Security Administration that reimburses health insurance companies and providers of medical services for medical care to individuals over 65, people with chronic kidney failure, or the disabled.
Outpatient clinic Interdisciplinary facility for outpatient care, managed by physicians. The responsible body of a medical care center includes all service providers (such as physicians, pharmacists, health care facilities), which are authorized to treat patients with statutory health insurance.
Parenteral nutrition Application of nutrients directly into the bloodstream of the patient (intravenously). This is necessary if the condition of a patient does not allow them to absorb and metabolize essential nutrients orally or as sip and tube feed in a sufficient quantity.
PD (Peritoneal dialysis) Dialysis treatment method using the patient’s peritoneum as a filter to cleanse their blood.
Prevalence Number of all patients who suffer from a specific disease within a defined period. The prevalence rate indicates the number of people with this specific disease (e.g., terminal kidney failure) treated per million population.
PPP (public-private partnership model) Publicprivate partnership describes a government service or private business venture that is funded and operated through a partnership of government and one or more privatesector companies. In most cases, PPP accompanies a partprivatization of governmental services.
Three-chamber bag The threechamber bag contains all the macronutrients like amino acids, glucose, and lipids, as well as electrolytes, in three separate chambers. Immediately before infusion, all nutrients are mixed thoroughly within the bag simply by opening individual chambers. This reduces the risk of contamination and saves time when preparing the infusions.

276
Glossary
Glossary
Financial terms 1
After adjustmentsIn order to measure the operating performance extending over several periods, key performance measures are “adjusted“ where applicable. Adjusted measures are labelled with “after adjustments”. A reconciliation table is available within the respective quarterly or annual report and presents the composition of special items.
Before special itemsIn order to measure the operating performance extending over several periods, key performance measures are adjusted by special items, where applicable. Adjusted measures are labelled with “before special items”. A reconciliation table is available within the respective quarterly or annual report and presents the composition of special items.
Cash flow Financial key figure that shows the net balance of incoming and outgoing payments during a reporting period.
Operating cash flow Operating cash flow is a financial measure showing cash inflows from operating activities during a period. Operating cash flow is calculated by subtracting noncash income and adding noncash expenses to net income.
Cash flow from investing activities Cash flow from investing activities is a financial measure opposing payments for the acquisition or purchase of property, plant and equipment and investments versus proceeds from the sale of property, plant and equipment and investments.
Cash flow from financing activities Cash flow from financing activities is a financial measure showing how the investments of the reporting period were financed.
Cash flow from financing activities is calculated from additions to equity plus proceeds from the exercise of stock options, less dividends paid, plus proceeds from debt increase (loans, bonds, etc.), less repayments of debt, plus the change in noncontrolling interest, plus proceeds from the hedge of exchange rate effects due to corporate financing.
Cash flow before acquisitions and dividendsFresenius uses the cash flow before acquisitions and dividends as the financial measure for free cash flow. Cash flow before acquisitions and dividends is calculated by operating cash flow less investments (net). Net investments are calculated by payments for the purchase of property, plant and equipment less proceeds from the sale of property, plant and equipment.
Constant currenciesConstant currencies for income and expenses are calculated using prioryear average rates; constant currencies for assets and liabilities are calculated using the midclosing rate on the date of the respective statement of financial position.
CSR (Corporate Social Responsibility) CSR refers to the social responsibility of companies. Their operations can affect economic, social, and environmental conditions all over the world.
DSO (Days Sales Outstanding)Indicates the average number of days it takes for a receivable to be paid.
EBIT (Earnings before Interest and Taxes)EBIT does include depreciation and writeups on property, plant and equipment.
EBIT is calculated by subtracting cost of sales, selling, general and administrative expenses, and research and development expenses from sales.
EBIT marginEBIT margin is calculated as the ratio of EBIT to sales.
EBITDA (Earnings before Interest, Taxes, Depreciation and Amortization)EBITDA is calculated from EBIT by adding depreciations recognized in income and deducting writeups recognized in income, both on intangible assets as well as property, plant and equipment.
EBITDA marginEBITDA margin is calculated as the ratio of EBITDA to sales.
Net debt / EBITDA
Net debt / EBITDA is a financial measure reflecting the ability of Fresenius to fulfill its payment obligations. Net debt and EBITDA are calculated at LTM (last twelve month) average exchange rates respectively.
Calculation of net debt:Shortterm debt+ Shortterm debt from related parties+ Current portion of longterm debt and capital
lease obligations+ Current portion of Senior Notes+ Longterm debt and capital lease obligations,
less current portion+ Senior Notes, less current portion+ Convertible bonds= Debt less cash and cash equivalents= Net debt
1 Integral part of Group Management Report

277
Glo
ssar
y
Glossary
€ in millions, except for ROICDecember 31,
2018December 31,
2017December 31,
2016
Total assets 56,703 53,133 46,697
Plus: Cumulative goodwill amortization 520 501 553
Minus: Cash and cash equivalents - 2,709 1,636 1,579
Minus: Loans to related parties - 60 56 51
Minus: Deferred tax assets - 777 744 627
Minus: Accounts payable - 1,823 1,688 1,315
Minus: Accounts payable to related parties - 67 42 57
Minus: Provisions and other current liabilities 1 - 7,141 6,921 6,006
Minus: Income tax payable - 428 420 478
Invested capital 44,218 42,127 37,137
Average invested capital as of December 31, 2018 / 2017 2 42,769 43,129 36,271
Operating income 3, 4 4,547 4,783 4,291
Income tax expense 5 - 1,000 1,349 1,206
NOPAT 3, 4 3,547 3,434 3,085
ROIC in % 8.3% 8.0 % 8.5 %
1 Includes noncurrent provisions and payments outstanding for acquisition; does not include pension liabilities and noncontrolling interest subject to put provisions.2 Includes adjustments for acquisitions in the respective reporting period with a purchase price above a certain level (2018: € 808 million; 2017: € 6,993 million; 2016: € 378 million).3 Includes adjustments for acquisitions in the respective reporting period with a purchase price above a certain level (2018: € 14 million; 2017: € 47 million; 2016: € 11 million).4 Before special items5 Before book gain from US tax reform (2017)
For a detailed overview of special items and adjustments please see the reconciliation tables on pages 58 – 61.
Financial terms 1
1 Integral part of Group Management Report
RECONCILIATION OF AVERAGE OPERATING ASSETS AND ROOA
€ in millions, except for ROOADecember 31,
2018December 31,
2017December 31,
2016
Total assets 56,703 53,133 46,697
Minus: Contract liabilities - 108 0 87
Minus: Payments received on account 0 53 0
Minus: Cash held in trust - 123 183 61
Minus: Loans to related parties - 60 56 51
Minus: Deferred tax assets - 777 744 627
Minus: Accounts payable - 1,823 1,688 1,315
Minus: Accounts payable to related parties - 67 42 57
Minus: Approved subsidies due to Hospital Funding Act (“Krankenhausfinanzierungsgesetz”, KHG) - 150 175 180
Operating assets 53,595 50,192 44,319
Average operating assets as of December 31, 2018 / 2017 1 50,722 50,717 42,821
Operating income 2, 3 4,547 4,783 4,291
ROOA in % 9.0% 9.4% 10.0%
1 Includes adjustments for acquisitions in the respective reporting period with a purchase price above a certain level (2018: € 2,343 million; 2017: € 6,923 million; 2016: € 421 million).2 Includes adjustments for acquisitions in the respective reporting period with a purchase price above a certain level (2018: € 14 million; 2017: € 47 million; 2016: € 11 million).3 Before special items
For a detailed overview of special items and adjustments please see the reconciliation tables on pages 58 – 61.
RECONCILIATION OF AVERAGE INVESTED CAPITAL AND ROIC
278
Glossary
Glossary
NOPAT Net Operating Profit After Taxes (NOPAT) is calculated from operating income (EBIT), as stated in the profit and loss statement, less income taxes.
Organic growth Growth that is generated by a company’s existing businesses and not by acquisitions, divestitures, or foreign exchange impact.
ROE (Return on Equity) Measure of a corporation’s profitability revealing how much profit a company generates with the money shareholders have invested.ROE is calculated by fiscal year’s net income / total equity × 100.
ROIC (Return on Invested Capital) Calculated by: (EBIT taxes) / Invested capital.
Invested capital = total assets + accumulated amortization of goodwill deferred tax assets cash and cash equivalents trade accounts payable accruals (without pension accruals) other liabilities not bearing interest.
ROOA (Return on Operating Assets) Calculated as the ratio of EBIT to operating assets (average).
Operating assets = total assets deferred tax assets trade accounts payable cash held in trust payments received on account approved subsidies.
SOI (Scope of Inventory)
Indicates the average number of days between receiving goods as inventory and the sale of the finished product.
Calculated by: (Inventories / Costs of goods sold) × 365 days.
Working capital Current assets (including deferred assets) accruals trade accounts payable other liabilities deferred charges.
Financial terms 1
1 Integral part of Group Management Report


Imprint
Imprint280
Commercial Register: Bad Homburg v. d. H.; HRB 11852 Chairman of the Supervisory Board: Dr. Gerd Krick
General Partner: Fresenius Management SE
Registered Office and Commercial Register: Bad Homburg v. d. H.; HRB 11673 Management Board: Stephan Sturm (President and CEO), Dr. Francesco De Meo, Rachel Empey, Dr. Jürgen Götz, Mats Henriksson, Rice Powell, Dr. Ernst WastlerChairman of the Supervisory Board: Dr. Gerd Krick
The German version of this Annual Report is legally binding.The editorial closing date of this Annual Report was on March 14, 2019, and it was published on March 20, 2019. Rounding differences may occur.
The Annual Report and the financial statements of Fresenius SE & Co. KGaA are available on our website and may be obtained upon request under Investor Relations.
You will find further information and current news about our company on our website at: www.fresenius.com.
Forwardlooking statements:This Annual Report contains forwardlooking statements. These statements represent assessments that we have made on the basis of the information available to us at the time. Should the assumptions on which the statements are based not occur, or if risks should arise – as mentioned in the risk report and the SEC filings of Fresenius Medical Care AG & Co. KGaA – the actual results could differ materially from the results currently expected.
Design concept / realization: Hilger & Boie Design, Wiesbaden
Due to changes in shareholders’ preferences and environmental aspects, we have decided to make the Annual Report available exclusively as a digital version from 2018.
IMPRINT

FINANCIAL CALENDAR
Report on 1st quarter 2019 Conference call, live webcast May 2, 2019
Annual General Meeting, Frankfurt am Main, Germany May 17, 2019
Payment of dividend 1 May 22, 2019
Report on 2nd quarter 2019 Conference call, live webcast July 30, 2019
Report on 3rd quarter 2019 Conference call, live webcast October 29, 2019
1 Subject to prior approval by the Annual General Meeting
Schedule updates, information on live webcasts, and other events at www.fresenius.com/events-and-presentations
FRESENIUS SHARE / ADR
CONTACT
Ordinary share ADR
Securities identification no. 578 560 CUSIP 35804M105
Ticker symbol FRE Ticker symbol FSNUY
ISIN DE0005785604 ISIN US35804M1053
Bloomberg symbol FRE GR Structure Sponsored Level 1 ADR
Reuters symbol FREG.de Ratio 4 ADR = 1 share
Main trading location Frankfurt / Xetra Trading platform OTCQX
Corporate HeadquartersElse-Kröner-Straße 1Bad Homburg v. d. H.Germany
Postal addressFresenius SE & Co. KGaA
61346 Bad Homburg v. d. H.Germany
Contact for shareholdersInvestor RelationsTelephone: ++ 49 61 72 6 08-24 87Telefax: ++ 49 61 72 6 08-24 88E-mail: [email protected]
Contact for journalistsCorporate CommunicationsTelephone: ++ 49 61 72 6 08-23 02Telefax: ++ 49 61 72 6 08-22 94E-mail: [email protected]