Embed Size (px)
Citation preview
Conference Call – Q3/2015 Results
October 29, 2015
Page 2
Safe Harbor Statement
Conference Call – Q3/15 Results, Fresenius SE & Co. KGaA, Investor Relations © Copyright, October 29, 2015
This presentation contains forward-looking statements that are subject to various risks and uncertainties. Future results could differ materially from those described in these forward-looking statements due to certain factors, e.g. changes in business, economic and competitive conditions, regulatory reforms, results of clinical trials, foreign exchange rate fluctuations, uncertainties in litigation or investigative proceedings, and the availability of financing. Fresenius does not undertake any responsibility to update the forward-looking statements contained in this presentation.
Page 3
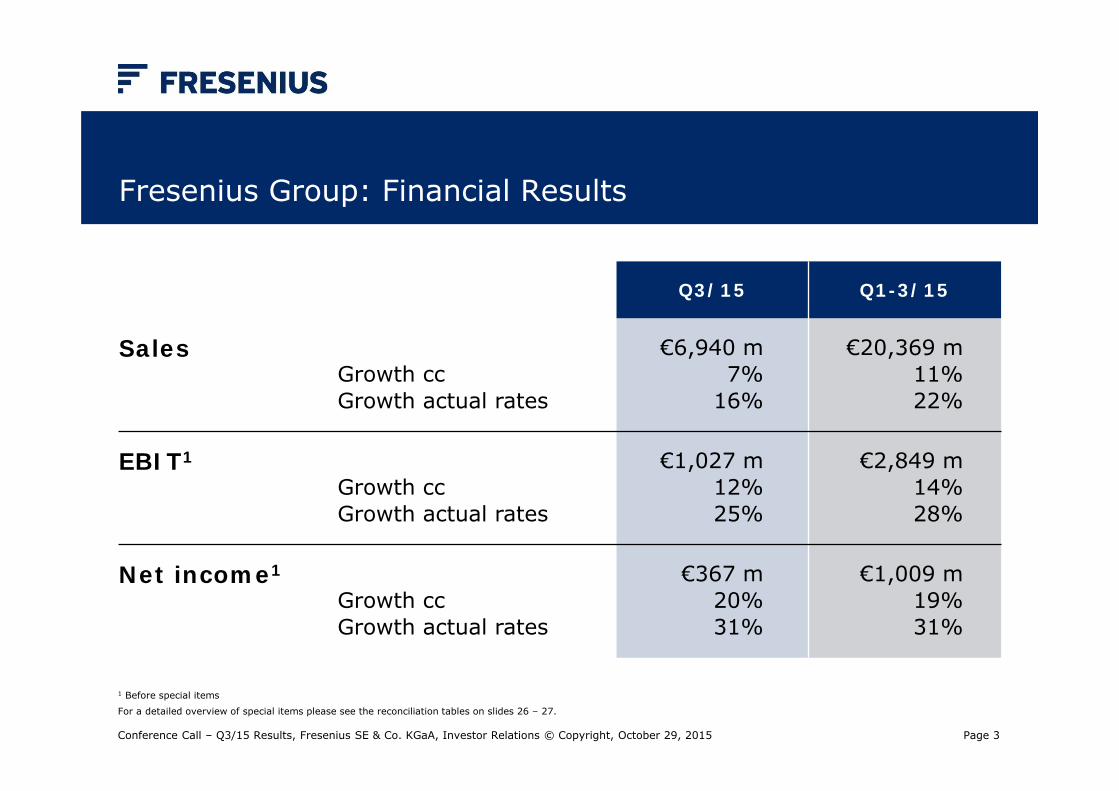
Fresenius Group: Financial Results
1 Before special items
For a detailed overview of special items please see the reconciliation tables on slides 26 – 27.
Conference Call – Q3/15 Results, Fresenius SE & Co. KGaA, Investor Relations © Copyright, October 29, 2015
Q3/15 Q1-3/15
SalesGrowth ccGrowth actual rates
€6,940 m7%
16%
€20,369 m11%22%
EBIT1
Growth ccGrowth actual rates
€1,027 m12%25%
€2,849 m14%28%
Net income1
Growth ccGrowth actual rates
€367 m20%31%
€1,009 m19%31%
Page 4
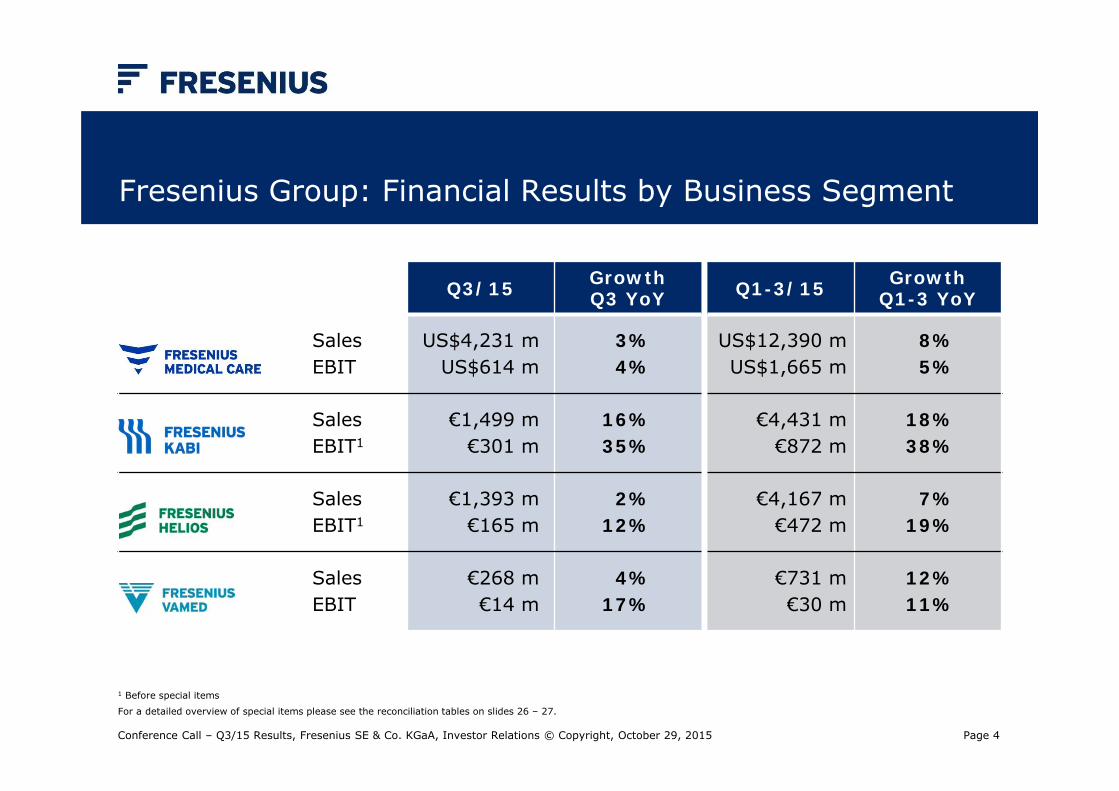
Fresenius Group: Financial Results by Business Segment
Conference Call – Q3/15 Results, Fresenius SE & Co. KGaA, Investor Relations © Copyright, October 29, 2015
Q3/15 GrowthQ3 YoY Q1-3/15 Growth
Q1-3 YoY
SalesEBIT
US$4,231 m US$614 m
3%4%
US$12,390 m US$1,665 m
8%5%
Sales EBIT1
€1,499 m€301 m
16%35%
€4,431 m€872 m
18%38%
Sales EBIT1
€1,393 m€165 m
2%12%
€4,167 m€472 m
7%19%
Sales EBIT
€268 m€14 m
4%17%
€731 m€30 m
12%11%
1 Before special items
For a detailed overview of special items please see the reconciliation tables on slides 26 – 27.
Page 5
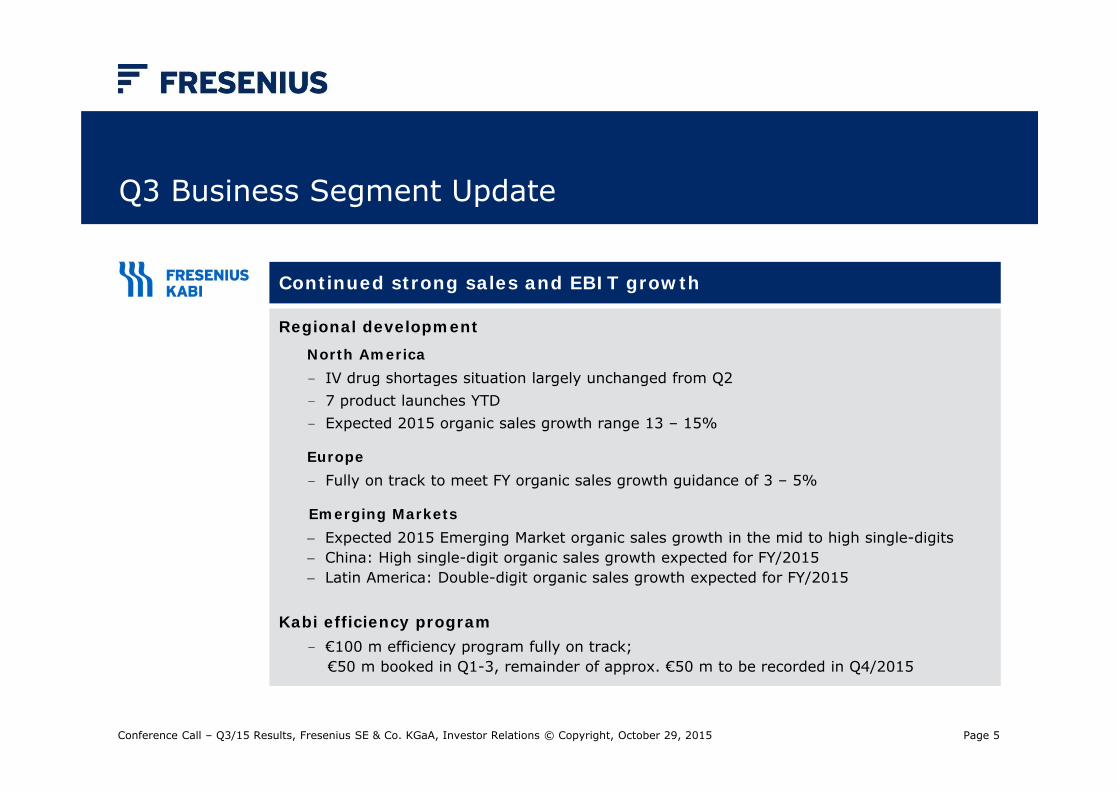
Q3 Business Segment Update
Conference Call – Q3/15 Results, Fresenius SE & Co. KGaA, Investor Relations © Copyright, October 29, 2015
Regional developmentNorth America- IV drug shortages situation largely unchanged from Q2- 7 product launches YTD- Expected 2015 organic sales growth range 13 – 15%
Europe- Fully on track to meet FY organic sales growth guidance of 3 – 5%
Emerging Markets Expected 2015 Emerging Market organic sales growth in the mid to high single-digits China: High single-digit organic sales growth expected for FY/2015 Latin America: Double-digit organic sales growth expected for FY/2015
Kabi efficiency program- €100 m efficiency program fully on track;
€50 m booked in Q1-3, remainder of approx. €50 m to be recorded in Q4/2015
Continued strong sales and EBIT growth
Page 6
Q3 Business Segment Update
Conference Call – Q3/15 Results, Fresenius SE & Co. KGaA, Investor Relations © Copyright, October 29, 2015
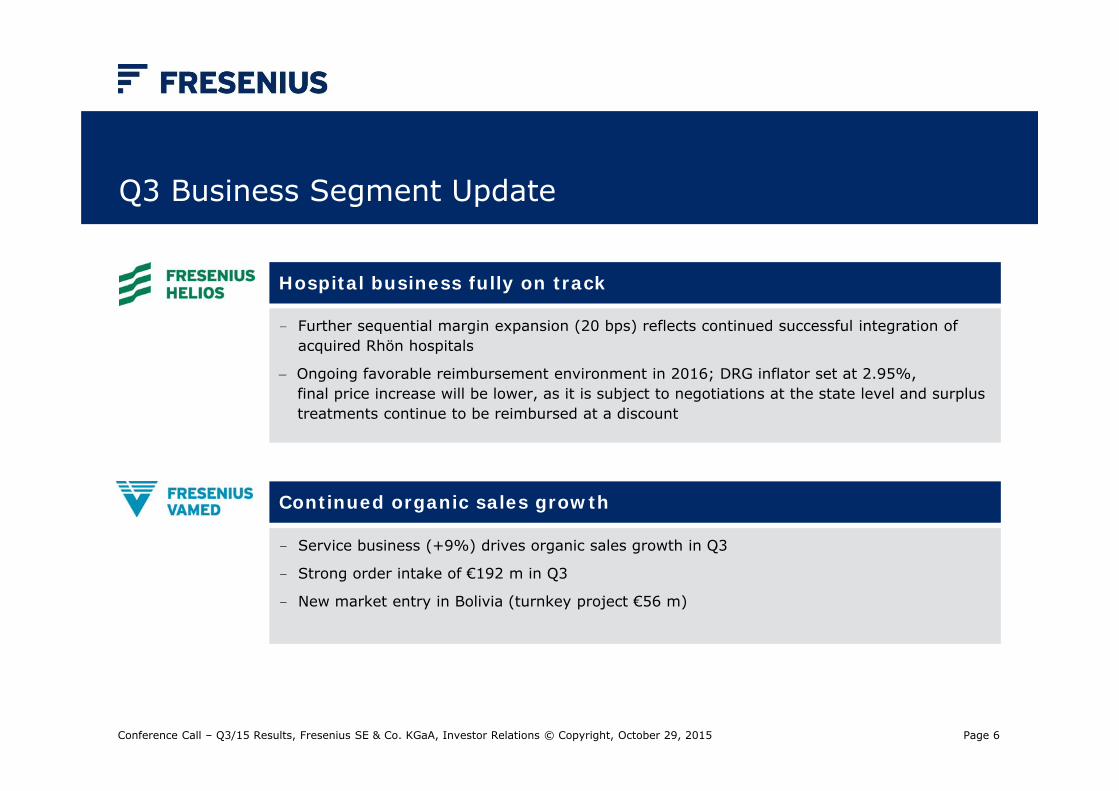
- Further sequential margin expansion (20 bps) reflects continued successful integration of acquired Rhön hospitals
Ongoing favorable reimbursement environment in 2016; DRG inflator set at 2.95%,final price increase will be lower, as it is subject to negotiations at the state level and surplus treatments continue to be reimbursed at a discount
Hospital business fully on track
- Service business (+9%) drives organic sales growth in Q3
- Strong order intake of €192 m in Q3
- New market entry in Bolivia (turnkey project €56 m)
Continued organic sales growth
Page 7
Group Financials Q3/15 − Outlook 2015
Conference Call – Q3/15 Results, Fresenius SE & Co. KGaA, Investor Relations © Copyright, October 29, 2015
Page 8
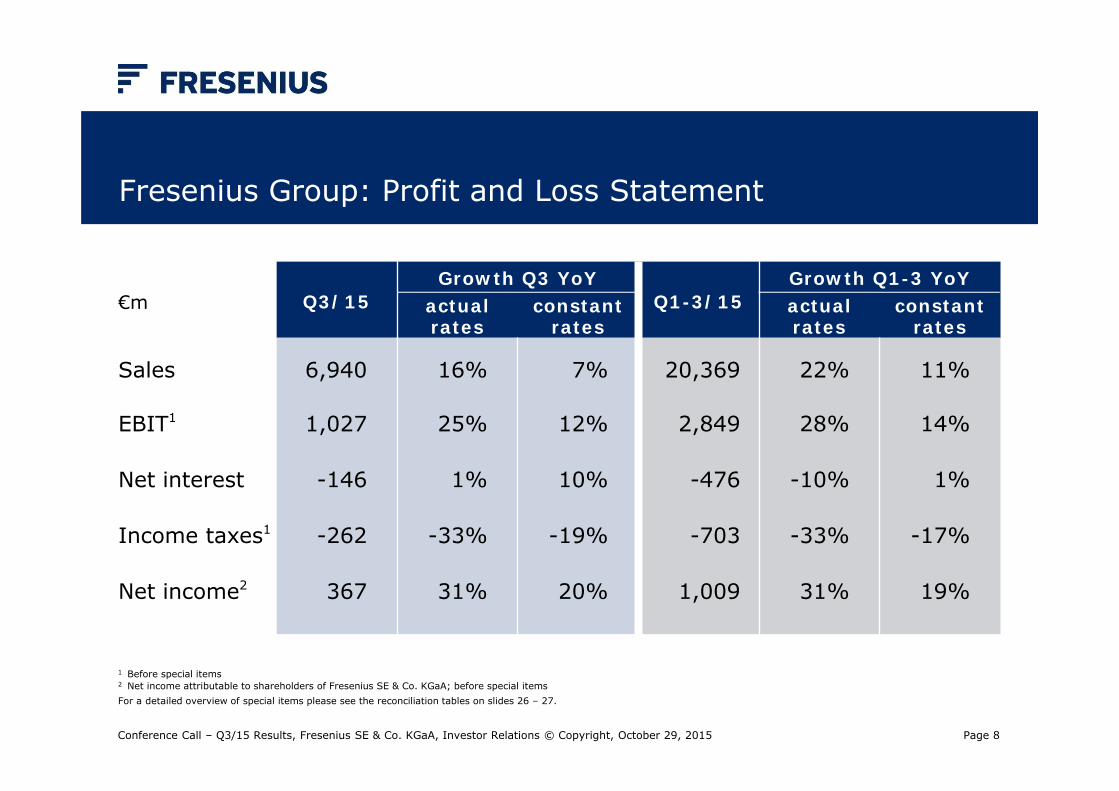
Fresenius Group: Profit and Loss Statement
Conference Call – Q3/15 Results, Fresenius SE & Co. KGaA, Investor Relations © Copyright, October 29, 2015
€m Q3/15Growth Q3 YoY
Q1-3/15Growth Q1-3 YoY
actualrates
constantrates
actualrates
constantrates
Sales
EBIT1
Net interest
Income taxes1
Net income2
6,940
1,027
-146
-262
367
16%
25%
1%
-33%
31%
7%
12%
10%
-19%
20%
20,369
2,849
-476
-703
1,009
22%
28%
-10%
-33%
31%
11%
14%
1%
-17%
19%
1 Before special items2 Net income attributable to shareholders of Fresenius SE & Co. KGaA; before special itemsFor a detailed overview of special items please see the reconciliation tables on slides 26 – 27.
Page 9
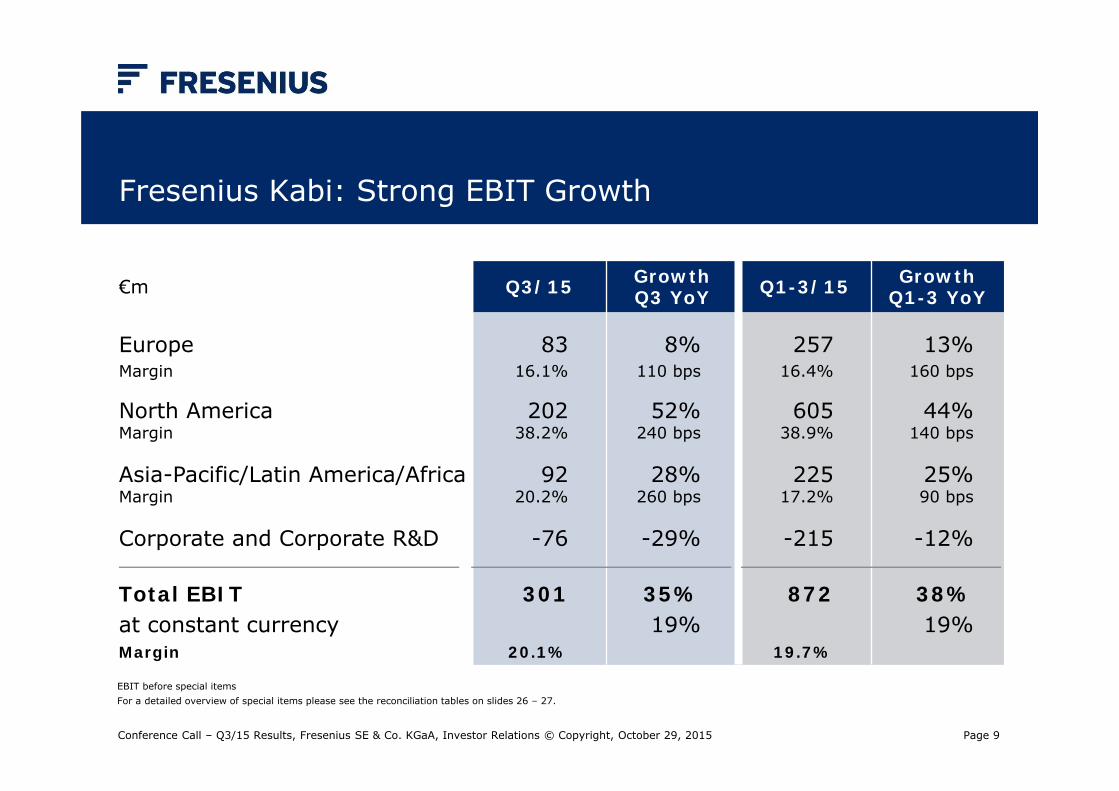
€m Q3/15 GrowthQ3 YoY Q1-3/15 Growth
Q1-3 YoY
EuropeMargin
North AmericaMargin
Asia-Pacific/Latin America/AfricaMargin
Corporate and Corporate R&D
8316.1%
20238.2%
9220.2%
-76
8%110 bps
52%240 bps
28%260 bps
-29%
25716.4%
60538.9%
22517.2%
-215
13%160 bps
44%140 bps
25%90 bps
-12%
Total EBITat constant currencyMargin
301
20.1%
35%19%
872
19.7%
38%19%
Fresenius Kabi: Strong EBIT Growth
Conference Call – Q3/15 Results, Fresenius SE & Co. KGaA, Investor Relations © Copyright, October 29, 2015
EBIT before special itemsFor a detailed overview of special items please see the reconciliation tables on slides 26 – 27.
Page 10
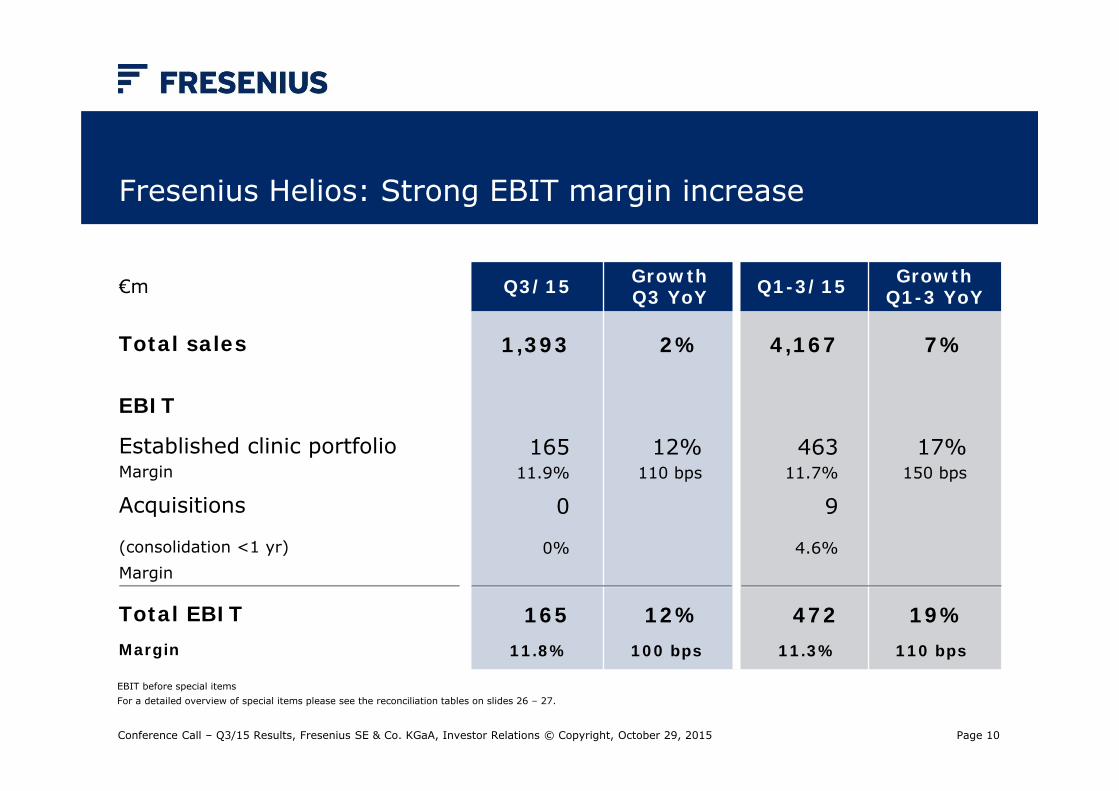
Fresenius Helios: Strong EBIT margin increase
Conference Call – Q3/15 Results, Fresenius SE & Co. KGaA, Investor Relations © Copyright, October 29, 2015
€m Q3/15 GrowthQ3 YoY Q1-3/15 Growth
Q1-3 YoY
Total sales
EBIT
Established clinic portfolioMargin
Acquisitions
(consolidation <1 yr)Margin
1,393
16511.9%
0
0%
2%
12%110 bps
4,167
46311.7%
9
4.6%
7%
17%150 bps
Total EBITMargin
16511.8%
12%100 bps
47211.3%
19%110 bps
EBIT before special itemsFor a detailed overview of special items please see the reconciliation tables on slides 26 – 27.
Page 11
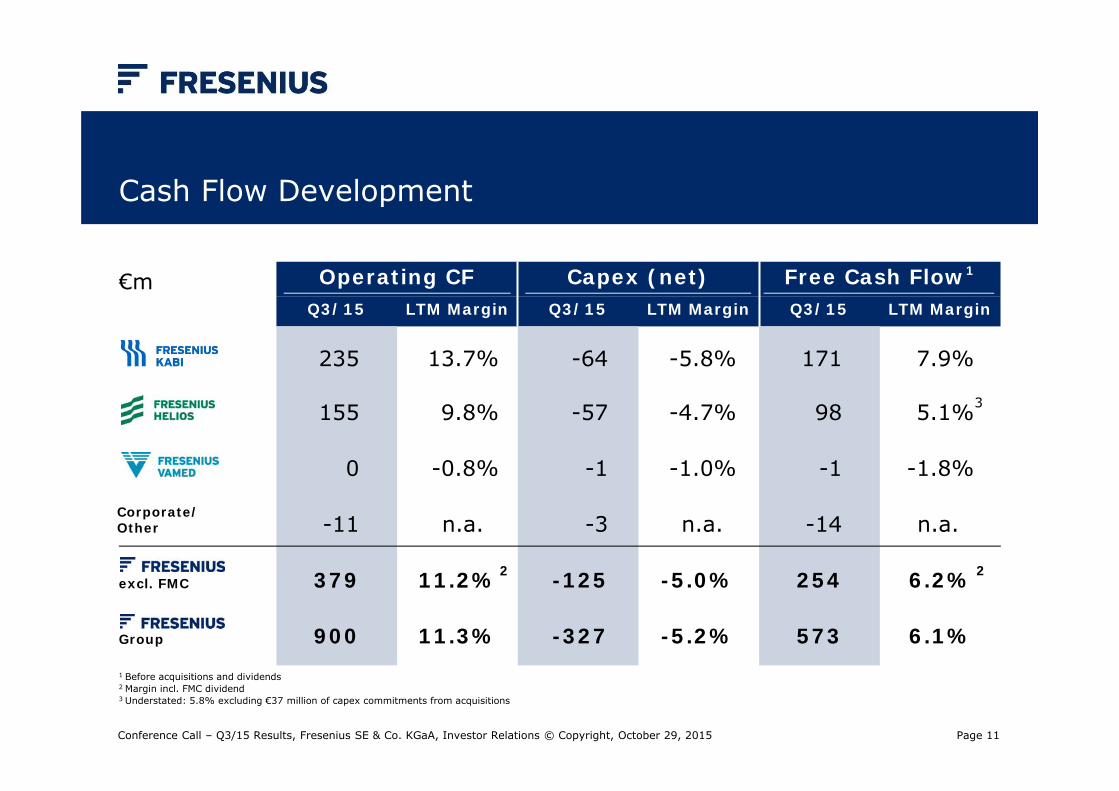
Cash Flow Development
€m Operating CF Capex (net) Free Cash Flow1
Q3/15 LTM Margin Q3/15 LTM Margin Q3/15 LTM Margin
235
155
0
-11
379
900
13.7%
9.8%
-0.8%
n.a.
11.2%
11.3%
-64
-57
-1
-3
-125
-327
-5.8%
-4.7%
-1.0%
n.a.
-5.0%
-5.2%
171
98
-1
-14
254
573
7.9%
5.1%
-1.8%
n.a.
6.2%
6.1%
Corporate/Other
excl. FMC
1 Before acquisitions and dividends2 Margin incl. FMC dividend3 Understated: 5.8% excluding €37 million of capex commitments from acquisitions
Group
2 2
3
Conference Call – Q3/15 Results, Fresenius SE & Co. KGaA, Investor Relations © Copyright, October 29, 2015
Page 12
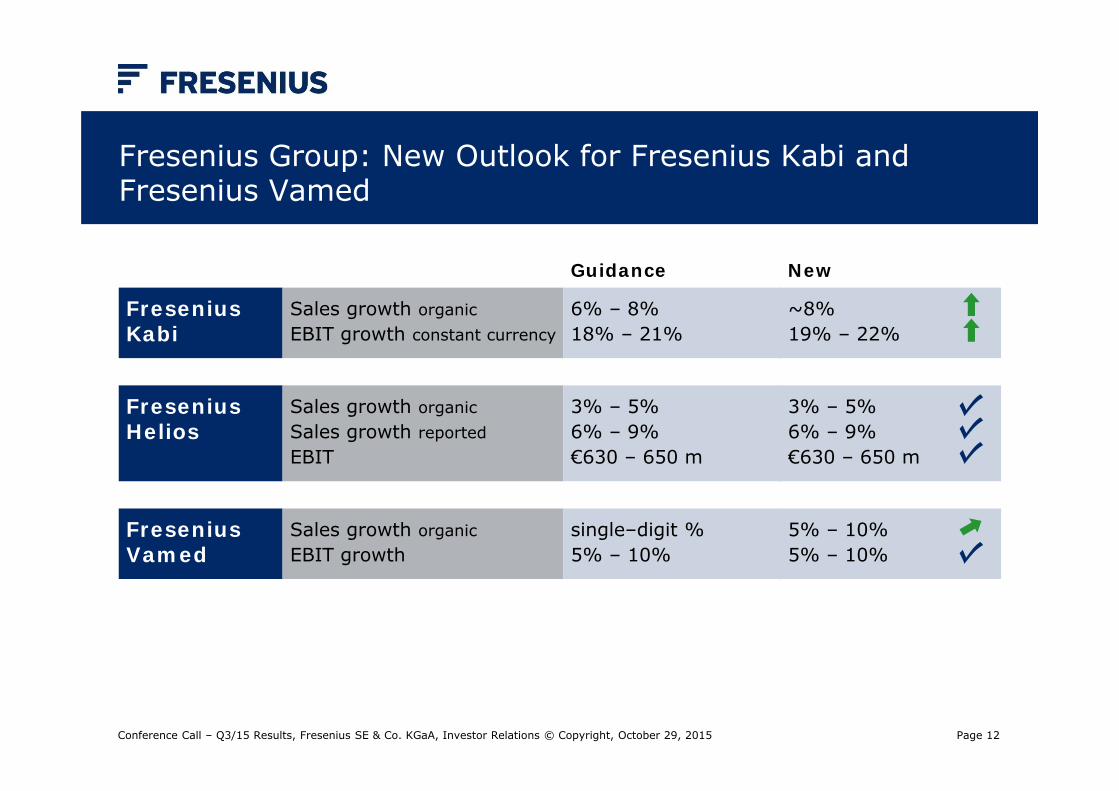
Fresenius Group: New Outlook for Fresenius Kabi and Fresenius Vamed
Conference Call – Q3/15 Results, Fresenius SE & Co. KGaA, Investor Relations © Copyright, October 29, 2015
Guidance New
FreseniusKabi
Sales growth organicEBIT growth constant currency
6% – 8%18% – 21%
~8%19% – 22%
FreseniusHelios
Sales growth organicSales growth reportedEBIT
3% – 5%6% – 9%€630 – 650 m
3% – 5%6% – 9%€630 – 650 m
FreseniusVamed
Sales growth organicEBIT growth
single–digit %5% – 10%
5% – 10%5% – 10%
Page 13
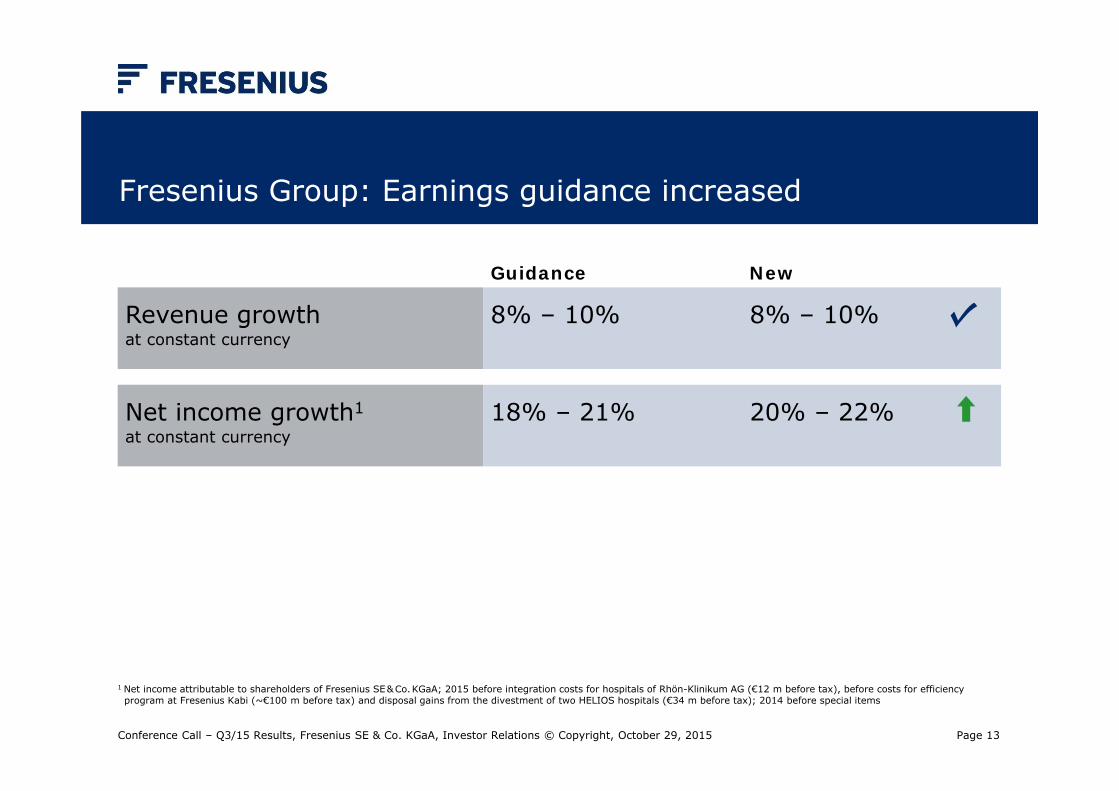
Fresenius Group: Earnings guidance increased
Guidance New
Revenue growthat constant currency
8% ‒ 10% 8% ‒ 10%
Net income growth1
at constant currency18% – 21% 20% – 22%
Conference Call – Q3/15 Results, Fresenius SE & Co. KGaA, Investor Relations © Copyright, October 29, 2015
1 Net income attributable to shareholders of Fresenius SE & Co. KGaA; 2015 before integration costs for hospitals of Rhön-Klinikum AG (€12 m before tax), before costs for efficiencyprogram at Fresenius Kabi (~€100 m before tax) and disposal gains from the divestment of two HELIOS hospitals (€34 m before tax); 2014 before special items
Page 14
Attachments
Conference Call – Q3/15 Results, Fresenius SE & Co. KGaA, Investor Relations © Copyright, October 29, 2015
Page 15
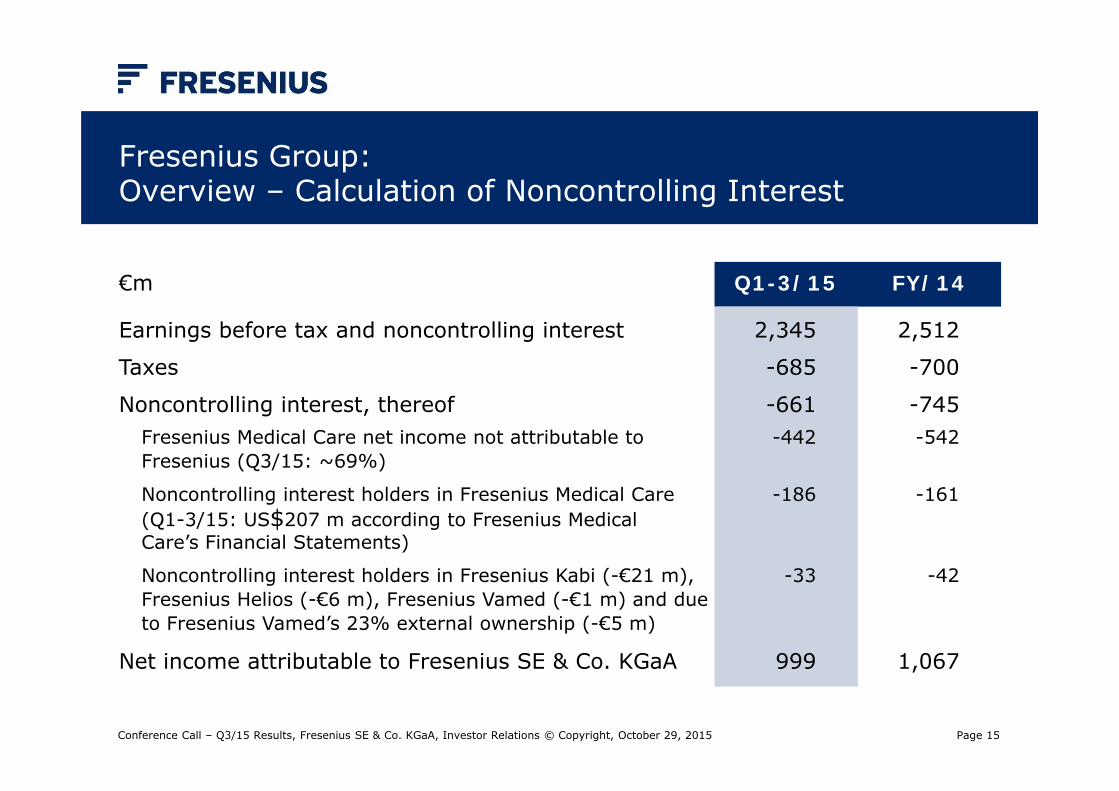
Fresenius Group: Overview – Calculation of Noncontrolling Interest
€m Q1-3/15 FY/14
Earnings before tax and noncontrolling interest
Taxes
Noncontrolling interest, thereofFresenius Medical Care net income not attributable toFresenius (Q3/15: ~69%)
Noncontrolling interest holders in Fresenius Medical Care (Q1-3/15: US$207 m according to Fresenius Medical Care’s Financial Statements)
Noncontrolling interest holders in Fresenius Kabi (-€21 m), Fresenius Helios (-€6 m), Fresenius Vamed (-€1 m) and due to Fresenius Vamed’s 23% external ownership (-€5 m)
Net income attributable to Fresenius SE & Co. KGaA
2,345
-685
-661-442
-186
-33
999
2,512
-700
-745-542
-161
-42
1,067
Conference Call – Q3/15 Results, Fresenius SE & Co. KGaA, Investor Relations © Copyright, October 29, 2015
Page 16
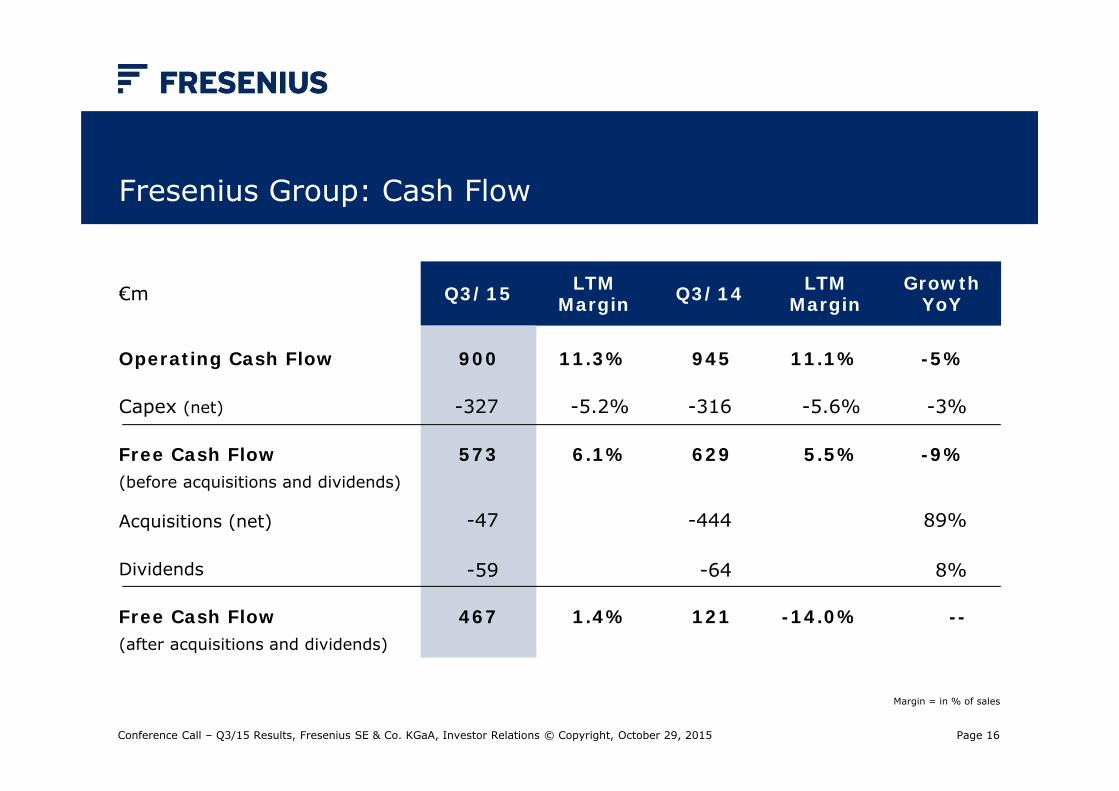
€m Q3/15 LTMMargin Q3/14 LTM
MarginGrowth
YoY
Operating Cash Flow
Capex (net)
Free Cash Flow(before acquisitions and dividends)
Acquisitions (net)
Dividends
Free Cash Flow(after acquisitions and dividends)
900
-327
573
-47
-59
467
11.3%
-5.2%
6.1%
1.4%
945
-316
629
-444
-64
121
11.1%
-5.6%
5.5%
-14.0%
-5%
-3%
-9%
89%
8%
--
Fresenius Group: Cash Flow
Conference Call – Q3/15 Results, Fresenius SE & Co. KGaA, Investor Relations © Copyright, October 29, 2015
Margin = in % of sales
Page 17
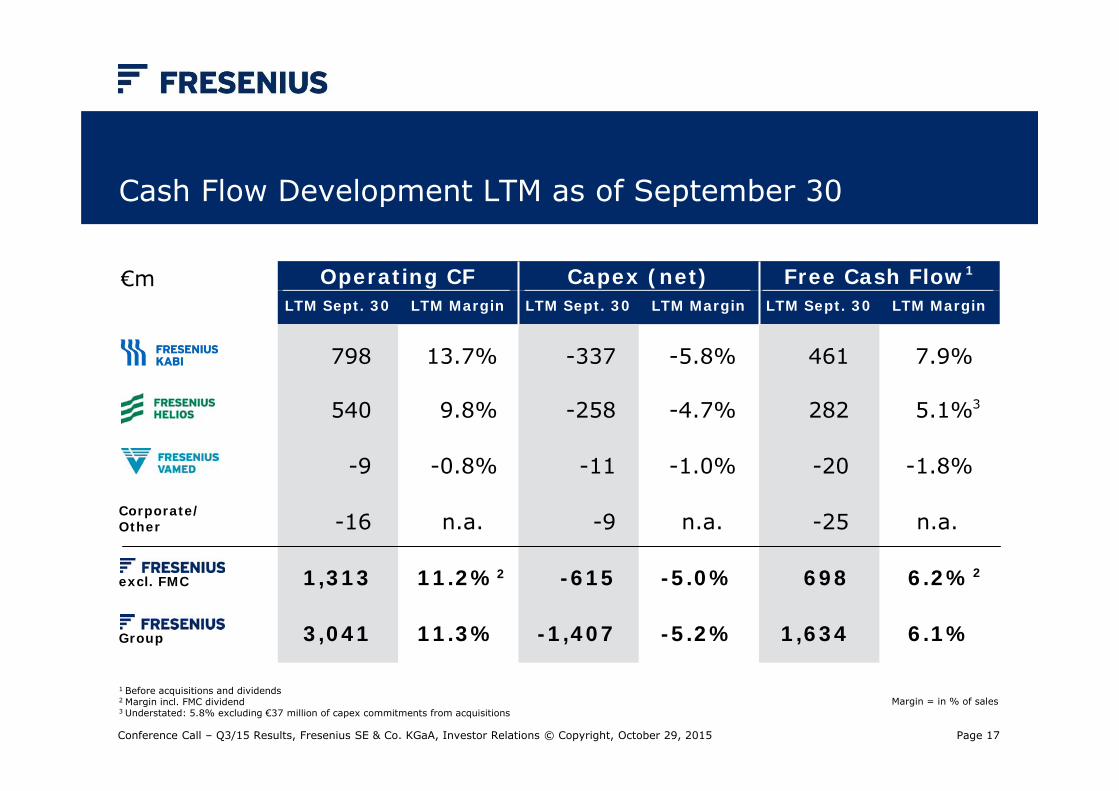
Cash Flow Development LTM as of September 30
€m Operating CF Capex (net) Free Cash Flow1
LTM Sept. 30 LTM Margin LTM Sept. 30 LTM Margin LTM Sept. 30 LTM Margin
798
540
-9
-16
1,313
3,041
13.7%
9.8%
-0.8%
n.a.
11.2%
11.3%
-337
-258
-11
-9
-615
-1,407
-5.8%
-4.7%
-1.0%
n.a.
-5.0%
-5.2%
461
282
-20
-25
698
1,634
7.9%
5.1%
-1.8%
n.a.
6.2%
6.1%
Corporate/Other
excl. FMC
1 Before acquisitions and dividends2 Margin incl. FMC dividend3 Understated: 5.8% excluding €37 million of capex commitments from acquisitions
Group
Margin = in % of sales
2 2
3
Conference Call – Q3/15 Results, Fresenius SE & Co. KGaA, Investor Relations © Copyright, October 29, 2015
Page 18
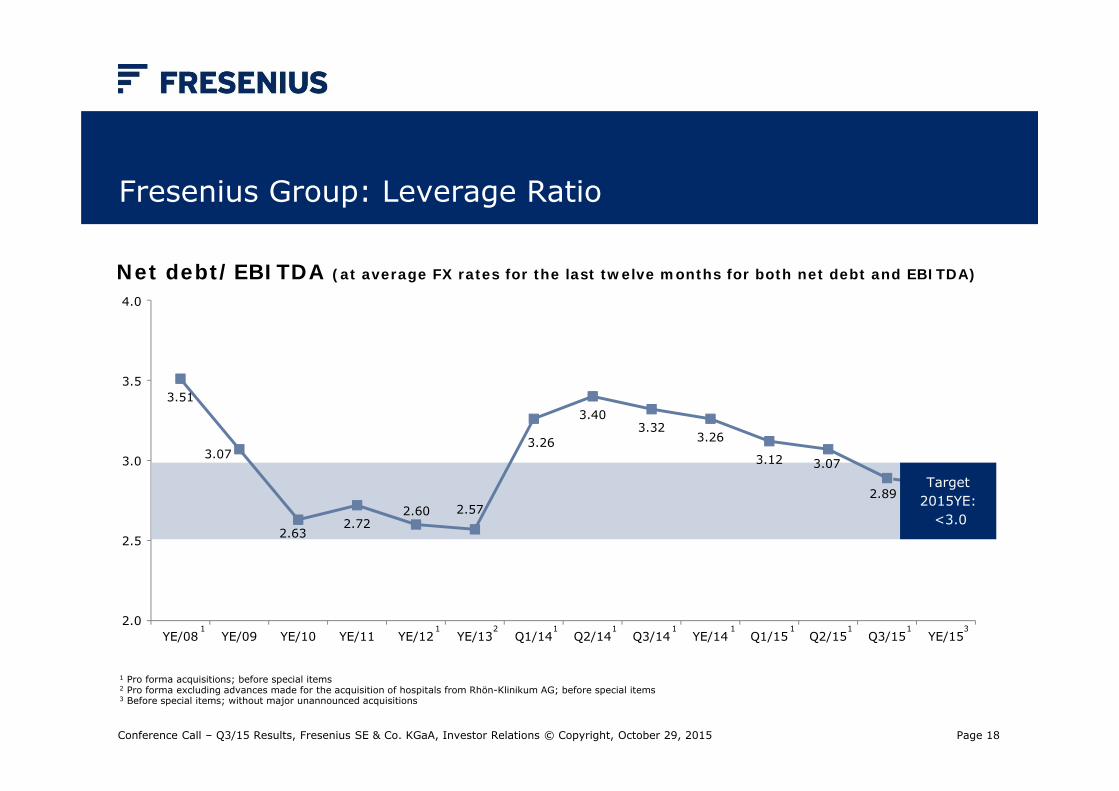
3.51
3.07
2.632.72
2.60 2.57
3.26
3.403.32
3.26
3.12 3.07
2.89
YE/08 YE/09 YE/10 YE/11 YE/12 YE/13 Q1/14 Q2/14 Q3/14 YE/14 Q1/15 Q2/15 Q3/15 YE/152 11 1 1 31 11 1 1
Fresenius Group: Leverage Ratio
1 Pro forma acquisitions; before special items2 Pro forma excluding advances made for the acquisition of hospitals from Rhön-Klinikum AG; before special items3 Before special items; without major unannounced acquisitions
Net debt/EBITDA (at average FX rates for the last twelve months for both net debt and EBITDA)
Conference Call – Q3/15 Results, Fresenius SE & Co. KGaA, Investor Relations © Copyright, October 29, 2015
4.0
3.5
3.0
2.5
2.0
Target2015YE:
<3.0
Page 19
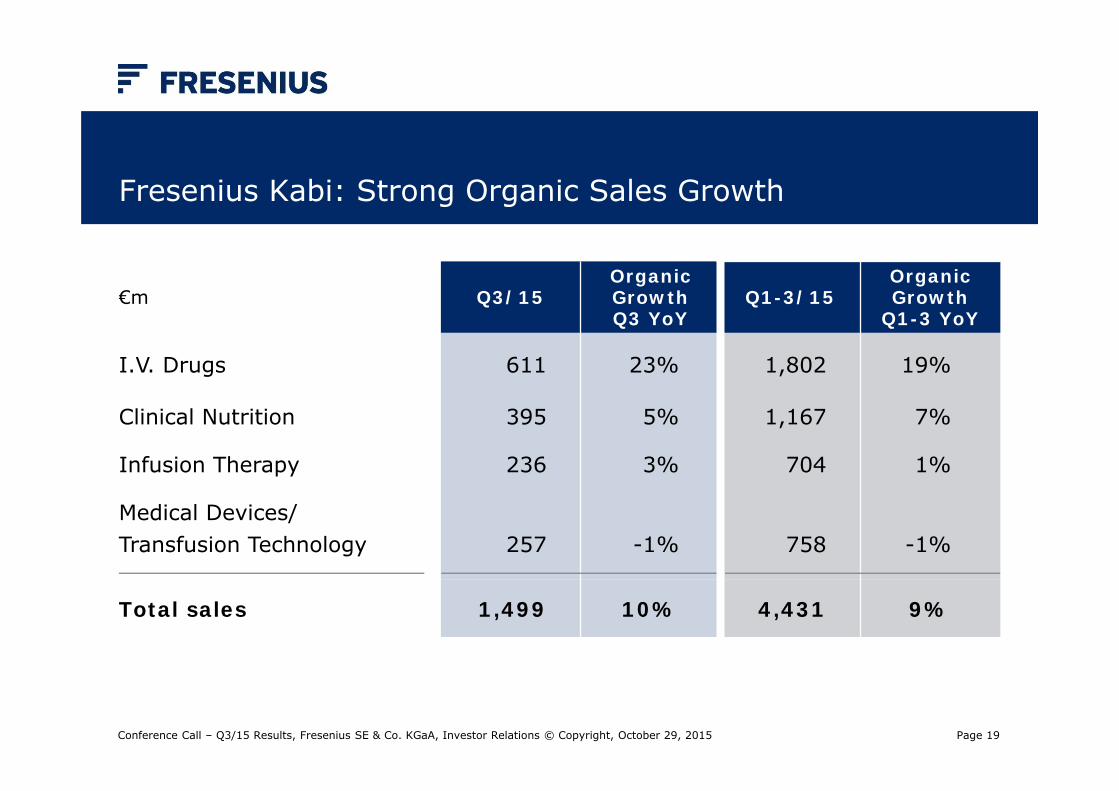
€m Q3/15Organic GrowthQ3 YoY
Q1-3/15Organic Growth
Q1-3 YoY
I.V. Drugs
Clinical Nutrition
Infusion Therapy
Medical Devices/Transfusion Technology
611
395
236
257
23%
5%
3%
-1%
1,802
1,167
704
758
19%
7%
1%
-1%
Total sales 1,499 10% 4,431 9%
Fresenius Kabi: Strong Organic Sales Growth
Conference Call – Q3/15 Results, Fresenius SE & Co. KGaA, Investor Relations © Copyright, October 29, 2015
Page 20
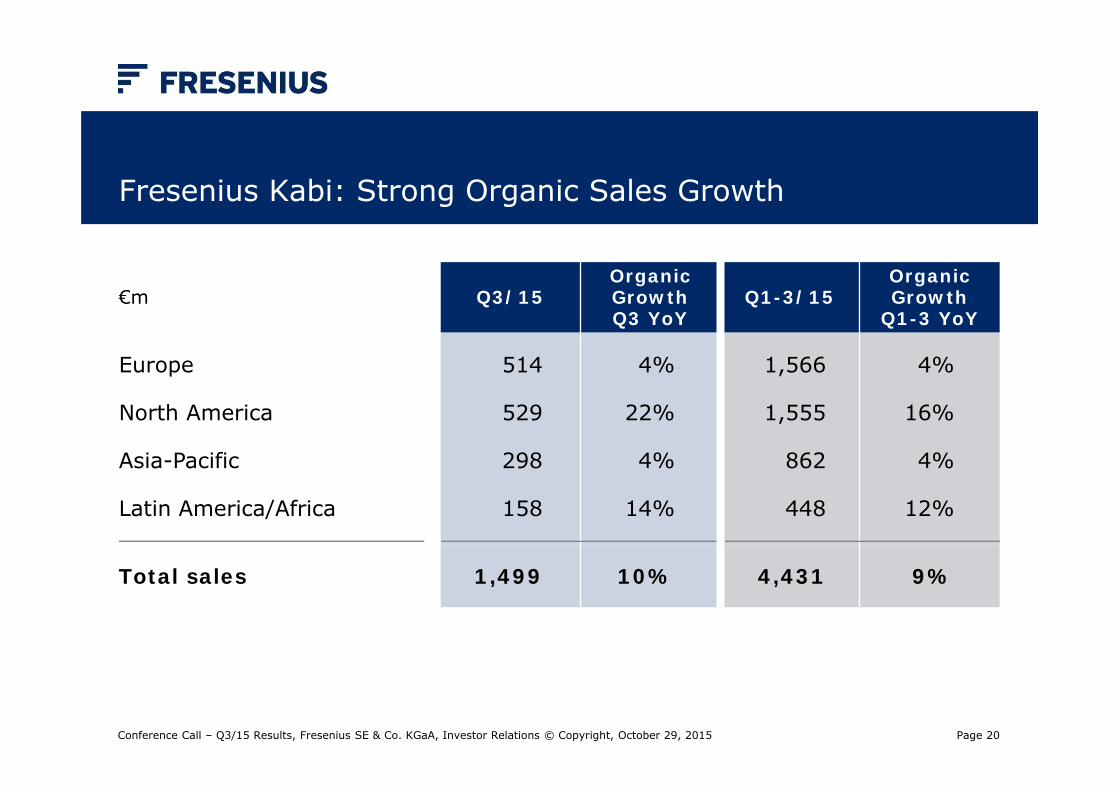
Fresenius Kabi: Strong Organic Sales Growth
Conference Call – Q3/15 Results, Fresenius SE & Co. KGaA, Investor Relations © Copyright, October 29, 2015
€m Q3/15Organic GrowthQ3 YoY
Q1-3/15Organic Growth
Q1-3 YoY
Europe
North America
Asia-Pacific
Latin America/Africa
514
529
298
158
4%
22%
4%
14%
1,566
1,555
862
448
4%
16%
4%
12%
Total sales 1,499 10% 4,431 9%
Page 21
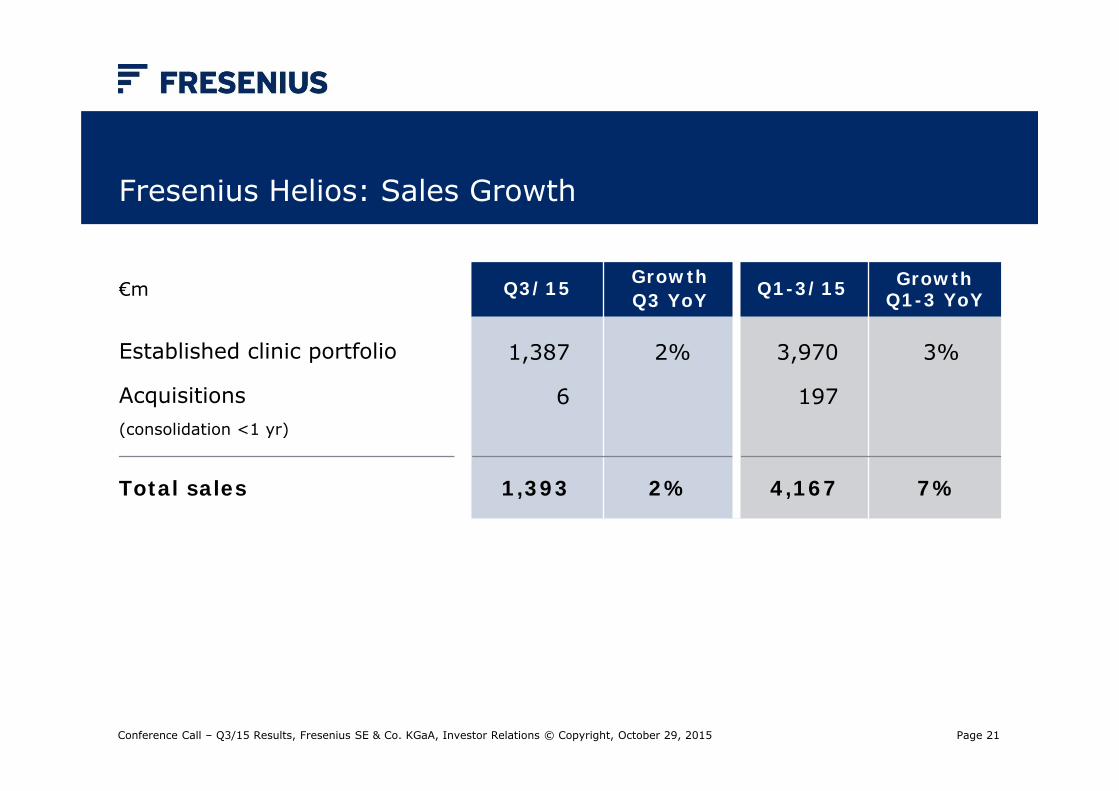
Fresenius Helios: Sales Growth
Conference Call – Q3/15 Results, Fresenius SE & Co. KGaA, Investor Relations © Copyright, October 29, 2015
€m Q3/15 GrowthQ3 YoY Q1-3/15 Growth
Q1-3 YoY
Established clinic portfolio
Acquisitions(consolidation <1 yr)
1,387
6
2% 3,970
197
3%
Total sales 1,393 2% 4,167 7%
Page 22
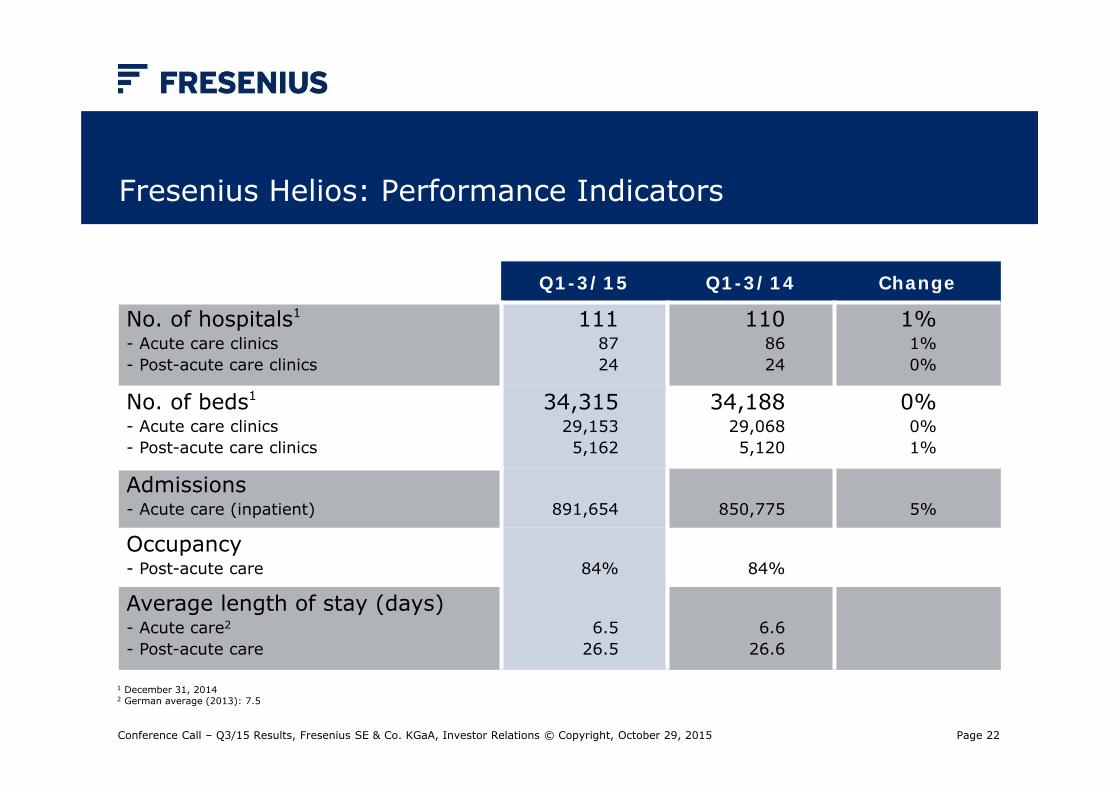
Fresenius Helios: Performance Indicators
Conference Call – Q3/15 Results, Fresenius SE & Co. KGaA, Investor Relations © Copyright, October 29, 2015
Q1-3/15 Q1-3/14 Change
No. of hospitals1
- Acute care clinics- Post-acute care clinics
1118724
1108624
1%1%0%
No. of beds1
- Acute care clinics- Post-acute care clinics
34,31529,1535,162
34,18829,0685,120
0%0%1%
Admissions- Acute care (inpatient) 891,654 850,775 5%
Occupancy- Post-acute care 84% 84%
Average length of stay (days)- Acute care2
- Post-acute care6.5
26.56.6
26.6
1 December 31, 20142 German average (2013): 7.5
Page 23
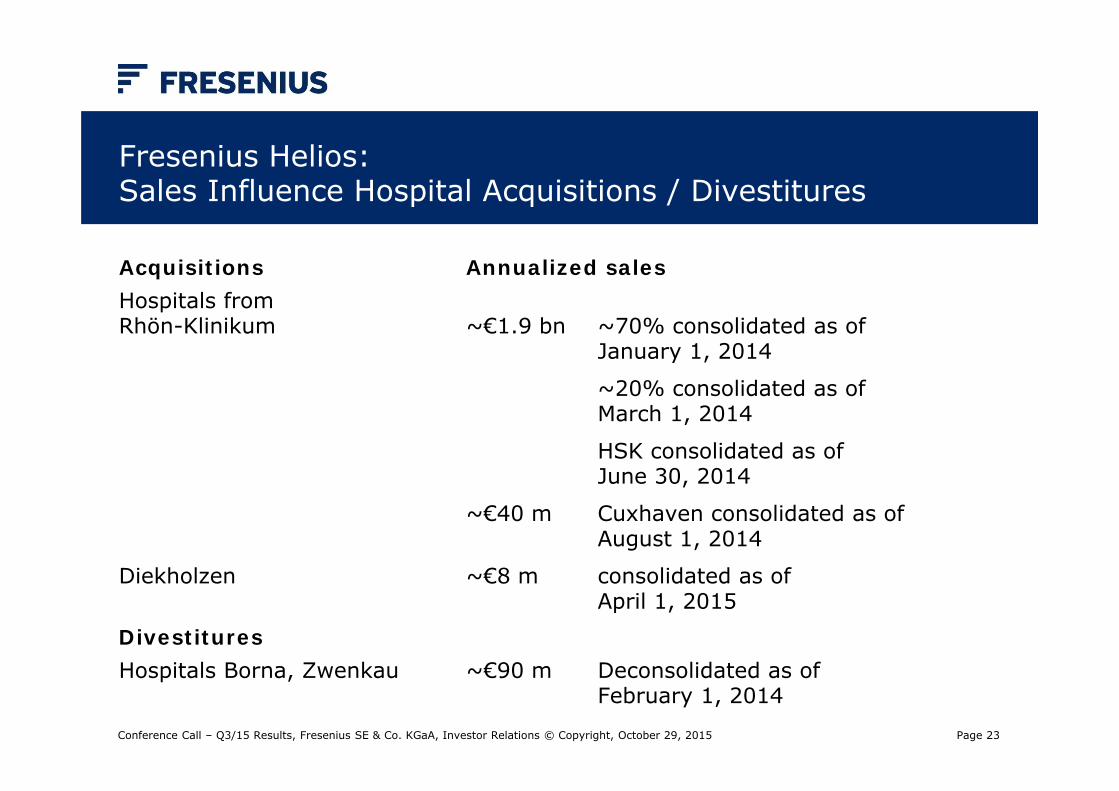
Fresenius Helios: Sales Influence Hospital Acquisitions / Divestitures
Conference Call – Q3/15 Results, Fresenius SE & Co. KGaA, Investor Relations © Copyright, October 29, 2015
Acquisitions Annualized salesHospitals fromRhön-Klinikum ~€1.9 bn ~70% consolidated as of
January 1, 2014
~20% consolidated as ofMarch 1, 2014
HSK consolidated as of June 30, 2014
~€40 m Cuxhaven consolidated as of August 1, 2014
Diekholzen ~€8 m consolidated as of April 1, 2015
DivestituresHospitals Borna, Zwenkau ~€90 m Deconsolidated as of
February 1, 2014
Page 24
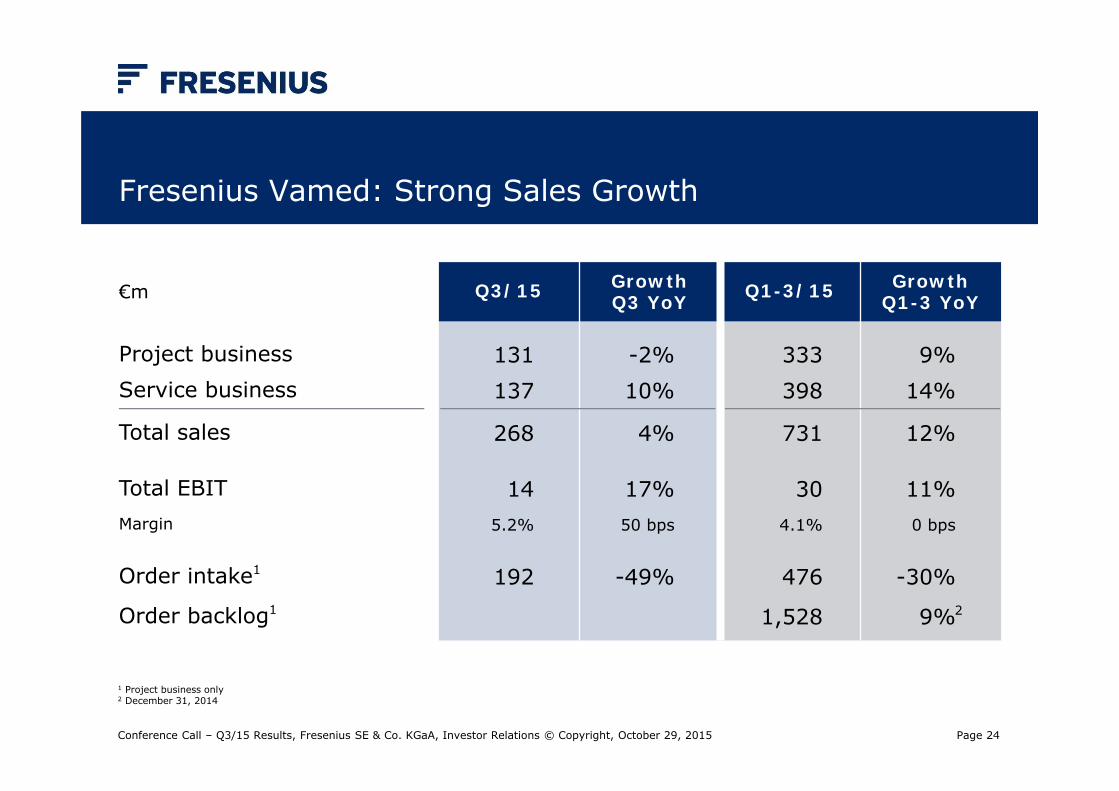
Fresenius Vamed: Strong Sales Growth
Conference Call – Q3/15 Results, Fresenius SE & Co. KGaA, Investor Relations © Copyright, October 29, 2015
€m Q3/15 GrowthQ3 YoY Q1-3/15 Growth
Q1-3 YoY
Project businessService business
131137
-2%10%
333398
9%14%
Total sales
Total EBITMargin
Order intake1
Order backlog1
268
145.2%
192
4%
17%50 bps
-49%
731
304.1%
476
1,528
12%
11%0 bps
-30%
9%
1 Project business only2 December 31, 2014
2
Page 25
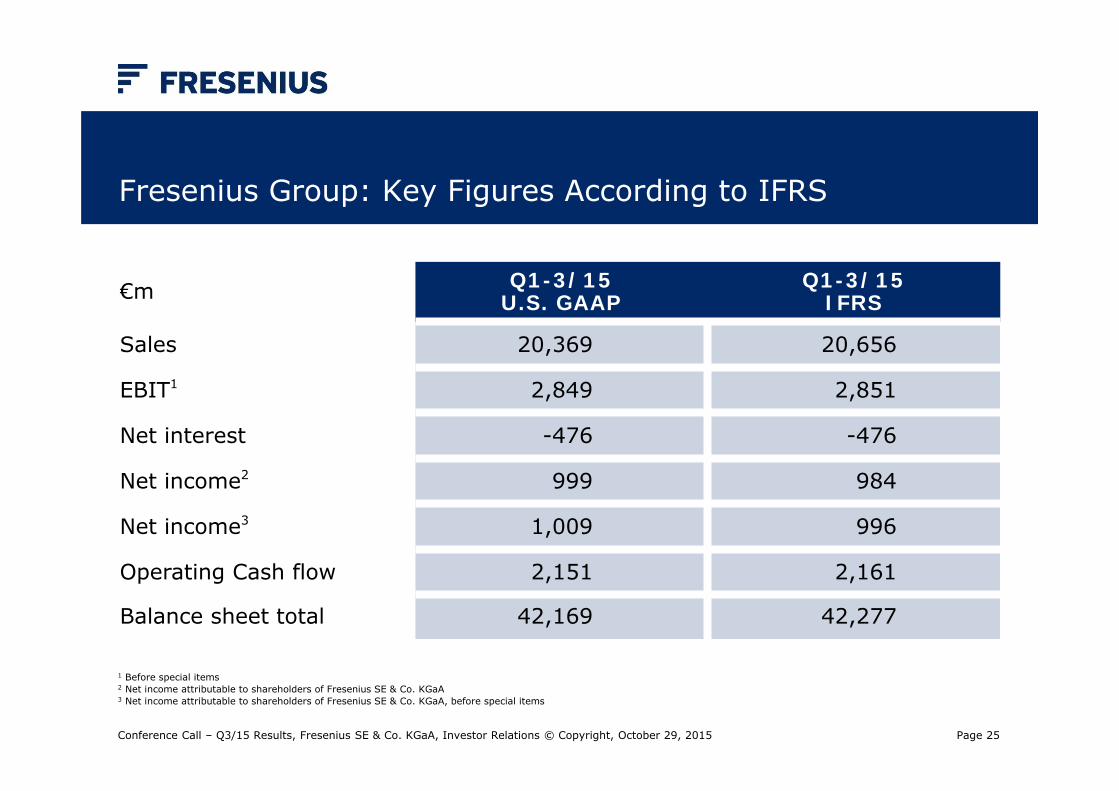
Fresenius Group: Key Figures According to IFRS
€m Q1-3/15U.S. GAAP
Q1-3/15IFRS
Sales 20,369 20,656
EBIT1 2,849 2,851
Net interest -476 -476
Net income2 999 984
Net income3 1,009 996
Operating Cash flow 2,151 2,161
Balance sheet total 42,169 42,277
Conference Call – Q3/15 Results, Fresenius SE & Co. KGaA, Investor Relations © Copyright, October 29, 2015
1 Before special items2 Net income attributable to shareholders of Fresenius SE & Co. KGaA3 Net income attributable to shareholders of Fresenius SE & Co. KGaA, before special items
Page 26
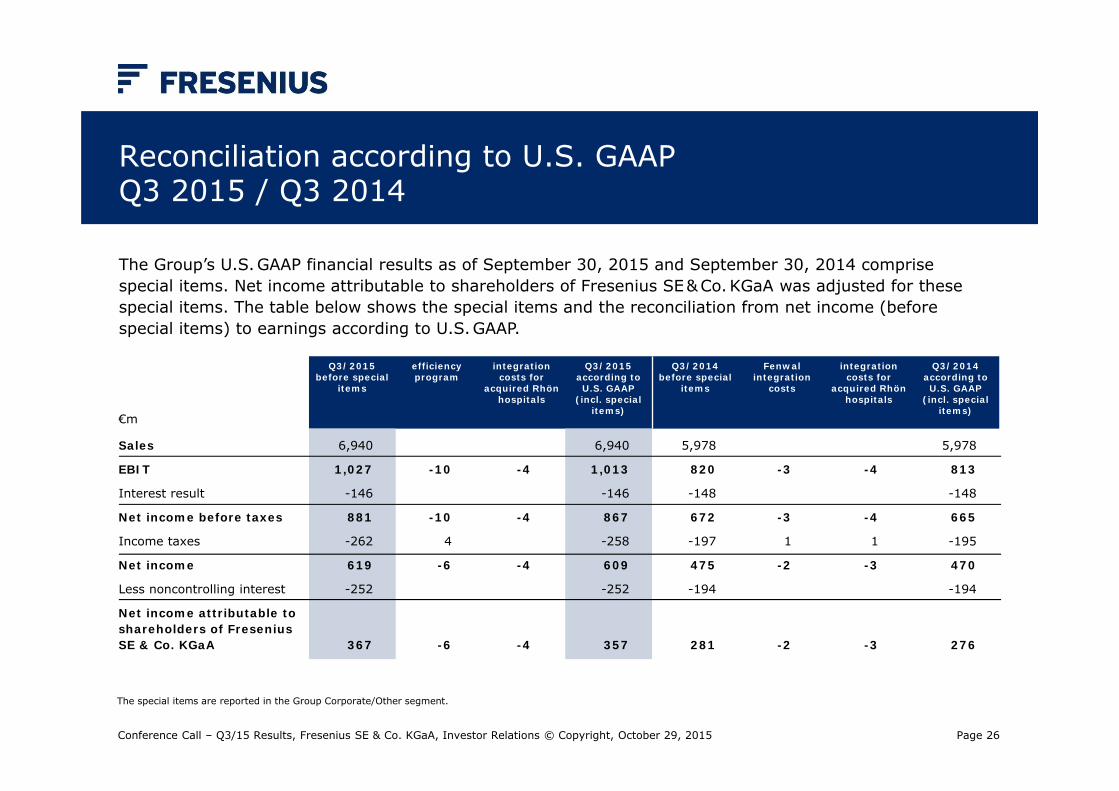
Reconciliation according to U.S. GAAPQ3 2015 / Q3 2014
€m
Q3/2015 before special
items
efficiencyprogram
integration costs for
acquired Rhönhospitals
Q3/2015 according to U.S. GAAP
(incl. special items)
Q3/2014 before special
items
Fenwalintegration
costs
integration costs for
acquired Rhönhospitals
Q3/2014 according to U.S. GAAP
(incl. special items)
Sales
EBIT
Interest result
Net income before taxes
Income taxes
Net income
Less noncontrolling interest
Net income attributable to shareholders of Fresenius SE & Co. KGaA
6,940
1,027
-146
881
-262
619
-252
367
-10
-10
4
-6
-6
-4
-4
-4
-4
6,940
1,013
-146
867
-258
609
-252
357
5,978
820
-148
672
-197
475
-194
281
-3
-3
1
-2
-2
-4
-4
1
-3
-3
5,978
813
-148
665
-195
470
-194
276
The Group’s U.S. GAAP financial results as of September 30, 2015 and September 30, 2014 comprise special items. Net income attributable to shareholders of Fresenius SE & Co. KGaA was adjusted for these special items. The table below shows the special items and the reconciliation from net income (before special items) to earnings according to U.S. GAAP.
The special items are reported in the Group Corporate/Other segment.
Conference Call – Q3/15 Results, Fresenius SE & Co. KGaA, Investor Relations © Copyright, October 29, 2015
Page 27
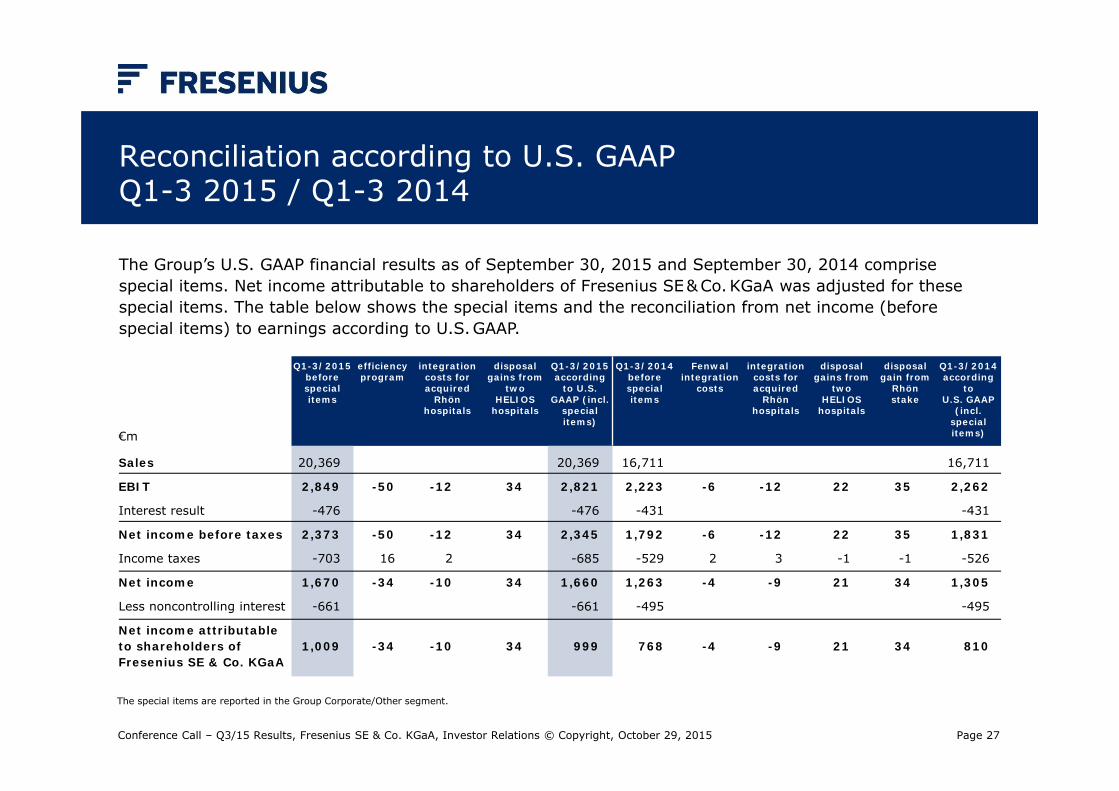
Reconciliation according to U.S. GAAP Q1-3 2015 / Q1-3 2014
€m
Q1-3/2015 beforespecialitems
efficiencyprogram
integration costs for acquired
Rhönhospitals
disposal gains from
two HELIOS
hospitals
Q1-3/2015 according
to U.S. GAAP (incl.
special items)
Q1-3/2014 beforespecialitems
Fenwalintegration
costs
integration costs for acquired
Rhönhospitals
disposal gains from
two HELIOS
hospitals
disposal gain from
Rhönstake
Q1-3/2014 according
to U.S. GAAP
(incl. special items)
Sales
EBIT
Interest result
Net income before taxes
Income taxes
Net income
Less noncontrolling interest
Net income attributable to shareholders of Fresenius SE & Co. KGaA
20,369
2,849
-476
2,373
-703
1,670
-661
1,009
-50
-50
16
-34
-34
-12
-12
2
-10
-10
34
34
34
34
20,369
2,821
-476
2,345
-685
1,660
-661
999
16,711
2,223
-431
1,792
-529
1,263
-495
768
-6
-6
2
-4
-4
-12
-12
3
-9
-9
22
22
-1
21
21
35
35
-1
34
34
16,711
2,262
-431
1,831
-526
1,305
-495
810
The Group’s U.S. GAAP financial results as of September 30, 2015 and September 30, 2014 comprise special items. Net income attributable to shareholders of Fresenius SE & Co. KGaA was adjusted for these special items. The table below shows the special items and the reconciliation from net income (before special items) to earnings according to U.S. GAAP.
The special items are reported in the Group Corporate/Other segment.
Conference Call – Q3/15 Results, Fresenius SE & Co. KGaA, Investor Relations © Copyright, October 29, 2015
Page 28
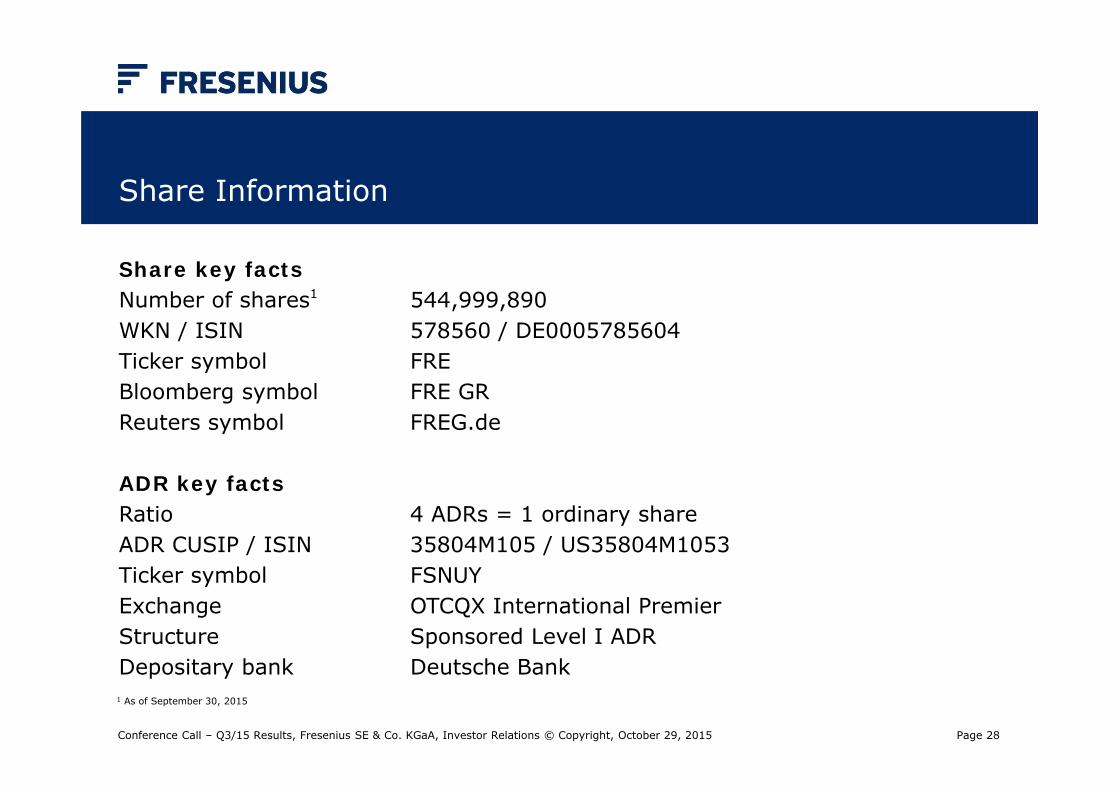
Share Information
Share key factsNumber of shares1 544,999,890WKN / ISIN 578560 / DE0005785604Ticker symbol FREBloomberg symbol FRE GRReuters symbol FREG.de
ADR key factsRatio 4 ADRs = 1 ordinary shareADR CUSIP / ISIN 35804M105 / US35804M1053Ticker symbol FSNUYExchange OTCQX International PremierStructure Sponsored Level I ADRDepositary bank Deutsche Bank1 As of September 30, 2015
Conference Call – Q3/15 Results, Fresenius SE & Co. KGaA, Investor Relations © Copyright, October 29, 2015
Page 29
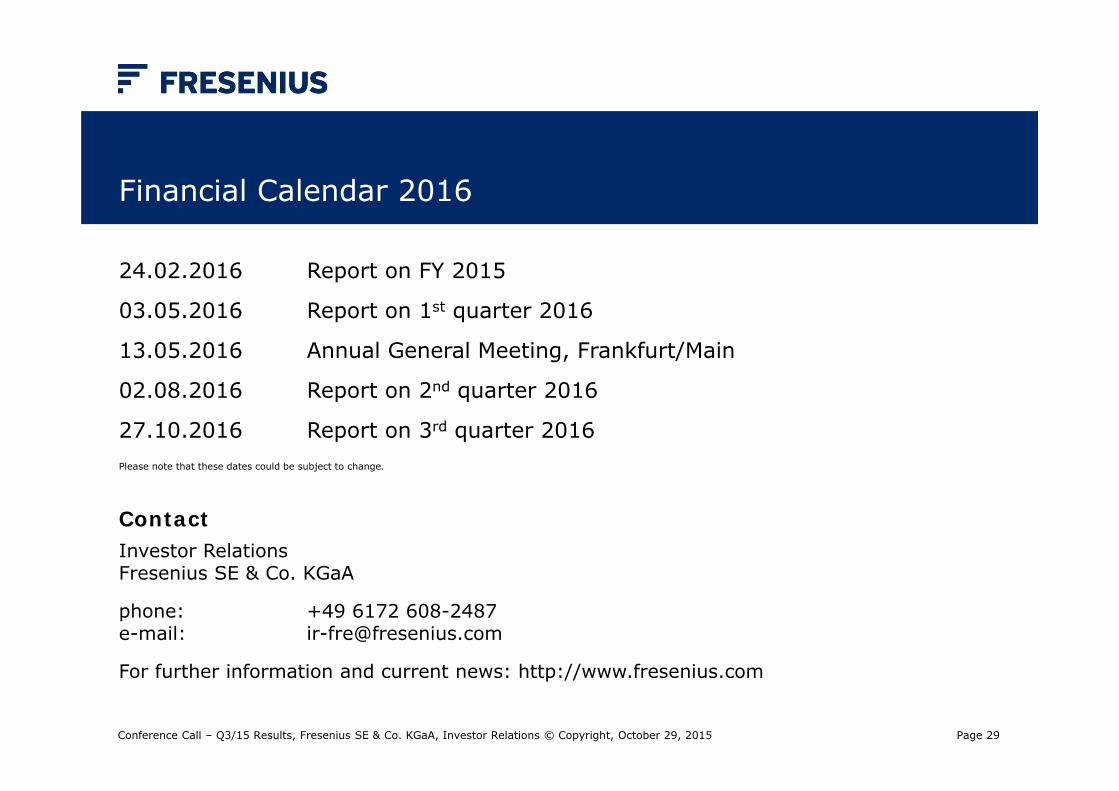
Financial Calendar 2016
24.02.2016 Report on FY 2015
03.05.2016 Report on 1st quarter 2016
13.05.2016 Annual General Meeting, Frankfurt/Main
02.08.2016 Report on 2nd quarter 2016
27.10.2016 Report on 3rd quarter 2016Please note that these dates could be subject to change.
ContactInvestor RelationsFresenius SE & Co. KGaA
phone: +49 6172 608-2487e-mail: [email protected]
For further information and current news: http://www.fresenius.com
Conference Call – Q3/15 Results, Fresenius SE & Co. KGaA, Investor Relations © Copyright, October 29, 2015