Embed Size (px)
Citation preview
HEADER / FOOTER INFORMATION (SUCH AS PRIVATE / CONFIDENTIAL)
Frequency Plots
Sector Enterprise Quality Northrop Grumman CorporationIntegrated Systems
CA/PA-RCA : Basic Tool

2
Why use frequency plots
Summarizes data from a process and graphically
presents the frequency distribution in bar form
Helps to answer the question whether the process
is capable of meeting customer requirements

3
When to use the frequency plots
To display large amounts of data that are difficult
to interpret in tabular form
To show the relative frequency of occurrence of
the various data values
To reveal the centering, spread and variation of
the data
To illustrate quickly the underlying distribution of
the data

4
Frequency Plot Features
0
3
2
1
6
5
4
7
8
9
104:
00
4:05
4:20
4:10
4:15
4:40
4:35
4:30
4:25
5:05
5:00
4:55
4:50
4:45
Height of column indicates how often that data value occurred
Target time
Label target and/or specifications
Overall shape shows how the data is distributed

5
How to construct a frequency plot
1. Decide on the process measure
2. Gather data (at least 50 data points)
3. Prepare a frequency table of the data
a. Count the number of data points
b. Calculate the range
c. Determine the number of class intervals
d. Determine the class width
e. Construct the frequency table
4. Draw a frequency plot (histogram) of the table
5. Interpret the graph

6
What to look for on a frequency plot
Center of the data
Range of the data
Shape of the distribution
Comparison with target and specification
Any irregularities

7
Common Shapes of Frequency Plots
If a frequency plot shows a bell-shaped, symmetric distribution:
Conclude – No special causes indicated but the distribution; data may come from a stable process (Caution: special causes may appear on a time plot or control chart).
Action – Make fundamental changes to improve a stable process (common cause strategy).
Bell shaped. Symmetric.

8
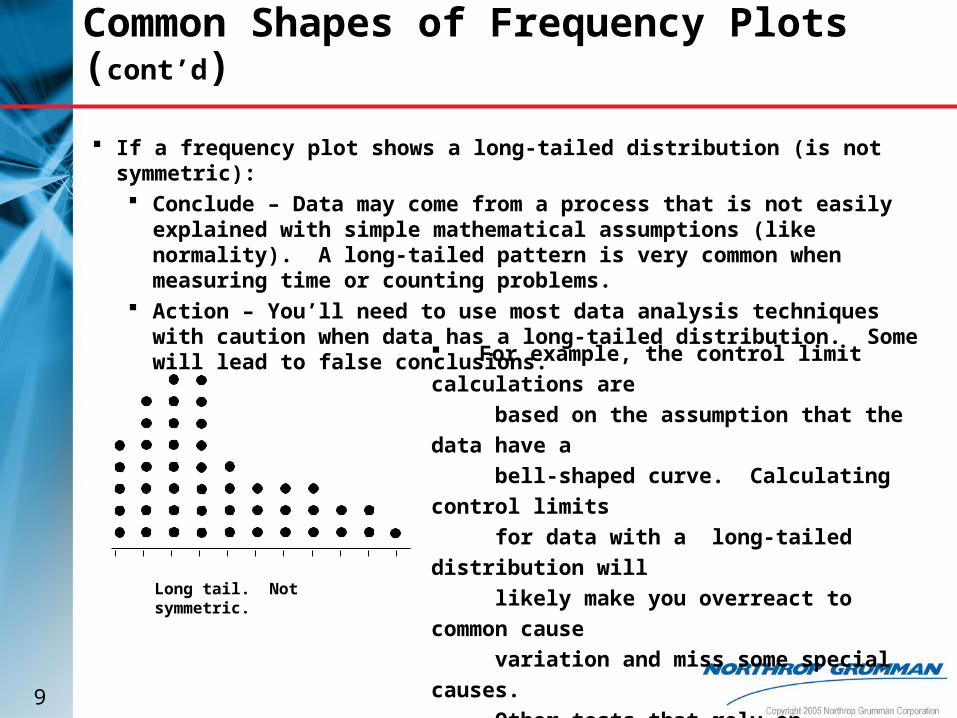
Common Shapes of Frequency Plots (cont’d)
If a frequency plot shows a two-humped, bimodal distribution:
Conclude – What we thought was one process operates like two processes (two sets of operating conditions with two sets of output)
Action – Use stratification or other analysis techniques to seek out causes for two humps; be wary of reacting to a time plot or control chart for data with this distribution
Two humps. Bimodal.
9
Common Shapes of Frequency Plots (cont’d)
If a frequency plot shows a long-tailed distribution (is not symmetric): Conclude – Data may come from a process that is not easily explained with
simple mathematical assumptions (like normality). A long-tailed pattern is very common when measuring time or counting problems.
Action – You’ll need to use most data analysis techniques with caution when data has a long-tailed distribution. Some will lead to false conclusions.
Long tail. Not symmetric.
For example, the control limit calculations are
based on the assumption that the data have a
bell-shaped curve. Calculating control limits
for data with a long-tailed distribution will
likely make you overreact to common cause
variation and miss some special causes.
Other tests that rely on normality include
hypotheses tests, ANOVA, and regression. To deal with data with this kind of
distribution, you may need to transform it.
10
Common Shapes of Frequency Plots (cont’d)
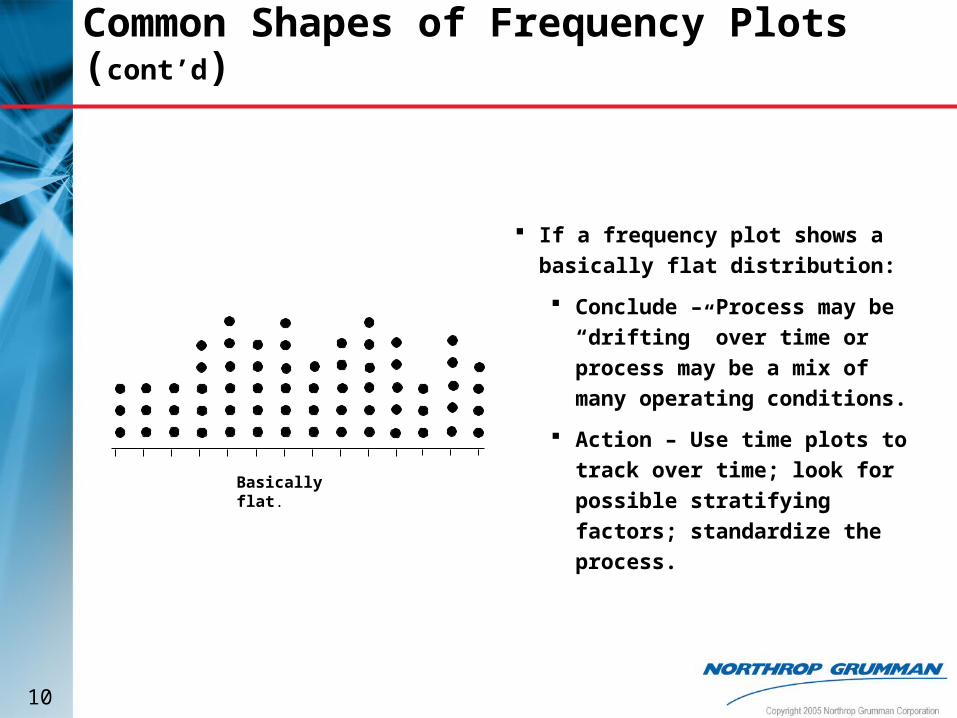
If a frequency plot shows a basically
flat distribution:
Conclude – Process may be
“drifting” over time or process
may be a mix of many operating
conditions.
Action – Use time plots to track
over time; look for possible
stratifying factors; standardize
the process.
Basically flat.

11
Common Shapes of Frequency Plots (cont’d)
If a frequency plot shows one or
more outliers:
Conclude – Outlier data points
are likely the result of clerical
error or something unusual
happening in the process.
Action – Confirm outliers are not
clerical error; treat like a special
cause.
One or more outliers.
12
Common Shapes of Frequency Plots (cont’d)
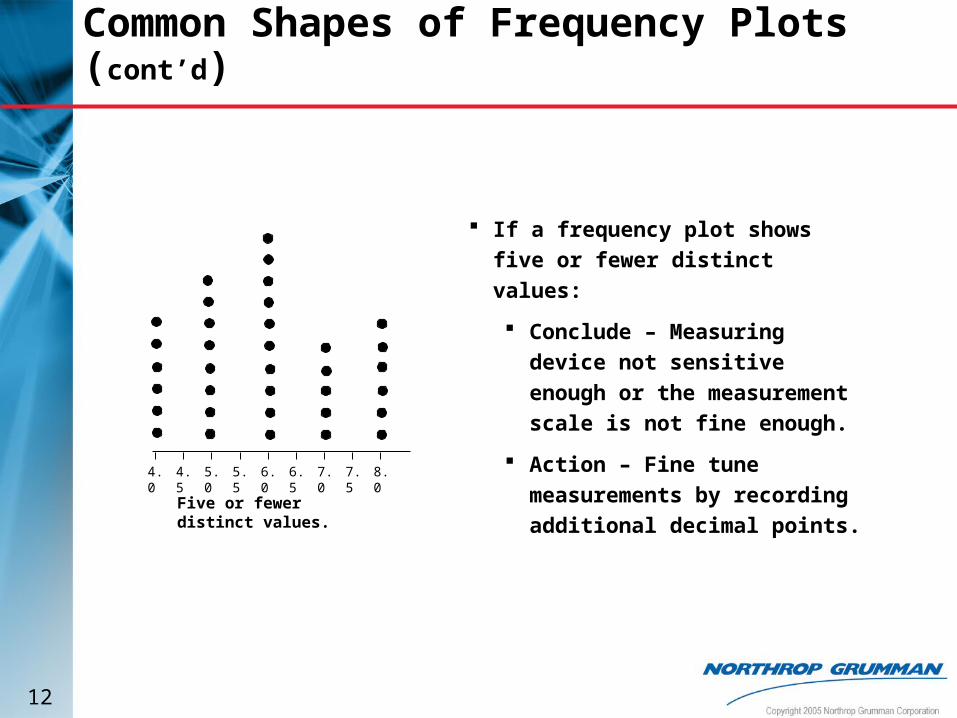
If a frequency plot shows five or
fewer distinct values:
Conclude – Measuring device not
sensitive enough or the
measurement scale is not fine
enough.
Action – Fine tune measurements
by recording additional decimal
points.Five or fewer distinct values.
4.0 5.04.5 6.05.5 6.5 7.0 8.07.5

13
Common Shapes of Frequency Plots (cont’d)
If a frequency plot shows a large
pile-up of data points:
Conclude – A sharp cut-off point
occurs if the measurement
instrument is incapable of
reading across the complete
range of data, or when people
ignore data that goes beyond a
certain limit.
Action – Improve measurement
devices. Eliminate fear of
reprisals for recording
“unacceptable” data.
Large pile-up around a minimum or maximum value

14
Common Shapes of Frequency Plots (cont’d)
If a frequency plot has one value that
is extremely common:
Conclude – When one value
appears far more commonly than
any other value, the measuring
instrument may be damaged or
hard to read, or the person
recording the data may have a
subconscious bias.
Action – Check measurement
instruments. Check data
collection procedures.One value is extremely common
15
Common Shapes of Frequency Plots (cont’d)
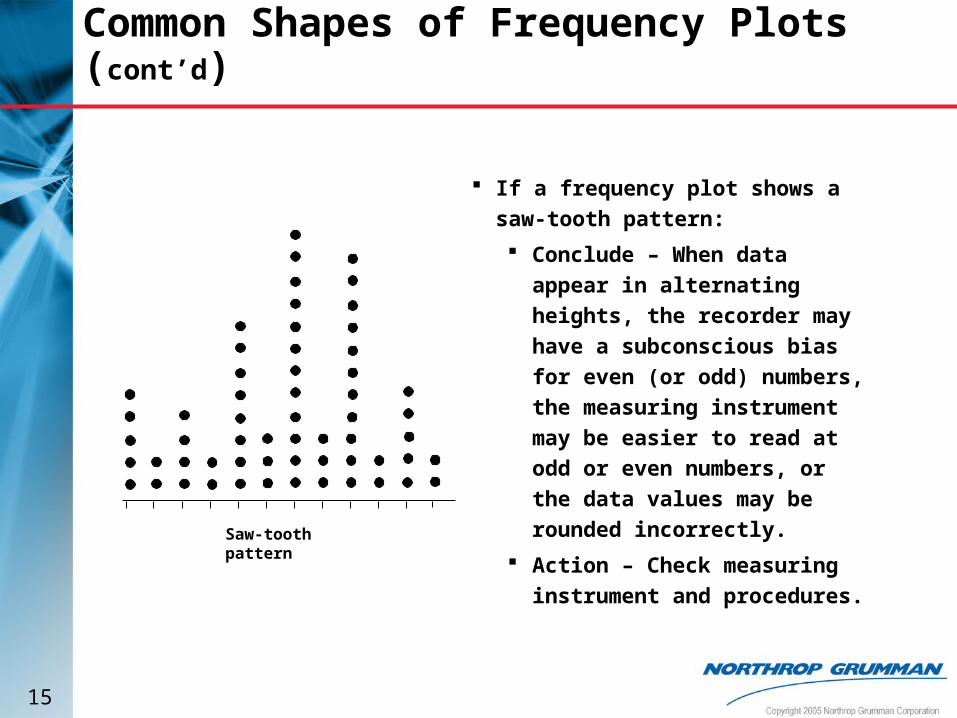
If a frequency plot shows a saw-
tooth pattern:
Conclude – When data appear in
alternating heights, the recorder
may have a subconscious bias
for even (or odd) numbers, the
measuring instrument may be
easier to read at odd or even
numbers, or the data values may
be rounded incorrectly.
Action – Check measuring
instrument and procedures.Saw-tooth pattern