Embed Size (px)
Citation preview
8/3/2019 Frequency Planning in 3g
http://slidepdf.com/reader/full/frequency-planning-in-3g 1/12
White Paper
Microwave Radio NetworkPlanning in 3G

8/3/2019 Frequency Planning in 3g
http://slidepdf.com/reader/full/frequency-planning-in-3g 2/12
8/3/2019 Frequency Planning in 3g
http://slidepdf.com/reader/full/frequency-planning-in-3g 3/12
3
White Paper
ContentsIntroduction 3
Evolution of mobile networks 4
Network topology evolution 4
Planning of Point-to-Point microwave 5
Capacity increase (upgrade from PDH to SDH) 9
Effect of technology change to link planning 10
Regulatory aspects 10
Conclusions 11
Introduction
This study highlights the main
issues that should be taken into
account when planning future
microwave radio networks for base
station access in 3G. Even though
there are different microwave access
technologies, this study covers only
the usage of point-to-point
microwave radios, which is the
main technology for base station
access today and in the foreseeable
future.
The introduction of 3G will have
a significant effect to cellular
transmission (CT), which has to be
taken into account in network
planning. The increased capacity
requirement will effect both the
individual radio network links and
the network topology. In current
GSM networks BTS capacities are
on average 0.5–1 Mbit/s while in3G BTS capacities are in range of
2–10 Mbit/s. This huge capacity
increase will force mobile operators
to introduce fibre based solutions
also in regional networks and
possibly change the existing
network structure towards a more
of a star type of topology.
The introduction of 3G will also
force operators to use the existing
frequency bands as ef ficient as
possible and also to find new
frequency bands. This will be a
big challenge for operators and
regulators because at the same time
new operators will emerge to share
the scarce radio frequency
spectrum. One of the key issues in
coming years is how to optimise the
usage of radio frequency spectrum
and how to guarantee the required
quality of service.
This study shows that robustmodulation methods like 4QAM
provides the best areal spectrum
ef ficiency in dense networks.
This has been studied on both in a
mesh networks with randomly
oriented hops and a fully built star
were hops are as close angle as
possible. Robust modulation
methods also guarantee low
RBER (Residual Bit Error Rate),
which is required by ATM transport
in 3G networks.
The effect of ATM transport to
radio link planning has been
studied and new planning
recommendations are given.
It can be assumed that many of
the existing PDH radio links fulfil
these recommendations, though
operators are encouraged to verify
the situation. Those PDH links
which has been planned according
to old G.821 should be recalculated
with a fade margin correspondingto threshold level at about
BER=10-5.
8/3/2019 Frequency Planning in 3g
http://slidepdf.com/reader/full/frequency-planning-in-3g 4/12
4
White Paper
Evolution of mobile networksTransmission is an important
element in any mobile network,
affecting both the services and
service quality offered as well as
the cost of the mobile operator.
Optimisation of transmission
solutions is thus certainly
worthwhile from the operator’s
business point of view. Microwave
access, based on point-to-point
microwave radios, is thedominating technology in base
station access networks. It offers
the fastest means for network
roll-out and capacity-expansion.
When using microwave radio
transmission, an operator saves on
operational expenses compared to
laying his own cable or leasing
connections. At least two-thirds of
all base station connections are
based on microwave radios.
CT access networks have been
typically built strictly according to
cellular system needs. These mobile
systems evolve from current
narrowband GSM to EDGE and
WCDMA. If services are same in
both networks, the transmission
capacity depends on the system
overhead, which is about 1.3 x user
bit rate in EDGE and about 2 x in
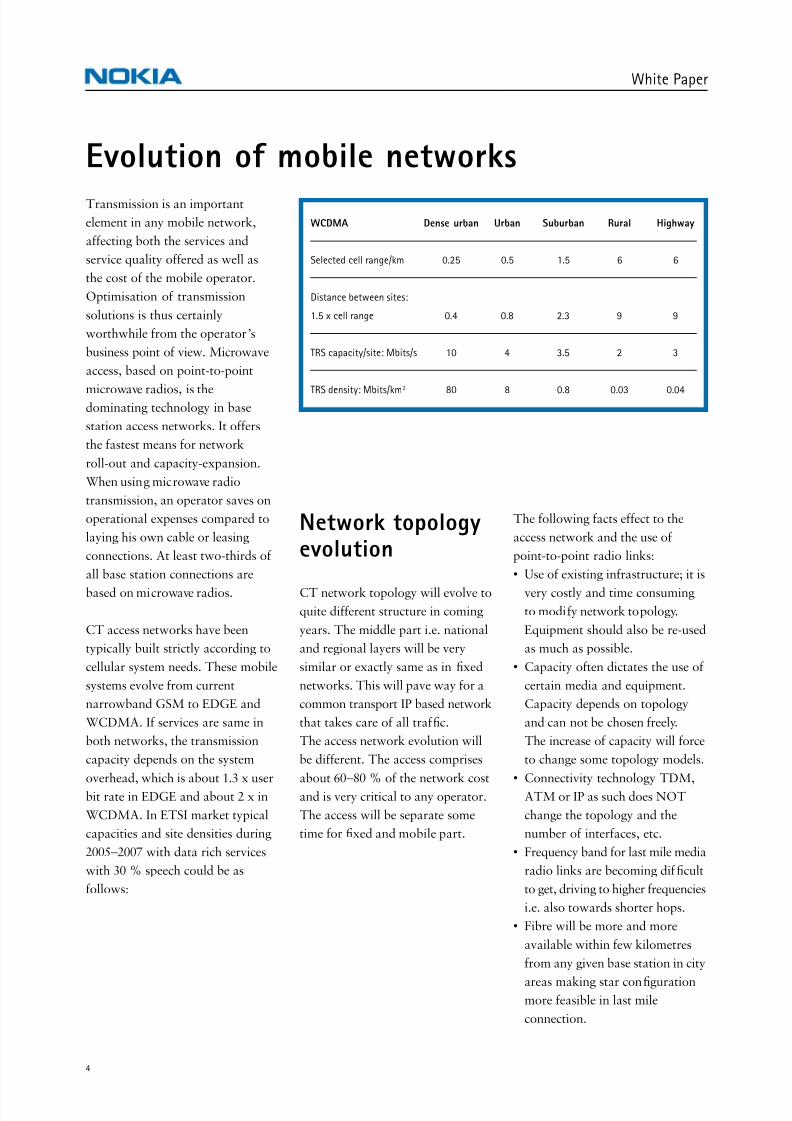
WCDMA. In ETSI market typical
capacities and site densities during
2005 – 2007 with data rich services
with 30 % speech could be as
follows:
Network topologyevolution
CT network topology will evolve to
quite different structure in coming
years. The middle part i.e. national
and regional layers will be very
similar or exactly same as in fixed
networks. This will pave way for a
common transport IP based network
that takes care of all traf fic.
The access network evolution will
be different. The access comprises
about 60 – 80 % of the network cost
and is very critical to any operator.
The access will be separate some
time for fixed and mobile part.
The following facts effect to the
access network and the use of
point-to-point radio links:
• Use of existing infrastructure; it is
very costly and time consuming
to modify network topology.
Equipment should also be re-used
as much as possible.
• Capacity often dictates the use of
certain media and equipment.
Capacity depends on topology
and can not be chosen freely.
The increase of capacity will force
to change some topology models.
• Connectivity technology TDM,
ATM or IP as such does NOT
change the topology and the
number of interfaces, etc.
• Frequency band for last mile media
radio links are becoming dif ficult
to get, driving to higher frequencies
i.e. also towards shorter hops.
• Fibre will be more and more
available within few kilometres
from any given base station in city
areas making star configurationmore feasible in last mile
connection.
WCDMA Dense urban Urban Suburban Rural Highway
Selected cell range/km 0.25 0.5 1.5 6 6
Distance between sites:
1.5 x cell range 0.4 0.8 2.3 9 9
TRS capacity/site: Mbits/s 10 4 3.5 2 3
TRS density: Mbits/km2
80 8 0.8 0.03 0.04
8/3/2019 Frequency Planning in 3g
http://slidepdf.com/reader/full/frequency-planning-in-3g 5/12
5
White Paper
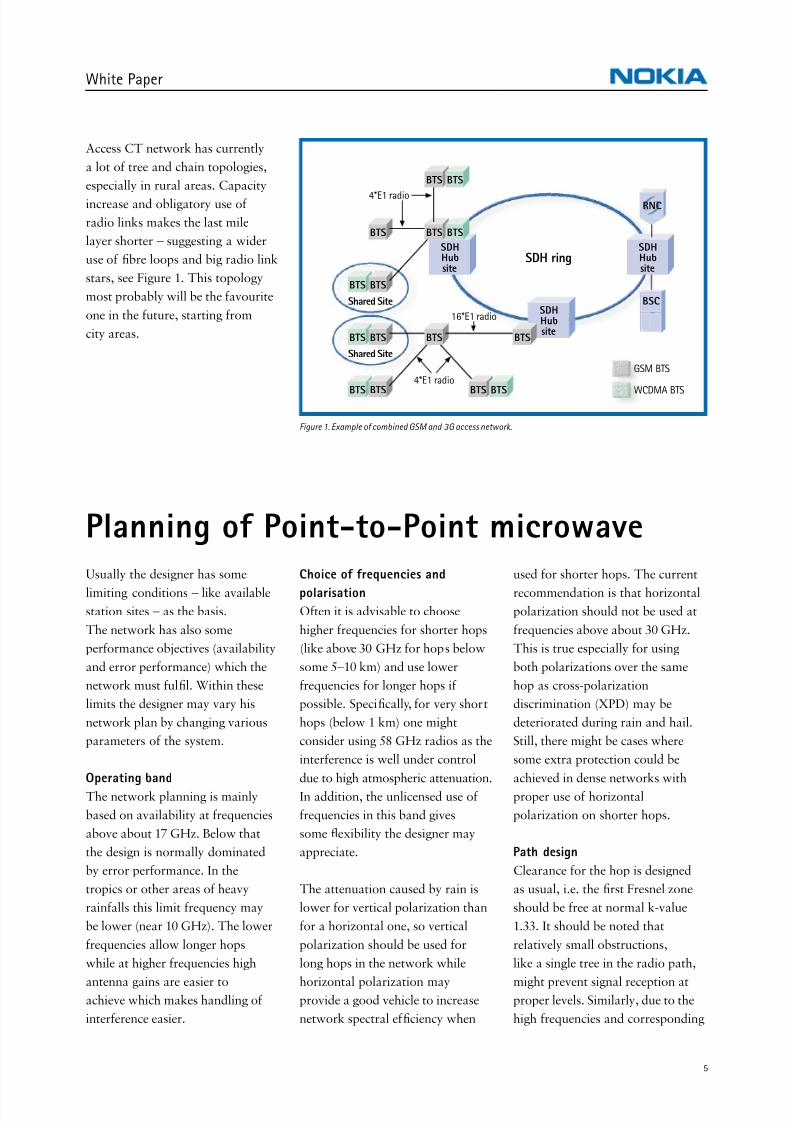
Access CT network has currently
a lot of tree and chain topologies,
especially in rural areas. Capacity
increase and obligatory use of
radio links makes the last mile
layer shorter – suggesting a wider
use of fibre loops and big radio link
stars, see Figure 1. This topology
most probably will be the favourite
one in the future, starting from
city areas.
Planning of Point-to-Point microwaveUsually the designer has some
limiting conditions – like available
station sites – as the basis.
The network has also some
performance objectives (availability
and error performance) which the
network must fulfil. Within these
limits the designer may vary his
network plan by changing various
parameters of the system.
Operating band
The network planning is mainly
based on availability at frequencies
above about 17 GHz. Below that
the design is normally dominated
by error performance. In the
tropics or other areas of heavy
rainfalls this limit frequency may
be lower (near 10 GHz). The lower
frequencies allow longer hops
while at higher frequencies high
antenna gains are easier toachieve which makes handling of
interference easier.
Choice of frequencies and
polarisationOften it is advisable to choose
higher frequencies for shorter hops
(like above 30 GHz for hops below
some 5 – 10 km) and use lower
frequencies for longer hops if
possible. Specifically, for very short
hops (below 1 km) one might
consider using 58 GHz radios as the
interference is well under control
due to high atmospheric attenuation.
In addition, the unlicensed use of
frequencies in this band gives
some flexibility the designer may
appreciate.
The attenuation caused by rain is
lower for vertical polarization than
for a horizontal one, so vertical
polarization should be used for
long hops in the network while
horizontal polarization mayprovide a good vehicle to increase
network spectral ef ficiency when
used for shorter hops. The current
recommendation is that horizontal
polarization should not be used at
frequencies above about 30 GHz.
This is true especially for using
both polarizations over the same
hop as cross-polarization
discrimination (XPD) may be
deteriorated during rain and hail.
Still, there might be cases where
some extra protection could be
achieved in dense networks with
proper use of horizontal
polarization on shorter hops.
Path design
Clearance for the hop is designed
as usual, i.e. the first Fresnel zone
should be free at normal k-value
1.33. It should be noted that
relatively small obstructions,
like a single tree in the radio path,
might prevent signal reception atproper levels. Similarly, due to the
high frequencies and corresponding
BTS
BTS
BTS
BTS
SDHHubsite
SDHHubsite
SDHHubsite
BTS
BTS
BTS
BTS
BTS
BTS
BTS
BTS
BTS
BTS
BTS
SDH ring
4*E1 radio
WCDMA BTS
GSM BTS
RNC
BSC
4*E1 radio
16*E1 radio
Shared Site
Shared Site
Figure 1. Example of combined GSM and 3G access network.
8/3/2019 Frequency Planning in 3g
http://slidepdf.com/reader/full/frequency-planning-in-3g 6/12
6
White Paper
small Fresnel zones, relatively small
areas may act as reflecting surfaces.
This is contrary to the design at
lower frequencies (below 10 GHz).
Modulation method
By choosing a modulation method
with few states (for example,
4QAM, MSK, etc.) or a system
with good error correction
capability, one may have relatively
high tolerance against noise and
interference, i.e. a low receiver
threshold power Prxth. That willallow longer hops to be built.
This will also lead to best areal
spectrum ef ficiency independently
of the hop lengths. On some
occasions – not typical for access
networks – point-to-point spectrum
ef ficiency can have more weight,
which may justify using modulation
methods with higher number of
states. Combining coding and high
state modulation like, e.g., in
trellis-coding modulation (TCM) –
may sometimes give a good
compromise between point-to-point
and areal spectral ef ficiency.
The introduction of ATM
transport requires that the RBER
(Residual Bit Error Rate) of a link
is very low. This supports also the
usage of modulation methods with
few states.
Transmitter power Ptx
Selecting higher transmitter power
Ptx will make the availability and
error performance figures better.
However, this may sometimes
cause excessive interference to other
radio links in own or other
networks. One should avoid using
unnecessarily high power.
Sometimes extra attenuators areneeded to adjust the power.
A more convenient way is to use
transmitters with selectable or
programmable power levels.
Another effective way to avoid
generating unnecessary interference
into the network is to use adaptive
transmitter power (ATP) where
high power is used only during
fading periods and otherwise a
lower power is used. A working
ATP scheme requires that there is a
return path in order to send
information about the receiving
conditions to the transmitter.
Use of error monitoring as a controlparameter is crucial in achieving
good network performance.
At star points, where several paths
converge to the same station,
a good rule of thumb for design is
to have equal received powers for
each path. Usually this means
that at least some of the far end
transmitter powers should be
adjusted. For very short hops one
might even use somewhat smaller
received levels than for the longer
ones.
Receiver threshold power Prxth
This is mainly dictated by the
selected capacity, noise figure and
used modulation method. In heavy
interference environment the
effective receiver threshold may
degrade considerably – in tightly
built networks about 3 dB or even
more. It should be reminded that
low threshold powers enable longer
hops (if the transmitted power
remains the same). It also directly
raises, in addition to filtering and
other things, interference tolerance.
Antenna gain Ga or size
The designer may increase theperformance by selecting an antenna
with higher gain, i.e. a bigger
antenna. Usually this also decreases
interference from other directions
and the interference caused to
others as well. Appropriate antenna
gains are usually between 35 and
45 dBi. Very high gain antennas may
make achieving and maintaining
antenna aligning dif ficult.
Protection methods
Use of equipment protection
(for example, hot stand-by) usually
changes system parameters by
increasing the branching loss.This should be taken into account
when calculating link performance.
Use of diversity usually changes
system parameters but also
improves error performance.
It should be noted that use of space
or frequency diversity above about
17 GHz is seldom motivated,
as they do not give protection
against rain induced unavailability.
Hop design and network
performance
Normally, the calculations start
with some existing or assumed
network configuration and with
some selected set of system
parameters (transmitter powers,
threshold powers, interference
conditions, antennas, etc.).
The error performance and
availability figures are evaluated
and checked against requirements.
Modifications are made according
to the results of calculations.
Sometimes it may turn out that
some changes are required in the
network configuration (some
additional site, path diversity etc.)
in order to achieve the targets.
Occasionally, it may also turn out
that the performance objectives assuch can be redefined and adjusted
according to the actual
8/3/2019 Frequency Planning in 3g
http://slidepdf.com/reader/full/frequency-planning-in-3g 7/12
7
White Paper
requirements. Usually, adjusting
transmitter powers and antennas
leads to the wanted final result.
However, the full calculation may
sometimes be quite a big job as the
interference between individual
links may be quite extensive in a
tightly built network. In these kinds
of situations it will be extremely
useful to use radio links which have
good tolerance against interference
as the number of hops producing
significant interference then
diminishes considerably.
The additional benefit in using
systems with low number of signal
states (or otherwise robust systems)
is that in dense networks they
lead to the best areal spectrum
ef ficiency, i.e. the highest number
of transmitted bits per square
kilometre. The required increase
in power against noise and
interference is for 16QAM, 64QAM
and 128QAM compared to 4QAM
as follows (uncoded systems):
7, 13 and 16 dB. The result is that
these modulation methods with
high number of states are very
inef ficient in dense networks
containing many randomly oriented
links (mesh network).
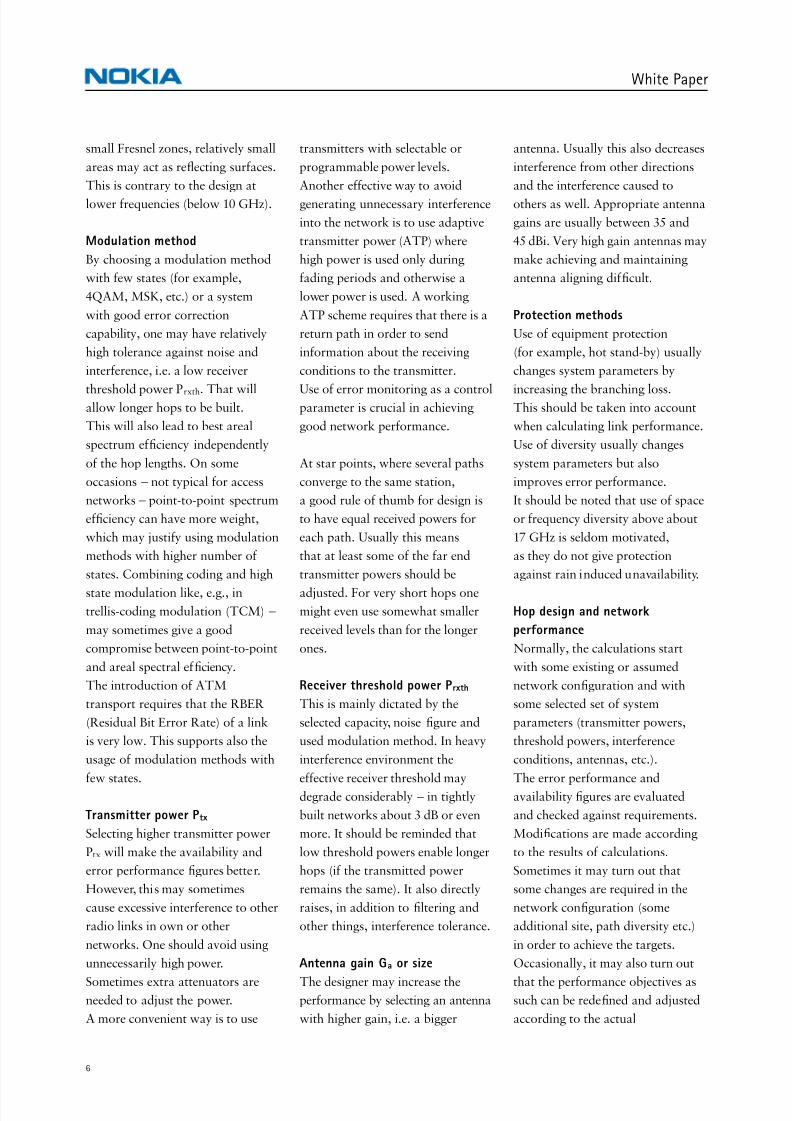
Figure 2 depicts the areal spectrum
ef ficiencies in a mesh network
with randomly oriented hops as a
function of fade margin and
network density threshold. Due to
different threshold powers, the
tolerance to interference is much
better in 4QAM than in other
systems in a case where areal
spectrum ef ficiency is determined
by only taking into account the
area occupied due to interference,and no limitation is given for the
network density, i.e. the node
density threshold = 0. Practical
cases have shown that = 0.25
and = 0.50 correspond to high
and medium density networks,
respectively. However, the new
urban networks where several
operators may operate in the same
geographical area, may approach
zero indicating that there might
be several transmitters near each
other. The density threshold can be
calculated in real network by
dividing the entire geographical
area by the number of sites and the
square of average hop length.
The example shown in Figure 2
depicts that the best ef ficiency is
achieved with 4QAM and 32TCM
modulation for most of the
interesting fade margins in dense
networks at 26 GHz. 32 TCM givesalways better or equal ef ficiency
compared to 16 QAM due better
tolerance and equal number of
information bits per symbol.
The area of equal ef ficiency is shown
in grey colours. Similar results
apply also for other frequencies.
The general trend of the areal
spectrum ef ficiency is in favour of
the 4-level modulation schemes
in very dense networks, with rather
low gain antennas, when a large
fade margin is required, or when
only little degradation due to
interference is accepted.
The yellow hexagon in the Figure 2
indicates roughly the typical
operation area in access networks
where terminal density is relatively
high. In dense networks hop
lengths are short and therefore the
required fade margin is relatively
small. The reverse is true for sparsenetworks.
Node density threshold
10Fade margin (dB)
0.0
128QAM
30
Medium density
29282726252423222120191817161514131211
0.8
0.7
0.6
0.5
0.4
0.3
0.2
0.1
32TCM or 16QAM 32TCM 4QAM
Infinite density
High density
Low density
Typical operation area
Figure 2. The modulation method that is giving the best areal spectrum efficiency as a function of fade margin
and network density threshold with performance degradation 3 dB, D = 0.3 m, f = 26 GHz, and BER = 10 -6 .
8/3/2019 Frequency Planning in 3g
http://slidepdf.com/reader/full/frequency-planning-in-3g 8/12
8
White Paper
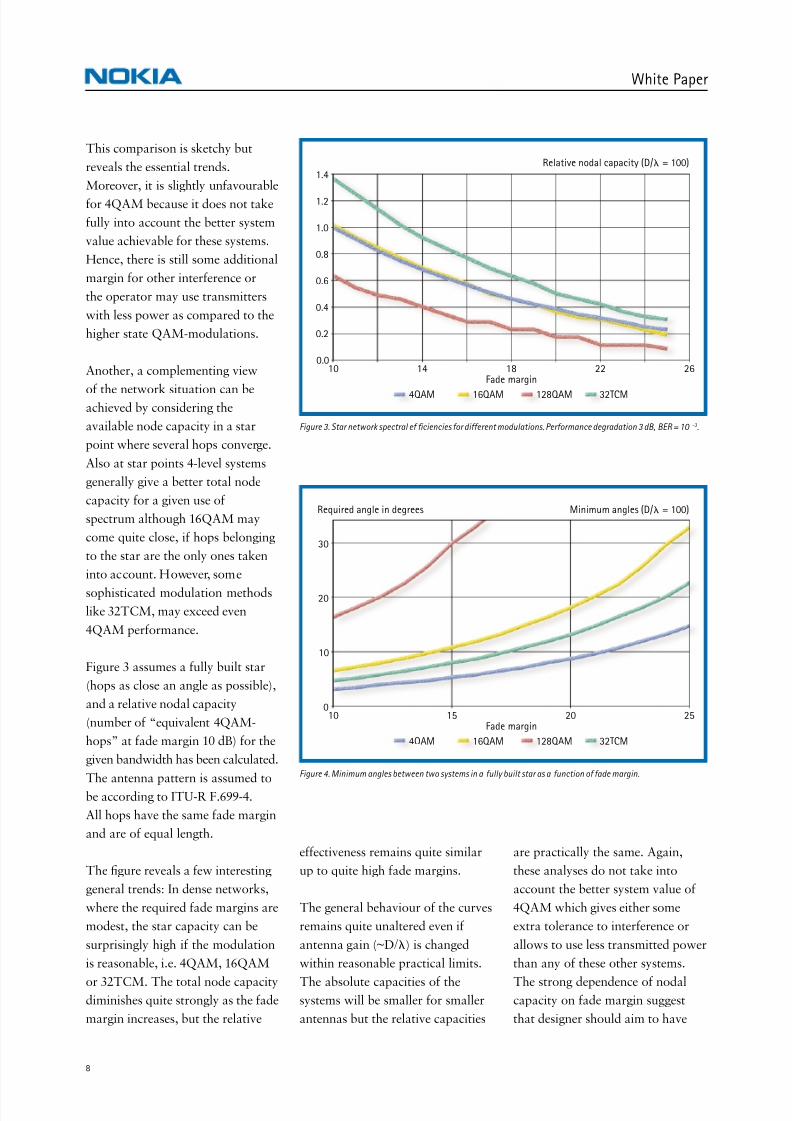
This comparison is sketchy but
reveals the essential trends.
Moreover, it is slightly unfavourable
for 4QAM because it does not take
fully into account the better system
value achievable for these systems.
Hence, there is still some additional
margin for other interference or
the operator may use transmitters
with less power as compared to the
higher state QAM-modulations.
Another, a complementing view
of the network situation can beachieved by considering the
available node capacity in a star
point where several hops converge.
Also at star points 4-level systems
generally give a better total node
capacity for a given use of
spectrum although 16QAM may
come quite close, if hops belonging
to the star are the only ones taken
into account. However, some
sophisticated modulation methods
like 32TCM, may exceed even
4QAM performance.
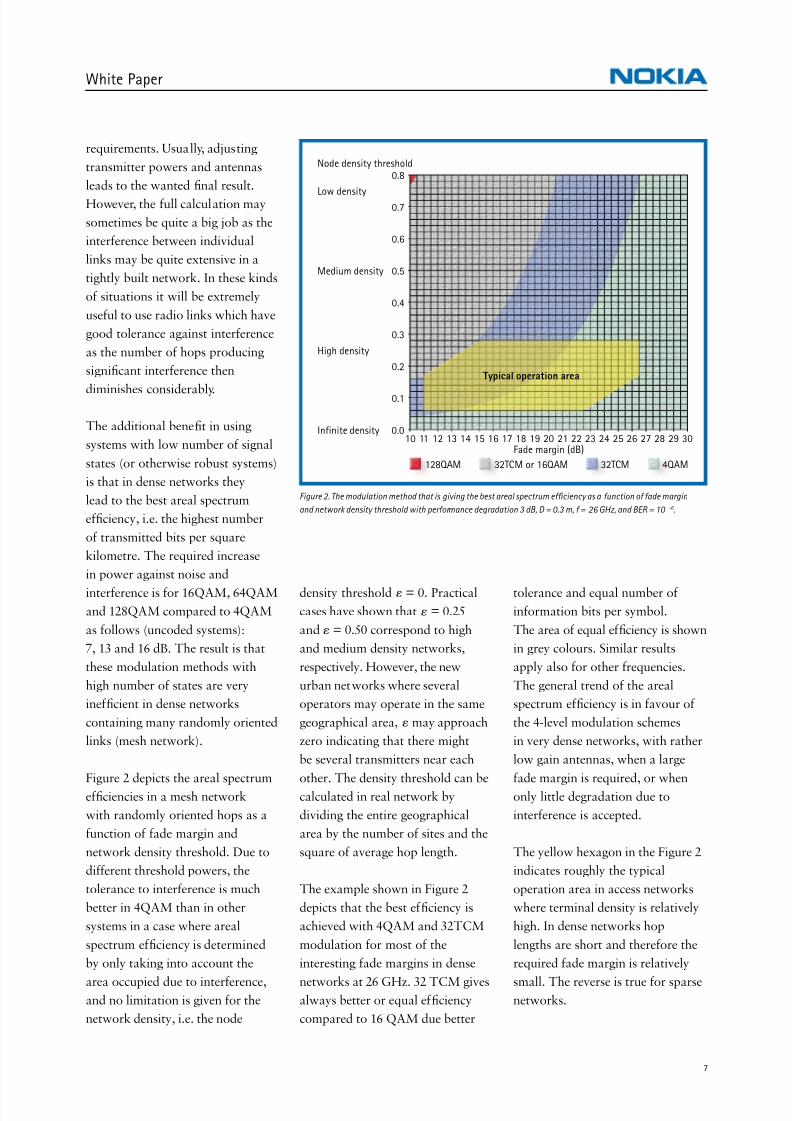
Figure 3 assumes a fully built star
(hops as close an angle as possible),
and a relative nodal capacity
(number of “equivalent 4QAM-
hops” at fade margin 10 dB) for the
given bandwidth has been calculated.
The antenna pattern is assumed to
be according to ITU-R F.699-4.
All hops have the same fade margin
and are of equal length.
The figure reveals a few interesting
general trends: In dense networks,
where the required fade margins are
modest, the star capacity can be
surprisingly high if the modulation
is reasonable, i.e. 4QAM, 16QAM
or 32TCM. The total node capacitydiminishes quite strongly as the fade
margin increases, but the relative
effectiveness remains quite similar
up to quite high fade margins.
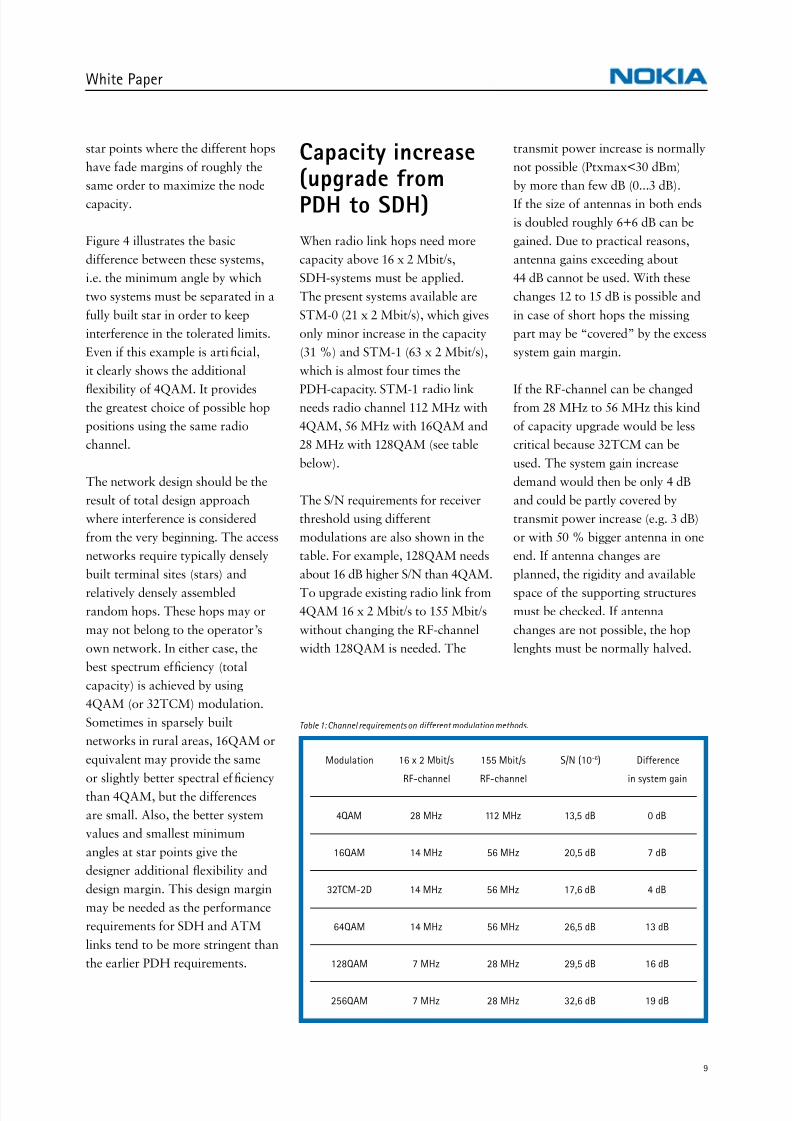
The general behaviour of the curves
remains quite unaltered even if
antenna gain (~D/) is changed
within reasonable practical limits.
The absolute capacities of thesystems will be smaller for smaller
antennas but the relative capacities
are practically the same. Again,
these analyses do not take into
account the better system value of
4QAM which gives either some
extra tolerance to interference or
allows to use less transmitted power
than any of these other systems.
The strong dependence of nodalcapacity on fade margin suggest
that designer should aim to have
1.4
10Fade margin
0.0
4QAM 16QAM 128QAM 32TCM
26221814
1.2
1.0
0.8
0.6
0.4
0.2
Relative nodal capacity (D/ = 100)
Required angle in degrees
10Fade margin
0
4QAM 16QAM 128QAM 32TCM
252015
30
20
10
Minimum angles (D/ = 100)
Figure 3. Star network spectral ef fi ciencies for different modulations. Performance degradation 3 dB, BER = 10 -3.
Figure 4. Minimum angles between two systems in a fully built star as a function of fade margin.
8/3/2019 Frequency Planning in 3g
http://slidepdf.com/reader/full/frequency-planning-in-3g 9/12
9
White Paper
star points where the different hops
have fade margins of roughly the
same order to maximize the node
capacity.
Figure 4 illustrates the basic
difference between these systems,
i.e. the minimum angle by which
two systems must be separated in a
fully built star in order to keep
interference in the tolerated limits.
Even if this example is artificial,
it clearly shows the additional
flexibility of 4QAM. It providesthe greatest choice of possible hop
positions using the same radio
channel.
The network design should be the
result of total design approach
where interference is considered
from the very beginning. The access
networks require typically densely
built terminal sites (stars) and
relatively densely assembled
random hops. These hops may or
may not belong to the operator’s
own network. In either case, the
best spectrum ef ficiency (total
capacity) is achieved by using
4QAM (or 32TCM) modulation.
Sometimes in sparsely built
networks in rural areas, 16QAM or
equivalent may provide the same
or slightly better spectral ef ficiency
than 4QAM, but the differences
are small. Also, the better system
values and smallest minimum
angles at star points give the
designer additional flexibility and
design margin. This design margin
may be needed as the performance
requirements for SDH and ATM
links tend to be more stringent than
the earlier PDH requirements.
Capacity increase(upgrade fromPDH to SDH)
When radio link hops need more
capacity above 16 x 2 Mbit/s,
SDH-systems must be applied.
The present systems available are
STM-0 (21 x 2 Mbit/s), which gives
only minor increase in the capacity
(31 %) and STM-1 (63 x 2 Mbit/s),
which is almost four times the
PDH-capacity. STM-1 radio linkneeds radio channel 112 MHz with
4QAM, 56 MHz with 16QAM and
28 MHz with 128QAM (see table
below).
The S/N requirements for receiver
threshold using different
modulations are also shown in the
table. For example, 128QAM needs
about 16 dB higher S/N than 4QAM.
To upgrade existing radio link from
4QAM 16 x 2 Mbit/s to 155 Mbit/s
without changing the RF-channel
width 128QAM is needed. The
Modulation 16 x 2 Mbit/s 155 Mbit/s S/N (10-6) Difference
RF-channel RF-channel in system gain
4QAM 28 MHz 112 MHz 13,5 dB 0 dB
16QAM 14 MHz 56 MHz 20,5 dB 7 dB
32TCM-2D 14 MHz 56 MHz 17,6 dB 4 dB
64QAM 14 MHz 56 MHz 26,5 dB 13 dB
128QAM 7 MHz 28 MHz 29,5 dB 16 dB
256QAM 7 MHz 28 MHz 32,6 dB 19 dB
transmit power increase is normally
not possible (Ptxmax<30 dBm)
by more than few dB (0...3 dB).
If the size of antennas in both ends
is doubled roughly 6+6 dB can be
gained. Due to practical reasons,
antenna gains exceeding about
44 dB cannot be used. With these
changes 12 to 15 dB is possible and
in case of short hops the missing
part may be “covered” by the excess
system gain margin.
If the RF-channel can be changedfrom 28 MHz to 56 MHz this kind
of capacity upgrade would be less
critical because 32TCM can be
used. The system gain increase
demand would then be only 4 dB
and could be partly covered by
transmit power increase (e.g. 3 dB)
or with 50 % bigger antenna in one
end. If antenna changes are
planned, the rigidity and available
space of the supporting structures
must be checked. If antenna
changes are not possible, the hop
lenghts must be normally halved.
Table 1: Channel requirements on different modulation methods.
8/3/2019 Frequency Planning in 3g
http://slidepdf.com/reader/full/frequency-planning-in-3g 10/12
10
White Paper
Effect of technology changeto link planning
The existing radio links have been
planned using parameters for PDH or
SDH systems such as SES (Severely
Errored Seconds), ES (Errored
Seconds), RBER (Residual Bit Error
Rate), BBER (Background Block
Error Ratios) for which some time
percentages of worst month has
been allocated. When planning isbased on 64 kbit/s ISDN-paths
(ITU-T G.821), several different
grades of quality can be applied,
such as High Grade, Medium Grade
(4 sub-classes) or Local Grade.
This applies mainly to existing
PDH-radio links. For mobile system
infrastructures typically one of the
Medium Grade classes is applied
(Class 3). When planning is based
on primary level or above paths
(ITU-T G.826) International portion
and National portion are specified.
National portion has been sub-
divided into Long-haul, Short-haul
and Access sections. This applies
mainly to existing SDH-radio links.
New international synchronous
paths should be planned according
to ITU-T G.828, which applies also
to national or private synchronous
paths. New ITU-T G.828 specifies
recommended block based error
performance parameters for
synchronous digital paths whichmay support circuit switched,
packet switched, and leased circuit
services. Synchronous digital paths
meeting the objectives of G.828 will
enable ATM traf fic to meet
B-ISDN-requirements of I.356.
Radio links planned according to
G.826 using ITU-R F.1189 or F.1092
can fulfil ATM-requirements if
residual BER is lower than about
10 – 11 per 100 km path. (In practice,
Regulatory aspects
The highest applicable frequency
band should be selected depending
on required hop length and
transmission capacity. Frequency
license fee policy of regulators tries
to promote this principle in order
to save lower frequency bands for
longer hops or special applications.
There is also a continuous and
growing need also for 56 MHz
channels to carry 155 Mbit/s using
16QAM or 32TCM modulations
since, for example, 128QAM-type
systems cannot offer good enoughareal spectral ef ficiency.
In a dense network, high order
modulations do not necessarily give
higher spectral ef ficiency compared
to lower order modulations. In case
when the hop density is very high
4QAM clearly seems to give the best
areal spectrum ef ficiency. However,
narrow frequency blocks available
for the operators may place additional
limitations to the spectral ef ficiency
considerations. This situation may
favour higher level modulations.
In urban environment the required
hop lengths are generally relativelyshort which also affects to the
spectral ef ficiency calculations.
four level modulation or FEC fulfils
this RBER requirement). If old
PDH-radio links which have been
planned according to requirements of
G.821 will be utilized recalculations
must be done for which fade margin
corresponding to threshold level at
about BER=10-5 is needed:
• If the frequency band is below
about 17 GHz, multi-path outage
probability during worst month
must be calculated according to
F.530-8 and the result compared
to SECBR (Severely Errored CellBlock Ratio)-limit.
• If the frequency band is above about
17 GHz, rain outage probability of
worst month must be calculated
according to F.530-8 and the
result compared to unavailability
target applicable to the network
(not yet specified to ATM,
recommended spec. ITU-R F.1493).
• Residual BER should be below
10-11 which can be also measured
by a suitable BER test
Among coded modulation schemes
32TCM seems to be the most
promising because C/I requirement
is in midway between 4QAM and
16QAM, but the net capacity and
the spectrum width is nearly the
same as those of 16QAM. In order
to cater for the mix of technologies
and services to be delivered at the
same frequency band, it is most
appropriate that a block (or blocks)
of spectrum is made available to a
potential operator in a manner
consistent with the technology andmarket that the operator may wish
to address.
8/3/2019 Frequency Planning in 3g
http://slidepdf.com/reader/full/frequency-planning-in-3g 11/12
11
White Paper
Copyright © Nokia Networks Oy 2001. All rights reserved.
No part of this publication may be copied, distributed, transmitted, transcribed, stored in a retrieval system, or translated into any human or computer language
without the prior written permission of Nokia Networks Oy.
The manufacturer has made every effort to ensure that the instructions contained in the documents are adequate and free of errors and omissions.
The manufacturer will, if necessary, explain issues which may not be covered by the documents. The manufacturer’s liability for any errors in the documents is limited
to the correction of errors and the aforementioned advisory services.
The documents have been prepared to be used by professional and properly trained personnel, and the customer assumes full responsibility when using them.
The manufacturer welcomes customer comments as part of the process of continual development and improvement of the documentation in the best way possiblefrom the user’s viewpoint. Please submit your comments to the nearest Nokia sales representative.
NOKIA is a registered trademark of Nokia Corporation. Any other trademarks mentioned in this document are the properties of their respective owners.
ConclusionsThe introduction of 3G will also
have a significant effect on cellular
transmission, which has to be taken
into account in network planning.
The main conclusions are:
• Capacity requirements will
increase significantly to several
Mbit/s per site.
• Fibre optic based solutions will
be taken into use also in regional
networks.• Microwave point-to-point radios
will continue to be the main last
mile access technology, because
typically there is no fibre available
at BTS site.
• Network topology is assumed
to change towards more simple
star type of topology (or short
chains).
• Current PDH radios can be used
to transport ATM traf fic, though
new planning recommendations
should be taken into use.
• The introduction of 3G will force
operators to use the existing
frequency bands as ef ficiently aspossible and also to find new
frequency bands.
• Robust modulation methods like
4QAM provides best areal spectrum
ef ficiency in dense networks.
8/3/2019 Frequency Planning in 3g
http://slidepdf.com/reader/full/frequency-planning-in-3g 12/12
N o k i a c o d e : 1 0 9 6 9
0 4 0 1 L i b r i s
© N o k i a N e t w o r k s 2 0 0 1 .
A l l r i g h t s r e s e r v e d .
N o k i a a n d N o k i a C o n n e c t i n g P e o p l e a r e r e g i s t e r e d t r a d e m a r k s o f N
o k i a C o r p o r a t i o n .
O t h e r p r o d u c t a n d c o m p a n y n a m e s m e n t i o n e d h e r e i n m a y b e t r a d
e m a r k s o r t r a d e n a m e s o f t h e i r r e s p e c t i v e o w n e r s .
P r o d u c t s a r e s u b j e c t t o c h a n g e w i t h o u t n o t i c e .
Nokia Networks
P.O. Box 300
FIN-00045 NOKIA GROUP, Finland
Phone: +358 (0) 7180 08000
www.nokia.com