Embed Size (px)
Citation preview
Frequency-modulated atomic force microscopy operation by imaging at the frequencyshift minimum: The dip-df modeSebastian Rode, Martin Schreiber, Angelika Kühnle, and Philipp Rahe
Citation: Review of Scientific Instruments 85, 043707 (2014); doi: 10.1063/1.4871436 View online: http://dx.doi.org/10.1063/1.4871436 View Table of Contents: http://scitation.aip.org/content/aip/journal/rsi/85/4?ver=pdfcov Published by the AIP Publishing Articles you may be interested in Modification of a commercial atomic force microscopy for low-noise, high-resolution frequency-modulationimaging in liquid environment Rev. Sci. Instrum. 82, 073703 (2011); 10.1063/1.3606399 Combined normal and torsional mode in frequency-modulation atomic force microscopy for lateral dissipationmeasurement Appl. Phys. Lett. 88, 153112 (2006); 10.1063/1.2194367 Higher harmonics imaging in tapping-mode atomic-force microscopy Rev. Sci. Instrum. 74, 5111 (2003); 10.1063/1.1626008 A direct method to calculate tip–sample forces from frequency shifts in frequency-modulation atomic forcemicroscopy Appl. Phys. Lett. 78, 123 (2001); 10.1063/1.1335546 Rapid imaging of calcite crystal growth using atomic force microscopy with small cantilevers Appl. Phys. Lett. 73, 1658 (1998); 10.1063/1.122237
This article is copyrighted as indicated in the article. Reuse of AIP content is subject to the terms at: http://scitationnew.aip.org/termsconditions. Downloaded to IP:
79.254.255.7 On: Mon, 28 Apr 2014 15:32:23

REVIEW OF SCIENTIFIC INSTRUMENTS 85, 043707 (2014)
Frequency-modulated atomic force microscopy operationby imaging at the frequency shift minimum: The dip-df mode
Sebastian Rode,a) Martin Schreiber,b) Angelika Kühnle,b) and Philipp Rahec)
Institut für Physikalische Chemie, Fachbereich Chemie, Johannes Gutenberg-Universität Mainz,Duesbergweg 10-14, 55099 Mainz, Germany
(Received 22 November 2013; accepted 3 April 2014; published online 28 April 2014)
In frequency modulated non-contact atomic force microscopy, the change of the cantilever frequency(�f) is used as the input signal for the topography feedback loop. Around the �f(z) minimum, how-ever, stable feedback operation is challenging using a standard proportional-integral-derivative (PID)feedback design due to the change of sign in the slope. When operated under liquid conditions, itis furthermore difficult to address the attractive interaction regime due to its often moderate peaked-ness. Additionally, the �f signal level changes severely with time in this environment due to driftof the cantilever frequency f0 and, thus, requires constant adjustment. Here, we present an approachovercoming these obstacles by using the derivative of �f with respect to z as the input signal for thetopography feedback loop. Rather than regulating the absolute value to a preset setpoint, the slopeof the �f with respect to z is regulated to zero. This new measurement mode not only makes theminimum of the �f(z) curve directly accessible, but it also benefits from greatly increased opera-tion stability due to its immunity against f0 drift. We present isosurfaces of the �f minimum ac-quired on the calcite CaCO3(1014) surface in liquid environment, demonstrating the capability ofour method to image in the attractive tip-sample interaction regime. © 2014 AIP Publishing LLC.[http://dx.doi.org/10.1063/1.4871436]
I. INTRODUCTION
Over the last decades, atomic force microscopy (AFM)has proven to be one of the most useful techniques for resolv-ing surface structures from the mesoscopic scale down to theatomic level in fields such as surface science, biochemistry,or materials science.1 Especially in the frequency-modulated(FM) non-contact (NC) mode, atomic resolution is nowa-days routinely achieved when operating the AFM under ultra-high vacuum conditions.2 Recently, the success of atomic-scale imaging has been transferred to the liquid environment,3
demonstrating atomic-resolution imaging on surfaces suchas, e.g., mica(001),4 calcite(104),5–8 aragonite(001),9 calciumdifluorite10 as well as LiNbO3(001),11 and, furthermore, high-resolution imaging on molecular systems.12
These achievements have only been possible after care-fully optimizing the experimental setup for increasing thesignal-to-noise ratio.3, 13 However, operating FM NC-AFM inliquid environment still requires a delicate adjustment of thescanning parameters compared to other AFM modes in dif-ferent environments. Here we note that, first, usually largedrift not only distorts the acquired images in all three spa-tial directions,14 but additionally causes a severe change ofthe cantilever reference frequency in time.15 This drift islikely caused by thermal fluctuations of the AFM system,by an evaporation of the liquid or by stray excitations of
a)Present address: SmarAct GmbH, Schuette-Lanz-Strasse 9, 26135Oldenburg, Germany.
b)URL: http://www.self-assembly.uni-mainz.de.c)Present address: Department of Physics and Astronomy, The University of
Utah, 115 South 1400 West, Salt Lake City, UT 84112, USA; Electronicmail: [email protected].
the surrounding environment. In principle, each of these is-sues can be addressed individually by a careful experimen-tal design.3, 4, 9, 16–18 Second, finding a suitable �f setpoint forimaging in the repulsive regime can be delicate and imagingin this regime might significantly wear off the scanning probetip. Third, imaging in liquids is typically performed in the re-pulsive tip-sample interaction regime. This is due to the factthat in the attractive regime the frequency shift signal does of-ten not largely deviate from the noise level, even at the largestnegative values. As a consequence, the attractive regime ishardly accessible. The latter statement is especially true whenconsidering drift in f0, easily causing absolute frequency driftsthat are larger than the �f(z) minimum. This possibly bringsthe feedback loop into an instable regime. Last, the ampli-tude spectrum usually resembles the well-known “forest ofpeaks,” where numerous resonances besides the cantileverresonance are apparent due to the environment.19–21 This is-sue has been addressed by using direct actuation methodssuch as magnetic,22 photothermal,16, 23 and electrostatic20, 24
excitation.Here, we present a new measurement mode where the
tip-sample distance is adjusted such that imaging is alwaysperformed at the minimum of the �f(z) curve. The existenceof a minimum in the �f(z) curve is a prerequisite for using thismeasurement mode. This mode is introduced as a promisingstrategy addressing the aforementioned challenges and pro-viding most practical solutions to them: First, it is immuneagainst drift of the cantilever reference frequency as we regu-late on the z derivative of the �f signal. Second, the setpointfor the distance feedback loop is well-defined and does not re-quire any adjustment, and third, it images the sample systemin the overall attractive regime.
0034-6748/2014/85(4)/043707/5/$30.00 © 2014 AIP Publishing LLC85, 043707-1
This article is copyrighted as indicated in the article. Reuse of AIP content is subject to the terms at: http://scitationnew.aip.org/termsconditions. Downloaded to IP:
79.254.255.7 On: Mon, 28 Apr 2014 15:32:23

043707-2 Rode et al. Rev. Sci. Instrum. 85, 043707 (2014)
Imaging in the overall attractive regime is gentler thanimaging in the repulsive regime. Consequently, we expect ourmeasurement mode to reduce modifications of sensitive ma-terials such as biological samples or other soft matter.
II. PRINCIPLE
The main measurement signal in FM NC-AFM is the fre-quency shift �f, defined by �f = f − f0.25 Here, f0 is the fre-quency of the cantilever oscillating without any tip-sample in-teraction, which changes to f when the tip is interacting withthe sample. The frequency shift �f is related to the tip-sampleinteraction force Fts by convolving the force with a weight-ing function resembling the cantilever oscillation.26 The fre-quency shift �f(z) along the tip-sample distance z usually fol-lows a curve qualitatively similar to the interaction force asdepicted in Fig. 1 (solid green curve): Far away from the sur-face in the long-range regime, the interaction is basically zero.Upon approach, at first long-range attractive van der Waalsand electrostatic interactions are the dominant interactions,leading to a negative shift in �f. A minimum is passed whenrepulsive interactions become more pronounced upon reduc-ing the tip-sample distance and, finally, repulsive interactionsdominate, typically when the frequency shift is positive.27
In Fig. 1, the derivative �f ′(z) (dashed orange curve)is presented in addition to the �f(z) curve (solid green).The derivative exhibits a maximum at the inflection pointof the �f(z) curve and, most importantly, has its root at the�f(z) minimum position. The method described here usesthis derivative as the input signal for the topography feedbackloop. When keeping the �f ′ setpoint at zero, the topographysignal will map an isosurface of �f(z) = min, i.e., the verti-cal position of the �f(z) minimum for each lateral point. Thisspecific position along the �f(z) curve is usually inaccessiblewith a feedback relying on a monotonic behavior due to thechange in sign of the slope in the �f(z) curve.
Experimentally, the derivative is directly accessible us-ing a well-known lock-in principle: the z piezo signal is mod-ulated with frequency fmod and amplitude Amod. The am-plitude and phase of the resulting oscillation in �f are thenmeasured using a lock-in amplifier. The technical implemen-tation is presented in Sec. III.
Modulation techniques of the Z position have been usedbefore to rapidly discriminate between different chemicalspecies from the slope of �f(z) curves.28 Furthermore, Z mod-ulation has been used to quickly recover the nonlinear �f(z)
FIG. 1. Schematic �f(z) interaction curve for FM NC-AFM experiments(solid green) and corresponding derivative �f ′(z) curve (dashed orange). Thetrajectory of the tip z(t) and the resulting �f(t) signal are included in solid redand orange, respectively.
curve from measuring the higher harmonics in the frequencyshift signal.29
III. IMPLEMENTATION
For implementing our “dip-df” mode, where the tip-sample distance is regulated to the minimum dip of the �f(z)curve, an oscillating signal with amplitude Amod and fre-quency fmod is added to the high-voltage z signal from thescan controller. This leads to a modulation of the tip-sampledistance, which, in turn, results in a modulation of the fre-quency shift �f.29 As depicted in Fig. 1, this oscillation alongthe z direction results in an oscillation of the �f signal if theslope of the �f(z) curve differs from zero, i.e., within the sam-ple range. The amplitude of this oscillation in the �f channelis dependent on the slope of the �f(z) interaction and ap-proaches zero at the �f(z) minimum position. As the phasebetween the z oscillation signal and the �f oscillation changesby 180◦ when passing the �f(z) minimum, in addition the signof the slope is readily available. Technically, the amplitudeincluding the 180◦ phase shift when passing the minimum iseasily detected using the in-phase signal of a lock-in amplifier.
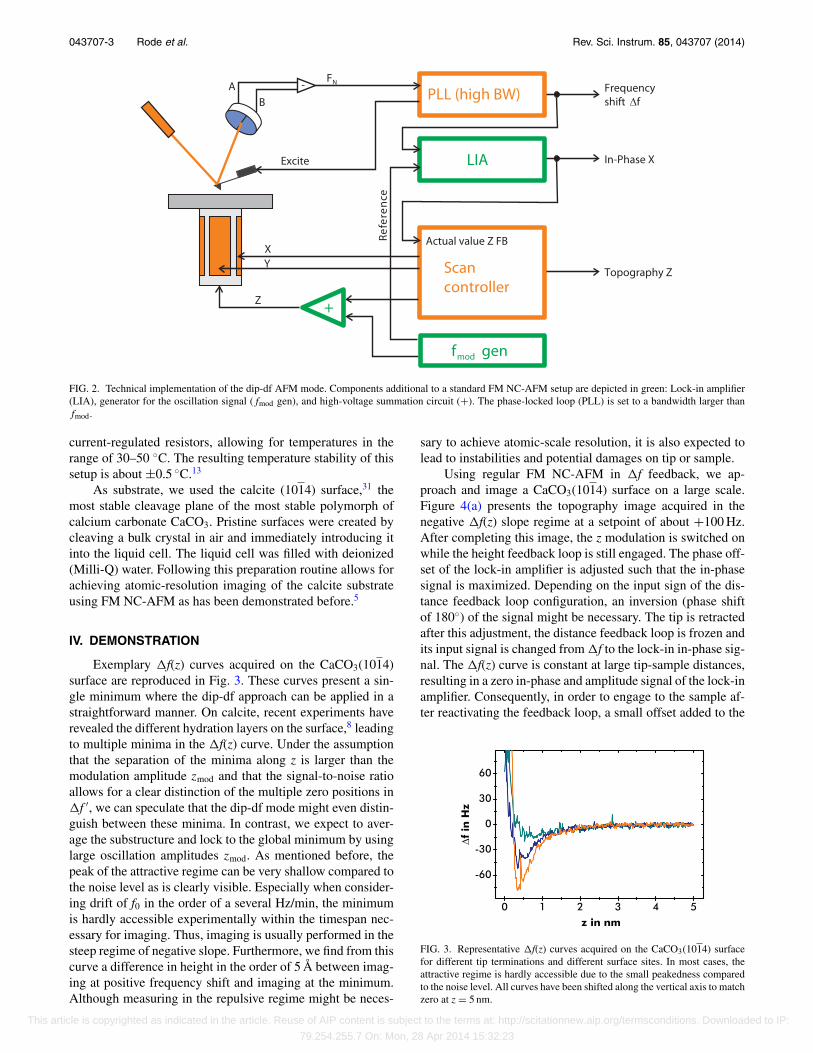
Fig. 2 depicts the technical implementation of the dip-dfmethod. Only two changes are necessary compared to a stan-dard FM NC-AFM setup: First, a sinusoidal signal is addedto the z signal generated by the scan controller and, second,the in-phase (X) signal of the lock-in amplifier is fed intothe topography feedback loop as input signal. The �f signalfrom the PLL is then used as the input signal for the lock-inamplifier.
The signal summation is realized by adding the sinu-soidal signal from a frequency generator to the scan con-troller signal. We used a mass-decoupled concept for the low-noise summation of low-voltage to high-voltage signals asdescribed in Ref. 30.
As PLL and lock-in amplifier we used an HF2 devicefrom Zurich Instruments (Zurich, Switzerland). For the zmodulation, a frequency in the range of fmod = 6–8 kHz andan amplitude of about Amod = 100 mV were used. This ampli-tude corresponds to a physical amplitude of about 1.5 Å us-ing the calibration for the herein used modified Bruker Mul-timode V atomic force microscope.13 The PLL was set to abandwidth slightly larger than fmod, while the response ofthe z feedback loop was set significantly slower. The timeconstant of the lock-in amplifier was in the order of 30 μs.For regular FM NC-AFM experiments, an easyPLL plus(Nanosurf, Neuchâtel, Switzerland) controller and detectorwith a bandwidth of 1300 Hz was used in parallel for prac-tical reasons. The reference frequency was determined fromthe excitation spectrum far away from the sample surface.
The dip-df method implementation and all experimentswere performed using a modified Bruker Multimode V AFM,optimized for low-noise performance in the FM NC-AFMmode.13 Gold coated p-doped silicon cantilevers (type PPP-NCH-AuD from Nanosensors, Neuchâtel, Switzerland) withtypical frequencies of around 160 kHz in liquid were op-erated at amplitudes of around 1–2 nm. The microscopeis enclosed by a home-built measurement chamber. Thetemperature of the entire compartment is controlled by
This article is copyrighted as indicated in the article. Reuse of AIP content is subject to the terms at: http://scitationnew.aip.org/termsconditions. Downloaded to IP:
79.254.255.7 On: Mon, 28 Apr 2014 15:32:23
043707-3 Rode et al. Rev. Sci. Instrum. 85, 043707 (2014)
FIG. 2. Technical implementation of the dip-df AFM mode. Components additional to a standard FM NC-AFM setup are depicted in green: Lock-in amplifier(LIA), generator for the oscillation signal (fmod gen), and high-voltage summation circuit (+). The phase-locked loop (PLL) is set to a bandwidth larger thanfmod.
current-regulated resistors, allowing for temperatures in therange of 30–50 ◦C. The resulting temperature stability of thissetup is about ±0.5 ◦C.13
As substrate, we used the calcite (1014) surface,31 themost stable cleavage plane of the most stable polymorph ofcalcium carbonate CaCO3. Pristine surfaces were created bycleaving a bulk crystal in air and immediately introducing itinto the liquid cell. The liquid cell was filled with deionized(Milli-Q) water. Following this preparation routine allows forachieving atomic-resolution imaging of the calcite substrateusing FM NC-AFM as has been demonstrated before.5
IV. DEMONSTRATION
Exemplary �f(z) curves acquired on the CaCO3(1014)surface are reproduced in Fig. 3. These curves present a sin-gle minimum where the dip-df approach can be applied in astraightforward manner. On calcite, recent experiments haverevealed the different hydration layers on the surface,8 leadingto multiple minima in the �f(z) curve. Under the assumptionthat the separation of the minima along z is larger than themodulation amplitude zmod and that the signal-to-noise ratioallows for a clear distinction of the multiple zero positions in�f ′, we can speculate that the dip-df mode might even distin-guish between these minima. In contrast, we expect to aver-age the substructure and lock to the global minimum by usinglarge oscillation amplitudes zmod. As mentioned before, thepeak of the attractive regime can be very shallow compared tothe noise level as is clearly visible. Especially when consider-ing drift of f0 in the order of a several Hz/min, the minimumis hardly accessible experimentally within the timespan nec-essary for imaging. Thus, imaging is usually performed in thesteep regime of negative slope. Furthermore, we find from thiscurve a difference in height in the order of 5 Å between imag-ing at positive frequency shift and imaging at the minimum.Although measuring in the repulsive regime might be neces-
sary to achieve atomic-scale resolution, it is also expected tolead to instabilities and potential damages on tip or sample.
Using regular FM NC-AFM in �f feedback, we ap-proach and image a CaCO3(1014) surface on a large scale.Figure 4(a) presents the topography image acquired in thenegative �f(z) slope regime at a setpoint of about +100 Hz.After completing this image, the z modulation is switched onwhile the height feedback loop is still engaged. The phase off-set of the lock-in amplifier is adjusted such that the in-phasesignal is maximized. Depending on the input sign of the dis-tance feedback loop configuration, an inversion (phase shiftof 180◦) of the signal might be necessary. The tip is retractedafter this adjustment, the distance feedback loop is frozen andits input signal is changed from �f to the lock-in in-phase sig-nal. The �f(z) curve is constant at large tip-sample distances,resulting in a zero in-phase and amplitude signal of the lock-inamplifier. Consequently, in order to engage to the sample af-ter reactivating the feedback loop, a small offset added to the
FIG. 3. Representative �f(z) curves acquired on the CaCO3(1014) surfacefor different tip terminations and different surface sites. In most cases, theattractive regime is hardly accessible due to the small peakedness comparedto the noise level. All curves have been shifted along the vertical axis to matchzero at z = 5 nm.
This article is copyrighted as indicated in the article. Reuse of AIP content is subject to the terms at: http://scitationnew.aip.org/termsconditions. Downloaded to IP:
79.254.255.7 On: Mon, 28 Apr 2014 15:32:23

043707-4 Rode et al. Rev. Sci. Instrum. 85, 043707 (2014)
FIG. 4. (a) Regular FM NC-AFM mode using the frequency shift �f as inputfor the topography feedback loop. (b) Dip-df AFM mode using the derivation�f ′(z) as input signal for the topography feedback loop with setpoint zero.The resulting image, thus, represents the isoplane of minimum �f. Both im-ages were compensated for vertical thermal drift, scanner hysteresis, sam-ple tilt, and tip changes by a line-by-line and second order polynomial cor-rection. The position of the line profile extracted from the frequency shiftchannel (see Fig. 5) is marked by a black line. Parameters for both images:512 × 512 pixel2 at 1 line/s (forward and backward scan).
in-phase lock-in signal is usually necessary. After stabilizingthe tip position close to the surface, this offset is set to zerofor stabilizing the tip precisely at the minimum of the �f(z)curve. We note that the intermediate maximum of the �f ′(z)curve is not causing feedback instabilities and can easily bepassed as we regulate on the zero position.
Figure 4(b) presents the topography channel when oper-ating in the dip-df mode. The topography now directly resem-bles the isosurface of the �f(z) minimum position. The dataacquired in the regular FM mode and the dip-df mode are ac-quired at the same sample position, the lateral movement iscaused by drift. In both images, calcite step edges and an etchpit due to calcite dissolution in water are resolved.
By comparing the two topography images (see Fig. 4),we observe a slight increase in the topography signal noisefor the dip-df mode. Although the RMS noise in the topog-raphy signal can by itself already be subject to the feedback
FIG. 5. Averaged line profile extracted at the indicated position in Fig. 4(b)from the regular �f channel (shown in the inset, see also Fig. 4(b)). Thehorizontal axis has been rescaled to depict the elapsed time. A linear regres-sion directly reveals a drift of the cantilever reference frequency f0 of about2 Hz/min.
loop characteristics, we especially note that the dip-df methodoperates in a conventionally not reachable interaction regimearound the �f minimum. Compared to the repulsive regime,the absolute forces are smaller around the minimum position,explaining the possibility for larger noise under the same ef-fective measurement conditions.
To illustrate the robustness of this technique against driftof the cantilever frequency f0, we present in Fig. 5 a line pro-file extracted from the �f channel acquired simultaneously toFig. 4(b). A linear fit reveals a drift of about 2 Hz/min, whichwould severely hinder measuring in the attractive regime aftera few minutes. We also note that the dip-df technique deliversa strategy to distinguish between drift along the spatial z axisand the cantilever frequency f0.
V. CONCLUSION
We presented a new AFM measurement mode, which al-lows for NC-AFM experiments at tip-sample distances cor-responding to the �f(z) minimum, resulting in a map of�f = min. Especially when using FM NC-AFM in liquid en-vironment, this dip-df mode is a helpful extension to the reg-ular FM mode. It circumvents the problem of drift in the can-tilever reference frequency f0 and allows for imaging in theattractive tip-sample interaction regime. We successfully im-aged the calcite CaCO3(1014) surface in this mode revealingstep edges and etch pits.
Especially on soft or sensitive sample systems, we ac-count this mode to be beneficial compared to the regu-lar repulsive FM NC-AFM mode in liquids due to reducedtip-sample interaction forces while imaging.
ACKNOWLEDGMENTS
We thank Christoph Marutschke, Holger Adam, andSteffi Klassen for their most helpful experimental assistance,Christopher Hauke for naming the method, and Sadik Hafi-zovic for most helpful support with the HF2 configuration.
1H.-J. Butt, B. Cappella, and M. Kappl, Surf. Sci. Rep. 59, 1 (2005).2C. Barth, A. S. Foster, C. R. Henry, and A. L. Shluger, Adv. Mater. 23, 477(2011).
3T. Fukuma, M. Kimura, K. Kobayashi, K. Matsushige, and H. Yamada,Rev. Sci. Instrum. 76, 053704 (2005).
This article is copyrighted as indicated in the article. Reuse of AIP content is subject to the terms at: http://scitationnew.aip.org/termsconditions. Downloaded to IP:
79.254.255.7 On: Mon, 28 Apr 2014 15:32:23

043707-5 Rode et al. Rev. Sci. Instrum. 85, 043707 (2014)
4T. Fukuma, K. Kobayashi, K. Matsushige, and H. Yamada, Appl. Phys.Lett. 87, 034101 (2005).
5S. Rode, N. Oyabu, K. Kobayashi, H. Yamada, and A. Kühnle, Langmuir25, 2850 (2009).
6M. Ricci, P. Spijker, F. Stellacci, J.-F. Molinari, and K. Votchovsky, Lang-muir 29, 2207 (2013).
7H. Imada, K. Kimura, and H. Onishi, Chem. Phys. 419, 193 (2013).8H. Imada, K. Kimura, and H. Onishi, Langmuir 29, 10744 (2013).9Y. Araki, K. Tsukamoto, N. Oyabu, K. Kobayashi, and H. Yamada, Jpn. J.Appl. Phys. 51, 08KB09 (2012).
10N. Kobayashi, S. Itakura, H. Asakawa, and T. Fukuma, J. Phys. Chem. C117, 24388 (2013).
11S. Rode, R. Hölscher, S. Sanna, S. Klassen, K. Kobayashi, H. Yamada, W.G. Schmidt, and A. Kühnle, Phys. Rev. B 86, 075468 (2012).
12M. Schreiber, M. Eckardt, S. Klassen, H. Adam, M. Nalbach, L. Greifen-stein, F. Kling, M. Kittelmann, R. Bechstein, and A. Kühnle, Soft Matter 9,7145 (2013).
13S. Rode, R. Stark, J. Lübbe, L. Tröger, J. Schütte, K. Umeda, K. Kobayashi,H. Yamada, and A. Kühnle, Rev. Sci. Instrum. 82, 073703 (2011).
14P. Rahe, R. Bechstein, and A. Kühnle, J. Vac. Sci. Technol. B 28, C4E31(2010).
15F. J. Giessibl, Rev. Mod. Phys. 75, 949 (2003).16H. Adam, S. Rode, M. Schreiber, K. Kobayashi, H. Yamada, and A.
Kühnle, Rev. Sci. Instrum. 85, 023703 (2014).17N. Umeda, S. Ishizaki, and H. Uwai, J. Vac. Sci. Technol. B 9, 1318 (1991).
18G. C. Ratcliff, D. A. Erie, and R. Superfine, Appl. Phys. Lett. 72, 1911(1998).
19T. E. Schäffer, J. P. Cleveland, F. Ohnesorge, D. A. Walters, and P. K.Hansma, J. Appl. Phys. 80, 3622 (1996).
20K.-I. Umeda, K. Kobayashi, K. Matsushige, and H. Yamada, Appl. Phys.Lett. 101, 123112 (2012).
21X. Xu and A. Raman, J. Appl. Phys. 102, 034303 (2007).22W. Han, S. M. Lindsay, and T. Jing, Appl. Phys. Lett. 69, 4111 (1996).23A. Labuda, K. Kobayashi, Y. Miyahara, and P. Grütter, Rev. Sci. Instrum.
83, 053703 (2012).24K.-I. Umeda, N. Oyabu, K. Kobayashi, Y. Hirata, K. Matsushige, and H.
Yamada, Appl. Phys. Express 3, 065205 (2010).25T. R. Albrecht, P. Grütter, D. Horne, and D. Rugar, J. Appl. Phys. 69, 668
(1991).26F. J. Giessibl, Phys. Rev. B 56, 16010 (1997).27P. Rahe, R. Bechstein, J. Schütte, F. Ostendorf, and A. Kühnle, Phys. Rev.
B 77, 195410 (2008).28Y. Sugimoto, T. Namikawa, M. Abe, and S. Morita, Appl. Phys. Lett. 94,
023108 (2009).29S. Kawai, S. Hafizovic, T. Glatzel, A. Baratoff, and E. Meyer, Phys. Rev. B
85, 165426 (2012).30P. Rahe, J. Schütte, W. Schniederberend, M. Reichling, M. Abe, Y. Sugi-
moto, and A. Kühnle, Rev. Sci. Instrum. 82, 063704 (2011).31P. Rahe, J. Schütte, and A. Kühnle, J. Phys.: Condens. Matter 24, 084006
(2012).
This article is copyrighted as indicated in the article. Reuse of AIP content is subject to the terms at: http://scitationnew.aip.org/termsconditions. Downloaded to IP:
79.254.255.7 On: Mon, 28 Apr 2014 15:32:23