Embed Size (px)
Citation preview
P.Coussy. DEV. Dep Economy – Carbon Capture Storage and International Negotiations. 10 April 2009. Pau©IF
P
Controlled CO2 | Diversified fuels | Fuel-efficient vehicles | Clean refining | Extended reserves
French CCS Roadmap
SocECO2 Project
ALSTOM, APESA, BRGM,CIRED, GDF, INERIS, TOTAL
2
©IF
P
P.Coussy. DEV. Dep Economy – Carbon Capture Storage and International Negotiations. 10 April 2009. Pau
GHG European commitments and the Factor 4 Objective in France
CCS French scenarios 2020-2050, SocECO2project
Content
3
©IF
P
P.Coussy. DEV. Dep Economy – Carbon Capture Storage and International Negotiations. 10 April 2009. Pau
2020 European and French objectives for GHG reduction levels
Adoption of international objective of limiting the temperature increase to no more than 2°C :
-20% reduction target GHG in 2020 (-30% if a Post-kyototarget).
2050 : -60 to -80% of 1990 emission level for developed countries
-20% in EU energy consumption
20% of EU energy consumption provided by renewables sources
4
©IF
P
P.Coussy. DEV. Dep Economy – Carbon Capture Storage and International Negotiations. 10 April 2009. Pau
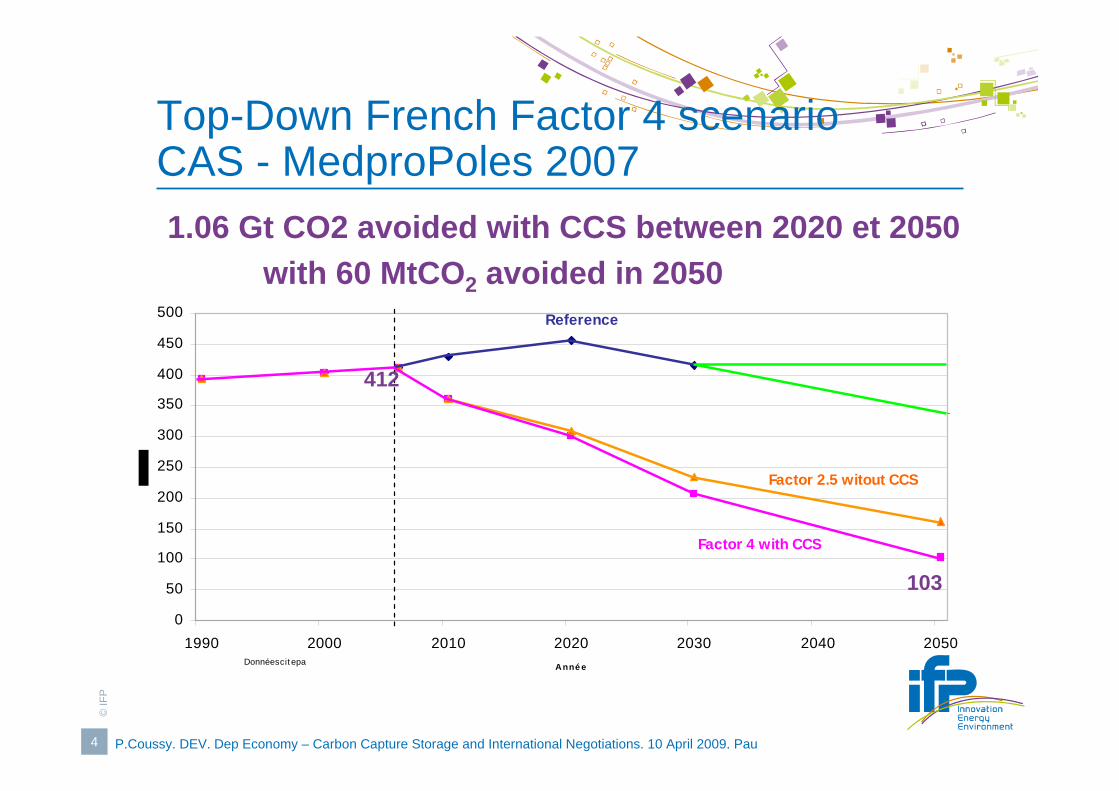
Top-Down French Factor 4 scenario CAS - MedproPoles 2007
0
50
100
150
200
250
300
350
400
450
500
1990 2000 2010 2020 2030 2040 2050Anné eDonnées cit epa
Factor 2.5 witout CCS
Factor 4 with CCS
Reference
1.06 Gt CO2 avoided with CCS between 2020 et 2050with 60 MtCO2 avoided in 2050
412
103
5
©IF
P
P.Coussy. DEV. Dep Economy – Carbon Capture Storage and International Negotiations. 10 April 2009. Pau
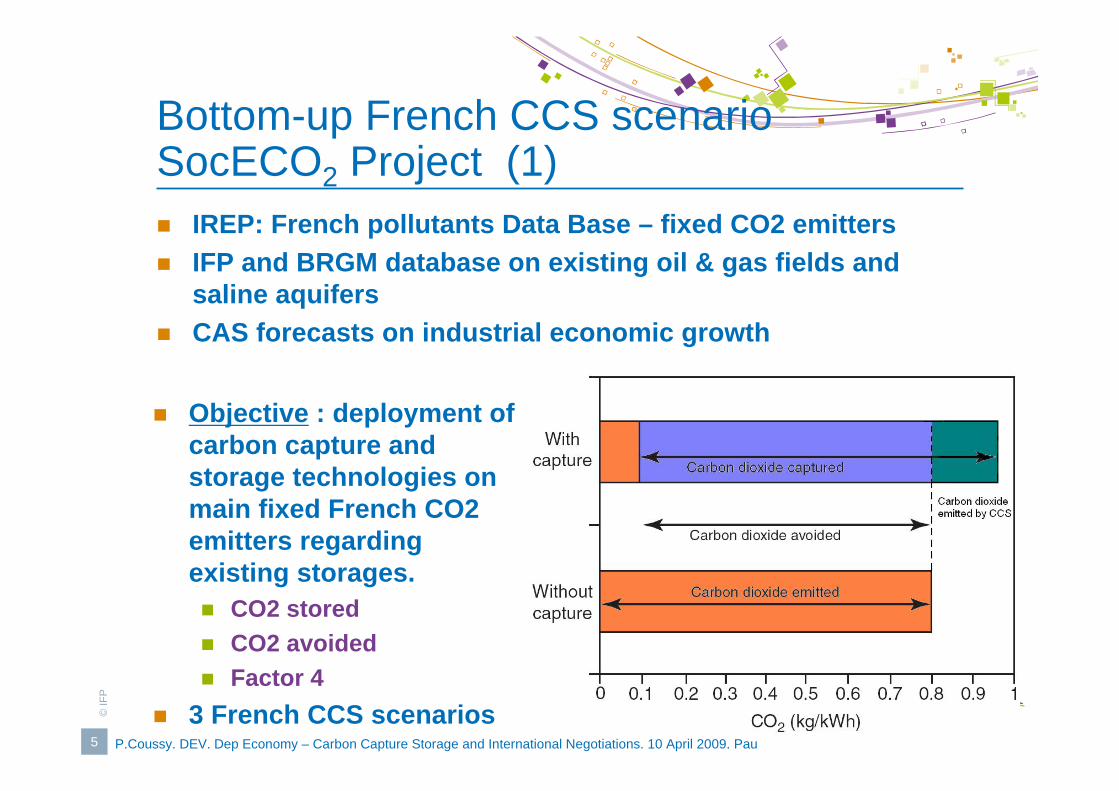
Bottom-up French CCS scenario SocECO2 Project (1)
IREP: French pollutants Data Base – fixed CO2 emittersIFP and BRGM database on existing oil & gas fields and saline aquifersCAS forecasts on industrial economic growth
Objective : deployment of carbon capture and storage technologies on main fixed French CO2 emitters regarding existing storages.
CO2 stored CO2 avoided Factor 4
3 French CCS scenarios
6
©IF
P
P.Coussy. DEV. Dep Economy – Carbon Capture Storage and International Negotiations. 10 April 2009. Pau
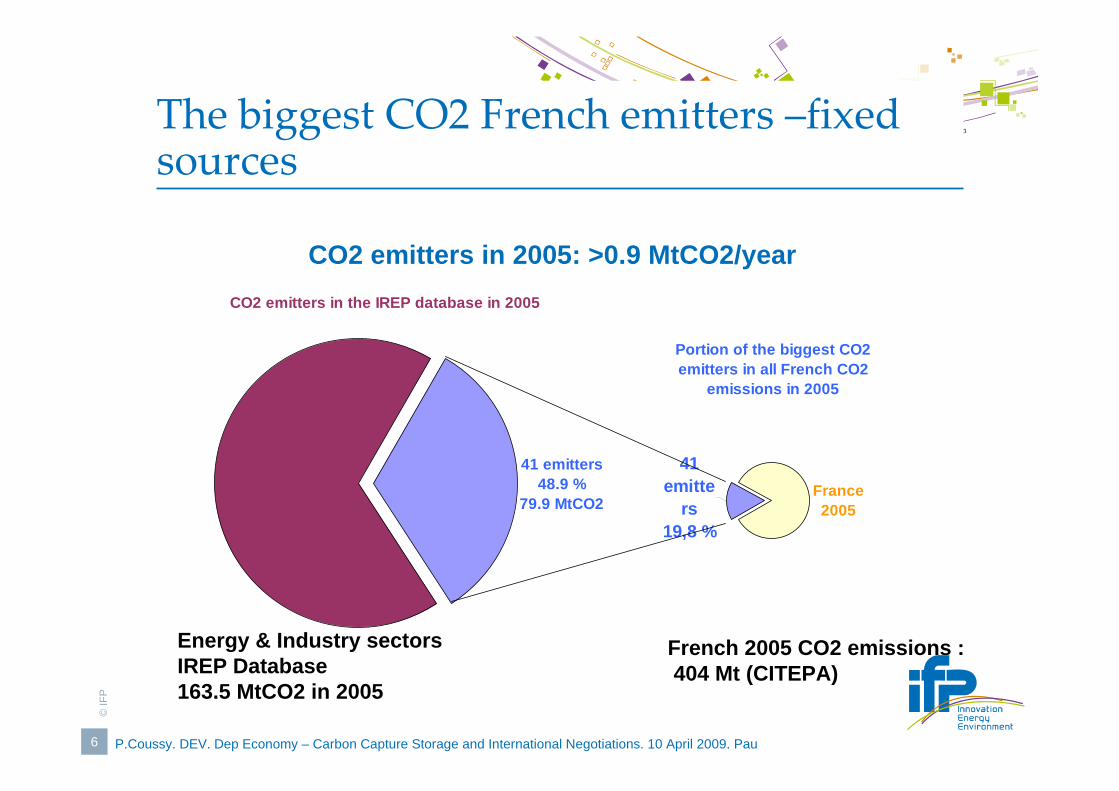
The biggest CO2 French emitters –fixed sources
CO2 emitters in the IREP database in 2005
41 emitters48.9 %
79.9 MtCO2
Portion of the biggest CO2 emitters in all French CO2
emissions in 2005
France 2005
41 emitte
rs19,8 %
Energy & Industry sectors IREP Database 163.5 MtCO2 in 2005
French 2005 CO2 emissions :404 Mt (CITEPA)
CO2 emitters in 2005: >0.9 MtCO2/year
7
©IF
P
P.Coussy. DEV. Dep Economy – Carbon Capture Storage and International Negotiations. 10 April 2009. Pau
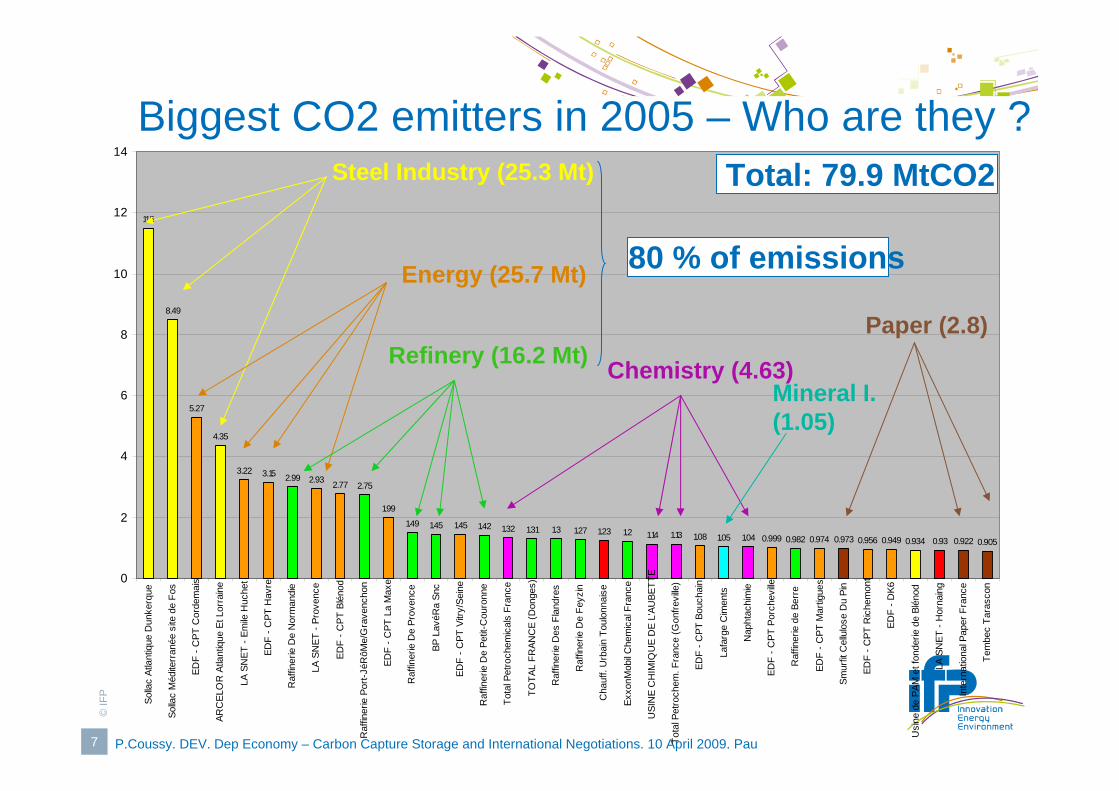
Biggest CO2 emitters in 2005 – Who are they ?
11.5
8.49
5.27
4.35
3.22 3.15 2.99 2.93 2.77 2.75
1.99
1.49 1.45 1.45 1.42 1.32 1.31 1.3 1.27 1.23 1.2 1.14 1.13 1.08 1.05 1.04 0.999 0.982 0.974 0.973 0.956 0.949 0.934 0.93 0.922 0.905
0
2
4
6
8
10
12
14So
llac
Atla
ntiq
ue D
unke
rque
Solla
c M
édite
rran
ée s
ite d
e Fo
s
EDF
- CPT
Cor
dem
ais
ARC
ELO
R A
tlant
ique
Et L
orra
ine
LA S
NET
- Em
ile H
uche
t
EDF
- CPT
Hav
re
Raf
finer
ie D
e N
orm
andi
e
LA S
NET
- Pr
oven
ce
EDF
- CPT
Blé
nod
Raf
finer
ie P
ort-J
éRôM
e/G
rave
ncho
n
EDF
- CPT
La
Max
e
Raf
finer
ie D
e Pr
oven
ce
BP L
avéR
a Sn
c
EDF
- CPT
Vitr
y/Se
ine
Raf
finer
ie D
e Pe
tit-C
ouro
nne
Tota
l Pet
roch
emic
als
Fran
ce
TOTA
L FR
ANC
E (D
onge
s)
Raf
finer
ie D
es F
land
res
Raf
finer
ie D
e Fe
yzin
Cha
uff.
Urb
ain
Toul
onna
ise
Exxo
nMob
il Che
mic
al F
ranc
e
USI
NE
CH
IMIQ
UE
DE
L'AU
BETT
E
Tota
l Pet
roch
em. F
ranc
e (G
onfre
ville
)
EDF
- CPT
Bou
chai
n
Lafa
rge
Cim
ents
Nap
htac
him
ie
EDF
- CPT
Por
chev
ille
Raf
finer
ie d
e Be
rre
EDF
- CPT
Mar
tigue
s
Smur
fit C
ellu
lose
Du
Pin
EDF
- CPT
Ric
hem
ont
EDF
- DK6
Usi
ne d
e PA
M e
t fon
derie
de
Blén
od
LA S
NET
- H
orna
ing
Inte
rnat
iona
l Pap
er F
ranc
e
Tem
bec
Tara
scon
Steel Industry (25.3 Mt)
Energy (25.7 Mt)
Refinery (16.2 Mt) Chemistry (4.63)Mineral I.(1.05)
Paper (2.8)
Total: 79.9 MtCO2
80 % of emissions
8
©IF
P
P.Coussy. DEV. Dep Economy – Carbon Capture Storage and International Negotiations. 10 April 2009. Pau
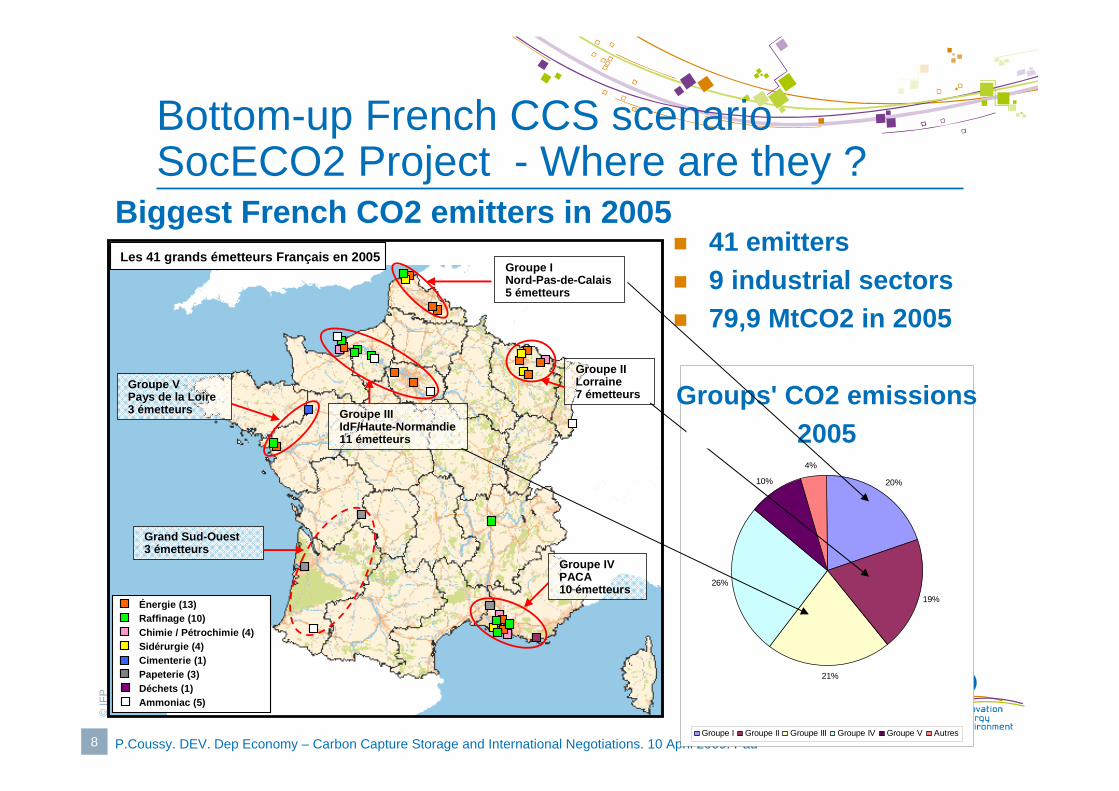
Bottom-up French CCS scenario SocECO2 Project - Where are they ?
41 emitters9 industrial sectors79,9 MtCO2 in 2005
Les 41 grands émetteurs Français en 2005Groupe INord-Pas-de-Calais5 émetteurs
Groupe IIIIdF/Haute-Normandie11 émetteurs
Groupe VPays de la Loire3 émetteurs
Groupe IILorraine7 émetteurs
Groupe IVPACA10 émetteurs
Énergie (13)Raffinage (10)Chimie / Pétrochimie (4)Sidérurgie (4)Cimenterie (1)Papeterie (3)Déchets (1)Ammoniac (5)
Énergie (13)Raffinage (10)Chimie / Pétrochimie (4)Sidérurgie (4)Cimenterie (1)Papeterie (3)Déchets (1)Ammoniac (5)
Grand Sud-Ouest3 émetteurs
Grands émetteurs - émissions 2005 par groupe (MtCO2)
20%
19%
21%
26%
10%
4%
Groupe I Groupe II Groupe III Groupe IV Groupe V Autres
Biggest French CO2 emitters in 2005
Groups' CO2 emissions2005
9
©IF
P
P.Coussy. DEV. Dep Economy – Carbon Capture Storage and International Negotiations. 10 April 2009. Pau
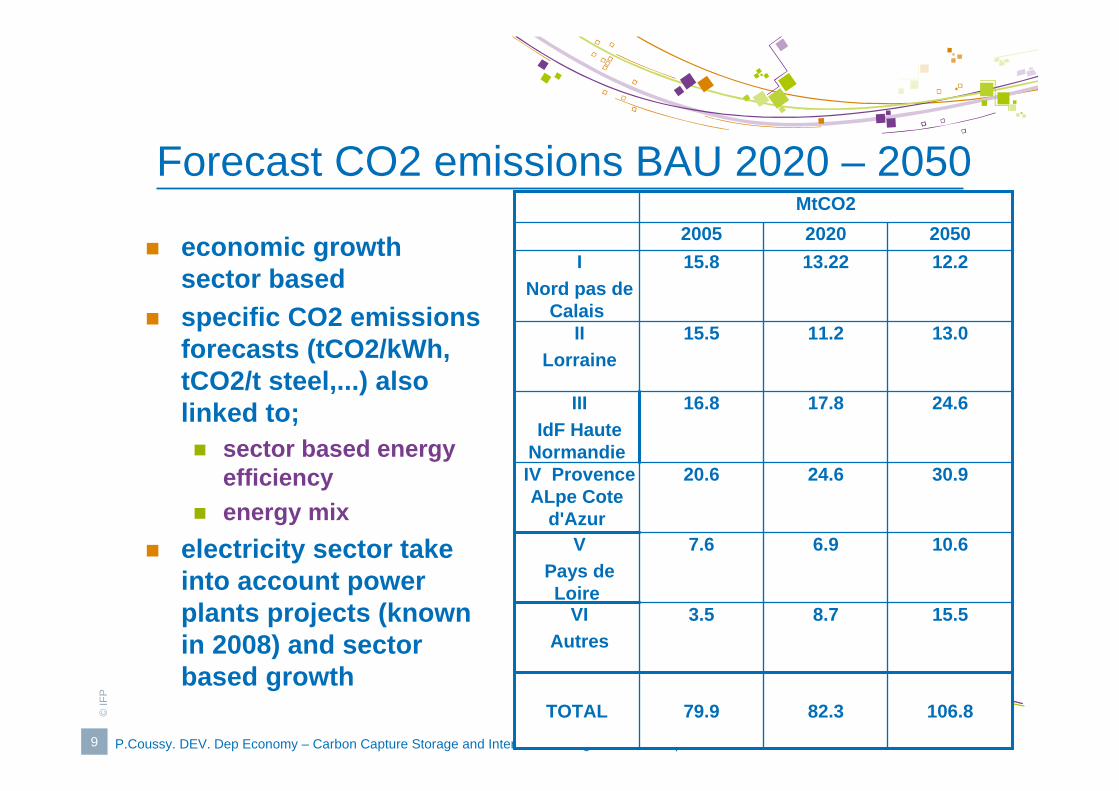
Forecast CO2 emissions BAU 2020 – 2050
economic growth sector based specific CO2 emissions forecasts (tCO2/kWh, tCO2/t steel,...) also linked to;
sector based energy efficiencyenergy mix
electricity sector take into account power plants projects (known in 2008) and sector based growth
15.58.73.5VIAutres
205020202005
10.66.97.6VPays de Loire
13.011.215.5II Lorraine
106.882.379.9TOTAL
30.924.620.6IV Provence ALpe Cote
d'Azur
24.617.816.8III IdF Haute
Normandie
12.213.2215.8I Nord pas de
Calais
MtCO2
10
©IF
P
P.Coussy. DEV. Dep Economy – Carbon Capture Storage and International Negotiations. 10 April 2009. Pau
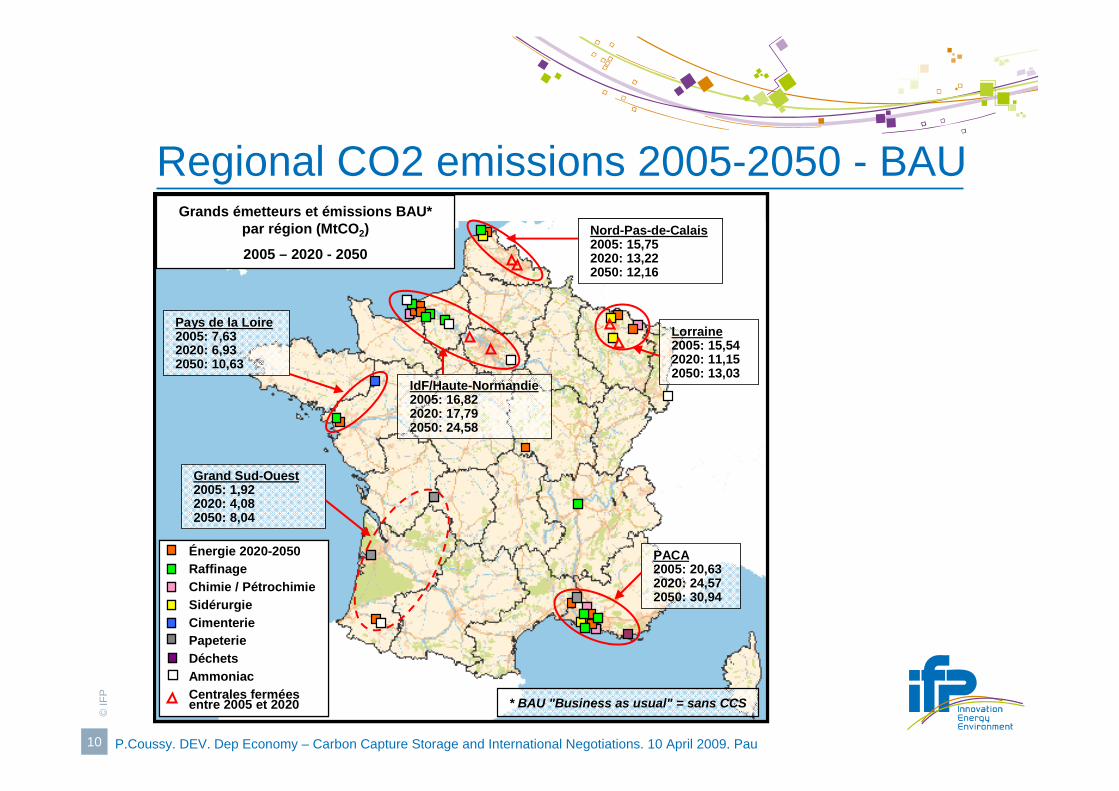
Regional CO2 emissions 2005-2050 - BAUGrands émetteurs et émissions BAU*
par région (MtCO2)
2005 – 2020 - 2050Nord-Pas-de-Calais2005: 15,752020: 13,222050: 12,16
IdF/Haute-Normandie2005: 16,822020: 17,792050: 24,58
Pays de la Loire2005: 7,632020: 6,932050: 10,63
Lorraine2005: 15,542020: 11,152050: 13,03
PACA2005: 20,632020: 24,572050: 30,94
* BAU "Business as usual" = sans CCS
Grand Sud-Ouest2005: 1,922020: 4,082050: 8,04
Énergie 2020-2050RaffinageChimie / PétrochimieSidérurgieCimenteriePapeterieDéchetsAmmoniacCentrales fermées entre 2005 et 2020
Grands émetteurs et émissions BAU* par région (MtCO2)
2005 – 2020 - 2050Nord-Pas-de-Calais2005: 15,752020: 13,222050: 12,16
IdF/Haute-Normandie2005: 16,822020: 17,792050: 24,58
Pays de la Loire2005: 7,632020: 6,932050: 10,63
Lorraine2005: 15,542020: 11,152050: 13,03
PACA2005: 20,632020: 24,572050: 30,94
* BAU "Business as usual" = sans CCS
Grand Sud-Ouest2005: 1,922020: 4,082050: 8,04
Énergie 2020-2050RaffinageChimie / PétrochimieSidérurgieCimenteriePapeterieDéchetsAmmoniacCentrales fermées entre 2005 et 2020
Énergie 2020-2050RaffinageChimie / PétrochimieSidérurgieCimenteriePapeterieDéchetsAmmoniacCentrales fermées entre 2005 et 2020
11
©IF
P
P.Coussy. DEV. Dep Economy – Carbon Capture Storage and International Negotiations. 10 April 2009. Pau
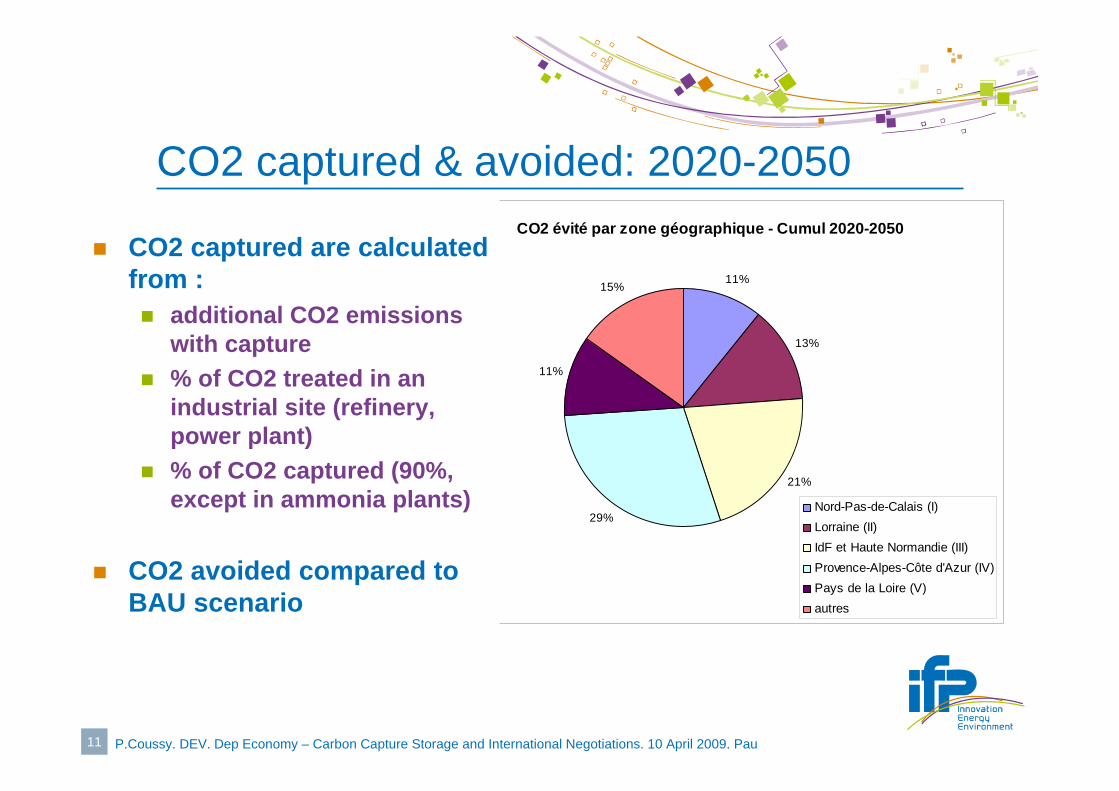
CO2 captured & avoided: 2020-2050CO2 évité par zone géographique - Cumul 2020-2050
11%
13%
21%
29%
11%
15%
Nord-Pas-de-Calais (I)Lorraine (II)IdF et Haute Normandie (III)Provence-Alpes-Côte d'Azur (IV)Pays de la Loire (V)autres
CO2 captured are calculated from :
additional CO2 emissions with capture% of CO2 treated in an industrial site (refinery, power plant)% of CO2 captured (90%, except in ammonia plants)
CO2 avoided compared to BAU scenario
12
©IF
P
P.Coussy. DEV. Dep Economy – Carbon Capture Storage and International Negotiations. 10 April 2009. Pau
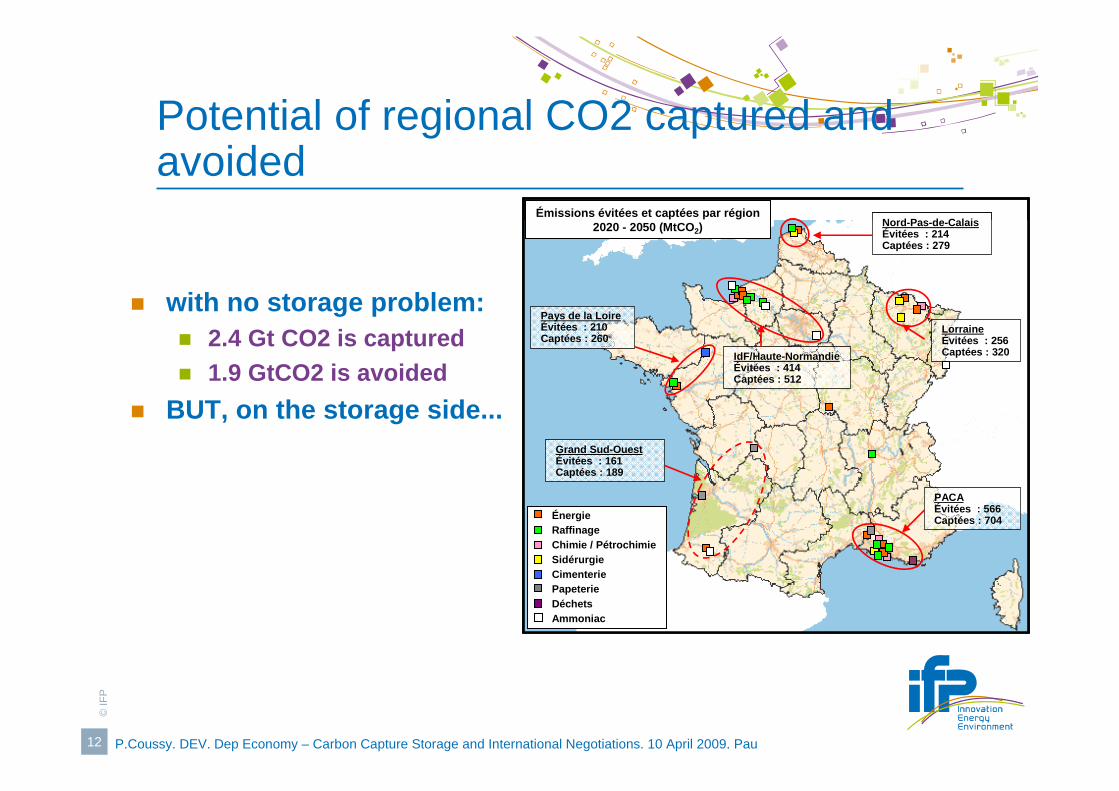
Potential of regional CO2 captured and avoided
with no storage problem:2.4 Gt CO2 is captured1.9 GtCO2 is avoided
BUT, on the storage side...
Émissions évitées et captées par région 2020 - 2050 (MtCO2) Nord-Pas-de-Calais
Évitées : 214Captées : 279
IdF/Haute-NormandieÉvitées : 414Captées : 512
Pays de la LoireÉvitées : 210Captées : 260
PACAÉvitées : 566Captées : 704
LorraineÉvitées : 256Captées : 320
Grand Sud-OuestÉvitées : 161Captées : 189
ÉnergieRaffinageChimie / PétrochimieSidérurgieCimenteriePapeterieDéchetsAmmoniac
ÉnergieRaffinageChimie / PétrochimieSidérurgieCimenteriePapeterieDéchetsAmmoniac
13
©IF
P
P.Coussy. DEV. Dep Economy – Carbon Capture Storage and International Negotiations. 10 April 2009. Pau
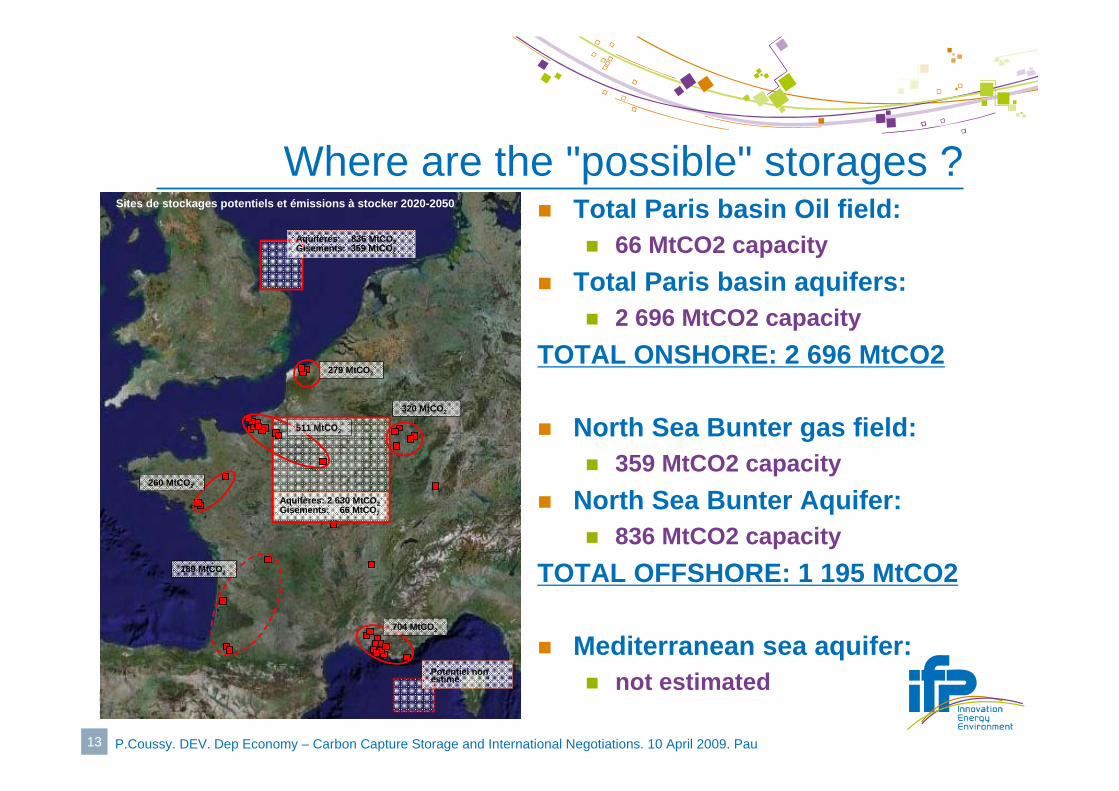
Where are the "possible" storages ?
Aquifères: 2 630 MtCO2Gisements: 66 MtCO2
Aquifères: 836 MtCO2Gisements: 359 MtCO2
Potentiel non estimé
279 MtCO2
320 MtCO2
511 MtCO2
260 MtCO2
189 MtCO2
704 MtCO2
Sites de stockages potentiels et émissions à stocker 2020-2050
Aquifères: 2 630 MtCO2Gisements: 66 MtCO2
Aquifères: 836 MtCO2Gisements: 359 MtCO2
Potentiel non estimé
279 MtCO2
320 MtCO2
511 MtCO2
260 MtCO2
189 MtCO2
704 MtCO2
Aquifères: 2 630 MtCO2Gisements: 66 MtCO2
Aquifères: 836 MtCO2Gisements: 359 MtCO2
Potentiel non estimé
279 MtCO2
320 MtCO2
511 MtCO2
260 MtCO2
189 MtCO2
704 MtCO2
Sites de stockages potentiels et émissions à stocker 2020-2050 Total Paris basin Oil field: 66 MtCO2 capacity
Total Paris basin aquifers:2 696 MtCO2 capacity
TOTAL ONSHORE: 2 696 MtCO2
North Sea Bunter gas field: 359 MtCO2 capacity
North Sea Bunter Aquifer:836 MtCO2 capacity
TOTAL OFFSHORE: 1 195 MtCO2
Mediterranean sea aquifer:not estimated
14
©IF
P
P.Coussy. DEV. Dep Economy – Carbon Capture Storage and International Negotiations. 10 April 2009. Pau
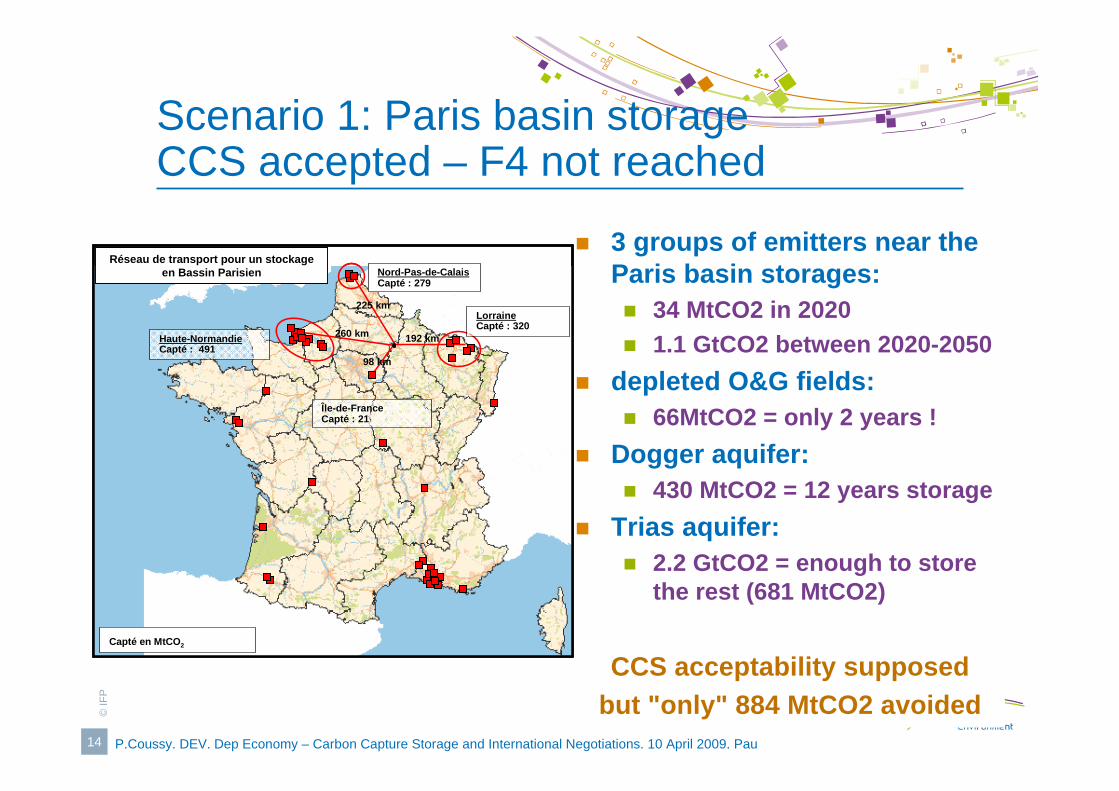
Scenario 1: Paris basin storageCCS accepted – F4 not reached
Réseau de transport pour un stockage en Bassin Parisien Nord-Pas-de-Calais
Capté : 279
Haute-NormandieCapté : 491
LorraineCapté : 320
Île-de-FranceCapté : 21
Capté en MtCO2
260 km
225 km
192 km
98 km
Réseau de transport pour un stockage en Bassin Parisien Nord-Pas-de-Calais
Capté : 279
Haute-NormandieCapté : 491
LorraineCapté : 320
Île-de-FranceCapté : 21
Capté en MtCO2
260 km
225 km
192 km
98 km
3 groups of emitters near the Paris basin storages:
34 MtCO2 in 20201.1 GtCO2 between 2020-2050
depleted O&G fields: 66MtCO2 = only 2 years !
Dogger aquifer: 430 MtCO2 = 12 years storage
Trias aquifer:2.2 GtCO2 = enough to store the rest (681 MtCO2)
CCS acceptability supposedbut "only" 884 MtCO2 avoided
15
©IF
P
P.Coussy. DEV. Dep Economy – Carbon Capture Storage and International Negotiations. 10 April 2009. Pau
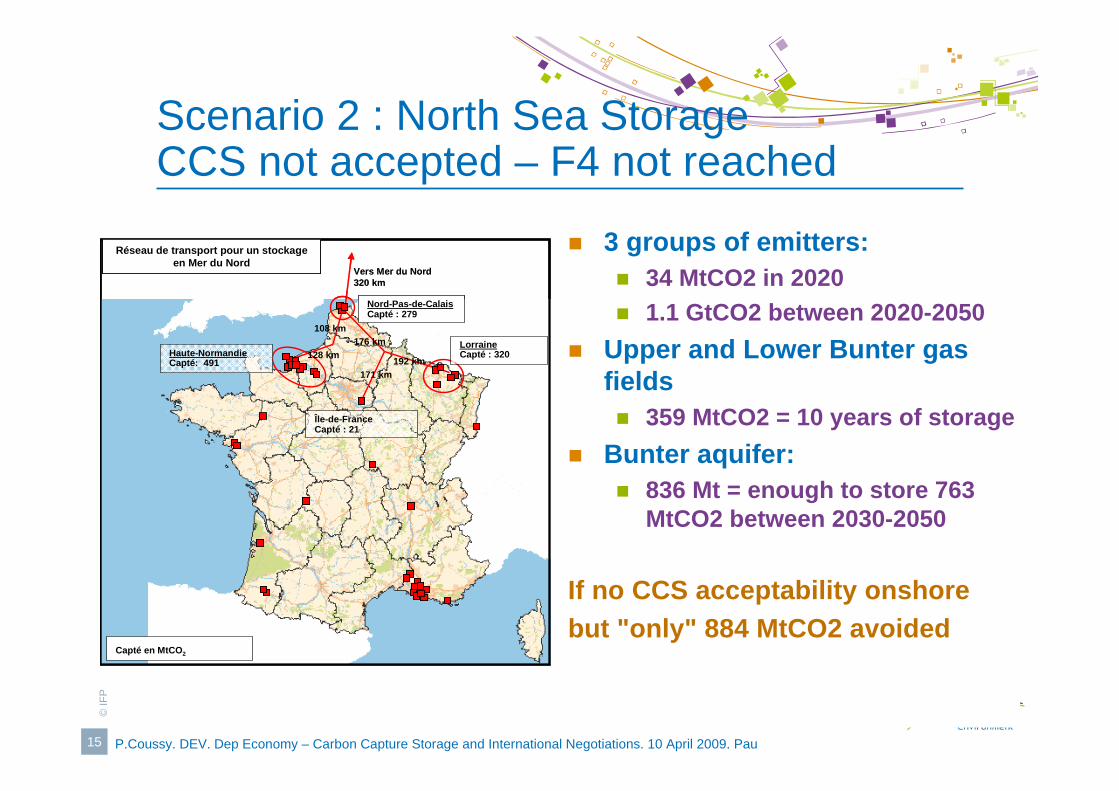
Scenario 2 : North Sea StorageCCS not accepted – F4 not reached
Réseau de transport pour un stockage en Mer du Nord
Nord-Pas-de-CalaisCapté : 279
Vers Mer du Nord320 km
Haute-NormandieCapté: 491
LorraineCapté : 320
Île-de-FranceCapté : 21
Capté en MtCO2
128 km
108 km
192 km171 km
176 km
Réseau de transport pour un stockage en Mer du Nord
Nord-Pas-de-CalaisCapté : 279
Vers Mer du Nord320 km
Haute-NormandieCapté: 491
LorraineCapté : 320
Île-de-FranceCapté : 21
Capté en MtCO2
128 km
108 km
192 km171 km
176 km
3 groups of emitters: 34 MtCO2 in 20201.1 GtCO2 between 2020-2050
Upper and Lower Bunter gas fields
359 MtCO2 = 10 years of storageBunter aquifer:
836 Mt = enough to store 763 MtCO2 between 2030-2050
If no CCS acceptability onshorebut "only" 884 MtCO2 avoided
16
©IF
P
P.Coussy. DEV. Dep Economy – Carbon Capture Storage and International Negotiations. 10 April 2009. Pau
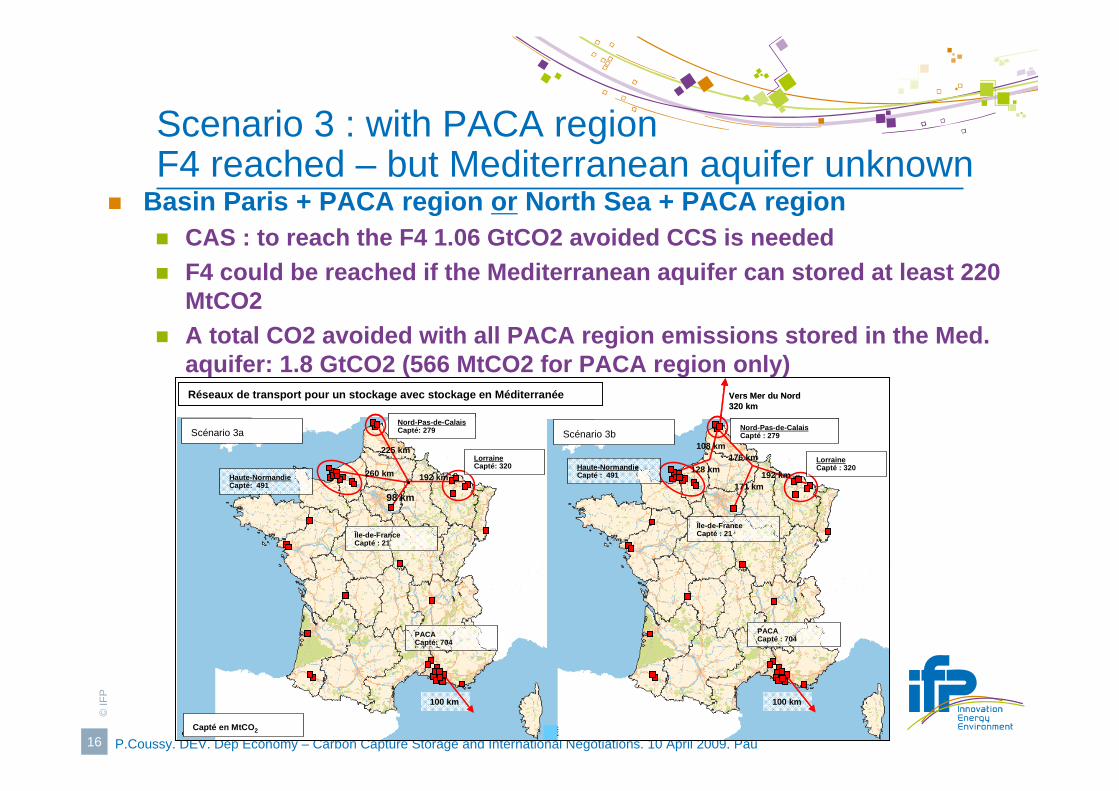
Scenario 3 : with PACA regionF4 reached – but Mediterranean aquifer unknown
Basin Paris + PACA region or North Sea + PACA regionCAS : to reach the F4 1.06 GtCO2 avoided CCS is neededF4 could be reached if the Mediterranean aquifer can stored at least 220 MtCO2A total CO2 avoided with all PACA region emissions stored in the Med. aquifer: 1.8 GtCO2 (566 MtCO2 for PACA region only)Réseaux de transport pour un stockage avec stockage en Méditerranée
Nord-Pas-de-CalaisCapté : 279
Vers Mer du Nord320 km
Haute-NormandieCapté : 491
LorraineCapté : 320
Île-de-FranceCapté : 21
128 km
108 km
192 km171 km
176 km
Nord-Pas-de-CalaisCapté: 279
Haute-NormandieCapté: 491
LorraineCapté: 320
Île-de-FranceCapté : 21
Capté en MtCO2
260 km
225 km
192 km
98 km
100 km100 km
Scénario 3a Scénario 3b
PACACapté : 704 PACA
Capté: 704
Réseaux de transport pour un stockage avec stockage en Méditerranée
Nord-Pas-de-CalaisCapté : 279
Vers Mer du Nord320 km
Haute-NormandieCapté : 491
LorraineCapté : 320
Île-de-FranceCapté : 21
128 km
108 km
192 km171 km
176 km
Nord-Pas-de-CalaisCapté: 279
Haute-NormandieCapté: 491
LorraineCapté: 320
Île-de-FranceCapté : 21
Capté en MtCO2
260 km
225 km
192 km
98 km
100 km100 km
Scénario 3a Scénario 3b
PACACapté : 704 PACA
Capté: 704

17
©IF
P
P.Coussy. DEV. Dep Economy – Carbon Capture Storage and International Negotiations. 10 April 2009. Pau
Conclusion
Even for France where electricity production is mainly nuclear, to reach the F4 CCS is an option to consider
not evident that storages sites will have enough capacity
importance to characterize the aquifers and conduct site specific simulations of injections
CCS acceptability could be also an important issue