Embed Size (px)
Citation preview

FREE TO BOUND REC9MBINATION
AND SCREENING EFFECTS IN CdS
Roland M. Egloff
B.A. Sc., University of'~ritish Columbia, 1971
A THESIS SUBMITTED IN PARTIAL FULFILLMENT OF
THE REQUIREMENTS FOR THE DEGREE OF
MASTER OF SCIENCE
in the Department
of
Physics
@ ROLAND M. EGLOFF 1973
SIMON FRASER UNIVERSITY
August 1973
All rights reserved. This thesis may not be reproduced in whole or in part, by photocopy or other means, without permission of the author.

APPROVAL
Name : Roland M. Egloff
Degree : Master of Science
Title of Thesis: Free-to-Bound Recombination and Screening
Effects in CdS
~xamining Committee:
Chairman: A. E. Curzon
K. Colbow
Senior Supervisor
J. F. Cochran
Date Approved: September 4, 1973
- ii -

PARIYAL COPYRICIIT LICENSE
I h e r e b y g r a n t t o Simon F r a s e r U n i v e r s i t y t h e r i g h t t o lend
my t h e s i s o r d i s s e r t a t i o n ( t h e t i t l e of which i s shown below) t o u s e r s
o f t h e Simon F r a s c r U n i v e r s i t y L i b r a r y , and t o make p a r t i a l or s i n g l e
c o p i e s o n l y f o r s u c h u s e r s o r i n r e s p o n s e t o a r e q u e s t from t h e l i b r a r y
of a n y o t h e r u n i v e r s i t y , o r o t h e r e d u c a t i o n a l i n s t i t u t i o n , on i t s own
b e h a l f o r f o r one of i t s u s e r s . I f u r t h e r a g r e e t h a t pe rmiss ion f o r
m u l t i p l e copying of t h i s t h e s i s f o r s c h o l a r l y purposes may be g r a n t e d
b y me o r t h e Dean of Graduate S t u d i e s . It is unders tood t h a t copying
' o r p u b l i c a t i o n of t h i s t h e s i s f o r f i n a n c i a l g a i n s h a l l n o t be a l lowed
w i t h o u t my w r i t t e n p e r m i s s i o n .
T i t l e of T h e s i s / ~ i s s e r t a t i o n :
Author :
( s i g n a t u r e )
(name)

Abstract
The main features of the luminescence spectrum of CdS
consist of a number of sharp lines from 2.43 ev to the band
edge at 2.58 ev and a number of broad bands below 2.43 ev.
The highest energy broad band (HEB) is due to a free electron
recombining with a hole bound at a shallow acceptor (free-to-
bound). The dependence of the peak energy of the HEB on
temperature and excitation intensity is investigated in the
interval 4.2 - 80•‹K. Increasing the excitation intensity results in a shift to higher energy. This is interpreted in terms of
free carrier screening which reduces the binding energy of the
acceptor. An energy shift due to the recombination of hot
electrons is also considered. An often neglected donor-
acceptor interaction term is discussed and found to be sig-
nificant. The acceptor binding energy was calculated as 167.5
I mev. Experimental observations suggest that screening of
excitons due to free carriers is ineffective.

TABLE OF CONTENTS Page
LIST OF TABLES AND FIGURES ............................... v
ACKNOWLEDGEMENTS .................................... vi
1 . THESIS INTRODUCTION ..................................... 1
2 . LUMINESCENCE IN CdS .................................. 2
2.1 Introduction .................................... 2
2.2 The Sharp Emission Lines..... ................... 2
2.3 Broad Band Luminescence ......................... 4
3 . EXPERIMENTAL DETAILS ................................. 11
....................................... 3.1 Apparatus 11
............................. 3.2 Crystal Preparation 13
4 . FREE-TO-BOUND RECOMBINATION .......................... 14
4.1 Introduction ................................ 14
4.2 Temperature Dependence of the Band Gap .......... 15
4.3 Kinetic Energy. EK .............................. 16
.................................... 4.4 Hot Carriers 20
4.5 Screening of Bound States ...................... 23
2 .............. 4.6 Donor-Acceptor Interaction. e ~ / K R 34
.......................... 4.7 Results and Discussion 43
5 . SCREENING OF EXCITONS ................................ 51
5.1 Introduction ................................... 51
5.2 Screening of Excitons ........................... 52
5.3 Conclusions .............................. 58
6 . SUMMARY ....................................... 59
APPENDIX A ........................................... 61
REFERENCES .......................................... 66
- i.v -

LIST OF TABLES AND FIGURES
Table - Page
I I Excitons in C d s . . , . . . . . . . . . . . . . . . . . . . . . . . . . . . . . 5
Figure
1 Exciton emission of CdS at 5"K.................. 3
Edge emission of CdS at 27OK. ................... 8
Experimental arrangement for photoluminescence measurements.................................. 12
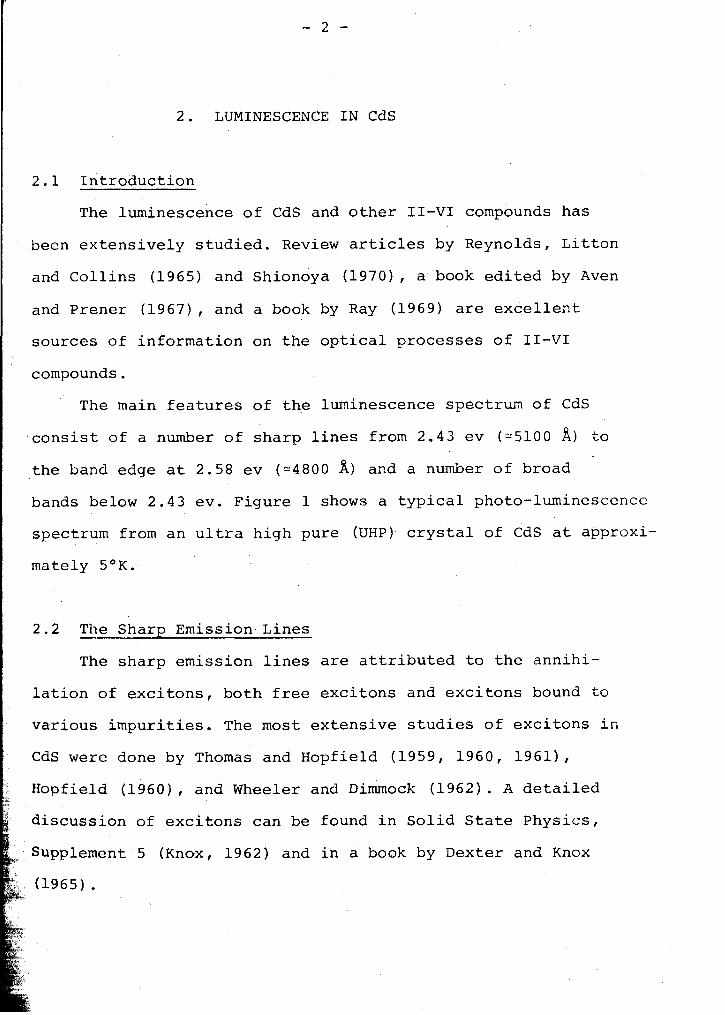
Energy shift of I2 with temperature at low excitation intensity for a high purity (HP) ........... and an ultra high purity (UHP) sample 17
Peak energy variation of HEB as a function of temperature at low free carrier concentration (no screening) ............................. 19
Decrease of the acceptor binding energy due to screening at various temperatures (Eo=165mev) ... 29
Solution to Equation 4.511: pas a function ......................................... of ao/A 32
Decrease of the donor binding energy due to .... screening at various temperatures (Eo=32mev) 35
Hole bound to ionized donor-acceptor pair. Fractional enrgy shift of the hole binding energy as a function of donor-acceptor separation ....................................... 37
Probability function g(r) of finding a donor at a distance r from the acceptor............... 41
Peak energy of HEB as a function of temperature at very low and maximum excitation intensity for two HP samples of Cds....................... 46
16 -3 Debye potential as a function of r for n=10 cm , T=30•‹K and ~ = 8 . 4 6 . Also shown is the pure coulomb potential ............................. 64

I wish to express my gratitude to my super-
visory committee, especially to Dr. K. Colbow who
suggested this research project. I also wish to
thank Doug Smeaton for many discussions. Thanks
are due also to the other members of the Department
of Physics from whom I have taken courses.
Financial assistance from Dr. K. Colbow, through
a research grant, as well as that of the Simon Fraser
University Department of Physics, in the form of
several teaching assistantships, is gratefully
acknowledged.

1. THESIS INTRODJCTION
The dependence on temperature and excitation intensity
of excitons and the free-to-bound recombination in cad-
mium sulphide is investigated. Free carriers screen the
coulomb interaction of bound states and reduces their
binding energies. Luminescence involving bound states such
as the acceptor in the free-to-bound recombination is thus
expected to show effects caused by screening as the free
carrier concentration is increased. The binding energy of
a free exciton is expected to be especially sensitive to 0
screening due to the relatively large ( - 2 9 A) electron-hole
separation. This thesis reports experimental observations
on the exciton and the free-to-bound recombination in the
interval 4.2'-80•‹K. A simple screening model based on the
Debye potential is discussed in some detail. Hot electron
recombination and donor-acceptor interaction effects are
considered. The temperature dependence 'of the band gap is
obtained and a possible band gap reduction due to a high
density of free carriers is discussed in connection with
screening of excitons. A brief review of the photo-
lUlninescence of single crystal CdS is given to provide a
background for the present work.
2. LUMINESCENCE IN CdS
2.1 Introduction
The luminescence of CdS and other 11-VI compounds has
been extensively studied. Review articles by Reynolds, Litton
and Collins (1965) and Shionoya (1970), a book edited by Aven
and Prener (1967), and a book by Ray (1969) are excellent
sources of information on the optical processes of 11-VI
compounds.
The main features of the luminescence spectrum of CdS
consist of a number of sharp lines from 2.43 ev (-5100 A) to
the band edge at 2.58 ev (-4800 A) and a number of broad
bands below 2.43 ev. Figure 1 shows a typical photo-luminescence
spectrum from an ultra high pure (UHP) crystal of CdS at approxi-
mately 5OK.
2.2 The Sham Emission.Lines
The sharp emission lines are attributed to the annihi-
lation of excitons, both free excitons and excitons bound to
various impurities. The most extensive studies of excitons in
CdS were done by Thomas and Hopfield (1959, 1960, 19611,
Hopfield (1960), and Wheeler and Dimmock (1962). A detailed
discussion of excitons can be found in Solid State Physics,
Supplement 5 (Knox, 1962) and in a book by Dexter and Knox
(1965). &

. a I I
lsso I 1 1
4900 4950 5000 5050 5100 WAVELENGTH IN ANGSTROMS
&lure 1 Exciton emission of CdS at 5 ' ~ . Line positions and binding

At liquid helium temperature the main exciton emission
lines are the so-called Il and I2 lines. The I1 line arises
from the decay of an exciton hound to a neutral acceptor
and I2 is due to the decay of an exciton bound to a neutral
donor. The emission Erom the annihilation of an exciton +
bound to an ionized donor can also be observed. Using H 2 as
a model, Hopfield (1964) calculated that an exciton cannot
be bound to an ionized acceptor due to the large effective * *
hole mass to effective electron mass ratio in CdS (mh/me=4).
Indeed no such line has been observed.
At liquid helium temperature, the emission lines due
to intrinsic excitons (the so-called A and B excitons) are
generally much weaker than those due to bound excitons.
However, with increasing temperature, bound excitons are
dissociated from the impurities, and consequently the emission
lines due intrinsic excitons become prominent.
Several sharp lines appear at energies of one or two
longitudinal optical (LO) phonon energies below the zero-
phonon lines. These are called LO phonon replicas.
Line positions, binding energies and chemical impurities
of some of the luminescent excitons are listed in Table 1.
2.3 Broad Band Luminescence
Most of the 11-VI compounds show two broad bands (the so-
called edge emission) at low temperatures near 5135 and

Ex
cit
on
s in
CdS
Po
sit
ion
*
Bin
din
g
Lin
e
6)
E (
ev
) Im
pu
rity
E
ne
rgy
(m
ev)
Re
fere
nc
e
A +
-
4854.8
2.55306
intr
ins
ic
B +
-
4826.1
2.56824
intr
ins
ic
* E
va
lua
ted
us
ing
EA
=
1.23946
x lo4 %
ev
** E
xa
ct
bin
din
g e
ne
rgy
of
bo
un
d
ex
cit
on
s d
ep
en
ds
on
c
he
mic
al
imp
uri
ty
to
wh
ich
e
xc
ito
n i
s b
ou
nd
.

TABLE I ( c o n t ' d )
Symbols employed f o r a g g r e g a t e s of c h a r g e s :
@ - N e u t r a l donor
8 + N e u t r a l a c c e p t o r
- + Exc i ton
0 - - + Exc i ton bound t o n e u t r a l donor
a + - + Exc i t on bound t o n e u t r a l a c c e p t o r
@ - + Exc i ton bound t o i o n i z e d donor
Refe rences :
1 Nassau, Henry and S h i e v e r (1970) . 2 Hopf i e ld and Thomas (1961) .
3 Henry, Nassau and S h i e v e r (1970) .
E 4 Thomas, Ding le and C u t h b e r t (1967) . 5 Thomas and Hopf ie ld (1962 ) .
6 Reynolds and L i t t o n (1963) . 7 Malm and Haer ing (1971) .
8 Smeaton and Haer ing ( t o be p u b l i s h e d ) .

simultaneous emission of one or more longitudinal optical
I phonons. X typical spcctrum of this edge 1umine;cence is
1 . shown in Figure 2 for a high purity (HP) crystal of CdS at
approximately 27OK. At temperatures less than approximately
20•‹K, most crystals 05 CdS show only the low energy band
(LEB) near 5180 8. The LEB arises from the recombination of
an electron trapped at a donor with a hole trapped at an
acceptor (Thomas, Hopfield and Colbow, 1964; Colbow, 1966).
1 Thc emission energy from a donor-acceptor pair separated a
distance r is given by
e 2 E(r) = EG - (ED + EA) + - - nE Kr P
1
where EG is the band gap energy, ED and EA the donor and i i acceptor ionization energies, respectively, and K is the
static dielectric constant. The term nE represents the s P
simultaneous emission of n = 0, 1, 2, ... phonons of energy E - 38 mev in CdS. The transition probability between the P bound electron and the bound'hole is proportional to the
Square of the overlap of the wave functions (Colbow, 1965)
where Wo is a constant and a is the Bohr radius of the 0
shallower state (the donor in CdS). Therefore, the emission


i n t e n s i t y should i n c r e a s e a s t h e p a i r s e p a r a t i o n dec reases .
However, r has d i s c r e t e va lues g iven by t h e geometry of t h e
c r y s t a l and hence t h e ndrnber of p o s s i b l e p a i r i n g s dec reases
a s r dec reases . For s m a l l va lues of r , t h e emiss ion spectrum
e x h i b i t s a f i n e s t r u c t u r e g iven by Eqn. 2 . 3 0 1 . This has been
observed i n Gap and CdS (Henry e t a l . , 1969; Reynolds e t a l . ,
1969) . For l a r g e r , t h e energy d i f f e r e n c e between a d j a c e n t
l i n e s becomes s m a l l , r e s u l t i n g i n t h e observed broad band.
A s t h e tempera ture i s i n c r e a s e d (T 1 20•‹K) some of t h e
donor e l e c t r o n s become i o n i z e d . The recombinat ion of a f r e e
e l e c t r o n w i t h a bound h o l e r e s u l t s i n t h e h igh energy band
(HEB) nea r 5135 a. The emiss ion energy of t h e HEB ( f r ee - to -
1 bound) i s g iven by (Colhow, 1966; van Doorn, 1966)
%"= 2 e a E = E G - E A + E K + - - nE
KR P
EK is t h e k i n e t i c energy of t h e free e l e c t r o n a t t h e instan-c
2 of recombinat ion. e ~ / K R r e p r e s e n t s t h e lowering of t h e accep to r
binding energy due t o donor-acceptor i n t e r a c t i o n . The
s i g n i f i c a n c e of t h i s i n t e r a c t i o n t e r m has o f t e n been neg lec t ed
by many a u t h o r s . It w a s f i r s t po in ted o u t by van Doorn (1966)
t h a t t h e presence of a nearby impur i ty w i l l modify t h e a c c e p t o r
binding energy , EA. I n p a r t i c u l a r , a donor impur i ty w i l l lower
t h e b ind ing energy o f a h o l e t rapped a t an accep to r r e s u l t i n g
i n a p o s i t i v e s h i f t o f t h e HEB emiss ion energy. The va lue of R

is distinct from r used in the expression for the LEB emission
energy (Eqn. 2.301). If only nearest neighbor interaction is
considered, then R is equal to the most probable distance
separating the donors and acceptors and is thus independent of
temperature and excitation intensity. a is a numerical factor
between zero and one and was introduced to account for screening
effects. At very low free carrier concentrations screening
effects are negligible and a = 1. As the free carrier
concentration is increased due to high excitation intensities
and/or higher temperatures, the coulomb interaction between
donor-acceptor pairs is screened and hence a < 1. At very
high free carrier concentrations a + 0 and the donor-
acceptor interaction term can be neglected in Eqn. 2.303.
The LEB becomes weaker as the temperature is increased
and is difficult to observe at T > 40•‹K in most crystals
of CdS. At still higher temperatures the hole becomes ionized
from the acceptor and the HEB is quenched (Maeda, 1965).

3. EXPERIMENTAL DETAILS
3.1 Apparatus
The experimental arrangement is illustrated schematically
in Figure 3. The crystal was mounted on a copper block with
a dab of nail polish in a variable temperature cryostat
(manufactured by Andonian Associates, Inc.). The crystal was
cooled by cold He gas. Temperature was measured using a
Au + 0.03%(at) Fe vs. Chrome1 thermocouple. Temperatures
from 4.2OK to 80•‹K were used for the measurements. The crystal
was excited by the light from a 100 watt high pressure mercury
arc (PEK Labs., model 911) filtered to obtain relatively high
intensity of greater-than-band-edge energy radiation. Exci-
tation light intensity variations were accomplished with
neutral density filters. The angle of excitation was 45' to
the normal of the crystal face.
The luminescent light was observed normal to the surface
of the crystal (same side as incident excitation) and was
focused on the entrance slit of a Spex Industries (model 1700)
spectrometer which had a linear dispersion of 5 i(/m in
second order. The light was detected at the exit slit with an
EM1 (type 9558) photomultiplier (S-20 response). The luminescent
light was chopped at 80 hz enabling the use of a phase sensitive
lock-in amplifier (Princeton Applied Research, model HR-8). The
signal vs. wavelength was recorded on a x-y recorder.

Interference filter
N.D. filter Photomultiplier S-20 response
I
Signal
Spectrometer 5ltlmm
Figure 3 Experimental arrangement for photoluminescence
measurements.
Sample
Ref. signal Wavelength
b t
Lock-in Intensity amplifier s X-Y recorder
i A

The resistance of some crystals was measured with a fl
~cithley (model 600A) electrometer.
3.2 Crystal Preparation
Ultra high purity (UHP) and high purity (HP) crystals
grown from the melt were purchased from Eagle-Picher. Some
crystals grown by a vapor transport method were also used.
Crystals were either cleaved or etched in concentrated HC1
followed by a thorough wash in distilled water. For the
resistance measurements, ohmic contacts were made by solderinq
gold wires to opposite sides of the crystal with indium.
It should be noted here that in CdS there must always
be at least as many donors as there are acceptors (Goldberg,
1966) due to self-compensation. Hence, CdS crystals are
either n-type or compensated but never p-type. In general,
UHP crystals are highly conducting (strongly n-type) whereas
HP crystals are of lower conductivity.

4. FREE-TO-BOUND RECOMBINATION
4.1 Introduction
In this chapter we shall be concerned with the high
energy band (HEB) of the edge emission. In particular we
would like to find the dependence of the peak energy of
the HEB as a function of temperature and excitation
intensity. The HEB results from the recombination of a
free electron with a bound hole (see Section 2.3).
We have measured the zero-phonon (n = 0 ) emission
peak of the HEB and found that the peak energy is a function
of temperature and excitation intensity. A typical energy
shift for a 100-fold increase in excitation intensity was %==
; found to be approximately 2 mev to higher energies at 25OK.
Similar energy shifts were observed by Colbow and Nyberg -- (l967), Condas and Yee (1966) and Radford et al. (1972).
While the exact cause of the energy shifts could not be
identified, three mechanisms are suggested in the following
sections :
1) An effective electron temperature significantly higher
than the crystal temperature at high excitation intensi-
ties (hot electrons). This increases the value of EK in
Eqn. 2.303.

2
3
the
Screening of the acceptor by free carriers. This reduces
the binding energy of the hole and thus increases the
HEB emission energy.
L Screening of the donor-acceptor interaction term (e ~ / K R )
This reduces the value of a and thus decreases the HEB
emission energy.
In order to evaluate Eqn. 2.303 for the peak energy of
HEB we will first discuss the variation of the band gap
energy as a function of temperature.
4 . 2 Temperature Dependence of the Band Gap
The temperature dependence of the band gap was obtained
by measuring the position of I2 (exciton bound to a neutral
donor) as a function of temperature. At low temperatures
and low excitation intensities the exciton energy is assumed
to be a constant distance from the band gap such that the
changes in energy of I2 represent shifts in the valence and
conduction band edges. Mahan (1965) used this method to
measure the band gap variation in CdTe and found good
agreement with predicted band edge shifts. At low temperatures
the band shifts show a T' dependence due to interaction of
holes with acoustical phonons. The temperature dependent
shifts in the conduction band are found to be negligible.

The results of our measurements are shown on Figure 4
for a UHP (high conductivity) and a HP (low conductivity)
sample at low excitation intensity. In general, the band gap
variation agrees with that obtained by Colbow (1966) and
Thomas and Hopfield (1960). We found that the exciton emission
energies differ slightly (<1 mev) for UHP and HP samples.
Increasing the excitation intensity by two orders of magnitude
lowered the exciton emission energies by approximately 0.5 to
1.0 mev in most samples. Screening of excitons will be
i. discussed in Chapter 5. For the HEB we will make use of the
L
band gap variation as shown in Figure 4 for the HP sample
at low excitation intensity. From conductivity measurements i4.E
we estimated a free carrier concentration of less than
1014 at T = 80•‹K and low excitation intensities. Under
these conditions we can neglect screening effects and Figure
should represent the band gap variation to a good accuracy.
4.3 Kinetic Energy, EK
The rate of recombination of the HEB is given by (Colbow
W(EK) = N: n(EK) v 0(EK) 4
0 here NA is the concentration of neutral acceptors, v is the
elocity of the electrons given by
v = (2EK/mg) 1/2

where m* i s t h e e l e c t r o n e f f e c t i v e mass, and o (EK) i s t h e e
c a p t u r e c r o s s s e c t i o n f o r an e l e c t r o n by a n e u t r a l a c c e p t o r .
n(EK) i s t h e e l e c t r o n c o n c e n t r a t i o n a s a f u n c t i o n of k i n e t i c
energy . Assuming a Boltzman d i s t r i b u t i o n f o r a p a r a b o l i c
conduction band w e can w r i t e
I f w e assume a c a p t u r e c r o s s s e c t i o n independent of E K , t h e
HEB recombinat ion ra te i s g iven by (us ing Eqns. 4.301, 4.302
and 4.303)
a-
where Wo i s a c o n s t a n t . This has a maximum f o r e l e c t r o n s of
k i n e t i c energy EK = kT. The emiss ion energy of t h e zero-
phonon peak of t h e HEB i s then g iven by
i.
F
I A t very low f r e e c a r r i e r c o n c e n t r a t i o n s w e can assume E A and
2 ; e ~ / K R t o be c o n s t a n t such t h a t t h e energy s h i f t of t h e HEB
! emiss ion peak as a f u n c t i o n of t empera ture is g iven by

AE (mev)
Figure 5 Peak energy variation of HEB as a function of
temperature at low free carrier concentration
(no screening).

4.4 Hot Carriers
It was suggested by Colbow and Nyberg (1967) that a pos-
sible explanation for the observed.energy shift of the HEB
emission peak could be the recombination of hot electrons w i t h
the hole bound to the acceptor. We found earlier that the
peak energy of the HEB is given by (Eqn. 4.304)
where T was assumed to be the lattice temperature. However, if
the effective temperature of the electrons in the conduction
band is distinct, i.e., higher than the lattice temperature,
a higher emission energy would be expected. In particular, with
the crystal at some temperature T I an effective electron tempera-
ture of Te = T + 23OK could account for an energy shift of
2 mev.
It should be noted here that the above idea only applies to
semiconductors where the optical transition probability for a
transition between a conduction band state and an acceptor level
is essentially constant over those conduction band energies
which would be occupied by hot electrons. The transition prob-
ability was calculated by Dumke (1963) assuming a direct gap
between parabolic bands and shallow impurities. The result,
derived from time-dependent perturbation theory, is given as

where
I lPvc avg = averaged i n t e r b a n d m a t r i x element of
t h e momentum o p e r a t o r .
EA = accep to r i o n i z a t i o n energy .
EG = band gap energy .
* ECK = R2~2/2me = f i w - (EG - EA) = k i n e t i c energy
o f an e l e c t r o n of wave number K i n t h e con-
d u c t i o n band.
m = f r e e e l e c t r o n m a s s . 0
* m = e l e c t r o n e f f e c t i v e mass. e
m = 2 E A ~ 2 ? ? 2 / e 4 = e q u i v a l e n t e f f e c t i v e mass f o r A
t h e a c c e p t o r .
NA = d e n s i t y of n e u t r a l accep to r s .
N = photon d e n s i t y
n = r e f r a c t i v e index of c r y s t a l

It can be seen that the transition probabiilty becones szallzr
as E increases. The decrease of A occurs at (see Eq,;. 4 . 4 ; ; ; CK ac
* In C d S , m /a is approximately 5 w l t h E = 165 mev ana = 6.-6
A e A
(Aven and Prener, 1967) and hence
It follows that, for the HEB emission, the transition proba-
bility can be essentially constant for the conduction Sand
energies which are of interest in the case of hot electrons.
Radford et al. (1972) compared the emission spectra cf C b T
produced under photoexcitation and cathodoexcitation. The
HEB emission peak at liquid nitrogen temperature was fount
to occur at 5135 for cathodoexcitation whlle for 2hoto-
excitation the same peak shifted to 5142 8 , a difference of 5 .&
corresponding to 3.3 mev. At liquid helium temperatures, the
HEB emission peak was found to occur at 5129 8, for cathode-
excitation and at 5138 % for photoexcitation, a difference or
9 8 corresponding to 4.2 mev. Radford et al. interpreted chz
observed energy shift in terms of a difference between the
effective electron temperature of the conduction electrons

for tlle two modes of excitation. We would like to point out,
however, that the two modes of excitation employed by Radford
e t a1 . resulted in iuninescence spectra of different intensity . In particular, Figure 1 and 2 of Radford's paper show that
the cathodoluminescence spectrum is approximately 15 times
more intense than the photoluminescence spectrum at 77OK. At
liquid helium temperature the difference is approximately 200.
That the total green edge emission intensity is much
greater for cathodoluminescence than photoluminescence may be
explained (Bryant et al., 1970) by the fact that the penetra-
tion depth of the cathodoexcitation is much greater than that
of the photoexcitation. A greater volume of crystal is thus
excited under cathodoexcitation. Also, the free carrier
concentrations produced by the two modes of excitation are
not the same and an energy shift due to free carrier screening
cannot be excluded.
4.5 Screening of Bound States
For semiconductors, the effective mass approximation con-
sists in treating the electron [holes] as free particles whose
motion is determined by the properties of the conduction
[valence] band near the minimum with an effective mass m*.
In particular, if a physical quantity is given by

f o r f r e e e l e c t r o n s , t hen f o r e l e c t r o n s i n t h e semiconductor
t h e same q u a n t i t y i s determined by
* where m i s t h e m a s s of t h e f r e e e l e c t r o n and m t h e e f f e c t i v e
0 * mass of t h e e l e c t r o n i n t h e semiconductor. m can be deduced
* from t h e measured p r o p e r t i e s of F i f t h e f u n c t i o n f i s known.
T h e e f f e c t i v e mass approximation i s u s e f u l i f t h e same va lue * *
f o r m d e s c r i b e s many p h y s i c a l q u a n t i t i e s such a s F . Kohn
(1957) d i s c u s s e s i n d e t a i l t h e e f f e c t i v e m a s s approximation
of sha l low donor and accep to r s t a t e s i n e l emen ta l semiconductors .
The e f f e c t i v e mass equa t ion f o r an e l e c t r o n bound t o a donor
i s g iven a s
By analogy t o t h e Schrodinger equa t ion f o r t h e hydrogen atom,
t h e b ind ing energy o f t h e ground s t a t e o f a n e u t r a l donor
d e f e c t i n a semiconductor i s t h u s g iven by
* me/mo i s t h e e l e c t r o n e f f e c t i v e m a s s r a t i o and K i s t h e s t a t i c
d i e l e c t r i c c o n s t a n t which t a k e s account of t h e r e d u c t i o n of

t he coulomb f o r c e between charges due t o t h e e l e c t r o n i c p o l a r i z -
a t i o n of t h e c r y s t a l . For an a c c e p t o r i m p u r i t y , EA i s ob- * *
t a i n e d by r e p l a c i n g m e by mh, t h e n o l e e f f e c t i v e mass.
The Bohr r a d i u s of t h e ground s t a t e of hydrogen
2 2 f i / m o e . I n a semiconductor
where a. i s t h e "Bohr rad ius ' ' of t h e donor s ta te .
Eqns. 4.502 and 4.503 w e can w r i t e
i s g iven by
4 .503
Combining
Expressing ED i n mev and r i n A , Eqn. 4.504 reduces t o 0
0
where w e used K = 8 . 4 6 f o r CdS.
So f a r , w e have assumed t h a t t h e r e i s no i n t e r a c t i o n between
neighboring i m p u r i t i e s and between i m p u r i t i e s and f r e e c a r r i e r s .
If t h e impur i ty c o n c e n t r a t i o n is l a r g e , t h e r e i s an o v e r l a p of
t h e e l e c t r o n wave f u n c t i o n s of neighboring impur i ty c e n t e r s
which causes a broadening of t h e e l e c t r o n [ho le ] l e v e l s t o form
an impur i ty band ( F i s t u l , 1969) . A l e v e l broadens symmetr ical ly
above and below i t s o r i g i n a l p o s i t i o n and t h u s E~ and EA

become s m a l l e r . W e can n e g l e c t t h i s t y p e of i n t e r a c t i o n s i n c e
a l l o u r samples were undoped ( f o r impur i t y conduc t ion i n doped
c r y s t a l s of CdS see eg. ToyotoRi d t a l . , 1968 ) .
W e cannot n e g l e c t t h e i n t e r a c t i o n between i m p u r i t i e s and f r e e
c a r r i e r s . A t h igh e x c i t a t i o n i n t e n s i t i e s t h e c o n c e n t r a t i o n
of f r e e c a r r i e r s is l a r g e even a t low t empera tu r e s . The
p resence of f r e e carriers s c r e e n s t h e Coulomb i n t e r a c t i o n be t -
ween t h e bound e l e c t r o n [ho l e ] and t h e i m p u r i t y i o n which r e s u l t s
i n a reduced b ind ing energy . Bonch-Bruevich ( 1 9 6 3 ) , Colbow
and Nyberg (1967 ) , Kr i ege r (1969) and Colbow and Dunn (1970)
i n v e s t i g a t e d t h e . sc reen ing e f f e c t of f r e e c a r r i e r s by u s ing
t h e Debye-Huckel form f o r t h e p o t e n t i a l
where X i s t h e Debye s c r e e n i n g l e n g t h g i v e n by
and n i s t h e f r e e c a r r i e r d e n s i t y . For a d e r i v a t i o n of Eqn. 5
see Appendix A.
To c a l c u l a t e t h e impur i t y i o n i z a t i o n energy i n t h e p resence
o f s c r e e n i n g w e s u b s t i t u t e t h e Debye-Huckel p o t e n t i a l , Eqn.
4 .505 , i n to t h e e f f e c t i v e mass Eqn. 4.501; i . e . , w e seek t h e
ground s t a t e energy of t h e Schrod inger e q u a t i o n

* To find EA, the acceptor ionization energy, me is replaced by
* m h' The solution to Eqn. 4.506 can be approximated by first
order perturbation techniques (Colbow and Dunn, 1970) or by a
variational approach (Colbow and Nyberg, 1967; Krieger, 1969).
Both solutions are outlined below -
a) perturbation method:
The energy shift is given by
where Eo is the impurity ionization energy in the absence c~f
free carrier screening and Vt(r) is the difference in potential
energy with and without screening and is found to be
The only case considered is that in which Qo is a hydrogenic
wave function:
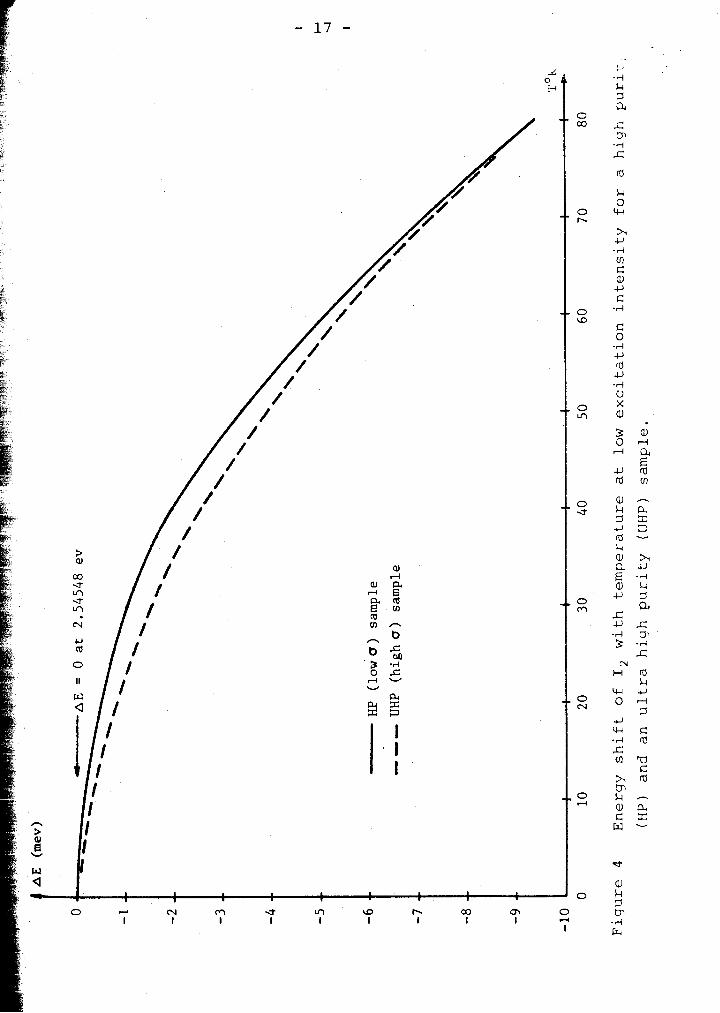
Evaluating the integral over all space and simplifying yields
The energy shift of the acceptor involved in the HEB emission
was obtained from Eqn. 4.508 and is shown in Fig. 6 for various
temperatures and a range of free carrier concentrations. We
assumed Eo = 165 mev and K was taken to be 8.46 (Aven and
Prener, 1967). Expanding the term
in Eqn. 4.508 and keeping only the first two terms, we get
where AE is given in mev. AE is thus proportional to hi- , as
expected, but inversely proportional to . The temperature
dependence can be understood if one considers the kinetic

F i g u r e 6 Decrease of t h e a c c e p t o r b i n d i n g energy due t o
s c r e e n i n g a t va r ious t e m p e r a t u r e s (E,= 165mev).

e n e r g y of t h e f r e e c a r r i e r s . A t h i g h t e m p e r a t u r e s t h e k i n e t i c
c n e r q y is l a r g e such t h a t it i s n o r e d i f f i - c u l t f o r a
space c h a r g e t o b u i l d up around t n e i m p u r i t y and hence t h e
s c r e e n i n g i s n o t a s e f f e c t i v e a s i t would be a t a lower
t e m p e r a t u r e .
b ) v a r i a t i o n a l method:
The Hami l ton ian f o r t h e bound e l e c t r o n [ h o l e ] i s g i v e n by
W e assume a t r i a l wave f u n c t i o n o f t h e form
where 6 i s t h e v a r i a t i o n a l pa ramete r and a i s t h e "Bohr 0
r a d i u s " g i v e n by E q . 4.504. The i o n i z a t i o n e n e r g y o f t h e
i m p u r i t y i s r e a d i l y found by c h o o s i n g 6 s o a s t o minimize t h e
ground s t a t e e n e r g y g i v e n by
The e n e r g y s h i f t due t o s c r e e n i n g i s t h e n g i v e n a s
which h a s a minimum w i t h r e s p e c t t o B f o r

Eo i s t h e i m p u r i t y i o n i z a t i o n e n e r g y i n t h e a b s e n c e of f r e e
c a r r i e r s c r e e n i n g and i s r e l a t e d t o a by 0
Eqn. 4 .511 h a s been s o l v e d f o r 6 as a f u n c t i o n o f ao/h where
The s o l u t i o n is shown i n F i g . 7 . I t c a n b e s e e n t h a t 6 = 0 . 5
i f a. = A . S u b s t i t u ~ i n g 6 = 0.5 i n t o E q . 4.510 g i v e s AE = Eo. -
Hence, no bound s t a t e s c a n e x i s t i f t h e Debye l e n g t h i s less
t h a n o r e q u a l t o t h e " ~ o h r r a d i u s " .
F i g . 7 a l s o shows t h a t
S u b s t i t u t i n g B = 1 i n t o Eqn. 4.510 and making u s e o f Eqn. 4.512
T h i s i s i d e n t i c a l t o Eqn. 4.508which was d e r i v e d from f i r s t
o r d e r p e r t u r b a t i o n p r i n c i p l e s . The c o n d i t i o n (ao/A)<O.l * k c o r r e s p o n d s t o c a r r i e r c o n c e n t r a t i o n s B F
L
n < 1.5x101 ' , T = 10•‹K t


F i
- 33 - i b with Eo = 165 mev and K = 8.46. At higher carrier concentra- P i
tions the energy shifts predicted by Eqns. 4.508 and 4.510
differ slightly. The ionization energy goes to zero less
sharply at the critical density ( A ao) as predicted by
the variational solution.
It is known that for the Debye-Huckel potential
(Eqn. 4.505) the number of descrete energy eigenvalues
is always finite, in contrast to the purely coulombic poten-
tial . Further, any departure of the potential from a strict
l/r dependence will remove the L-degeneracy which is charac-
teristic for the hydrogen problem. Bonch-Bruevich and Glasko
(1963) have investigated the energy spectrum of a particle
in a Debye field by numerical methods. In particular, the
equation
was reduced to the eigenvalue problem
by a proper choice of dimensionless variables. Approximate
eigensolutions of the above equation withe = 0 were also
calculated by ~ulthgn and Laurikainen (1951) with emphasis
on the mathematical aspect of the problem. The results of
Bonch-Bruevich et al. show that the energy levels are pulled'
closer to the conduction band as a result of increasing free
carrier concentration and, finally, disappear. From their

d a t a , w e have c a l c u l a t e d t h e e n e r g y s h i f t f o r a donor i m p u r i t y
w i t h a n e l e c t r o n e f f e c t i v e mass r a t i o m*/m = 0.17 (Ray, 1963) e c
and a st-atic d i e l e c t r i c c o n s t a n t K = 8.46. The r e s u l t s are shown
i n F i g u r e 8 t o g e t h e r w i t h t h e e n e r g y s h i f t a s p r e d i c t e d by
Eqn. 4 . 5 0 8 ( p e r t u r b a t i o n method) . A s c a n b e s e e n , t h e a g r e e -
ment i s q u i t e good.
I t h a s been shown i n t h i s s e c t i o n t h a t s c r e e n i n g o f t h e
a c c e p t o r c o u l d a c c o u n t f o r t h e obse rved e n e r g y s h i f t s i n t h e
HEB luminescence . A s t h e e x c i t a t i o n i n t e n s i t y i s i n c r e a s e d ,
more f r e e c a r r i e r s a r e g e n e r a t e d . The i n c r e a s e d f r e e c a r r i e r
c o n c e n t r a t i o n r e d u c e s t h e b i n d i n g e n e r g y o f t h e h o l e on t h e
a c c e p t o r due t o s c r e e n i n g o f t h e coulomb i n t e r a c t i o n . A
r e d u c t i o n i n EA i n c r e a s e s t h e energy o f t h e HEB e m i s s i o n
peak ( E q n . 4 . 3 0 4 ) .
4 .6 Donor-Acceptor I n t e r a c t i o n , e 2 a / K ~
The s i g n i f i c a n c e o f t h e donor -accep to r i n t e r a c t i o n term
h a s o f t e n been n e g l e c t e d by many a u t h o r s . I t was f i r s t
p o i n t e d o u t by Van Doorn (1966) b u t w i t h o u t t h e pa ramete r a
which w e i n t r o d u c e d t o a c c o u n t f o r s c r e e n i n g e f f e c t s .
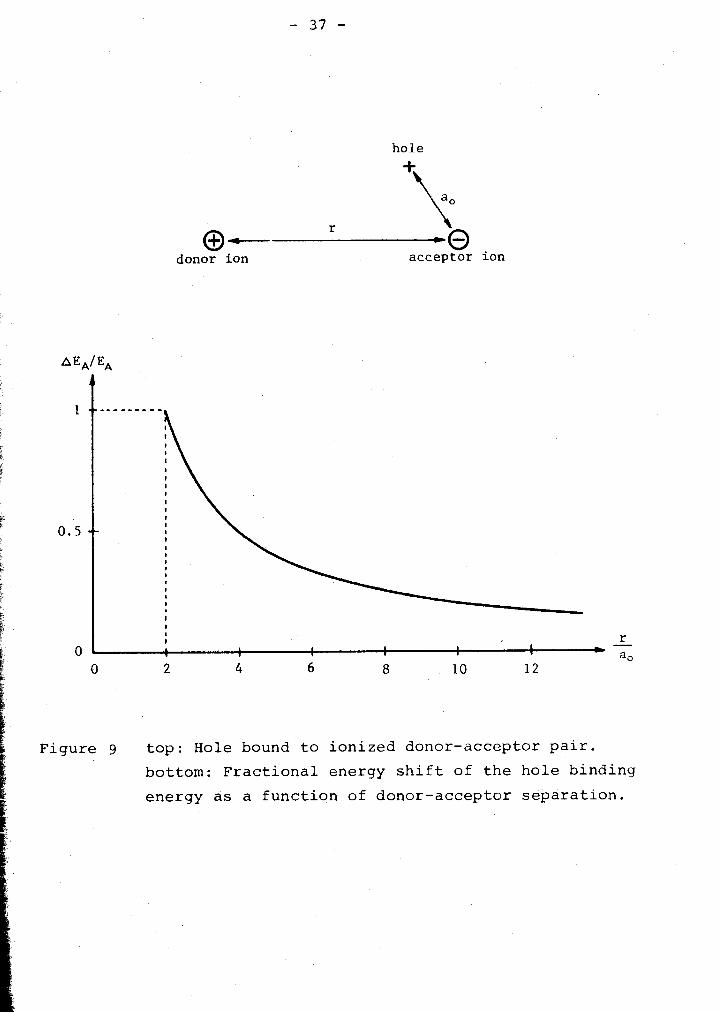
Cons ide r f i r s t a h o l e bound t o a n i o n i z e d donor -accep to r
p a i r . The m o s t i m p o r t a n t e f f e c t o f t h e i o n i z e d donor is t o
r a i s e t h e a v e r a g e p o t e n t i a l e n e r g y o f t h e h o l e by a n amount


where r is the donor-acceptor separation. Fig. 9 shows the
fractional energy shift ( A E ~ / E ~ ) of the hole as a function
of r/ao, where EA is the acceptor ionization energy and a.
the acceptor "Bohr radius" (Eqn. 4.504). It can be seen
that for a critical separation r c = 2ao the hole becomts
unbound. Hopfield (1964) calculated rc in various approxima-
tions. taking into account the finite spatial extent of the
hole wavefunction and the acceptor polarizability, and found
that
The total binding energy of an electron-hole pair to a
donor-acceptor pair is given by (Thomas et al., 1964; Williams,
1968)
where J includes four coulomb interactions and is equal to
the cohesive energy of the neutral donor-acceptor pair
(J ? 0 in Eq. 4.602), e2/rr is due to the core interaction
which remains after ionization, and ea6/~r6 is the Van der
Waals attraction between the neutral donor and acceptor
(a = effective Van der Waals coefficient). If the donor-
acceptor separation, r, is large compared to the radii of
the donor and acceptor states, J and the Van der Waals
ho le
donor ion acceptor ion
F i g u r e g t o p : Hole bound t o i o n i z e d donor -accep to r p a i r .
bot tom: F r a c t i o n a l ene rgy s h i f t of t h e h o l e b i n d i n g
e n e r g y as a f u n c t i o n of d o n o r - a c c e p t o r s e p a r a t i o n .

term vanish such that the binding energy of the electron-hole
pair becomes
2 What fraction of e / ~ r modifies the ground state of either of
the two impurities depends on the values of ED and EA. For
the special case in which ED = EA, both impurities have their
2 binding energies decreased by e /2~r. If, on the other hand,
the binding energies are such that ED<<EA, the weakly bound
particle (the electron) is unaffected by the presence of the
neutral acceptor such that the strongly bound particle (the
hole) experiences a modification of its binding energy by .
2 e /ur. In CdS, ED 32 mev and EA = 165 mev. We will thus
assume that the binding energy of the electron-hole pair is
given by the one particle binding curve (Fig. 8) plus the
donor binding energy. The consequence is that the donor-
acceptor interaction term which is of interest for the HEB
recombination does not depend on whether the donor is neutral
or ionized and is thus given by Eqn. 4.601.
We now have to find an expression for the most probable
separation of the donor-acceptor pairs. For definiteness,
and in agreement with the present experimental situation, we
will assume that the donor concentration is larger than the
acceptor concentration such that the most probable separation

of the donor-acceptor pairs will be a function of donor
concentration only.
L
; Let g(r)dr be the probability of finding a donor at a dis-
tance r from a given acceptor with no other impurity inside e; i the sphere 4ar3/3 centered at the acceptor. The simplest
solution is obtained by neglecting all interactions between
ions. The probability that there is a donor at a distance r
from the acceptor is then given by
The probability that there is no other impurity inside the
sphere 4ar3/3 is
where G(r) is the probability that there is another impurity
inside the sphere and is simply given by
From Eqns. 4.603, 4.604 and 4.605 we then obtain the
integral equation .-
C
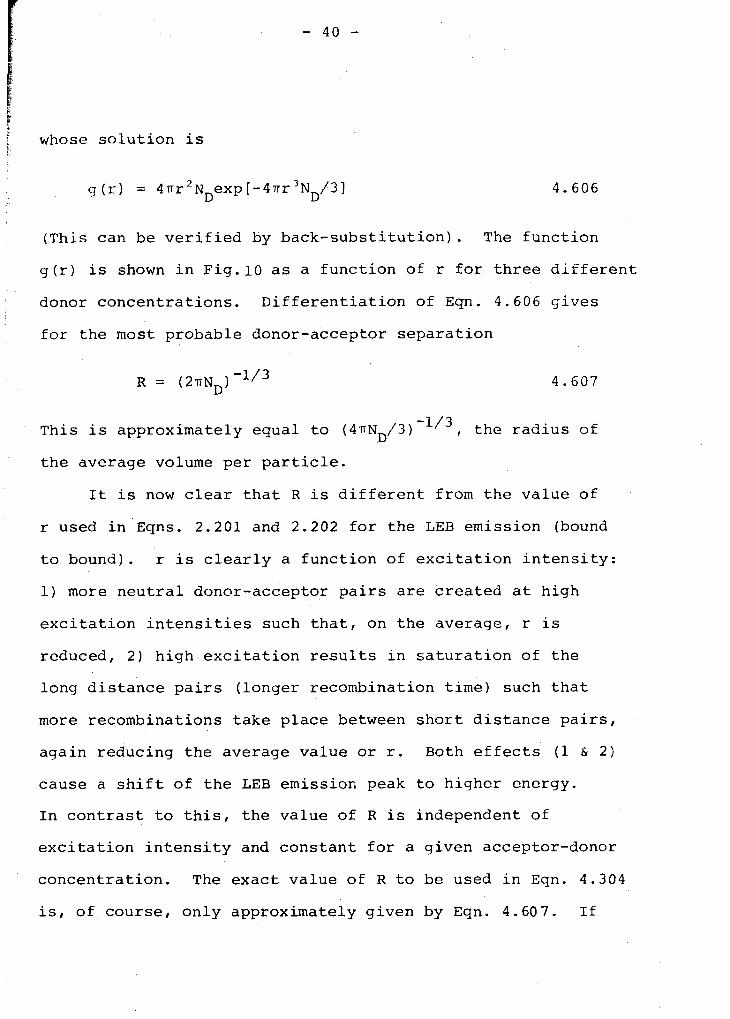
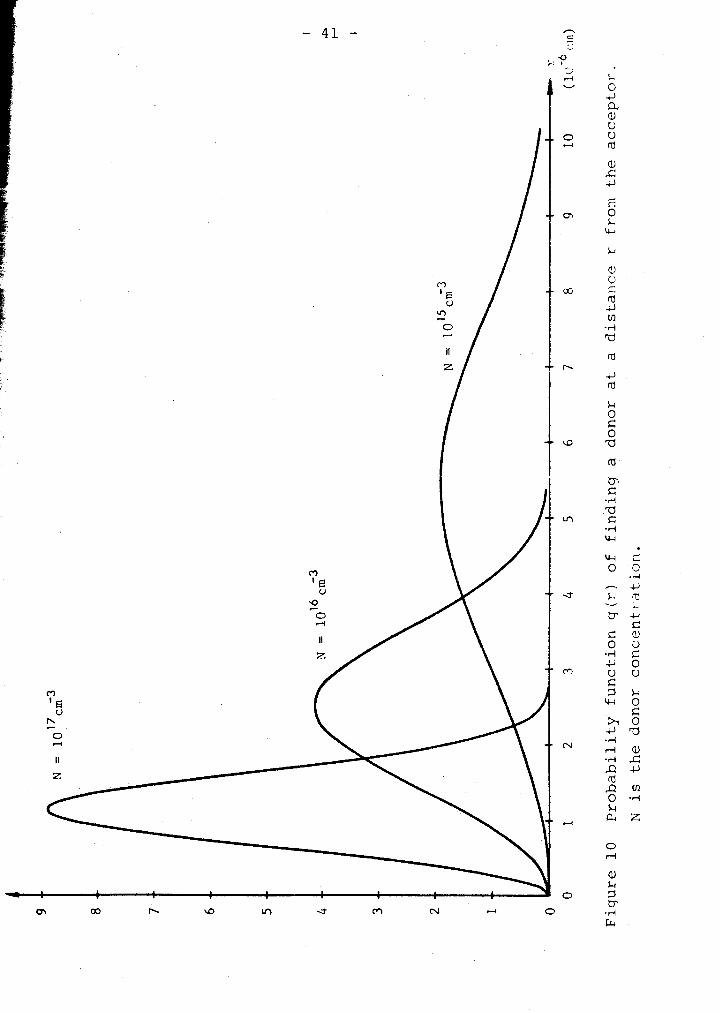
whose solution is
(This can be verified by back-substitution). The function
g(r) is shown in Fig.10 as a function of r for three different
donor concentrations. Differentiation of Eqn. 4.606 gives
for the most probable donor-acceptor separation
This is approximately equal to (4nND/3) -'I3, the radius of
the average volume per particle.
It is now clear that R is different from the value of
r used in Eqns. 2.201 and 2.202 for the LEB emission (bound
to bound). r is clearly a function of excitation intensity:
1) more neutral donor-acceptor pairs are created at high
excitation intensities such that, on the average, r is
reduced, 2) high excitation results in saturation of the
long distance pairs (longer recombination time) such that
more recombinations take place between short distance pairs,
again reducing the average value or r. Both effects (1 & 2 )
cause a shift of the LEB emission peak to higher energy.
In contrast to this, the value of R is independent of
excitation intensity and constant for a given acceptor-donor
concentration. The exact value of R to be used in Eqn. 4.304
is, of course, only approximately given by Eqn. 4.607. If

interaction between impurities is taken into account one
wo1;ld expect a smaller value for R due to coulomb inter-
action between the impurities during crystal preparation.
Moreover, the probability for an acceptor to capture a hole
is influenced by the presence of a nearby donor which would
increase the effective value of R.
Using Eqn. 4.697, we find that
for a donor concentration of 1016 ~m'~. Assuming a = 1 and
K = 8.46, this gives a donor-acceptor interaction energy
(Eqn. 4.304)
The coulomb interaction between donor-acceptor pairs
will be subject to screening at large free carrier concentra-
tions. The potential due to the donor ion will then be
given by the Debye potential (Eqn. 4.505)
The parameter a in Eqn. 4.304 is thus given by

i We have shown that the donor-acceptor interaction term can
be significant at high donor concentrations and low excitation
iritensity. In particular, the interaction term must be taken
into account if Eqn. 4.304 is to be used to calculate the
value of the acceptor ionization energy from experime~~tal
data. The contribution of the interaction term to the total
emission energy becomes less important at high free carrier
concentrations due to screening.
4.7 RESULTS AND DISCUSSION
It was shown in this chapter that the peak energy of
the HEB emission is a function of temperature and excitation
intensity. The peak energy is given by
where
E~ = band gap energy (Fig. 4 )
E~ = acceptor binding energy (Eqn. 4.508 1
kT = kinetic energy of electrons at the instant
of recombination
2 e - e = donor-acceptor interaction term KR
(Eqns. 4.607 and 4.608)
nE = phonon emission energy (n = 0,1,2,. . . ) P

j p o s i t i o n o f t h e zero-phonon peak and t h e known band gap
e n e r g y a t v e r y low t e m p e r a t u r e s and low e x c i t a t i o n i n t e n s i t y .
Under t h e s e c o n d i t i o n s t h e f r e e c a r r i e r c o n c e n t r a t i o n i s
s m a l l such t h a t s c r e e n i n g e f f e c t s c a n b e n e g l e c t e d . The
energy of t h e HEB emiss ion peak a t 4.2OK was measured a s
2.4186 e v f o r a h i g h p u r i t y sample o f CdS. Using Eqn. 4.701
w i t h EG = 2.5826 ev and kT = 0.0004 e v w e f i n d
e2 -R/A EA = 164.4 mev + - e
KR
To e v a l u a t e t h e donor-acceptor i n t e r a c t i o n t e r m w e used an
approximate v a l u e of t h e donor c o n c e n t r a t i o n . The H a l l m o b i l i t y
a s a f u n c t i o n o f t e m p e r a t u r e was t a k e n from Ray (1969) . The
numer ica l f a c t o r c r e l a t i n g t h e H a l l m o b i l i t y R t o t h e d r i f t
m o b i l i t y 1~ n
was assumed u n i t y . The e l e c t r o n c o n c e n t r a t i o n a s a f u n c t i o n
o f t e m p e r a t u r e was c a l c u l a t e d from c o n d u c t i v i t y measurements
u s i n g
An approximate v a l u e o f t h e donor c o n c e n t r a t i o n c o u l d t h e n be
o b t a i n e d from n v s . l / T i n t h e t e m p e r a t u r e region of i m p u r i t y
s a t u r a t i o n . Hence
Using Eqn. 4.697 w e f i n d t h e most p r o b a b l e donor -accep to r
s e p a r a t i o n
which l e a d s t o an i n t e r a c t i o n energy
2 e- a - 3 . 1 mev KR
w i t h K = 8 . 4 6 and a = 1. S u b s t i t u t i o n i n t o Eqn. 4.702 g i v e s
E~ - 167.5 mev
w i t h a n u n c e r t a i n t y of a b o u t 2 . 5 mev due t o t h e e s t i m a t e of
No. T h i s compares w e l l w i t h t h e v a l u e of 170 mev from Colbow
( 1 9 6 6 ) and 165 mev from t h e r e s u l t s o f Henry e t a l . ( 1 9 7 0 ) .
W e n o t e t h a t t h e i n t e r a c t i o n term was n o t i n c l u d e d by Colbow
and Henry e t a l .
F i g u r e 11 shows some e x p e r i m e n t a l p o i n t s which were
o b t a i n e d from two h i g h p u r i t y samples a t v e r y low and a t
maximum e x c i t a t i o n i n t e n s i t y u s i n g above band gap r a d i a t i o n
from a mercury a r c (see Chap te r 3 f o r e x p e r i m e n t a l d e t a i l s ) .


The acceptor binding energy calculated above was obtained
from sample 1. i
a) Low excitation intensity:
From Figure 11 it can be seen that the peak energy for
the two samples differs by about 2.4 mev at 4.2OK. This can
be accounted for by a difference in the donor-acceptor
interaction term for sample 2. A donor concentration of
15 -3 5.4 x 10 cm gives an interaction energy equal to 5.5 mev
(assuming a = 1) which differs from the interaction energy
of sample 1 by 2.4 mev (Eqn. 4.703). This illustrates the
uncertainty in obtaining the acceptor binding energy from
the measured HEB peak energy if the exact value of the
interaction term (or the donor concentration) is unknown.
Aside from this energy shift due to different donor
concentrations we see that the measured peak energies agree
well with the predicted temperature dependence (dotted line
in Fig. 11) for T < 60•‹K. Since the free carrier density
increases as the temperature is raised, both EA and the
2 donor-acceptor interaction term, e ~ / K R , are subject to
14 -3 screening. For a free carrier concentration of 10 cm
at 50•‹K, for example, we find from Figure 6: AEA = 1 mev.
From Eqn. 4.608 and 4.703 we obtain a change in the inter-
action term of -1 mev for the same carrier concentration
and temperature. Since AEA increases the peak emission
2 energy and A(e ~/KR) results in an energy decrease, no net

e f f e c t i s observed. A t h igher t empera tu re s , and t h u s h igher
c a r r i e r c o n c e n t r a t i o n s , s c r een ing of t h e accep to r becomes
more dominant r e s u l t i n g i n t h e observed d e v i a t i o n from t h e
d o t t e d l i n e i n F igu re 11. For example, a t a f r e e c a r r i e r
c o n c e n t r a t i o n of 3 x 10" cme3 and a t empera ture of 80•‹K
we f i n d f o r sample 1 ( N ~ 1015)
AEA = 5 mev
2 A(e ~ / K R ) = 2.5 mev
wi th a n e t s h i f t of 2.5 mev t o h igher energy.
b ) High e x c i t a t i o n i n t e n s i t y :
The observed s h i f t of t h e measured emiss ion peak i s
according t o e x p e c t a t i o n and can aga in be expla ined by t h e
sc reen ing model. I nc reas ing t h e e x c i t a t i o n i n t e n s i t y c r e a t e s
more f r e e c a r r i e r s which sc reen t h e i n t e r a c t i o n between t h e
ho le and t h e accep to r and a l s o between donor-acceptor p a i r s .
A t h igh f r e e c a r r i e r d e n s i t i e s t h e s c reen ing of t h e hole-
accep to r i n t e r a c t i o n i s dominant r e s u l t i n g i n t h e observed
s h i f t t o h ighe r energy. W e no t e (F ig . 11) t h a t t h e energy
s h i f t w i t h r e s p e c t t o t h e d o t t e d l i n e i n c r e a s e s w i t h tempera-
t u r e f o r bo th samples a s expected. However, t h e energy d i f f e r -
ence between t h e low e x c i t a t i o n and t h e h igh e x c i t a t i o n peaks
i s a maximum a t around 40•‹K f o r both samples and dec reases

at higher temperatures, becoming negligible at 80•‹K for
sample 2. This is probably because the percentage change
in free carrier concentration in going from low excitation
to high excitation becomes less as the temperature is
increased.
The energy shift in the high excitation case could
also be explained in terms of hot carriers (an increase in
the value of kT in Eqn. 4.701). However, hot electro,~
recombination could not explain the positive energy shift
at T > 60•‹K which was observed in the low excitation case.
It should be noted that screening due to hot electrons is
less effective since screening is inversely proportional
to fi (cf. Eqn. 4.509). Thus hot electron effects would
be partially compensated by a decrease in screening.
It is not certain wether a decrease in band gap energy
due to large free carrier densities is important. Gay (1971)
postulated a band gap reduction due to self screening of the
free carrier plasma (see Section 5.2).
The actual energy shift is expected to be somewhat
larger than was observed since a slight increase in sample
temperature can probably not be avoided at high excitation
intensities. An increase in temperature reduces EG and thus
the HEB emission energy. The sample temperature was
measured with a thermocouple which was mounted on the
sample using silver paste for good thermal contact. Sample

h e a t i n g a t i n c r e a s i n g e x c i t a t i o n l e v e l s w a s a l s o checked by
o b s e r v i n g t h e r e l a t i v e s t r e n g t h s o f t h e I and Il e x c i t o n s . 2
= 2 i s less t i g h t l y bound t h a n I1 (see T a b l e I ) and i s
t h e r e f o r e t h e r m a l l y i o n i z e d more r e a d i l y . The r a t i o o f
v a l u e s t h u s s e r v e s as a r e l i a b l e i n t e r n a l t e m p e r a t u r e
peak
s t a n d a r d .
W e have measured t h e t e m p e r a t u r e and e x c i t a t i o n i n t e n s i t y
dependence o f v a r i o u s HP samples o f CdS f rom d i f f e r e n t s o u r c e s .
A l l s a m p l e s produced r e s u l t s which w e r e i n g e n e r a l ag reemen t
w i t h t h e b e h a v i o u r o f sample 1 and 2 d i s c u s s e d above .
5. SCREENING OF EXCITONS
5.3 Introduction
~f a crystal satisfizs the effective mass approximation,
and the extrema of the energy bands lie in the center of the
Brillouin zone, then the total energy of an exciton is
given by
E~ is the band gap energy, K the dielectric constant of the
medium, and a, the exciton Bohr radius given by
- ?I2 K ao - E 2 - 5.102
where v is the reduced mass of the exciton defined by
1 - 1 - - - 1 + - p m e * mh*
with me* and mh* being the electron and hole effective masses.
K is the wave vector of the exciton
The positive hole and the negative electron thus form a
bound system similar to the hydrogen atom. The exciton

spectrum consists of a series of discrete parabolic bands
below EG which merge into a continuum at higher energies.
The last term in Eqn. 5.101 represents the kinetic energy
of the exciton which res-llts In a slight broadening of the
exciton levels. Using Eqn. 5.102 with u = 0.155 mo and
K = 8.46 appropriate for CdS we obtain an exciton Bohr 0
radius of - 29 A. The exciton is thus large compared to
the lattice constant and embraces many atoms.
Intrinsic (free) excitons have a tendency to form
ion-like or molecule-like complexes at low temperatures.
For example, two intrinsic excitons may form an excitonic
molecule (similar to H z ) or an intrinsic exciton may be
captured by an impurity atom (acceptor or donor) to form
a bound exciton complex.
5.2 Screenina of Excitons
From the discussion of screening of bound states (4.5)
it is expected that the binding energy of excitons would
decrease at high densities of free carriers which would be
created at high excitation intensities. A decrease in
binding energy would result in a corresponding increase
in the energy of recombination. However, we found that
the exciton energy decreased slightly (<1 mev) as the
excitation intensity was increased. This was the case for

both intrinsic and bound excitons. From conductivity
measurements we estimated a free carrier concentration
greater than 10'~cm.'~ at 30•‹K and maximum excitation
intensity for the UHP (1 igh conductivity) samples. Thus,
if Eqn. 4.508 is applicable, a shift of approximately
4.5 mev to higher energy should have been observed for the
intrinsic exciton. This discrepancy is believed to be due
to the internal motion of the exciton which makes it more
difficult for a space charge to be formed than in the case
of the stationary acceptor (or donor) ion. The angular
frequency of motion of an exciton (characteristic frequency)
is given by (Dexter and Knox, 1965)
LE W = 8 - b angularmomentum_ - - _ _ - - ex mass x (radius) IJ aO2 5
where Eb is the binding energy of the exciton given by
(see Eqn. 5.101)
-1 With a, = 29 1( we obtain uex = 8.9 X 10" rads sec . In comparison, the plasma frequency of the electrons in a
solid is given by

- 3 With n = lo1' cm , K = 8.46, and me* = 0.17 mo -1
we obtain w = 1.5 x lo1* rads sec , that is to say P
- 3 For (*, = w a carrier concentration of 3.6 X 1018 cm
P ex ' is required. This simple argument would suggest that the
free carrier plasma is too sluggish to follow the internal
motion of the exciton and thus screening due to free
carriers would not be very effective. Therefore, the
simple screening model based on the Debye potential can not
be applied to excitons.
A theoretical study of screening of excitons based on
a dielectric function approach was done by Gay (1971).
The study avoids the region of carrier concentration for
which the plasma frequency ( w ) is comparable to the P
characteristic frequency of the exciton (wex). In the region
w < < w (low carrier concentration) it was found that the P ex free carrier plasma responds only to the time-average charge
density of the exciton which results in a slight lowering
of the exciton energy measured from the top of the valence
band. This is in agreement with our observations. As the
density of free carriers increases the plasma becomes less
sluggish and begins to respond to the relative motion of the

electron and hole. For w >>a the plasma can follow the P ex
internal motion of the exciton essentialy instantly resulting
in the effective screening of the electron-hole coulomb
interaction. Gay's calculations show, however, that the
exciton energy (relative to the valence band) does not change
significantly due to the large free carrier concentration.
The energy of assembly of an exciton is shown to be civen by
W (r) = V(r) + Wm where
-2e 2 - -1 2X(2kTu) 1/2
WO3 - - tan A
5 . 2 0 1 KTrh
r is the electron-hole separation, X the Debye screening
length, and p the reduced mass of the electron-hole pair.
V(r) is the. Debye potential of a screened electron-hole
pair (cf. Eqn. 4.505) and Wm is composed of clothing
energies of the electron and hole. The value of
tan-' (2h(2kT~1)~/~/#) is close to n/2 such that
The change in potential energy due to a change in V(r) is

given by (cf. Eqns. 4.508, 4.509)
It follows that any changc in potential energy due to a
change in V ( r ) is cancelled by an equal but opposite change
in the value of Wm. Hence, no change in exciton enerTy is
observed. Gay interprets Wm as a decrease in the conduction
band edge. It is not clear to us how this conclusion was
arrived at. A band gap reduction given by Eqn. 5.201 would
be remarkable and should show its effects in other optical
processes. For example, Levy at al. (1972) investigated the
exciton-exciton emission line (called M-line by them) in
CdS as a function of excitation intensity. The M-line
appears at high excitation levels and is the result of an
exciton-exciton interaction in which one of the excitons
scatters into the dissociation state, while the other
exciton scatters into a photon-like state. The emitted
photon has an energy
where'
EG = band gap energy
Eb = exciton binding energy
E = E - Eb = exciton energy G

If Eb decreases by an amount A due to a high free carrier
co.lcentration then, according to Gay's paper, EG decreases
by approximately A as well such that E remains unchanged.
From Eqn. 5.202 it is thus expexted that the photon energy
increases by an amount A. However, the peak energy of the
M-line shifts towards the low energy side (-8 mev) of the
spectrum when the excitation intensity is increased. It
was noted by Levy at al. that I2 (exciton bound to a
neutral donor) and the intrinsic exciton emission energies
show no appreciable shift, in agreement with Gay's analysis.
The negative energy shift of the M-line was explained by
Levy at al. to be due to a filling of states at the extrema
of the bands by a high density of free carriers. The
unbound electron-hole pairs created by exciton-exciton
interaction thus require a higher energy which reduces the
energy of the emitted photon. Eqn. 5.202 should then be
written as
h e where EK and EK are the kinetic energies of the created
hole and electron. A shift of - 8 mev requires a free carrier
density of approximately 1018 cm-3 as shown by Levy et al.
This example speaks against a band gap reduction due to a
high free carrier density.

5.3 Conclusions
It was found experimentally that the exciton energies
(both intrinsic and bound) do not change significantly as
a function of excitation intensity. This agrees with
observations by other workers (eg. Levy et al., 1972). A
theoretical study of screening of excitons was done by
Gay (1971) who was able to give a qualitative description
in agreement with experimental observations. Aside from
a nearly constant exciton energy (measured from the valence
band), Gay also postulates a remarkable band gap reduction
due to self-screening of the free carrier plasma. No direct
experimental evidence is available for such a band gap
reduction.
6. SUMMARY
P . The edge emission in CdS consists of two series of
narrow bands. The higher energy series (HEB) is due to the -
recombination of a free electron with a hole bound at a
shallow acceptor. The dependence of the peak energy of the ;
HEB on temperature and excitation intensity was investigated
in the interval 4.2 - 80•‹K. Agreement with predicted temperature dependence for low excitation intensities was
good. The band gap variation as a function of temperature
was obtained from the measured peak energy shifts of a bound
exciton. An average kinetic energy of the electrons equal to
kT at the instant of recombination was found to give good
agreement with the measured peak energies of the HEB. An
often neglected donor-acceptor interaction term was included
in the discussion and found to be important especially for
accurate measurements of the acceptor binding energy. The
interaction term is dependent on the impurity concentrations
and can explain the observed difference in the HEB peak
energies for different samples. A shift to higher energies
at high excitation intensities was measured for two samples
from 4.2 - 80•‹K. No positive identification could be made of the effect causing the energy shift. A reduction in the
acceptor binding energy due to screening by free carriers was
discussed in some detail and found to be the most likely

cause of the observed energy shift. An energy shift due to
khe recombination of hot electrons was considered and could
not be ruled out. In agreement with other workers it was
found that exciton energies (i.~trinsi-c and bound) remain
essentially constant even for large changes in excitation
intensities. Screening of excitons was discussed and
reference was made to a theoretical model proposed by
Gay (1971).

APPENDIX A
The e l e c t r o n i c c u r r e n t dens i t - - a t any p o i n t i n a s o l i d i s
9 i ven by
-8-
3 = v e n r - ~ e v n
where p is t h e m o b i l i t y of t h e e l e c t r o n s , n t h e i r concen-
t r a t i o n , D t h e i r d i f f u s i o n c o n s t a n t and 'C t h e l o c a l e l e c t r i c
f i e l d . A similar exp res s ion can be w r i t t e n f o r t h e ~ l o l e s . -
I f no e x t e r n a l f i e l d is p r e s e n t , E r e s u l t s from t h e presence
of t h e i o n i z e d i m p u r i t i e s and of t h e space charge . The e l e c t r o -
s t a t i c p o t e n t i a l cq(r) f e l t by an e l e c t r o n f a r from t h e i o n i z e d
i m p u r i t i e s w i l l n o t be simply t h a t due t o i on i zed i m p u r i t i e s
a lone . An i o n i z e d impur i ty a c t s t o p o l a r i z e t h e e l e c t r o n s i n
i t s immediate v i c i n i t y ; a d i s t a n t e l e c t r o n t h e r e f o r e responds
bo th t o t h e i o n i z e d impur i ty and t h e induced space charge.
Let us c o n s i d e r t h e fo l lowing model: an e l e c t r o n gas i s
moving i n a n e u t r a l i z i n g background w i t h uniform charge d e n s i t y
n e. The average e l e c t r o n concen t r a t i on i s no. Now in t roduce 0
an a d d i t i o n a l p o i n t charge q a t t h e o r i g i n ( r = 0) of t h e
e l e c t r o n g a s . W e want t o show t h a t t h i s a d d i t i o n a l charge
g i v e s rise t o a s m a l l s p h e r i c a l l y symmetric charge q ( r ) i n
t h e e l e c t r o s t a t i c p o t e n t i a l g iven by'

The e l e c t r o s t a t i c p o t e n t i i - q (7) w i l l obey P o l s s o n r s equdrluu
- - - - -
formula
n ( r ) = Ae ecp ( r ) /kT
where t h e cons tan t A is determined by
/nm d" = N v
N being t h e t o t a l number of e l e c t r o n s i n t h e volume V. In
I t then follows t h a t A = no.
can expand t h e exponent ial f i r s t o rde r

K n e2 0
Ti? v Z q (rj - --- kl q(r) = - q6(r)
where
= K ~ T
47inoe2
It is easy to verify that the solution to equation A 3
is given by
where
Thus the potential arounC a charged impurity is a screened
Coulomb potential. The constant A, which measures the order
of magnitude of the spherical region in which the electron
density is increased (if q is positive), is called the Debye
attenuation length (P. Debye and E. ~Gckel, 1923) . A is determined by the competition between the influence of the
potential energy and kinetic energy on the motion of the
e1ectrons.Screening is the result of the interaction between
the electrons and is opposed by their kinetic energy which
represents the degree of random motion. Fig.12 shows the


Coulomb potential due to a point charge with and without
screening as a function of r.
~t should be noted that in the above derivation it was
assumed that the charge density is continuous such that q(r)
varies slowly over an interparticle distance. This would
require at least one charge in the Debye sphere, or
Substituting Eqn. A5 then gives
Using a random-phase approximation,Colbow and Dunn
(1970) found that the Debye potential, Eqn. A 4 , is valid
even for carrier concentrations which fall outside the
class,ical region of validity as given by A6.

R e f e r e n c e s
Aven N . and P r e n e r J . S . , P h y s i c s and Chemis t ry o f 11-VI Compounds, e d . by M . Aven and J . S . P r e n e r (Nor th- H o l l a n d , Amsterdam, 1 9 6 7 ) .
Bonch-Bruevich V.L. and Glasko V . B . , O p t i c s & S p e c t r o s c o p y 1 4 , 264 ( 1 9 6 3 ) . -.
B r y a n t F . J . and Radford C . J . , J. Phys . C : S o l i d S t a t e Phys. 3 , 1264 ( 1 9 7 0 ) . -
Colbow K . , Phys. Rev. - 1 3 9 , A274 ( 1 9 6 5 ) .
Colbow K . , Phys . .Rev. - 1 4 1 , 742 ( 1 9 6 6 ) .
Colbow K. and Nyberg D.W. , Phys. L e t t e r s - 25A, 250 ( 1 9 6 7 ) .
Colbow K . and Dunn D . , P h i l . Mag. - 22, 237 ( 1 9 7 0 ) .
Condas G.A. and Y e e J . H . , Appl. Phys. L e t t e r s - 9 , 188 (1966) .
Debye P. and Huckel E . , P h y s i k . Z . - 24, 185 ( 1 9 2 3 ) .
Dexter D.L. and Knox R.S., E x c i t o n s ( I n t e r s c i e n c e P u b l i s h e r s , a d i v i s i o n o f John Wiley & Sons , 1 9 6 5 ) .
Dumke W.P., Phys. Rev. - 1 3 2 , 1998 ( 1 9 6 3 ) .
F i s t u l V . I . , H e a v i l y Doped S e m i c o n d u c t o r s , t r a n s l a t e d by Tybulewicz A. (Plenum P r e s s , 1 9 6 9 ) .
Gay J . G . , Phys. Rev. B4, - 2567 ( 1 9 7 1 ) ; E r r a t a : Phys. Rev. - B6, 4884 (1972) .
Goldberg P . , Luminescence o f I n o r g a n i c S o l i d s , ed . by Goldberg P . (Academic P r e s s , 1966) p. 566.
Henry C . H . , F a u l k n e r R.A. and Nassau K . , Phys. Rev. - 183 , 798 ( 1 9 6 9 ) .
Henry C . H . , Nassau K . and S h i e v e r J . W . , Phys. Rev. L e t t e r s 24, 820 ( 1 9 7 0 ) . -
H o p f i e l d J.J. and Thomas D . G . , Phys. Rev. - 122, 35 (1961) .
H o p f i e l d J .J . , P r o c e e d i n g s o f t h e S e v e n t h I n t e r n a t i o n a l C o n f e r e n c e on t h e P h y s i c s o f Semiconduc to r s , ed. by Hul in - M. (Dunod, P a r i s , 1964) pp. 725-735.

~ u l t h t h L. and L a u r i k a i n e n K.V . , Rev. Modern Phys. - 23, 1 (1951)
Knox R.S., S o l i d S t a t e P h y s i c s , Supplement 5 , ed . by F. S e i t z and D. T u r n b u l l (Academic P r e s s , 1 9 6 3 ) .
Kohn W . , S o l i d S t a t e P h y s i c s - 5 , 257-320 ( 1 9 5 7 ) .
K r i e g e r J . B . , Phys . Rev. - 1 7 8 , 1337 ( 1 9 6 9 ) .
Levy R . , Grun J . B . , Haken H . and N i k i t i n e S . , S o l i d S t a t e Commun. - 1 0 , 915 ( 1 9 7 2 ) .
Maeda K . , J . Phys. Chem. S o l i d s - 26, 1419 ( 1 9 6 5 ) .
Mahan G . D . , J. Phys. Chem. S o l i d s - 26, 7 5 1 (1965) .
M a l m H. and Haer ing R . R . , Can. J. o f Phys . - 49,2432 (1971) .
Nassau K. Henry C . H . , and S h i e v e r J . W . , P r o c e e d i n g s o f the Ten th I n t e r n a t i o n a l Confe rence on t h e P h y s i c s o f Semiconduc to r s , e d . by Keller S .P . , Hanse l J . C . , and S t e r n F. (U.S. A t o m i c Energy Commission, 1970) p. 629.
Radford C . J . , Hagston W.E. and B r y a n t F . J . , J. Phys. C : S o l i d S t a t e Phys. - 5 , 511 ( 1 9 7 2 ) .
Ray B. , 1 1 - I V Compounds (Pergamon P r e s s , 1963) . Reynolds D.C. and L i t t o n C.W., Phys. Rev . - 132 , 1023 ( 1 9 6 3 ) .
Reynolds D .C . , L i t t o n C.W. and C o l l i n s T.C., Phys. S t a t . S o l i d i - 9 , 645 (1965) , and Phys. S t a t . S o l i d i - 1 2 , 3 (1965) .
Reynolds D.C. and C o l l i n s T.C., Phys. Rev. - 1 8 8 , 1267 ( 1 9 6 9 ) .
Shionoya S . , J . o f Lum. - 1, 17 ( 1 9 7 0 ) .
Thomas D.G. and H o p f i e l d J.J., Phys . Rev. - 1 1 6 , 573 ( 1 9 5 9 ) ; J. Phys. Chem. S o l i d s - 1 2 , 276 ( 1 9 6 0 ) ; Phys . Rev. - 122 , 35 ( 1 9 6 1 ) .
Thomas D.G. and H o p f i e l d J.J., Phys. Rev. - 1 1 9 , 570 ( 1 9 6 0 ) .
Thomas D . G . and H o p f i e l d J.J., Phys. Rev. - 1 2 8 , 2135 ( 1 9 6 2 ) .
Thomas D . G . , Gershenzon M. and Trurnbore F.A., Phys . R e v . 133 , A269 ( 1 9 6 4 ) . -
Thomas D . G . , H o p f i e l d J.J. and Colbow K . , P r o c e e d i n g s o f t h e S e v e n t h I n t e r n a t i o n a l Confe rence on t h e P h y s i c s o f Semiconduc to r s , R a d i a t i v e Recombinat ion i n Semiconduc to r s , e d . by H u l i n M . (Dunod, P a r i s , 1964) p. 67.

r --
I , .
- 68 - L
Thomas D . G . , D i n g l e R. and C u t h b e r t J . D . , 11-IV S e m i c o n d u c t i n g Compounds, 1967 I n t e r n a t i o n a l C o n f e r e n c e , e d . by Thomas D . G . ( B e n j a m i n , N e w York) p . 863.
Toyotomy S . and M o r i g a k i K . , J . Phys . S o c . J a p a n - 2 5 , 807 ( 1 9 6 8 ) .
van Doorn C . Z . , P h i l i p s R e s . R e p t s . - 21 , 1 6 3 (1966 ) . Whee le r R . G . and Dimmock J . O . , P h y s . Rev. 1 2 5 , 1805 ( 1 9 6 2 ) .
W i l l i a m s F . , Phys . S t a t . S o l i d i - 2 5 , 4 9 3 ( 1 9 6 8 ) .