Embed Size (px)
Citation preview

FRED-MD: A Monthly Database for Macroeconomic Research
Michael W. McCracken∗ Serena Ng†
December 20, 2014
Abstract
This paper presents and describes a large, monthly frequency, macroeconomic database withthe goal of establishing a convenient starting point for empirical analysis that requires ”BigData.” The dataset mimics the coverage of those already used in the literature but has threeappealing features. First, it is designed to be updated in real-time using the FRED database.Second, it will be publicly accessible, facilitating the replication of empirical work. Third, itwill relieve researchers from the task of data changes and revisions. This will be handled by thedata desk at the Federal Reserve Bank of St. Louis. We show that factors extracted from ourdataset share the same predictive content as those based on the various vintages of the so-calledStock-Watson data. In addition, we suggest that diffusion indexes constructed as the partialsum of the factor estimates can potentially be useful for the study of business cycle chronology.
JEL Classification: C30, C33, G11, G12.Keywords: diffusion index, forecasting, big data, factors.
∗Research Division; Federal Reserve Bank of St. Louis; P.O. Box 442; St. Louis, MO 63166;[email protected].†Department of Economics, Columbia University, 420 W. 118 St. Room 1117, New York, NY 10025; Serena.Ng
at Columbia.edu.We thank Kenichi Shimizu and Joseph McGillicuddy for excellent research assistance. Financial support to thesecond author is provided by the National Science Foundation, SES-0962431. The views expressed here are those ofthe individual authors and do not necessarily reflect official positions of the Federal Reserve Bank of St. Louis, theFederal Reserve System, or the Board of Governors.

1 Introduction
A new trend in research is to make use of data that two decades ago were either not available,
or that computational constraints prohibit their use. This is true not just in medical science
and engineering research, but also in many disciplines of social science. Economic research is no
exception. Instead of working with T time series observations of N variables where T is large and
N is quite small, macroeconomic policy and forecasting can now consider many more variables
without compromising information in the time series dimension. When we work with datasets
that have large N and large T , we are in what Bernanke and Boivin (2003) referred to as a data
rich environment. Of course, more data is not always desirable unless the data are informative
about the economic variables that we seek to explain. As such, assembling a good database is an
important part of economic research. However, not only is the process time consuming, it often
involves judgment on details with which academic researchers have little expertise. The task can
be overwhelming when N is large.
Over the course of the year, we have worked with the FRED data desk at the Federal Reserve
Bank of St. Louis to develop FRED-MD, a macroeconomic database of 135 monthly U.S. indicators.
The data will be updated in a timely manner and can be downloaded for free from the website
http://research.stlouisfed.org/econ/mccracken/. We hope that easy access to the data will
stimulate more research that exploits the data rich environment. Working with a more or less
standard database should also facilitate replication and comparison of results. This paper provides
background information about FRED-MD.
To better understand the motivation of this project, it is useful to give some history of big data
analysis in macroeconomic research. The first personalized U.S. macroeconomic database appears
to be compiled by Stock and Watson (1996) for analyzing parameter instability over the sample
1959:1-1993:12. Their data collection was guided by four considerations:
First, the sample should include the main monthly aggregates and coincident indica-
tors. Second, the data should include important leading economic indicators. Third,
the data should represent broad class of variables with differing time series properties.
Fourth, the data should have consistent historical definitions or when the definitions
are inconsistent, it should be possible to adjust the series with a simple additive or
multiplicative splice. [Stock and Watson (1996), p.12]
Using these criteria, Stock and Watson collected 76 series mostly drawn from CITIBASE.
The data included industrial production, weekly hours, personal inventories, monetary aggregates,
interest rates and interest-rate spreads, stock prices, and consumer expectations. The data were
1

then classified into 8 categories: output and sales, employment, orders, inventories, prices, interest
rates, exchange rates, government spending /taxes, and miscellaneous leading indicators. This
dataset was expanded in Stock and Watson (1998, 2002) to include 215 series, subsequently classified
into 14 categories. In this iteration, the data were taken from the DRI/McGraw Hill database.
Although over 200 series were collected, the statistical analysis was based on a balanced panel
of 149 series. The exercise consists of compressing information in the 149 series into a handful
of factors, and then use the factor estimates as predictors. This methodology has come to be
known as ‘diffusion index forecasting’. Marcellino et al. (2006) analyzed 171 series for the sample
1959:1-2002:12 to assess different implementations of diffusion forecasting.
In an influential paper, Bernanke and Boivin (2003) considered the use of big data in monetary
policy analysis.1 This marked the beginning of using big data not just for forecasting, but also in
structural macroeconomic modeling. Bernanke et al. (2005) used 120 series to estimate a factor
augmented autoregression (FAVAR). Boivin and Giannoni (2006) considered estimation of DSGE
models using 91 variables and interpreted measurement error as the difference between the data
and model concepts. Data for these exercises were taken from the DRI database.
Up till this point, more data were collected than used in analysis because some of these series
were available only from 1967:01. The next phase of this work focused primarily on balanced
panels. Stock and Watson (2005, 2006) constructed data for 132 macroeconomic time series over
the sample 1959:01-2003:12. The data, used to estimate structural FAVARs, were organized into
14 categories: real output and income, employment and hours, real retail, manufacturing and trade
sales, consumption, housing starts, sales, real inventories, orders, stock prices, exchange rates,
interest rates and spreads, money and credit quantity aggregates, price indexes, average hourly
earnings, and miscellaneous. The data were draw primarily from Global Insights Basic Economics
Database (GSI), with a few series from the Conference Board, and a few series based on the authors’
calculations. This database of 132 series is sometimes referred to as the ”Stock-Watson dataset” in
the research community. Bai and Ng (2008) used the data to compare diffusion index forecasting
with predictors selected by hard thresholding.
Ludvigson and Ng (2011) updated the Stock-Watson data to 2007:12 and more broadly classi-
fied the data into 8 groups: output and income, labor market, housing, consumption, orders and
inventories, money and credit, interest rate, and exchange rates, prices and stock market. Factors
estimated using the entire dataset were compared with an alternative estimator that takes advan-
tage of the structure of the eight blocks. The data were again updated in Jurado et al. (2013) to
1They used three datasets to assess the robustness of their results. The first combined real time data based onStark and Croushore (2001). The second was a version of the first but with revised data. The third used the 215variables used in Stock and Watson (1998).
2

2011:12 and merged with 147 monthly financial time series to construct an index of macroeconomic
uncertainty. The database has since been updated to 2013:05. Hereafter, we distinguish the vin-
tages of GSI data by the end of sample. The 2003 vintage is the original data used in Stock and
Watson (2005) and the 2011 vintage is the data used in Jurado et al. (2013).
Many researchers have collected larger or smaller datasets but the coverage of the data is quite
similar to the original Stock-Watson data. This is not surprising because most of the data come from
the statistical agencies. Whether the database has more or fewer data series depends on desired level
of disaggregation. For example, Stock and Watson (2014a) collected 270 disaggregated monthly
series for the sample 1959:01-2010:08 to estimate turning points. For macroeconomic forecasting,
most analyses use between 100 and 150 series.
2 FRED-MD
If the same variables were reported year after year, the data updating exercise is straightforward.
Assuming one has access to GSI, one would download the data and run a few programs. A dataset
satisfying the first three criteria outlined in Stock and Watson (1996) should then be available.
But the process is more involved in practice. The main difficulty is almost entirely due to changing
definitions and data availability. Even with careful selection of variables that meet the fourth
criterion of Stock and Watson (1996), researchers often have to deal with data revisions that took
place for one reason or another. As an example, an oil price variable is widely used in empirical work.
Yet, the OILPRICE series in FRED which existed since 1946:1 has recently been discontinued. In
its place is a WTI series that only starts from 1986:1. If one was to analyze 50 years of monthly
data, one cannot avoid having to melt or splice data from different sources, which is what makes
the data updating process difficult.
To get a sense of the problems involved, consider the process of updating the data from the
vintage which ended in 2011:12 to 2013:12. Based on the mnemonics of the 2011 data, used in
Jurado et al. (2013), we started by retrieving from GSI the same data but for the extended sample.
It was found that some series have changed names, so the first task was to locate the variables
under their new names. Then quarterly implicit price deflators from the NIPA tables and monthly
nominal consumption from the BLS were used to construct real monthly consumption. Next,
we gathered data for business loans from FRED, the nominal effective exchange rates from the
IMF, the Michigan index of consumer sentiment index from the Institute of Survey Research, and
merged the GSI help wanted index with the calculations Barnichon (2010). This completed the
data collection exercise. The next step was to compare the new and old data over the overlapping
sample to check for irregularities. It was found that the housing series in the 2014 dataset starts at
3

a later date, orders and inventories have a new chain base, the exchange rate variables have been
revised because of changes in trade weights, and several other series have gone through minor data
revisions. To deal with such problems, replacing non-existing data by close substitutes or splicing
seems routine. It is difficult if not impossible to automate the process as judgment is involved.
Two researchers starting with the same raw data can end up using different data for analysis.
One advantage of taking the data from GSI is that it is ‘one-stop shopping ’ as over 100 series
can be retrieved from one source, albeit with missing values for some variables. But the data are
available only on a subscription basis; researchers without access will have to look to alternatives
which inevitably involve multiple sources. There is also a catch to using the GSI data. The licensing
agreement understandably prohibits redistribution of the data. Yet it is increasingly common to
be required by journals to post the data used in empirical work. Authors are often at a loss what
can and cannot be posted.
FRED-MD seeks to make available a database with three objectives in mind. First, it will be
publicly available so that US and international researchers alike have access to the same data that
satisfy the four criteria established in Stock and Watson (1996). Second, it will be updated on a
timely basis. Third, it will relieve the researchers from the burden of handling data changes and
revisions. With these objectives in mind, we collect 135 monthly series with coverage that is similar
to the original Stock-Waton data. A full list of the data is given in Appendix I, along with the
comparable series in the GSI database. The suggested data transformation for each series is given
in the column under tcode. As of the writing of this paper, the latest vintage is 2014:10. While
we provide a csv file with data for this sample, but FRED-MD is not a balanced panel for a number
of reasons:
(1) The S&P PE ratio (series 84) is taken from Shiller’s website and is released with roughly a
6-month lag. Hence observations are missing at the end of the sample,
(2) The Michigan Survey of Consumer Sentiment (series 131) is available only quarterly prior to
1977:11 and recent data is available in FRED only with a 1-year lag,
(3) The trade-weighted exchange rate (series 102) is available in FRED only through 1973:1 and
we have not found other documented sources with which to splice the series,
(4) Seasonally adjusted housing permits (series 55-59) only exist through 1960:01,
(5) Currently, FRED primarily holds NAICS data (though some older SIC data exists and is
used whenever possible) from the Census Manufacturers Survey and hence a few Value of
Manufacturers’ Orders components like Nondefense Capital Goods (series 66) and especially
Consumer Goods (series 64) have a limited history.
4

Of course, the dataset can easily be turned into a balanced panel by removing these series involved.
In MATLAB, these series can be identified by checking if the mean over the full sample is a NaN.
We have not made outlier adjustments to the data. To be consistent with the previous GSI data
used in empirical work, we start the data in 1959:01. In the first vintage of FRED-MD with the
sample ending in 2014:08, the balanced panel has 122 series. A balanced panel consisting of 128
series can be constructed if the sample terminates in 2014:05.
In addition to data revisions and definitional changes, going from GSI to FRED necessitates
finding close substitutes to replace the proprietary variables constructed by GSI. A major appeal of
FRED-MD is that this task is left to the data experts. In first vintage of FRED-MD, 21 out of 135
series require some adjustments to the raw data available in FRED. We tag these variables with
an ”x” to indicate that they been adjusted and thus differ from the series at source. A summary
of the adjustments is as follows:
Number Variable Adjustments
4 Real Manu. and Trade (i) adjust M0602BUSM144NNBR for inflation using PCEPI(ii) seasonal adjust with ARIMA X12(iii) splice with NAICS series CMRMTSPL
5 Retail/Food Sales splice SIC series RETAIL with NAICS series RSAFS17 IP: Resid. Utilities FRB series IP.B51222.S20 Capacity Utilization FRB series CAPUTL.B00004.S21 Help Wanted from Barnichon (2010)22 Help Wanted to unemployed HWI/UNEMPLOY32 Initial Claims splice monthly series M08297USM548NNBR with weekly ICNSA65 New orders (durables) splice SIC series AMDMNO and NAICS series DGORDER66 New orders (non-defense) splice SIC series ANDENO and NAICS series ANDENO67 Unfilled orders (durables) splice SIC series AMDMUO and NAICS series AMDMUO68 Business Inventories splice SIC series and NAICS series BUSINV69 Inventory to sales splice SIC series and NAICS series ISRATIO80 Consumer credit to P.I. NONREVSL to PI81 3month Comm. Paper splice M13002US35620M156NNBR, CP3M with CPF3M90 3month CP -FF splice CP3M-FedFunds90 Switzerland/US FX filled back to 1959 from Banking/Monetary statistics91 Japan/US FX filled back to 1959 from Banking/Monetary statistics92 UK/US FX filled back to 1959 from Banking/Monetary statistics93 Cdn/US FX filled back to 1959 from Banking/Monetary statistics107 Crude Oil splice OILPRICE with MCOILWTICO127 Consumer sentiment splice UMSCENT1 with UMSCENT
Some comments on these adjustments are in order. To replace the GSI data for manufacturing and
trade series, we have to deal with the fact that data for orders, sales, and inventories are available
from FRED starting in 1992 when the standard industrial classification (SIC) was changed to the
5
North American Industry Classification System (NAICS). These series in FRED-MD have been
spliced with the SIC historical data when available from the CENSUS. Consumer credit outstanding
in GSI is replaced by non-revolving consumer credit. The exchange rate data in FRED start from
1971, the three month commercial paper rate series has been discontinued since 1997:08 though a
3 month financial commercial paper rate series existed since 1997:01. The FRED-MD data splice
the data with historical data from the Banking and Monetary Statistics series produced by the
Federal Reserve Board of Governors and obtained from FRASER. The West Texas oil price which
was discontinued in 2013:07 is spliced with a West Texas-Oklahoma series available since 1986:01.
We note that some these adjusted series are of independent interest even if the entire database is
not.
Going forward, the FRED-MD data will come in one (csv) file available for download from
http://research.stlouisfed.org/econ/mccracken/. The series listed in the Appendix is the
core of FRED-MD but it is likely that some series will eventually be retired and new ones will
be gradually added. The help-wanted column of newspapers is no longer as good a measure of
labor market slackness as it once was, as job-search websites like monster.com have become more
popular. At the moment, there is not enough data to build a HWI series based on internet data
alone, but it should eventually be possible to splice the old help wanted index with one that better
reflects the modern economy. This work will be handled by the experts at the data desk at FRED.
3 Factor Estimates
A primary use of big macro datasets is diffusion index forecasting and FAVAR which augments an
otherwise standard vector autoregression with factors estimated from the big panel of data. This
methodology has been found to produce superior forecasts over competing methods, especially those
that are based on a small set of predictors. The factors serve the purpose of dimension reduction. In
a large N and large T setting, the space spanned by the latent factors can be consistently estimated
by static or dynamic principal components.2
We begin by examining the properties of the factors estimated from the vintage of FRED-MD
that spans 1959:1 to -2014:08. After transforming the data, our estimation is based on the sample
1960:3-2014:08 for a total of T =655 observations. As mentioned earlier, a few series have missing
observations in the beginning or the end of the sample. We estimate the static factors by PCA
adapted to allow for missing values. It is essentially the EM algorithm given in Stock and Watson
(2002). In brief, observations that are missing are initialized to the unconditional mean based on
the non-missing values (which is zero since the data are demeaned and standardized) so that the
2See Forni et al. (2000, 2005), Boivin and Ng (2005), Bai and Ng (2008), Stock and Watson (2006).
6

panel is re-balanced. A r × 1 vector f factors ft and a N × r matrix of loadings λ are estimated
from this panel using the normalization that λ′λ/N = Ir. The missing value for series i at time
t is updated from zero to λ̂′if̂t. This is multiplied by the standard deviation of the series and the
mean is re-added back. Treating resulting value as an observation for series i and time t, the mean
and variance of the complete sample are re-calculated. The data are demeaned and standardized
again, and the factors and loadings are re-estimated from the updated panel. The iteration stops
when the factor estimates do not change.3 After the factors are estimated, we regress the i-th series
in the dataset on a set of r (orthogonal) factors. For k = 1, . . . , r, this yields Ri(k)2 for series i.
The incremental explanatory power of factor k is mR2i (k) = R2
i k) − R2i (k − 1), k = 2, . . . , r with
mR2i (1) = R2
i (1). The average importance of factor-k is mR2(k) = 1N
∑Ni=1mR
2i (k).
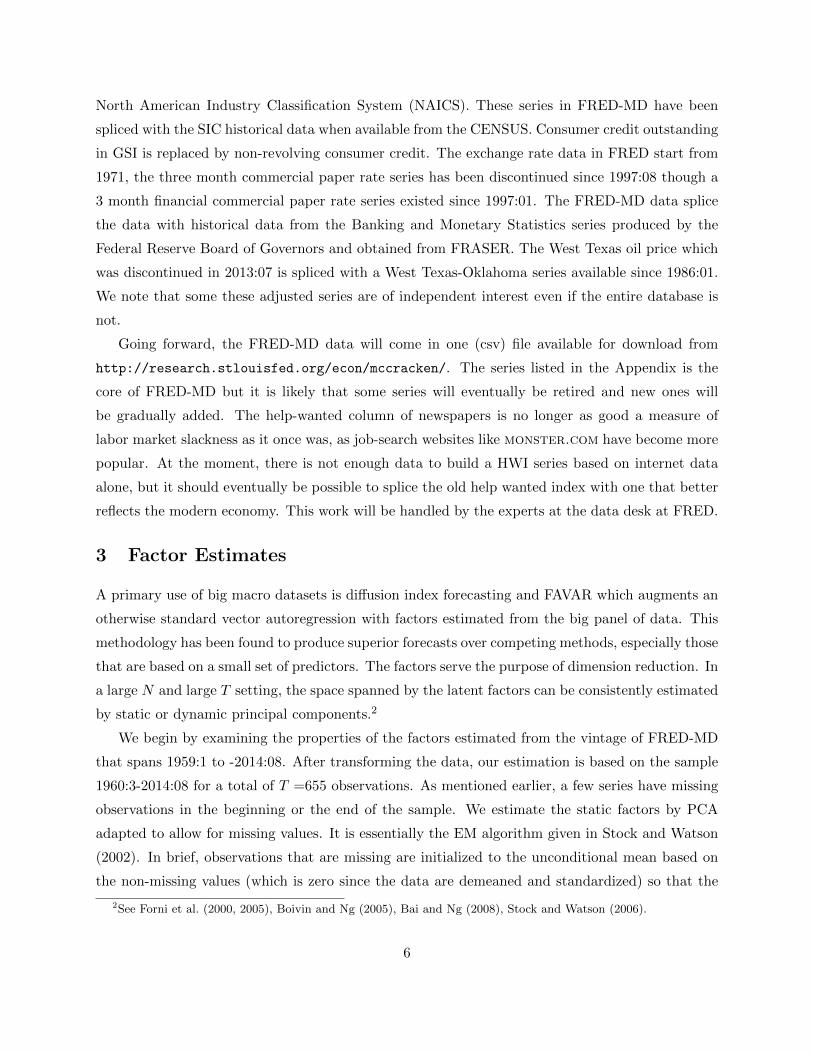
We begin with an analysis of the number of factors. The PCP2 criterion of Bai and Ng (2002)
finds 8 factors explaining .445 of the total variation in the data (and seven if outlier adjustment is
made).4 Figure 1 plots R2(8)) ordered by groups. The x axis in this figure is the id of the series as
indicated in the Appendix and the y axis is the fraction of variation in each series explained by eight
factors. These eight factors explain over .5 of the variation in 58 series and between .25 and .5 of the
variation in 34 series. The ten series that are best explained by the factors are ’ipmansics’, ’indpro’,
’t10yffm’, ’caputlb00004s’, ’gs1’, ’ipfpnss’, ’t5yffm’, ’aaaffm’, ’ipfinal’ , ’tb6ms’, ’tb6smffm’. There
are, however, 22 series that have the idiosyncratic component explaining 90% of the variation.
The ten series with the largest idiosyncratic component are ’nonborres’ ’cpimedsl’ ’cuur0000sad’
’cpiappsl’ ’ddurrg3m086sbea’ ’invest’ ’ces1021000001’ ’ipfuels’ ’claimsx’ ’cusr0000sas’. A case can
be made to drop these series from the panel; as discussed in Boivin and Ng (2006), noisy data can
worsen the quality of the factor estimates.
Table 1 lists R2(j) and the ten series with the highest mR2(j) for factor j. Factor 1 explains
.139 of the variation in the data and can be interpreted as a real activity/employment factor since
the mR(1) associated with industrial production and employment series are as high as .776. Factor
2 is dominated by forward looking variables like term interest rate spreads and inventories. Factor
3 has an mR2(3) of 0.065 and its explanatory power is concentrated on price variables, hence can be
interpreted as an inflation factor. The explanatory power of Factor 4 concentrates on the interest
rates. Factor 5 is a mix of labor market and term spread variables. Factor 6 and 7 both have
explanatory power for stock market variables while factors 7 and 8 both have explanatory power
for monetary aggregates.
How does FRED-MD differ from the vintages of GSI data that have been used previously?
3In this EM algorithm, the number of factors is determined by the space spanned by the data without missingvalues. The iteration does not change the number of factors.
4This is primarily due to the monetary base series which took on extreme values during the financial crisis.
7

We repeat the exercise in Table 1 for four vintages. Estimation always starts in 1960:3 but ends
differently depending on the vintage. The first is the 2003 vintage used in Stock and Watson (2005).
The sample ends in 2003:12. The 2007, 2011, and 2013 vintages updated by Ludvigson and Ng
end in 2007:12, 2011:12, and 2013:05, respectively. Table 2 reports the properties of the factor
estimates. The PCP2 criterion of Bai and Ng (2002) finds r = 8 factors in the 2003 and 2007
vintages, and r = 7 factors in the 2013 vintage.
Table 2 shows that explanatory power provided by the first four factors have been remarkably
stable across databases. The first factor explains 0.156 of the total variations of the 2003 GSI
data, 0.147 of the 2007 GSI data, 0.152 of the 2011 GSI data, and 0.157 of the 2013 GSI data
respectively. The first factor captures a significant fraction of the variations in industrial production
and employment,5 explaining over .7 of variation in manufacturing output and employment in each
vintage. The second factor explains between 0.071 and 0.076 of the total variation in the data and
has good explanatory power for interest rate spreads.6 The third factor explains between 0.054 and
0.065 of the variation in the data and is particularly successful in explaining variations in prices.7
Factor four explains about 0.05 of total variation in the data and explains well the variations in
interest rates.
Turning to factors five to eight, their mR2are noticeably lower than those for factors one to four,
and the relative importance of the factors are also less stable. Factor five has good explanatory
power for term spreads in all four older databases. In the 2003 and 2007 vintages, the monetary
aggregates have mR2i (6) of around .5; in the 2011 and 2014 vintages, the monetary aggregates
are better explained by factor 8 with mR2i (8) below .2. While the stock market variables are well
explained by factor 8 in the 2003 and 2007 vintages, they are better explained by factors 6 and 7
in the 2011 and 2013 vintages. The mR2i (6) and mR2
i (7) for SP500 is 0.4 in the 2011 vintage. This
is unprecedentedly high, but perhaps not surprising in view of the volatility in the stock market
around 2008.
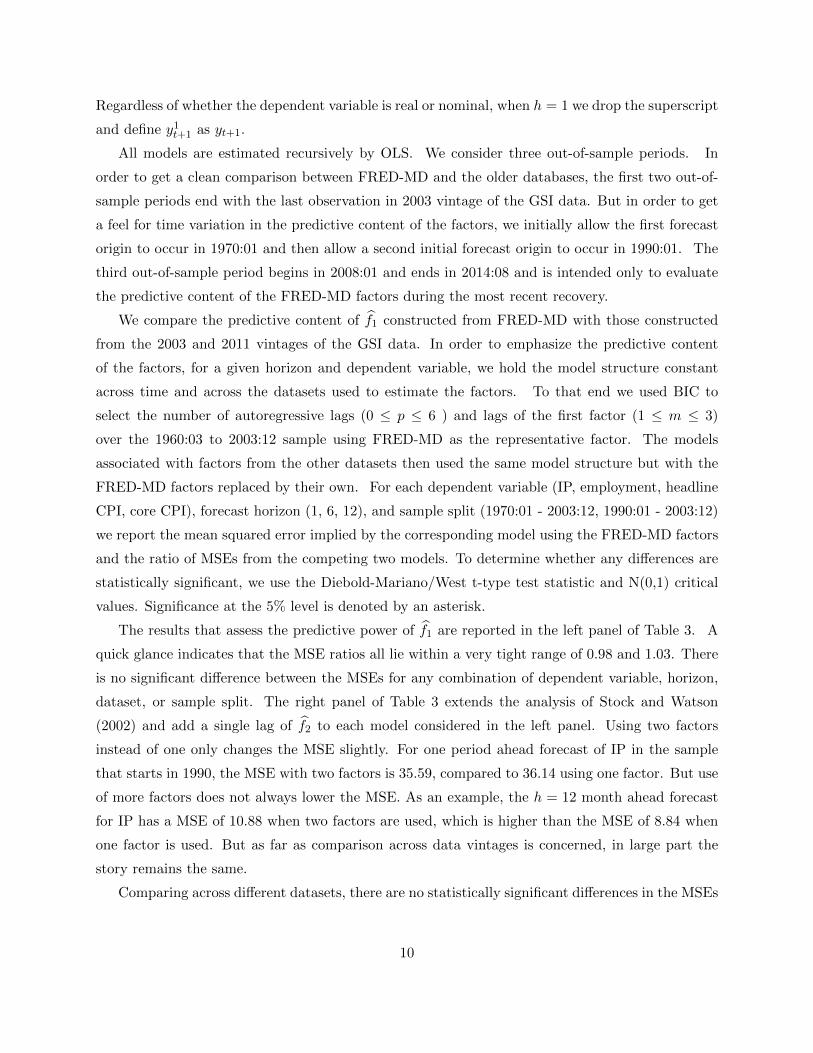
We also recursively estimate the factors using the different data vintages. For t starting in
1970:1, we record the number of factors rt selected by the PCP2 criterion and the corresponding
R2(rt). This is plotted in Figure 2. The NBER recession dates are shaded in grey. The top panel
shows that the number of factors has crept up from a minimum of 2 in early 1970, to 4 in early
1980, 6 in early 1990, to 7 in early 2000, and stands at 8 in 2014:08. The bottom panel shows that
the size of the common component has also increased from .2 in 1970 ot .35 in 1980, .4 in 1990, .43
5ips43 is IP: mfg, ces003 is Emp: gds prod., and a0m082 is capacity utilization.6sfybaac is the spread between the federal funds rate and Baa bonds.7puc is cpi commodities, gmden is implicit price deflator of non- durables. punew is cpi all items, and puxm is cpi
excluding medical care.
8

in 2000. Interestingly, these increases in the number of factors and R2 line up well with the NBER
recession dates. Figure 2 shows that the number of factors and R2(rt) also jumped when the GSI
data were used.
Based on the properties of the factor estimates, we are encouraged that FRED-MD preserves the
primary variations in the GSI data used in previous work. While the variable names have changed
over the years, it is a solid fact that the first factor has strong association to real activity, and the
second, third and fourth factors have strong association with nominal variables not directly related
to the stock market. These four factors explain over .3 of the variation of data. The remaining
three or four factors explain another .12 to .15. The stock market related factors seemed to have
gained importance over time, though it is necessary to monitor a few more vintages of FRED-MD
to be sure if this finding is robust.
3.1 Predictability
In this subsection we revisit the usefulness of factors for predicting macroeconomic aggregates – with
an eye towards evaluating the usefulness of those factors extracted using FRED-MD. Specifically,
we revisit a subset of the forecasting exercises conducted in Stock and Watson (2002). In particular
we consider forecasts of U.S. industrial production, nonfarm employment, headline CPI inflation,
and core CPI inflation at the 1-, 6-, and 12-month horizons. For each permutation of dependent
variable and horizon we have three goals: (1) document that the FRED-MD factors have predictive
content above-and-beyond that contained in a baseline autoregressive model, (2) document that
the FRED-MD factors compare favorably, in terms of predictive content, to factors extracted using
the databases that have been previously used, and (3) document the predictive content of the
FRED-MD factors during the most recent US recovery.
In each case the models used for forecasting take the form
yht+h = αh + βh(L)f̂t + γh(L)yt + εht+h,
for finite order lag polynomials βh(L) and γh(L). When predicting the real variables we define the
dependent variable as average annualized monthly growth. As an example, for IP we obtain
yht+h = (1200/h) ln(IPt+h/IPt).
When predicting the nominal variables we define the dependent variable similarly but treat inflation
as I(1). As an example, for CPI we obtain
yht+h = (1200/h) ln(CPIt+h/CPIt) − 1200 ln(CPIt/CPIt−1).
9
Regardless of whether the dependent variable is real or nominal, when h = 1 we drop the superscript
and define y1t+1 as yt+1.
All models are estimated recursively by OLS. We consider three out-of-sample periods. In
order to get a clean comparison between FRED-MD and the older databases, the first two out-of-
sample periods end with the last observation in 2003 vintage of the GSI data. But in order to get
a feel for time variation in the predictive content of the factors, we initially allow the first forecast
origin to occur in 1970:01 and then allow a second initial forecast origin to occur in 1990:01. The
third out-of-sample period begins in 2008:01 and ends in 2014:08 and is intended only to evaluate
the predictive content of the FRED-MD factors during the most recent recovery.
We compare the predictive content of f̂1 constructed from FRED-MD with those constructed
from the 2003 and 2011 vintages of the GSI data. In order to emphasize the predictive content
of the factors, for a given horizon and dependent variable, we hold the model structure constant
across time and across the datasets used to estimate the factors. To that end we used BIC to
select the number of autoregressive lags (0 ≤ p ≤ 6 ) and lags of the first factor (1 ≤ m ≤ 3)
over the 1960:03 to 2003:12 sample using FRED-MD as the representative factor. The models
associated with factors from the other datasets then used the same model structure but with the
FRED-MD factors replaced by their own. For each dependent variable (IP, employment, headline
CPI, core CPI), forecast horizon (1, 6, 12), and sample split (1970:01 - 2003:12, 1990:01 - 2003:12)
we report the mean squared error implied by the corresponding model using the FRED-MD factors
and the ratio of MSEs from the competing two models. To determine whether any differences are
statistically significant, we use the Diebold-Mariano/West t-type test statistic and N(0,1) critical
values. Significance at the 5% level is denoted by an asterisk.
The results that assess the predictive power of f̂1 are reported in the left panel of Table 3. A
quick glance indicates that the MSE ratios all lie within a very tight range of 0.98 and 1.03. There
is no significant difference between the MSEs for any combination of dependent variable, horizon,
dataset, or sample split. The right panel of Table 3 extends the analysis of Stock and Watson
(2002) and add a single lag of f̂2 to each model considered in the left panel. Using two factors
instead of one only changes the MSE slightly. For one period ahead forecast of IP in the sample
that starts in 1990, the MSE with two factors is 35.59, compared to 36.14 using one factor. But use
of more factors does not always lower the MSE. As an example, the h = 12 month ahead forecast
for IP has a MSE of 10.88 when two factors are used, which is higher than the MSE of 8.84 when
one factor is used. But as far as comparison across data vintages is concerned, in large part the
story remains the same.
Comparing across different datasets, there are no statistically significant differences in the MSEs
10

for IP, CPI, and Core CPI across models. For Employment, there are no significant differences when
evaluated across the entire post-1970 sample but a few differences appear in the post-1990 sample
at the longer horizons. In sum, of the 96 possible pairwise comparison considered in Table 3, only
5 show any signs of significance and do so only when we ignore any issues associated with multiple
testing.
To get a feel for the nominal predictive content of the FRED-MD factors themselves, in Table
4 we report (i) the relative improvement in MSE of those models that include the first factor to
those that are purely autoregressive, and (ii) the relative improvement of those models that include
the first and second factors with those that only include the first factor. For this exercise the
FRED-MD factors are estimated using data that ends in 2014:08. For ease of comparison with the
previous tables, the models that include factors maintain the exact same autoregressive structure.
As above, for each dependent variable (IP, employment, headline CPI, core CPI), forecast horizon
(1,6, 12), and sample split (1970:01 - 2014:08, 1990:01 - 2014:08, 2008:01 - 2014:08) we report the
mean squared error implied by the model using the FRED-MD factors and the ratio of MSEs from
the two models. To determine any significant differences, we use the MSE-F statistic described in
Clark and McCracken (2005) and obtain critical values using a fixed regressor wild bootstrap as
described in Clark and McCracken (2012).
The results are reported in Table 4. Significant differences are marked with asteriks. Consider
the first four columns in which we compare a simple autoregressive model to one augmented by lags
of the first factor. When evaluated over the entire post-1970 sample, the model that includes the
first factor provides statistically significant MSE-based improvements across all horizons and for
all dependent variables with the exception of CPI-6. For IP and Employment, this improvement
largely continues when we restrict ourselves to the post-1990 and post-2008 samples as well. In
contrast, the first factor does not seem to provide any useful predictive content for either CPI or
Core CPI during the post-1990 or post-2008 samples. This is consistent with the finding in Bai
and Ng (2008) that targeting individual predictors that underlie the factors may be more effective
for forecasting inflation than using f̂t.
In the second set of four columns, the baseline is the model that includes lags of the first factor
and the competing model is the same but augmented with one lag of the second factor. As in the
first four columns, there is considerable evidence of additional predictive content when evaluated
over the entire post-1970 sample. This is particularly true for IP and Employment. But when we
move to the later forecast periods, the second factor seems to lose much of it’s predictive content
with only a few idiosyncratic instances in which there are statistically significant improvements -
the largest of which is only 3%.
11
A primary use of large macroeconomic datasets is forecast. Hence it is important that the
variables in FRED-MD have good predictive when used in diffusion index forecasting exercises.
The results in this subsection suggest that there is no statistically significant difference in the
predictive ability of the factors estimated from FRED-MD and the GSI data.
3.2 FDI: Factor Based Diffusion Indexes
This subsection suggests a new use of the estimated factors in the study of business chronology.
Our starting point is to re-organize the factors estimates into two groups: one for real activity, and
one for nominal activity unrelated to the stock market.8 The task is see if information about the
state of the economy can be obtained by visualizing the factors as a group. We propose to consider
factor-based diffusion indexes.
The use of diffusion indexes in the study of business cycle chronology has a long history. Burns
and Mitchell (1946) pioneered the study of business cycle turning points using a variety of methods
one of which is to analyze the direction of change in the components of aggregate data. A series
that increases, decreases, and stays unchanged over a given span are assigned values of 100, 0,
and 50 respectively. A diffusion index is an index that aggregates over components in a group
(such as industrial production) and provides a summary of the direction of change for the group.9
Subsequent work by Broida (1955), among others, find that the diffusion indexes have a high rate
of falsely signaling turning points. This work was more or less discarded with occasional studies
such as by Kenndey (1994) who found that the diffusion indexes for industrial production and
employment have predictive power in a twenty-five year sample beginning in 1967.
There is a renewed interest in using diffusion indexes to analyze busiess cycle turning points.
Stock and Watson (2010, 2014b) consider two approaches. The first is a ’date and average’ method
that first identifies turning points in the individual series and looks for a common turning point.
The second is an ’average and date’ method that looks for turning points in the three aggregate
indicators, namely, i) the Conference Board index, (ii) a weighted average of industrial production,
employment, manufacturing trade, and personal income using the standard-deviation of the series
as weights, and (iii) a (dynamic) factor estimated from the same four series. They find the Burns-
Mitchell idea of ’date and average’ to be more promising in detecting business cycle turning points.
Our approach is in the spirit of average and date, but differs from the Stock and Watson (2014b)
methodology in two ways. The first is that we estimate static instead of dynamic factors. This
difference is not substantive because that static and dynamic factors usually have similar properties.
8The specific factors that enter the two groups will depend on the vintage of the data considered.9Historical data for these indexes are still available. See http://www.nber.org/databases/macrohistory/
contents/chapter16.html and http://research.stlouisfed.org/fred2/series/M1642AUSM461SNBR.
12

The specific property that is relevant here is variability of the factor estimates. Since the data are
differenced to achieve stationarity, the factor estimates f̂t are too volatile for turning point analysis.
If we apply the algorithm of Bry and Boschan (1971), f̂1t is in agreement with the NBER recessions
dates only 60% of the time, and with the expansions dates 53% of the time.
To mitigate this problem, we form diffusion indexes from the partial sum of the common factors
rather than the factors themselves, which is substantively different from the analysis in Stock and
Watson (2014b). To be precise, our real activity diffusion index is constructed as F̂1t =∑t
j=1 f̂1t.
While f̂1t isolates the common variations at higher frequencies, F̂1t zooms in on common variations
at low frequencies. It may seem counter-intuitive to learn about the state of a business cycle
from the trend component. Informally, Moore (1961, p.286) also plotted the diffusion indexes in
cumulative form and found them useful. As well, the Bry and Boschan (1971) algorithm also looks
for directional change in the smoothed series which is an estimate of the trend.
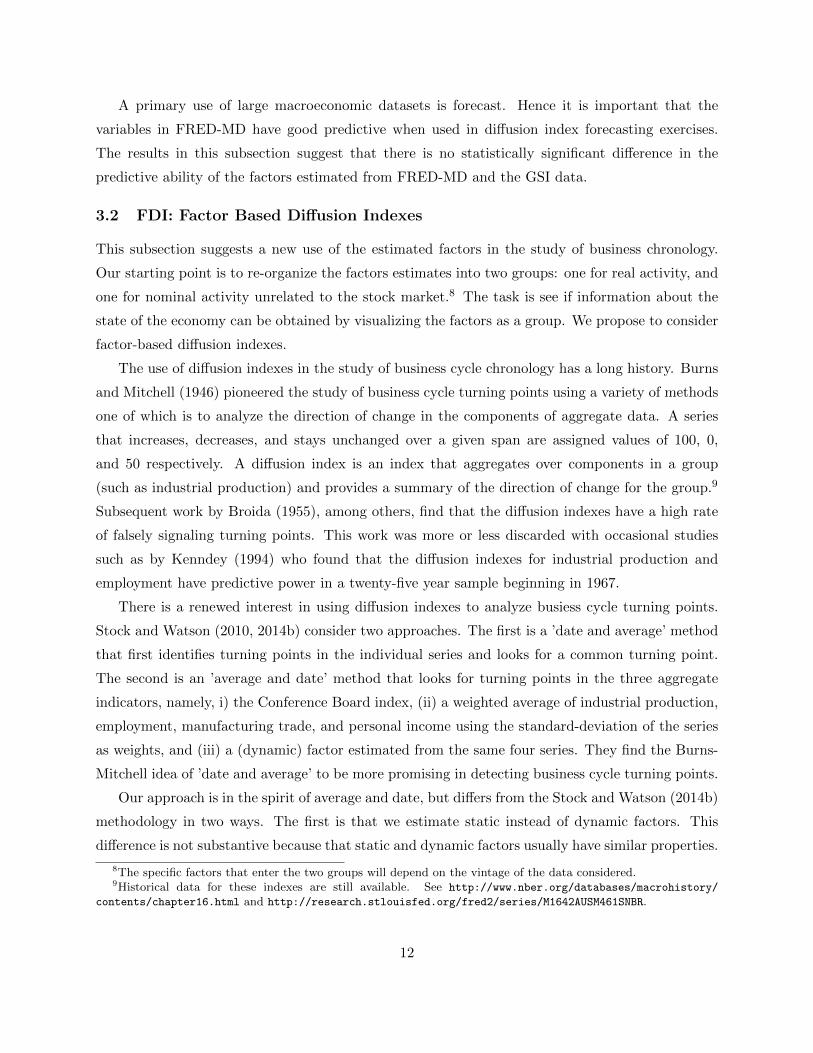
The top panel of Figure 3 plots the real activity diffusion index F̂1t constructed from FRED-MD
data. In the base case (blue line), the factors f̂t are estimated using all 135 series over the 1960:03-
2014:08. To use this opportunity to see that the factor estimates are robust to the treatment of
missing values, F̂1t is also plotted (in red) with f̂t estimated from a balanced panel of 122 series.
The NBER recession dates are shaded in gray. We see that the F̂1t series always peaks before the
beginning of NBER recession dates and reaches a trough just after the recession is over. This is
true even for the 1990 and 2001 recessions which have been difficult to forecast. The real activity
diffusion index estimated using the balanced panel is almost identical to the one estimated from
the larger but non-balanced panel. Applying the algorithm of Bry and Boschan (1971) to F̂1t, we
find that the series perfectly classifies the NBER recession dates. It is less successful in classifying
expansions, with correct classification rate of 0.65.
The bottom panel of Figure 3 shows the second diffusion index, constructed as F̂2t =∑t
j=1 f̂2t.
From Table 1, we can think of f̂2t as a nominal factor since it has good explanatory power for
term spreads. This diffusion index peaks in the early 1980s when inflation was high and has
been declining since the early 1990s. The diffusion indexes F̂3t and F̂4t exhibit the same secular
movements as F̂2t and are not displayed. But recall from Table 2 that f̂3t and f̂4t have higher mR2
for price and interest rate variables. Whether we combine the three diffusion indexes F̂2t, F̂3t and
F̂4t or look at them individually, they seem to line up with price pressure inflation expectations in
the last five decades. This is interesting even if these indexes seem unrelated to recessions.
Unfortunately, the F̂1t has the drawback that it must take the value of zero at the end of the
sample.10 This problem arises because the factors are constructed as linear combinations of series
10This is not numerically the case when missing data are allowed and the factors are estimated using the EMalgorithm. Nevertheless, the F̂1t remains very close to zero at the end of the sample with any deviation arising from
13

that have been demeaned using the full sample. Hence while F̂1t gives a good historical classification
of recessions, it is ill-suited as a monitoring device for recent changes in the business cycle.
We attempt to handle this problem in two ways. The first is to demean the data differently before
estimating the factors. We use backward recursive demeaning, For i = 1, . . . N and t = 3, . . . T , let
x̃it = (xit−xit)σi
, where xit = 1t
∑ts=1 xis and σi = 1
T
∑Ts=1(xit −
1T
∑Tt=1 xit)
2. We set xi1 and xi2
set to the unconditional mean of series i. This recursive demeaning only needs to be done once.
Now each x̃it is not necessarily mean zero over the whole sample, and neither are the means of
the estimated factors, say f̃kt, k = 1, . . . r. Hence the corresponding real activity diffusion index
F̃1t =∑t
j=1 f̃1j is no longer a Brownian bridge. Recursive demeaning requires a more delicate
treatment of missing vales, so we only use the balanced panel of 122 series to estimate the factors
over the full sample. The recursively demeaned diffusion index F̃1t is plotted in Figure 4. As
with F̂1t, the beginning of recessions are preceded by upward turn in the index, and the end of
recessions are preceded by downward turns. Based on the Bry-Boschan algorithm, F̃1t has a correct
classification rate for recessions of 0.98, missing only the recession in 1961:02 at the very beginning
of the sample. The correct classification rate for expansions is 0.55.
The end point problem associated with F̂1t is also a feature of the CUSUM of regression residuals.
By construction, these residuals sums to zero when an intercept is included in the OLS regression.
It is known that residual-based CUSUM tests for structural breaks lacks power at the end of the
sample. However, recursive residuals were developed precisely to improve power against breaks at
the end of the sample. Building on this analogy, our second approach to the end point problem
is to construct the diffusion indexes from recursively estimated factors. For each k = 1, . . . r, we
recursively estimate the fk,t starting in 1970:01. In each month t, a historical sequence of factors
f̂k,s,t is constructed for each s = 1, . . . , t. From each of these sequences, we save the most recent
value of fk,t,t. The partial sum of this series is used to construct a recursive diffusion index, denoted
R̂F 1t.
There are two technical details with this exercise. The first problem arises from the fact that
the factors are only identified up to an orthogonal rotation and in particular, are not sign-identified.
Hence as we move from month to month, the ”correct” sign of the estimated first factor has the
potential to change. To avoid this issue, in each month t =1970:01, we assume that the sign of the
first factor in 1961:01 is positive (f̂1,1961:01,t > 0). If the estimate is negative, we simply flip the
sign of the entire series. Somewhat surprisingly this happens very rarely and in fact, never occurs
at any point over the entire sample when using FRED-MD.
The second problem is due to missing values or no variation in some series during the early part
approximation error.
14

of the sample. In the first recursion, which starts 1970:01, four of the series are missing a large
number of observations: ACOGNO (64), TWEXMMTH (102), oilprice (111), and UMCSENTx
(131). For the first two we simply have no data. For the latter two, the transformed data is highly
irregular after transformation. The oilprice series is essentially zero in the early sample (since the
data are differenced) with a few large jumps followed by a similar decline. The Michigan sentiment
series is only quarterly prior to 1970 and hence the transformation isn’t really operational. We
therefore drop these four series from the exercise. If we were to redo the recursive analysis starting
in 1980 or later we would likely avoid having to drop any series. At the moment, we are only able
to construct these recursive diffusion indexes for factors one and two, and these two series only
available from 1970:01 onwards.
The recursively estimated diffusion index R̂F 1t is plotted in Figure 4, side by side with F̃1t.
The series also tends to change direction at the beginning and the end of recessions. Evidently, it
no longer ends at zero; the most recent values of F̃1t and R̂F 1t show no clear direction of change,
which suggests that the economy is staying in its course. The bottom panel shows R̂F 2t. As with
F̃2t, the series peaked around 1981 when inflationary pressure was high. Obviously, more work is
needed to study the statistical properties of both formulations of the diffusion indexes. But the
results so far is encouraging. Since FRED-MD will be updated on a timely basis, these factor based
diffusion indexes can be useful tools in the documenting the state of the economy.
4 Conclusion
This paper introduces researchers to a set of 135 monthly macroeconomic variables based on the
database at FRED. The dataset starts in 1959:01 and will be updated on a timely basis hereafter.
In addition to open public access, the main appeal of the data is that revisions and data changes
are taken care of by the data specialists at FRED. We sincerely thank them for their support in
this work. We plan to put together a quarterly database in due course.
15

References
Bai, J. and Ng, S. 2002, Determining the Number of Factors in Approximate Factor Models,Econometrica 70:1, 191–221.
Bai, J. and Ng, S. 2008, Forecasting Economic Time Series Using Targeted Predictors, Journal ofEconometrics 146, 304–317.
Barnichon, R. 2010, Building a Composite Help-Wanted Index, Economics Letters 109(1), 175–178.
Bernanke, B. and Boivin, J. 2003, Monetary Policy in a Data Rich Environment, Journal of Mon-etary Economics 50:3, 525–546.
Bernanke, B., Boivin, J. and Eliasz, P. 2005, Factor Augmented Vector Autoregressions (FVARs)and the Analysis of Monetary Policy, Quarterly Journal of Economics 120:1, 387–422.
Boivin, J. and Giannoni, M. 2006, DSGE Models in a Data Rich Environment, NBER WorkingPaper 12272.
Boivin, J. and Ng, S. 2005, Undertanding and Comparing Factor Based Forecasts, InternationalJournal of Central Banking 1:3, 117–152.
Boivin, J. and Ng, S. 2006, Are More Data Always Better for Factor Analysis, Journal of Econo-metrics 132, 169–194.
Broida, A. 1955, Diffusion Indexes, American Statistician 9(3), 7–16.
Bry, G. and Boschan, C. 1971, Cyclical Analysis of Time Series: Procedures and Computer Pro-grams, National Bureau of Economic Research, New York.
Burns, A. F. and Mitchell, W. C. 1946, Measuring Business Cycle, National Bureau of EconomicResearch, New York.
Clark, T. and McCracken, M. 2005, Evaluating Direct Multistep Forecasts, Econometric Reviews24, 369–404.
Clark, T. and McCracken, M. 2012, In-Sample Tetsts of Predictive Ability: A New Approach,Journal of Econometrics 170(1), 1–14.
Forni, M., Hallin, M., Lippi, M. and Reichlin, L. 2000, The Generalized Dynamic Factor Model:Identification and Estimation, Review of Economics and Statistics 82:4, 540–554.
Forni, M., Hallin, M., Lippi, M. and Reichlin, L. 2005, The Generalized Dynamic Factor Model, OneSided Estimation and Forecasting, Journal of the American Statistical Association 100, 830–840.
Jurado, K., Ludvigson, S. and Ng, S. 2013, Measuring Macroeconomic Uncertainty, AmericanEconomic Review. mimeo, Columbia University.
Kenndey, J. E. 1994, The Information of Diffusion Indexes for Forecasting Related Economic Ag-gregates, Economics Letters 44, 113–117.
Ludvigson, S. and Ng, S. 2009, Bond Risk Premia and Macro Factors, Review of Fiancial Studies22(12), 5027–5067.
Ludvigson, S. and Ng, S. 2011, A Factor Analysis of Bond Risk Premia, in D. Gilles and A. Ullah(eds), Handbook of Empirical Economics and Finance, Chapman and Hall, pp. 313–372.
16

Marcellino, M., Stock, J. and Watson, M. 2006, A Comparison of Direct and Iterated AR Methodsfor Forecasting Macroeconomic Time Series h-steps Ahead, Journal of Econometrics 135, 499–526.
Moore, G. H. 1961, Diffusion Indexes, Rates of Change, and Forecasting, in G. H. Moore (ed.),Business Cycle Indicators, Vol. 1, pp. 282–293.
Stark, T. and Croushore, D. 2001, Forecasting with a Real Time Data Set for Macroeconomists,Journal of Macroeconomics 24(4), 507–531.
Stock, J. and Watson, M. 2014a, Estimating Turning Points Using Large Data Sets, Journal ofEconometrics 178, 368–381.
Stock, J. and Watson, M. 2014b, Estimating Turning Points Using Large Data Sets, Journal ofEconometrics 178, 368–381.
Stock, J. and Watson, M. W. 2010, Modeling Inflation After the Crisis, NBER Working Paper16488.
Stock, J. H. and Watson, M. W. 1996, Evidence on Structural Instability in Macroeconomic TimeSeries Relations, Journal of Business and Economic Statistics 14, 11–30.
Stock, J. H. and Watson, M. W. 1998, Diffusion Indexes, NBER Working Paper 6702.
Stock, J. H. and Watson, M. W. 2002, Macroeconomic Forecasting Using Diffusion Indexes, Journalof Business and Economic Statistics 20:2, 147–162.
Stock, J. H. and Watson, M. W. 2005, Implications of Dynamic Factor Models for VAR analysis,NBER WP 11467.
Stock, J. H. and Watson, M. W. 2006, Forecasting with Many Predictors, Handbook of Forecasting,North Holland.
17

Table 1: Factors Estimated from FRED-MD: Total Variation Explained, 0.446
mR2(1) 0.139 mR2(2) 0.069 mR2(3) 0.065 mR2(4) 0.050
IPMANSICS 0.776 BAAFFM 0.568 CUSR0000SAC 0.731 GS1 0.523INDPRO 0.747 AAAFFM 0.568 DNDGRG3M086SBEA 0.717 GS5 0.506USGOOD 0.730 T10YFFM 0.560 CPIAUCSL 0.689 TB6MS 0.485MANEMP 0.702 T5YFFM 0.534 CUSR0000SA0L5 0.651 GS10 0.457CAPUTLB00004S 0.698 TB3SMFFM 0.373 CUUR0000SA0L2 0.627 TB3MS 0.422PAYEMS 0.684 TB6SMFFM 0.372 PCEPI 0.596 AAA 0.415IPFPNSS 0.665 T1YFFM 0.344 CPITRNSL 0.594 CP3M 0.370DMANEMP 0.649 BUSINVx 0.309 CPIULFSL 0.565 BAA 0.307IPDMAT 0.600 NAPMPRI 0.260 PPIFCG 0.492 MZMSL 0.170IPMAT 0.573 BAA 0.242 PPIFGS 0.472 FEDFUNDS 0.168
mR2(5) 0036 mR2(6) 0.030 mR2(7) 0.027 mR2(8) 0.026
CES0600000007 0.199 SP: indust 0.346 SP: indust 0.168 M2SL 0.275TB6SMFFM 0.184 SP 500 0.344 SP 500 0.166 M3SL 0.275AWHMAN 0.176 SP div yield 0.268 SP div yield 0.149 PERMIT 0.177T1YFFM 0.157 SP PE ratio 0.203 SP PE ratio 0.144 MZMSL 0.135TB3SMFFM 0.154 IPCONGD 0.169 M1SL 0.134 M1SL 0.134NAPMPI 0.139 IPFINAL 0.146 NAPM 0.131 PERMITMW 0.129ISRATIOx 0.139 IPDCONGD 0.118 M2SL 0.128 TOTRESNS 0.110T5YFFM 0.138 UMCSENTx 0.112 M3SL 0.128 PERMITS 0.109T10YFFM 0.138 M3SL 0.110 NAPMEI 0.127 USCONS 0.095RETAILx 0.132 M2SL 0.110 CONSPI 0.115 HOUSTMW 0.094
This table lists the ten series that loads most heavily of the first eight factors along with R2 ina regression of the series on the factor. For example, factor 1 explains 0.747 of the variation inindpro. The first factor has a marginal R2 of .139. This is the fraction of the variation in 135series explained by the first factor.
18

Table 2: Estimates From Earlier Vintages of GSI Data: Factors 1-4
2003 2007 2011 2013
mR2(1) 0.156 0.147 0.152 0.157ips43 0.769 ips43 0.787 IP: mfg 0.786 IP: mfg 0.766ips10 0.762 ips10 0.765 IP: total 0.758 Emp: gds prod 0.751ces003 0.741 utl11 0.735 Emp: gds 0.742 IP: total 0.736a0m082 0.721 ces003 0.718 Emp: total 0.715 Emp: total 0.726ces015 0.713 ces015 0.679 Emp: mfg 0.707 Emp: mfg 0.719mR2(2) 0.076 0.072 0.072 0.071sfybaac 0.591 sfybaac 0.596 Baa-FF 0.580 Baa-FF 0.523sfyaaac 0.568 sfyaaac 0.569 Aaa-FF 0.571 Aaa-FF 0.515sfygt10 0.537 sfygt10 0.538 10 yr-FF 0.559 10 yr-FF 0.508sfygt5 0.514 sfygt5 0.516 5 yr-FF 0.537 5 yr-FF 0.489pmcp 0.337 sfygt1 0.324 6 mo-FF 0.352 6 mo-FF 0.312mR2(3) 0.054 0.059 0.065 0.065puc 0.759 puc 0.794 cpi-U: comm. 0.774 cpi-U: comm. 0.791gmdcn 0.729 gmdcn 0.787 pce nondble 0.765 pce: nondble 0.768puxhs 0.690 puxhs 0.749 cpi-U: ex shelter 0.740 cpi-U: ex shelter 0.755punew 0.677 punew 0.731 cpi-U: all 0.725 cpi-U: all 0.741puxm 0.637 puxm 0.692 cpi-U: ex med 0.689 cpi-U: ex med 0.706mR2(4) 0.049 0.048 0.050 0.049fygt1 0.450 fygt5 0.456 1 yr T-bond 0.555 1 yr T-bond 0.504fygt5 0.450 fygt1 0.449 5 yr T-bond 0.543 5 yr T-bond 0.490fygm6 0.410 fygt10 0.425 6 mo T-bill 0.509 6 mo T-bill 0.460fygt10 0.409 fygm6 0.403 10 yr T-bond 0.502 10 yr T-bond 0.448fyaaac 0.373 fyaaac 0.377 Aaa bond 0.466 Aaa bond 0.405
mR2(5) 0.041 0.039 0.037 0.040sfygm6 0.317 sfygm6 0.255 6 mo-FF 0.271 6 mo-FF 0.254sfygt1 0.304 sfygt1 0.239 1 yr-FF 0.246 3 mo-FF 0.218sfygm3 0.282 sfygm3 0.220 3 mo-FF 0.228 1 yr-FF 0.214sfygt5 0.261 sfygt5 0.203 5 yr-FF 0.213 Avg hrs 0.207sfygt10 0.244 ces151 0.202 10 yr-FF 0.201 5 yr-FF 0.206
mR2(6) 0.033 0.030 0.031 0.030fmrra 0.550 fmrra 0.411 sp: indust 0.437 sp: indust 0.232fmrnba 0.461 fmfba 0.371 sp 500 0.429 sp 500 0.226gmdcs 0.405 fm1 0.335 sp div yield 0.339 ip: cons gds 0.213fm1 0.360 fmrnba 0.289 sp PE 0.281 ip: final prod 0.184fmfba 0.349 fm2 0.206 ip: cons gds 0.140 sp div yield 0.172mR2(7) 0.030 0.028 0.028 0.028hsfr 0.249 fspin 0.241 bp: total 0.234 sp 500 0.326hsmw 0.172 fspcom 0.228 bp: mw 0.220 sp: indust 0.325hsbmw 0.177 fsdxp 0.201 emp: const 0.201 sp PE ratio 0.267ces011 0.187 ips12 0.138 bp: south 0.128 sp div yield 0.264ips12 0.199 ips299 0.128 starts: mw 0.108 starts: nonfarm 0.163mR2(8) 0.027 0.029 0.023 0.024fspin 0.535 fspcom 0.326 Reserves total 0.220 Ex rate: avg 0.198fspcom 0.519 fspin 0.325 M2 0.210 Inst cred/PI 0.196fsdxp 0.423 fsdxp 0.236 M1 0.196 Ex rate: Switz 0.183fspxe 0.298 fspxe 0.164 Ex rate: Switz: 0.120 Ex rate: UK 0.175hhsntn 0.121 ces151 0.142 Ex rate: UK 0.115 M1 0.137
19

Table 3: Non-nested Model Comparisons
f̂1 f̂1 + f̂2h IP Empl. CPI Core CPI IP Empl. CPI Core CPI
1970 1 MSE 57.58 3.34 7.05 4.75 56.84 3.36 6.99 4.55
Ratio03 1.00 0.99 1.00 1.00 0.99 0.99 1.00 1.00Ratio11 0.98* 0.99 1.00 1.00 0.99 1.00 1.00 1.00
6 MSE 26.61 2.26 2.75 2.37 19.88 1.95 2.81 2.31Ratio03 1.01 1.00 1.00 0.99 1.03 1.01 1.00 0.99Ratio11 0.97 0.99 1.00 1.01 1.02 0.99 1.00 1.00
12 MSE 20.44 2.59 2.91 2.44 14.59 2.20 3.03 2.56Ratio03 1.01 1.00 1.00 0.99 1.04 0.99 1.00 0.99Ratio11 0.99 0.99 1.00 1.01 1.02 1.00 1.00 1.00
1990 1 MSE 36.14 1.41 4.44 1.49 35.59 1.45 4.46 1.54
Ratio03 0.98 0.99 1.00 1.00 0.98 0.99 1.00 0.99Ratio11 0.99 1.01 1.00 0.99 0.99 1.00 1.00 1.00
6 MSE 10.98 1.05 1.16 0.29 10.59 1.27 1.21 0.34Ratio03 1.00 0.98 1.02 1.01 1.00 0.94* 1.02 1.01Ratio11 0.98 1.01 0.99 0.97 0.99 0.96* 1.00 0.97
12 MSE 8.84 1.72 1.08 0.29 10.88 2.35 1.06 0.29Ratio03 1.00 0.98 1.03 1.01 0.94 0.94* 1.03 1.02Ratio11 0.99 1.01 0.99 0.98 0.96 0.97* 1.00 0.97
Table 4: Nested Model Comparisons
f̂1 vs. AR f̂1 + f̂2 vs. f̂1h IP Empl. CPI Core CPI IP Empl. CPI Core CPI
1970 1 MSE 70.52 3.29 9.68 3.98 60.16 2.91 9.57 3.84Ratio 0.85* 0.88* 0.99* 0.97* 0.98* 1.00 1.01 0.99*
6 MSE 30.44 2.28 5.02 2.12 27.41 2.10 4.93 1.92Ratio 0.90* 0.92* 0.98 0.91* 0.82* 0.89* 1.02 1.02
12 MSE 24.86 4.35 4.65 2.41 22.21 2.67 4.28 2.01Ratio 0.89* 0.61* 0.92* 0.83* 0.79* 0.92* 1.00 1.07
1990 1 MSE 58.39 1.40 9.98 1.19 48.98 1.39 10.17 1.29Ratio 0.84* 0.99 1.02 1.08 0.98* 1.03 1.01 1.10
6 MSE 21.48 1.35 5.15 0.31 18.38 1.24 5.87 0.46Ratio 0.86* 0.92* 1.14 1.48 1.03 1.15 1.02 1.30
12 MSE 19.71 4.27 3.84 0.35 16.83 2.16 4.42 0.52Ratio 0.85* 0.51* 1.15 1.46 1.12 1.29 0.97 1.18
2008 1 MSE 98.38 1.85 17.56 0.76 75.86 1.65 18.81 1.03Ratio 0.77* 0.89* 1.07 1.36 0.97* 1.01 1.01 1.28
6 MSE 49.69 2.65 14.84 0.33 43.63 2.23 18.27 0.84Ratio 0.88* 0.84* 1.23 2.59 0.97 1.04 1.02 1.39
12 MSE 46.17 8.91 10.37 0.42 38.95 3.81 13.35 1.10Ratio 0.84 0.43* 1.29 2.61 0.97 1.17 0.97 1.24
20

Figure 1: Importance of Component Component
0.00
0.25
0.50
0.75
Group 1 2 3 4 5 6 7 8
R2Importance of Factors: R2
21

Figure 2: Number of factors and R2: Recursive Estimation
Number of Factors
1970 1975 1980 1985 1990 1995 2000 2005 2010
2
3
4
5
6
7
8
9
NBER RecessionFRED−MDGSI 2011GSI 2003
R−squared
1970 1975 1980 1985 1990 1995 2000 2005 2010
0.2
0.25
0.3
0.35
0.4
0.45
0.5
NBER RecessionFRED−MDGSI 2011GSI 2003
22

Figure 3: Diffusion Indexes: F̂1 and F̂2
F1
1965 1970 1975 1980 1985 1990 1995 2000 2005 2010
−5
0
5
10
15
20
25
30 NBERF1F1−balanced
F2
1965 1970 1975 1980 1985 1990 1995 2000 2005 2010
0
5
10
15
20
25
30
35NBERF2F2−balanced
23

Figure 4: Recursively Estimated Diffusion Indexes: RFDI1
RF−1
1965 1970 1975 1980 1985 1990 1995 2000 2005 2010−20
−10
0
10
20
30
40
50 NBER RecessionRecursive EstimationRecursive Demean
RF−2
1965 1970 1975 1980 1985 1990 1995 2000 2005 2010
−30
−20
−10
0
10
20
30
NBER RecessionRecursive EstimationRecursive Demean
24

Appendix
The column tcode denotes the following data transformation for a series x: (1) no transformation;(2) ∆xt; (3) ∆2xt; (4) log(xt); (5) ∆ log(xt); (6) ∆2 log(xt). The FRED column gives mnemonicsin FRED followed by a short description. The comparable series in Global Insight is given in thecolummn GSI.
Group 1 id tcode fred description gsi gsi:description1 1 5 RPI Real Personal Income M 14386177 PI2 2 5 W875RX1 RPI ex. Transfers M 145256755 PI less transfers3 6 5 INDPRO IP Index M 116460980 IP: total4 7 5 IPFPNSS IP: Final Products and Supplies M 116460981 IP: products5 8 5 IPFINAL IP: Final Products M 116461268 IP: final prod6 9 5 IPCONGD IP: Consumer Goods M 116460982 IP: cons gds7 10 5 IPDCONGD IP: Durable Consumer Goods M 116460983 IP: cons dble8 11 5 IPNCONGD IP: Nondurable Consumer Goods M 116460988 IP: cons nondble9 12 5 IPBUSEQ IP: Business Equipment M 116460995 IP: bus eqpt
10 13 5 IPMAT IP: Materials M 116461002 IP: matls11 14 5 IPDMAT IP: Durable Materials M 116461004 IP: dble matls12 15 5 IPNMAT IP: Nondurable Materials M 116461008 IP: nondble matls13 16 5 IPMANSICS IP: Manufacturing M 116461013 IP: mfg14 17* 5 IPB51222S IP: Residential Utilities M 116461276 IP: res util15 18 5 IPFUELS IP: Fuels M 116461275 IP: fuels16 19 1 NAPMPI ISM Manufacturing: Production M 110157212 NAPM prodn17 20* 2 CAPUTLB00004S Capacity Utilization: Manufacturing M 116461602 Cap util
Group 2 id tcode fred description gsi gsi:description1 21* 2 HWI Help-Wanted Index for US Help wanted indx2 22* 2 HWIURATIO Help Wanted to Unemployed ratio M 110156531 Help wanted/unemp3 23 5 CLF16OV Civilian Labor Force M 110156467 Emp CPS total4 24 5 CE16OV Civilian Employment M 110156498 Emp CPS nonag5 25 2 UNRATE Civilian Unemployment Rate M 110156541 U: all6 26 2 UEMPMEAN Average Duration of Unemployment M 110156528 U: mean duration7 27 5 UEMPLT5 Civilians Unemployed <5 Weeks M 110156527 U < 5 wks8 28 5 UEMP5TO14 Civilians Unemployed 5-14 Weeks M 110156523 U 5-14 wks9 29 5 UEMP15OV Civilians Unemployed >15 Weeks M 110156524 U 15+ wks
10 30 5 UEMP15T26 Civilians Unemployed 15-26 Weeks M 110156525 U 15-26 wks11 31 5 UEMP27OV Civilians Unemployed >27 Weeks M 110156526 U 27+ wks12 32* 5 CLAIMSx Initial Claims M 15186204 UI claims13 33 5 PAYEMS All Employees: Total nonfarm M 123109146 Emp: total14 34 5 USGOOD All Employees: Goods-Producing M 123109172 Emp: gds prod15 35 5 CES1021000001 All Employees: Mining and Logging M 123109244 Emp: mining16 36 5 USCONS All Employees: Construction M 123109331 Emp: const17 37 5 MANEMP All Employees: Manufacturing M 123109542 Emp: mfg18 38 5 DMANEMP All Employees: Durable goods M 123109573 Emp: dble gds19 39 5 NDMANEMP All Employees: Nondurable goods M 123110741 Emp: nondbles20 40 5 SRVPRD All Employees: Service Industries M 123109193 Emp: services21 41 5 USTPU All Employees: TT&U M 123111543 Emp: TTU22 42 5 USWTRADE All Employees: Wholesale Trade M 123111563 Emp: wholesale23 43 5 USTRADE All Employees: Retail Trade M 123111867 Emp: retail24 44 5 USFIRE All Employees: Financial Activities M 123112777 Emp: FIRE25 45 5 USGOVT All Employees: Government M 123114411 Emp: Govt26 46 1 CES0600000007 Hours: Goods-Producing M 140687274 Avg hrs27 47 2 AWOTMAN Overtime Hours: Manufacturing M 123109554 Overtime: mfg28 48 1 AWHMAN Hours: Manufacturing M 14386098 Avg hrs: mfg29 49 1 NAPMEI ISM Manufacturing: Employment M 110157206 NAPM empl30 128 6 CES0600000008 Ave. Hourly Earnings: Goods M 123109182 AHE: goods31 129 6 CES2000000008 Ave. Hourly Earnings: Construction M 123109341 AHE: const32 130 6 CES3000000008 Ave. Hourly Earnings: Manufacturing M 123109552 AHE: mfg
25

Group 3 id tcode fred description gsi gsi:description1 50 4 HOUST Starts: Total M 110155536 Starts: nonfarm2 51 4 HOUSTNE Starts: Northeast M 110155538 Starts: NE3 52 4 HOUSTMW Starts: Midwest M 110155537 Starts: MW4 53 4 HOUSTS Starts: South M 110155543 Starts: South5 54 4 HOUSTW Starts: West M 110155544 Starts: West6 55 4 PERMIT Permits M 110155532 BP: total7 56 4 PERMITNE Permits: Northeast M 110155531 BP: NE8 57 4 PERMITMW Permits: Midwest M 110155530 BP: MW9 58 4 PERMITS Permits: South M 110155533 BP: South
10 59 4 PERMITW Permits: West M 110155534 BP: West
Group 4 id tcode fred description gsi gsi:description1 3 5 DPCERA3M086SBEA Real PCE M 123008274 Real Consumption2 4* 5 CMRMTSPLx Real M&T Sales M 110156998 M&T sales3 5* 5 RETAILx Retail and Food Services Sales M 130439509 Retail sales4 60 1 NAPM ISM: PMI Composite Index M 110157208 PMI5 61 1 NAPMNOI ISM: New Orders Index M 110157210 NAPM new ordrs6 62 1 NAPMSDI ISM: Supplier Deliveries Index M 110157205 NAPM vendor del7 63 1 NAPMII ISM: Inventories Index M 110157211 NAPM Invent8 64 5 ACOGNO Orders: Consumer Goods M 14385863 Orders: cons gds9 65* 5 AMDMNOx Orders: Durable Goods M 14386110 Orders: dble gds
10 66* 5 ANDENOx Orders: Nondefense Capital Goods M 178554409 Orders: cap gds11 67* 5 AMDMUOx Unfilled Orders: Durable Goods M 14385946 Unf orders: dble12 68* 5 BUSINVx Total Business Inventories M 15192014 M&T invent13 69* 2 ISRATIOx Inventories to Sales Ratio M 15191529 M&T invent/sales14 131* 2 UMCSENTx Consumer Sentiment Index hhsntn Consumer expect
Group 5 id tcode fred description gsi gsi:description1 70 6 M1SL M1 Money Stock M 110154984 M12 71 6 M2SL M2 Money Stock M 110154985 M23 72 6 M3SL MABMM301USM189S in FRED, M3 for the United States M 110155013 Currency4 73 5 M2REAL Real M2 Money Stock M 110154985 M2 (real)5 74 6 AMBSL St. Louis Adjusted Monetary Base M 110154995 MB6 75 6 TOTRESNS Total Reserves M 110155011 Reserves tot7 76 6 NONBORRES Nonborrowed Reserves M 110155009 Reserves nonbor8 77 6 BUSLOANS Commercial and Industrial Loans BUSLOANS C&I loan plus9 78 1 REALLN Real Estate Loans BUSLOANS DC&I loans
10 79 6 NONREVSL Total Nonrevolving Credit M 110154564 Cons credit11 80* 2 CONSPI Credit to PI ratio M 110154569 Inst cred/PI12 132 6 MZMSL MZM Money Stock N.A. N.A.13 133 6 DTCOLNVHFNM Consumer Motor Vehicle Loans N.A. N.A.14 134 6 DTCTHFNM Total Consumer Loans and Leases N.A. N.A.15 135 6 INVEST Securities in Bank Credit N.A. N.A.
Group 6 id tcode fred description gsi gsi:description1 85 2 FEDFUNDS Effective Federal Funds Rate M 110155157 Fed Funds2 86* 2 CP3M 3-Month AA Comm. Paper Rate CPF3M Comm paper3 87 2 TB3MS 3-Month T-bill M 110155165 3 mo T-bill4 88 2 TB6MS 6-Month T-bill M 110155166 6 mo T-bill5 89 2 GS1 1-Year T-bond M 110155168 1 yr T-bond6 90 2 GS5 5-Year T-bond M 110155174 5 yr T-bond7 91 2 GS10 10-Year T-bond M 110155169 10 yr T-bond8 92 2 AAA Aaa Corporate Bond Yield Aaa bond9 93 2 BAA Baa Corporate Bond Yield Baa bond
10 94* 1 COMPAPFF CP - FFR spread CP-FF spread11 95 1 TB3SMFFM 3 Mo. - FFR spread 3 mo-FF spread12 96 1 TB6SMFFM 6 Mo. - FFR spread 6 mo-FF spread13 97 1 T1YFFM 1 yr. - FFR spread 1 yr-FF spread14 98 1 T5YFFM 5 yr. - FFR spread 5 yr-FF spread15 99 1 T10YFFM 10 yr. - FFR spread 10 yr-FF spread16 100 1 AAAFFM Aaa - FFR spread Aaa-FF spread17 101 1 BAAFFM Baa - FFR spread Baa-FF spread18 102 5 TWEXMMTH Trade Weighted U.S. FX Rate Ex rate: avg19 103 5 EXSZUS Switzerland / U.S. FX Rate M 110154768 Ex rate: Switz20 104 5 EXJPUS Japan / U.S. FX Rate M 110154755 Ex rate: Japan21 105 5 EXUSUK U.S. / U.K. FX Rate M 110154772 Ex rate: UK22 106 5 EXCAUS Canada / U.S. FX Rate M 110154744 EX rate: Canada
26

Group 7 id tcode fred description gsi gsi:description1 107 6 PPIFGS PPI: Finished Goods M 110157517 PPI: fin gds2 108 6 PPIFCG PPI: Finished Consumer Goods M 110157508 PPI: cons gds3 109 6 PPIITM PPI: Intermediate Materials M 110157527 PPI: int materials4 110 6 PPICRM PPI: Crude Materials M 110157500 PPI: crude materials5 111* 6 oilprice Crude Oil Prices: WTI M 110157273 Spot market price6 112 6 PPICMM PPI: Commodities M 110157335 PPI: nonferrous7 113 1 NAPMPRI ISM Manufacturing: Prices M 110157204 NAPM com price8 114 6 CPIAUCSL CPI: All Items M 110157323 CPI-U: all9 115 6 CPIAPPSL CPI: Apparel M 110157299 CPI-U: apparel
10 116 6 CPITRNSL CPI: Transportation M 110157302 CPI-U: transp11 117 6 CPIMEDSL CPI: Medical Care M 110157304 CPI-U: medical12 118 6 CUSR0000SAC CPI: Commodities M 110157314 CPI-U: comm.13 119 6 CUUR0000SAD CPI: Durables M 110157315 CPI-U: dbles14 120 6 CUSR0000SAS CPI: Services M 110157325 CPI-U: services15 121 6 CPIULFSL CPI: All Items Less Food M 110157328 CPI-U: ex food16 122 6 CUUR0000SA0L2 CPI: All items less shelter M 110157329 CPI-U: ex shelter17 123 6 CUSR0000SA0L5 CPI: All items less medical care M 110157330 CPI-U: ex med18 124 6 PCEPI PCE: Chain-type Price Index gmdc PCE defl19 125 6 DDURRG3M086SBEA PCE: Durable goods gmdcd PCE defl: dlbes20 126 6 DNDGRG3M086SBEA PCE: Nondurable goods gmdcn PCE defl: nondble21 127 6 DSERRG3M086SBEA PCE: Services gmdcs PCE defl: service
Group 8 id tcode fred description gsi gsi:description1 81* 5 S&P 500 S&P: Composite M 110155044 S&P 5002 82* 5 S&P: indust S&P: Industrials M 110155047 S&P: indust3 83* 2 S&P div yield S&P: Dividend Yield S&P div yield4 84* 5 S&P PE ratio S&P: Price-Earnings Ratio S&P PE ratio
27