Embed Size (px)
Citation preview

May 2009: Supplemental (Covering May 5, 2009, to May 12, 2009)
Economic ActivityInvolunatry Part-Time Workers and the Defi ciencies of
the Unemployment RateThe Employment Situation, April 2009 Is the Housing Bust Over?
Banking and Financial InstitutionsHow Realistic Were the Economic Forecasts Used in
the Stress Tests?
In This Issue:

2Federal Reserve Bank of Cleveland, Economic Trends | May 2009: Supplemental
Economic ActivityInvoluntary Part-Time Workers and the Defi ciencies of the Unemployment Rate
05.07.09 by Yoonsoo Lee and Beth Mowry
Th e Bureau of Labor Statistics’ March employ-ment report had very few positive things to say about the labor market. Employers slashed an additional 663,000 jobs, and the unemployment rate climbed 0.4 percentage point, from 8.1 percent to 8.5 percent, the highest rate since late 1983. As dismal as 8.5 percent sounds, the unemployment rate actually gives a rosier take on the labor market than alternative measures do. Now appears to be a time when this rate, the government’s most publi-cized statistic on employment conditions, off ers an incomplete view of the state of the labor market.
Th e unemployment rate is often criticized for leaving some people out of the count. Th e rate is defi ned as the percentage of those in the labor force who are unemployed, and to be in the labor force, one needs to be employed or actively seeking work. Not included are people who are willing and able to work but who have stopped searching.
Th ere are a variety of reasons these so-called mar-ginally attached workers may have stopped look-ing for work. Discouraged workers are considered part of the marginally attached group, for instance, because they believe searching for a job would not be worthwhile. As gloomy economic conditions discourage workers from hunting for new jobs, the offi cial unemployment rate may understate slack in the labor market during recessions.
Involuntary part-time workers are another group whose status is not captured entirely in the offi cial unemployment rate. Th ese underemployed work-ers would like to have full-time jobs but instead are working fewer than 35 hours a week, either because their hours have been reduced or because part-time work was all they could fi nd.
Th e employment report showed that the number of people employed part-time for economic rea-sons (rather than by choice) increased by 423,000

3Federal Reserve Bank of Cleveland, Economic Trends | May 2009: Supplemental
last month. Th is increase followed on the heels of a 787,000 increase in February, the second-largest monthly jump since records began in the 1950s (the largest was September 2001). Th e total num-ber of involuntary part-timers is now the highest it has ever been, standing at 9 million—nearly double what it was just a year ago (4.9 million).
Th e BLS’s Current Population Survey categorizes involuntary part-timers into those working part-time due to “slack work or business conditions” and those who “could only fi nd a part-time job.” In other words, some workers had full-time jobs but went to part-time when their employers cut hours because business was falling off , while other work-ers had to start out in part-time jobs even though they were looking for full-time work, because that’s all that was available.
0
1,000
2,000
3,000
4,000
5,000
6,000
7,000
1994 1997 2000 2003 2006 2009
Involuntary Part-Time EmploymentThousands of workers
Notes: Shaded bars represent recessions. Seasonally adjusted data.Source: Bureau of Labor Statistics.
Could only find part-time work
Slack work or business conditions
Average Job Openings and Labor Turnover by Industry
April 2006 March 2009 Change
Total (thousands) Percent
Total (thousands) Percent
Total (thousands) Percent
Total part-time for economic reasons
3908 100.0 9049 100.0 5141 100.0
Slack work or business conditions
2440 62.4 6857 75.8 4417 85.9
Could only work part-time
115 132 370 385 388 383
Manufacturing 232 282 340 352 457 367
Note: Data are seasonally-adjusted.Sources: Bureau of Labor Statistics, Current Population Survey.
Th e 5.1 million rise in involuntary part-time em-ployment from its recent low in April 2006 to the present was mainly due to an increase in workers whose hours were cut back because of slack work conditions. In fact, the number of those working part-time for this reason more than doubled since the beginning of the recession. Th ey accounted for 62 percent of all economic part-timers in 2006, and now they constitute 76 percent of the group.
Th is large uptick is important to note because it fi lls in some of the gaps of the labor market story that the offi cial unemployment rate leaves open. When marginally attached workers and involun-tary part-time workers are added to the offi cial unemployment rate, the unemployment rate nearly doubles, from 8.5 percent to 15.6 percent.

4Federal Reserve Bank of Cleveland, Economic Trends | May 2009: Supplemental
To read more on the Bureau of Labor Statistics’ March employment report:http://www.bls.gov/news.release/empsit.nr0.htm
2
6
10
14
18
1994 1997 2000 2003 2006 2009
Alternative Measures of Unemployment Rate Percent
Notes: Shaded bars indicate recessions. The official unemployment rate is the ratio of unemployed persons to the labor force. The other rates include the additional worker classifications in the numerator and denominator. Source: Bureau of Labor Statistics.
Official rate with all marginally attached workers Official rate with discouraged workers
Official rate with marginally attached and involuntary part-timers
Official unemployment rate
More and more people appear to be working part-time jobs for economic reasons, rather than by choice. Th e unemployment measure that accounts for these people and other marginally attached workers has increased even more than the offi cial unemployment rate over the past year.
Th e offi cial unemployment rate rose from 4.9 percent at the start of the recession in December 2007 to its present 8.5 percent, an increase of 3.6 percentage points. Th e unemployment rate includ-ing marginally attached workers and the underem-ployed increased 6.9 percentage points in the

5Federal Reserve Bank of Cleveland, Economic Trends | May 2009: Supplemental
Economic ActivityTh e Employment Situation, April 2009
05.12.09by Yoonsoo Lee and Beth Mowry
Nonfarm payroll employment declined by a less-than-expected 539,000 in April, boosted by federal government hiring and smaller-than-expected losses across many private industries. While still very large, the loss was the smallest since last October. Revisions to the data for the previous two months, however, continued to be on the downside, adding 66,000 additional losses to the earlier fi gures for February and March. Th ose months have now seen respective losses of 681,000 and 699,000, bringing total payroll losses since the start of the recession to 5.7 million.
Th e unemployment rate jumped from 8.5 percent to 8.9 percent in April, largely due to a labor force increase of 683,000 people, which pushed up the participation rate 0.3 percentage point to 65.8 per-cent. Th e employment-to-population ratio, often considered a more stable measure of labor market dynamics, remained at 59.9 percent.
Th e diff usion index of employment change, which tracks the percentage of industries that are increas-ing their employment, saw its largest monthly increase since September 2007, jumping from 20.3 to 28.2. Th is reading is still well below the 50 threshold, which would indicate an equal balance between industries with increasing and decreasing employment.
Goods-producing payrolls decreased by 270,000 in April, compared to average monthly losses of 322,000 for year-to-date 2009. Manufacturing and construction losses (−149,000, −110,000) were both the smallest seen for any month this year. Du-rable goods (−127,000) continued to be a heavier drag on the manufacturing fi gure than nondurable goods (−22,000). Within durable goods, motor vehicles and parts manufacturers alone were respon-sible for 29,000 of the payroll losses.
Th e private service-providing sector shed 341,000 jobs in April, after larger drops in February (−393,000) and March (−375,000). Of all the ma-
-800-700-600-500-400-300-200-100
0100200300
Average Nonfarm Employment Change Change, thousands of jobs
RevisedPrevious estimate
Source: Bureau of Labor Statistics.
2006 2007 2008YTD 2009
III IV I2008 2009
FebruaryMarch
April

6Federal Reserve Bank of Cleveland, Economic Trends | May 2009: Supplemental
jor service industries, only information (−17,000) and leisure and hospitality (−44,000) fared slightly worse than they had in March. Other service indus-tries shed fewer jobs last month: Trade, transporta-tion, and utilities lost 126,000, fi nancial activities lost 40,000, and professional and business services dropped 122,000. Payroll losses in temporary help services lessened slightly but are still elevated compared to most months over the course of the recession. As has been the case over the past year, education and healthcare is the only service indus-try to add to payrolls, with a net gain of 15,000. Th e government sector experienced its largest monthly gain since June 2001, due to the hiring of 140,000 federal employees in preparation for the 2010 Census.
Labor Market Conditions and RevisionsAverage monthly change (thousands of employees, NAICS)
February current
Revision to February March current
Revision to March April 2009
Payroll employment −681 −30 −699 −36 −539Goods-producing −295 −10 −318 −13 −271
Construction −113 −6 −135 −9 −110Heavy and civil engineering −7.6 −2 −12 −2 −17
Residentiala −51.1 2 −62 −3 −52 Nonresidentialb −54.1 −6 −61 −4 −41 Manufacturing −172 −3 −167 −6 −149 Durable goods −128 0 −127 −2 −127 Nondurable goods −44 −3 −40 −4 −22 Service-providing −386 −20 −381 −23 −269 Retail trade −57 −6 −64 −16 −47 Financial activitiesc −56 −12 −43 0 −40 PBSd −176 2 −130 3 −122 Temporary help services −73 4 −72 0 −63 Education and health services 19 −3 10 2 15 Leisure and hospitality −32 −4 −42 −2 −44 Government 7 4 −6 −1 72 Local educational services 6 −4 −4 −4 4
a. Includes construction of residential buildings and residential specialty trade contractors.b. Includes construction of nonresidential buildings and nonresidential specialty trade contractors.c. Includes the fi nance, insurance, and real estate sector and the rental and leasing sector.d. PBS is professional business services (professional, scientifi c, and technical services, management of companies and enterprises, administra-tive and support, and waste management and remediation services.Source: Bureau of Labor Statistics.

7Federal Reserve Bank of Cleveland, Economic Trends | May 2009: Supplemental
Total private sector employment dropped by a milder 611,000 jobs last month, compared to March’s loss of 693,000. Still, monthly private-sector losses this year have been considerably worse for several months running compared to past reces-sions. Th e only months in the series with com-parable losses were December 1974 and October 1949, which saw respective private sector losses of 629,000 and 814,000.
Private Sector Employment Growth
-800
-600
-400
-200
0
200
400
2000 2001 2002 2003 2004 2005 2006 2007 2008 2009
Three-month moving averageMonthly change
Source: Bureau of Labor Statistics.
Thousands of jobs

8Federal Reserve Bank of Cleveland, Economic Trends | May 2009: Supplemental
Economic ActivityIs the Housing Bust Over?
05.12.09by Michael Shenk
It was early 2006 that housing markets did their abrupt turnaround, transitioning from a period of increasing prices and sales to one where both prices and sales were in a near freefall. Th e fallout of the housing market bust has been well documented, and the boom-bust cycle is often cited as a leading cause of the current recession.
It’s been three years—is the housing market correc-tion fi nally over? Th e short answer is probably no, but there are some encouraging signs of improve-ment.
Existing single-family home sales, by far the larg-est segment of the housing market, have been relatively stable for the past fi ve months. Prior to a steep drop off in November, sales had held steady for roughly 14 months. Th is stability has come at a cost though, as the median price of homes sold has fallen drastically over the past year and a half.
Part of the reason that existing home prices seem to be falling so rapidly is that an increasing percent-age of homes being sold are distressed. In April, the National Association of Realtors reported that just over half of March’s home sales were in this category. While this may not seem encouraging for homeowners, working off the bloated supply of foreclosures is an important step in the return to normalcy. So far, inventories of existing homes have yet to come down signifi cantly, but with sales showing signs of stability, it appears that inventories may have turned a corner. In addition, the Mort-gage Bankers Association reported that the percent of loans entering foreclosure fell in the second half of 2008.
New single-family home sales have also shown tentative signs of stabilizing over the past few months. However, since they began their decline in late 2005, new home sales have shown quite a few signs of stability over short periods, only to be followed by more declines. Of course, one might not expect new home sales to stabilize as rapidly
1.0
1.3
1.6
1.9
2.2
2.5
2.8
3.1
3.4
3.7
4.0
1990 1992 1994 1996 1998 2000 2002 2004 2006 20083
4
5
6
7
8
9
10
11
12
13Millions of units
Source: National Association of Realtors.
Existing Single-Family Homes for SaleMonths of supply
3.0
3.5
4.0
4.5
5.0
5.5
6.0
6.5
1995 1997 1999 2001 2003 2005 2007 2009100
120
140
160
180
200
220
240
Millions of units, SAAR
Source: National Association of Realtors.
Sales
Median sales price
Existing Single-Family Home SalesThousands of dollars, NSA
0.0
0.2
0.4
0.6
0.8
1.0
1.2
1.4
1980 1984 1988 1992 1996 2000 2004 2008
Percent of loans entering foreclosure
Foreclosure Starts
Source: Mortgage Bankers Association.
9Federal Reserve Bank of Cleveland, Economic Trends | May 2009: Supplemental
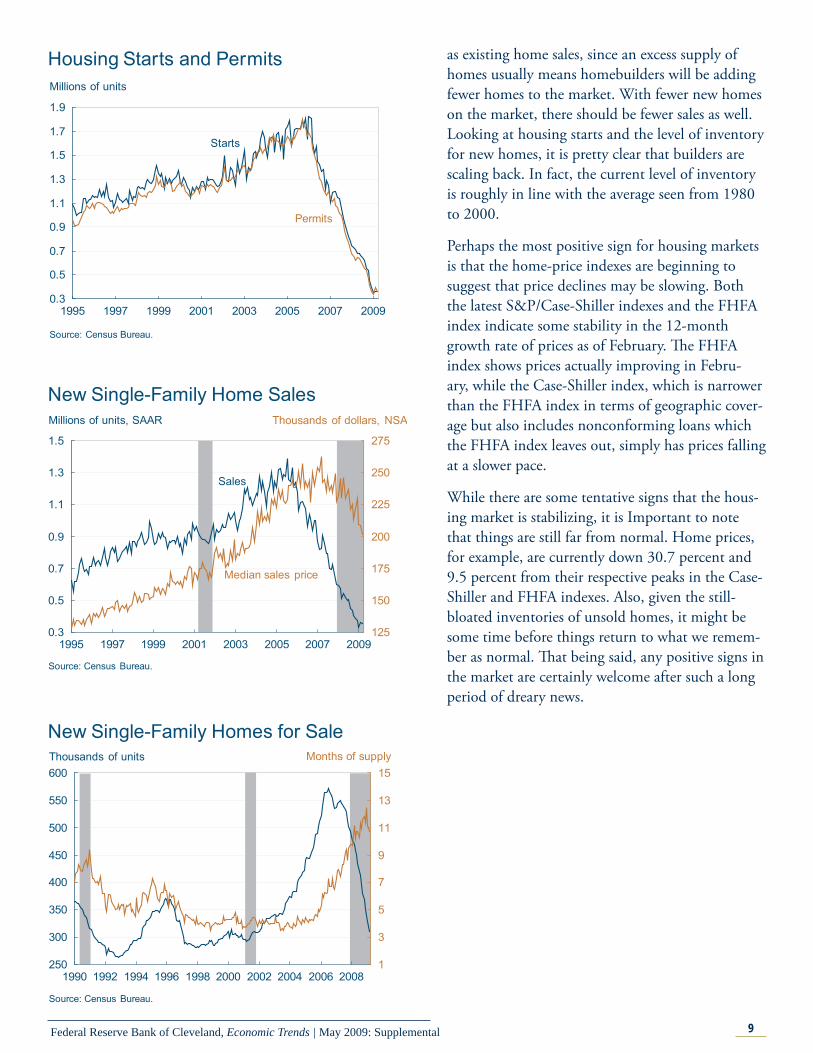
as existing home sales, since an excess supply of homes usually means homebuilders will be adding fewer homes to the market. With fewer new homes on the market, there should be fewer sales as well. Looking at housing starts and the level of inventory for new homes, it is pretty clear that builders are scaling back. In fact, the current level of inventory is roughly in line with the average seen from 1980 to 2000.
Perhaps the most positive sign for housing markets is that the home-price indexes are beginning to suggest that price declines may be slowing. Both the latest S&P/Case-Shiller indexes and the FHFA index indicate some stability in the 12-month growth rate of prices as of February. Th e FHFA index shows prices actually improving in Febru-ary, while the Case-Shiller index, which is narrower than the FHFA index in terms of geographic cover-age but also includes nonconforming loans which the FHFA index leaves out, simply has prices falling at a slower pace.
While there are some tentative signs that the hous-ing market is stabilizing, it is Important to note that things are still far from normal. Home prices, for example, are currently down 30.7 percent and 9.5 percent from their respective peaks in the Case-Shiller and FHFA indexes. Also, given the still-bloated inventories of unsold homes, it might be some time before things return to what we remem-ber as normal. Th at being said, any positive signs in the market are certainly welcome after such a long period of dreary news.
0.3
0.5
0.7
0.9
1.1
1.3
1.5
1995 1997 1999 2001 2003 2005 2007 2009125
150
175
200
225
250
275
Millions of units, SAAR
Source: Census Bureau.
Sales
Median sales price
New Single-Family Home SalesThousands of dollars, NSA
0.3
0.5
0.7
0.9
1.1
1.3
1.5
1.7
1.9
1995 1997 1999 2001 2003 2005 2007 2009
Millions of units
Permits
Housing Starts and Permits
Source: Census Bureau.
Starts
250
300
350
400
450
500
550
600
1990 1992 1994 1996 1998 2000 2002 2004 2006 20081
3
5
7
9
11
13
15Thousands of units
New Single-Family Homes for SaleMonths of supply
Source: Census Bureau.

10Federal Reserve Bank of Cleveland, Economic Trends | May 2009: Supplemental
-20
-15
-10
-5
0
5
10
15
20
25
1995 1997 1999 2001 2003 2005 2007 2009
Sources: S&P, Fiserv, and MacroMarkets LLC, Federal Housing Finance Agency.
S&P/Case-Shiller ten-city index
S&P/Case-Shiller 20-city index
FHFA purchase-only index
Monthly Home Price Indexes12-month percent change
75
100
125
150
175
200
225
250
2000 2002 2004 2006 2008
Monthly Home Price IndexesIndex, January 2000=100
Sources: S&P, Fiserv, and MacroMarkets LLC, Federal Housing Finance Agency.
S&P/Case-Shiller ten-city index
S&P/Case-Shiller 20-city index
FHFA purchase-only index

11Federal Reserve Bank of Cleveland, Economic Trends | May 2009: Supplemental
Banking and Financial InstitutionsHow Realistic Were the Economic Forecasts Used in the Stress Tests?
05.12.09 by Ken Beauchemin and Brent Meyer
Th e results of the “stress tests” came out last Th urs-day, and we can now see what three months of intense scrutiny of 19 of the countries’ largest bank holding companies has revealed about the amount of capital they are likely to need to withstand a worse-than-expected recession. Since the April 24 release of the Federal Reserve white paper describ-ing the process, a number of observers have sug-gested that the economic forecasts used in the tests are not severe enough, and may result in insuffi -cient capital requirements.
Regulators tested the banks against two sets of as-sumptions for GDP, unemployment, and housing prices. Th e “baseline” scenario averaged the Febru-ary forecasts of real GDP and the unemployment rate from the Blue Chip Survey, Consensus Fore-casts, and the Survey of Professional Forecasters. Th e assumptions for house prices followed a path implied by futures on the Case-Shiller Housing Price Index. Th e second, “more adverse” scenario represented a longer and deeper recession than the baseline scenario.
In the baseline case, real GDP falls by 2.0 per-cent in 2009 before rebounding to 2.1 percent in 2010; the unemployment rate averages 8.4 percent in 2009 and 8.8 percent in 2010. House prices decline 14.0 percent in 2009 and fall an additional 4.0 percent in 2010.
Th e more adverse (but not necessarily “worst-case” scenario) assumes a sharp 3.3 percent real GDP contraction in 2009 followed by scant 0.5 percent growth in 2010; the unemployment rate averages 8.9 percent in 2009 and 10.3 percent in 2010. House prices drop 22.0 percent in 2009 and 7.0 percent in 2010.
At the time the assumptions were determined, the advance estimate on fourth-quarter 2009 real GDP growth was −3.8 percent (annualized), and the Feb-ruary employment fi gures were not known. Subse-quently, the Bureau of Economic Analysis slashed

12Federal Reserve Bank of Cleveland, Economic Trends | May 2009: Supplemental
the fourth-quarter growth estimate by a stunning 2.5 percentage points, to −6.3 percent. Given the large downward GDP revision, an exceptionally rapid deterioration in the labor market, and yet another large GDP decline (in the fi rst quarter), it is, of course, natural to question the validity of the bank stress tests. It turns out, however, that the most recent forecasts remain in line with the two stress-test scenarios.
First, the most recent GDP growth forecasts still lie within the range covered by the stress-test scenarios. While both the Blue Chip consensus and Macro-economic Advisors forecasts dip below the base-line-scenario projection for 2009 growth of −2.0 percent, they are quite close to the 2010 baseline and remain fi rmly within the range between the baseline and more adverse scenarios in both years. Furthermore, only the Blue Chip pessimists’ fore-cast hits the lower bound of the stress-test scenarios in 2009, and it is 0.4 percentage point above the more adverse scenario for 2010.
Second, while rapid deterioration in the labor market has led to a near-term path for the unem-ployment rate that will most likely generate a 2009 average in excess of the 8.4 percent rate assumed by the baseline scenario, both the most recent Macroeconomic Advisors and Blue Chip forecasts predict an unemployment rate slightly lower than the 8.9 percent rate assumed by the more adverse scenario. Th e forecasts for 2010 are also less dire than assumed by the more adverse scenario. As the Federal Reserve noted in its April 24 white paper, “Although the likelihood that unemployment could average 10.3 percent in 2010 is now higher than had been anticipated when the scenarios were specifi ed, that outcome still exceeds a more recent consensus projection by professional forecasters for an average unemployment rate of 9.3 percent in 2010.”
Finally, recent forecasts for house prices remain consistent with those of the stress-test scenarios and even hold out some hope that house prices may rise faster than the baseline forecast. Th is result is particularly encouraging since further declines in house prices will be a leading cause of any addition-al losses. Home prices are an important indicator
-4
-3
-2
-1
0
1
2
3
2007 2008 2009 2010
Real GDP Growth Forecasts and Stress Test ScenariosAnnual average percent change
Sources: Blue Chip Newsletter, April 2009; Macroeconomic Advisers, April 2009;Bureau of Economic Analysis; Federal Reserve Board.
Blue Chip optimists
Blue Chip pessimistsMacroeconomic AdvisersApril forecast
Blue Chip consensus
Baselinescenario
More adversescenario
4
6
8
10
12
2007 2008 2009 2010
Unemployment Rate Forecasts and Stress Test ScenariosPercent, annual average
Sources: Blue Chip Newsletter, April 2009; Macroeconomic Advisers forecast, April 2009; Bureau of Labor Statistics; Federal Reserve Board.
Blue Chip optimists
Blue Chip pessimistsMacroeconomic AdvisersApril forecast
Blue Chip consensusBaselinescenario
More adversescenario

13Federal Reserve Bank of Cleveland, Economic Trends | May 2009: Supplemental
Economic Trends is published by the Research Department of the Federal Reserve Bank of Cleveland.
Views stated in Economic Trends are those of individuals in the Research Department and not necessarily those of the Fed-eral Reserve Bank of Cleveland or of the Board of Governors of the Federal Reserve System. Materials may be reprinted provided that the source is credited.
If you’d like to subscribe to a free e-mail service that tells you when Trends is updated, please send an empty email mes-sage to [email protected]. No commands in either the subject header or message body are required.
ISSN 0748-2922
to consider because the troubled assets that could potentially threaten the 19 tested fi nancial institu-tions are largely related to residential real estate. Th e ultimate performance of these assets is partly a function of what happens to home prices in the future.
In summary, notwithstanding further unexpected and dramatic declines in the economy, recent projections by professional forecasters indicate that the stress-test scenarios remain viable and relevant to the task of assessing the potential losses faced by nation’s largest bank holding companies. While the adverse scenario may seem more likely than when it was fi rst drawn up, it is only the near-term outlook for unemployment that has signifi cantly strayed from baseline assumptions. Furthermore, the alternatively adverse scenario looks to be plenty adverse, and exposes the wisdom of planning for a more stressful outcome in the fi rst place.
To read the April 24 release from the Federal Reserve:http://www.federalreserve.gov/newsevents/press/bcreg/bcre-g20090424a1.pdf
100
125
150
175
200
225
250
2007 2008 2010
House Price Forecasts and Stress Test ScenariosFourth-quarter levels (index, January 2000=100)
Path implied by Case-Shiller futures (as of 5.4.09)
Sources: Macroeconomic Advisers forecast; Chicago Mercantile Exchange; S&P, Fiserv, & Macromarkets; Federal Reserve Board.
Macroeconomic Advisers April forecast
Baseline scenario
More adverse scenario
2009


