Embed Size (px)
Citation preview

August 2020
Investor Presentation
Frasers Logistics & Commercial Trust
2
This presentation is for information only and does not constitute or form part of an offer, solicitation, recommendation or invitation for the sale or purchase or subscription of securities, including units in
Frasers Logistics & Commercial Trust (“FLCT”, and the units in FLCT, the “Units”) or any other securities of FLCT. No part of it nor the fact of its presentation shall form the basis of or be relied upon in
connectionw ith any investment decision, contract or commitment w hatsoever. The past performance of FLCT and Frasers Logistics & CommercialAsset Management Pte. Ltd., as the manager of FLCT
(the “Manager”), is not necessarily indicative of the futureperformance of FLCTand the Manager.
This presentation contains “forward-looking statements”, including forward–looking financial information, that involve assumptions, known and unknown risks, uncertainties and other factors which may
cause the actual results, performance, outcomes or achievements of FLCT or the Manager, or industry results, to be materially different from those expressed in such forward-looking statements and
f inancial information. Such forward-looking statements and financial information are based on certain assumptions and expectations of future events regarding FLCT's present and future business
strategies and the environment in which FLCT will operate. The Manager does not guarantee that these assumptions and expectations are accurate or will be realised. You are cautioned not to place
undue reliance on these forward-looking statements, which are based on the Manager’s current view of future events. The Manager does not assume any responsibility to amend, modify or revise any
forward-looking statements, on the basis of any subsequent developments, information or events, or otherwise, subject to compliance with all applicable laws and regulations and/or the rules of the
Singapore Exchange SecuritiesTrading Limited (“SGX-ST”)and/orany otherregulatory or supervisory bodyor agency.
The information and opinions in this presentation are subject to changew ithout notice, its accuracy is not guaranteed and it may not contain all material information concerning FLCT. None of Frasers
Property Limited, FLCT, the Manager, Perpetual (Asia) Limited, in its capacity as trustee of FLCT, or any of their respective holding companies, subsidiaries, aff iliates, associated undertakings or
controlling persons, or any of their respective directors, off icers, partners, employees, agents, representatives, advisers or legal advisers makes any representation or warranty, express or implied, as to
the accuracy, completeness or correctness of the information contained in this presentation or otherwise made available or as to the reasonableness of any assumption contained herein or therein, and
any liability whatsoever (in negligence or otherwise) for any loss howsoever arising, whether directly or indirectly, from any use, reliance or distribution of this presentation or its contents or otherwise
arising in connection with thispresentation is expresslydisclaimed. Further, nothing in this presentation should be construedas constituting legal, business,tax or financial advice.
The value of Units and the income derived from them, if any, may fall or rise. Units are not obligations of, deposits in, or guaranteed by, the Manager or any of its aff iliates. An investment in the Units is
subject to investment risks, including the possible loss of the principal amount invested. Investors should note that they have no right to request the Manager to redeem their Units while the Units are
listed. It is intended that holders of Units may only deal in their Units throughtrading on the SGX-ST. Listing of the Units on the SGX-STdoes not guarantee a liquid market for the Units.
This advertisement hasnot been reviewed by the MonetaryAuthority of Singapore.
Nothing in this presentation constitutes or forms a part of any offer to sell or solicitation of any offer to purchase or subscribe for securities for sale in Singapore, the United States or any other jurisdiction
in w hich such offer, solicitation or sale would be unlawful prior to registrationor qualif ication under the securities lawsof any such jurisdiction.

Introduction to FLCT
Section Divider To add a background, press Insert > Pictures > Picture from File > Send to back
Bunzl Facility, Marl, Germany

4
57.2%
21.3%
21.5%
L&I (93 properties)
Office & Business Parks (4 properties)
CBD Commercial (3 properties)
Portfolio Composition(1)
UK
(2 Properties)
Australia
(65 Properties)
Singapore
(2 Properties)
Germany
(26 Properties)The Netherlands
(5 Properties)
Commercial / Business Parks
Logistics & Industrial (“L&I”)
Note: Unless otherwise stated, the metrics presented on slides 4 – 7 includes the two new properties acquired on 12 August 2020 and excludes the Sale Property (the “Transactions”). Please refer to the announcements dated 3 August 2020 and 12 August 2020
for details. 1. Book Value as at 30 June 2020 and include the Transactions. 2. Based on GRI, being the contracted rental income and estimated recoverable outgoings for the month of June 2020 and include the Transactions. Excludes straight lining rental
adjustments and include committed leases.
A flagship logistics and commercial portfolio
100 PropertiesAcross 5 Countries
~S$6.0 billionPortfolio Value(1)
~97.3%Occupancy Rate(2)
~5.1 yearsLong WALE(2)
By Asset Type By Geography
46.5%
20.6%
21.1%
7.2%
4.6%
Australia(65 properties)
Germany(26 properties)
Singapore(2 properties)
UK(2 properties)
The Netherlands(5 properties)

5
Key Acquisition Milestones
Note: S$ v alues, unless otherwise stated, are based on an exchange rate of A$1: S$0.9620, €1: S$1.5609 and £1:S$1.7282 as at 30 June 2020.
1. Includes the FCOT portfolio of approximately S$2.4 billion as at 30 June 2020 and based on 100% interest in Farnborough Business Park.
1.6 1.92.9
3.5
6.0
FP16 FY17 FY18 FY19 FY20
Initial Portfolio:
54 L&I properties
in Australia
(inclusive of three
call option properties)
FY17
Acquired seven
new L&I
properties in
Australia
FY18
Strategic entry
into Germany
and the
Netherlands acquiring 21 L&I
properties;
added tw o L&I
properties in
Australia
FY19
Further inroads
into Europe and
Australia by
acquiring 13 new L&I
properties
FY20
Completed
milestone merger
w ith Frasers
Commercial Trust; added a
L&I property in
Australia and a
business park in
the UK
Proven track record in executing value-
accretive acquisitions:
◆ ~S$4.4 billion(1) worth of accretive
acquisitions to-date since IPO in June 2016
1
Active portfolio rebalancing:
◆ ~S$407.5 million in strategic divestments at
premiums to book value
2
Completed transformational merger with
Frasers Commercial Trust in April 2020:
◆ Expanded investment mandate to include
business parks and commercial
properties
3
Portfolio Value (S$ billion)

6
Note: S$ v alues, unless otherwise stated, are based on an exchange rate of A$1: S$0.9620, €1: S$1.5609 and £1:S$1.7282 as at 30 June 2020.
1. Based on GRI, being the contracted rental income and estimated recoverable outgoings for the month of June 2020 and includes the Transactions. Excludes straight lining rental adjustments and include committed leases.
2. S$ v alues are based on assumed exchange rates of A$1: S$0.9872 and £1: S$1.7969. 3. Based on Agreed Property Value, as reported in Slide 31 of this presentation.
Active Asset Management in 3QFY20
99 Sandstone Place, Parkinson,
Queensland (“Coles Parkinson”)
Strategic Divestment at Premium to Book Value
◆ 3 Aug 20: Announced divestment of
remaining 50% stake in the Cold
Storage Facility in Queensland at a
sale consideration of A$152.5 million
(~S$150.5 million)(2)
◆ 12.2% premium to the book value of
the property at A$135.9 million
(~S$134.2 million)(2) as at 30 June 20Cold Storage Facility, Queensland, Australia
Occupancy Rate
~97.3%High portfolio occupancy(1)
WALE
~5.1 yearsLong WALE(1)
Top-10 Tenant % of GRI
~23.3%Well-diversified
Acquisition of Two High-Quality Freehold Properties
◆ 12 Aug 20: Completed the acquisition of
two 100% occupied freehold properties,
comprising the IVE Facility in Australia
and 100% interest in Maxis in the UK, at
a total agreed property value of
approximately S$143.2 million(2)(3)
FY20 Upcoming Expiries
~1.0% of portfolio GRI
Minimal leases due for renewalNew Leases & Renewals
134,669 sqm
Representing 5.2% of lettable area
Maxis, Bracknell, UK
IVE Facility, Victoria, Australia

7
High-quality tenants with exposure to attractive sectors and limited concentration risk
Top 10 Portfolio Tenants(1) % of GRI WALE (Years)
Commonwealth of Australia 4.7% 5.0
Google Asia Pacific, Singapore 3.8% 4.5
Rio Tinto, Australia 2.5% 10.0
Commonwealth Bank of Australia 2.0% 2.5
Ceva Logistics, Australia 1.9% 5.0
BMW, Germany 1.9% 5.5
Schenker, Australia 1.7% 4.4
Techtronics Industries, Australia 1.7% 3.3
Fluor Limited, United Kingdom 1.6% 4.4
Mainfreight, The Netherlands 1.5% 5.7
Total:23.3%
Average:5.0 years
1. Based on GRI, being the contracted rental income and estimated recoverable outgoings for the month of June 2020 and includes the Transactions. Excludes straight lining rental adjustments and include committed leases. 2. Exclude vacancies and
includes the Transactions.
24.0%
17.0%
6.2%
4.1%
7.1%
7.8%
5.1%
4.5%
3.6%
3.0%
2.9%
2.6%
2.3%
2.2%
1.7%
0.8%
5.1%
3PL & Distribution
Consumer Products
Manufacturing
Automotives Manufacturing
Others (Logistics & Industrial)
IT Products & Services
Government and Government Linked
Insurance & Financial Services
Consultancy & Business Solutions
Mining & Resources
Engineering
Food and Beverage
Multimedia & Telecommunications
Service office/flexible space operators
Medical/Pharmaceuticals
Retail
Others (Business Space)
Business Space
Logistics & Industrial
Portfolio Tenant Sector Breakdown (1)(2)
c.31.4% of FLCT’s Logistics
& Industrial portfolio(1) is
involved in e-commerce/e-
fulfilment activities
Well-diversified tenant base with no single tenant accounting for more than 4.7% of portfolio GRI(1)
High-quality tenant base with majority of portfolio tenants comprising Government or related entities, MNCs, conglomerates and listed companies

8
Revenue
S$103.7 m▲ 91.9%
54.1
103.73QFY20
3QFY19
2QFY19
2QFY19
Total Gross Borrowings
S$2,308 mas at 30 June 2020
For the quarter ended 30 June 2020(1)
Aggregate Leverage
37.4%as at 30 June 2020
Interest Coverage Ratio(2)
6.7 times
Cost of Borrowings
2.1%as at 30 June 2020
Adjusted NPI
S$78.0 m▲ 77.0%
44.1
78.03QFY20
3QFY19
Distributable Income
S$61.1 m▲ 83.5%
2QFY19 33.3
61.13QFY20
3QFY19
2QFY19
1. FLCT has adopted S$ as its f unctional currency with effect from 15 April 2020 f ollowing its merger with FCOT. Prior period results were based on A$ translated at the 15 April 2020 exchange rate of A$1: S$0.9016 used for
conv ersion of the accounts to S$. 2. As defined in the Code on Collective Investment Schemes revised by the Monetary Authority of Singapore on 16 April 2020 and clarif ied on 29 May 2020 and computed as trailing 12
months EBITDA (excluding effects of any fair value changes of derivatives and investment properties, and foreign exchange translation), over trailing 12 months borrowing costs. Borrowing costs include effects of FRS 116.
2QFY19
NAV per unit
S$1.04▲ 13.0%
0.92
1.0430 Jun 20
30 Sep 19
Note: The Board of Directors of the Manager had prov ided a v oluntary one-off update on certain selected interim f inancial inf ormation of FLCT on a consolidated basis f or its third quarter f rom 1 April 2020 to 30 June
2020 (“3QFY20”), The Board believ es that such one-off update would be usef ul to the unitholders of FLCT giv en that this is the f irst f inancial quarter of FLCT as an enlarged REI T immediately af ter the merger of FLT
and Frasers Commercial Trust by way of a trust scheme of arrangement which became eff ectiv e on 15 April 2020. The f ollowing selected key unaudited interim f inancial inf ormation of FLCT f or 3QFY20 is on a
consolidated basis: Rev enue, Adjusted NPI, Distributable Income and NAV per unit.
Following this one-off update on FLCT’s selected f inancial inf ormation f or 3QFY20, the Manager will continue its half y early reporting as prev iously announced on 13 May 2020 and the next f inancial results
announcement will be f or the f ull-y ear ending 30 September 2020.

9
Key Credit Metrics as at 30 June 2020
Aggregate Leverage 37.4%
Total Gross Borrowings S$2,308 million
Cost of Borrowings 2.1%(1)
Average Weighted Debt Maturity 3.2 years
Interest Rate Exposure Fixed 55.3%
Interest Coverage Ratio 6.7 times(2)
Debt Headroom(3) S$1,552 million
1. Based on trailing 12 months borrowing cost (including FCOT f rom date of completion of merger). 2. As defined in the Code on Collective Investment Schemes revised by the Monetary Authority of Singapore on 16 April
2020 and clarif ied on 29 May 2020 and computed as trailing 12 months EBITDA (excluding effects of any fair value changes of derivatives and inv estment properties, and foreign exchange translation), over trailing 12 months
borrowing costs. Borrowing costs include effects of FRS 116. 3. Prior to reaching the 50.0% aggregate regulatory leverage limit. 4. The S$160 million borrowings due in 4QFY2020 refers to FCOT notes to be redeemed with
the exercise of delisting put options by noteholders. The affected bonds were redeemed on 9 Jul 2020, f inanced by new borrowings that are due in FY2021 and FY2022. 5. Management has put in place facilities to refinance
A$63 million and S$65 million of borrowings due in 4QFY2020 with new term loans. The remaining S$37 million outstanding will be ref inanced by the existing revolving credit facilities.
(3)
(3)
(5)
S$160m of borrowings refinanced to
FY2021 and FY2022 in July 2020(4)
Debt Maturity Profile as at 30 June 2020 (S$ million)
71 135 130
48 -109
-
28
177 20
60
560
65
101
65
110
50
248 2
19
150
160
80
80
166
502
230
127
610 572
101
4QFY2020 FY2021 FY2022 FY2023 FY2024 FY2025 >FY2026
A$ Debt € Debt S$ Debt £ Debt Bond Redemption Refinanced S$ Debt
10
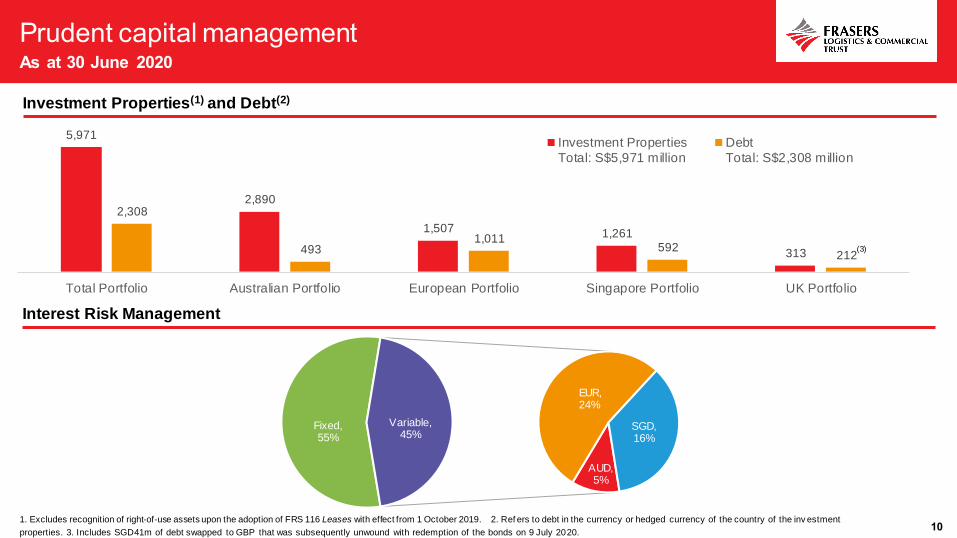
Fixed, 55%
AUD, 5%
EUR, 24%
SGD, 16%
Variable, 45%
5,971
2,890
1,507 1,261
313
2,308
4931,011
592212
Total Portfolio Australian Portfolio European Portfolio Singapore Portfolio UK Portfolio
Investment Properties
Total: S$5,971 million
Debt
Total: S$2,308 million
1. Excludes recognition of right-of-use assets upon the adoption of FRS 116 Leases with effect from 1 October 2019. 2. Ref ers to debt in the currency or hedged currency of the country of the inv estment
properties. 3. Includes SGD41m of debt swapped to GBP that was subsequently unwound with redemption of the bonds on 9 July 2020.
Investment Properties(1) and Debt(2)
Interest Risk Management
(3)

11
1. Based on FLCT’s closing price of S$1.35 per unit as at 28 August 2020 and by annualising FLCT’s distribution of 3.47 Singapore cents announced for the period from 1 October 2019 to 31 March 2020. 2. Source:
Bloomberg LLP (For the period f rom 21 June 2016 to 28 August 2020). Calculation of total return assumed the distributions paid during the period are reinvested. 3. Source: Monetary Authority of Singapore Daily SGS
Prices and interest rates of banks and finance companies (last accessed 28 August 2020).
Trading Performance since IPO (20 June 2016 – 28 August 2020)SGX Stock Code: BUOU
Bloomberg: FLT:SP
Reuters: FRAE.SI
IPO Issue Price: S$0.89
FLCT units rose by approximately 152% for the period from 20 Jun 16 to 28
Aug 20; outperforming the FTSE ST REIT Index Closing Price (28 Aug 20): $1.35
Stock Information (As at 28 August 2020)
Market capitalisation S$4.6 billion
Free float ~78%
1-year average daily traded volume ~9.6 million units
Annualised Distribution Yield(1) 5.1%
Annualised Total Return since IPO(2) 14.9%
Distribution Payment Semi-annual
5.1%
1.0%0.6% 0.5%
FLCTAnnualised Yield
10-yr SingaporeGovernment Bond
5-yr SingaporeGovernment Bond
12-month S$Fixed Deposit
(3) (3) (3)
50%
70%
90%
110%
130%
150%
Jun-16 Nov-16 Apr-17 Sep-17 Feb-18 Jul-18 Dec-18 May-19 Oct-19 Mar-20 Aug-20
FLCT
FTSE ST REIT

12
Industrial
Leadership
The industrial portfolio was named Global Sector Leader (Listed
Industrial) for the second consecutive year in the 2019 GRESB
Assessment(1)
Achieved overall score of 90 out of 100, which incorporates the industrial
portfolio spanning Australia, Germany and the Netherlands
Highest Rated
Industrial
Portfolio
Highest Green Star performance-rated industrial
portfolio in Australia(2)
Achieved an overall 4 Star Green Star rating as
assessed by the GBCA
First to achieve 6 Star Green Star ratings for
industrial facilities in each of New South Wales,
Victoria and Queensland
Strong
Commercial
Performance
The commercial portfolio ranked in the top three for commercial in the
Asia-Pacific in its inaugural GRESB Real Estate Assessment in 2019
Achieved overall score of 82 out of 100, which incorporates the commercial
portfolio spanning Australia, Singapore and the UK
Perf ormance rated
83.6%
Design and As-built
6.0%
Not rated10.4%
(3)
1. Refers to the 2018 and 2019 Real Estate Assessments by GRESB, the global ESG benchmark for real estate. 2. Portfolio Green Star ratings as at 30 September 2019. Green Star ratings are
aw arded by the Green Building Council of Australia (GBCA) which has assessed the Australian properties against nine key performance criteria – energy, water, transport, materials, indoor
environment quality management, land use and ecology, emissions and innovation. 3. Based on GLA.

13
Australia Singapore Europe & UK
Overview and GovernmentMeasures
The implementation of mitigation strategies since March 2020 is
seeing ongoing results with transmission rates remaining low across
most states. A three-stage re-opening plan was initiated by the
government in May 2020. In July 2020, the state of Victoria
experienced a resurgence in cases, with the government introducing
a six-week partial lockdown to contain transmissions.
SME Commercial Leasing Principles(1):
For qualifying tenants, landlords provide a proportionate
reduction in rent in the form of waivers and deferrals based on
the reduction in the tenant’s trade during the crisis and
subsequent recovery period
Rental waivers must constitute no less than 50% of the total
reduction in rent with 50% of deferrals amortised over the
balance of the lease term for a period of no lessthan 24 months
Overview and GovernmentMeasures
A ‘circuit breaker’ period was implemented in early April 2020 to control the
pandemic’s spread and with community transmissions remaining low,
authorities have implemented a three-phased re-opening from early June
2020.
COVID-19 (Temporary Measures) Act 2020 (2):
Property tax rebate for non-residential properties
Rental Relief Framework for qualifying SMEs (3):
SME tenants at office/industrial and retail premises with turnover of up to
S$100 million in 2019 will be entitled to Government-funded cash grants
of 0.64 month and 0.8 month of Base Rent respectively. This is in addition
to the previously announced cash grants of 0.36 month and 1.2 month of
Base Rent. The qualifying tenants will be determined by the government
and notified to landlords. The Act also compels the Landlord to provide an
addition of up to 1 month and 2 months of Base Rent to qualifying
office/industrial and retail SME tenants respectively
Overview and GovernmentMeasures
The pandemic has gradually come under
control in Germany, the Netherlands and UK,
with European countries progressively relaxing
travel restrictions.
Germany has implemented a prohibition
on landlords from forfeiting leases for the
period to 30 June 2020 due to the non-
payment of rent by tenants
The UK has implemented similar
measures on landlords until 30 September
2020
Portfolio Impact - Minimal
Limited impact on the industrial and commercial properties, with
eligible SMEs representing a small proportion of FLCT’s
Australian portfolio
Expects near- to mid-term impact on the retail components of the
Australian portfolio
Portfolio Impact – Mainly on retail components
Fully passing on any property tax rebate and rental reliefs, as applicable,
to eligible tenants
Expects near- to mid-term impact on the retail components of the
Singapore portfolio
Portfolio Impact - Minimal
Limited impact on the German and Dutch
industrial portfolio
The UK business park is seeing stable
performance
To-date the FLCT portfolio has not been materially impacted by the COVID-19 pandemic. How ever, the situation remains dynamic w ith ongoing uncertainty as to the impact it may have
on the countries FLCT has a presence in
The REIT Manager is focused on managing any f inancial implications arising from COVID-19 and w ill continue to w ork closely with FLCT’s customers to overcome this trying period
together
The Covid-19 impact on FLCT’s distributable income in the year-to-date to June 2020, w hich includes mainly rental w aiver granted and provisions for rental w aiver for qualifying SME tenants w as approximately S$1.4 million
1. National Cabinet Mandatory Code of Conduct, 3 April 2020 2. COVID-19 (Temporary Measures) Act 2020, 16 July 2020 3. Rental Relief Framework for SMEs
14
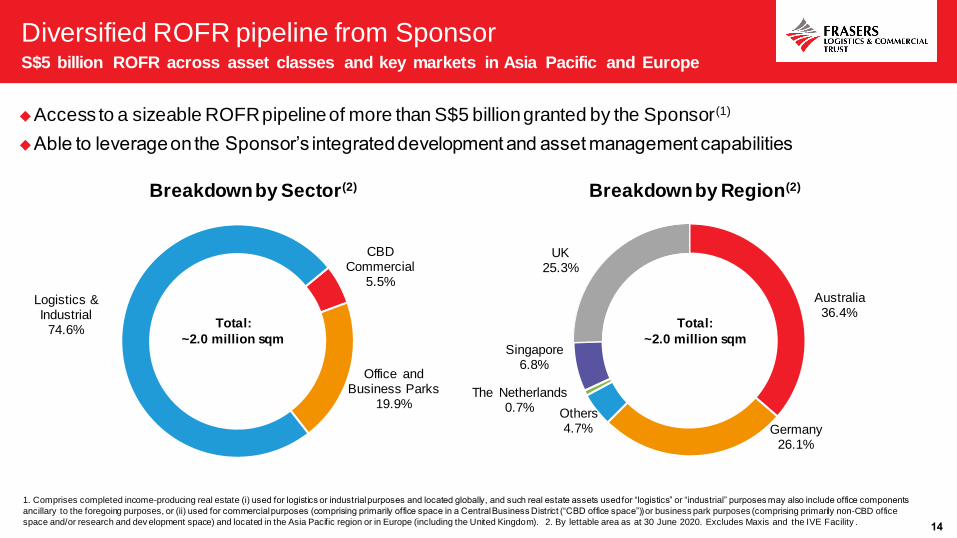
Breakdown by Sector(2) Breakdown by Region(2)
CBD Commercial
5.5%
Office and Business Parks
19.9%
Logistics & Industrial
74.6%
Australia36.4%
Germany26.1%
Others4.7%
The Netherlands0.7%
Singapore6.8%
UK25.3%
Total:
~2.0 million sqm
Total:
~2.0 million sqm
Diversified ROFR pipeline from SponsorS$5 billion ROFR across asset classes and key markets in Asia Pacific and Europe
◆Access to a sizeable ROFR pipeline of more than S$5 billion granted by the Sponsor(1)
◆Able to leverage on the Sponsor’s integrated development and asset management capabilities
1. Comprises completed income-producing real estate (i) used for logistics or industrial purposes and located globally, and such real estate assets used for “logistics” or “industrial” purposes may also include office components
ancillary to the foregoing purposes, or (ii) used for commercial purposes (comprising primarily office space in a Central Business District (“CBD office space”)) or business park purposes (comprising primarily non-CBD office
space and/or research and dev elopment space) and located in the Asia Pacific region or in Europe (including the United Kingdom). 2. By lettable area as at 30 June 2020. Excludes Maxis and the IVE Facility .
15
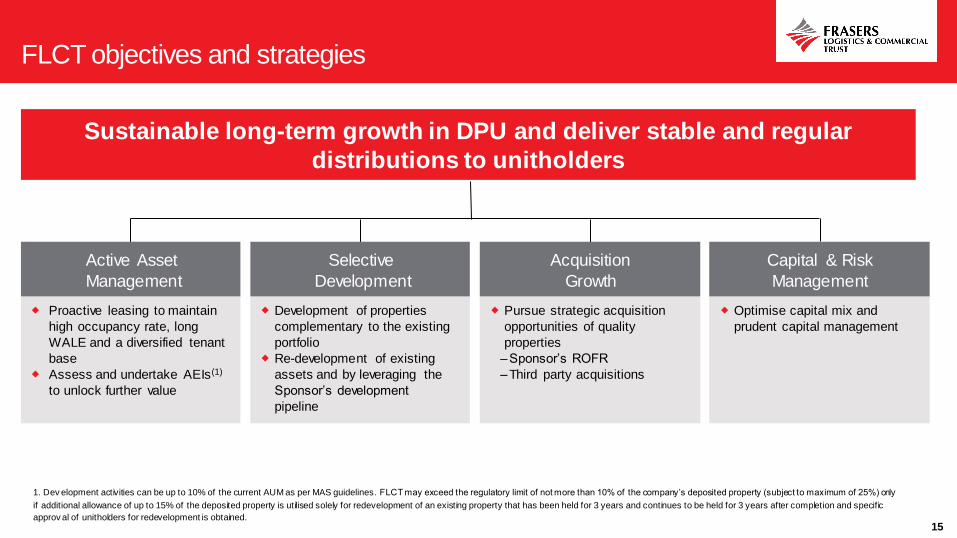
FLCT objectives and strategies
Sustainable long-term growth in DPU and deliver stable and regular
distributions to unitholders
Active Asset
Management
Proactive leasing to maintain
high occupancy rate, long
WALE and a diversified tenant
base
Assess and undertake AEIs(1)
to unlock further value
Selective
Development
Development of properties
complementary to the existing
portfolio
Re-development of existing
assets and by leveraging the
Sponsor’s development
pipeline
Acquisition
Growth
Pursue strategic acquisition
opportunities of quality
properties
–Sponsor’s ROFR
–Third party acquisitions
Capital & Risk
Management
Optimise capital mix and
prudent capital management
1. Dev elopment activities can be up to 10% of the current AUM as per MAS guidelines. FLCT may exceed the regulatory limit of not more than 10% of the company’s deposited property (subject to maximum of 25%) only
if additional allowance of up to 15% of the deposited property is utilised solely for redevelopment of an existing property that has been held for 3 years and continues to be held for 3 years after completion and specific
approv al of unitholders for redevelopment is obtained.
Market Information
Section Divider To add a background, press Insert > Pictures > Picture from File > Send to back
Alexandra Technopark, Singapore
17
$115
$94
$144
$80
$90
$100
$110
$120
$130
$140
$150
Q2 2016 Q2 2017 Q2 2018 Q2 2019 Q2 2020
Brisbane Melbourne Sydney
(+2.8% y-o-y)
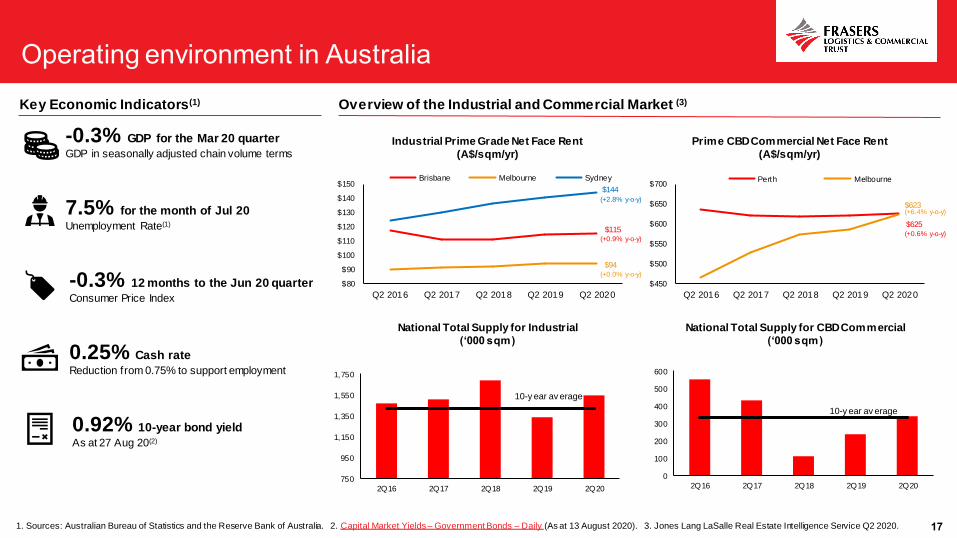
1. Sources: Australian Bureau of Statistics and the Reserve Bank of Australia. 2. Capital Market Yields – Government Bonds – Daily (As at 13 August 2020). 3. Jones Lang LaSalle Real Estate Intelligence Service Q2 2020.
Key Economic Indicators(1)
-0.3% GDP for the Mar 20 quarter
GDP in seasonally adjusted chain volume terms
7.5% for the month of Jul 20
Unemployment Rate(1)
-0.3% 12 months to the Jun 20 quarter
Consumer Price Index
0.25% Cash rate
Reduction from 0.75% to support employment
0.92% 10-year bond yield
As at 27 Aug 20(2)
Overview of the Industrial and Commercial Market (3)
750
950
1,150
1,350
1,550
1,750
2Q16 2Q17 2Q18 2Q19 2Q20
Industrial Prime Grade Net Face Rent
(A$/sqm/yr)
10-y ear av erage
National Total Supply for Industrial
(‘000 sqm)
Prime CBD Commercial Net Face Rent
(A$/sqm/yr)
National Total Supply for CBD Commercial
(‘000 sqm)
$625
$623
$450
$500
$550
$600
$650
$700
Q2 2016 Q2 2017 Q2 2018 Q2 2019 Q2 2020
Perth Melbourne
0
100
200
300
400
500
600
2Q16 2Q17 2Q18 2Q19 2Q20
10-y ear av erage
(+0.9% y-o-y)
(+0.0% y-o-y)
(+6.4% y-o-y)
(+0.6% y-o-y)
181. Source: Destatisches Bundesamt (Federal Statistics Office of Germany). 2. Source: https://www.euribor-rates.eu/en/current-euribor-rates/ (As at 18 August 2020). 3. Source: BNP Paribas Real Estate Q2 2020.
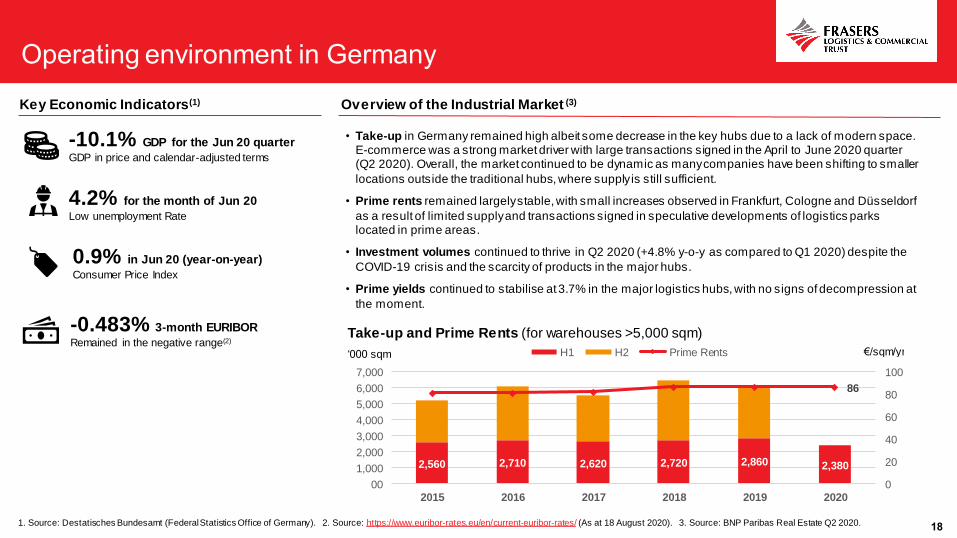
-10.1% GDP for the Jun 20 quarter
GDP in price and calendar-adjusted terms
4.2% for the month of Jun 20
Low unemployment Rate
0.9% in Jun 20 (year-on-year)
Consumer Price Index
• Take-up in Germany remained high albeit some decrease in the key hubs due to a lack of modern space. E-commerce was a strong market driver with large transactions signed in the April to June 2020 quarter (Q2 2020). Overall, the market continued to be dynamic as many companies have been shifting to smaller
locations outside the traditional hubs, where supply is still sufficient.
• Prime rents remained largely stable, with small increases observed in Frankfurt, Cologne and Düsseldorf
as a result of limited supply and transactions signed in speculative developments of logistics parks located in prime areas.
• Investment volumes continued to thrive in Q2 2020 (+4.8% y-o-y as compared to Q1 2020) despite the
COVID-19 crisis and the scarcity of products in the major hubs.
• Prime yields continued to stabilise at 3.7% in the major logistics hubs, with no signs of decompression at
the moment.
Overview of the Industrial Market (3)
-0.483% 3-month EURIBOR
Remained in the negative range(2)Take-up and Prime Rents (for warehouses >5,000 sqm)
2,560 2,710 2,620 2,720 2,860 2,380
86
0
20
40
60
80
100
00
1,000
2,000
3,000
4,000
5,000
6,000
7,000
2015 2016 2017 2018 2019 2020
H1 H2 Prime Rents €/sqm/yr‘000 sqm
Key Economic Indicators(1)

19
1. Sources: Singstat, Ministry of Trade and Industry Singapore. 2.Source: MAS SGS. 3. Source: CBRE, Singapore Market View, Q2 2020. 4. Alexandra Technopark is a high-specification B1 industrial development located at the
city -fringe, with certain physical attributes similar to business parks. Due to limited availability of market research informat ion directly relating to the asset class of Alexandra Technopark, market research information for business parks
is prov ided f or indicative reference.
-13.2% GDP for the June 20 quarter
Year-on-year GDP change
2.9% in June 20
Low unemployment Rate
-0.4% year-on-year in Jul 20
All-items Consumer Price Index
0.0959% on 28 Aug 20
Singapore Overnight Rate Average
Overview of the Singapore Office and Business Park Markets (3)
1.01% 10-year bond yield
As at 28 Aug 20(2)
Office Supply-Demand Dynamics
Net supply Net absorption Vacancy rate (RHA)
mil
sf m
il sf
Business Park Supply-Demand Dynamics
Grade A and Grade B Office Rents
(S$ psf per month)Business Park Rents(4)
(S$ psf per month)
Net supply Net absorption Vacancy rate (RHA)
9.50 8.9510.10
11.30 11.15
7.25 6.85 7.257.95 7.85
$2.0
$4.0
$6.0
$8.0
$10.0
$12.0
$14.0
2016Q2 2017Q2 2018Q2 2019Q2 2020Q2
Grade A Grade B Islandwide
5.50 5.50 5.70 5.80 5.85
3.70 3.70 3.75 3.80 3.75
$2.5
$3.5
$4.5
$5.5
$6.5
2016Q2 2017Q2 2018Q2 2019Q2 2020Q2
Business Park (City Fringe)
Business Park (Rest of the Island)
Key Economic Indicators(1)
201. Source: CBS (Statistics Netherlands).2. Source: https://www.euribor-rates.eu/en/current-euribor-rates/ (As at 26 August 2020). 3. Source: BNP Paribas Real Estate Q2 2020.
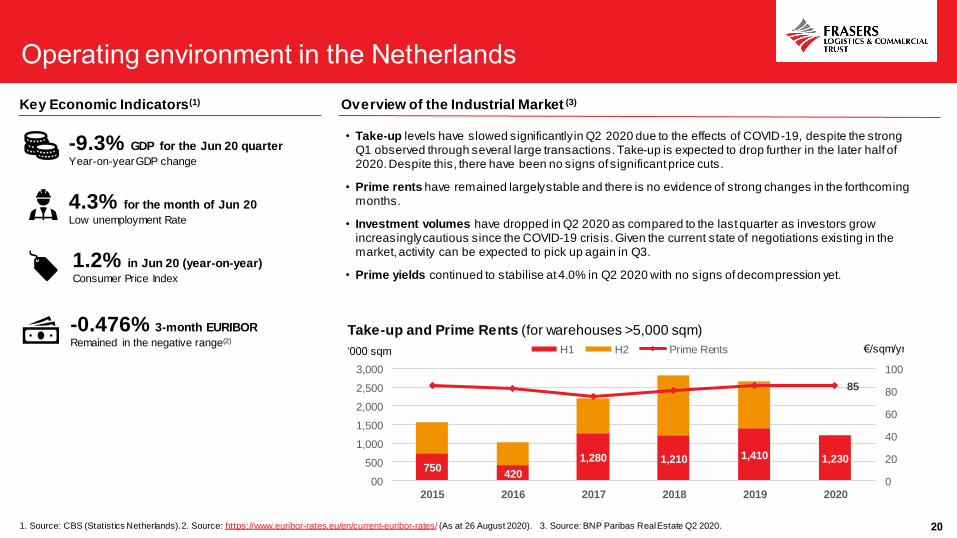
-9.3% GDP for the Jun 20 quarter
Year-on-year GDP change
4.3% for the month of Jun 20
Low unemployment Rate
1.2% in Jun 20 (year-on-year)
Consumer Price Index
Overview of the Industrial Market (3)
Take-up and Prime Rents (for warehouses >5,000 sqm)
• Take-up levels have slowed significantly in Q2 2020 due to the effects of COVID-19, despite the strong Q1 observed through several large transactions. Take-up is expected to drop further in the later half of 2020. Despite this, there have been no signs of significant price cuts.
• Prime rents have remained largely stable and there is no evidence of strong changes in the forthcoming months.
• Investment volumes have dropped in Q2 2020 as compared to the last quarter as investors grow increasingly cautious since the COVID-19 crisis. Given the current state of negotiations existing in the market, activity can be expected to pick up again in Q3.
• Prime yields continued to stabilise at 4.0% in Q2 2020 with no signs of decompression yet.
750420
1,280 1,210 1,410 1,230
85
0
20
40
60
80
100
00
500
1,000
1,500
2,000
2,500
3,000
2015 2016 2017 2018 2019 2020
H1 H2 Prime Rents €/sqm/yr‘000 sqm
-0.476% 3-month EURIBOR
Remained in the negative range(2)
Key Economic Indicators(1)
211. Source: Of fice for National Statistics. 2. Source: BNP Paribas Real Estate UK South East Offices Review Q2 2020.
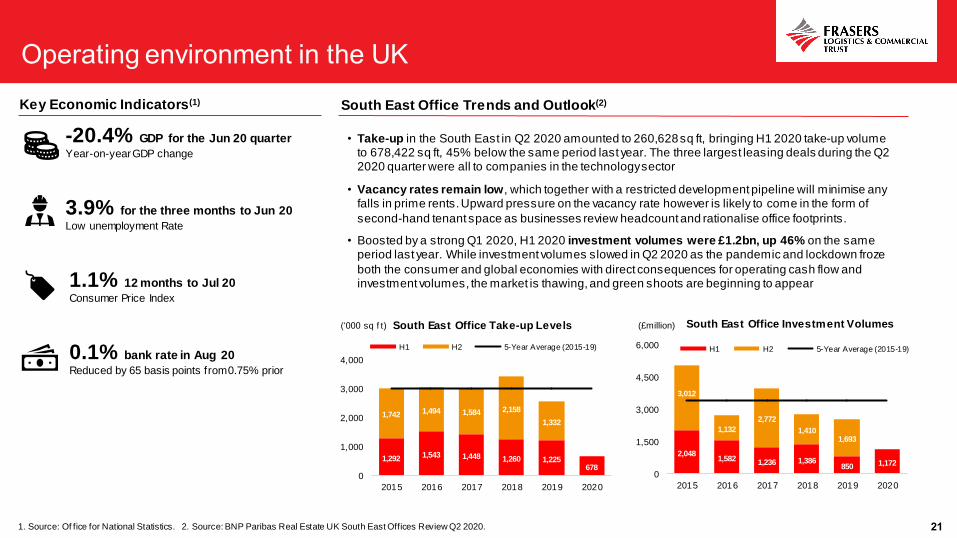
-20.4% GDP for the Jun 20 quarter
Year-on-year GDP change
3.9% for the three months to Jun 20
Low unemployment Rate
1.1% 12 months to Jul 20
Consumer Price Index
0.1% bank rate in Aug 20
Reduced by 65 basis points from 0.75% prior
South East Office Trends and Outlook(2)
• Take-up in the South East in Q2 2020 amounted to 260,628 sq ft, bringing H1 2020 take-up volume to 678,422 sq ft, 45% below the same period last year. The three largest leasing deals during the Q2 2020 quarter were all to companies in the technology sector
• Vacancy rates remain low, which together with a restricted development pipeline will minimise any falls in prime rents. Upward pressure on the vacancy rate however is likely to come in the form of
second-hand tenant space as businesses review headcount and rationalise office footprints.
• Boosted by a strong Q1 2020, H1 2020 investment volumes were £1.2bn, up 46% on the same period last year. While investment volumes slowed in Q2 2020 as the pandemic and lockdown froze
both the consumer and global economies with direct consequences for operating cash flow and investment volumes, the market is thawing, and green shoots are beginning to appear
2,0481,582 1,236 1,386
850 1,172
3,012
1,132
2,772
1,4101,693
0
1,500
3,000
4,500
6,000
2015 2016 2017 2018 2019 2020
(£million) South East Office Investment Volumes
H1 H2 5-Year Average (2015-19)
1,292 1,543 1,448 1,260 1,225678
1,742 1,494 1,584 2,158
1,332
0
1,000
2,000
3,000
4,000
2015 2016 2017 2018 2019 2020
(‘000 sq f t) South East Office Take-up Levels
H1 H2 5-Year Average (2015-19)
Key Economic Indicators(1)

Appendix: 3QFY20
Portfolio Information
Section Divider To add a background, press Insert > Pictures > Picture from File > Send to back
Farnborough Business Park, United Kingdom

24
For the avoidance of doubt, the contents in the appendix section excludes the two new properties acquired on 12 August 2020 and includes the Sale Property.1. Includes a 50% interest in the property at 99 Sandstone Place, Parkinson, Queensland, Australia. 2. Book value as at 30 June 2020. 3. Based on GRI, being the contracted rental income and estimated recoverable outgoings for the month of June 2020.
Excludes straight lining rental adjustments and include committed leases.
A$6.0bPortfolio Value (2)
99Properties
5.2 yearsWALE(3)
97.2%Occupancy Rate
A flagship logistics and commercial portfolioStrategically diversified in five major developed markets
As at 30 June 2020Logistics &
Industrial Portfolio
Commercial
PortfolioOverall Portfolio
No. of Properties 93(1) 6 99
Portfolio Value (S$ million)(2) 3,529.2 2,442.2 5,971.4
Lettable Area (sqm) 2,258,875 322,043 2,580,918
WALE(3) 5.9 years 4.2 years 5.2 years
WALB(3) 5.9 years 3.9 years 5.1 years
Occupancy Rate(3) 99.8% 93.6% 97.2%
Portfolio Value by Geography(2)
Logistics & Industrial, 59.1%
Office & Business Parks, 19.4%
CBD Commercial, 21.5%
Portfolio Value by Type(2)
Australia, 48.4%
Germany , 20.7%
Singapore, 21.1%
UK, 5.2%
The Netherlands, 4.6%

25
1. Includes a 50% interest in the property at 99 Sandstone Place, Parkinson, Queensland, Australia. 2. Book value as at 30 June 2020. 3. Based on GRI, being the contracted rental income and estimated recoverable outgoings for the month of June 2020. Excludes straight lining rental adjustments and include committed leases. 4. Refers to the 2018 and 2019 Real Estate Assessments by
GRESB, the global ESG benchmark for real estate. 5. 95.9% of the leases have either CPI-linked indexation or fixed escalations.
Prime & modern logistics & industrial portfolio Long WALE, high occupancy and predominantly freehold assets
As at 30 June 2020 Australia Europe Total
No. of Properties 62(1) 31 93
Portfolio Value (S$ million)(2) 2,021.3 1,507.9 3,529.2
Lettable Area (sqm) 1,377,594 881,281 2,258,875
Average Age by Value 8.2 years 8.1 years 8.2 years
WALE(3) 5.3 years 7.1 years 5.9 years
WALB(3) 5.2 years 7.1 years 5.9 years
Occupancy Rate(3) 99.7% 100.0% 99.8%
Average Annual Rental Increment 3.1% Fixed/CPI-linked(5) N.M.
Freehold, 81.5% >75 Years
Leasehold, 11.8%
Other Leasehold,
6.7%
Land Tenureby Value(2)
Leadership in Sustainability
Global Sector Leader (Listed Industrial) for the
second consecutive year in the annual
GRESB Assessment(4)
(13)
(16)
(1)
(3)
(29)
Dutch Properties (5)
German Properties (26)
Australia
Germany &
the Netherlands

261. Book value as at 30 June 2020. 2. Based on 50% interest in the property. 3. Based on GRI, being the contracted rental income and estimated recoverable outgoings for the month of June 2020. Excludes straight lining rental adjustments and include committed leases.
Quality & well-located commercial portfolioHealthy WALE, occupancy and fixed rental increments
Cross Street
Exchange
357 Collins
Street
Central
Park
Caroline
Chisholm
Centre
Alexandra
Technopark
Farnborough
Business
Park
As at 30 June 2020 CBD Commercial Office and Business Parks
Country SingaporeMelbourne,
Australia
Perth,
Australia
Canberra,
AustraliaSingapore
United
Kingdom
Ownership 100.0% 100.0% 50.0% 100.0% 100.0% 100.0%
Property Value
(S$ million)(1)652.6 320.1 313.8(2) 235.4 607.7 312.5
Lettable Area (sqm) 36,495 31,965 66,225 40,244 96,107 51,006
WALE(3) 3.0 years 3.0 years 6.2 years 5.0 years 3.1 years 6.1 years
WALB(3) 3.0 years 3.0 years 6.2 years 5.0 years 2.9 years 4.6 years
Occupancy Rate(3) 89.5% 95.4% 83.5% 100.0% 95.5% 99.5%
Singapore, 51.6%
Australia, 35.6%
UK, 12.8%
Breakdown by Geography(1)
Office & Business
Parks, 47.3%
CBD Commercial, 52.7%
Breakdown by Sector(1)

27
High portfolio occupancy
99.7% 100.0%
89.5%
95.5%
83.5%
100.0%
95.4%99.5%100.0% 100.0%
90.5%
97.3%
83.5%
100.0%
95.4%98.8%
Australia Europe Cross Street
Exchange
Alexandra
Technopark
Central Park Caroline Chisholm
Centre
357 Colins Street Farnborough
Business Park
Portfolio Occupancy of 97.2%(1) as at 30 June 2020
30-Jun-20 31-Mar-20Logistics & Industrial:
99.8% Occupancy
Commercial:
93.6% Occupancy
1. Based on GRI and includes committed leases.

28
0.1% 3.9%
7.2% 7.0% 6.4%5.2%
6.5%
4.4% 4.7%
13.2%
2.7%
1.0%
4.2%
5.0%
7.7%
3.5%
10.3%
0.5%
0.3%1.9%
4.3%
Vacant Sep-20 Sep-21 Sep-22 Sep-23 Sep-24 Sep-25 Sep-26 Sep-27 Sep-28 Sep 2029 and
beyond
Portfolio Lease Expiry Profile as at 30 June 2020 (1)
Industrial
Commercial
Minimal near-term lease expiries
Well-spread out lease expiry profile with only 1.0% of
GRI due for renewal in FY2020
2.8%
1.0%
8.1%
12.2%
14.7%
9.9%
15.5%
7.0%
4.7%
6.6%
17.5%
1. Based on GRI, being the contracted rental income and estimated recoverable outgoings for the month of June 2020. Excludes straight lining rental adjustments and include committed leases.

29Portfolio Metrics – Leasing Activity and Reversion
Active management with 134,669 sqm of deals completed in 3QFY20
Industrial Leasing Summary Lease Type TenantLettable
Area (sqm)Lease Term Lease Expiry
Annual
IncrementReversion(1)
77 Atlantic Drive, Victoria Renewed Miele 15,095 5.0 years August 2027 3.0% -7.5%
150-168 Atlantic Drive, Victoria Renewed ESR Group 16,065 1.5 years March 2023 3.0% -12.1%
21 Kangaroo Avenue, Victoria Renewed TTI 41,401 1.0 year July 2023 N.A. +2.7%
49-75 Pacific Drive, Victoria Renewed Horizon 25,163 5.0 years Dec 2026 3.0% -3.5%
1-27 Sunline Drive, Victoria Renewed Freight 12,021 1.0 year April 2023 N.A. -6.6%
10 Stanton Road, New South Wales Renewed CSR 7,065 5.0 years August 2026 3.0% -19.6%
20-22 Butler Boulevard, South Australia Renewed TNT 5,607 1.5 years March 2022 3.5% +2.9%
Koperstraße 10, Germany Renewed Roman Mayer 5,676 2.2 years June 2025 CPI -1.6%
Total: 128,093 Average Reversion: -3.9%
1. Calculated based on the signing gross rent (excluding any contracted fixed annual rental step-ups) of the new/renewed lease divided by the preceding terminating gross rent of each new/renewed lease (weighted by gross rent) of existing space.
Commercial Leasing Summary No. of LeasesLettable
Area (sqm)Average Lease Term Reversion(1)
Singapore 10 5,828 2.8 years +12.1%
Australia 1 383 5.0 years -8.0%
United Kingdom 2 365 3.0 years +12.8%
Total: 6,576 Average Reversion: +10.6%

Appendix:
Recent Acquisitions and Divestment
Section Divider To add a background, press Insert > Pictures > Picture from File > Send to back
M axis Business Park, Bracknell, UK
31
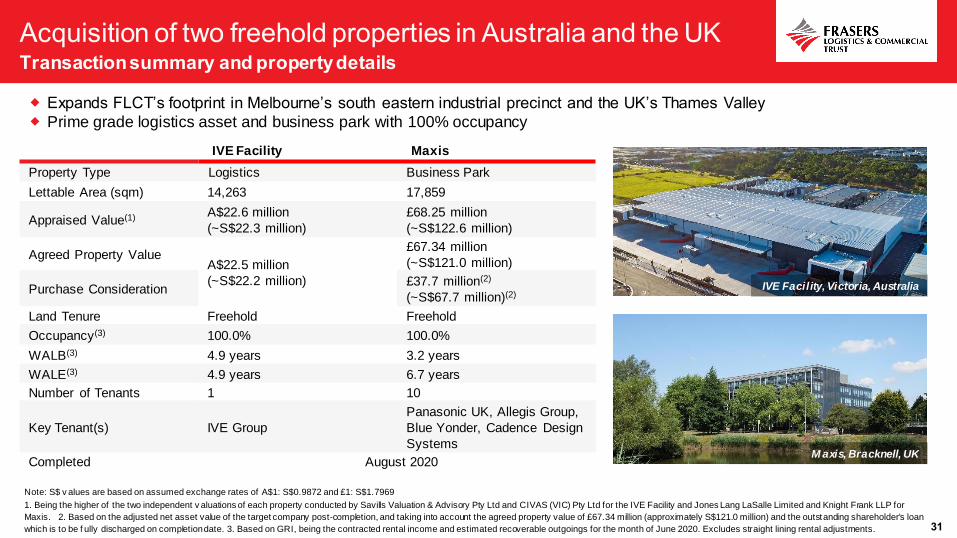
Note: S$ v alues are based on assumed exchange rates of A$1: S$0.9872 and £1: S$1.7969
1. Being the higher of the two independent v aluations of each property conducted by Savills Valuation & Advisory Pty Ltd and CIVAS (VIC) Pty Ltd for the IVE Facility and Jones Lang LaSalle Limited and Knight Frank LLP for
Maxis. 2. Based on the adjusted net asset value of the target company post-completion, and taking into account the agreed property value of £67.34 million (approximately S$121.0 million) and the outstanding shareholder's loan
which is to be f ully discharged on completion date. 3. Based on GRI, being the contracted rental income and estimated recoverable outgoings for the month of June 2020. Excludes straight lining rental adjustments.
M axis, Bracknell, UK
Expands FLCT’s footprint in Melbourne’s south eastern industrial precinct and the UK’s Thames Valley
Prime grade logistics asset and business park with 100% occupancy
IVE Facility Maxis
Property Type Logistics Business Park
Lettable Area (sqm) 14,263 17,859
Appraised Value(1) A$22.6 million
(~S$22.3 million)
£68.25 million
(~S$122.6 million)
Agreed Property ValueA$22.5 million
(~S$22.2 million)
£67.34 million
(~S$121.0 million)
Purchase Consideration£37.7 million(2)
(~S$67.7 million)(2)
Land Tenure Freehold Freehold
Occupancy(3) 100.0% 100.0%
WALB(3) 4.9 years 3.2 years
WALE(3) 4.9 years 6.7 years
Number of Tenants 1 10
Key Tenant(s) IVE Group
Panasonic UK, Allegis Group,
Blue Yonder, Cadence Design
Systems
Completed August 2020
IVE Facility, Victoria, Australia

32
Divestment of remaining 50% interest in a Cold Storage Facility
Disposal of single largest facility in FLCT’s logistics portfolio, ~1.9% of total portfolio GRI as at 30 June 2020
Sale consideration is 13.6% higher than the sale of A$134.2 million (~S$132.5 million) for the initial 50% interest (1)
ColesFacility, Queensland, Australia
Note: S$ v alues are based on an assumed exchange rate of A$1: S$0.9872
1. Sale of the initial 50% interest in the Cold Storage Facility was completed on 24 July 2019. 2. As at 30 June 2020
Sale Property
Sale ConsiderationA$152.5 million
(~S$150.5 million)
Book Value(2) A$135.9 million
(~S$134.2 million)
Premium to Book Value 12.2%
Target Completion By December 2020

Appendix: Other Key Market Information
Section Divider To add a background, press Insert > Pictures > Picture from File > Send to back
Transgourmet Facility, Ulm, Germany
34
Sources: Jones Lang LaSalle Real Estate Intelligence Service – Sy dney Industrial Final Data 2Q20; Jones Lang LaSalle Real Estate Intelligence Service – Sy dney Industrial Snapshot 2Q20; Jones Lang LaSalle Real Estate Data
Solution – Sy dney Construction Projects from Q3 2010 to 2Q20; Knight Frank Research – Sy dney Industrial Vacancy Q1 April 2020.
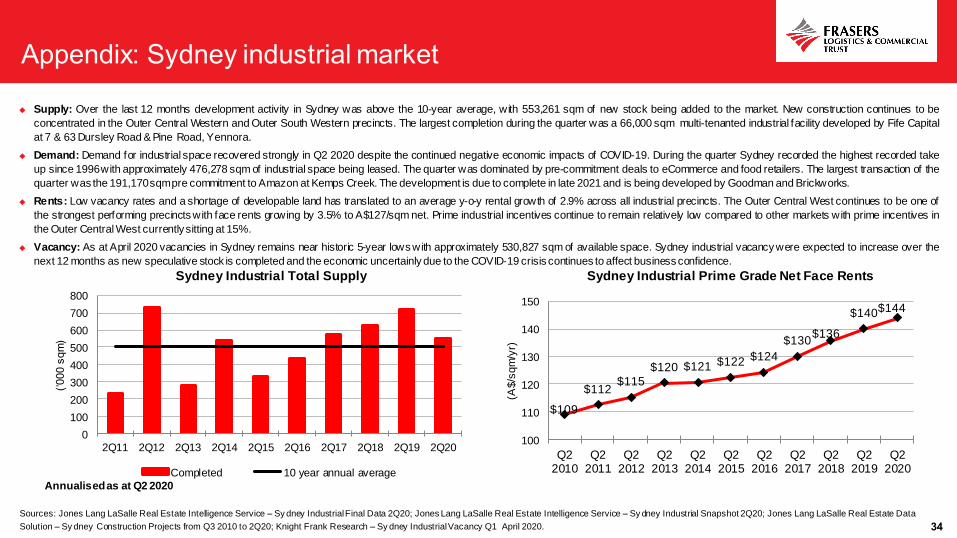
Sydney Industrial Total Supply Sydney Industrial Prime Grade Net Face Rents
◆ Supply: Over the last 12 months development activity in Sydney was above the 10-year average, with 553,261 sqm of new stock being added to the market. New construction continues to be
concentrated in the Outer Central Western and Outer South Western precincts. The largest completion during the quarter was a 66,000 sqm multi-tenanted industrial facility developed by Fife Capital
at 7 & 63 Dursley Road & Pine Road, Yennora.
◆ Demand: Demand for industrial space recovered strongly in Q2 2020 despite the continued negative economic impacts of COVID-19. During the quarter Sydney recorded the highest recorded take
up since 1996with approximately 476,278 sqm of industrial space being leased. The quarter was dominated by pre-commitment deals to eCommerce and food retailers. The largest transaction of the
quarter was the 191,170sqmpre commitment to Amazon at Kemps Creek. The development is due to complete in late 2021 and is being developed by Goodman and Brickworks.
◆ Rents: Low vacancy rates and a shortage of developable land has translated to an average y-o-y rental growth of 2.9% across all industrial precincts. The Outer Central West continues to be one of
the strongest performing precinctswith face rents growing by 3.5% to A$127/sqm net. Prime industrial incentives continue to remain relatively low compared to other markets with prime incentives in
the Outer Central West currentlysitting at 15%.
◆ Vacancy: As at April 2020 vacancies in Sydney remains near historic 5-year lows with approximately 530,827 sqm of available space. Sydney industrial vacancy were expected to increase over the
next 12 months as new speculative stock is completed and the economic uncertainly due to the COVID-19 crisis continues to affect business confidence.
$109
$112$115
$120 $121 $122 $124
$130$136
$140$144
100
110
120
130
140
150
Q22010
Q22011
Q22012
Q22013
Q22014
Q22015
Q22016
Q22017
Q22018
Q22019
Q22020
(A$/s
qm
/yr)
0
100
200
300
400
500
600
700
800
2Q11 2Q12 2Q13 2Q14 2Q15 2Q16 2Q17 2Q18 2Q19 2Q20
(‘000 s
qm
)
Annualised as at Q2 2020
Completed 10 year annual average

35Sources: Jones Lang LaSalle Real Estate Intelligence Service – Melbourne Industrial Final Data 2Q20; Jones Lang LaSalle Real Estate Intelligence Service – Melbourne Industrial Snapshot 2Q20; Jones Lang LaSalle Real
Estate Data Solution – Melbourne Construction Projects from Q3 2010 to 2Q20; Knight Frank Research – Melbourne Industrial April 2020.
Melbourne Industrial Total Supply Melbourne Industrial Prime Grade Net Face Rents
◆ Supply: Over the last 12 months development activity in Melbourne was above the 10-year average, with 441,969 sqm of new stock being added to the market. In Q2 2020 approximately 75% of
new industrial supply wascompleted in the Western Precinctwith the remaining 25% being completed in the North. The largest completion during the quarter was the Amart furniture distribution centre
at 148-248 Leakes Road Truganina.
◆ Demand: Tenant demand in Melbourne covered strongly in 2Q2020 with take-up of 293,431 sqm being recorded. Over the 12 months to 30 June 2020 there was approximately 1,094,662 sqm of
gross take up in Melbourne the highest of any Australian industrial market. The largest transaction of the quarter was a 40,000 sqm pre-commit to Coles at MidWest Logistics Hub, 500 Dohertys
Road, Truganina.
◆ Rents: High levels of development activity and the addition of new supply has softened the average y-o-y rental growth in Melbourne. Industrial face rents Melbourne increased by an average of 0.6%
across all precincts. The South East continues to be the strongest performing precinct with face rents increasing 1.9% to A$93/sqm net over the previous 12 months. Incentives in South East have
also remained stable at around 23%.
◆ Vacancy: Despite the COVID-19 crisis Melbourne vacancy rates declined by 10% as tenant demand for industrial space remains strong. As at April 2020 there was approximately 688,409 sqm of
available industrial space in Melbourne.
$83
$84$85
$88 $88 $89$90
$91 $92
$94 $94
80
85
90
95
100
Q22010
Q22011
Q22012
Q22013
Q22014
Q22015
Q22016
Q22017
Q22018
Q22019
Q22020
(A$/s
qm
/yr)
0
100
200
300
400
500
600
700
800
2Q11 2Q12 2Q13 2Q14 2Q15 2Q16 2Q17 2Q18 2Q19 2Q20
(‘000 s
qm
)
Annualised as at Q2 2020
Completed 10 year annual average

36
Sources: Jones Lang LaSalle Real Estate Intelligence Service – Brisbane Industrial Final Data 2Q20; Jones Lang LaSalle Real Estate Intelligence Service – Brisbane Industrial Snapshot 2Q20; Jones Lang LaSalle Real Estate Data
Solution – Brisbane Construction Projects from Q3 2010 to 2Q20; Knight Frank Research – Brisbane Industrial Vacancy April 2020.
Brisbane Industrial Total Supply Brisbane Industrial Prime Grade Net Face Rents
◆ Supply: Over the last 12 months development activity in Brisbane remains below the 10-year average, with 269,212 sqm of new stock being added to the market. New construction continues to be
concentrated in the Southern precinct. The largest completion during the quarterwas the 39,463 sqm Rheinmetall Defence Australia Headquarters at Redbank. There are currently 15 projects under
constructionin Brisbane which will provide approximately 357,589sqmof new stock in the next 12 months.
◆ Demand: Tenant demand for industrial space has also remains subdued with Brisbane recording take-up of 101,997 sqm in Q2 2020. Over the 12 months to 30 June 2020 occupier demand in
Brisbane has exceeded the historic 10-year average with 506,693 sqm of gross take up being recorded. The largest transaction of the quarter was the pre-lease to Amazon at 42-52 Export Street,
Lytton. The property is to consistof a 21,388 sqmfulfilment centrewhich is being developedby Goodman.
◆ Rents: The lack of new supply and reduction of vacancies has translated to an average y-o-y rental growth of 1.2% across all precincts. The Southern industrial precinct has experienced minimal
rental growth with average rent remaining stable at A$110/sqm net. Incentives in Brisbane South while higher compared to other industrial markets have remained stable at 20% for prime industrial
assets.
◆ Vacancy: Vacancies levels in Brisbane have continued to decline due to the lack of new supply and continued tenant demand. As at April 2020 the level of available industrial space is approximately
445,019 sqmwhich is 7% below the historic 10-year average. However vacancy rates in Brisbane are expected to increase over the next 12 months as new speculative stock is completed and the
COVID-19 outbreak continues to negativelyaffect the Australian economy.
0
50
100
150
200
250
300
350
400
450
500
2Q11 2Q12 2Q13 2Q14 2Q15 2Q16 2Q17 2Q18 2Q19 2Q20
(‘000 s
qm
)
Annualised as at Q2 2020
Completed 10 year annual average
$117
$118$120 $120
$118 $118 $117
$111 $111$114$115
100
110
120
130
2Q10 2Q11 2Q12 2Q13 2Q14 2Q15 2Q16 2Q17 2Q18 2Q19 2Q20
(A$/s
qm
/yr)

37
Sources: Jones Lang LaSalle Real Estate Intelligence Service – Melbourne CBD Office Final Data 2Q20; Jones Lang LaSalle Real Estate Intelligence Service – Melbourne CBD Office Snapshot
2Q20; Jones Lang LaSalle Real Estate Data Solution – Melbourne CBD Office Construction Projects from Q3 2010 to 2Q20.
Melbourne Commercial Total Supply Melbourne Prime Grade Net Face Rent
◆ Supply: Three major developments completed in quarter in contributing 158,899 sqm of new space to the Melbourne CBD market. Approximately 96% of the new space was pre-committed and has not
signif icantly contributed to vacancy rates in the Melbourne CBD. There are currently six commercial projects under construction,delivering 274,800 sqm of new NLA to the market by 2021.
◆ Demand: Despite COVID-19 tenant demand for commercial space rebounded from the Q1 2020 w ith take-up of 162,664 sqm in Melbourne. Over the 12 months to 30 June 2020 there was
approximately 194,981 sqm of gross take up in Melbourne CBD w hich is approximately 9% below the historic 10-year average.
◆ Rents: Prime growth rates in the Melbourne CBD have experienced strong growth of 6.4% over the last 12 months. However due to the continued economic impacts of the COVID-19 crisis and a sharp
increase in vacancies average prime rents have declined by 0.8% in Q2 2020 and are currently A$623/sqm net. Prime incentives in the Melbourne CBD have also increased slightly over the quarter and
are currently 30.73%. The decline in face rents and the increase of incentives has resulted in negative effective rental growth over the quarter.
◆ Vacancy: As at Q2 2020 the vacancy rate in Melbourne CBD increased sharply from 3.4% to 7.6%. This increase is due to the addition of new supply, an increase in sublease space, as well as several
large tenant contractions. As at 30 June 2020 there is approximately 379,560 sqm of vacant commercial space in the Melbourne CBDmarket. Melbourne CBD commercial vacancy is expected to
increase over the next 12 months as new stock is added to the market and the ongoing COVID-19 crisis continues to negatively af fect business confidence and tenant demand.
$378
$400 $409 $421 $431$452 $466
$528$573
$585$623
300
350
400
450
500
550
600
650
700
2Q10 2Q11 2Q12 2Q13 2Q14 2Q15 2Q16 2Q17 2Q18 2Q19 2Q20
(A$/s
qm
/yr)
0
20
40
60
80
100
120
140
160
180
2Q11 2Q12 2Q13 2Q14 2Q15 2Q16 2Q17 2Q18 2Q19 2Q20
(‘000 s
qm
)
Annualised as at Q2 2020
Completed 10 year annual average

38
Sources: Jones Lang LaSalle Real Estate Intelligence Service – Perth CBD Office Final Data 2Q20; Jones Lang LaSalle Real Estate Intelligence Service – Perth CBD Office Snapshot 2Q20;
Jones Lang LaSalle Real Estate Data Solution – Perth CBD Office Construction Projects from Q3 2010 to 2Q20.
Perth CBD Office Total Supply Perth CBD Office Prime Grade Net Face Rent
◆ Supply: Development activity in the Perth CBD has been subdued with no new space completed in the last 12 months. There are currently two major new developments under construction in the
Perth CBD, Chevron HQand Capital Square Tow er2. The two developments will provideapproximately 79,200 sqmof commercial spaceand are both expected to be completed in Q4 2023.
◆ Demand: During 2Q 2020 demand for commercial space in the Perth CBD was subdued with take-up of only 1,485 sqm. Over the previous 12 months to 30 June 2020 there was approximately
25,658 sqm of gross take up in Perth which is 68% below the historic 10-year average. The only lease transaction of the quarter was a 1,485 sqm lease to Pilbara Ports Authority at 999 Hay Street,
Perth.
◆ Rents: Despite softening demand prime rents in the Perth CBD has experienced modest rental growth of 0.6% over the previous 12 months. The average prime rents in the Perth CBD are currently
A$625/sqm net. However due to the continued high vacancy rates and modest tenant demand incentives in the Perth CBD remain high compared to other Australian CBD markets. Over the previous
12 months incentives for prime office space have remained stable and are currentlyat 47%.
◆ Vacancy: As at Q2 2020 the vacancy rate in Perth CBD increased slightly to 20.13%. Currently there is approximately 363,763 sqm of vacant commercial space in the Perth CBD market. Vacancy
rates are expectedto increasein the short termas the economic impacts of the COVID-19 outbreak continue to negatively affect business confidenceand tenant demand.
0
20
40
60
80
100
120
140
160
2Q11 2Q12 2Q13 2Q14 2Q15 2Q16 2Q17 2Q18 2Q19 2Q20
(‘000 s
qm
)
Annualised as at Q2 2020
Completed 10 year annual average
$639
$664
$748 $741
$693
$654$631
$618$618
$621$625
550
600
650
700
750
800
2Q10 2Q11 2Q12 2Q13 2Q14 2Q15 2Q16 2Q17 2Q18 2Q19 2Q20
(A$/s
qm
/yr)
39Source: CBRE, Singapore Market View, Q2 2020
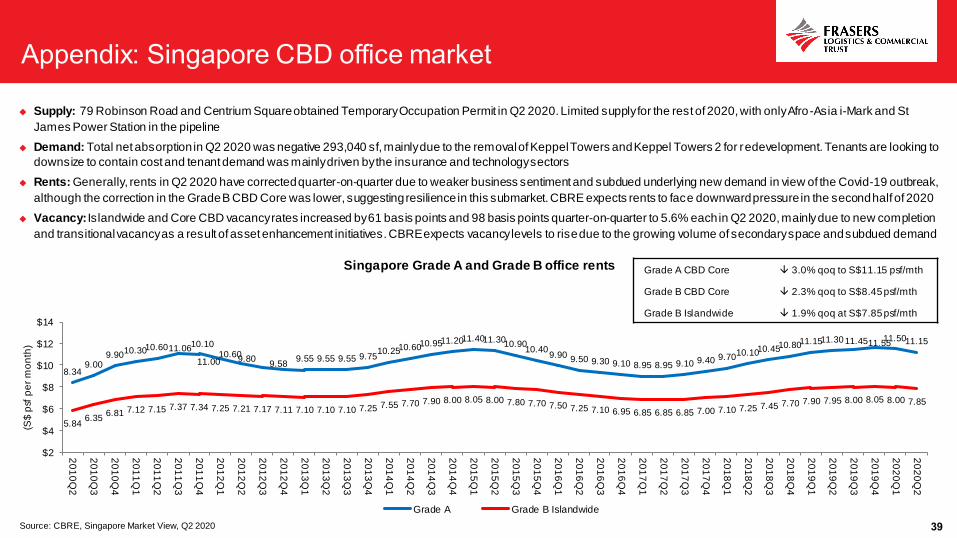
Singapore Grade A and Grade B office rents
◆ Supply: 79 Robinson Road and Centrium Square obtained Temporary Occupation Permit in Q2 2020. Limited supply for the rest of 2020, with only Afro-Asia i-Mark and St
James Power Station in the pipeline
◆ Demand: Total net absorption in Q2 2020 was negative 293,040 sf, mainly due to the removal of Keppel Towers and Keppel Towers 2 for redevelopment. Tenants are looking to
downsize to contain cost and tenant demand was mainly driven by the insurance and technology sectors
◆ Rents: Generally, rents in Q2 2020 have corrected quarter-on-quarter due to weaker business sentiment and subdued underlying new demand in view of the Covid-19 outbreak,
although the correction in the Grade B CBD Core was lower, suggesting resilience in this submarket. CBRE expects rents to face downward pressure in the second half of 2020
◆ Vacancy: Islandwide and Core CBD vacancy rates increased by 61 basis points and 98 basis points quarter-on-quarter to 5.6% each in Q2 2020, mainly due to new completion
and transitional vacancy as a result of asset enhancement initiatives. CBRE expects vacancy levels to rise due to the growing volume of secondary space and subdued demand
8.349.00
9.9010.3010.6011.06
11.0010.60
10.10
9.809.58
9.55 9.55 9.55 9.7510.2510.6010.9511.2011.4011.30
10.9010.40
9.909.50 9.30 9.10 8.95 8.95 9.10 9.40 9.70
10.1010.4510.8011.1511.30 11.4511.5511.5011.15
5.846.35
6.81 7.12 7.15 7.37 7.34 7.25 7.21 7.17 7.11 7.10 7.10 7.10 7.25 7.55 7.70 7.90 8.00 8.05 8.00 7.80 7.70 7.50 7.25 7.10 6.95 6.85 6.85 6.85 7.00 7.10 7.25 7.45 7.70 7.90 7.95 8.00 8.05 8.00 7.85
$2
$4
$6
$8
$10
$12
$14
20
10
Q2
20
10
Q3
20
10
Q4
20
11
Q1
20
11
Q2
20
11
Q3
20
11
Q4
20
12
Q1
20
12
Q2
20
12
Q3
20
12
Q4
20
13
Q1
20
13
Q2
20
13
Q3
20
13
Q4
20
14
Q1
20
14
Q2
20
14
Q3
20
14
Q4
20
15
Q1
20
15
Q2
20
15
Q3
20
15
Q4
20
16
Q1
20
16
Q2
20
16
Q3
20
16
Q4
20
17
Q1
20
17
Q2
20
17
Q3
20
17
Q4
20
18
Q1
20
18
Q2
20
18
Q3
20
18
Q4
20
19
Q1
20
19
Q2
20
19
Q3
20
19
Q4
20
20
Q1
20
20
Q2
(S$
psf
pe
r m
on
th)
Grade A Grade B Islandwide
Grade A CBD Core 3.0% qoq to S$11.15 psf/mth
Grade B CBD Core 2.3% qoq to S$8.45 psf/mth
Grade B Islandwide 1.9% qoq at S$7.85 psf/mth

40
5.10 5.10 5.05 5.05 5.055.05 5.05 5.255.35 5.35 5.30 5.30 5.30 5.40 5.40 5.40 5.49 5.50 5.50 5.50 5.50 5.40 5.40 5.40 5.50 5.50 5.50 5.50 5.50 5.55 5.60 5.65 5.70 5.80 5.80 5.80 5.80 5.80 5.85 5.85 5.85
3.20
3.55 3.60 3.70 3.60 3.60 3.70 3.70 3.65 3.653.80 3.80 3.80 3.85 3.85 3.85 3.84
3.70 3.65 3.65 3.65 3.65 3.65 3.65 3.70 3.70 3.70 3.70 3.70 3.70 3.70 3.70 3.75 3.80 3.80 3.80 3.80 3.80 3.75 3.75 3.75
$2.5
$3.0
$3.5
$4.0
$4.5
$5.0
$5.5
$6.0
$6.5
20
10
Q2
20
10
Q3
20
10
Q4
20
11
Q1
20
11
Q2
20
11
Q3
20
11
Q4
20
12
Q1
20
12
Q2
20
12
Q3
20
12
Q4
20
13
Q1
20
13
Q2
20
13
Q3
20
13
Q4
20
14
Q1
20
14
Q2
20
14
Q3
20
14
Q4
20
15
Q1
20
15
Q2
20
15
Q3
20
15
Q4
20
16
Q1
20
16
Q2
20
16
Q3
20
16
Q4
20
17
Q1
20
17
Q2
20
17
Q3
20
17
Q4
20
18
Q1
20
18
Q2
20
18
Q3
20
18
Q4
20
19
Q1
20
19
Q2
20
19
Q3
20
19
Q4
20
20
Q1
20
20
Q2
(S$
psf
pe
r m
on
th)
Business Park (City Fringe) Business Park (Rest of the Island)
1. Alexandra Technopark is a high-specification B1 industrial development located at the city-fringe, with certain physical attributes similar to business parks. Due to limited availability of market
research inf ormation directly relating to the asset class of Alexandra Technopark, market research information for business parks is provided for indicative reference.
Source: CBRE, Singapore Market View, Q2 2020
Singapore Business Park rents
◆ Supply: Islandwide business park stock stayed at 19.4 million sf in Q2 2020
◆ Demand: The value proposition of business parks continue to remain attractive, with preference for newer business parks in the city fringe submarket. Leasing activity was
limited, mainly stemming from technology firms absorbing space in the city fringe submarket
◆ Rents: The business park segment continued to remain resilient. As at the end of Q2 2020, averaged rents remained stable quarter-on-quarter at S$5.85 psf per month for city
fringe business parks and S$3.75 psfper month for the rest of the island. The tight supply is expected to support rents in the city fringe submarket
◆ Vacancy: Islandwide vacancy rate remained at 13.1% in Q2 2020, with vacancy tightening in the city fringe submarket which offset the increase in the rest of island submarket.
The tight vacancy in the city fringe submarket may prompt occupiers to turn to the rest of the island submarket

41
Frasers Property entities
FLCT: Frasers Logistics & Commercial Trust
FCOT: Frasers Commercial Trust
FLT: Frasers Logistics & Industrial Trust
FPL or the Sponsor: Frasers Property LimitedThe Group: Frasers Property Limited, together w ith its subsidiaries
Financial Year
FP16: Period f rom 20 June 2016 to 30 September 2016
FY17: Period f rom 1 October 2016 to 30 September 2017
FY18: Period f rom 1 October 2017 to 30 September 2018
FY19: Period f rom 1 October 2018 to 30 September 2019
FY20: Period f rom 1 October 2019 to 30 September 2020
41
Other acronyms
Adjusted NPI: Calculated based on the actual NPI excluding straight lining adjustments for
rental income and adding lease payments of right-of-use assets
AEI: Asset Enhancement Initiative
CBD: Central Business DistrictCOVID-19: Coronavirus disease 2019
DPU: Distribution per unit
EBITDA: Earnings before interest, taxes, depreciation, and amortisation
EURIBOR: Euro Interbank Offered Rate
FBP: Farnborough Business ParkFY: Financial year
GRESB: Global Real Estate Sustainability Benchmark
GLA: Gross lettable area
GRI: Gross Rental Income
IVE Facility: 75-79 Canterbury Road, Braeside, Victoria, AustraliaMaxis: Maxis Business Park, Bracknell, UK
NAV: Net asset value
NLA: Net Lettable Area
NPI: Net property income
REIT: Real estate investment trustRBA: Reserve Bank of Australia
ROFR: Right of First Refusal
Sale Property/Cold Storage Facility: 99 Sandstone Place, Parkinson, Queensland, Australia
SGX-ST: Singapore Exchange Securities Trading Limited
SME: Small and Medium-sized Enterprisesqft: Square feet
sqm: Square metres
UK: the United Kingdom
WALE: Weighted average lease expiry
WALB: Weighted average lease to breakY-o-Y: Year-on-year
Additional notes
In the tables, the arrow direction indicates the increase (up) or decrease (down) of the absolute
f igure, The colour indicates if the change is positive (green), negative (red) or neutral (black).